Embed Size (px)
Citation preview

N00
U.S. Army Research InstitutefI for the Behavioral and Social Sciences
Research Report 1571
Predicting First-Run Gunnery Performanceon Tank Table VIII
David A. Campshure and Eugene H. DruckerHuman Resources Research Organization
DTICELECTE
August 1990
Approved for public release; distribution is unlimited
90 1lo

U.S. ARMY RESEARCH INSTITUTE
FOR THE BEHAVIORAL AND SOCIAL SCIENCES
A Field Operating Agency Under the Jurisdiction
of the Deputy Chief of Staff for Personnel
EDGAR M. JOHNSON JON W. BLADESTechnical Director COL, IN
Commanding
Research accomplished under contract forthe Department of the Army
Human Resorces Research Organization
Technical review by
Billy BurnsideScott E. Graham
NOTICES
FINAL DISPOSITION: This report may be destroyed when it is no longer needed. Please do not return it tothe U.S. Army Research Institute for the Behavioral and Social Sciences.
NOTE: The findings in this report are not to be construed as an official Department of the Army position,unless so designated by other authorized documents.

JNCLASSIFIEDURITY CLASSIFICATION OF THIS PAGE
Form ApprovedREPORT DOCUMENTATION PAGE I0MB No. 0704-0788
REPORT SECURITY CLASSIFICATION lb. RESTRICTIVE MARKINGS
UnclassifiedSECURITY CLASSIFICATION AUTHORITY 3. DISTRIBUTION/AVAILABILITY OF REPORT
DECLASSIFICATION I DOWNGRADING SCHEDULE
)ERFORMING ORGANIZATION REPORT NUMBER(S) S. MONITORING ORGANIZATION REPORT NUMBER(S)
FR-PRD-90-13
NAME OF PERFORMING ORGANIZATION 6b. OFFICE SYMBOL 7a. NAME OF MONITORING ORGANIZATION
Human Resources Research (If applicable) U.S. Army Research Institute for theOrganization Behavioral and Social Sciences
ADDRESS (City, State, and ZIP Code) 7b. ADDRESS (City, State, and ZIP Code)ARI Field Unit-Ft. Knox
1100 South Washington Street ATTN: PERI-IKAlexandria, VA 22314 Fort Knox, KY 40121-5620
NAME OF FUNDINGI SPONSORING Bb. OFFICE SYMBOL 9. PROCUREMENT INSTRUMENT IDENTIFICATION NUMBERORGANIZATION I (If applicable)U.S. Army Research Institute I PERI-I MDA903-86-C-0335
ADDRESS (City, State, and ZIP Code) 10. SOURCE OF FUNDING NUMBERS
5001 Eisenhower Avenue PROGRAM PROJECT TASK IWORK UNIT
Alexandria, VA 22333-5600 ELEMENT NO. NO. NO. ACCESSION NO.
63743 A794 331 H1TITLE (Include Security Classification)
Predicting First-Run Gunnery Performance on Tank Table VIII
PERSONAL AUTHOR(S)
David A. Campshure and Eugene H. Druckera. TYPE OF REPORT 113b. TIME COVERED T14. DATE OF REPORT (Year, Month, Day) 115. PAGE COUNT
Final Report IFROM .3/89.... TO_.5L/f.. 68* SUPPLEMENTARY NOTATION
Donald F. Haggard, Contracting Officer's Representative
COSATI CODES 18. SUBJECT TERMS (Continue on reverse if necessary and identify by block number)
FIELD GROUP SUB-GROUP ---rank gunnery,. Armor< Training U--CfffTraining devices, Tanks . Testing , / -
* ABSTRACT (Continue on reverse if necessary and identify by block number)
--- Research was conducted to determine if performance on the first run of Tank Table VIII:an be predicted from amount and level of training on the Unit Conduct-of-Fire TrainerU-COFT) and from crew turbulence data. During the first phase of the research,intercorrelations were computed between predictor variables and Table VIII performanceieasures obtained from 77 tank crews. Two predictor variables from U-COFT training:orrelated significantly with Table VIII performance--crew reticle aim level and TC reticleim level. Neither variable was able to predict which crews would qualify on Table VIII,iut the composite of crew reticle aim and time in crew was able to predict which crews wouldlualify. This finding was not supported by the results based on 136 crews examined duringIhase II. Since gunnery training was curtailed during Phase I but not during Phase II, the1hase I results may be applicable to future t aining situations in which resource:onstraints cause training to be curtailed. / jt.
i. DISTRIBUTION/ AVAILABILITY OF ABSTRACT 121 ABSTRACT SECURITY CLASSIFICATION
IUNCLASSIFIED/UNLIMtTg9 0 SAME AS RPT C DTIC USERS Unclassifieda. NAME OF RESPONSIBLE INDIVIDUAL 22b. TELEPHONE (Include Area Code) r22c. OFFICE SYMBOL
Donald F. Haggard I (502) 62t-3450 I PERI-IKI Form 1473, JUN 86 Pre.,ious editions are obsolete. SECURITY CLASSIFICATION OF THIS PAGE
UNCLASSI FIEDi

Research Report 1571
Predicting First-Run Gunnery Performanceon Tank Table VIII
David A. Campshure and Eugene H. DruckerHuman Resources Research Organization
Field Unit at Fort Knox, KentuckyDonald F. Haggard, Chief
Training Research LaboratoryJack H. Hiller, Director
U.S. Army Research Institute for the Behavioral and Social Sciences5001 Eisenhower Avenue, Alexandria, Virginia 22333-5600
Office, Deputy Chief of Staff for PersonnelDepartment of the Army
August 1990
Army Project Number Education and Training2Q263007A794
Approved for public release; distribution is unlimited.

FOREWORD
Tank crew gunnery proficiency is assessed on Tank Table VIII, a series oflive-fire engagements that are expensive to administer. Crews that fail toqualify on their first run on Table VIII must repeat part or all of these ex-ercises until they qualify and can proceed to section and platoon level gunnerytraining.
This report describes research designed to decrease the cost of adminis-tering Tank Table VIII by predicting which crews will pass and which crewswill fail to qualify on their first run. If accurate predictions can be made,crews predicted to fail can receive additional gunnery training on the UnitConduct-of-Fire Trainer before participating on Table VIII. This procedurewould reduce the costs of administering the exercises because it would reducethe need for repeating exercises.
This research is part of the ARI task entitled "Application of Technolo-gies to Meet Armor Skills Training Needs." This task is performed under ARI'sArmor Research and Development Activity at Fort Knox. The mission of the taskis to design and conduct human performance research in armor gunnery. Thereport was delivered to the Director of the Directorate of Total Armor ForceReadiness at Fort Knox and to the III Corps G3, Training, at Fort Hood.
Training and Doctrine Command is the proponent for this research, andUSAARMC is the user (Memorandum of Agreement with ARI entitled "The Effects ofSimulators and Other Resources on Training Readiness," 16 January 1989).
EDGAR M. JOHNSONTechnical Director
( " Accession ForCNTIS GRA&I P00"
" / fDTIC TABUnannounced 0Justification ,
ByDistribution/
Availability Codel
JAva il and/or
Dist j Special
ho'
v

PREDICTING FIRST-RUN GUNNERY PERFORMANCE ON TANK TABLE VIII
EXECUTIVE SUMMARY
Research Requirement:
The purpose of this study was to determine if first-run performance onTank Table VIII can be predicted from amount and level of training on the UnitConduct-of-Fire Trainer (U-COFT) and from crew turbulence data. If Tank TableVIII performance can be predicted, ammunition can be conserved by delaying acrew's participation on Table VIII until it is likely to qualify on its firstrun.
Procedure:
The research was conducted in two phases. Table VIII scores, U-COFTtraining data, and crew turbulence data were obtained from two M1 tankbattalions (Phase I) and from four MI tank battalions (Phase II) assigned to aCONUS post. Intercorrelations were computed between predictor variables andTable VIII performance measures. Regression analyses were performed todetermine how well each predictor variable alone could predict performance onTable VIII and how well multiple predictor composites could improve upon thesepredictions. Scatterplots were drawn to determine the accuracy of thepredicted Table VIII scores derived from the individual predictors and fromthe multiple predictor composites.
Results:
Two predictor variables correlated significantly with Table VIIIperformance measures during Phase I--level attained within the crew matrix onU-COFT and level attained within the TC matrix on U-COFT. Neither variable,however, was able to predict which crews would qualify on Table VIII. Themultiple predictor composites were more successful i, predicting Table VIIIperformance. The composite of crew reticle aim level and time in crewpredicted that 12 crews would qualify on their first run on TaLie kfII andthat 65 crews would fail. Half of the crews that were predicted to qualifyactually passed the exercise, and 72% of the crews that were predicted to failactually failed to qualify. Although the results obtained during Phase Iappeared to demonstrate that Table VIII performance can be predicted fromU-COFT and crew turbulence data, this finding was not supported duringPhase II. Since training on Tank Table IV was curtailed during Phase I, butnot during Phase II, it is likely that U-COFT contributed more to gunneryskill acquisition during Phase I than during Phase II. Thus, it may bepossible to predict first-run performance on Table VIII from U-COFT trainingand crew turbulence data when resources for gunnery training are curtailed,but not otherwise.
vii

Utilization of Findings:
The findings can be used by armor units to conserve ammunition duringthe conduct of Table VIII, particularly if ammunition allocations are reduced.U-COFT training and crew turbulence data would be used to identify the crewsthat are most likely to qualify on their first run on Table VIII, and onlythose crews would be allowed to participate on the gunnery table. Crews thatare identified as likely to fail on their first run would be given additionaltrairing on U-COFT, and they would not participate on Table VIII until thepredictors indicate that they would be likely to qualify on their first run.
viii

PREDICTING FIRST-RUN GUNNERY PERFORMANCE ON TANK TABLE '/III
CONTENTS
Page
INTRODUCTION .. ... ..... ..... ...... ..... ...... 1
Tank Combat Tables .. .. .... ..... ..... ...... ... 1Conservation of Ammunition .. .. .... ..... ..... .......Using the Unit Conduct-of-Fire Trainer and Crew Turbulence to
Predict Table VIII Performance .. ... ..... ..... .... 2Purpose of the Present Research .. ... ..... ..... ...... 2
PHASEI .. .. ..... ..... ..... ..... ..... ...... 3
Method .. .. .... ..... ..... ...... ..... .... 3Participants. .. ..... ..... ..... ..... ...... 3Predictor Variables. .. ... ..... ..... ..... .... 3Performance Variables. .. .. ...... ..... ..... ... 5Analyses .. ... ..... ..... ..... ...... .... 7
Results............................8Descriptive Statistics....................8Intercorrelations and Correlations .. ... ..... ....... 18Predicting Table VIII Performance. .. .. ..... ......... 23
Discussion .. .. .... ..... ..... ...... ........ 34
PHASE II .. ... ...... ..... ..... ..... ....... 38
Method..I... ...... ..... ..... ..... ....... 38Participants .. ... ..... ..... ...... ........ 38Predictor Variables .. .. .... ..... ..... ....... 38Performance Variables. .. ... ..... ..... ..... ... 38Analyses. .. ..... ..... ..... ..... ....... 39
Results ........................... 39Descriptive Statisics....................39Intercorrelations and Correlations .. ... ..... ....... 44Cross-Validation of Phase I Findings .. ... ..... ...... 45Replication of Phase I Findings .. .. .... ..... ...... 47
Discussion .. .. .... ..... ..... ..... ......... 50Predictor Variables .. .. .... ..... ..... ....... 50Performance Measures. .. ..... ............... 50Relationship Between Predictor and Performance Measures.......51Summary and Conclusions. .. .. ...... ..... ........ 52
ix

CONTENTS (continued)
Page
References .... .. ... ... .............................. 54
Appendix A. U-COFT Matrices .... .. .. ..................... A-i
B. Procedures for Calculating Overall and Main GunPerformance Variables .... ... .................. B-I
List of Tables
1. Tank Table VIII Engagements Fired ....... ................ 6
2. Table VIII Performance Variables ....... ................. 8
3. Summary Statistics for Table VIII Overall and Main GunPerformance Variables .... .. ... ...................... 9
4. Descriptive Statistics of Table VIII Overall and Main GunPerformance Measures Tor Day and Night Tasks ..... ........... 13
5. Descriptive Statistics of Table VIII Overall and Main GunPerformance Measures for Offensive (Off) andDefensive (Def) Tasks .... .. ... ...................... 13
6. Summary Statistics for Predictor Variables ... ............ ... 14
7. Correlations Among Table VIII Performance Measures .......... ... 18
8. Correlations Between Table VIII Performance Measures forDay and Night Tasks .... .. ... ....................... 19
9. Correlations Between Table VIII Performance Measures for
Offensive and Defensive Tasks .... .. .. .................. 19
10. Correlations Among Predictor Variables ...... .............. 20
11. Correlations Between Table VIII Performance Measures andPredictor Variables .... .. ... ....................... 21
12. Correlations Between Performance Measures for Table VIIIDay Tasks and Predictor Variables ....... ................ 21
13. Correlations Between Performance Measures for Table VIIINight Tasks and Predictor Variables .... ............... .... 22
14. Correlations Between Performance Measures for Table VIIIOffensive Tasks and Predictor Variables .... .. ............. 22
x

CONTENTS (continued)
Page
15. Correlations Between Performance Measures for Table VIIIDefensive Tasks and Predictor Variables .... .. ............. 23
16. Results of Multiple Regression Analyses of Average TotalScore by Predictor Variables ........ ................... 27
17. Frequency of Correct and Incorrect Predictions of Table VIIIFirst-Run Outcomes ....... ... ........................ 32
18. Summary Statistics for Average Total Score on Table VIIIand Its Major Portions ...... ...................... ... 40
19. Summary Statistics for Table VIII Average Total Score byPhase and Battalion .... .. ... ....................... 41
20. Correlations Among Table VIII Performance Measures .... ........ 44
21. Frequency of Correct and Incorrect Predictions of Table VIIIFirst-Run Outcomes for Cross-Validation Sample ............ .... 45
22. Results of Multiple Regression Analyses of Average TotalScore by Predictor Variables ....... ................... 47
B-I. Procedures for Calculating Overall and Main Gun PerformanceVariables ....... .. .. ............................ B-I
List of Figures
1. Distribution of Table VIII raw scores (average raw scoremultiplied by 10) .... ... ........................ .... 10
2. Distribution of Table VIII total scores (average total scoremultiplied by 10) .... .. .... ........................ 10
3. Distribution of Table VIII crew cuts (average cuts
multiplied by 10) .... .. .... ........................ 11
4. Distribution of Table VIII average opening times .... ......... 11
5. Distribution of Table VIII percent hits ...... ............. 12
6. Distributions of crew matrix reticle aim level and reticleaim group ...... .. .... ............................ 16
7. Distributions of TC matrix reticle aim level and reticleaim group ...... ... ... ........................... 16
xi

CONTENTS (continued)
Page
8. Distributions of the number of computer and total eAercisescompleted in the crew matrix ...... .. ................... 17
9. Distributions of the number of computer and total exercisescompleted in the TC matrix ..... .................... .... 17
10. Total score as a function of reticle aim level attained inthe U-COFT crew matrix ...... ...................... ... 25
11. Total score as a function of reticle aim level attained inthe U-COFT TC matrix ...... ....................... .... 26
12. Actual total score plotted against a predicted total scoreba-ed on crew reticle aim level dnd time in crew .... ......... 29
13. Actual total score plotted against a predicted total scorebased on crew reticle aim level and the total number ofexercises completed in the crew matrix ... .............. ... 30
14. Actual total score plotted against a predicted total scorebased on TC reticle aim level and time in crew ............ .... 31
15. Predicted average total score on Table VIIT as a functionof time together as a crew and the reticle aim level attainedin the U-COFT crew matrix ..... .................... .... 33
16. Predicted average total score on Table VIII as a functionof the total number of exercises completed and reticle aimlevel attained in the U-COFT crew matrix ...... ............. 35
17. Predicted average total score on Table VIII as a functionof time together as a crew and the reticle aim level attainedin the U-COFT TC matrix ...... .. ..................... 36
18. Distribution of Table VIII total scores (average total scoremultiplied by 10) .... ... ........................ ... 40
19. Distribution of crew matrix reticle aim level and reticleaim group ...... ... ... ............................ 42
20. Distribution of time in months that the TC and gunner had beenpaired together ....... ......................... .... 43
21. Actual total score for Phase II crews plotted againstpredicted total score, which was calculated from the regressionequation derived from the Phase I sample .................. 46
xii

CONTENTS (continued)
Page
22. Total score as a function of the number of months TC andgunners had been paired together ..... ................. .... 48
23. Actual total score plotted against a predicted total score
based on time in crew .......... ...................... 49
A-I. MI U-COFT TC training matrix ......... .................. A-1
A-2. MI U-COFT crew training matrix ..... ................. .... A-2
xiii
PREDICTING FIRST-RUN GUNNERY PERFORMANCE ON TANK TABLE VIII
INTRODUCTION
Tank Combat Tables
The goal of M1 tank combat training is to achieve and sustainproficiency in gunnery and tactics. Tank crewmen attain proficiency ingunnery primarily by participating in a series of gunnery engagements. Theengagements are conducted in a graduated set of twelve gunnery tables that aredescribed in detail in FM 17-12-1, Tank Combat Tables M1 (Department of theArmy, 1988). According to the field manual, basic individual and crew skillsare trained on Tables I through III and tested on Table IV; intermediate levelcrew skills are trained on Tables V through VII and tested on Table VIII; andadvanced section and platoon skills are trained on Tables IX and XI and testedon Tables X and XII.
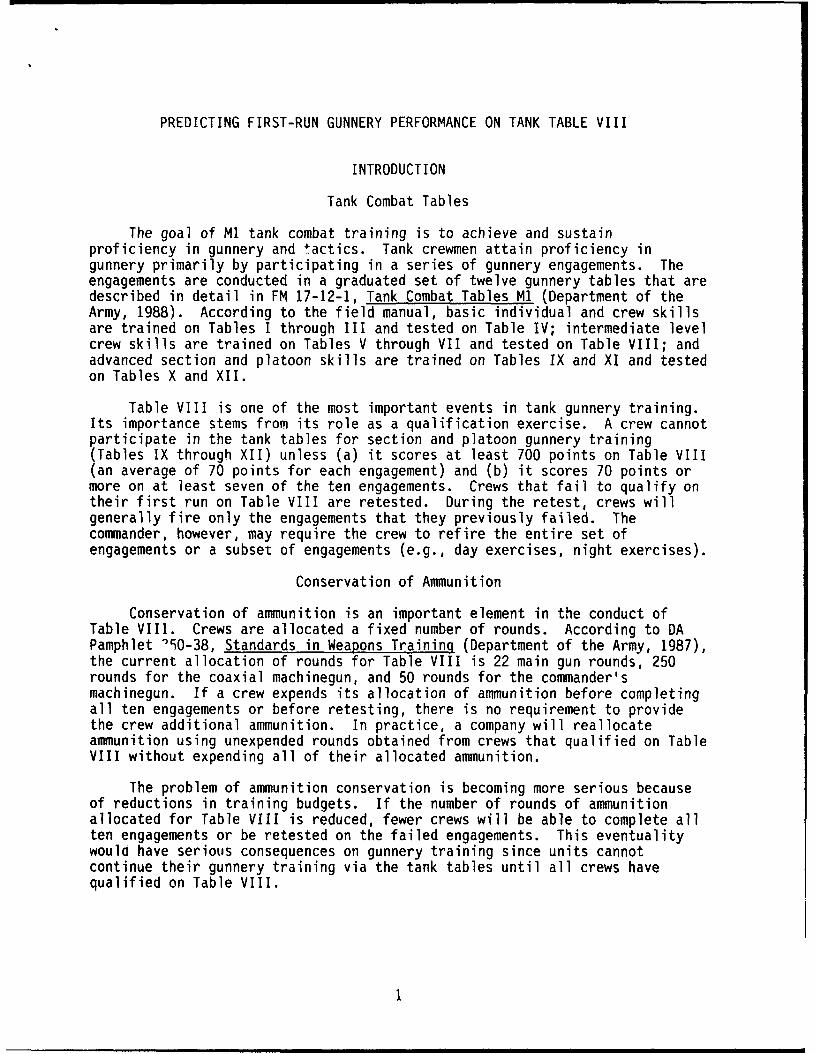
Table VIII is one of the most important events in tank gunnery training.Its importance stems from its role as a qualification exercise. A crew cannotparticipate in the tank tables for section and platoon gunnery training(Tables IX through XII) unless (a) it scores at least 700 points on Table VIII(an average of 70 points for each engagement) and (b) it scores 70 points ormore on at least seven of the ten engagements. Crews that fail to qualify ontheir first run on Table VIII are retested. During the retest, crews willgenerally fire only the engagements that they previously failed. Thecommander, however, may require the crew to refire the entire set ofengagements or a subset of engagements (e.g., day exercises, night exercises).
Conservation of Ammunition
Conservation of ammunition is an important element in the conduct ofTable VIII. Crews are allocated a fixed number of rounds. According to DAPamphlet 150-38, Standards in Weapons Training (Department of the Army, 1987),the current allocation of rounds for Table VIII is 22 main gun rounds, 250rounds for the coaxial machinegun, and 50 rounds for the commander'smachinegun. If a crew expends its allocation of ammunition before completingall ten engagements or before retesting, there is no requirement to providethe crew additional ammunition. In practice, a company will reallocateammunition using unexpended rounds obtained from crews that qualified on TableVIII without expending all of their allocated ammunition.
The problem of ammunition conservation is becoming more serious becauseof reductions in training budgets. If the number of rounds of ammunitionallocated for Table VIII is reduced, fewer crews will be able to complete allten engagements or be retested on the failed engagements. This eventualitywould have serious consequences on gunnery training since units cannotcontinue their gunnery training via the tank tables until all crews havequalified on Table VIII.
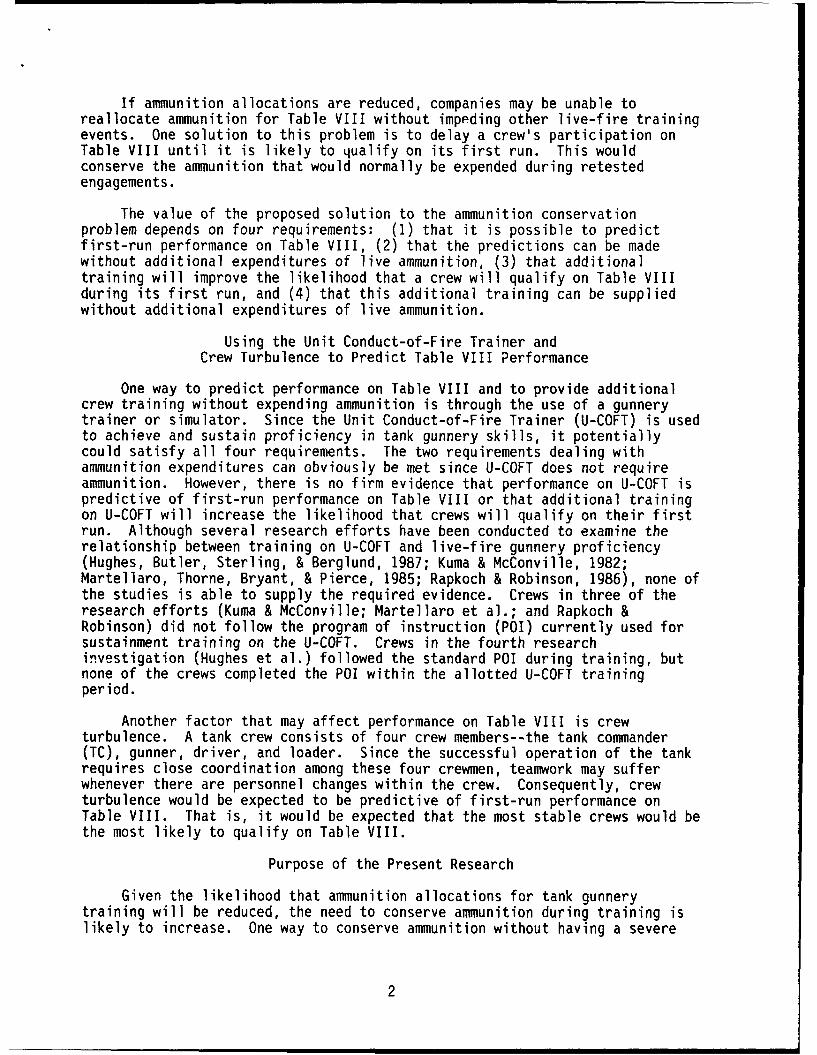
If ammunition allocations are reduced, companies may be unable toreallocate ammunition for Table VIII without impeding other live-fire trainingevents. One solution to this problem is to delay a crew's participation onTable VIII until it is likely to qualify on its first run. This wouldconserve the ammunition that would normally be expended during retestedengagements.
The value of the proposed solution to the ammunition conservationproblem depends on four requirements: (1) that it is possible to predictfirst-run performance on Table VIII, (2) that the predictions can be madewithout additional expenditures of live ammunition, (3) that additionaltraining will improve the likelihood that a crew will qualify on Table VIIIduring its first run, and (4) that this additional training can be suppliedwithout additional expenditures of live ammunition.
Using the Unit Conduct-of-Fire Trainer andCrew Turbulence to Predict Table VIII Performance
One way to predict performance on Table VIII and to provide additionalcrew training without expending ammunition is through the use of a gunnerytrainer or simulator. Since the Unit Conduct-of-Fire Trainer (U-COFT) is usedto achieve and sustain proficiency in tank gunnery skills, it potentiallycould satisfy all four requirements. The two requirements dealing withammunition expenditures can obviously be met since U-COFT does not requireammunition. However, there is no firm evidence that performance on U-COFT ispredictive of first-run performance on Table VIII or that additional trainingon U-COFT will increase the likelihood that crews will qualify on their firstrun. Although several research efforts have been conducted to examine therelationship between training on U-COFT and live-fire gunnery proficiency(Hughes, Butler, Sterling, & Berglund, 1987; Kuma & McConville, 1982;Martellaro, Thorne, Bryant, & Pierce, 1985; Rapkoch & Robinson, 1986), none ofthe studies is able to supply the required evidence. Crews in three of theresearch efforts (Kuma & McConville; Martellaro et al.; and Rapkoch &Robinson) did not follow the program of instruction (POI) currently used forsustainment training on the U-COFT. Crews in the fourth researchinvestigation (Hughes et al.) followed the standard POI during training, butnone of the crews completed the POI within the allotted U-COFT trainingperiod.
Another factor that may affect performance on Table VIII is crewturbulence. A tank crew consists of four crew members--the tank commander(TC), gunner, driver, and loader. Since the successful operation of the tankrequires close coordination among these four crewmen, teamwork may sufferwhenever there are personnel changes within the crew. Consequently, crewturbulence would be expected to be predictive of first-run performance onTable VIII. That is, it would be expected that the most stable crews would bethe most likely to qualify on Table VIII.
Purpose of the Present Research
Given the likelihood that ammunition allocations for tank gunnerytraining will be reduced, the need to conserve ammunition during training islikely to increase. One way to conserve ammunition without having a severe
2

impact on training is to delay a crew's participation on Table VIII until itis more apt to qualify on its first run. The primary purpose of the presentresearch was to determine how well first-run performance on Table VIII can bepredicted from the amount and level of training on U-COFT and from crewturbulence.
This research was conducted in two phases. The objective of Phase I wasto develop a model, based on significant relationships between first-run TableVIII performance and U-COFT and crew turbulence variables, which could be usedto predict Table VIII scores. The objective of Phase II was to cross-validatethe model derived during the Phase I analysis and to replicate the proceduresused in Phase I in an attempt to improve the validity of the model.
PHASE I
Method
Participants
Table VIII, U-COFT, and crew turbulence data were obtained in 1989 fromtwo M1 tank battalions (77 crews) stationed at a Continental U.S. (CONUS)post.
Predictor Variables
Two sets of variables were examined in the study to determine theirability to predict Table VIII performance: (a) variables related to trainingon U-COFT and (b) crew turbulence. U-COFT variables included measures ofU-COFT proficiency and amount of U-COFT training. Crew turbulence focused onthe amount of time that the TC and gunner were together in those positions inthe same crew.
M1 U-COFT
Crew training on the M1 U-COFT. The M1 U-COFT is among the most widelyused simulators for tank gunnery training. The U-COFT was designed to trainand sustain critical gunnery skills under simulated conditions. According toFC 17-12-7-1, M1 Unit Conduct-of-Fire Trainer (U-COFT) Training Device SupportPackage (U.S. Army Armor Center, 1985), U-COFT can be used to simulate all orportions of the basic and intermediate tank gunnery tables (Tank GunneryTables I-VIII). U-COFT exercises, however, were not meant to replace the tankgunnery tables. rnstead, they were intended as an additional means oftraining and maintaining the individual and crew skills that are trained bythe basic and intermediate gunnery tables.
The M1 U-COFT is a whole-task gunnery simulator that was developed totrain TC and gunner teams. The U-COFT contains simulated TC and gunner crewstations and presents computer-generated images of targets in the TC and
3
gunner sights. CrewsI are instructed to go through the actual engagementprocedures necessary to produce simulated target "kills."
Four types of gunnery training are supported by U-COFT programs:(a) basic gunnery training of non-armor personnel so that they can serve asbattlefield replacements; (b) transition training of tank crewmen who areconverting from the M60 to the M1 tank; (c) cross training of M1 drivers andloaders for the gunner's position or of gunners for the TC's position; and(d) sustainment training for TCs and gunners with M1 experience.
U-COFT exercises. There are 685 training exercises available on theU-COFT. Each exercise contains from four to ten engagements. The engagementscover a broad range of target engagement conditions by simulating a variety oftactical scenarios, weather and visibility conditions, and levels of equipmentreadiness. The exercises are controlled by an instructor/operator (I/O). TheI/O's responsibilities include initiating the exercises, acting as the driverand loader, monitoring crew performance, and providing crews with performancefeedback.
The U-COFT exercises are described in detail in the Instructor'sUtilization Handbook for the MI Unit-Conduct of Fire Trainer (U-COFT) (GeneralElectric, 1985). The exercises are organized into two training matrices--a TCmatrix and a crew matrix. All targets in the TC matrix must be engaged by theTC from the Commander's Weapon Station (CWS). The TC can fire the main gun,the coaxial machinegun, or the commander's machinegun. When firing the maingun or the coaxial machinegun, the TC must use the Gunner's Primary SightExtension (GPSE) and the commander's override. Although the gunner is presentin the simulator, he is instructed not to identify targets acquired by the TC.Since the TC cannot use the Gunner's Auxiliary Sight (GAS), only precision andbattlesight engagements can be fired when using the main gun or the coaxialmachinegun.
The crew matrix contains exercises that are fired by the TC and gunneras a team. The TC can fire the same weapon systems in the crew matrix as inthe TC matrix. In addition, the gunner can engage targets with either themain gun or the coaxial machinegun using either the Gunner's Primary Sight(GPS) or the GAS. Precision and battlesight engagements can be fired usingthe GPS, and degraded mode engagements can be fired using the GAS.
Each matrix depicts three gunnery skill dimensions or areas: (a) targetacquisition (skills necessary to acquire and identify targets); (b) reticleaim (skills necessary to aim and fire at targets); and (c) system management(skills necessary to operate the fire control system). The two matrices arepresented in Appendix A. The participants (TC or crew) train on U-COFT bygoing through exercises that are defined by the different cells in the matrix.The exercises can be selected by the computer or by the I/O. The U-COFTcomputer regulates advancement by selecting exercises based on performance onprevious U-COFT exercises. The computer can cause a TC or crew to repeat an
iThe U-COFT is configured to train only the TC and gunner crew positions.Therefore, the term "crew" refers to just the TC and gunner when used inreference to U-COFT throughout this report.
4

exercise, move to a more difficult exercise, or move to a less difficultexercise. The I/O has the option of manually selecting exercises to emphasizecertain skill areas. Performance on these optional exercises is not takeninto account by the computer when regulating advancement through the matrix.
U-COFT predictor variables. Crews in the present study followed thestandard U-COFT POI for sustainment training of M1 gunnery skills. Twovariables were obtained from U-COFT training printouts and examined todetermine how well they could predict first-run Table VIII performance. Thesepredictor variables were (a) proficiency on U-COFT and (b) amount of trainingon U-COFT. Data on proficiency and amount of training were obtained from boththe TC and the crew matrices. Thus, the two indicators of proficiency were(a) the reticle aim level achieved by the TC in the TC matrix and (b) thereticle aim level achieved by the crew in the crew matrix. The fourindicators of amount of U-COFT training were (a) the number of computerrecommended exercises completed by the TC in the TC matrix, (b) the totalnumber of exercises (computer recommended exercises plus I/0 selectedexercises) completed by the TC in the TC matrix, (c) the number of computerrecommended exercises completed by the crew in the crew matrix, and (d) thetotal number of exercises completed by the crew in the crew matrix.
Crew Turbulence
Although there are four crewmen in a tank crew, only the TC and thegunner can participate on U-COFT. Consequently, the number of months that theTC and gunner had served together in the same crew, as TC and gunner, wasselected as the measure of crew turbulence.
Performance Variables
Tank Table VIII
Enqaqements. Table VIII consists of ten engagements (referred to astasks in FM 17-12-1) selected from among fourteen different engagementsdescribed in FM 17-12-1. The fourteen engagements represent variouscombinations of five factors: (1) whether the firing tank is moving orstationary, (2) whether the primary or auxiliary sight is used to engage thetargets, (3) whether the precision or battlesight engagement technique isused, (4) whether the engagement is conducted during the day or at night, and(5) the nature of the target. The fifth factor is a heterogeneous categorythat includes single targets (stationary and moving), multiple main guntargets (stationary and moving), and simultaneous targets (stationary).Table VIII consists of two parts--Table VIIIA and Table VIIIB. Table VIIIAcomprises engagements that are fired during the day, and Table VIIIB comprisesengagements that are fired at night. Each engagement (day or night) consistsof one or two targets. These targets can be stationary or moving and areengaged from either a stationary or moving tank. The crews in the presentstudy fired the same 10 engagements, which are described in Table 1. Tasks 1through 6 were fired during the day and constituted Table VIIIA; tasks 7through 10 were fired at night and constituted Table VIIIB.
5

Table 1
Tank Table VIII Engagements Fired
Task Time Own Tank Conditions Target I Target 2(Situation) (Range) (Range)
1 Al Day Stationary GAS, Battlesight, Moving T-72 Stationary T-72(Defensive) Computer & LRF failure (900-1300m) (900-1300m)
2 A2 Day Stationary Simultaneous, GPS, Stationary BMP Troops(Defensive) Precision (900-1100m) (400-600m)
3 A3 Day Moving GPS Troops Troops(Offensive) (400-600m) (700-900m)
4 A4 Day Moving NBC, GPS, Precision Stationary T-72 Stationary T-72(Offensive) (1400-1600m) (1400-1600m)
5 A5A Day Moving GPS, Precision Stationary T-72 Moving T-72(Offensive) (1400-1600m) (1400-1600m)
6 BIS Day Stationary 3-Man Crew, GPSE, Stationary T-72 None(Defensive) Precision (1400-1600m)
7 B2 Night Stationary GPS, Precision Stationary BMP Stationary BMP(Defensive) (1200-1400m) (1200-1400m)
8 B3 Night Moving NBC, GPS, Precision Stationary BMP Troops(Offensive) (400-600m) (400-600m)
9 B4 Night Moving GPS, Precision Stationary T-72 Moving T-72(Offensive) (1300-1500m) (1300-1500m)
10 B5A Night Stationary GPS, Precision Moving T-72 None(Defensive) (1700-1900m)
Note. The order in which crews fired the engagements varied. GAS - Gunner's Auxiliary Sight. LRF = LaserRange Finder. GPS = Gunner's Primary Sight. GPSE = Gunner's Primary Sight Extension used by the TC.NBC - Protective masks worn by crewmen. T-72 = Soviet tank. BMP = Soviet personnel carrier.
Some targets on Table VIII are to be engaged only by the gunner (i.e.,targets requiring the use of the GAS and the GPS, and those engaged under NBCconditions), and three are to be engaged by the TC alone (i.e., one targetrequiring the use of the GPSE and two targets engaged with the commander'smachinegun). All other targets can be engaged by either the TC or the gunner.Consequently, the further the TC has progressed within the TC matrix, and thefurther the TC and gunner have progressed within the crew matrix, the bettertheir performance should be on Table VIII.
Scoring. The raw score which crews receive on each of the tasks inTable VIII is based on engagement speed and accuracy and on threat capability.A crew can earn up to 100 raw points for their performance on each of the tentasks in Table VIII. However, from 5 to 30 crew duties penalty points(commonly referred to as crew cuts) can be subtracted from each raw score forprocedural errors. There are three types of procedural errors: failure touse correct engagement techniques or methods (5 point penalty), failure toadhere to safety rules (10 point penalty), and failure to follow theconditions specified by the task (30 point penalty). A score of 0 points isawarded whenever the penalty points for a task exceed the raw score since thetotal score received by a crew on a task cannot be negative. Thus, a crew canearn from 0 to 100 points on each of the 10 tasks. These points are thensummed to determine the crew's Table VIII score. Crews must obtain a minimumscore of 700 of the 1,000 points possible to qualify on Table VIII.
6

Performance measures. Performance data were extracted from the TableVIII scoresheets provided by the participating battalions. The informationrecorded on the scoresheets for each engagement was used to calculate fivemeasures of overall Table VIII performance: average raw score, average cuts,average total score, average opening time, and percent hits. While it is morecommon to use total scores, averages were used so that crews missing data forone or more tasks could be included in the analyses. The average measures canbe multiplied by 10 to convert them to total measures.
In addition to the five measures of overall performance on Table VIII,three measures of main gun performance were calculated: firing rate, hitproportion, and hit rate. The measures of main gun performance on Table VIIIwere included in the analyses as an alternative to the usual means ofmeasuring o. gunnery proficiency on Table VIII (i.e., total score). Gunnerymeasures are typically derived from the variables of time, rounds, targets,and hits. However, no one metric can encompass all of these variables.Hoffman and Witmer (1989) suggested using the composite metric hit rate as theprimary measure of crew gunnery proficiency. Hit rate (hits/time) is anindicator of the speed with which crews achieved hits. Firing rate(rounds/time) is an indicator of how fast crews were able to fire rounds,regdrdless of accuracy. Hit proportion (hits/rounds) is an indicator of crewfiring accuracy. Hit rate can therefore be calculated from firing rate andhit proportion (hits/time = hits/rounds x rounds/time). If hit rate isweighted by the number of targets presented, the resulting metric thenincludes the variables of hits, time, and targets. Although calculating hitrate in this manner ignores the variable rounds, hit rate is influenced by thenumber of rounds fired in that having to fire extra rounds increases the timerequired to attain a hit.
Descriptions of each of the overall and main gun measures of Table VIIIperformance are presented in Table 2. The procedures for calculating each ofthe overall and main gun measures are shown in Appendix B.
Analyses
Three types of analyses were performed--descriptive statistics,intercorrelations, and regression analyses.
Descriptive Statistics
The descriptive statistics were calculated to summarize the following:(a) measures of first-run performance on Table VIII; (b) measures of majorportions of Table VIII performance, that is, separate summary statistics forday tasks (Table VIIIA), night tasks (Table VIIIB), offensive tasks(engagements fired from a moving tank), and defensive tasks (engagements firedfrom a stationary tank); and (c) the predictor variables (U-COFT proficiency,amount of U-COFT training, and crew turbulence).
7

Table 2
Table VIII Performance Variables
Variable Description
Overall Measures
Average Raw Score Mean raw score for the tasks fired.Average Cuts Mean number of procedural cuts for the tasks fired.Average Total Score Mean total score for the tasks fired.Average Opening Time Mean opening time for the tasks fired.Percent Hits Hits per targets presented.
Main Gun Measures
Firing Rate Rounds fired over time.Hit Proportion Targets hit per rounds fired.Hit Rate Targets hit over time.
Intercorrelations and Correlations
The following intercorrelations were obtained: (a) intercorrelationsamong the predictor variables, (b) intercorrelations among the performancemeasures, and (c) correlations between the predictor variables and theperformance measures.
Regression Analyses
Regression analyses were used to form multiple regression equationsutilizing predictor composites. Predicted average total scores were thencalculated from these composite equations and plotted against average totalscores to determine the utility of the predictor composites.
Results
Descriptive Statistics
Table VIII Performance Measures
Summary statistics. Table 3 contains summary performance statistics forTable VIII engagements overall and for the main gun engagements. The meantotal score for an engagement was 61.29. Multiplying this mean total score byten (the total number of engagements) provides the mean total score forTable VIII. The mean total score (612.9) is almost 90 points below theminimum score of 700 that is required for crew qualification. The summarystatistics suggest that, on the average, crews failed to qualify because theiropening time was too long (8.75 seconds), they hit only 61% of the targets
8

Table 3
Summary Statistics for Table VIII Overall and Main Gun Performance Variables
All Engagements Main Gun Engagements
Average Average AverageRaw Average Total Opening Percent Firing Hit HitScore Cuts Score Time Hits Rate Proportion Rate
Minimum 26.10 0.00 23.70 3.33 29.2 4.49 0.32 1.97
Maximum 95.70 8.50 95.20 21.50 100.0 13.00 1.00 9.61
Mean 63.13 2.47 61.29 8.75 60.9 7.97 0.73 5.88
S.D. 15.35 2.00 15.33 3.61 10.7 1.66 0.15 1.85
Note. N = 77.
(73% of the main gun targets), their firing rate for the main gun was too low(8 rounds per minute), or some combination of these factors.
Performance distributions. The distributions of the overall variablesare presented in Figures 1 through 5. The distributions for Table VIII rawscores (Figure 1) and total scores (Figure 2) appear to approximate normality.Only 24 of the 77 crews in the sample (31%) earned a total score equal to orgreater than the 700 points needed to qualify. Thus, 69% of the crews in thesample had to refire at least some of the Table VIII exercises. Thepercentage of crews that qualified is substantially below the 95.5% of crewsthat were reported by Hoffman (1989) to have passed Table VIII at Grafenwoehr.Hoffman, however, acknowledged that the Grafenwoehr scores could have includedreruns. If so, any comparison between the two sets of scores would havelittle meaning.
Crew cuts (crew duties penalty points) appeared to have little effect onTable VIII scores since crews were penalized, on the average, less than threepoints per engagement. The distribution of crew cuts, shown in Figure 3, ispositively skewed. That is, more crews had a small number than a large numberof crew cuts.
The mean opening time for Table VIII was 8.75 seconds. The distributionof opening times, shown in Figure 4, is positively skewed. Thus, more thanhalf of the crews had average opening times of 8.00 seconds or less eventhough the average opening time was 8.75. Crews hit 61% of the targets, onthe average, and the distribution of percent hits, which is shown in Figure 5,was approximately normal.
9

12
2
0200 300 400 S00 G00 700 800 S00 1000
Tftble VITXX Ra- floore.
Figure 1. Distribution of Table VIII raw scores (average raw scoremultiplied by 10).
12
10
2
0200 300 K 0 So K oo 700 Soo 90 Y0Tab1. VIII Total Soors.
Figure 2. Distribution of Table VIII total scores (average totalscore multiplied by 10).
10

12
12
10
9
7
77
0 S 10 20 25 30 25 40 45 s0 55 G 60 5 70 7S s0
Table .rzxI Crew cu~ts
Figure 3. Distribution of Table VIII crew cuts (average cutsmultiplied by 10).
24
12
1 2 3 S 6 7 a 9 1 11 3 1 S 1 7 1 1 .
10l IZO~tlgT" M nM
Figure 4. D~istiuino al IIaeaeoeigtms
18-
X4
3
12
d 10
0I Vz I Z
deesv takHr rsne i als4ad5
5035 4 4 6 55 60 657 59 09 0
Tablv Vgt PerTent Hiti
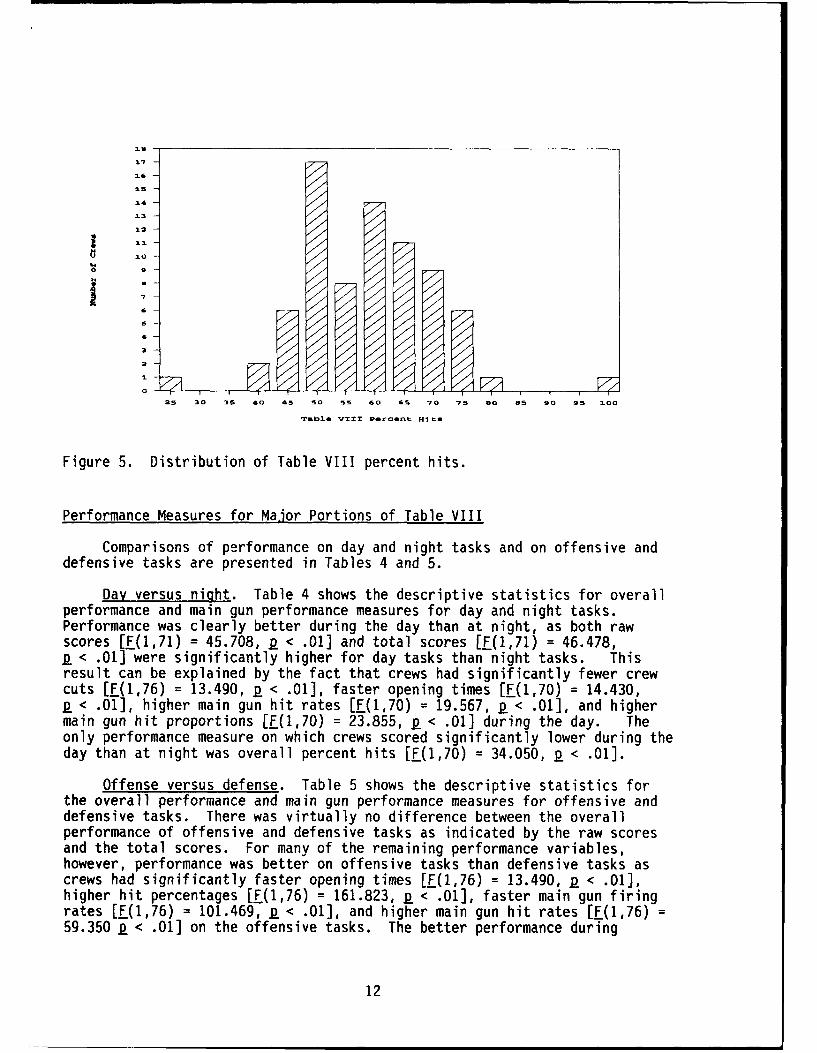
Figure 5. Distribution of Table VIII percent hits.
Performance Measures for Malor Portions of Table VIII
Comparisons of performance on day and night tasks and on offensive anddefensive tasks are presented in Tables 4 and 5.
Day versus niqht. Table 4 shows the descriptive statistics for overall
performance and main gun performance measures for day and night tasks.Performance was clearly better during the day than at night, as both rawscores [F(1,71) = 45.708, p < .01] and total scores [[(1,71) = 46.478,p < .01] were significantly higher for day tasks than night tasks. Thisresult can be explained by the fact that crews had significantly fewer crewcuts [L(1,76) = 13.490, p < .01], faster opening times [F(1,70) = 14.430,p < .01], higher main gun hit rates [L(1,70) = 19.567, p < .01], and highermain gun hit proportions [[(1,70) = 23.855, p < .01] during the day. Theonly performance measure on which crews scored significantly lower during theday than at night was overall percent hits [E(1,70) = 34.050, p < .01].
Offense versus defense. Table 5 shows the descriptive statistics forthe overall performance and main gun performance measures for offensive anddefensive tasks. There was virtually no difference between the overallperformance of offensive and defensive tasks as indicated by the raw scoresand the total scores. For many of the remaining performance variables,however, performance was better on offensive tasks than defensive tasks ascrews had significantly faster opening times [[(1,76) = 13.490, p < .01],higher hit percentages [F(1,76) = 161.823, p < .01], faster main gun firingrates [[(1,76) = 101.469, p < .01], and higher main gun hit rates [L(1,76) =59.350 p < .01] on the offensive tasks. The better performance during
12

u -
4-' ('4 0 O t, N 4- 0
C! 0 . . . > 004 LO C% C
4j 4--( N u04 C4J' 4-
0) m %; t * .-. 4 n r-, r.n
r 1 N C L -t4 tm ai r-C> O
to (a 0.~ '-
U t9-> 414S0 ( 4-=
0 >4 041 41 U0 --Lp t- I -M~ C:j04
C; u. Cu (404D-5. . 0.
4--c
+j. 00 C>CiC W( o L
04Ito (A (L d).4*C04N 4 Cm 4 to - !
4- Ln 41c W I
*00M 5-C1
04U 0( . 0 N
4)4-
4- > 4- C
f- W Cu -.
(U 41 4. C0
1 -00 00D4 :C> t
4- 4- 4-i OD 4 cm00) ccJ~ 3U)
c.4 c. 00C 44) to Ll C 41,tDL4Ul
04-0 1=-+ ~N4~~ oCD4 *c2i o c 'en0 00Lo ( -0 40 4 N
>3 W- >
0 0 to N. N 0 0 -
CuD
Q)L) 0 );..0u (flU .. .. C)4. t)-. *
13 4

offensive tasks is somewhat unexpected given the difference in scoringoffensive and defensive engagements on Table VIII. Timing during offensivetasks begins as soon as the target is activated. During defensive tasks,timing does not begin until the firing tank moves from turret to hull defiladeand is exposed to the target. Thus, the time required to acquire targets,issue fire commands, set the fire control switches, and make the initialtarget lay should not be reflected in the performance measures duringdefensive tasks. Despite the performance advantages provided by the timing ofdefensive tasks, crews apparently performed better during offensive tasks.
Predictor Variables
Summary statistics. Summary statistics for the U-COFT trainingvariables and the crew turbulence variable are shown in Table 6. The crewscompleted an average of 38.4 computer exercises and attained an averagereticle aim level of 26. Level 26 is in reticle aim group 4 of the crewtraining matrix. The tasks in group 4 require crews to fire at moving targetsfrom stationary tanks. Thus, on the average, crews practiced firing atstationary targets from stationary and moving tanks (crew reticle aim groups 2and 3) on U-COFT. On the average, crews also received some practice firing atmoving targets from stationary tanks (crew reticle aim group 4) on U-COFT, butthey did not practice firing at moving targets from moving tanks (crew reticleaim group 5). Similarly, the TCs attained an average reticle aim level of 15in the TC training matrix. Therefore, on the average, TCs had practicedfiring at stationary targets from stationary and moving tanks on U-COFT (TCreticle aim levels 1, 2, and 3), but did not practice firing at moving targetsfrom either stationary or moving tanks (TC reticle aim leveis 4 and 5). As aconsequence, many of the TCs and crews in this study did not practice onU-COFT firing under all of the engagement conditions that are required onTable VIII.
Table 6
Summary Statistics for Predictor Variables
TC TC TC Crew Crew Crew Time InComputer Total Reticle Computer Total Reticle CrewExercises Exercises Aim Level Exercises Exercises Aim Level (Months)
Minimum 0.00 0.00 6.00 0.00 4.00 10.00 0.50
Maximum 24.00 27.00 21.00 72.00 100.00 39.00 30.00
Mean 11.91 14.26 15.21 38.42 65.48 26.29 5.07
S.D. 6.34 7.17 4.31 17.49 22.72 8.19 4.72
Note. N = 77, TC - Tank commander.
14

Although the crews completed an average of 65 total exercises on U-COFT,only 38 of these exercises (58%), on the average, were computer selectedexercises. The remaining 27 exercises (42%) were selected by the I/Os. Incontrast, the TCs completed an average of 14 total exercises in the TC matrix,but only 2 (14%) were selected by the I/Os. This discrepancy in theproportion of I/O selected exercises implies that the I/Os emphasizedcrew-fired over TC-fired exercises.
The TCs and gunners in this study had been together for an average of 5months (see Table 6). Because this mean was influenced by a single crew thathad been together for 2-1/2 years, the median (3 months) is probably a betterindicator of crew turbulence than the mean. A median of 3 months indicatesthat only 50% of the crews were together for more than 3 months. Only 25% ofthe crews were together for more than 6 months, and only 4% were together morethan a year. These data confirm that crew turbulence is a major problem forunit trainers. Because tank gunnery requires a high degree of coordinationbetween crew members, an increased amount of training time would probably berequired to overcome the effects of the high turbulence rate.
U-COFT distributions. The distributions of the U-COFT predictormeasures are presented in Figures 6 through 9. The distribution of thereticle aim levels that were achieved in the crew matrix is presented inFigure 6. Although reticle aim level 26 was the mean level achieved in thecrew matrix, the level that was attained most often was level 39, the highestpossible reticle aim level; sixteen of the 77 crews (21%) had completed theentire crew matrix. None of the crews were in reticle aim group 1 (levels 1-7), and only four crews were in reticle aim group 2 (levels 8-14). Thedistribution of the reticle aim levels that were achieved in the TC matrix ispresented in Figure 7. The distribution within the TC matrix is similar tothe distribution within the crew matrix. Although level 15 was the averagereticle aim level achieved within the TC matrix, the level that was attainedmost often was level 21, the highest possible reticle aim level; 17 of the 77TCs (22%) had completed the entire matrix. None of the TCs were in reticleaim group 1, but 12 of the TCs (16%) were in reticle aim group 2.
The distributions of the computer and total exercises completed in thecrew matrix are presented in Figure 8. Although crews completed an average of65 total exercises, the distribution was negatively skewed. That is, thelargest number of crews (46) completed between 71 and 90 exercises, andrelatively few crews (12) completed fewer than 41 exercises. The distributionof computer exercises was more normally distribdted around the mean of 38 withonly one crew having completed more than 60 computer exercises.
The distributions of the computer and total exercises completed in theTC matrix are presented in Figure 9. Unlike the negatively skeweddistribution of total exercises completed in the crew matrix, the distributionof total exercises completed in the TC matrix was approximately normal.
15

16
17 Reticle Aim
Group 616
15
1211
10
0 9 Reticle AimGroup 4
70
5
4 Reticle Aim Reticle AimGroup 2 Group 3 Reticle Aim
Group 5
1 Reticle Aim 11 1
Group 1
1 3 5 7 9 11 13 15 17 19 21 23 25 27 29 31 33 35 37 39
Crew Matrix Reticle Aim Level
Figure 6. Distributions of crew matrix reticle aim level and reticle aimgroup.
186 -
Reticle Aim Group 517
16
15
14
13 Reticle Aim
0Group 3o 12
H 11
44 10 Reticle0
9 AimN Group 40
O Reticle AimGroup
2
3
2
1 Reticle AimGroup 1
1 2 3 1 5 6 7 2 .10 11 13 13 14 15 16 17 16 19 20 21
TC Matrix Reticle Aim Level
Figure 7. Distributions of TC matrix reticle aim level and reticle aimgroup.
16

2
20
18
14
10
X2
6
4
2
0-10 11-20 31-30 31-40 4M-50 51-60 GM-70 *71-80 81-90 93-100
brnflnr of t3-0072 Crew~ Mat rix Nbcoraon CoopletedComPnter aUOCexOt.8 Total WiceOZOISO
Figure 8. Distributions of the number of computer and total exercisescompleted in the crew matrix.
24 -
223
20
16
12
10
0-5 A-10 12-15 16-20 22-25 26-30
MU.JD7eof 10-COVtr TO MatrI. .Ot.. Coopletedcomputer Rxeroj. T g otal7. xerciso.
Figure 9. Distributions of the number of computer and total exercisescompleted in the TC matrix.
17
Intercorrelations and Correlations
Table VIII Performance Measures
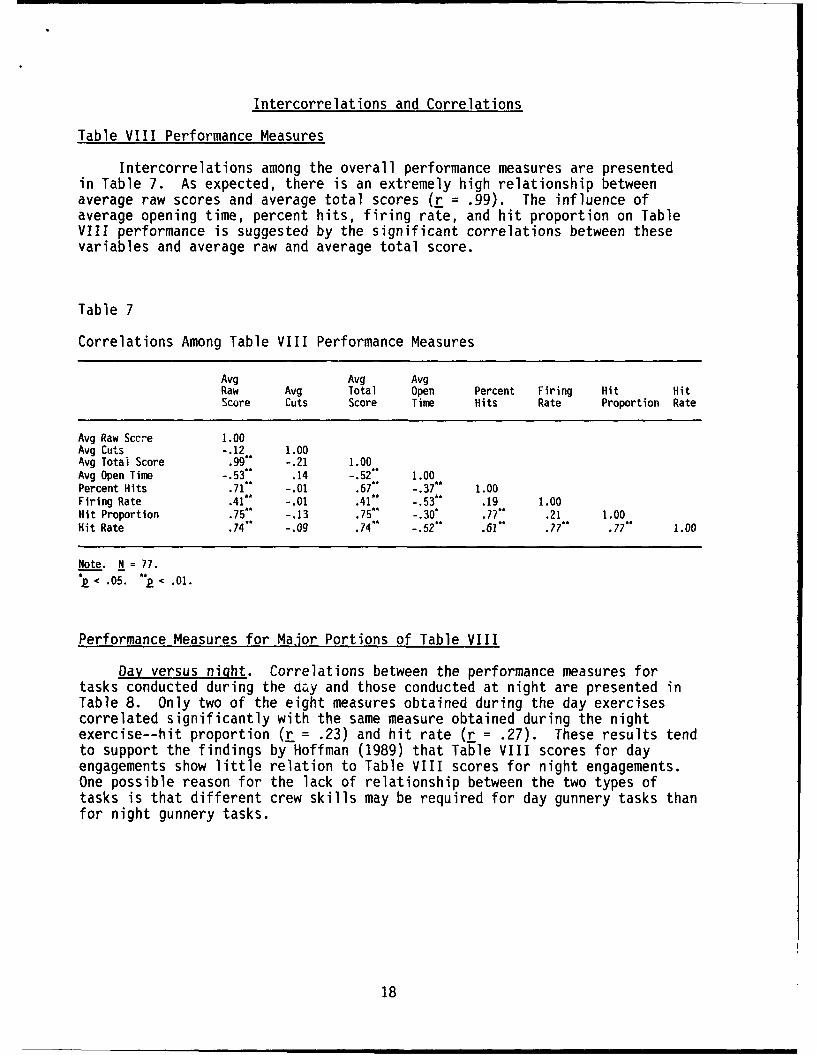
Intercorrelations among the overall performance measures are presentedin Table 7. As expected, there is an extremely high relationship betweenaverage raw scores and average total scores (L = .99). The influence ofaverage opening time, percent hits, firing rate, and hit proportion on TableVIII performance is suggested by the significant correlations between thesevariables and average raw and average total score.
Table 7
Correlations Among Table VIII Performance Measures
Avg Avg AvgRaw Avg Total Open Percent Firing Hit HitScore Cuts Score Time Hits Rate Proportion Rate
Avg Raw Sccre 1.00Avg Cuts -.12 1.00Avg Total Score .99"" -.21 1.00Avg Open Time -.53". .14 -.52"* 1.00Percent Hits .71* -.01 .67"" -.37** 1.00Firing Rate .41" -.01 .41"* -.53** .19 1.00Hit Proportion .75" -.13 .75' -.30* .77" .21 1.00Hit Rate .74" -.09 .74"* -.52* .61" .77"* .77"" 1.00
Note. N = 77.*2 < .05. " < . .01.
Performance Measures for Major Portions of Table VIII
Day versus night. Correlations between the performance measures fortasks conducted during the cay and those conducted at night are presented inTable 8. Only two of the eight measures obtained during the day exercisescorrelated significantly with the same measure obtained during the nightexercise--hit proportion (L = .23) and hit rate (r = .27). These results tendto support the findings by Hoffman (1989) that Table VIII scores for dayengagements show little relation to Table VIII scores for night engagements.One possible reason for the lack of relationship between the two types oftasks is that different crew skills may be required for day gunnery tasks thanfor night gunnery tasks.
18

Table 8
Correlations Between Table VIII Performance Measures for Day and Night Tasks
Day TasksAvg Avg AvgRaw Avg Total Open Percent Firing Hit HitScore Cuts Score Time Hits Rate Prop. Rate
Night Tasks
Avg Raw Score .19 .01 .18 .05 .26" .05 .35"" .28"Avg Cuts .11 .09 .09 -.13 .18 .23" -.01 .17Avg Total Score .18 .01 .17 .06 .24" .03 .34"* .26"Avg Open Time -.34"" .01 -.33"* .19 -.25" -.02 -.35"" -.23'Percent Hits .12 .06 .10 .03 .19 .03 .22 .17Firing Rate .26* -.05 .26" -.06 .22 .00 .37** .25*Hit Proportion .08 .01 .08 -.01 .18 .07 .23" .23Hit Rate .13 -.01 .12 .00 .18 .07 .31" .27'
Note. N - 71 for all correlations except those that include the performance variables average raw score,average cuts, and average total score, for which N 72." P< .05. -*k < .01.
Offense versus defense. Correlations between the performance measuresfor offensive tasks and the performance measures for defensive tasks arepresented in Table 9. Five of the eight measures obtained during offensiveexercises correlated significantly with the same measures obtained duringdefensive exercises. These results imply that the same crew skills arerequired for offensive and defensive gunnery tasks.
Table 9
Correlations Between Table VIII Performance Measures for Offensive andDefensive Tasks
Offensive TasksAvg Avg AvgRaw Avg Total Open Percent Firing Hit HitScore Cuts Score Time Hits Rate Prop. Rate
Defensive Tasks
Avg Raw Score .23' .00 .22 -.04 .27' .01 .13 .08Avg Cuts -.08 .01 -.08 .08 -.08 -.09 -.05 -.09Avg Total Score .23" .01 .23" -.05 .27' .02 .14 .09Avg Open Time -.20 .04 -.19 .25' -.21 -.17 -.09 -.17Percent Hits .19 .27" .14 -.06 .26 -.08 .11 .03Firing Rate .27* .08 .26" -.05 .22 .15 .21 .23"Hit Proportion .30 -.01 .29* -.08 .37"" -.13 .27" .09Hit Rate .35"* .03 .34*" -.05 .37- .03 .31"" .21
Note. N - 77.
R< .05. k: .01.
19

Predictor Variables
Correlations among the predictor variables are presented in Table 10.All six of the U-COFT related variables correlated significantly with eachother. Moreover, all of the U-COFT related variables except TC computerexercises and TC total exercises correlated significantly with time in crew,the measure of crew turbulence. This suggests that crews that had beentogether longer had more time to train on U-COFT (since they completed moreexercises) and performed better on U-COFT (since they reached a higher crewreticle aim level).
Table 10
Correlations Among Predictor Variables
TC TC TC Crew Crew Crew TimeComputer Total Reticle Computer Total Reticle InExercises Exercises Aim Level Exercises Exercises Aim Level Crew
1. TC Computer Exercises 1.002. TC Total Exercises .94* 1.003. TC Reticle Aim Level .37* .29* 1.004. Crew Computer Exercises .76* .69" .61" 1.005. Crew Total Exercises .42" .42" .33" .66" 1.006. Crew Reticle Aim Level .44* .34' .85* .65* .33* 1.007. Time in Crew .22 .20 .34* .39* .37" .38" 1.00
Note. N = 77. TC = Tank Commander'P - .01.
Relationship Between Performance Measures and Predictor Variables
Correlations between the predictor variables and the performancemeasures are presented in Table 11. Few of the correlations between thepredictor variables and the performance measures were significant. Crewreticle aim level correlated significantly with total score and hit rate, andTC reticle aim level correlated significantly with total score. That is,crews that advanced further in the crew matrix tended to have higher totalscores and hit rates on Table VIII. Likewise, crews with TCs that advancedfurther in the TC matrix tended to have higher total scores. These findingssuggest that sustainment training on the U-COFT does train gunnery skillsdemanded by Table VIII.
Correlations between predictor variables and performance variables werecomputed separately for day and night tasks and are shown in Tables 12 and 13,respectively. Crew reticle aim level correlated significantly with averagetotal score during both day and night exercises, but TC reticle aim levelcorrelated significantly with average total score only during the dayexercises. This latter finding is of minor importance, however, since thecorrelation between TC reticle aim level and total score differed only sightly
20

from day to night (r = .26 vs. r = .22). In addition, TC reticle aim levelcorrelated significantly with firing rate during night exercises, but notduring day exercises.
Table 11
Correlations Between Table VIII Performance Measures and PredictorVariables
Table VIII Measure
Avg Avg AvgPredictor Raw Avg Total Open Percent Firing Hit HitVariable Score Cuts Score Time Hits Rate Prop. Rate
TC Computer Exercises .12 .13 .11 .11 .01 .11 -.01 .05TC Total Exercises .01 .10 .00 .15 -.07 .07 -.08 -.02TC Reticle Aim Level .29" -.07 .30- -.14 .11 .11 .13 .16Crew Computer Exercises .17 .15 .16 .01 .07 .00 .05 .03Crew Total Exercises -.07 .22 -.09 .14 .02 -.10 -.12 -.13Crew Reticle Aim Level .35** .01 .35** -.13 .14 .20 .18 .24"Time in Crew -.10 -.01 -.09 .08 -.04 -.13 -.12 -.15
Note. N - 77 for all correlations except those that include the predictor variable time in crew, for whichW = 71. TC = Tank commander.*p< .05. *p< .01.
Table 12
Correlations Between Performance Measures for Table VIII Day Tasks andPredictor Variables
Table VIII Measure - Day Tasks
Avg Avg AvgPredictor Raw Avg Total Open Percent Firing Hit HitVariable Score Cuts Score Time Hits Rate Prop. Rate
TC Computer Exercises .14 .03 .13 .05 .01 .17 -.01 .16TC Total Exercises .02 .03 .01 .02 -.08 .16 -.09 .09TC Reticle Aim Level .25* -.09 .26* -.10 .05 -.01 .14 .10Crew Computer Exercises .20 .11 .18 .04 -.01 .02 .05 .08Crew Total Exercises .00 .19 -.02 .13 .02 -.02 -.03 -.03Crew Reticle Aim Level .26" .04 .25" -.11 .02 .13 .09 .17Time in Crew -.06 .03 -.06 .14 -.02 -.05 -.05 -.04
Note. N - 77 for all correlations except those that include the predictor variable time in crew, for which- 71.
21

Table 13
Correlations Between Performance Measures for Table VIII Night Tasks andPredictor Variables
Table VIII Measure - Night Tasks
Avg Avg AvgPredictor Raw Avg Total Open Percent Firing Hit HitVariable Score Cuts Score Time Hits Rate Prop. Rate
TC Computer Exercises .07 .15 .06 .10 .02 .02 -.01 .00TC Total Exercises .01 .11 .00 .17 -.03 -.04 -.05 -.05TC Reticle Aim Level .22 -.02 .22 -.15 .11 .23* .07 .17Crew Computer Exercises .07 .07 .07 -.05 .10 .05 .03 .02Crew Total Exercises -.13 .11 -.14 .04 -.09 -.01 -.21 -.16Crew Reticle Aim Level .28* -.06 .29 -.10 .21 .20 .19 .21Time in Crew -.10 -.08 -.08 .00 -.09 -.13 -.18 -.19
Note. N - 71 for all correlations that include the performance variables average opening time, percent hits,itpr oportion, and hit rate except those with the predictor variable time in crew, for which N - 65.N- 72 for all correlations that include the performance variables average raw score, average cuts, andaverage total score except those with the predictor variable time in crew, for which N = 66. TC - Tankcommander.
*p .05.
Correlations between predictor variables and performance variables werealso computed separately for offensive and defensive tasks and are shown inTables 14 and 15. The correlations for offensive tasks are similar to thoseobtained with all tasks. That is, TC reticle aim level correlatedsignificantly with raw and total score; and crew reticle aim level correlated
Table 14
Correlations Between Performance Measures for Table VIII Offensive Tasksand Predictor Variables
Table VIA Measure - Offensive Tasks
Avg Avg AvgPredictor Raw Avg Total Open Percent Firing Hit HitVariable Score Cuts Score Time Hits Rate Prop. Rate
TC Computer Exercises .13 .18 .12 .11 -.01 .09 .00 .05TC Total Exercises .04 .17 .02 .14 -.09 .07 -.04 .00TC Reticle Aim Level .29" .08 .29* -.15 .17 .14 .14 .19Crew Computer Exercises .19 .11 .19 -.02 .06 .02 .03 .06Crew Total Exercises -.02.. .22 -.02 .12 -.03 -.06 -.06 -.04Crew Reticle Aim Level .38 .06 .38* -.15 .21 .25" .19 .27"Time in Crew .05 .02 .05 -.06 .02 -.04 -.09 -.09
Note. N - 77 for all correlations except those that include the predictor variable time in crew, for whichW-iT TC - Tank commander.
S.05. < " .01.
22

Table 15
Correlations Between Performance Measures for Table VIII Defensive Tasksand Predictor Variables
Table VIII Measure - Defensive Tasks
Avg Avg AvgPredictor Raw Avg Total Open Percent Firing Hit HitVariable Score Cuts Score Time Hits Rate Prop. Rate
TC Computer Exercises .08 .00 .08 .04 .02 .09 .01 .07TC Total Exercises -.01 -.03 -.01 .07 -.05 .03 -.07 -.01TC Reticle Aim Level .16 -.17 .18 -.08 .02 -.01 .10 .08Crew Computer Exercises .08 .09 .07 .02 .04 -.02 .07 .03Crew Total Exercises -.11 .10 -.13 .10 .04 -.09 -.11 -.11Crew Reticle Aim Level .16 -.05 .17 -.06 .02 .02 .12 .10Time in Crew -.22 -.04 -.21 .18 -.09 -.22 -.08 -.18
Note. N - 77 for all correlations except those that include the predictor variable time in crew, for whichN - 71. TC - tank commander.
significantly with raw score, total score, hit rate, and firing rate. On theother hand, the predictor variables did not correlate significantly with anyof the performance measures for defensive tasks.
The finding that the predictor variables correlated significantly withTable VIII performance measures for offensive tasks, but not for defensivetasks, was unexpected. There are two possible explanations for this finding.The first possible explanation is that U-COFT training is more effective atpreparing crews for offensive engagements than for defensive engagements.This is unlikely given the fact that there are more defensive than offensiveengagements represented in the U-COFT crew matrix. The second possibleexplanation is that the significant correlation between crew reticle aim leveland performance on offensive tasks on Table VIII may be due to the role thattarget acquisition plays during offensive engagements. Since timing does notbegin on defensive tasks until the tanks move out of defilade position,performance scores for defensive tasks primarily reflect marksmanship. Timingon offensive tasks begins as soon as a target appears. Consequently, targetacquisition plays a relatively important role in offensive engagements. Thesignificant correlation between U-COFT reticle aim level and offensive tasks,but not defensive tasks, on Table VIII, may reflect the success of U-COFT intraining crews to acquire targets.
Predicting Table VIII Performance
The major purpose of this study was to determine whether or not measuresof U-COFT performance and crew turbulence could be used to predict which crewswould qualify on Table VIII on their first run. The best prediction thatcould be made without predictor variables is that all 77 crews in the samplewould fail to qualify on Table VIII on their first run. Since 24 crews didqualify on their first run, the predictions would be incorrect for 31% of thecrews. Thus, predictions made without predictor variables cannot be used toidentify the crews that would be most likely to qualify on Table VIII, since
23

all crews would be predicted to fail Table VIII. The next step in theanalysis, therefore, was to try to predict which crews would qualify on TableVIII using the predictor variables.
Regression Analyses
Crew reticle aim level and TC reticle aim level were the only twopredictor variables that correlated significantly with average total score onTable VIII. Consequently, scatter plots were constructed of crew reticle aimlevel and Table VIII total scores (Figure 10) and TC reticle aim level andTable VIII total scores (Figure 11). The regression line shown on each figure(i.e., solid diagonal line) depicts the Table VIII total score that would bepredicted using a regression formula. A dotted line drawn horizontally ineach figure shows the minimum total score crews must achieve to qualify onTable VIII. In Figure 10, if a vertical line is drawn from the point at whichthe regression line intersects the dotted line, the vertical line willintercept the X-axis at reticle aim level 39. This indicates that crewreticle aim level cannot be used to predict which crews would qualify on TableVIII. Crews achieving reticle aim levels less than 39 would be expected tofail Table VIII on their first run. Predictions cannot be made among crewsreaching reticle aim level 39 since maximum uncertainty concerning passing orfailing occurs at that level. In the TC matrix, no crews would be expected topass since the regression line does not intercept the cutoff score within theestablished boundary of the matrix. These findings indicate that theindividual correlations between crew and TC reticle aim levels and total scoreare not sufficiently robust to allow prediction of Table VIII performance fromreticle aim level alone.
Multiple Regressions
Given that neither crew reticle aim level nor TC reticle aim level couldbe used to predict which crews would qualify on Table VIII on their first run,the next step was to examine whether multiple predictor composites couldimprove predictions of Table VIII performance. Multiple regression analyseswere conducted to identify predictor variables which, when combined with crewreticle aim level or TC reticle aim level, significantly increased theproportion of variance accounted for in Table VIII average total score. Sinceprogress through the TC and crew matrices should take place at roughly thesame rate, variables from the two matrices were expected to have highintercorrelations (which was indeed the case, as reported above). Therefore,prior to the analyses it was decided that no attempts would be made to combineU-COFT predictor variables across matrices. That is, no attempts were made toform predictor composites by combining crew reticle aim level with TC reticleaim level, crew reticle aim level with the number of exercises completed inthe TC matrix, or TC reticle aim level with the number of exercises completedin the crew matrix.
The regression analyses showed that there were three cases in whichcombining a second predictor variable with crew or TC reticle aim levelcontributed significantly to the prediction of Table VIII total scores. Twoof the cases involved crew reticle aim level and the other TC reticle aimlevel. When combined individually with crew reticle aim level, both time in
24

1000
900
LU 800 minimun
W ~qualificationrrstandard
CO 600
o 500
400
300
200
100r =.35. p < .0 1
0 ............ ....... .......
0 13 26 39
CREW RETICLE AIM LEVEL
Figure 10. Total score as a function of reticle aim level attained in theU-COFT crew matrix. (Total score = average total score x 10.)
25

1000
900
800 minimrnCc standardo 700 -0
-J 600
1--o 500
400LuIJm 300
200
100
0
0 7 14 21
TO RETICLE AIM LEL--VEL
Figure 11. Total score as a function of reticle aim level attained in theU-COFT TC matrix. (Total score = average total score x 10.)
26

crew and crew total exercises contributed significantly to the prediction ofaverage total score. Likewise, combining time in crew with TC reticle aimlevel significantly increased the proportion of variance accounted for inaverage total score. The results of the multiple regression analyses and theincrease in proportion of variance accounted for by each of the threecomposite regression equations are presented in Table 16.
Table 16
Results of Multiple Regression Analyses of Average Total Score by PredictorVariables
Variables Entered in Equation Multiple R2 R2 Change F df p level
Crew reticle aim level .147Crew reticle aim level & Time in crew .241 .067 5.80 1.68 .05
Overall model .214 9.26 2,68 .0001
Crew reticle aim level .125Crew reticle aim level & Crew total exercises .175 .049 4.03 1,68 .05Overall model .175 7.77 2.68 .001
TC reticle aim level .111TC reticle aim level & Time in crew .161 .05 4.05 1,68 .05
Overall model .161 6.50 2,68 .003
Time in crew and crew total exercises are both weighted negatively inthe regression equations in which they appear. Thus, if crews at any givenreticle aim level are compared, the crew that had been together the shortestperiod of time would have the highest predicted total score; and the crew thathad been together the longest would have the lowest predicted score.Likewise, at any given reticle aim level the crew that completed the fewestnumber of U-COFT exercises would have the highest predicted score and the crewthat completed the most U-COFT exercises the lowest. The fact that time increw and the number of U-COFT exercises completed were virtually uncorrelatedwith average total score (r = .09 for both variables) indicates that they eachact as a suppressor variable in their respective regression equations. Thevariables time in crew and number of U-COFT exercises in effect partial out,or suppress, that part of reticle aim level that is unrelated to average totalscore. That is, since time in crew and number of U-COFT exercises explainsome of the variability in reticle aim level, the proportion of variance intotal score explained by reticle aim level is greater.
Accuracy of the Predictor equations. The three significant regressionequations were used to calculate predicted total scores for each crew. Thethree resulting predicted scores were individually plotted against each crew'sactual total score. Figure 12 shows actual total score plotted against thepredicted total score based on crew reticle aim level and time in crew.Figure 13 shows actual total score plotted against the predicted total scorecalculated from crew reticle aim level and the number of exercises completed
27

in the crew matrix. Figure 14 shows the plot of actual total score and thepredicted total score derived from TC reticle aim level and time in crew. Ineach figure, the horizontal dotted line shows the total score necessary toqualify on Table VIII and the solid line along the diagonal represents theregression line.
Figure 12 shows that the predictor composite of crew reticle aim leveland time in crew predicted that 12 crews would qualify on Table VIII and 65crews would fail. Of the 12 crews predicted to qualify, only six actuallyqualified on their first run. In addition, only 47 of the 65 crews that werepredicted to fail actually failed to qualify. Thus, 50% of the crews thatwere predicted to qualify actually qualified, and 72% of the crews that werepredicted to fail actually failed. Overall, 53 of the 77 predictions (69%)based on the composite of crew reticle aim level and time in crew wereaccurate. That is the same level of accuracy that would be achieved if thepredictor variables were ignored. However, if predictor variables were notused and all 77 crews were allowed to participate on Table VIII, 31% of thecrews (i.e., 24 crews) would qualify. On the other hand, if predictorvariables were used and crews had to have a predicted total score of at least700 to participate on Table VIII, 50% of the crews (i.e., 6 crews) wouldqualify. Although the number of qualifying crews would be reduced from 24 to6 by using the predictor composite, the number of crews participating on TableVIII would be reduced from 77 to 12. Of course, all crews would participateon Table ,'III when the predictors indicate that they would be likely toqualify.
Figure 13 shows that the regression equation that includes crew reticleaim level and the total number of exercises completed in the crew matrixpredicts that 8 crews wo!ld qualify and 69 crews would fail. Four of tile 8crews (50%) predicted to qualify actually qualified, and 49 of the 69 crews(71%) predicted to fail actually failed. Again, 53 of the 77 predictions(69%) were correct. These accuracy levels and the passing rate are virtuallythe same as those obtained using the composite of crew reticle aim level andtime in crew. However, the composite of crew reticle aim level and time increw correctly predicted 25% of the crews that qualified, while the compositeof crew reticle aim level and total number of exercises correctly predictedonly 17% of the crews that qualified.
Figure 14 shows that the composite of TC reticle aim level and time increw predicted that five crews would qualify and 72 would fail. Only two ofthe five crews (40%) predicted to qualify did indeed pass, and 50 of the 72crews (69%) predicted to fail did indeed fail. Thus, 52 of the 77 predictions(68%) were correct. However, the composite of TC reticle aim level and timein crew was able to predict only two of the 24 crews (3%) that actuallyqualified.
28

1000 I I I I I,0
900 -
800 mnirnrum 4N 'qualification
:0cc:LL standard zz z ,
o 700 -- - - -,- . . .. .. .. ...
600 0 0 o
500 04 ?00
400
o 300
2000,001
100- R =.46, p < .00 1
0
0 100 200 300 400 500 600 700 800 900 1000
PREDICTED TOTAL SCORE
Figure 12. Actual total score plotted against a predicted total score basedon crew reticle aim level and time in crew. (Actual total score = averagetotal score x 10. P.'edicted total score = 419.16 + [9.14 x crew reticle aimlevel] + [-.921 x time in crew]. Geometric shapes were used as plottingpoints to assist the reader in identifying the quadrant of the plot in which apoint occurred.)
29

1000 I I ' I ' I ' I I , I i '1000
900
A OAAA ZA, :o
800 min~imm, ,A /-
qualification A- A,cc standard
0 700 A- &-- -----------0oC/) 600
<00 500 C>
oV400
o 300
200
100R= 42, p <.001
0 I I I I I I , I
0 100 200 300 400 500 600 700 800 900 1000
PREDICTED TOTAL SCORE
Figure 13. Actual total score plotted against a predicted total score basedon crew reticle aim level and the total number of exercises completed in thecrew matrix. (Actual total score = average total score x 10. Predicted totalscore = 504.31 + [8.07 x crew reticle aim level] + [-1.58 x crew totalexercises]. Geometric shapes were used as plotting points to assist thereader in identifying the quadrant of the plot in which a point occurred.)
30

1000 I 1 I ' 1 1 1 1
900
0 - qualification
standard
0T' 700 -- . . . .
00r. 600 > o :o
<-F- 5000
400
0
0- 300
200
100R = .40. p <.01
0 / ,
0 100 200 300 400 500 600 700 800 900 1000
PREDICTED TOTAL SCORE
Figure 14. Actual total score plotted against a predicted total score basedon TC reticle aim level and time in crew. (Actual total score = average totalscore x 10. Predicted total score = 428.35 + [14.72 x TC reticle aim level] +[-7.81 x time in crew]. Geometric shapes were used as plotting points toassist the reader in identifying the quadrant of the plot in which a pointoccurred.)
31

Table 17 shows the number of correct and incorrect predictions ofTable VIII first-run performance as calculated from crew reticle aim levelalone and each of the three predictor composites. The table shows that usingcrew reticle aim level by itself or using any one of the three predictorcomposites yields approximately the same number of correct (52-53) andincorrect (24-25) predictions. A close examination of Table 15 shows that asthe number of true positives (crews predicted to qualify that actuallyqualified) increases, the number of false positives (crews predicted toualify that actually failed) increases, and the number of true negativescrews predicted to fail that actually failed) and false negatives (crews
predicted to fail that actually qualified) decreases.
Table 17
Frequency of Correct and Incorrect Predictions of Table VIII First-RunOutcomes
PredictionsCorrect Incorrect
Predictors Qualify Fail Qualify Fail
Crew Reticle Aim Level 0 53 0 24
TC Reticle Aim Level &Time in Crew 2 50 3 22
Crew Reticle Aim Level &Crew Total Exercises 4 49 4 20
Crew Reticle Aim Level &Time in Crew 6 47 6 18
Utilizing the regression equations to predict Table VIII scores.Figure 15 shows the expected first-run Table VIII scores as calculated fromdifferent combinations of crew reticle aim level and time in crew (in months).According to the figure, crews that reach reticle aim level 32 in the crewmatrix would be expected to qualify on their first run on Table VIII, but onlyif the crew had been paired together for one month or less. Presumably a crewthat could reach level 32 in just one month would be good enough to qualify onTable VIII on their first run. As crews are together for increasingly longerperiods of time, they would have to attain higher reticle aim levels to beexpected to qualify. Crews that reached reticle aim level 39, but had to betogether 8-1/2 months to do so, would not be expected to qualify. Thus, thedata suggest that crews skilled enough to reach level 32 in one month or lesswill qualify on their first run on Table VIII, but crews that take longer thaneight months to reach level 39 will not. No conclusions can be reachedconcerning the effects of time in crew on Table VIII performance, however,since the correlation between time in crew and average total score was notsignificant.
32

4-~
40
CA'* i * 4R ..... -w0
.. . . ..... .. .. .. .. ... .... .... ... .. ..... .. .. ....
CCo
111 .. M:. M. N. JO.,
In .. ......t 4 4 *4 A * A *4
N .~ ~ . ........... N ~
6i .. ... ........ 0 4
Ln N. N. I. imm "AS' 4J
....... ....'a 4#A!LA. ow.
...... ... .. ...X
4jU........... U' - .0 a
C! .4CA- Vl a *-4A0 roA *MIMIa
... ....#z~~4 v en -4Oo '
1-D S.- 4U 4-) (A
LM C- * 4 ox""V * 4 ~ 4 . 4 * 4 4 Ar- W. 4-
. .. ... ... . ... ... ...010
i RUge> X CD
LIN
'.. C- a) 4S,-E
wo~ W 5 r
V.. .. ....4A * A ...V 4 .4 * -X::11 1 11tm=- i**aim ru*%4A AA 1~~*
.1 -40 U
N. I 6:~ s~.
a a'a)
C-4> C- rC
~~ a) 4-'
UC96IJ3 WWO--4-'Ew <-
a ~ ~ U33

Figure 16 shows the expected first-run Table VIII scores derived fromdifferent combinations of crew reticle aim level and total number of exercisescompleted in the U-COFT crew matrix. According to the figure, crewsproficient enough to attain level 28 in only 15 exercises are likely toachieve a qualifying score on their first run on Table VIII. The figure alsoshows that crews failing to reach level 39 in less than 80 exercises will notbe expected to qualify on their first run. This suggests that as crewscomplete additional exercises, they must make progress within the crew matrixin order to be expected to qualify on Table VIII.
Figure 17 shows the expected first-run Table VIII scores as calculatedfrom different combinations of TC reticle aim level and time in crew (months).According to the figure, a crew whose TC has reached reticle aim level 19 inthe TC matrix would be expected to qualify on Table VIII, but only if the TCand gunner have been paired together for one month or less. Obviously, if theTC and gunner have been together for one month or less, either the TC, or thegunner, or both are new to the crew or new to their position. If the TC isnew, the results suggest that a crew will qualify if the TC is good enough toreach level 19 in the TC matrix in one month or less. As the TC and gunnerare together for longer periods of time, the TC would have to attainincreasingly higher reticle aim levels for the crew to be expected to qualify.Any crew that has been together for five months or more without the TCattaining reticle aim level 21 of the TC matrix would not be expected toqualify on Table VIII. Presumably, any TC that took five months to reachlevel 21 is not proficient enough to have his crew qualify on its first run ofTable VIII.
Discussion
The performance data revealed that 53 of the 77 tank crews in the samplefailed to qualify on their first run on Table VIII. Thus, two-thirds of thetank crews participating on the table had to refire one or more gunneryengagements. This finding confirms the notion that improved ammunitionconservation techniques will be needed if ammunition allocations are reducedin the future.
The major purpose of this study was to determine how well performance onTable VIII could be predicted from amount and level of training on U-COFT andfrom crew turbulence data. If these variables could predict which crews wouldqualify and which crews would fail to qualify on their first run on TableVIII, then it would be possible to reduce ammunition expenditures by allowingonly those crews that would be likely to qualify to participate on Table VIII.The remaining crews would receive additional training on a gunnery trainer orsimulator until they too would be expected to qualify on their first run onTable VIII. The savings in ammunition would be achieved by reducing thenumber of crews that would have to refire the gunnery engagements.
The results of the data analysis showed that two of the predictorvariables--crew reticle aim level and TC reticle aim level--correlatedsignificantly with average total score. The correlations were not large (.35and .30, respectively), however, and neither variable could be used to predictwhich crews would qualify on their first run on Table VIII. Multiple
34

U )cu r_
44- - 4
U .-U, . S * 4 1 ..........
-n f!r
en tR. ... . : () Wa)
4- ) .0
A' 0)-f" P, m - .4 ' UA')-
_. . ... .. ... .. ..... ..LAJ0 4J X4-
.......... - a) 4-w4 ~ W* *~ -.4 -- __.
C C9 Q I Lt _r....i' w " vw
P,~4 -4 c"Lira)-4m,. . . .
P4-
~~U ,0)
. 0)01'.................. ... .. *. .. I ..0') .15) , I- 4AL~1Am044.#5m itsA'.) C- S'~ U)1DJ
15.1. I' IS.U's 's ~a-XIN r- fiS
tv> !
1%Ja)U ~ . ..I ...-15) -4m q r_ 4)~~.
.... .. ... ..
0~ . . .. .. ... ... .... 4 * .. .. .4 4 5 4
15) ~*~j~M 4-
tia) >.r
cm' Q) .J
............. 'w0J
'Ad~~~- a)-: 4x 4j:) 2
'0 (L) 4-)
.i ........
'.7
*-0 SiX
35

MONTHS PAIRED TOGETHER IN CREW
5 4.5 4 3.5 3 2.5 2 1.5 1 0.5
21 5 702.3 706.2 710.1 714.0 717.9 721.9 725.8 729.7 733.6T 20 6 i i 6U9. 703.2 707.1 711.0 714.9 718.8C 19 i#iU 0i .700.2 704.1
18 5 i4.$ 5iLZ iR 17 am9.&.4.3.A 644. 6Ai 6L 04P4E 16 P4i~.4 ii i 3*4 i :40A 644ii ii4$ .
T 15 6101 140 17. 81. 86.782.883.8 ~74 413E 14 N I .1 1 I II....... ............... .6..I................
Fiur 1. PrdceSvrg2otlsoeo al VI safnto
C 13 80784888 ~48838Q~841880610L 12 86989883887781888 894.9....01E 11 8 85 8484 8$80784 7. 4*4
Figure 17. Predicted average total score on Table VIII as a functionof time together as a crew and the reticle aim level att 'ained in theU-COFT TC matrix. (The predicted scores within the #!$rke ie po rt io nof the matrix fall below the minimum qualification standards forTable VIII.)
correlations using two variable composites resulted in higher correlationsthan were obtained using single predictors. The multiple correlation betweenaverage total score and the composite of crew reticle aim level and time increw, for example, was .46.
Although the correlation with average total score increased when using acomposite of two predictor variables, a more important issue concerns thepractical consequence of the relationship between the predictor andperformance variables. If the crews in the sample had been required to attainan expected total score of 700 before being allowed to fire Table VIII, onlytwelve crews would have participated in the table without receiving additionaltraining. Half of the twelve crews would have qualified, and half would havefailed to qualify. On the other hand, if all of the crews in the sample wereallowed to fire regardless of the expected outcome, only 31% would havequalified and 69% would have failed to qualify on Table VIII. Thus, using thepredictor variables to determine which crews would be allowed to fire TableVIII would have increased the percentage of crews that qualified from 31% to5n% and would have decreased the percentage of crews that failed to qualifyfrom 69% to 50%. To achieve this increase in efficiency, however, 18 crewsthat actually qualified on Table VIII would not have been allowed toparticipate on the table until they attained higher reticle aim levels in theU-COFT crew matrix. Although these 18 crews would have had to take part inmore U-COFT exercises, there would be no increase in the number of rounds oflive ammunition they would eventually fire. In return for having to provideadditional U-COFT training for 18 crews, 47 other crews would have been
36

prevented from participating on Table VIII when they would have failed toqualify.
By selecting a predicted score of 700 as the prerequisite for firingTable VIII, twelve crews would have been allowed to fire and half of themwould have qualified. This level of accuracy is expected since predictedperformance scores derived from regression equations deviate from actualscores. The regression lines in Figures 6-9 represent the predicted scores onTable VIII given different levels of U-COFT training and different levels ofcrew turbulence. The actual scores would be distributed around the regressionline with half of the scores being above the line and half of the scores beingbelow the line. Thus, an accuracy level of 50% (i.e., half of the crew passand half of the crews fail) would be expected when a predicted total score of700 is used to determine which crews would take part on Table VIII. One wayto increase the accuracy of the prediction would be to require a higherpredicted score in order to take part on Table VIII. For example, if apredicted total score of 800 were used instead of 700, more than half of thecrews would be expected to qualify on Table VIII. Unfortunately, thisprocedure could not have been used on the present sample since none of thecrews had an expected score that high. In fact, using the highest U-COFTlevel (level 39 in the crew matrix) in the regression equation along with themini mum time in crew (0 months) yields an expected average score of only775 . Consequently, 50% accuracy in predicting which crews would qualify ontheir first run on Table VIII represents the highest level of accuracy thatcan be achieved using the predictor variables that were examined in the study.Nevertheless, an accuracy level of 50% is considerably better than an accuracylevel of 31% that would be achieved without using any predictors at all.
In summary, if predictor variables were used to determine which crewswould be allowed to fire Table VIII, fewer crews would participate on TableVIII until receiving additional training. By delaying their first run onTable VIII, the percentage of crews firing Table VIII that would qualify ontheir first run would increase from 31% to 50%. Although this procedure woulddelay participation on Table VIII for most crews, the number of engagementsthat would have to be refired would be reduced, and there would be acorresponding savings in ammunition.
The basic presumption underlying this research is that additional U-COFTtraining would be provided to crews expected to fail Table VIII on their firstrun. The purpose of this additional training would be to allow the crews toprogress through the U-COFT matrix. Unfortunately, the additional trainingcould overtax U-COFT facilities that may already be overburdened. Blocks ofU-COFT time would have to be reserved for crews needing additional trainingprior to Table VIII. Although U-COFT plays an important role in sustaininggunnery skills, trainers may have to establish a set of priorities fordetermining who would have access to U-COFT when the demands for U-COFT timeexceed availability. Since it would be highly cost effective to use U-COFT toincrease the first-run qualification rate on Table VIII, it would be
2Although the maximum average Table VIII score is actually 1000, theestimates provided by regression formulas always move closer to the mean.
37

reasonable to expect that preparation for Table VIII would receive a highpriority.
Finally, the reader should be aware of a statistical artifact that couldlead to erroneous conclusions concerning the relationship of Table VIIIperformance to either time in position or the number of exercises completed inthe crew matrix. The predicted average total scores for Table VIII that wereshown in Figures 15, 16, and 17 appear to suggest that crews will not qualifyon their first run if the TC and gunner are paired together in the same crewfor more than 8 months (see Figure 15), if the crew completed more than 75exercises in the crew matrix (see Figure 16), or if the TC and gunner arepaired together in the same crew for more than 4.5 months (see Figure 17).These conclusions would be inaccurate since they would be based on astatistical artifact. The multiple regression equations used to derive thethree figures assume that the predictor variables are without limits. Inreality, there are caps on reticle aim level since the crew matrix containsonly 39 levels and the TC matrix contains only 21 levels. Therefore, anyconclusions concernii crews that have been together for relatively longperiods of time or that have completed a relatively high number of U-COFTexercises (which, in turn, is a function of the time the crew has beentogether) could be misleading.
PHASE II
Method
Participants
Phase II utilized Table VIII, U-COFT, and crew turbulence data collectedfrom four M1 tank battalions (136 crews) in two CONUS divisions.
Predictor Variables
The only predictor variables included in the Phase II analyses were crewreticle aim level and time in crew. Data pertaining to the remainingpredictor measures utilized in Phase I (i.e., TC and crew computer exercises,TC and crew total exercises, and TC reticle aim level) were unavailable forthe majority of the crews.
Performance Variables
Average total score on Table VIII was the only performance measureincluded in the analysis of the data collected for Phase II. The other fourmeasures of overall performance used in Phase I (average raw score, averagecuts, average opening time, and percent hits) and the three measures of maingun performance (firing rate, hit proportion, and hit rate) were droppedbecause data concerning those variables were unavailable for most of thecrews.
38

Analyses
Descriptive Statistics
Summary statistics and distributions were calculated for the following:(a) measures summarizing first-run performance on Table VIII; (b) measuressummarizing performance on the major portions of Table VIII (i.e., separatesummary statistics for day tasks, night tasks, offensive tasks, and defensivetasks); and (c) summaries of the predictor variables (crew reticle aim leveland crew turbulence).
Intercorrelations and Correlations
The following intercorrelations were obtained: (a) intercorrelationsamong the predictor variables, (b) intercorrelations among the performancemeasures, and (c) correlations between the predictor variables and theperformance measures.
Cross-Validation of Phase I Findings
The model derived from the regression analyses conducted during Phase Iwas used to predict the Table VIII performance of the Phase II crews. Thesepredicted scores were then plotted against actual scores to determine thecross-validity of the predictor equation.
Replication of Phase I Regression Analyses
The regression analyses conducted during Phase I were replicated todetermine if assigning different weights to the variables in the regressionequation would increase the validity of the model as applied to the datacollected for Phase II.
Results
Descriptive Statistics
Table VIII Performance Measures
Summary statistics and distributions. The summary stetistics for TableVIII average total score are shown in Table 18. The mean average total scoreof 74.2 results in a mean total score of 742.0 (i.e., average total scoremultiplied by 10) which is well above the minimum score of 700 necessary forcrew qualification on Table VIII, and is 130 points greater than the meantotal score for the Phase I crews. In addition, although the distribution oftotal scores for the Phase I crews (Figure 2) was roughly normal, thedistribution of total scores for the Phase II crews, as presented inFigure 18, is negatively skewed. That is, the scores are clustered towardsthe high end of the performance range.
39

Table 18
Summary Statistics for Average Total Score on Table VIII and ItsMajor Portions
Average Major Portions of Table VIIITotal Score Day Night Offense Defense
Minimum 22.20 21.17 0.00 7.00 20.00
Maximum 96.60 100.00 100.00 100.00 99.40
Mean 74.20 69.78 80.84 72.78 74.22
S.D. 15.14 17.56 19.75 22.85 15.99
Note. N = 136.
26 ,
24 -
22 -
20 -
18 -0
w 16 -NU
12omt b10)
6 --
300 200 400 500 600 7o0 soo 900 1000
Table VIII Total Scores
Figure 18. Distribution of Table VIII total scores (average total scoremultiplied by 10).
40

Because of the large discrepancy in mean total score between the crewsin Phase I and Phase I, performance on Table VIII was broken down bybattalion for both the Phase I and Phase II crews. The summary statisticspresented in Table 19 show that performance on Table VIII was not consistentacross battalions in either phase, as mean total scores ranged from 530.2 to685.5 in Phase I and from 647.9 to 830.4 in Phase II.
Table 19
Summary Statistics for Table VIII Average Total Score by Phase and Battalion
Phase I Battalions Phase II Battalions
1 2 1 2 3 4
n 41 36 19 38 35 44
Minimum 43.60 23.70 25.50 56.70 22.20 44.40
Maximum 95.20 83.70 95.60 95.40 91.90 96.60
Mean 68.55 53.02 66.56 83.04 64.79 77.36
S.D. 11.98 14.65 19.39 8.47 15.85 11.18
Performance on the Major Portions of Table VIII
Summary statistics for average total score on Table VIIIA (day),Table VIIIB (night), Table VIII offensive tasks, and Table VIII defensivetasks are presented in Table 18.
Day versus night. Average total score on Table VIII was significantlyhi gher for tasks fired at night fir those fired during the day(F[1,135] = 35.795, 2 < .01). This relationship is opposite the one found inthe Phase I analysis. The Phase II mean night score is 11 points higher thanthe mean day score, while the Phase I mean night score is 21 points lower thanthe mean day score.
Offense versus defense. A comparison of the mean average total scoresfor the offensive and defensive tasks revealed no significant differences.This parallels the results of the Phase I analysis, although the Phase IItotal scores are higher than the Phase I total scores for both the offensive(10 points) and defensive (14 points) tasks.
41

Predictor Variables
Summary statistics and distributions. The 136 crews in Phase IIattained a mean reticle aim level of 20.80 in the crew matrix, with a standarddeviation of 8.33. Figure 19 shows the distribution of crew reticle aim levelfor the Phase II crews. A comparison of the means for the Phae I(mean = 26.29) and Phase II samples reveals that the Phase II crews did notprogress as far in the matrix as the crews in Phase I. The average crew inPhase II had reached reticle aim group 3 in the crew matrix, whereas theaverage Phase I crew had reached reticle aim group 4.
15 ....... . ....... ._ __ __ __ __ __ __ __ __
Reticle Aim Group 614
13
12
11 Reticle Aim
Group 3
SReticle Aim
0 Group 4S 9U
B ReReile AiA
o Group 27
*1 Reticle Aim
- ''GrGroup 5
2 3 5 7 9 11 13 i5 17 19 21 23 25 27 29 31 33 35 37 39
CREW MATRIX RETICLE AIM LEVEL
Figure 19. Distribution of crew matrix reticle aim level and reticle aimgroup.
42

Data regarding the amount of time crews had been paired together wereavailable for 129 of the Phase II crews. The length of time crews in Phase IIhad been together ranged from 2 weeks to 33 months with a mean of 4.68 months,and a standard deviation of 5.79. The distribution of time in crew for PhaseII, as shown in Figure 20, is similar to that for Phase I and again the median(2 months) is probably a better indicator of crew turbulence than is the mean.Only 50% of the Phase II crews were together longer than 2 months, 31% longerthan 3 months, 22% longer than 6 months, and 9% longer than 1 year.
40
35
30
.5
0 20
10 -
5
0 1 2 3 4 5 6 7 5 9 10 11 12.
aIME IN CREW (Months)
Figure 20. Distribution of time in months that the TC and gunner had beenpaired together.
43

Intercorrelations and Correlations
Table 20 shows the intercorrelations among average total score on TableVIII, average total score on each of the major portions of Table VIII, U-COFTcrew reticle aim level, and time in crew.
Table 20
Correlations Among Table VIII Performance Measures
Average Total Score CrewReticle Time
Table Aim inVIII Day Night Offense Defense Level Crew
1. Avg Total Score - Table VIII 1.002. Avg Total Score - Day .87"" 1.003. Avg Total Score - Night .75. .34" 1.004. Avg Total Score - Offense .78. .68*" .59 1.005. Avg Total Score - Defense .81" .74" .58" .39" 1.006. Crew Reticle Aim Level .10 .05 .12 .09 .04 1.007. Time in Crew .22" .21" .15 .20* .15 .46** 1.00
Note. N - 136 for all correlations except those that include the predictor variable time in crew, for whichW - 129.
"p- .05. - - .01.
Table VIII Performance Measures
Average total scores on the major portions of Table VIII were all highlyintercorrelated with each other and with Table VIII as a whole. Although thelowest of these correlations were between scores on day and night tasks(r = .34) and scores on offensive and defensive tasks (L = .39), thesecorrelations were statistically significant.
Predictor Variables
The correlation between crew reticle aim level and time in crew(r = .39) was significant and is comparable to the correlation between thosesame variables that was obtained in Phase I r .38).
44

Relationship Between Performance Measures and Predictor Variables
Crew reticle aim level was not significantly correlated with averagetotal score on Table VIII or any of its major portions. This is in sharpcontrast to the Phase I findings in which crew reticle aim level wassignificantly related to average total score on Table VIII as a whole (L =.35), da tasks (L = .25), night tasks (r = .29), and offensive tasks( = .38).
Time in crew was significantly correlated with average total score onTable VIII (r = .22), day tasks (n = .21), and offensive tasks (L = .20).Once again, these relationships are markedly different from those found duringPhase I, where time in crew was not significantly correlated with any of theperformance measures.
Cross-Validation of Phase I Findings
The regression equation based on the composite of crew reticle aim leveland time in crew that was derived in Phase I was used to predict total scoreon Table VIII for each of the Phase II crews. The correlation betweenpredicted score and actual score was not significant (L = -.06) and did notapproach the correlation obtained during the Phase I analyses (L = .46).Figure 21 depicts actual total score plotted against predicted total scorebased on the Phase I prediction equation. The number of correct and incorrectpredictions with regards to crews meeting the minimum qualification score of700 are shown in Table 21. Only 29% of the predictions were accurate. Of theinaccurate predictions, 70% were false negatives (crews predicted to fail thatactually passed), and 1% were false positives (crews predicted to pass thatactually failed). These results suggest that the model derived during Phase Iappears to be applicable only to the sample on which it was based.
Table 21
Frequency of Correct and Incorrect Predictions of Table VIII First-RunOutcomes for Cross-Validation Sample
Predicted to fail Predicted to pass Total
Actual failed 33 2 35
Actual passed 89 5 94
Total 122 7 129
45
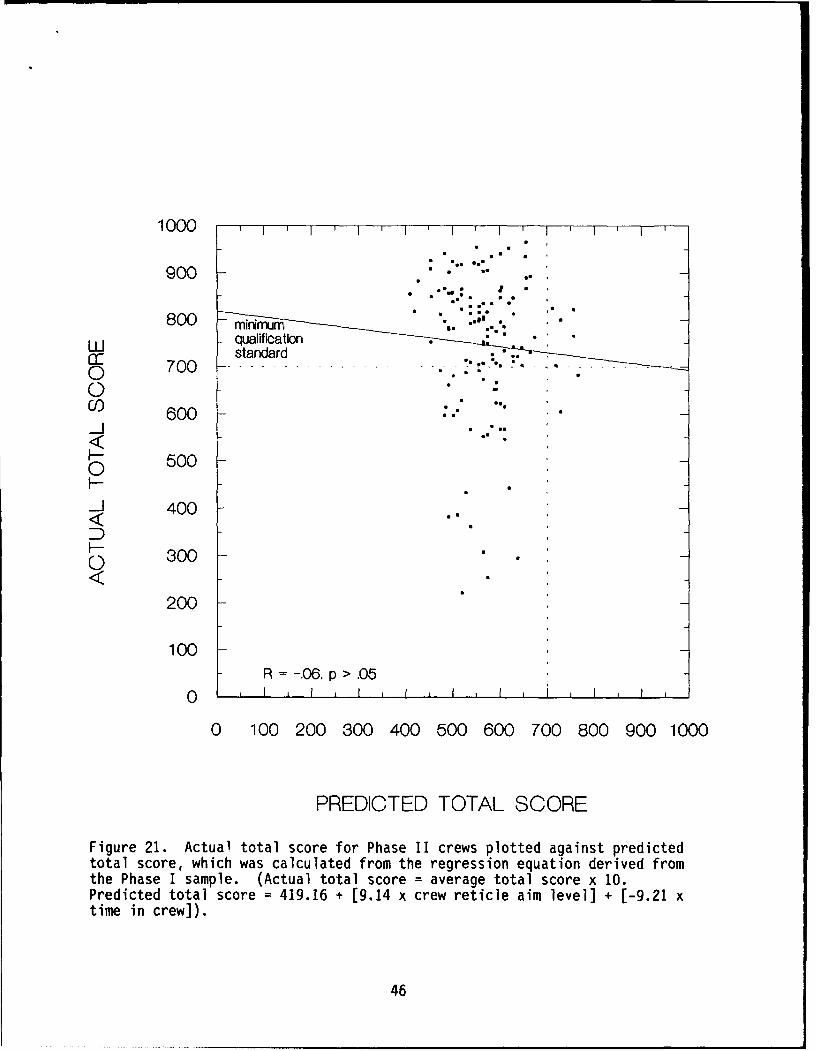
1000 I I
• .. .900
800 ""qualification,
standard7 0 0 .. ... . ... . .. .. . . ... .." ". .. .
r0 70 --------- ,
Wo 600
H 5000
400
H-O 3000
200
100R - -.06. p > .05
0 I I I
0 100 200 300 400 500 600 700 800 900 1000
PREDICTED TOTAL SCORE
Figure 21. Actual total score for Phase II crews plotted against predictedtotal score, which was calculated from the regression equation derived fromthe Phase I sample. (Actual total score = average total score x 10.Predicted total score = 419.16 + [9.14 x crew reticle aim level] + [-9.21 xtime in crew]).
46

Replication of Phase I Findings
Regression Analyses
The same procedures used to derive the prediction equation in Phase Iwere followed in an attempt to develop a model for predicting Table VIIIperformance of the crews in Phase II. Time in crew was the only predictormeasure to be significantly correlated with total scores on Table VIII.Figure 22 shows a scatter plot of those two variables. The regression line inFigure 22 indicates that time in crew by itself cannot be used to predictwhether or not crews will qualify on Table VIII on their first run because theregression line does not intercept the dotted minimum line used to representthe minimum score needed to qualify. As shown in Figure 23, when time in crewis used to predict Table VIII total score, all of the crews are predicted toqualify. Although this results in a prediction accuracy rate of 73% (94 outof 129 crews actually qualified), there is no practical reason for using timein crew as a predictor since all crews would be allowed to fire Table VIII,which is currently the practice.
Multiple Regression Analyses
Since time in crew alone could not be used to predict first-run TableVIII scores, the next step was to determine if adding crew reticle aim levelto the regression equation could improve the predictions. The results of themultiple regression analyses are shown in Table 22. Although the equationthat incorporates time in crew and crew reticle aim level is significant, theaddition of crew reticle aim level to the equation does not increase theproportion of variance accounted for in average total score.
Table 22
Results of Multiple Regression Analyses of Average Total Score by PredictorVariables
Variables Enteredin Equation Multiple R2 R2 Change F df level
Time in crew .049
Time in crew &Crew reticle aim level .049 .000
Overall Model .049 3.24 2,127 .043
47

1000I -I
900 :
800 -A :• mint m
LI_ qualificaionCr" standard
0CO)_j 600 --
0 500I-
400LU
~~300 ••I--
200
100I- r = .22. p < .05
0 1 1 1
0 5 10 15 20 25 30 35
TIME IN CREW (months)
Figure 22. Total score as a function of the number of months TC and gunnershad been paired together. (Total score = average total score x 10.)
48

1000 I I I
II "
900 - •a *I
800 mirimum*squalification
LU standardo 7 0 0 -- ---------------------------
0J600
- 5000
400Do 300
200
100
r = 22. p < .050 I I I I I I I
0 100 200 300 400 500 600 700 800 900 1000
PREDICTED TOTAL SCORE
Figure 23. Actual total score plotted against a predicted total score basedon time in crew. (Actual total score = average total score x 10. Predictedtotal score = 71.967 + [.581 x time in crew]).
49

Discussion
The results obtained during Phase II of the research failed to supportthe finding from Phase I that Table VIII performance can be predicted fromU-COFT performance level and time in crew. Crew reticle aim level and time increw accounted for 21% of the Table VIII total score variance in Phase I. Thesame two predictor variables accounted for only 5% of the variance inPhase II. Moreover, the entire 5% was accounted for by time in crew.
The discrepancies between the two sets of findings can be attributed todifferences in the predictor variables, differences in the performancemeasures, or differences in the relationship between the predictor variablesand the performance measures. The possible effects of each set of factors arediscussed below.
Predictor Variables
Crews participating in Phase I of the research attained a higher crewreticle aim level on U-COFT, on the average, than crews participating inPhase II. Level 26, the average level attained in Phase I, is in crew reticleaim group 4, which provides practice in firing at moving targets. Level 20,the average level achieved in Phase II, is in crew reticle aim group 3, whichprovides practice in firing at stationary targets. Reticle aim group 2 (thestarting point in the matrix for crews in sustainment training) also providespractice firing at stationary targets. As a consequence of the difference inthe reticle aim level attained during the two phases of the research, fewercrews received U-COFT training for moving targets during Phase II than duringPhase I. As a result, the relationship between U-COFT and Table VIIIperformance could have been attenuated during Phase II. This may account forthe discrepancy in the findings obtained during the two phases of theresearch.
Restriction of range in any of the predictor variables included in thepredictor model could also cause the multiple correlation between thepredictors and Ta!. 'ITT! 1ntal score tc he lowered. This does not appear tobe a factor in this research, however. Although the means for crew reticleaim level and time in crew are different for Phase I than for Phase II, thevariance and distributions for those variables are approximately equal.
Performance Measures
Crews participating in Phase II of the research obtained a higheraverage total score on their first run on Table VIII (742.0) than crewsparticipating in Phase I (612.9). The difference in mean total score betweenthe Phase I and Phase II crews could have been due to unit differences inTable VIII performance, a phenomenon that had been reported by Hoffman (1989).Six different battalions participated in the present research--two battalionsin Phase I and four battalions in Phase II. The two battalions thatparticipated in Phase I and one of the four battalions that participated inPhase II were from the same CONUS division, and the remaining three battalionsthat participated in Phase II were from a different CONUS division. The threebattalions that were from the division that participated in both Phases scoredan average of 623.3 on their first run on Table VIII, whereas the three
50

battalions from the division that participated only in Phase II scored anaverage of 754.4 on their first run on Table VIII. This suggests that samplesin the two Phases were not equivalent in their performance on Table VIII. Thedifference in Table VIII performance could have been due to differencesbetween the divisions in the capability of the crews, the experience of thecrews, emphasis given to training for Table VIII, or to other factors.Because of the differences between the two divisions, a different set offactors may have affected the Table VIII performance during each phase of theresearch. This possibility is discussed in more detail in the next section ofthe report.
Although there were differences between the mean total scores forPhases I and II, the variance and distribution of the scores for each phasewere similar. This indicates that restriction of range in the criterionvariable was not a problem in this research.
Another possible explanation for the failure of the predictor modelderived in Phase I to cross-validate or replicate in Phase II is that TableVIII may be an unreliable criterion, since one prerequisite for obtaining ahigh correlation between predictor and criterion variables is a reliablecriterion measure. To test the feasibility of this explanation, an estimateof the internal consistency of Table VIII average total score was calculatedindependently for each phase, using the ten Table VIII tasks as items. ForPhase I and Phase II, respectively, the as were .58 and .49. Thus,unreliability of the criterion measure does not appear to be a significantproblem in this research. That the reliability of each of the Table VIIIsapproaches or exceeds .50 is surprising in itself, since Table VIII isdesigned to cover a rather broad and heterogeneous set of crew gunnery skills.
Relationship Between Predictor and Performance Measures
A somewhat ironic finding of the research was that crews achieved higherscores on their first run on Table VIII during Phase II even though thesecrews attained lower reticle aim levels in the crew matrix. This finding isevidence that the two battalions used U-COFT differently during their trainingleading up to Table VIII. The two battalions that participated in Phase I hadmileage restrictions for training that were imposed by the division. That is,a limit was placed on the number of miles that each tank could be drivenduring the gunnery cycle. As a result of this limit, crews could participatein only one Tank Table IV exercise (the Tank Crew Proficiency Course or TCPC)during their gunnery training cycle. This gunnery event allows crews to dry-fire from stationary and moving tanks or to use Telfare, a subcaliber devicethat substitutes for the main gun. Moreover, the distance that the crewstraveled during the TCPC was restricted to 5 miles. The relatively poorperformance on Table VIII during Phase I is evidence that the mileage and TCPClimitations interfered with normal gunnery training.
Given that the two battalions participating in Phase I were restrictedin the amount of gunnery training received on actual tanks, their training onU-COFT probably accounted for a larger proportion of their total gunnerytraining. If so, then the relatively high relationship between level ofperformance on U-COFT and first-run Table VIII performance would be expected.On the other hand, given that the four battalions that participated in
51

Phase II had none of the training restrictions that were present duringPhase I, their U-COFT training probably accounted for a smaller proportion oftheir total gunnery training. To the extent that TCPC exercises contributedto overall gunnery skills, then the lack of a relationship between level ofperformance on U-COFT and first-run Table VIII performance during Phase IIwould not be surprising.
Summary and Conclusions
During Phase I of this research, a relationship was found between U-COFTperformance and first-run performance on Table VIII, with crew turbulence as asuppressor variable. This relationship was not obtained during Phase II,however. This discrepancy between the two sets of results could have been dueto differences in gunnery training during Phases I and II. The battalionsparticipating in Phase I were restricted to one TCPC, but those participatingin Phase II had no TCPC restrictions. Thus, U-COFT may have played a largerrole in training during Phase I than during Phase II.
The fact that the anticipated relationship between the predictor andperformance variables was obtained during Phase I, but not during Phase II,suggests that it may be possible to overcome the effects of future reductionsin ammunition allocations. Mileage restrictions interfered with normalgunnery training during Phase I. The existence of these restrictions mayinadvertently have caused Phase I to be a more accurate reflection of futuretraining conditions than Phase II. If so, then more credence can be given tothe Phase I results than to the Phase II results.
52

This page intentionally left blank.
53

References
Department of the Army. (1987). Standards in weapons training (DA PAM350-38). Washington, DC: Author.
Department of the Army. (1988). Tank combat tables M1 (FM 17-12-1).Washington, DC: Author.
General Electric Company (1985). Instructor's utilization handbook for the M1Unit-Ccnduct of Fire Trainer (U-COFT) (Vol. 1). Orlando, FL: NavalTraining Equipment Center.
Hoffman, R. G. (1989). Description and prediction of Grafenwoehr M1 tanktable VIII performance (ARI Technical Report 837). Alexandria, VA: U.S.Army Research Institute for the Behavioral and Social Sciences.
Hoffman, R. G. & Witmer, B. G. (1989). Development of a Unit-Conduct of FireTrainer (U-COFT) test of M1 gunnery proficiency (ARI Technical Report 859).Alexandria, VA: U.S. Army Research Institute for the Behavioral and SocialSciences.
Hughes, C. R., Butler, W. G., Sterling, B. S., & Berglund, A. W. (1987). MIUnit Conduct-of-Fire Trainer (TRAC-WSMR-TEA-16-87). White Sands, NM:Department of the Army, U.S. Army TRADOC Analysis Command.
Kuma, D., & McConville, L. (1982). Independent evaluation report for M1/M60series Unit-Conduct of Fire Trainer (U-COFT) (TRADOC ACN 39373). Ft. Knox,KY: Directorate of Training Developments, U.S. Army Armor Center.
Martellaro, H. C., Thorne, H. W., Bryant, J. A., & Pierce, M. A. (1985). Tankgunnery/Conduct of Fire Trainer-Mi (TRASANA-TEA-23-85). White Sands, NM:Department of the Army, U.S. Army TRADOC Systems Analysis Activity.
Rapkoch, J. M., & Robinson, F. D. (1986). Concept evaluation program ofgunnery training devices (TRADOC TRMS NO. 6-CEP342). Fort Knox, KY: U.S.Army Engineer Board.
U.S. Army Armor Center (1985). M1 Unit Conduct-of-Fire Trainer (U-COFT)training device support package (FC 17-12-7-1). Fort Knox, KY: Author.
54

Appendix A
U-COFT Matrices
00
U.~
W2
'0
con s I-
.4 4- V
.4 6w- 6w
4 C 0 Cf , 4 -
4 1 1 1 Ca
IN3U39VNIJ1- S.
.4 .jIJ3ISAS
w o
A-iC

IC S S fl 'f f
U 00W
V I-.
13A31 'V -I9VV1
cm 0' 0-
LU InU3VN
Cke
u to U-01 0-9
ac cc C0 at -C -
CL Z -)CK -C = ;:
Co.J
Iciw LLO -
W--w--WU-
0 A-2
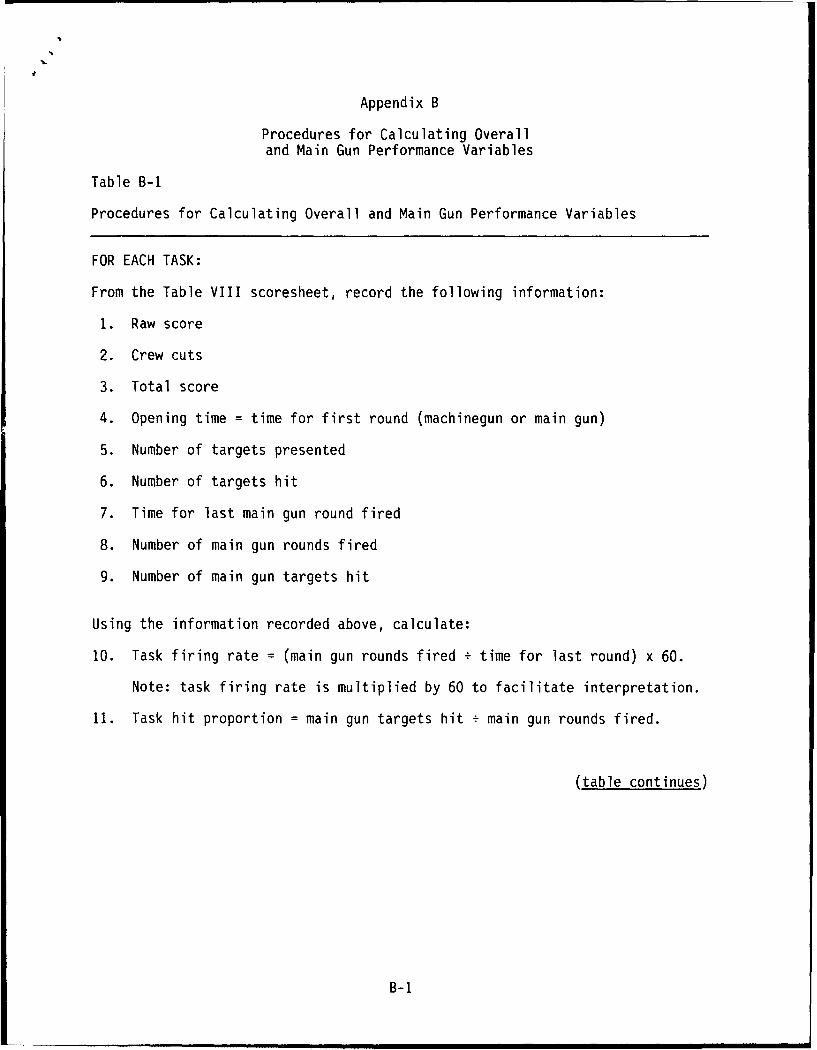
Appendix B
Procedures for Calculating Overalland Main Gun Performance Variables
Table B-i
Procedures for Calculating Overall and Main Gun Performance Variables
FOR EACH TASK:
From the Table VIII scoresheet, record the following information:
1. Raw score
2. Crew cuts
3. Total score
4. Opening time = time for first round (machinegun or main gun)
5. Number of targets presented
6. Number of targets hit
7. Time for last main gun round fired
8. Number of main gun rounds fired
9. Number of main gun targets hit
Using the information recorded above, calculate:
10. Task firing rate = (main gun rounds fired time for last round) x 60.
Note: task firing rate is multiplied by 60 to facilitate interpretation.
11. Task hit proportion = main gun targets hit + main gun rounds fired.
(table continues)
B-I

ACROSS TASKS:
Using the information recorded and calculations made for each task, calculatethe following performance measures:
12. Average raw score = sum of raw scores divided by the number ofengagements included in the analyses.
13. Average cuts = sum of crew cuts divided by the number of engagementsincluded in the analyses.
14. Average total score = sum of total scores divided by the number ofengagements included in the analyses.
15. Average opening time = sum of opening times divided by the number ofengagements included in the analyses.
16. Percent hits = total number of targets hit divided by the total numberof targets presented.
17. Firing rate = task firing rate weighted by the number of main guntargets in the task.
For each task multiply the task firing rate by the number of main guntargets presented. Sum the resulting value across tasks and divide bythe total number of main gun targets presented. That is,
Firing rate = V(task firing rate x main gun targets in task)
(main gun targets)
where I = sum across tasks.
18. Hit proportion = task hit proportion weighted by the number of main guntargets in the task.
For each task multiply the task hit proportion by the number of main guntargets presented. Sum the resulting value across tasks and divide bythe total number of main gun targets presented. That is,
Hit proportion = 1(task hit proportion x main gun targets in task)(main gun targets)
where I = sum across tasks.
19. Hit rate = firing rate x hit proportion.
B-2