Embed Size (px)
Citation preview
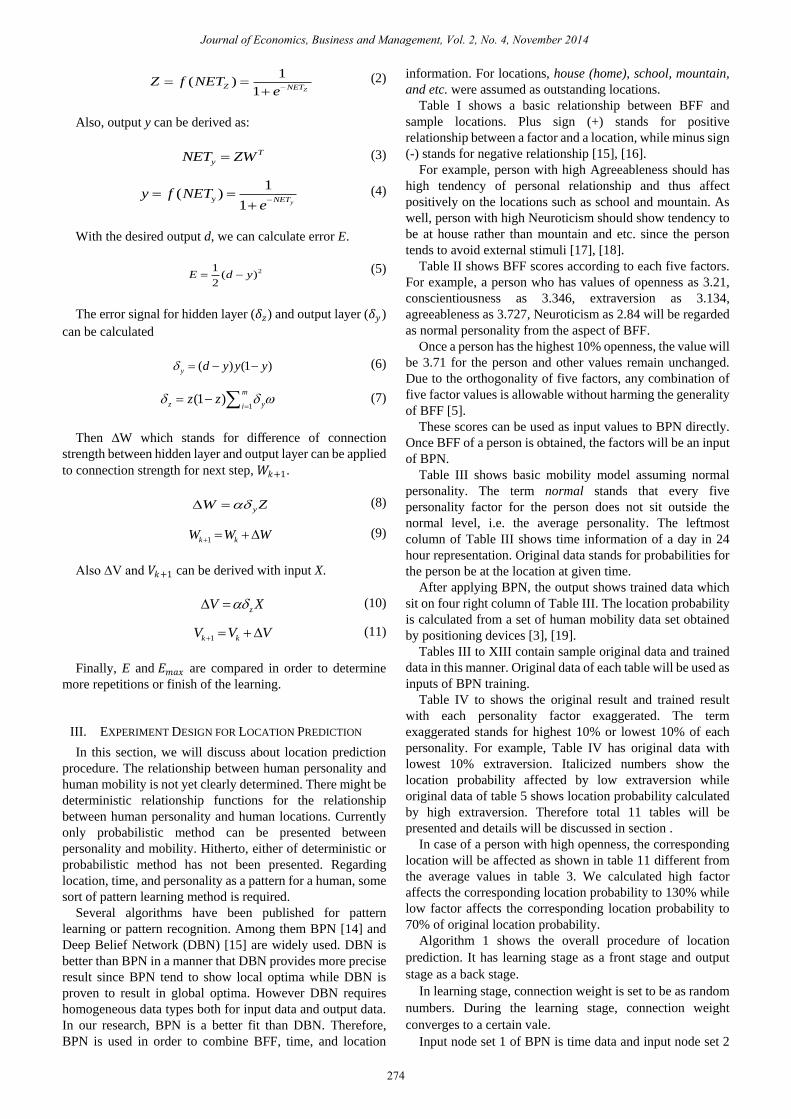
Abstract—It is generally believed that human mobility
pattern is affected by human personality. It implies human
personality can influence future human location or usual
frequent places. In such a manner, Big Five Personality Traits is
utilized in order to figure out the effect of human personality
toward human mobility model. The Back Propagation Network
is used as a tool for identifying the effect of human personality
to human mobility model. Human personality and preferred
locations were related in a range of common sense. An
algorithm is designed to simulate the effect of personality on
human locations and represent the effect numerically. Our
result will show the combinatorial effect of human personality
and human mobility.
Index Terms—Human mobility, probabilistic location
prediction, big five factors, back propagation network,
psychological factor, big five inventory, human mobility
modeling, big five personality traits.
I. INTRODUCTION
Human locations have been great interest of various
related fields and it is now possible for researchers to collect
human location information due to portable positioning
devices and smartphones, and by help of big-data technology
and data mining technology [1]. Once human locations can
be predictable, so many related application areas such as
advertisement, civil engineering, city or building planning
and military will utilize such information [2].
Among many parameters for human location prediction,
e.g. time, personality, personal income, age or so, we focused
on human personality. In our previous research, we
introduced a methodology in order to establish human
mobility models with time attribute [3]. In this research, we
are going to develop a process to predict human locations
with the affluence of human personality.
It is clear that human mobility pattern is affected by human
personality and thus researched already [4]. For example,
persons with extraversion may prefer outdoor activity to
persons with introversion [2].
Manuscript received July 12, 2013; revised September 14, 2013.
Seung Yeon Kim is with the Hongik University (E-mail:
II. BACKGROUNDS
A. Big Five Personality Traits
In a domain of psychology, the Big Five factors (BFF) of
personality are five broad domains that are used to describe
human personality. The Big Five framework of personality
traits emerged as a robust model for understanding the
relationship between personality and various behaviors [7].
The Big Five factors are:
Openness to experience (inventive vs. cautious)
Conscientiousness (efficient vs. Careless)
Extraversion (outgoing vs. solitary/reserved
Agreeableness (friendly vs. unkind)
Neuroticism (sensitive vs. secure/confident)
Personality traits were measured using the Big Five
Inventory (BFI) that is a most frequently used self-report
inventory [8], [9], [10] and the scores of five factors from BFI
is treated as major inputs of algorithm developed in this
paper.
B. Back Propagation Network
Back Propagation Network (BPN) is a kind of neural
network developed by Parker in 1982 [11]. It has output layer,
hidden layer, and input layer. Each layer can be composed of
arbitrary number of nodes.
The nodes between each layer are connected and each
connection edge has its own weight, so called connection
strength. The error of output layer used to calibrate the
connection strength between hidden layer and output layer,
and the error of output layer is back propagated to hidden
layer, then the connection weight between input layer and
hidden layer will be calibrated.
In sum, repetitions of three steps required: input a leaning
pattern and earning output, earning error between output and
desired values, back propagate error to calibrate connection
strength [12], [13]. This procedure will be finished once a
desired error level is achieved.
The detailed process requires several parameters.
First, we must have V and W as connection strength, and
initialize them.
Second, we must have p patterns.
Third, limitation of error, 𝐸𝑚𝑎𝑥 , must be determined. Then
the output of hidden layer, Z can be derived as follows:
z
TNET XV (1)
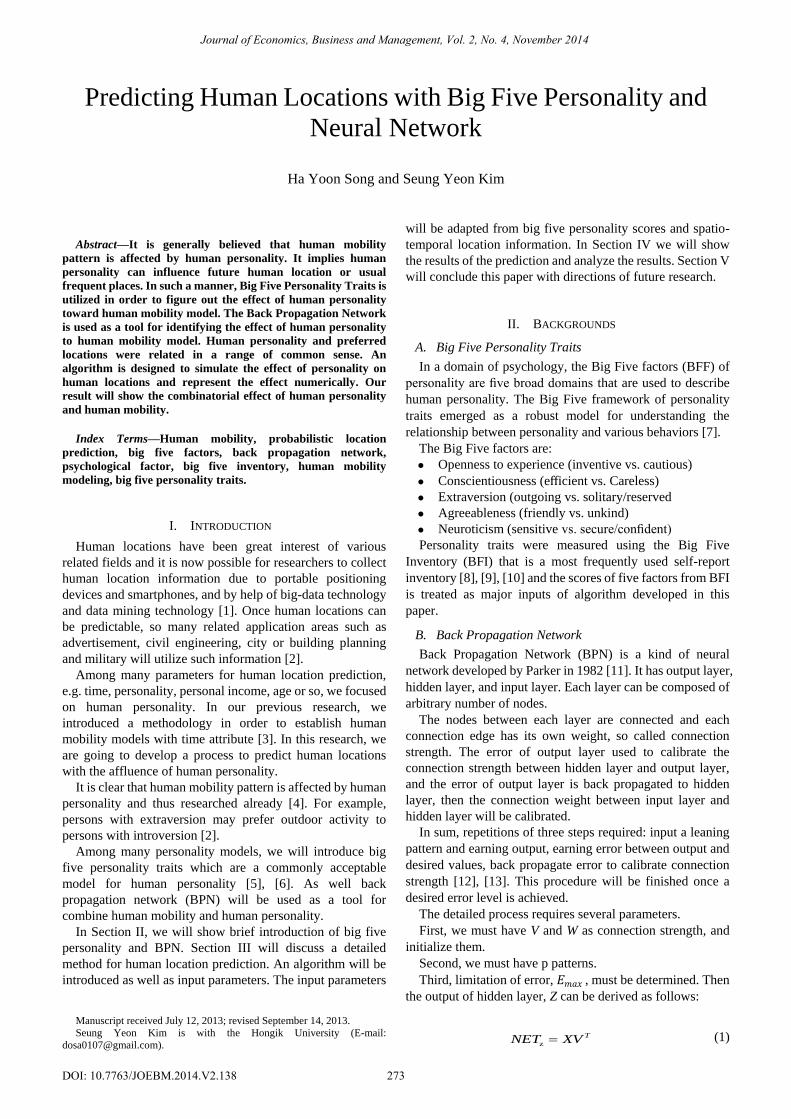
Predicting Human Locations with Big Five Personality and
Neural Network
Ha Yoon Song and Seung Yeon Kim
Journal of Economics, Business and Management, Vol. 2, No. 4, November 2014
273
Among many personality models, we will introduce big
five personality traits which are a commonly acceptable
model for human personality [5], [6]. As well back
propagation network (BPN) will be used as a tool for
combine human mobility and human personality.
In Section II, we will show brief introduction of big five
personality and BPN. Section III will discuss a detailed
method for human location prediction. An algorithm will be
introduced as well as input parameters. The input parameters
will be adapted from big five personality scores and spatio-
temporal location information. In Section IV we will show
the results of the prediction and analyze the results. Section V
will conclude this paper with directions of future research.
DOI: 10.7763/JOEBM.2014.V2.138
1( )
1 ZZ NET
Z f NETe
(2)
Also, output y can be derived as:
T
yNET ZW (3)
y
1( )
1 yNETy f NET
e
(4)
With the desired output d, we can calculate error E.
21( )
2E d y
(5)
The error signal for hidden layer (𝛿𝑧) and output layer (𝛿𝑦 )
can be calculated
( ) (1 )y d y y y (6)
1(1 )
m
z yiz z
(7)
Then ∆W which stands for difference of connection
strength between hidden layer and output layer can be applied
to connection strength for next step, 𝑊𝑘+1.
yW Z (8)
1k kW W W (9)
Also ∆V and 𝑉𝑘+1 can be derived with input X.
zV X (10)
1k kV V V (11)
Finally, E and 𝐸𝑚𝑎𝑥 are compared in order to determine
more repetitions or finish of the learning.
III. EXPERIMENT DESIGN FOR LOCATION PREDICTION
In this section, we will discuss about location prediction
procedure. The relationship between human personality and
human mobility is not yet clearly determined. There might be
deterministic relationship functions for the relationship
between human personality and human locations. Currently
only probabilistic method can be presented between
personality and mobility. Hitherto, either of deterministic or
probabilistic method has not been presented. Regarding
location, time, and personality as a pattern for a human, some
sort of pattern learning method is required.
Several algorithms have been published for pattern
learning or pattern recognition. Among them BPN [14] and
Deep Belief Network (DBN) [15] are widely used. DBN is
better than BPN in a manner that DBN provides more precise
result since BPN tend to show local optima while DBN is
proven to result in global optima. However DBN requires
homogeneous data types both for input data and output data.
In our research, BPN is a better fit than DBN. Therefore,
BPN is used in order to combine BFF, time, and location
information. For locations, house (home), school, mountain,
and etc. were assumed as outstanding locations.
Table I shows a basic relationship between BFF and
sample locations. Plus sign (+) stands for positive
relationship between a factor and a location, while minus sign
(-) stands for negative relationship [15], [16].
For example, person with high Agreeableness should has
high tendency of personal relationship and thus affect
positively on the locations such as school and mountain. As
well, person with high Neuroticism should show tendency to
be at house rather than mountain and etc. since the person
tends to avoid external stimuli [17], [18].
Table II shows BFF scores according to each five factors.
For example, a person who has values of openness as 3.21,
conscientiousness as 3.346, extraversion as 3.134,
agreeableness as 3.727, Neuroticism as 2.84 will be regarded
as normal personality from the aspect of BFF.
Once a person has the highest 10% openness, the value will
be 3.71 for the person and other values remain unchanged.
Due to the orthogonality of five factors, any combination of
five factor values is allowable without harming the generality
of BFF [5].
These scores can be used as input values to BPN directly.
Once BFF of a person is obtained, the factors will be an input
of BPN.
Table III shows basic mobility model assuming normal
personality. The term normal stands that every five
personality factor for the person does not sit outside the
normal level, i.e. the average personality. The leftmost
column of Table III shows time information of a day in 24
hour representation. Original data stands for probabilities for
the person be at the location at given time.
After applying BPN, the output shows trained data which
sit on four right column of Table III. The location probability
is calculated from a set of human mobility data set obtained
by positioning devices [3], [19].
Tables III to XIII contain sample original data and trained
data in this manner. Original data of each table will be used as
inputs of BPN training.
Table IV to shows the original result and trained result
with each personality factor exaggerated. The term
exaggerated stands for highest 10% or lowest 10% of each
personality. For example, Table IV has original data with
lowest 10% extraversion. Italicized numbers show the
location probability affected by low extraversion while
original data of table 5 shows location probability calculated
by high extraversion. Therefore total 11 tables will be
presented and details will be discussed in section .
In case of a person with high openness, the corresponding
location will be affected as shown in table 11 different from
the average values in table 3. We calculated high factor
affects the corresponding location probability to 130% while
low factor affects the corresponding location probability to
70% of original location probability.
Algorithm 1 shows the overall procedure of location
prediction. It has learning stage as a front stage and output
stage as a back stage.
In learning stage, connection weight is set to be as random
numbers. During the learning stage, connection weight
converges to a certain vale.
Input node set 1 of BPN is time data and input node set 2
Journal of Economics, Business and Management, Vol. 2, No. 4, November 2014
274
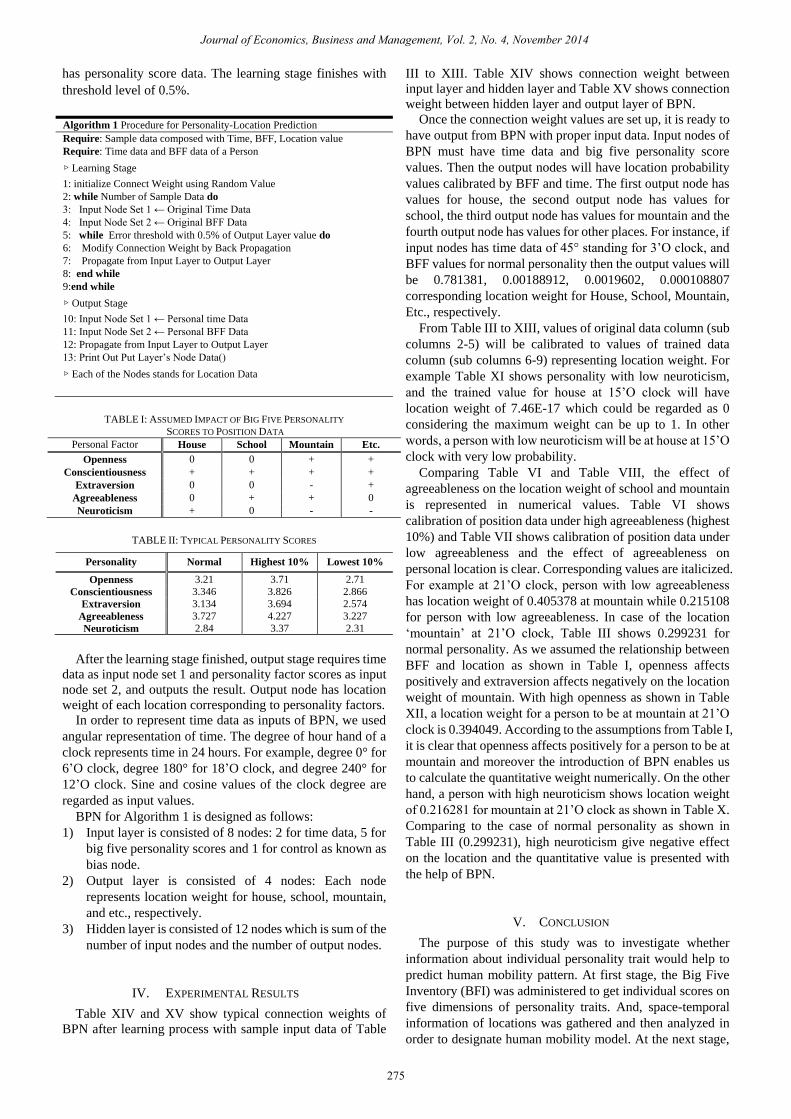
has personality score data. The learning stage finishes with
threshold level of 0.5%.
Algorithm 1 Procedure for Personality-Location Prediction
Require: Sample data composed with Time, BFF, Location value
Require: Time data and BFF data of a Person
▷ Learning Stage
1: initialize Connect Weight using Random Value
2: while Number of Sample Data do
3: Input Node Set 1 ← Original Time Data
4: Input Node Set 2 ← Original BFF Data
5: while Error threshold with 0.5% of Output Layer value do
6: Modify Connection Weight by Back Propagation
7: Propagate from Input Layer to Output Layer
8: end while
9:end while
▷ Output Stage
10: Input Node Set 1 ← Personal time Data
11: Input Node Set 2 ← Personal BFF Data
12: Propagate from Input Layer to Output Layer
13: Print Out Put Layer‟s Node Data()
▷ Each of the Nodes stands for Location Data
TABLE I: ASSUMED IMPACT OF BIG FIVE PERSONALITY
SCORES TO POSITION DATA
Personal Factor House School Mountain Etc.
Openness 0 0 + +
Conscientiousness + + + +
Extraversion 0 0 - +
Agreeableness 0 + + 0
Neuroticism + 0 - -
TABLE II: TYPICAL PERSONALITY SCORES
Personality Normal Highest 10% Lowest 10%
Openness 3.21 3.71 2.71
Conscientiousness 3.346 3.826 2.866
Extraversion 3.134 3.694 2.574
Agreeableness 3.727 4.227 3.227
Neuroticism 2.84 3.37 2.31
After the learning stage finished, output stage requires time
data as input node set 1 and personality factor scores as input
node set 2, and outputs the result. Output node has location
weight of each location corresponding to personality factors.
In order to represent time data as inputs of BPN, we used
angular representation of time. The degree of hour hand of a
clock represents time in 24 hours. For example, degree 0° for
6‟O clock, degree 180° for 18‟O clock, and degree 240° for
12‟O clock. Sine and cosine values of the clock degree are
regarded as input values.
BPN for Algorithm 1 is designed as follows:
1) Input layer is consisted of 8 nodes: 2 for time data, 5 for
big five personality scores and 1 for control as known as
bias node.
2) Output layer is consisted of 4 nodes: Each node
represents location weight for house, school, mountain,
and etc., respectively.
3) Hidden layer is consisted of 12 nodes which is sum of the
number of input nodes and the number of output nodes.
IV. EXPERIMENTAL RESULTS
Table XIV and XV show typical connection weights of
BPN after learning process with sample input data of Table
Journal of Economics, Business and Management, Vol. 2, No. 4, November 2014
275
III to XIII. Table XIV shows connection weight between
input layer and hidden layer and Table XV shows connection
weight between hidden layer and output layer of BPN.
Once the connection weight values are set up, it is ready to
have output from BPN with proper input data. Input nodes of
BPN must have time data and big five personality score
values. Then the output nodes will have location probability
values calibrated by BFF and time. The first output node has
values for house, the second output node has values for
school, the third output node has values for mountain and the
fourth output node has values for other places. For instance, if
input nodes has time data of 45° standing for 3‟O clock, and
BFF values for normal personality then the output values will
be 0.781381, 0.00188912, 0.0019602, 0.000108807
corresponding location weight for House, School, Mountain,
Etc., respectively.
From Table III to XIII, values of original data column (sub
columns 2-5) will be calibrated to values of trained data
column (sub columns 6-9) representing location weight. For
example Table XI shows personality with low neuroticism,
and the trained value for house at 15‟O clock will have
location weight of 7.46E-17 which could be regarded as 0
considering the maximum weight can be up to 1. In other
words, a person with low neuroticism will be at house at 15‟O
clock with very low probability.
Comparing Table VI and Table VIII, the effect of
agreeableness on the location weight of school and mountain
is represented in numerical values. Table VI shows
calibration of position data under high agreeableness (highest
10%) and Table VII shows calibration of position data under
low agreeableness and the effect of agreeableness on
personal location is clear. Corresponding values are italicized.
For example at 21‟O clock, person with low agreeableness
has location weight of 0.405378 at mountain while 0.215108
for person with low agreeableness. In case of the location
„mountain‟ at 21‟O clock, Table III shows 0.299231 for
normal personality. As we assumed the relationship between
BFF and location as shown in Table I, openness affects
positively and extraversion affects negatively on the location
weight of mountain. With high openness as shown in Table
XII, a location weight for a person to be at mountain at 21‟O
clock is 0.394049. According to the assumptions from Table I,
it is clear that openness affects positively for a person to be at
mountain and moreover the introduction of BPN enables us
to calculate the quantitative weight numerically. On the other
hand, a person with high neuroticism shows location weight
of 0.216281 for mountain at 21‟O clock as shown in Table X.
Comparing to the case of normal personality as shown in
Table III (0.299231), high neuroticism give negative effect
on the location and the quantitative value is presented with
the help of BPN.
V. CONCLUSION
The purpose of this study was to investigate whether
information about individual personality trait would help to
predict human mobility pattern. At first stage, the Big Five
Inventory (BFI) was administered to get individual scores on
five dimensions of personality traits. And, space-temporal
information of locations was gathered and then analyzed in
order to designate human mobility model. At the next stage,
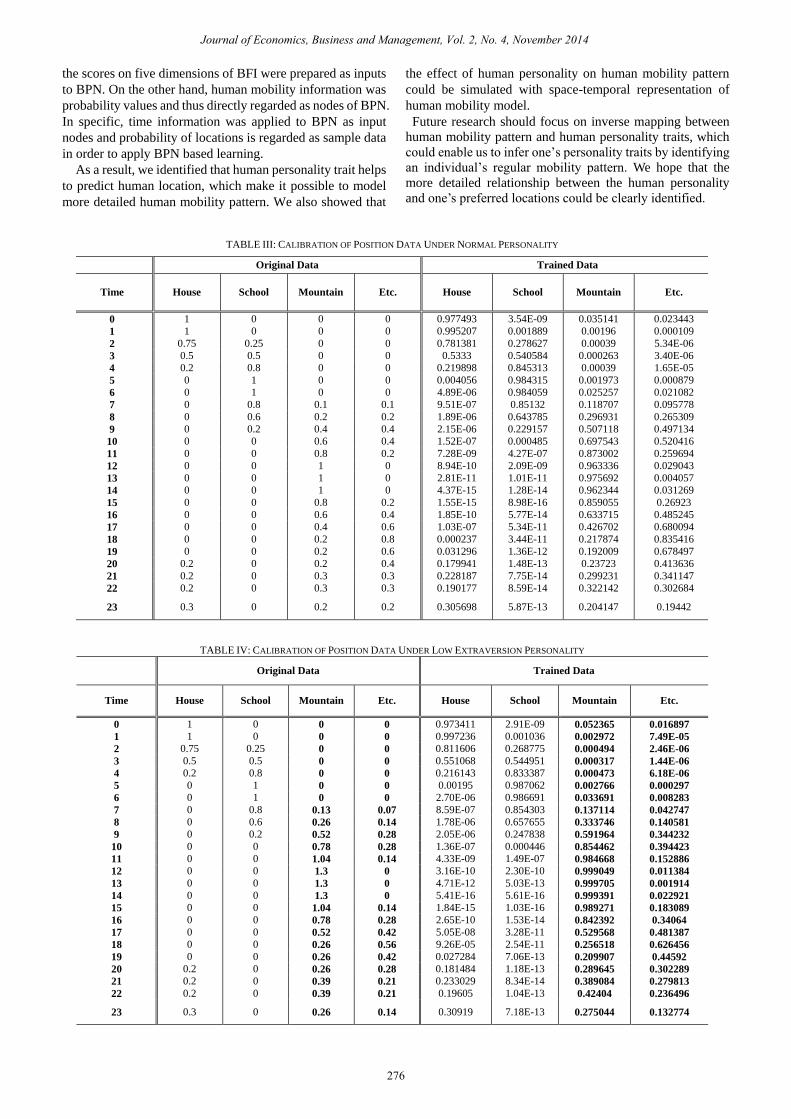
TABLE III: CALIBRATION OF POSITION DATA UNDER NORMAL PERSONALITY
Original Data Trained Data
Time House School Mountain Etc. House School Mountain Etc.
0 1 0 0 0 0.977493 3.54E-09 0.035141 0.023443
1 1 0 0 0 0.995207 0.001889 0.00196 0.000109
2 0.75 0.25 0 0 0.781381 0.278627 0.00039 5.34E-06
3 0.5 0.5 0 0 0.5333 0.540584 0.000263 3.40E-06
4 0.2 0.8 0 0 0.219898 0.845313 0.00039 1.65E-05
5 0 1 0 0 0.004056 0.984315 0.001973 0.000879
6 0 1 0 0 4.89E-06 0.984059 0.025257 0.021082
7 0 0.8 0.1 0.1 9.51E-07 0.85132 0.118707 0.095778
8 0 0.6 0.2 0.2 1.89E-06 0.643785 0.296931 0.265309
9 0 0.2 0.4 0.4 2.15E-06 0.229157 0.507118 0.497134
10 0 0 0.6 0.4 1.52E-07 0.000485 0.697543 0.520416
11 0 0 0.8 0.2 7.28E-09 4.27E-07 0.873002 0.259694
12 0 0 1 0 8.94E-10 2.09E-09 0.963336 0.029043
13 0 0 1 0 2.81E-11 1.01E-11 0.975692 0.004057
14 0 0 1 0 4.37E-15 1.28E-14 0.962344 0.031269
15 0 0 0.8 0.2 1.55E-15 8.98E-16 0.859055 0.26923
16 0 0 0.6 0.4 1.85E-10 5.77E-14 0.633715 0.485245
17 0 0 0.4 0.6 1.03E-07 5.34E-11 0.426702 0.680094
18 0 0 0.2 0.8 0.000237 3.44E-11 0.217874 0.835416
19 0 0 0.2 0.6 0.031296 1.36E-12 0.192009 0.678497
20 0.2 0 0.2 0.4 0.179941 1.48E-13 0.23723 0.413636
21 0.2 0 0.3 0.3 0.228187 7.75E-14 0.299231 0.341147
22 0.2 0 0.3 0.3 0.190177 8.59E-14 0.322142 0.302684
23 0.3 0 0.2 0.2 0.305698 5.87E-13 0.204147 0.19442
TABLE IV: CALIBRATION OF POSITION DATA UNDER LOW EXTRAVERSION PERSONALITY
Original Data Trained Data
Time House School Mountain Etc. House School Mountain Etc.
0 1 0 0 0 0.973411 2.91E-09 0.052365 0.016897
1 1 0 0 0 0.997236 0.001036 0.002972 7.49E-05
2 0.75 0.25 0 0 0.811606 0.268775 0.000494 2.46E-06
3 0.5 0.5 0 0 0.551068 0.544951 0.000317 1.44E-06
4 0.2 0.8 0 0 0.216143 0.833387 0.000473 6.18E-06
5 0 1 0 0 0.00195 0.987062 0.002766 0.000297
6 0 1 0 0 2.70E-06 0.986691 0.033691 0.008283
7 0 0.8 0.13 0.07 8.59E-07 0.854303 0.137114 0.042747
8 0 0.6 0.26 0.14 1.78E-06 0.657655 0.333746 0.140581
9 0 0.2 0.52 0.28 2.05E-06 0.247838 0.591964 0.344232
10 0 0 0.78 0.28 1.36E-07 0.000446 0.854462 0.394423
11 0 0 1.04 0.14 4.33E-09 1.49E-07 0.984668 0.152886
12 0 0 1.3 0 3.16E-10 2.30E-10 0.999049 0.011384
13 0 0 1.3 0 4.71E-12 5.03E-13 0.999705 0.001914
14 0 0 1.3 0 5.41E-16 5.61E-16 0.999391 0.022921
15 0 0 1.04 0.14 1.84E-15 1.03E-16 0.989271 0.183089
16 0 0 0.78 0.28 2.65E-10 1.53E-14 0.842392 0.34064
17 0 0 0.52 0.42 5.05E-08 3.28E-11 0.529568 0.481387
18 0 0 0.26 0.56 9.26E-05 2.54E-11 0.256518 0.626456
19 0 0 0.26 0.42 0.027284 7.06E-13 0.209907 0.44592
20 0.2 0 0.26 0.28 0.181484 1.18E-13 0.289645 0.302289
21 0.2 0 0.39 0.21 0.233029 8.34E-14 0.389084 0.279813
22 0.2 0 0.39 0.21 0.19605 1.04E-13 0.42404 0.236496
23 0.3 0 0.26 0.14 0.30919 7.18E-13 0.275044 0.132774
Journal of Economics, Business and Management, Vol. 2, No. 4, November 2014
276
the scores on five dimensions of BFI were prepared as inputs
to BPN. On the other hand, human mobility information was
probability values and thus directly regarded as nodes of BPN.
In specific, time information was applied to BPN as input
nodes and probability of locations is regarded as sample data
in order to apply BPN based learning.
As a result, we identified that human personality trait helps
to predict human location, which make it possible to model
more detailed human mobility pattern. We also showed that
the effect of human personality on human mobility pattern
could be simulated with space-temporal representation of
human mobility model.
Future research should focus on inverse mapping between
human mobility pattern and human personality traits, which
could enable us to infer one‟s personality traits by identifying
an individual‟s regular mobility pattern. We hope that the
more detailed relationship between the human personality
and one‟s preferred locations could be clearly identified.
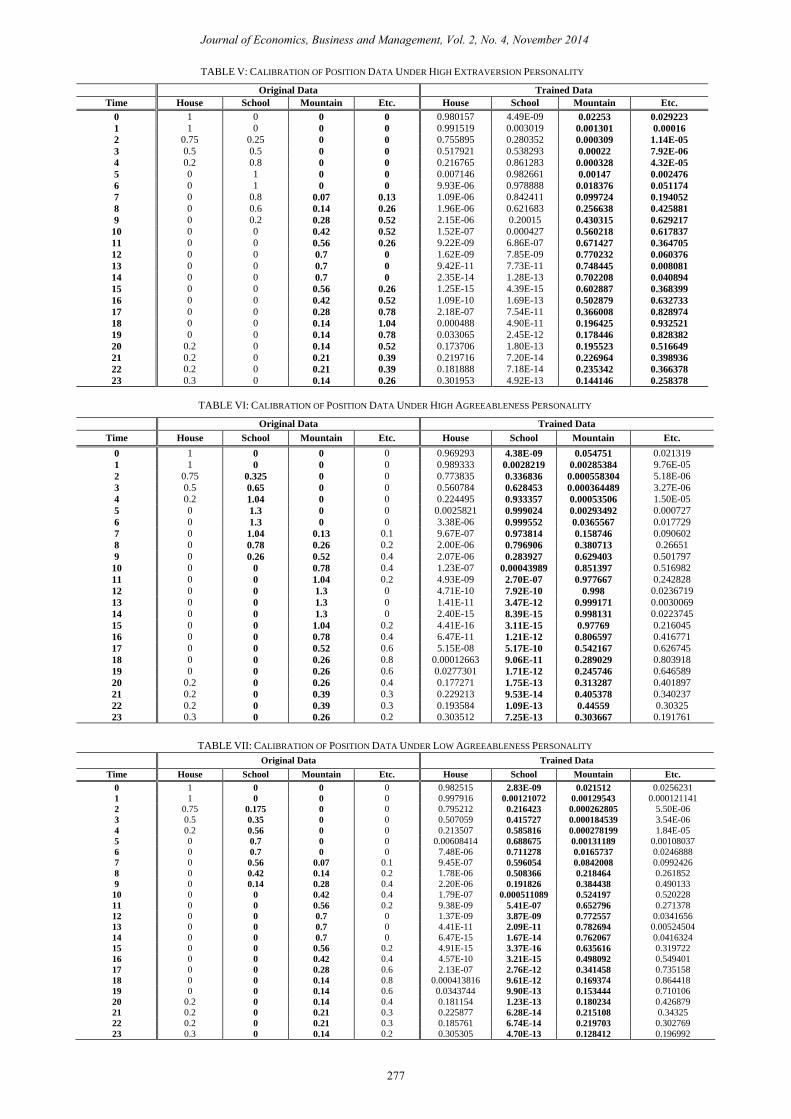
TABLE V: CALIBRATION OF POSITION DATA UNDER HIGH EXTRAVERSION PERSONALITY
Original Data Trained Data
Time House School Mountain Etc. House School Mountain Etc.
0 1 0 0 0 0.980157 4.49E-09 0.02253 0.029223
1 1 0 0 0 0.991519 0.003019 0.001301 0.00016
2 0.75 0.25 0 0 0.755895 0.280352 0.000309 1.14E-05
3 0.5 0.5 0 0 0.517921 0.538293 0.00022 7.92E-06
4 0.2 0.8 0 0 0.216765 0.861283 0.000328 4.32E-05
5 0 1 0 0 0.007146 0.982661 0.00147 0.002476
6 0 1 0 0 9.93E-06 0.978888 0.018376 0.051174
7 0 0.8 0.07 0.13 1.09E-06 0.842411 0.099724 0.194052
8 0 0.6 0.14 0.26 1.96E-06 0.621683 0.256638 0.425881
9 0 0.2 0.28 0.52 2.15E-06 0.20015 0.430315 0.629217
10 0 0 0.42 0.52 1.52E-07 0.000427 0.560218 0.617837
11 0 0 0.56 0.26 9.22E-09 6.86E-07 0.671427 0.364705
12 0 0 0.7 0 1.62E-09 7.85E-09 0.770232 0.060376
13 0 0 0.7 0 9.42E-11 7.73E-11 0.748445 0.008081
14 0 0 0.7 0 2.35E-14 1.28E-13 0.702208 0.040894
15 0 0 0.56 0.26 1.25E-15 4.39E-15 0.602887 0.368399
16 0 0 0.42 0.52 1.09E-10 1.69E-13 0.502879 0.632733
17 0 0 0.28 0.78 2.18E-07 7.54E-11 0.366008 0.828974
18 0 0 0.14 1.04 0.000488 4.90E-11 0.196425 0.932521
19 0 0 0.14 0.78 0.033065 2.45E-12 0.178446 0.828382
20 0.2 0 0.14 0.52 0.173706 1.80E-13 0.195523 0.516649
21 0.2 0 0.21 0.39 0.219716 7.20E-14 0.226964 0.398936
22 0.2 0 0.21 0.39 0.181888 7.18E-14 0.235342 0.366378
23 0.3 0 0.14 0.26 0.301953 4.92E-13 0.144146 0.258378
TABLE VI: CALIBRATION OF POSITION DATA UNDER HIGH AGREEABLENESS PERSONALITY
Original Data Trained Data
Time House School Mountain Etc. House School Mountain Etc.
0 1 0 0 0 0.969293 4.38E-09 0.054751 0.021319
1 1 0 0 0 0.989333 0.0028219 0.00285384 9.76E-05
2 0.75 0.325 0 0 0.773835 0.336836 0.000558304 5.18E-06
3 0.5 0.65 0 0 0.560784 0.628453 0.000364489 3.27E-06
4 0.2 1.04 0 0 0.224495 0.933357 0.00053506 1.50E-05
5 0 1.3 0 0 0.0025821 0.999024 0.00293492 0.000727
6 0 1.3 0 0 3.38E-06 0.999552 0.0365567 0.017729
7 0 1.04 0.13 0.1 9.67E-07 0.973814 0.158746 0.090602
8 0 0.78 0.26 0.2 2.00E-06 0.796906 0.380713 0.26651
9 0 0.26 0.52 0.4 2.07E-06 0.283927 0.629403 0.501797
10 0 0 0.78 0.4 1.23E-07 0.00043989 0.851397 0.516982
11 0 0 1.04 0.2 4.93E-09 2.70E-07 0.977667 0.242828
12 0 0 1.3 0 4.71E-10 7.92E-10 0.998 0.0236719
13 0 0 1.3 0 1.41E-11 3.47E-12 0.999171 0.0030069
14 0 0 1.3 0 2.40E-15 8.39E-15 0.998131 0.0223745
15 0 0 1.04 0.2 4.41E-16 3.11E-15 0.97769 0.216045
16 0 0 0.78 0.4 6.47E-11 1.21E-12 0.806597 0.416771
17 0 0 0.52 0.6 5.15E-08 5.17E-10 0.542167 0.626745
18 0 0 0.26 0.8 0.00012663 9.06E-11 0.289029 0.803918
19 0 0 0.26 0.6 0.0277301 1.71E-12 0.245746 0.646589
20 0.2 0 0.26 0.4 0.177271 1.75E-13 0.313287 0.401897
21 0.2 0 0.39 0.3 0.229213 9.53E-14 0.405378 0.340237
22 0.2 0 0.39 0.3 0.193584 1.09E-13 0.44559 0.30325
23 0.3 0 0.26 0.2 0.303512 7.25E-13 0.303667 0.191761
TABLE VII: CALIBRATION OF POSITION DATA UNDER LOW AGREEABLENESS PERSONALITY
Original Data Trained Data
Time House School Mountain Etc. House School Mountain Etc.
0 1 0 0 0 0.982515 2.83E-09 0.021512 0.0256231
1 1 0 0 0 0.997916 0.00121072 0.00129543 0.000121141
2 0.75 0.175 0 0 0.795212 0.216423 0.000262805 5.50E-06
3 0.5 0.35 0 0 0.507059 0.415727 0.000184539 3.54E-06
4 0.2 0.56 0 0 0.213507 0.585816 0.000278199 1.84E-05
5 0 0.7 0 0 0.00608414 0.688675 0.00131189 0.00108037
6 0 0.7 0 0 7.48E-06 0.711278 0.0165737 0.0246888
7 0 0.56 0.07 0.1 9.45E-07 0.596054 0.0842008 0.0992426
8 0 0.42 0.14 0.2 1.78E-06 0.508366 0.218464 0.261852
9 0 0.14 0.28 0.4 2.20E-06 0.191826 0.384438 0.490133
10 0 0 0.42 0.4 1.79E-07 0.000511089 0.524197 0.520228
11 0 0 0.56 0.2 9.38E-09 5.41E-07 0.652796 0.271378
12 0 0 0.7 0 1.37E-09 3.87E-09 0.772557 0.0341656
13 0 0 0.7 0 4.41E-11 2.09E-11 0.782694 0.00524504
14 0 0 0.7 0 6.47E-15 1.67E-14 0.762067 0.0416324
15 0 0 0.56 0.2 4.91E-15 3.37E-16 0.635616 0.319722
16 0 0 0.42 0.4 4.57E-10 3.21E-15 0.498092 0.549401
17 0 0 0.28 0.6 2.13E-07 2.76E-12 0.341458 0.735158
18 0 0 0.14 0.8 0.000413816 9.61E-12 0.169374 0.864418
19 0 0 0.14 0.6 0.0343744 9.90E-13 0.153444 0.710106
20 0.2 0 0.14 0.4 0.181154 1.23E-13 0.180234 0.426879
21 0.2 0 0.21 0.3 0.225877 6.28E-14 0.215108 0.34325
22 0.2 0 0.21 0.3 0.185761 6.74E-14 0.219703 0.302769
23 0.3 0 0.14 0.2 0.305305 4.70E-13 0.128412 0.196992
Journal of Economics, Business and Management, Vol. 2, No. 4, November 2014
277
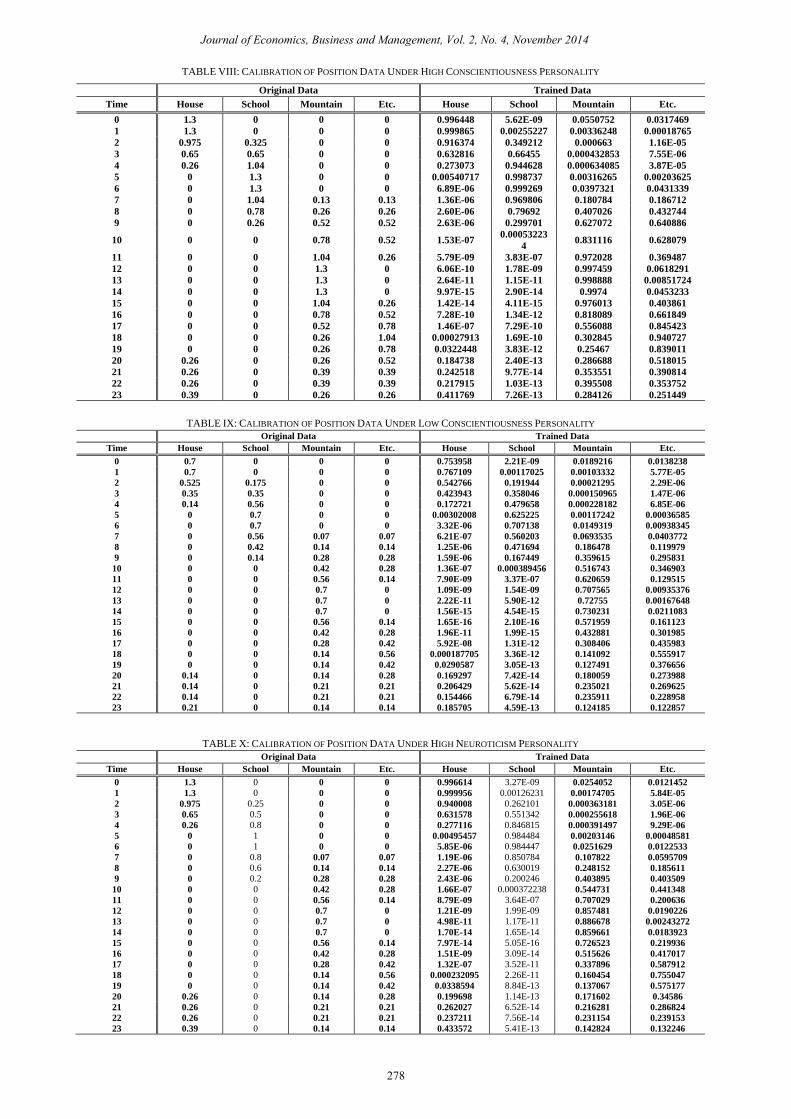
TABLE VIII: CALIBRATION OF POSITION DATA UNDER HIGH CONSCIENTIOUSNESS PERSONALITY
Original Data Trained Data
Time House School Mountain Etc. House School Mountain Etc.
0 1.3 0 0 0 0.996448 5.62E-09 0.0550752 0.0317469
1 1.3 0 0 0 0.999865 0.00255227 0.00336248 0.00018765
2 0.975 0.325 0 0 0.916374 0.349212 0.000663 1.16E-05
3 0.65 0.65 0 0 0.632816 0.66455 0.000432853 7.55E-06
4 0.26 1.04 0 0 0.273073 0.944628 0.000634085 3.87E-05
5 0 1.3 0 0 0.00540717 0.998737 0.00316265 0.00203625
6 0 1.3 0 0 6.89E-06 0.999269 0.0397321 0.0431339
7 0 1.04 0.13 0.13 1.36E-06 0.969806 0.180784 0.186712
8 0 0.78 0.26 0.26 2.60E-06 0.79692 0.407026 0.432744
9 0 0.26 0.52 0.52 2.63E-06 0.299701 0.627072 0.640886
10 0 0 0.78 0.52 1.53E-07 0.00053223
4 0.831116 0.628079
11 0 0 1.04 0.26 5.79E-09 3.83E-07 0.972028 0.369487
12 0 0 1.3 0 6.06E-10 1.78E-09 0.997459 0.0618291
13 0 0 1.3 0 2.64E-11 1.15E-11 0.998888 0.00851724
14 0 0 1.3 0 9.97E-15 2.90E-14 0.9974 0.0453233
15 0 0 1.04 0.26 1.42E-14 4.11E-15 0.976013 0.403861
16 0 0 0.78 0.52 7.28E-10 1.34E-12 0.818089 0.661849
17 0 0 0.52 0.78 1.46E-07 7.29E-10 0.556088 0.845423
18 0 0 0.26 1.04 0.00027913 1.69E-10 0.302845 0.940727
19 0 0 0.26 0.78 0.0322448 3.83E-12 0.25467 0.839011
20 0.26 0 0.26 0.52 0.184738 2.40E-13 0.286688 0.518015
21 0.26 0 0.39 0.39 0.242518 9.77E-14 0.353551 0.390814
22 0.26 0 0.39 0.39 0.217915 1.03E-13 0.395508 0.353752
23 0.39 0 0.26 0.26 0.411769 7.26E-13 0.284126 0.251449
TABLE IX: CALIBRATION OF POSITION DATA UNDER LOW CONSCIENTIOUSNESS PERSONALITY
Original Data Trained Data
Time House School Mountain Etc. House School Mountain Etc.
0 0.7 0 0 0 0.753958 2.21E-09 0.0189216 0.0138238
1 0.7 0 0 0 0.767109 0.00117025 0.00103332 5.77E-05
2 0.525 0.175 0 0 0.542766 0.191944 0.00021295 2.29E-06
3 0.35 0.35 0 0 0.423943 0.358046 0.000150965 1.47E-06
4 0.14 0.56 0 0 0.172721 0.479658 0.000228182 6.85E-06
5 0 0.7 0 0 0.00302008 0.625225 0.00117242 0.00036585
6 0 0.7 0 0 3.32E-06 0.707138 0.0149319 0.00938345
7 0 0.56 0.07 0.07 6.21E-07 0.560203 0.0693535 0.0403772
8 0 0.42 0.14 0.14 1.25E-06 0.471694 0.186478 0.119979
9 0 0.14 0.28 0.28 1.59E-06 0.167449 0.359615 0.295831
10 0 0 0.42 0.28 1.36E-07 0.000389456 0.516743 0.346903
11 0 0 0.56 0.14 7.90E-09 3.37E-07 0.620659 0.129515
12 0 0 0.7 0 1.09E-09 1.54E-09 0.707565 0.00935376
13 0 0 0.7 0 2.22E-11 5.90E-12 0.72755 0.00167648
14 0 0 0.7 0 1.56E-15 4.54E-15 0.730231 0.0211083
15 0 0 0.56 0.14 1.65E-16 2.10E-16 0.571959 0.161123
16 0 0 0.42 0.28 1.96E-11 1.99E-15 0.432881 0.301985
17 0 0 0.28 0.42 5.92E-08 1.31E-12 0.308406 0.435983
18 0 0 0.14 0.56 0.000187705 3.36E-12 0.141092 0.555917
19 0 0 0.14 0.42 0.0290587 3.05E-13 0.127491 0.376656
20 0.14 0 0.14 0.28 0.169297 7.42E-14 0.180059 0.273988
21 0.14 0 0.21 0.21 0.206429 5.62E-14 0.235021 0.269625
22 0.14 0 0.21 0.21 0.154466 6.79E-14 0.235911 0.228958
23 0.21 0 0.14 0.14 0.185705 4.59E-13 0.124185 0.122857
TABLE X: CALIBRATION OF POSITION DATA UNDER HIGH NEUROTICISM PERSONALITY Original Data Trained Data
Time House School Mountain Etc. House School Mountain Etc.
0 1.3 0 0 0 0.996614 3.27E-09 0.0254052 0.0121452
1 1.3 0 0 0 0.999956 0.00126231 0.00174705 5.84E-05
2 0.975 0.25 0 0 0.940008 0.262101 0.000363181 3.05E-06
3 0.65 0.5 0 0 0.631578 0.551342 0.000255618 1.96E-06
4 0.26 0.8 0 0 0.277116 0.846815 0.000391497 9.29E-06
5 0 1 0 0 0.00495457 0.984484 0.00203146 0.00048581
6 0 1 0 0 5.85E-06 0.984447 0.0251629 0.0122533
7 0 0.8 0.07 0.07 1.19E-06 0.850784 0.107822 0.0595709
8 0 0.6 0.14 0.14 2.27E-06 0.630019 0.248152 0.185611
9 0 0.2 0.28 0.28 2.43E-06 0.200246 0.403895 0.403509
10 0 0 0.42 0.28 1.66E-07 0.000372238 0.544731 0.441348
11 0 0 0.56 0.14 8.79E-09 3.64E-07 0.707029 0.200636
12 0 0 0.7 0 1.21E-09 1.99E-09 0.857481 0.0190226
13 0 0 0.7 0 4.98E-11 1.17E-11 0.886678 0.00243272
14 0 0 0.7 0 1.70E-14 1.65E-14 0.859661 0.0183923
15 0 0 0.56 0.14 7.97E-14 5.05E-16 0.726523 0.219936
16 0 0 0.42 0.28 1.51E-09 3.09E-14 0.515626 0.417017
17 0 0 0.28 0.42 1.32E-07 3.52E-11 0.337896 0.587912
18 0 0 0.14 0.56 0.000232095 2.26E-11 0.160454 0.755047
19 0 0 0.14 0.42 0.0338594 8.84E-13 0.137067 0.575177
20 0.26 0 0.14 0.28 0.199698 1.14E-13 0.171602 0.34586
21 0.26 0 0.21 0.21 0.262027 6.52E-14 0.216281 0.286824
22 0.26 0 0.21 0.21 0.237211 7.56E-14 0.231154 0.239153
23 0.39 0 0.14 0.14 0.433572 5.41E-13 0.142824 0.132246
Journal of Economics, Business and Management, Vol. 2, No. 4, November 2014
278
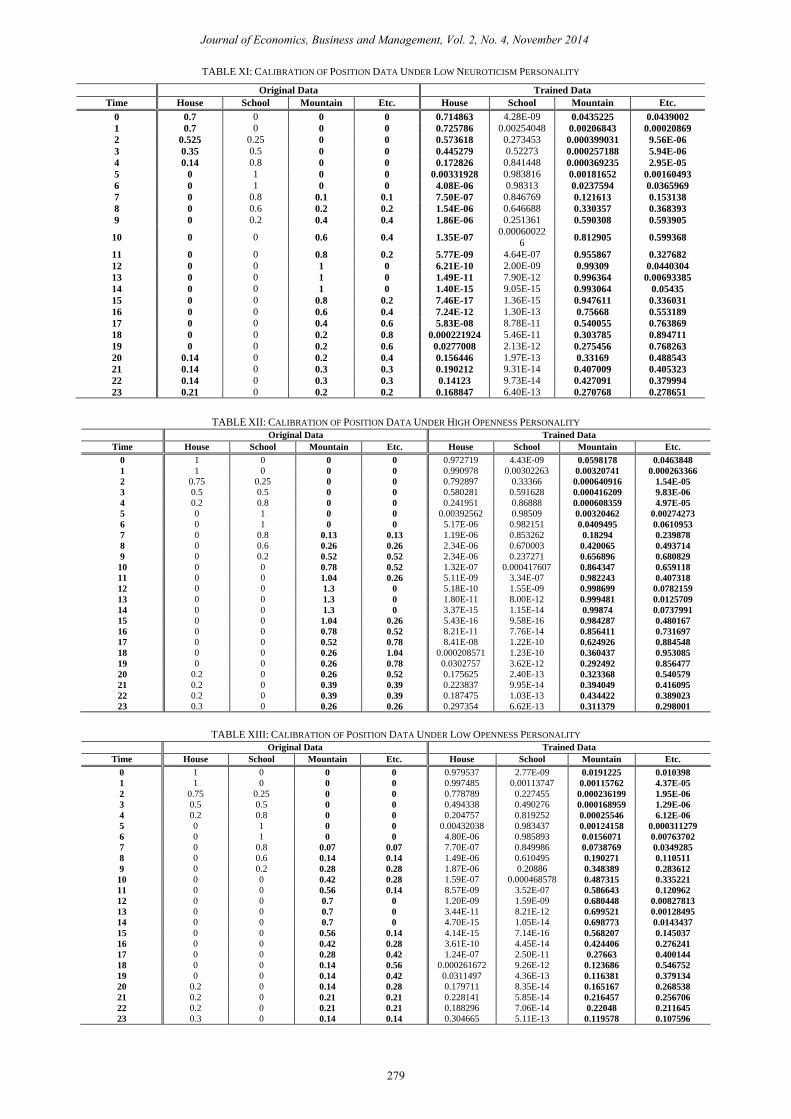
TABLE XI: CALIBRATION OF POSITION DATA UNDER LOW NEUROTICISM PERSONALITY
Original Data Trained Data
Time House School Mountain Etc. House School Mountain Etc.
0 0.7 0 0 0 0.714863 4.28E-09 0.0435225 0.0439002
1 0.7 0 0 0 0.725786 0.00254048 0.00206843 0.00020869
2 0.525 0.25 0 0 0.573618 0.273453 0.000399031 9.56E-06
3 0.35 0.5 0 0 0.445279 0.52273 0.000257188 5.94E-06
4 0.14 0.8 0 0 0.172826 0.841448 0.000369235 2.95E-05
5 0 1 0 0 0.00331928 0.983816 0.00181652 0.00160493
6 0 1 0 0 4.08E-06 0.98313 0.0237594 0.0365969
7 0 0.8 0.1 0.1 7.50E-07 0.846769 0.121613 0.153138
8 0 0.6 0.2 0.2 1.54E-06 0.646688 0.330357 0.368393
9 0 0.2 0.4 0.4 1.86E-06 0.251361 0.590308 0.593905
10 0 0 0.6 0.4 1.35E-07 0.00060022
6 0.812905 0.599368
11 0 0 0.8 0.2 5.77E-09 4.64E-07 0.955867 0.327682
12 0 0 1 0 6.21E-10 2.00E-09 0.99309 0.0440304
13 0 0 1 0 1.49E-11 7.90E-12 0.996364 0.00693385
14 0 0 1 0 1.40E-15 9.05E-15 0.993064 0.05435
15 0 0 0.8 0.2 7.46E-17 1.36E-15 0.947611 0.336031
16 0 0 0.6 0.4 7.24E-12 1.30E-13 0.75668 0.553189
17 0 0 0.4 0.6 5.83E-08 8.78E-11 0.540055 0.763869
18 0 0 0.2 0.8 0.000221924 5.46E-11 0.303785 0.894711
19 0 0 0.2 0.6 0.0277008 2.13E-12 0.275456 0.768263
20 0.14 0 0.2 0.4 0.156446 1.97E-13 0.33169 0.488543
21 0.14 0 0.3 0.3 0.190212 9.31E-14 0.407009 0.405323
22 0.14 0 0.3 0.3 0.14123 9.73E-14 0.427091 0.379994
23 0.21 0 0.2 0.2 0.168847 6.40E-13 0.270768 0.278651
TABLE XII: CALIBRATION OF POSITION DATA UNDER HIGH OPENNESS PERSONALITY
Original Data Trained Data
Time House School Mountain Etc. House School Mountain Etc.
0 1 0 0 0 0.972719 4.43E-09 0.0598178 0.0463848
1 1 0 0 0 0.990978 0.00302263 0.00320741 0.000263366
2 0.75 0.25 0 0 0.792897 0.33366 0.000640916 1.54E-05
3 0.5 0.5 0 0 0.580281 0.591628 0.000416209 9.83E-06
4 0.2 0.8 0 0 0.241951 0.86888 0.000608359 4.97E-05
5 0 1 0 0 0.00392562 0.98509 0.00320462 0.00274273
6 0 1 0 0 5.17E-06 0.982151 0.0409495 0.0610953
7 0 0.8 0.13 0.13 1.19E-06 0.853262 0.18294 0.239878
8 0 0.6 0.26 0.26 2.34E-06 0.670003 0.420065 0.493714
9 0 0.2 0.52 0.52 2.34E-06 0.237271 0.656896 0.680829
10 0 0 0.78 0.52 1.32E-07 0.000417607 0.864347 0.659118
11 0 0 1.04 0.26 5.11E-09 3.34E-07 0.982243 0.407318
12 0 0 1.3 0 5.18E-10 1.55E-09 0.998699 0.0782159
13 0 0 1.3 0 1.80E-11 8.00E-12 0.999481 0.0125709
14 0 0 1.3 0 3.37E-15 1.15E-14 0.99874 0.0737991
15 0 0 1.04 0.26 5.43E-16 9.58E-16 0.984287 0.480167
16 0 0 0.78 0.52 8.21E-11 7.76E-14 0.856411 0.731697
17 0 0 0.52 0.78 8.41E-08 1.22E-10 0.624926 0.884548
18 0 0 0.26 1.04 0.000208571 1.23E-10 0.360437 0.953085
19 0 0 0.26 0.78 0.0302757 3.62E-12 0.292492 0.856477
20 0.2 0 0.26 0.52 0.175625 2.40E-13 0.323368 0.540579
21 0.2 0 0.39 0.39 0.223837 9.95E-14 0.394049 0.416095
22 0.2 0 0.39 0.39 0.187475 1.03E-13 0.434422 0.389023
23 0.3 0 0.26 0.26 0.297354 6.62E-13 0.311379 0.298001
TABLE XIII: CALIBRATION OF POSITION DATA UNDER LOW OPENNESS PERSONALITY
Original Data Trained Data
Time House School Mountain Etc. House School Mountain Etc.
0 1 0 0 0 0.979537 2.77E-09 0.0191225 0.010398
1 1 0 0 0 0.997485 0.00113747 0.00115762 4.37E-05
2 0.75 0.25 0 0 0.778789 0.227455 0.000236199 1.95E-06
3 0.5 0.5 0 0 0.494338 0.490276 0.000168959 1.29E-06
4 0.2 0.8 0 0 0.204757 0.819252 0.00025546 6.12E-06
5 0 1 0 0 0.00432038 0.983437 0.00124158 0.000311279
6 0 1 0 0 4.80E-06 0.985893 0.0156071 0.00763702
7 0 0.8 0.07 0.07 7.70E-07 0.849986 0.0738769 0.0349285
8 0 0.6 0.14 0.14 1.49E-06 0.610495 0.190271 0.110511
9 0 0.2 0.28 0.28 1.87E-06 0.20886 0.348389 0.283612
10 0 0 0.42 0.28 1.59E-07 0.000468578 0.487315 0.335221
11 0 0 0.56 0.14 8.57E-09 3.52E-07 0.586643 0.120962
12 0 0 0.7 0 1.20E-09 1.59E-09 0.680448 0.00827813
13 0 0 0.7 0 3.44E-11 8.21E-12 0.699521 0.00128495
14 0 0 0.7 0 4.70E-15 1.05E-14 0.698773 0.0143437
15 0 0 0.56 0.14 4.14E-15 7.14E-16 0.568207 0.145037
16 0 0 0.42 0.28 3.61E-10 4.45E-14 0.424406 0.276241
17 0 0 0.28 0.42 1.24E-07 2.50E-11 0.27663 0.400144
18 0 0 0.14 0.56 0.000261672 9.26E-12 0.123686 0.546752
19 0 0 0.14 0.42 0.0311497 4.36E-13 0.116381 0.379134
20 0.2 0 0.14 0.28 0.179711 8.35E-14 0.165167 0.268538
21 0.2 0 0.21 0.21 0.228141 5.85E-14 0.216457 0.256706
22 0.2 0 0.21 0.21 0.188296 7.06E-14 0.22048 0.211645
23 0.3 0 0.14 0.14 0.304665 5.11E-13 0.119578 0.107596
Journal of Economics, Business and Management, Vol. 2, No. 4, November 2014
279
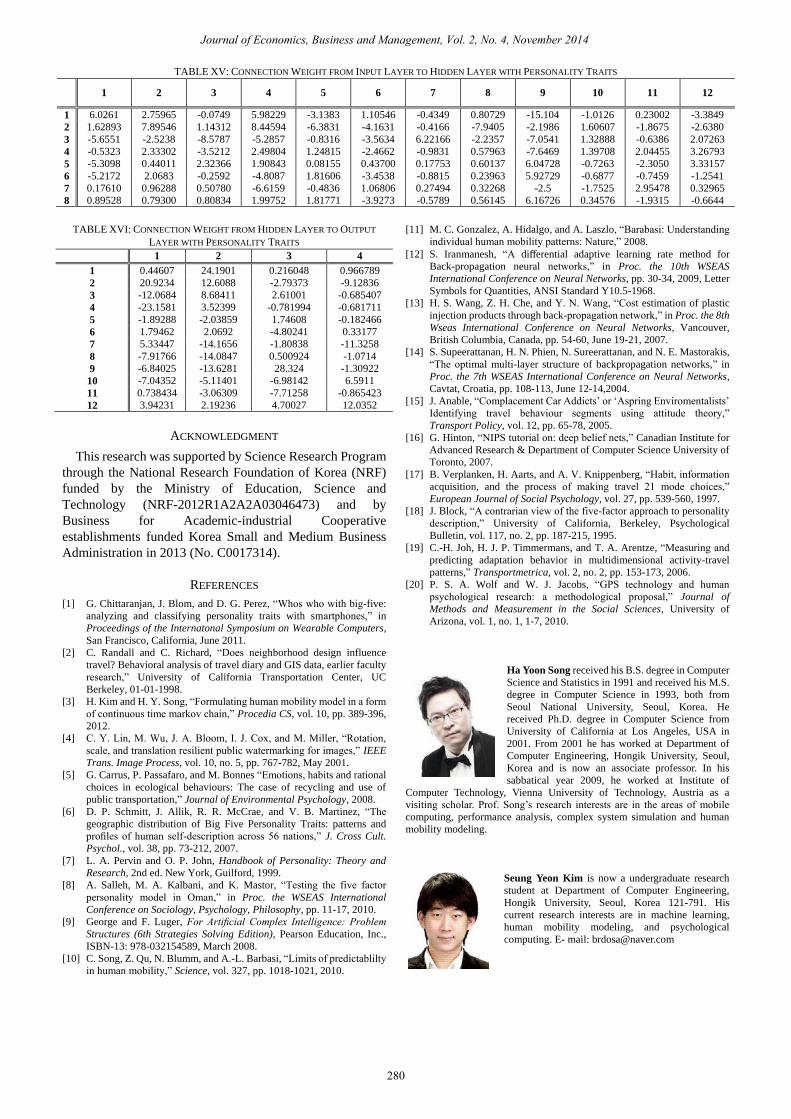
TABLE XV: CONNECTION WEIGHT FROM INPUT LAYER TO HIDDEN LAYER WITH PERSONALITY TRAITS
1 2 3 4 5 6 7 8 9 10 11 12
1 6.0261 2.75965 -0.0749 5.98229 -3.1383 1.10546 -0.4349 0.80729 -15.104 -1.0126 0.23002 -3.3849
2 1.62893 7.89546 1.14312 8.44594 -6.3831 -4.1631 -0.4166 -7.9405 -2.1986 1.60607 -1.8675 -2.6380
3 -5.6551 -2.5238 -8.5787 -5.2857 -0.8316 -3.5634 6.22166 -2.2357 -7.0541 1.32888 -0.6386 2.07263
4 -0.5323 2.33302 -3.5212 2.49804 1.24815 -2.4662 -0.9831 0.57963 -7.6469 1.39708 2.04455 3.26793
5 -5.3098 0.44011 2.32366 1.90843 0.08155 0.43700 0.17753 0.60137 6.04728 -0.7263 -2.3050 3.33157
6 -5.2172 2.0683 -0.2592 -4.8087 1.81606 -3.4538 -0.8815 0.23963 5.92729 -0.6877 -0.7459 -1.2541
7 0.17610 0.96288 0.50780 -6.6159 -0.4836 1.06806 0.27494 0.32268 -2.5 -1.7525 2.95478 0.32965
8 0.89528 0.79300 0.80834 1.99752 1.81771 -3.9273 -0.5789 0.56145 6.16726 0.34576 -1.9315 -0.6644
TABLE XVI: CONNECTION WEIGHT FROM HIDDEN LAYER TO OUTPUT
LAYER WITH PERSONALITY TRAITS
1 2 3 4
1 0.44607 24.1901 0.216048 0.966789
2 20.9234 12.6088 -2.79373 -9.12836
3 -12.0684 8.68411 2.61001 -0.685407
4 -23.1581 3.52399 -0.781994 -0.681711
5 -1.89288 -2.03859 1.74608 -0.182466
6 1.79462 2.0692 -4.80241 0.33177
7 5.33447 -14.1656 -1.80838 -11.3258
8 -7.91766 -14.0847 0.500924 -1.0714
9 -6.84025 -13.6281 28.324 -1.30922
10 -7.04352 -5.11401 -6.98142 6.5911
11 0.738434 -3.06309 -7.71258 -0.865423
12 3.94231 2.19236 4.70027 12.0352
ACKNOWLEDGMENT
This research was supported by Science Research Program
through the National Research Foundation of Korea (NRF)
funded by the Ministry of Education, Science and
Technology (NRF-2012R1A2A2A03046473) and by
Business for Academic-industrial Cooperative
establishments funded Korea Small and Medium Business
Administration in 2013 (No. C0017314).
REFERENCES
Seung Yeon Kim is now a undergraduate research
student at Department of Computer Engineering,
Hongik University, Seoul, Korea 121-791. His
current research interests are in machine learning,
human mobility modeling, and psychological
computing. E- mail: [email protected]
Journal of Economics, Business and Management, Vol. 2, No. 4, November 2014
280
[1] G. Chittaranjan, J. Blom, and D. G. Perez, “Whos who with big-five:
analyzing and classifying personality traits with smartphones,” in
Proceedings of the Internatonal Symposium on Wearable Computers,
San Francisco, California, June 2011.
[2] C. Randall and C. Richard, “Does neighborhood design influence
travel? Behavioral analysis of travel diary and GIS data, earlier faculty
research,” University of California Transportation Center, UC
Berkeley, 01-01-1998.
[3] H. Kim and H. Y. Song, “Formulating human mobility model in a form
of continuous time markov chain,” Procedia CS, vol. 10, pp. 389-396,
2012.
[4] C. Y. Lin, M. Wu, J. A. Bloom, I. J. Cox, and M. Miller, “Rotation,
scale, and translation resilient public watermarking for images,” IEEE
Trans. Image Process, vol. 10, no. 5, pp. 767-782, May 2001.
[5] G. Carrus, P. Passafaro, and M. Bonnes “Emotions, habits and rational
choices in ecological behaviours: The case of recycling and use of
public transportation,” Journal of Environmental Psychology, 2008.
[6] D. P. Schmitt, J. Allik, R. R. McCrae, and V. B. Martinez, “The
geographic distribution of Big Five Personality Traits: patterns and
profiles of human self-description across 56 nations,” J. Cross Cult.
Psychol., vol. 38, pp. 73-212, 2007.
[7] L. A. Pervin and O. P. John, Handbook of Personality: Theory and
Research, 2nd ed. New York, Guilford, 1999.
[8] A. Salleh, M. A. Kalbani, and K. Mastor, “Testing the five factor
personality model in Oman,” in Proc. the WSEAS International
Conference on Sociology, Psychology, Philosophy, pp. 11-17, 2010.
[9] George and F. Luger, For Artificial Complex Intelligence: Problem
Structures (6th Strategies Solving Edition), Pearson Education, Inc.,
ISBN-13: 978-032154589, March 2008.
[10] C. Song, Z. Qu, N. Blumm, and A.-L. Barbasi, “Limits of predictablilty
in human mobility,” Science, vol. 327, pp. 1018-1021, 2010.
[11] M. C. Gonzalez, A. Hidalgo, and A. Laszlo, “Barabasi: Understanding
individual human mobility patterns: Nature,” 2008.
[12] S. Iranmanesh, “A differential adaptive learning rate method for
Back-propagation neural networks,” in Proc. the 10th WSEAS
International Conference on Neural Networks, pp. 30-34, 2009, Letter
Symbols for Quantities, ANSI Standard Y10.5-1968.
[13] H. S. Wang, Z. H. Che, and Y. N. Wang, “Cost estimation of plastic
injection products through back-propagation network,” in Proc. the 8th
Wseas International Conference on Neural Networks, Vancouver,
British Columbia, Canada, pp. 54-60, June 19-21, 2007.
[14] S. Supeerattanan, H. N. Phien, N. Sureerattanan, and N. E. Mastorakis,
“The optimal multi-layer structure of backpropagation networks,” in
Proc. the 7th WSEAS International Conference on Neural Networks,
Cavtat, Croatia, pp. 108-113, June 12-14,2004.
[15] J. Anable, “Complacement Car Addicts‟ or „Aspring Enviromentalists‟
Identifying travel behaviour segments using attitude theory,”
Transport Policy, vol. 12, pp. 65-78, 2005.
[16] G. Hinton, “NIPS tutorial on: deep belief nets,” Canadian Institute for
Advanced Research & Department of Computer Science University of
Toronto, 2007.
[17] B. Verplanken, H. Aarts, and A. V. Knippenberg, “Habit, information
acquisition, and the process of making travel 21 mode choices,”
European Journal of Social Psychology, vol. 27, pp. 539-560, 1997.
[18] J. Block, “A contrarian view of the five-factor approach to personality
description,” University of California, Berkeley, Psychological
Bulletin, vol. 117, no. 2, pp. 187-215, 1995.
[19] C.-H. Joh, H. J. P. Timmermans, and T. A. Arentze, “Measuring and
predicting adaptation behavior in multidimensional activity-travel
patterns,” Transportmetrica, vol. 2, no. 2, pp. 153-173, 2006.
[20] P. S. A. Wolf and W. J. Jacobs, “GPS technology and human
psychological research: a methodological proposal,” Journal of
Methods and Measurement in the Social Sciences, University of
Arizona, vol. 1, no. 1, 1-7, 2010.
Ha Yoon Song received his B.S. degree in Computer
Science and Statistics in 1991 and received his M.S.
degree in Computer Science in 1993, both from
Seoul National University, Seoul, Korea. He
received Ph.D. degree in Computer Science from
University of California at Los Angeles, USA in
2001. From 2001 he has worked at Department of
Computer Engineering, Hongik University, Seoul,
Korea and is now an associate professor. In his
sabbatical year 2009, he worked at Institute of
Computer Technology, Vienna University of Technology, Austria as a
visiting scholar. Prof. Song‟s research interests are in the areas of mobile
computing, performance analysis, complex system simulation and human
mobility modeling.