Embed Size (px)
Citation preview
A. Suharyanto / GMSARN International Journal 10 (2016) 129 - 136
129
Abstract— Flood is one of natural hazard often occurs in many areas. During raining season flood is occur in many areas in Indonesia. There are many reasons of flood occurring, among them are high rainfall intensity, degradation of watershed condition, illegal logging, and increasing of percentage of impervious area especially in urban district. Usually, the flood is occur because of the flood water level is higher than embankment level. The area have elevation lower than flood water level will be inundated by the flood. If the watershed condition is not changed, the water level is only depend on the rainfall intensity. In this research, the area of inundation due to the rainfall intensity data will be investigated. The rainfall intensity was analyzed based on certain return period. The water level in channel was analyzed using HEC-RAS software. The water level is plotted in the topographic map to predict the inundation area. By selecting the rainfall intensity data which is same with rainfall intensity when the flood was occurred as input data, the inundation area was investigated. The investigated result of flood inundation map was compared with flood inundation map generated from observation data during the flood. It was can be confirmed that the investigated and surveyed flood maps are similar. Therefore, it can be concluded that analyzing rainfall data with certain return period is powerful to predict the inundation of flood. Keywords— About four key words or phrases in alphabetical order, separated by commas.
1. INTRODUCTION
During raining seasons, flood is occurring in many places in Indonesia. The main reason is the surface runoff discharge is bigger than channel capacity. Due to the change of physical condition of watershed and climate change, every year the runoff discharge is increased. On the other way, every year the channel capacity is decrease due to the sedimentation phenomena. To predict the flood inundation area, it is necessary to select the rainfall intensity data same with the rainfall intensity which is causing the flood in an area. Usually, the rainfall intensity data used as input data in the runoff simulation was selected from rainfall intensity with certain return period. The rainfall intensity data used as input data to the runoff simulation have same value with recorded rainfall intensity when the flood was occurred. This data is selected from rainfall intensity with certain return period. To predict the water level the HEC-RAS software is used. To run the HEC-RAS, beside of rainfall data the channel cross section, land use, roughness coefficient, watershed area, and channel long section data are need. Channel cross section was collected from topographic survey. The land use and roughness coefficient data were generated from satellite remote sensing data. The watershed area was analyzed from topographic map. For the rainfall data, 10 years time series data were used. Daily rainfall intensity data was used and daily maximum data is selected to analyze the rainfall intensity for many return period years. The
Agus Suharyanto is with the Civil Engineering Department, Faculty
of Engineering, Brawijaya University Jl. MT. Haryono 167, Malang 65145, Indonesia. Phone: +62-341-580120; Fax.: +62-341-551430; E-mail: [email protected].
analyzed result of rainfall intensity in many return period it was in daily rainfall intensity. Due to the analyzing process data requirement, it is necessary to change the daily rainfall intensity to hourly rainfall intensity. The Mononobe formulas was used to change the daily rainfall to hourly rainfall data [1].
The history of flood occurrences of the research area was recorded by the relating agency. Two biggest floods were selected as samples in the research analysis. By looking the dates of the flood occurrences, the rainfall data at the same dates were investigated. The recorded rainfall intensity data at the day when the flood was occurrences was compared with rainfall intensity were analyzed at the many return periods. The years of the return period of recorded rainfall was decided when the values of both rainfall intensity are same. By using the selected rainfall intensity data in certain return period, the water level in the channel were simulated using HEC-RAS software. The others data need in the analysis such as land use, watershed characteristics, and channel characteristics were generated from the raw data collected with the same year. From the simulation result, the water levels at cross and long sections of channel were obtained. The inundation area were plotted at the topographic map due to the elevation of simulated water level result. The boundary of inundation area was represented by the contour line have elevation with the simulated water level elevation. The area of inundation from the simulation was compared with the area of inundation drew from the field survey. The agreement of the comparison can be confirmed well. Therefore, the rainfall data analyzed by certain return period can be used to predict the flood inundation in an area.
Agus Suharyanto
Prediction of Flood Area Based on the Occurrence of Rainfall Intensity
A. Suharyanto / GMSARN International Journal 10 (2016) 129 - 136
130
2. RESEARCH MATERIALS AND METHOD
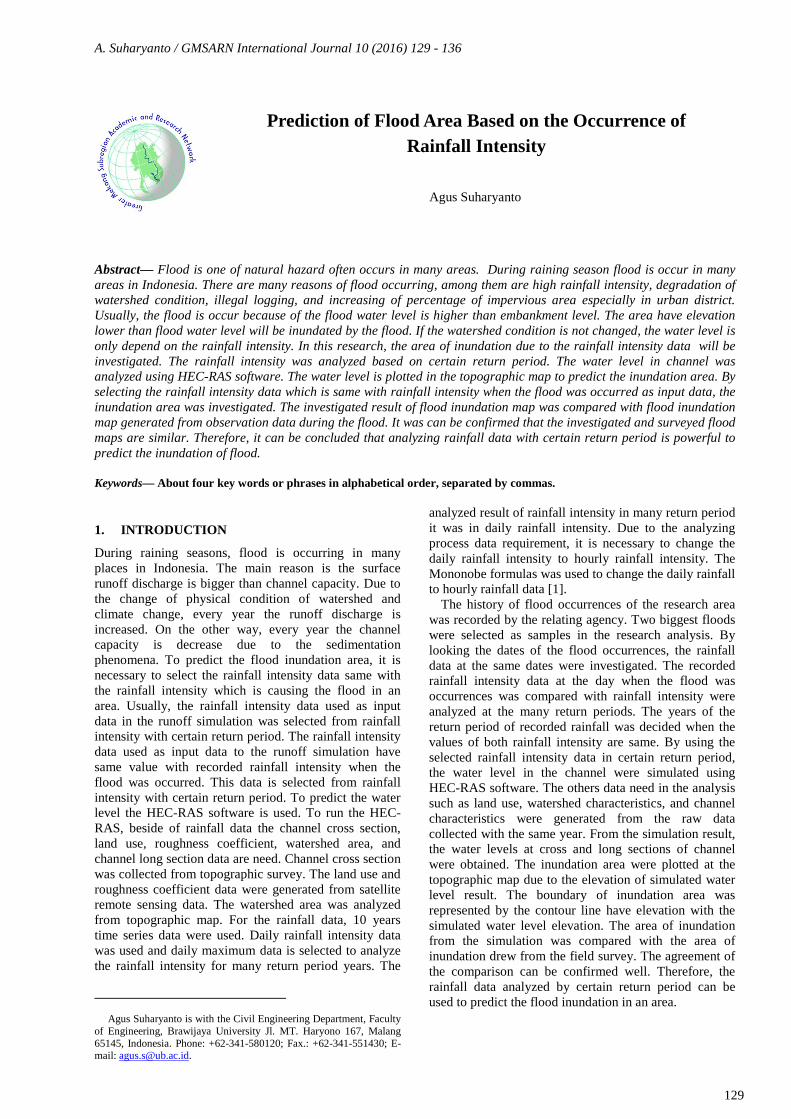
The research area is Sampean watershed, which is located in east Java province Indonesia. The watershed occupied two regencies, namely Bondowoso regency and Situbondo regency. Geographically, Sampean watershed located between 7.650 - 8.1250 South Latitude and 113.650 - 114.1250 East Longitude. The area of Sampean watershed is 1,239.77 km2. To analyze the rainfall intensity in many return periods, surface runoff discharge, and water level in channel many data and materials are needed. The rainfall intensity in many return periods is analyzed using daily rainfall data in 10 years time series from 27 rainfall gauges. The rainfall stations distribution map is shows in Figure 1. The physical parameters of watershed was generated from topographic map using GIS technology [2]- [3]. The land use data was classified from SPOT remotely sensed data using unsupervised classification method [4].
Fig. 1. Rainfall Distribution Map in Sampen Watershed The 15 sheets of topographic maps in scale 1:25,000
were used in this research. The SPOT data with path and raw 296/366 and 297/366 scanned in September 2014 were used in this research.
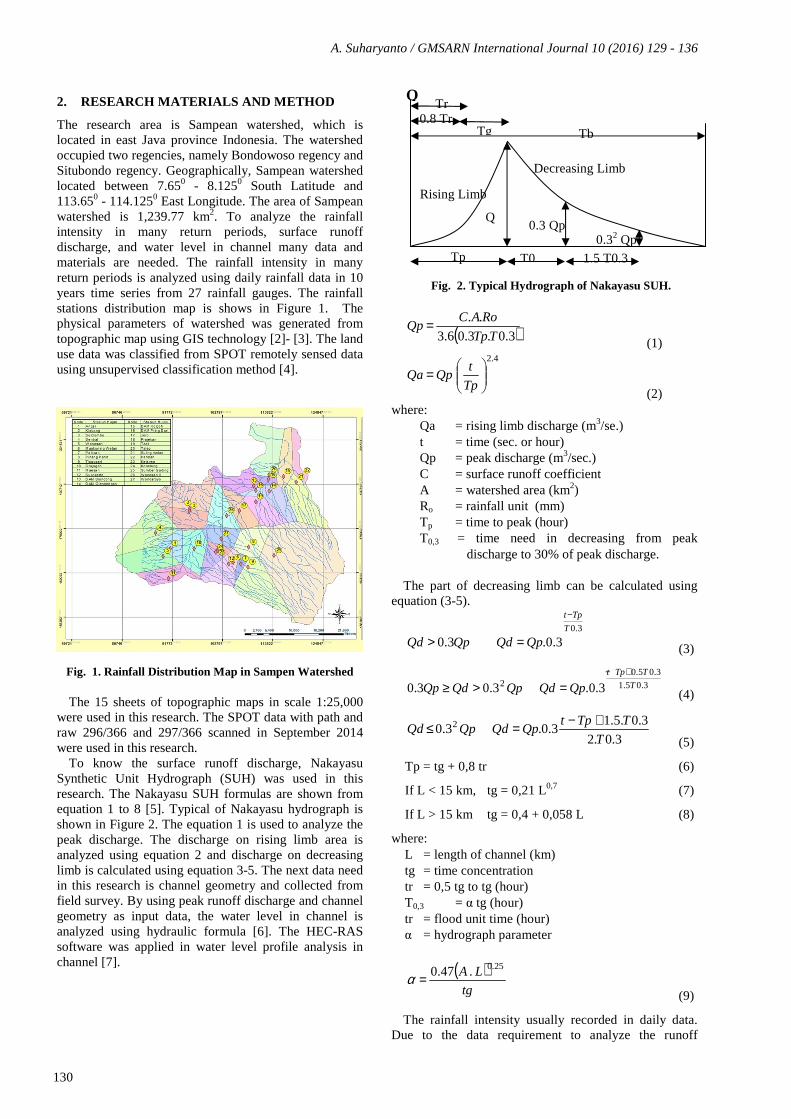
To know the surface runoff discharge, Nakayasu Synthetic Unit Hydrograph (SUH) was used in this research. The Nakayasu SUH formulas are shown from equation 1 to 8 [5]. Typical of Nakayasu hydrograph is shown in Figure 2. The equation 1 is used to analyze the peak discharge. The discharge on rising limb area is analyzed using equation 2 and discharge on decreasing limb is calculated using equation 3-5. The next data need in this research is channel geometry and collected from field survey. By using peak runoff discharge and channel geometry as input data, the water level in channel is analyzed using hydraulic formula [6]. The HEC-RAS software was applied in water level profile analysis in channel [7].
Fig. 2. Typical Hydrograph of Nakayasu SUH.
( )3.0.3.06.3
..
TTp
RoACQp =
(1) 4.2
=
Tp
tQpQa
(2) where:
Qa = rising limb discharge (m3/se.) t = time (sec. or hour) Qp = peak discharge (m3/sec.) C = surface runoff coefficient A = watershed area (km2) Ro = rainfall unit (mm) Tp = time to peak (hour) T0,3 = time need in decreasing from peak
discharge to 30% of peak discharge. The part of decreasing limb can be calculated using
equation (3-5).
3.0
3.0.3.0T
Tpt
QpQdQpQd
−
=> (3)
3.05.1
3.05.02 3.0.3.03.0 T
TTpt
QpQdQpQdQp+−
=>≥ (4)
3.0.2
3.0.5.13.0.3.0 2
T
TTptQpQdQpQd
+−=≤ (5)
Tp = tg + 0,8 tr (6)
If L < 15 km, tg = 0,21 L0,7 (7)
If L > 15 km tg = 0,4 + 0,058 L (8)
where: L = length of channel (km) tg = time concentration tr = 0,5 tg to tg (hour) T0,3 = α tg (hour) tr = flood unit time (hour) α = hydrograph parameter
( )tg
LA 25.0.47.0=α (9)
The rainfall intensity usually recorded in daily data. Due to the data requirement to analyze the runoff
1.5 T0.3
Tr 0.8 Tr
Tg
Rising Limb
Decreasing Limb
Qp
Tp T0.
0.3 Qp 0.32 Qp
Tb
Q
A. Suharyanto / GMSARN International Journal 10 (2016) 129 - 136
131
discharge, it is necessary to convert the daily to hourly rainfall data. The Mononobe formula is used in this analysis. The formula can be shown in equation 10 [8]-[9].
32
24 24
24
=
ct
II
(10) where:
I = rainfall intensity (mm/hour) R24 = daily rainfall intensity (mm/day) tc = rainfall duration As shown in Figure 1, there are 27 daily rainfall data
collected from 27 stations were used in this research. One maximum daily rainfall data for each year was selected to use in the analysis. Ten years daily rainfall data was collected in this research. Consequently, there are 27 maximum daily rainfall data for each year. To find the average rainfall intensity for each year in the Sampean watershed, the Thiessen polygon method is used [10]. The Thiessen polygon figure can be shown in Figure 1. Finally, 10 average daily rainfall data in Sampean watershed for each year can be found. From this data the rainfall with certain return period was calculated using Log Pearson Type III.
To convert the daily rainfall data with certain return period to hourly rainfall data, the Mononobe formula was used. This data will be used as one main data to find the surface runoff discharge in the research area. Beside it, the surface runoff coefficient and length of river data are needed in this analysis. The surface runoff coefficient was estimated using land cover map generated from satellite remote sensing data. The length of river was calculated based on topographic map. The total discharge flowing through the river are coming from surface runoff discharge and discharge from domestic wasted water. The discharge of domestic wasted water was analyzed due to the population density. The total discharge for each rainfall data with certain return period will be used as one of main input data to calculate the water level in river. The HEC-RAS software is used in this analysis [11].
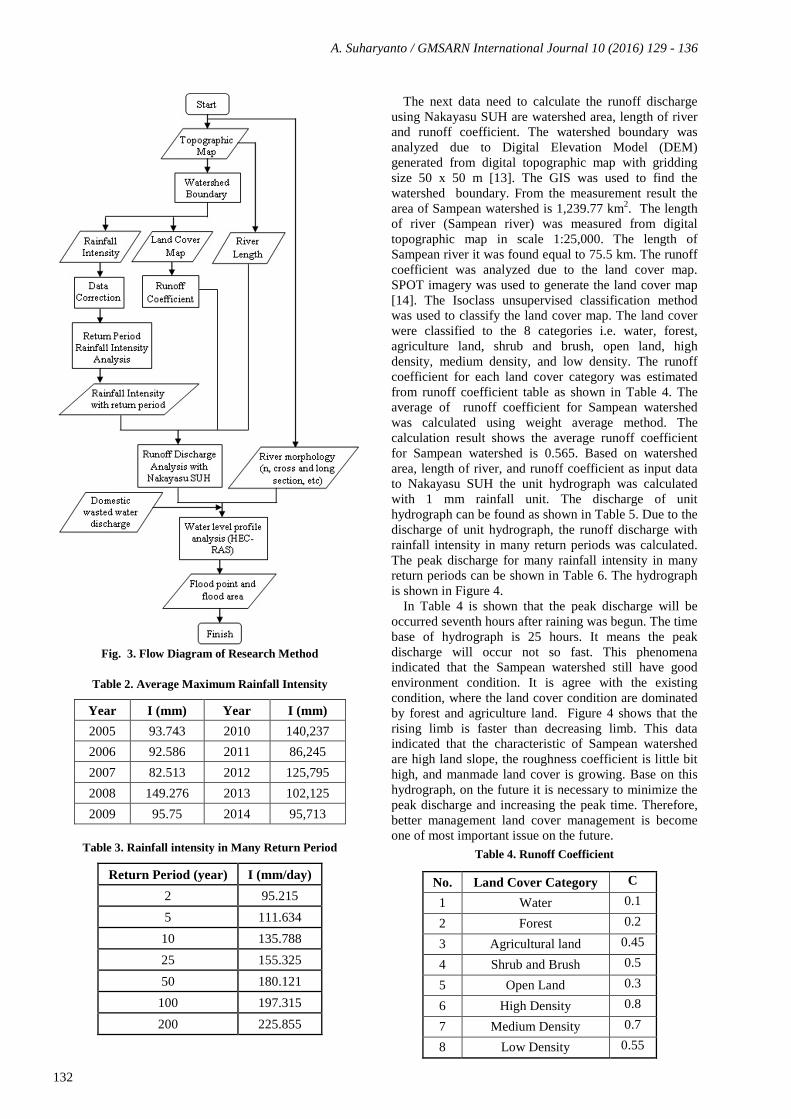
The data need in the water level simulation using HEC-RAS are channel cross sectional, channel roughness coefficient, longitudinal slope, and runoff discharge with many rainfall intensity return period. After analyzing process, the water level profile on the river can be found. The water level found from the analysis result is superimposed with the cross sectional data for each cross sectional point with 100 m interval. From the superimposed results it can be found the point which are the water level are higher than bank level. If the water level higher than bank level, it can be concluded that the flood is occurred. By plotting the water level from cross section point which are the flood occurred to the topographic map, the flood area can be predicted. From the simulations results with rainfall intensity in many return period as one of main input data, the certain rainfall return period data which is causing the flood occurrence can be found. The principle of the whole research method can be summarized in flow
diagram as shown in Figure 3.
3. RESULTS AND DISCUSSION
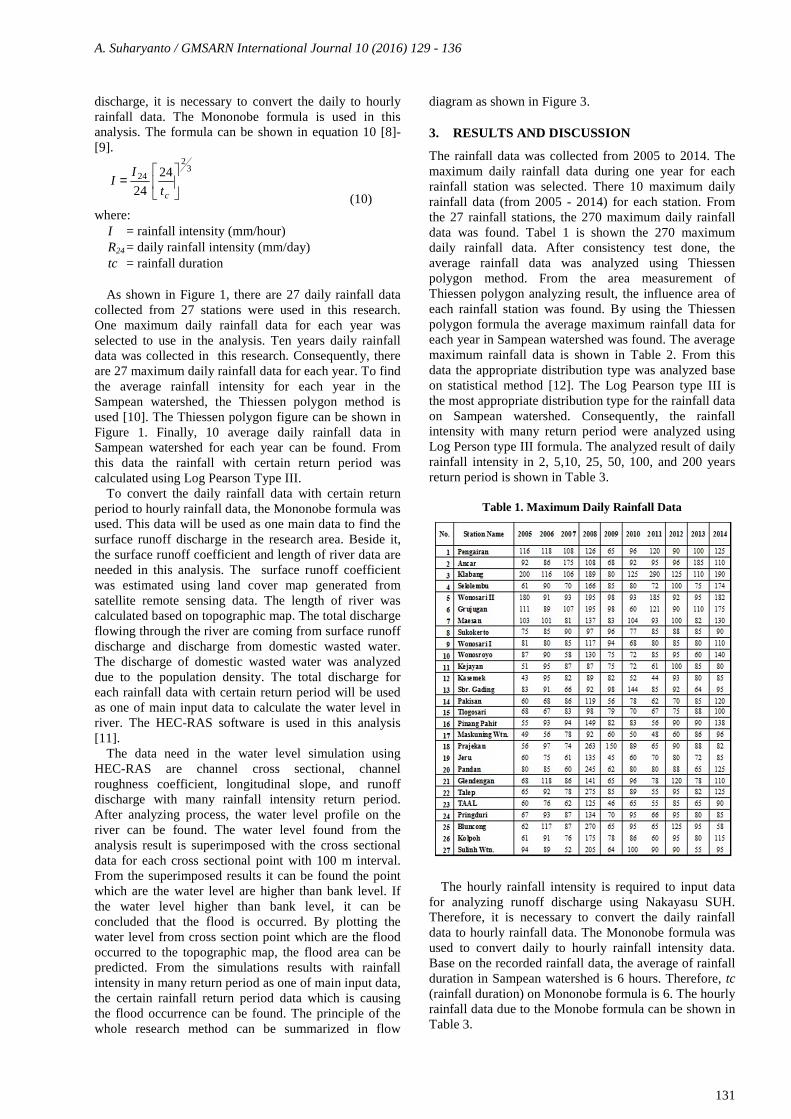
The rainfall data was collected from 2005 to 2014. The maximum daily rainfall data during one year for each rainfall station was selected. There 10 maximum daily rainfall data (from 2005 - 2014) for each station. From the 27 rainfall stations, the 270 maximum daily rainfall data was found. Tabel 1 is shown the 270 maximum daily rainfall data. After consistency test done, the average rainfall data was analyzed using Thiessen polygon method. From the area measurement of Thiessen polygon analyzing result, the influence area of each rainfall station was found. By using the Thiessen polygon formula the average maximum rainfall data for each year in Sampean watershed was found. The average maximum rainfall data is shown in Table 2. From this data the appropriate distribution type was analyzed base on statistical method [12]. The Log Pearson type III is the most appropriate distribution type for the rainfall data on Sampean watershed. Consequently, the rainfall intensity with many return period were analyzed using Log Person type III formula. The analyzed result of daily rainfall intensity in 2, 5,10, 25, 50, 100, and 200 years return period is shown in Table 3.
Table 1. Maximum Daily Rainfall Data
The hourly rainfall intensity is required to input data for analyzing runoff discharge using Nakayasu SUH. Therefore, it is necessary to convert the daily rainfall data to hourly rainfall data. The Mononobe formula was used to convert daily to hourly rainfall intensity data. Base on the recorded rainfall data, the average of rainfall duration in Sampean watershed is 6 hours. Therefore, tc (rainfall duration) on Mononobe formula is 6. The hourly rainfall data due to the Monobe formula can be shown in Table 3.
A. Suharyanto / GMSARN International Journal 10 (2016) 129 - 136
132
Fig. 3. Flow Diagram of Research Method
Table 2. Average Maximum Rainfall Intensity
Year I (mm) Year I (mm)
2005 93.743 2010 140,237
2006 92.586 2011 86,245
2007 82.513 2012 125,795
2008 149.276 2013 102,125
2009 95.75 2014 95,713
Table 3. Rainfall intensity in Many Return Period
Return Period (year) I (mm/day)
2 95.215
5 111.634
10 135.788
25 155.325
50 180.121
100 197.315
200 225.855
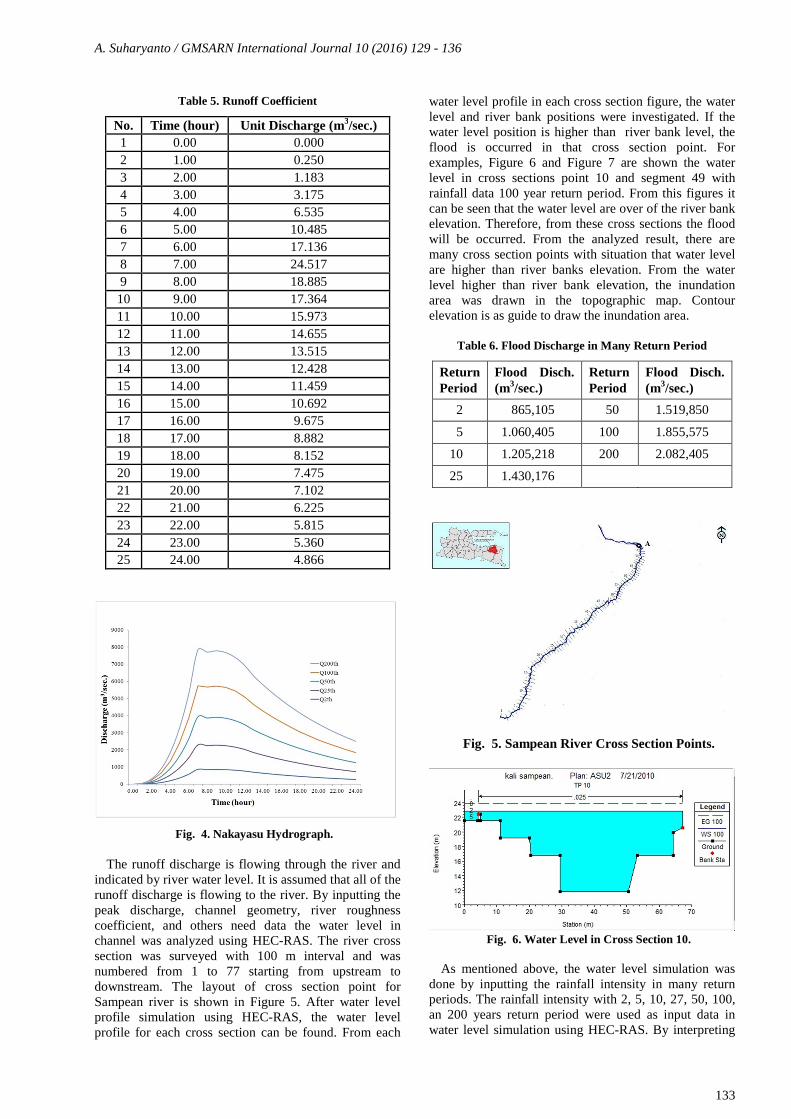
The next data need to calculate the runoff discharge using Nakayasu SUH are watershed area, length of river and runoff coefficient. The watershed boundary was analyzed due to Digital Elevation Model (DEM) generated from digital topographic map with gridding size 50 x 50 m [13]. The GIS was used to find the watershed boundary. From the measurement result the area of Sampean watershed is 1,239.77 km2. The length of river (Sampean river) was measured from digital topographic map in scale 1:25,000. The length of Sampean river it was found equal to 75.5 km. The runoff coefficient was analyzed due to the land cover map. SPOT imagery was used to generate the land cover map [14]. The Isoclass unsupervised classification method was used to classify the land cover map. The land cover were classified to the 8 categories i.e. water, forest, agriculture land, shrub and brush, open land, high density, medium density, and low density. The runoff coefficient for each land cover category was estimated from runoff coefficient table as shown in Table 4. The average of runoff coefficient for Sampean watershed was calculated using weight average method. The calculation result shows the average runoff coefficient for Sampean watershed is 0.565. Based on watershed area, length of river, and runoff coefficient as input data to Nakayasu SUH the unit hydrograph was calculated with 1 mm rainfall unit. The discharge of unit hydrograph can be found as shown in Table 5. Due to the discharge of unit hydrograph, the runoff discharge with rainfall intensity in many return periods was calculated. The peak discharge for many rainfall intensity in many return periods can be shown in Table 6. The hydrograph is shown in Figure 4.
In Table 4 is shown that the peak discharge will be occurred seventh hours after raining was begun. The time base of hydrograph is 25 hours. It means the peak discharge will occur not so fast. This phenomena indicated that the Sampean watershed still have good environment condition. It is agree with the existing condition, where the land cover condition are dominated by forest and agriculture land. Figure 4 shows that the rising limb is faster than decreasing limb. This data indicated that the characteristic of Sampean watershed are high land slope, the roughness coefficient is little bit high, and manmade land cover is growing. Base on this hydrograph, on the future it is necessary to minimize the peak discharge and increasing the peak time. Therefore, better management land cover management is become one of most important issue on the future.
Table 4. Runoff Coefficient
No. Land Cover Category C
1 Water 0.1
2 Forest 0.2
3 Agricultural land 0.45
4 Shrub and Brush 0.5
5 Open Land 0.3
6 High Density 0.8
7 Medium Density 0.7
8 Low Density 0.55
A. Suharyanto / GMSARN International Journal 10 (2016) 129 - 136
133
Table 5. Runoff Coefficient
No. Time (hour) Unit Discharge (m3/sec.) 1 0.00 0.000 2 1.00 0.250 3 2.00 1.183 4 3.00 3.175 5 4.00 6.535 6 5.00 10.485 7 6.00 17.136 8 7.00 24.517 9 8.00 18.885 10 9.00 17.364 11 10.00 15.973 12 11.00 14.655 13 12.00 13.515 14 13.00 12.428 15 14.00 11.459 16 15.00 10.692 17 16.00 9.675 18 17.00 8.882 19 18.00 8.152 20 19.00 7.475 21 20.00 7.102 22 21.00 6.225 23 22.00 5.815 24 23.00 5.360 25 24.00 4.866
Fig. 4. Nakayasu Hydrograph. The runoff discharge is flowing through the river and
indicated by river water level. It is assumed that all of the runoff discharge is flowing to the river. By inputting the peak discharge, channel geometry, river roughness coefficient, and others need data the water level in channel was analyzed using HEC-RAS. The river cross section was surveyed with 100 m interval and was numbered from 1 to 77 starting from upstream to downstream. The layout of cross section point for Sampean river is shown in Figure 5. After water level profile simulation using HEC-RAS, the water level profile for each cross section can be found. From each
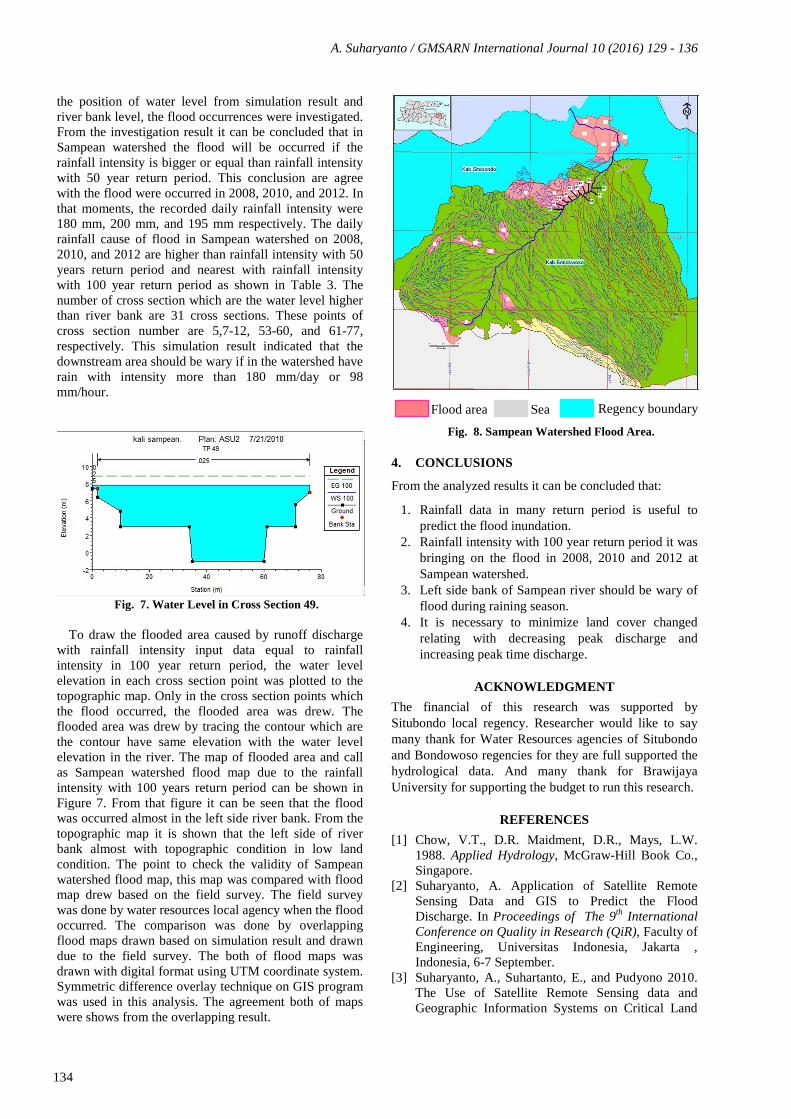
water level profile in each cross section figure, the water level and river bank positions were investigated. If the water level position is higher than river bank level, the flood is occurred in that cross section point. For examples, Figure 6 and Figure 7 are shown the water level in cross sections point 10 and segment 49 with rainfall data 100 year return period. From this figures it can be seen that the water level are over of the river bank elevation. Therefore, from these cross sections the flood will be occurred. From the analyzed result, there are many cross section points with situation that water level are higher than river banks elevation. From the water level higher than river bank elevation, the inundation area was drawn in the topographic map. Contour elevation is as guide to draw the inundation area.
Table 6. Flood Discharge in Many Return Period
Return Period
Flood Disch. (m3/sec.)
Return Period
Flood Disch. (m3/sec.)
2 865,105 50 1.519,850
5 1.060,405 100 1.855,575
10 1.205,218 200 2.082,405
25 1.430,176
Fig. 5. Sampean River Cross Section Points.
Fig. 6. Water Level in Cross Section 10.
As mentioned above, the water level simulation was
done by inputting the rainfall intensity in many return periods. The rainfall intensity with 2, 5, 10, 27, 50, 100, an 200 years return period were used as input data in water level simulation using HEC-RAS. By interpreting
A. Suharyanto / GMSARN International Journal 10 (2016) 129 - 136
134
the position of water level from simulation result and river bank level, the flood occurrences were investigated. From the investigation result it can be concluded that in Sampean watershed the flood will be occurred if the rainfall intensity is bigger or equal than rainfall intensity with 50 year return period. This conclusion are agree with the flood were occurred in 2008, 2010, and 2012. In that moments, the recorded daily rainfall intensity were 180 mm, 200 mm, and 195 mm respectively. The daily rainfall cause of flood in Sampean watershed on 2008, 2010, and 2012 are higher than rainfall intensity with 50 years return period and nearest with rainfall intensity with 100 year return period as shown in Table 3. The number of cross section which are the water level higher than river bank are 31 cross sections. These points of cross section number are 5,7-12, 53-60, and 61-77, respectively. This simulation result indicated that the downstream area should be wary if in the watershed have rain with intensity more than 180 mm/day or 98 mm/hour.
Fig. 7. Water Level in Cross Section 49.
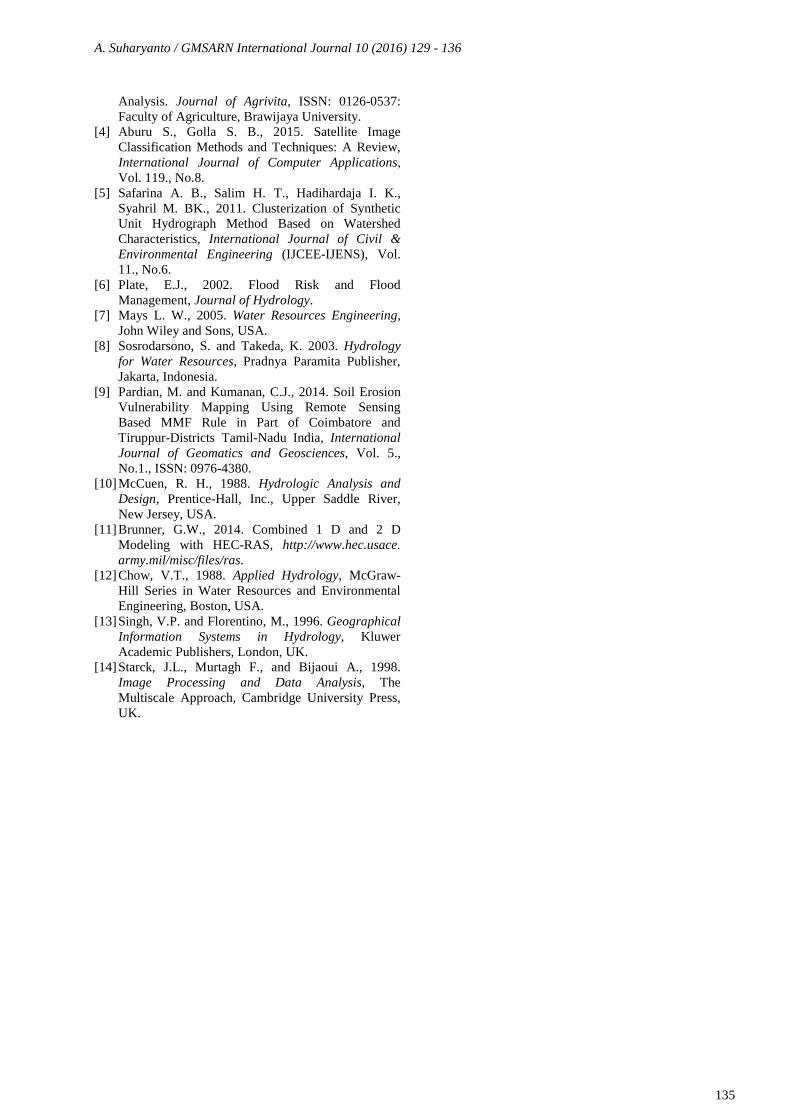
To draw the flooded area caused by runoff discharge
with rainfall intensity input data equal to rainfall intensity in 100 year return period, the water level elevation in each cross section point was plotted to the topographic map. Only in the cross section points which the flood occurred, the flooded area was drew. The flooded area was drew by tracing the contour which are the contour have same elevation with the water level elevation in the river. The map of flooded area and call as Sampean watershed flood map due to the rainfall intensity with 100 years return period can be shown in Figure 7. From that figure it can be seen that the flood was occurred almost in the left side river bank. From the topographic map it is shown that the left side of river bank almost with topographic condition in low land condition. The point to check the validity of Sampean watershed flood map, this map was compared with flood map drew based on the field survey. The field survey was done by water resources local agency when the flood occurred. The comparison was done by overlapping flood maps drawn based on simulation result and drawn due to the field survey. The both of flood maps was drawn with digital format using UTM coordinate system. Symmetric difference overlay technique on GIS program was used in this analysis. The agreement both of maps were shows from the overlapping result.
Fig. 8. Sampean Watershed Flood Area.
4. CONCLUSIONS
From the analyzed results it can be concluded that:
1. Rainfall data in many return period is useful to predict the flood inundation.
2. Rainfall intensity with 100 year return period it was bringing on the flood in 2008, 2010 and 2012 at Sampean watershed.
3. Left side bank of Sampean river should be wary of flood during raining season.
4. It is necessary to minimize land cover changed relating with decreasing peak discharge and increasing peak time discharge.
ACKNOWLEDGMENT
The financial of this research was supported by Situbondo local regency. Researcher would like to say many thank for Water Resources agencies of Situbondo and Bondowoso regencies for they are full supported the hydrological data. And many thank for Brawijaya University for supporting the budget to run this research.
REFERENCES
[1] Chow, V.T., D.R. Maidment, D.R., Mays, L.W. 1988. Applied Hydrology, McGraw-Hill Book Co., Singapore.
[2] Suharyanto, A. Application of Satellite Remote Sensing Data and GIS to Predict the Flood Discharge. In Proceedings of The 9th International Conference on Quality in Research (QiR), Faculty of Engineering, Universitas Indonesia, Jakarta , Indonesia, 6-7 September.
[3] Suharyanto, A., Suhartanto, E., and Pudyono 2010. The Use of Satellite Remote Sensing data and Geographic Information Systems on Critical Land
Flood area Sea Regency boundary
A. Suharyanto / GMSARN International Journal 10 (2016) 129 - 136
135
Analysis. Journal of Agrivita, ISSN: 0126-0537: Faculty of Agriculture, Brawijaya University.
[4] Aburu S., Golla S. B., 2015. Satellite Image Classification Methods and Techniques: A Review, International Journal of Computer Applications, Vol. 119., No.8.
[5] Safarina A. B., Salim H. T., Hadihardaja I. K., Syahril M. BK., 2011. Clusterization of Synthetic Unit Hydrograph Method Based on Watershed Characteristics, International Journal of Civil & Environmental Engineering (IJCEE-IJENS), Vol. 11., No.6.
[6] Plate, E.J., 2002. Flood Risk and Flood Management, Journal of Hydrology.
[7] Mays L. W., 2005. Water Resources Engineering, John Wiley and Sons, USA.
[8] Sosrodarsono, S. and Takeda, K. 2003. Hydrology for Water Resources, Pradnya Paramita Publisher, Jakarta, Indonesia.
[9] Pardian, M. and Kumanan, C.J., 2014. Soil Erosion Vulnerability Mapping Using Remote Sensing Based MMF Rule in Part of Coimbatore and Tiruppur-Districts Tamil-Nadu India, International Journal of Geomatics and Geosciences, Vol. 5., No.1., ISSN: 0976-4380.
[10] McCuen, R. H., 1988. Hydrologic Analysis and Design, Prentice-Hall, Inc., Upper Saddle River, New Jersey, USA.
[11] Brunner, G.W., 2014. Combined 1 D and 2 D Modeling with HEC-RAS, http://www.hec.usace. army.mil/misc/files/ras.
[12] Chow, V.T., 1988. Applied Hydrology, McGraw-Hill Series in Water Resources and Environmental Engineering, Boston, USA.
[13] Singh, V.P. and Florentino, M., 1996. Geographical Information Systems in Hydrology, Kluwer Academic Publishers, London, UK.
[14] Starck, J.L., Murtagh F., and Bijaoui A., 1998. Image Processing and Data Analysis, The Multiscale Approach, Cambridge University Press, UK.

A. Suharyanto / GMSARN International Journal 10 (2016) 129 - 136
136