Embed Size (px)
Citation preview
India’s energy sector has witnessed a strong growth in recent years generated by expansion of universal energy access through various government schemes, underpinned by urbanisation of its vast population and industrialization in addition to growing economic prosperity. Today, India is globally the third largest consumer of energy and its energy use will continue to grow at a rapid pace due to improved energy access by its rural population resulting in a rapidly changing energy landscape and fuelling the economic growth of the country.The PPAC biannual Ready Reckoner provides in a single volume a comprehensive compilation of the latest data/information for the financial year 2018-19 and historical time series pertaining to the oil and gas sector. The Ready Reckoner is also published on PPAC’s website (http://ppac.gov.in) and is accessible on our mobile app – PPACE. The coverage of data in the print version and the mobile app has been restricted to relatively shorter time periods while longer historical data series has been provided on our website. The Ready Reckoner endeavours to provide accurate and timely information to policy makers, decision makers in the oil & gas and allied industries, non-governmental organizations academicians, analysts, market researchers, educational institutions, libraries and the public, and for planning for sustainable development.The publication of Ready Reckoner is a concerted effort by all divisions of PPAC and I would like to place on record my sincere appreciation of the diligent efforts of the officers and staff who have contributed to bring out the current edition. The cooperation of the oil and gas industry is acknowledged for their timely inputs.It is my pleasure to present the Ready Reckoner which has become one of PPAC’s most established publications. To our data users, it is my hope that they will find this a useful reference. Efforts are continuously made to include more statistical information to make it more useful for the stakeholders. PPAC welcomes feedback and suggestions for broadening the coverage and contents of the data being disseminated through this publication.
New DelhiJune 13, 2019
Atreyee DasDirector General
Petroleum Planning & Analysis Cell (PPAC)(Ministry of Petroleum & Natural Gas)
Preface

Vision To be the most authentic official source for data and policy analysis on the
hydrocarbon sector in the country.
Mission1. To strengthen the existing data system in PPAC by adopting the latest techniques
and best practices.2. To render effective assistance to the Ministry of Petroleum & Natural Gas in the
discharge of its responsibilities, particularly pricing of petroleum products and administration of subsidy schemes.
3. To monitor and analyze developments in the domestic oil and gas sector.4. To undertake analysis of domestic and international energy markets.5. To develop a cooperative framework for exchange of information and conduct of
studies with other countries and international organizations in the energy sector.
Objectives1. To ensure effective administration of the subsidy schemes notified by the
Government.2. To monitor and analyze trends in prices of crude oil, petroleum products and
natural gas and their impact on the oil companies and consumers, and prepare appropriate technical inputs for policy making.
3. To monitor developments in the domestic market and analyze options for policy changes in pricing, transportation and distribution of petroleum products.
4. To collect, compile and disseminate data on the domestic oil and gas sector in a continuous manner and maintain the data bank.
5. To ensure quality of data in terms of prescribed parameters such as accuracy, completeness and timeliness.
6. To prepare periodic reports on various aspects of oil and gas sector.
Petroleum Planning & Analysis Cell(Ministry of Petroleum & Natural Gas)
Vision & Mission
CONTENTSCHAPTER NO. TITLE PAGE NO.
1 GENERAL
Selected indicators of the Indian economy 2
Global energy consumption 3
2 EXPLORATION & CRUDE OIL PRODUCTION
World top 30 crude oil proved reserves countries 5
World top 30 crude oil producing countries 6
World top 30 crude oil consuming countries 7
World top 30 crude oil refining capacity countries 8
Indigenous crude oil production 9
Self sufficiency in petroleum products 9
Status of blocks under NELP 10
Status of blocks under OALP round of HELP and DSF rounds 10
Domestic oil & gas production vis a vis overseas production 10
Coal Bed Methane (CBM) gas development in India 11
Status of shale gas and oil development in India 11
3 NATURAL GAS
World top 30 natural gas reserves countries 13
World top 30 natural gas producing countries 14
World top 30 natural gas consuming countries 15
Natural gas at a glance 16
Natural gas production 16
CNG / PNG data 17
Chart: State wise distribution of CNG stations 18
CNG sales in India 19
CNG stations and vehicles 20
LNG terminals (Operational) 20
Import of Liquefied Natural Gas (LNG) 21
Domestic natural gas price and gas price ceiling 21
4 REFINING & PRODUCTION
Map of refineries in India 23
Simplified block flow diagram of a typical refinery 24
Refineries: Installed capacity and crude oil processing 25
High Sulphur (HS) & Low Sulphur (LS) crude oil processing 25
Imported crude & indigenous crude oil processing 25
Production of petroleum products 26
Production of petroleum products: All sources 27
Production vis a vis consumption of petroleum products 27
Gross Refining Margins (GRM) of refineries 28
GRM of North East refineries excluding excise duty benefit 28
Distillate yield of PSU refineries 29

Fuel and Loss 30
Specific energy consumption (MBN number) of PSU refineries 30
Import / export of crude oil and petroleum products 31
Exchange rates of Indian rupee (`) 32
5 MAJOR PIPELINES IN INDIA
Map of pipeline network in India 34
Gas pipeline network 35
Existing major crude oil pipelines in India 36
Existing major POL pipelines in India 37
6 SALES
Consumption of petroleum products 39
Chart : All India consumption of petroleum products 39
Consumption growth of petroleum products 40
End-use analysis of HSD sales & diesel consumption by sectors 40
State-wise sales of selected petroleum products 41
PDS SKO allocation 42
Oil industry retail outlets & SKO/LDO agencies 43
Chart: Category wise SKO/LDO agencies 44
Industry marketing infrastructure 44
Chart: All India number of retail ourlets in PSU & private category 45
Chart: Category wise retail outlets 45
Break-up of POL consumption data (PSU and Private) 46
Chart : POL consumption by product 47
Chart : Distribution of total domestic POL sales in India 47
7 LPG
LPG marketing at a glance 49
LPG coverage (estimated) 50
BPL households covered under PMUY scheme 51
LPG domestic customers (14.2 kg/5 kg) enrolment by PSU OMCs 52
Number of LPG distributers (New scheme) 53
8 PRICES AND TAXES
FOB price of Indian basket of crude oil 55
Chart: Trend in spreads of petroleum products vs Indian basket of crude oil 56
Chart: Trend in spreads of international benchmark crude oils 56
Price build-up of PDS kerosene at Mumbai 57
Price build-up of domestic LPG at Delhi 57
Price build-up of petrol at Delhi 57
Price build-up of diesel at Delhi 57
Share of taxes in Retail Selling Price of petrol at Delhi 58
Share of taxes in Retail Selling Price of diesel at Delhi 58
Break up of central excise duty on petrol & diesel 58
Share of taxes in Retail Selling Price of PDS kerosene at Mumbai 59
CHAPTER NO. TITLE PAGE NO.
Share of taxes in Retail Selling Price of domestic LPG at Delhi 59
Weightage of crude oil, natural gas and petroleum products in Wholesale Price Index (WPI) 59
Dealers’ commission on petrol & diesel 60
Wholesale dealers’ commission on PDS kerosene 60
Distributors’ commission on domestic LPG 61
Retail Selling Price of major products in India & neighbouring countries 62
Retail Selling Price & percentage of taxes in RSP in developed countries vis-a-vis India:
62Price & tax in Indian rupees (`)/litre
Price & tax in US dollars ($)/litre
Retail Selling Price of petroleum products at State capitals/UTs 63
Retail Selling Price of PDS kerosene at major cities 63
Customs, excise duty and GST rates on petroleum products 64
Actual rate of sales tax/VAT/GST and other taxes levied by State/UT Governments on major petroleum products
65
Contribution of petroleum sector to exchequer 66
State/UT wise collection of sales tax/VAT by petroleum sector 67
State/UT wise collection of SGST/UTGST by petroleum sector 68
Profit After Tax (PAT) of oil companies 69
Financial details of oil companies 70
Total subsidy/under-recovery on petroleum products & natural gas 71
Quantity and value of Indian crude oil imports 71
9 MISCELLANEOUS
Average international calorific values of different fuels 73
Weight to volume conversion 73
Volume conversion 73
Contents of LPG & Natural Gas 73
Natural Gas conversions 74
Major end use of petroleum products 74
Information about key officers of MoP&NG and PPAC 75
CHAPTER NO. TITLE PAGE NO.
PPAC Ready Reckoner
1
General
Chapter-1
PPAC Ready Reckoner
2
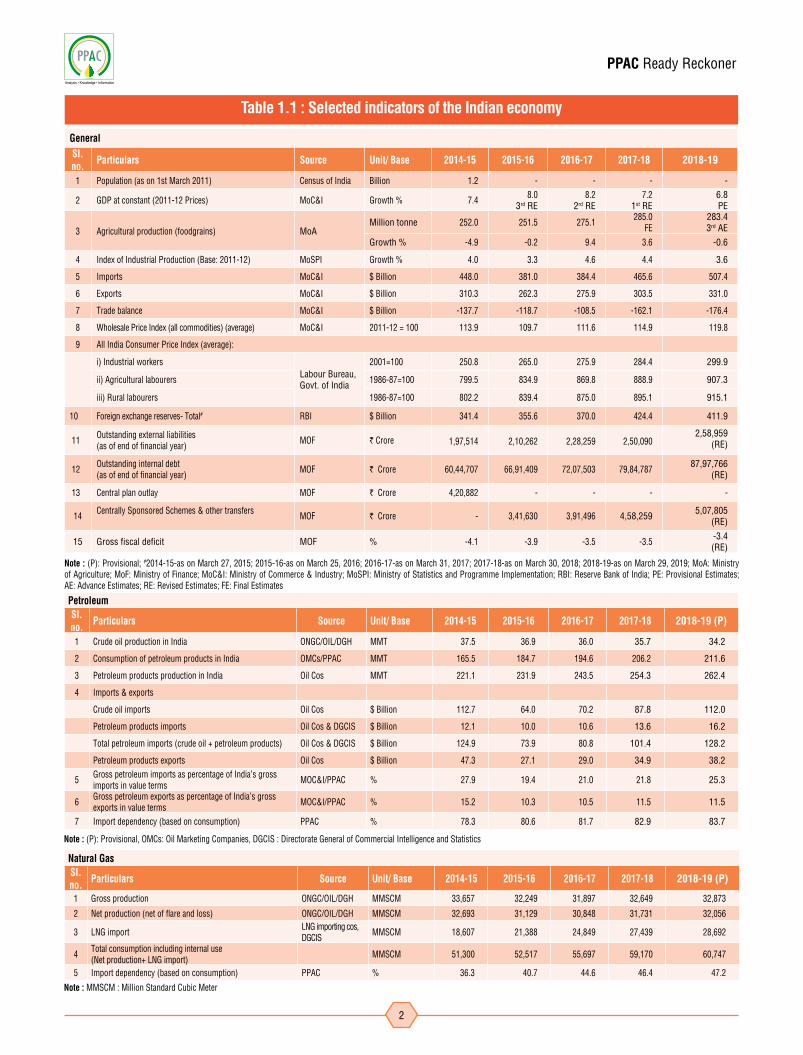
GeneralSl. no. Particulars Source Unit/ Base 2014-15 2015-16 2016-17 2017-18 2018-19
1 Population (as on 1st March 2011) Census of India Billion 1.2 - - - -
2 GDP at constant (2011-12 Prices) MoC&I Growth % 7.4 8.0 3rd RE
8.2 2rd RE
7.2 1st RE
6.8 PE
3 Agricultural production (foodgrains) MoAMillion tonne 252.0 251.5 275.1 285.0
FE283.4 3rd AE
Growth % -4.9 -0.2 9.4 3.6 -0.6
4 Index of Industrial Production (Base: 2011-12) MoSPI Growth % 4.0 3.3 4.6 4.4 3.6
5 Imports MoC&I $ Billion 448.0 381.0 384.4 465.6 507.4
6 Exports MoC&I $ Billion 310.3 262.3 275.9 303.5 331.0
7 Trade balance MoC&I $ Billion -137.7 -118.7 -108.5 -162.1 -176.4
8 Wholesale Price Index (all commodities) (average) MoC&I 2011-12 = 100 113.9 109.7 111.6 114.9 119.8
9 All India Consumer Price Index (average):
i) Industrial workersLabour Bureau, Govt. of India
2001=100 250.8 265.0 275.9 284.4 299.9
ii) Agricultural labourers 1986-87=100 799.5 834.9 869.8 888.9 907.3
iii) Rural labourers 1986-87=100 802.2 839.4 875.0 895.1 915.1
10 Foreign exchange reserves- Total# RBI $ Billion 341.4 355.6 370.0 424.4 411.9
11 Outstanding external liabilities (as of end of financial year) MOF ` Crore 1,97,514 2,10,262 2,28,259 2,50,090
2,58,959(RE)
12 Outstanding internal debt(as of end of financial year) MOF ` Crore 60,44,707 66,91,409 72,07,503 79,84,787 87,97,766
(RE)
13 Central plan outlay MOF ` Crore 4,20,882 - - - -
14 Centrally Sponsored Schemes & other transfers MOF ` Crore - 3,41,630 3,91,496 4,58,259 5,07,805(RE)
15 Gross fiscal deficit MOF % -4.1 -3.9 -3.5 -3.5 -3.4(RE)
PetroleumSl. no. Particulars Source Unit/ Base 2014-15 2015-16 2016-17 2017-18 2018-19 (P)
1 Crude oil production in India ONGC/OIL/DGH MMT 37.5 36.9 36.0 35.7 34.2
2 Consumption of petroleum products in India OMCs/PPAC MMT 165.5 184.7 194.6 206.2 211.6
3 Petroleum products production in India Oil Cos MMT 221.1 231.9 243.5 254.3 262.4
4 Imports & exports
Crude oil imports Oil Cos $ Billion 112.7 64.0 70.2 87.8 112.0
Petroleum products imports Oil Cos & DGCIS $ Billion 12.1 10.0 10.6 13.6 16.2
Total petroleum imports (crude oil + petroleum products) Oil Cos & DGCIS $ Billion 124.9 73.9 80.8 101.4 128.2
Petroleum products exports Oil Cos $ Billion 47.3 27.1 29.0 34.9 38.2
5 Gross petroleum imports as percentage of India's gross imports in value terms MOC&I/PPAC % 27.9 19.4 21.0 21.8 25.3
6 Gross petroleum exports as percentage of India's gross exports in value terms MOC&I/PPAC % 15.2 10.3 10.5 11.5 11.5
7 Import dependency (based on consumption) PPAC % 78.3 80.6 81.7 82.9 83.7
Natural Gas Sl. no. Particulars Source Unit/ Base 2014-15 2015-16 2016-17 2017-18 2018-19 (P)
1 Gross production ONGC/OIL/DGH MMSCM 33,657 32,249 31,897 32,649 32,873
2 Net production (net of flare and loss) ONGC/OIL/DGH MMSCM 32,693 31,129 30,848 31,731 32,056
3 LNG import LNG importing cos, DGCIS MMSCM 18,607 21,388 24,849 27,439 28,692
4 Total consumption including internal use (Net production+ LNG import) MMSCM 51,300 52,517 55,697 59,170 60,747
5 Import dependency (based on consumption) PPAC % 36.3 40.7 44.6 46.4 47.2
Table 1.1 : Selected indicators of the Indian economy
Note : MMSCM : Million Standard Cubic Meter
Note : (P): Provisional; #2014-15-as on March 27, 2015; 2015-16-as on March 25, 2016; 2016-17-as on March 31, 2017; 2017-18-as on March 30, 2018; 2018-19-as on March 29, 2019; MoA: Ministry of Agriculture; MoF: Ministry of Finance; MoC&I: Ministry of Commerce & Industry; MoSPI: Ministry of Statistics and Programme Implementation; RBI: Reserve Bank of India; PE: Provisional Estimates; AE: Advance Estimates; RE: Revised Estimates; FE: Final Estimates
Note : (P): Provisional, OMCs: Oil Marketing Companies, DGCIS : Directorate General of Commercial Intelligence and Statistics

PPAC Ready Reckoner
3
Source: BP Statistical Review of World Energy, June 2019Note: For calculation of per capita consumption population figures have been taken from World Bank International database for 2017.Mtoe: Million tonnes oil equavalent, Toe: Tonnes of oil equivalent
Sl.no. CountryOil Natural Gas Coal Nuclear Energy Hydro Electricity Renewables Total Energy
(Mtoe) (Mtoe) (Mtoe) (Mtoe) (Mtoe) (Mtoe) (Mtoe)
World 4662.1 3309.4 3772.1 611.3 948.8 561.3 13864.9
% share 33.6 23.9 27.2 4.4 6.8 4.0 100.0
Per capita consumption (Toe) 0.62 0.44 0.50 0.08 0.13 0.07 1.84
1 China 641.2 243.3 1906.7 66.6 272.1 143.5 3273.5
% share 19.6 7.4 58.2 2.0 8.3 4.4 100.0
Per capita consumption (Toe) 0.46 0.18 1.38 0.05 0.20 0.10 2.36
2 USA 919.7 702.6 317.0 192.2 65.3 103.8 2300.6
% share 40.0 30.5 13.8 8.4 2.8 4.5 100.0
Per capita consumption (Toe) 2.83 2.16 0.97 0.59 0.20 0.32 7.08
3 India 239.1 49.9 452.2 8.8 31.6 27.5 809.2
% share 29.5 6.2 55.9 1.1 3.9 3.4 100.0
Per capita consumption (Toe) 0.18 0.04 0.34 0.01 0.02 0.02 0.60
4 Russian Federation 152.3 390.8 88.0 46.3 43.0 0.3 720.7
% share 21.1 54.2 12.2 6.4 6.0 0.04 100.0
Per capita consumption (Toe) 1.05 2.70 0.61 0.32 0.30 0.002 4.99
5 Japan 182.4 99.5 117.5 11.1 18.3 25.4 454.1
% share 40.2 21.9 25.9 2.4 4.0 5.6 100.0
Per capita consumption (Toe) 1.44 0.78 0.93 0.09 0.14 0.20 3.58
6 Canada 110.0 99.5 14.4 22.6 87.6 10.3 344.4
% share 31.9 28.9 4.2 6.6 25.4 3.0 100.0
Per capita consumption (Toe) 3.00 2.71 0.39 0.62 2.39 0.28 9.38
7 Germany 113.2 75.9 66.4 17.2 3.8 47.3 323.9
% share 34.9 23.4 20.5 5.3 1.2 14.6 100.0
Per capita consumption (Toe) 1.37 0.92 0.80 0.21 0.05 0.57 3.92
8 South Korea 128.9 48.1 88.2 30.2 0.7 5.0 301.0
% share 42.8 16.0 29.3 10.0 0.2 1.6 100.0
Per capita consumption (Toe) 2.50 0.93 1.71 0.59 0.01 0.10 5.85
9 Brazil 135.9 30.9 15.9 3.5 87.7 23.6 297.6
% share 45.7 10.4 5.3 1.2 29.5 7.9 100.0
Per capita consumption (Toe) 0.65 0.15 0.08 0.02 0.42 0.11 1.42
10 Iran 86.2 193.9 1.5 1.6 2.4 0.1 285.7
% share 30.2 67.9 0.5 0.6 0.9 0.03 100.0
Per capita consumption (Toe) 1.06 2.39 0.02 0.02 0.03 0.001 3.52
11 Saudi Arabia 162.6 96.4 0.1 - - 0.04 259.2
% share 62.8 37.2 0.04 - - 0.01 100.0
Per capita consumption (Toe) 4.94 2.93 0.003 - - 0.001 7.87
12 France 78.9 36.7 8.4 93.5 14.5 10.6 242.6
% share 32.5 15.1 3.5 38.5 6.0 4.4 100.0
Per capita consumption (Toe) 1.18 0.55 0.12 1.39 0.22 0.16 3.62
13 United Kingdom 77.0 67.8 7.6 14.7 1.2 23.9 192.3
% share 40.1 35.3 3.9 7.7 0.6 12.4 100.0
Per capita consumption (Toe) 1.17 1.03 0.11 0.22 0.02 0.36 2.91
14 Mexico 82.8 77.0 11.9 3.1 7.3 4.8 186.9
% share 44.3 41.2 6.4 1.6 3.9 2.6 100.0
Per capita consumption (Toe) 0.64 0.60 0.09 0.02 0.06 0.04 1.45
15 Indonesia 83.4 33.5 61.6 - 3.7 3.3 185.5
% share 45.0 18.1 33.2 - 2.0 1.8 100.0
Per capita consumption (Toe) 0.32 0.13 0.23 - 0.01 0.01 0.70
Table 1.2 : Global energy consumption, 2018

PPAC Ready Reckoner
4
Exploration &Crude Oil Production
Chapter-2
PPAC Ready Reckoner
5
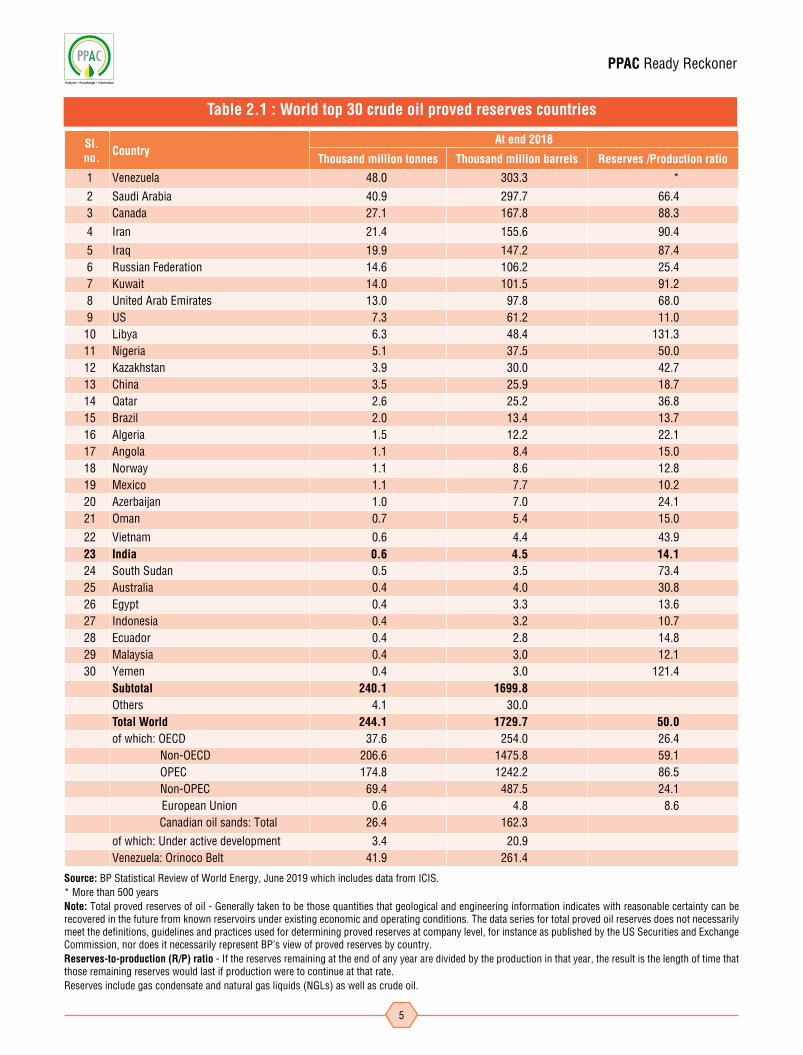
Table 2.1 : World top 30 crude oil proved reserves countries
Sl.no. Country
At end 2018
Thousand million tonnes Thousand million barrels Reserves /Production ratio
1 Venezuela 48.0 303.3 *
2 Saudi Arabia 40.9 297.7 66.43 Canada 27.1 167.8 88.3
4 Iran 21.4 155.6 90.4
5 Iraq 19.9 147.2 87.46 Russian Federation 14.6 106.2 25.47 Kuwait 14.0 101.5 91.28 United Arab Emirates 13.0 97.8 68.09 US 7.3 61.2 11.010 Libya 6.3 48.4 131.311 Nigeria 5.1 37.5 50.012 Kazakhstan 3.9 30.0 42.713 China 3.5 25.9 18.714 Qatar 2.6 25.2 36.815 Brazil 2.0 13.4 13.716 Algeria 1.5 12.2 22.117 Angola 1.1 8.4 15.018 Norway 1.1 8.6 12.819 Mexico 1.1 7.7 10.220 Azerbaijan 1.0 7.0 24.121 Oman 0.7 5.4 15.0
22 Vietnam 0.6 4.4 43.923 India 0.6 4.5 14.124 South Sudan 0.5 3.5 73.425 Australia 0.4 4.0 30.826 Egypt 0.4 3.3 13.627 Indonesia 0.4 3.2 10.728 Ecuador 0.4 2.8 14.829 Malaysia 0.4 3.0 12.130 Yemen 0.4 3.0 121.4
Subtotal 240.1 1699.8Others 4.1 30.0Total World 244.1 1729.7 50.0of which: OECD 37.6 254.0 26.4 Non-OECD 206.6 1475.8 59.1 OPEC 174.8 1242.2 86.5 Non-OPEC 69.4 487.5 24.1
European Union 0.6 4.8 8.6 Canadian oil sands: Total 26.4 162.3
of which: Under active development 3.4 20.9 Venezuela: Orinoco Belt 41.9 261.4
Source: BP Statistical Review of World Energy, June 2019 which includes data from ICIS. * More than 500 years Note: Total proved reserves of oil - Generally taken to be those quantities that geological and engineering information indicates with reasonable certainty can be recovered in the future from known reservoirs under existing economic and operating conditions. The data series for total proved oil reserves does not necessarily meet the definitions, guidelines and practices used for determining proved reserves at company level, for instance as published by the US Securities and Exchange Commission, nor does it necessarily represent BP’s view of proved reserves by country. Reserves-to-production (R/P) ratio - If the reserves remaining at the end of any year are divided by the production in that year, the result is the length of time that those remaining reserves would last if production were to continue at that rate. Reserves include gas condensate and natural gas liquids (NGLs) as well as crude oil.
PPAC Ready Reckoner
6
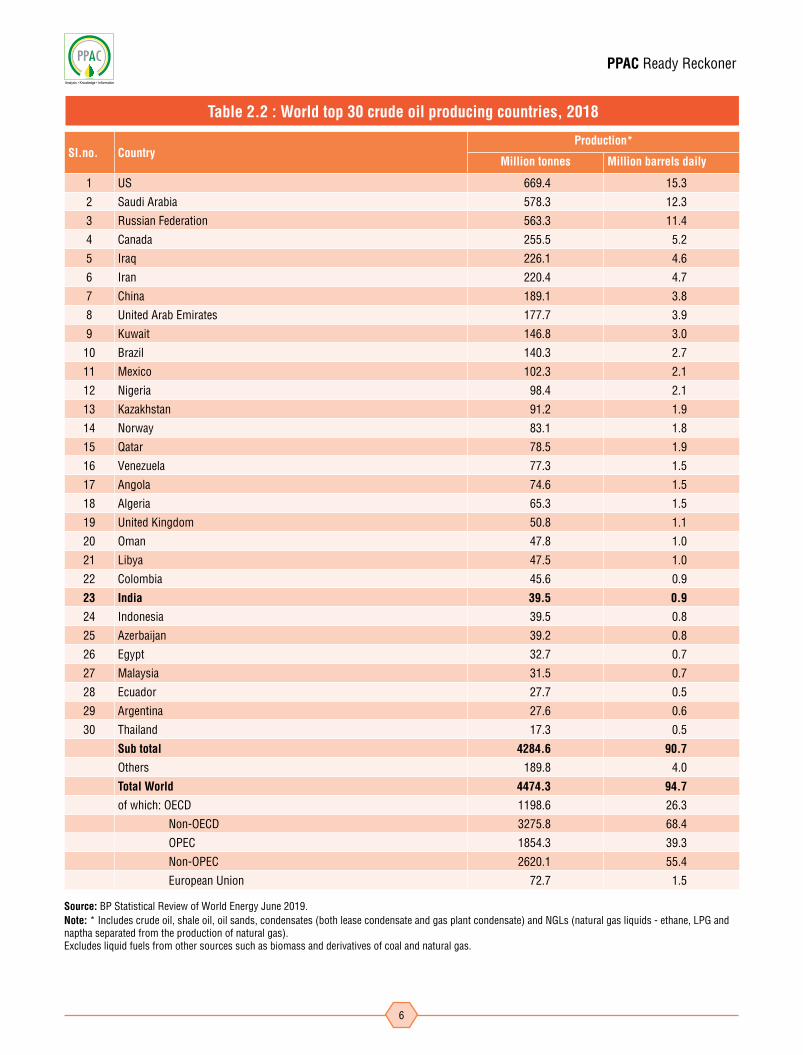
Source: BP Statistical Review of World Energy June 2019.Note: * Includes crude oil, shale oil, oil sands, condensates (both lease condensate and gas plant condensate) and NGLs (natural gas liquids - ethane, LPG and naptha separated from the production of natural gas). Excludes liquid fuels from other sources such as biomass and derivatives of coal and natural gas.
Sl.no. CountryProduction*
Million tonnes Million barrels daily
1 US 669.4 15.3
2 Saudi Arabia 578.3 12.3
3 Russian Federation 563.3 11.4
4 Canada 255.5 5.2
5 Iraq 226.1 4.6
6 Iran 220.4 4.7
7 China 189.1 3.8
8 United Arab Emirates 177.7 3.9
9 Kuwait 146.8 3.0
10 Brazil 140.3 2.7
11 Mexico 102.3 2.1
12 Nigeria 98.4 2.1
13 Kazakhstan 91.2 1.9
14 Norway 83.1 1.8
15 Qatar 78.5 1.9
16 Venezuela 77.3 1.5
17 Angola 74.6 1.5
18 Algeria 65.3 1.5
19 United Kingdom 50.8 1.1
20 Oman 47.8 1.0
21 Libya 47.5 1.0
22 Colombia 45.6 0.9
23 India 39.5 0.9
24 Indonesia 39.5 0.8
25 Azerbaijan 39.2 0.8
26 Egypt 32.7 0.7
27 Malaysia 31.5 0.7
28 Ecuador 27.7 0.5
29 Argentina 27.6 0.6
30 Thailand 17.3 0.5
Sub total 4284.6 90.7
Others 189.8 4.0
Total World 4474.3 94.7
of which: OECD 1198.6 26.3
Non-OECD 3275.8 68.4
OPEC 1854.3 39.3
Non-OPEC 2620.1 55.4
European Union 72.7 1.5
Table 2.2 : World top 30 crude oil producing countries, 2018

PPAC Ready Reckoner
7
Table 2.3 : World top 30 crude oil consuming countries, 2018
Sl. no. CountryConsumption *
Million tonnes Million barrels daily
1 US 892.8 20.5
2 China 628.0 13.5
3 India 236.6 5.2
4 Japan 175.5 3.9
5 Saudi Arabia 156.1 3.7
6 Russian Federation 146.3 3.2
7 Brazil 141.3 3.1
8 South Korea 122.3 2.8
9 Germany 109.2 2.3
10 Canada 105.2 2.4
11 Iran 82.1 1.9
12 Indonesia 80.1 1.8
13 Mexico 78.8 1.8
14 France 76.4 1.6
15 Singapore 75.2 1.4
16 United Kingdom 74.2 1.6
17 Spain 65.7 1.3
18 Thailand 63.1 1.5
19 Italy 59.0 1.3
20 Australia 51.1 1.1
21 Turkey 48.2 1.0
22 Taiwan 48.1 1.1
23 United Arab Emirates 43.3 1.0
24 Netherlands 39.8 0.9
25 Iraq 38.0 0.8
26 Egypt 35.4 0.8
27 Malaysia 34.8 0.8
28 Belgium 33.1 0.7
29 Poland 31.7 0.7
30 Argentina 29.8 0.6
Sub total 3801.2 84.2
Others 728.1 15.6
Total World 4529.3 99.8
of which: OECD 2133.2 47.5
Non-OECD 2396.1 52.4
European Union 629.0 13.3
Source: BP Statistical Review of World Energy, June 2019* Inland demand plus international aviation and marine bunkers and refinery fuel and loss. Consumption of biogasoline (such as ethanol), biodiesel and derivatives of coal and natural gas are also included.Note: Differences between these world consumption figures and world production statistics are accounted for by stock changes, consumption of non-petroleum additives and substitute fuels, and unavoidable disparities in the definition, measurement or conversion of oil supply and demand data.
PPAC Ready Reckoner
8
(Thousand barrels daily)
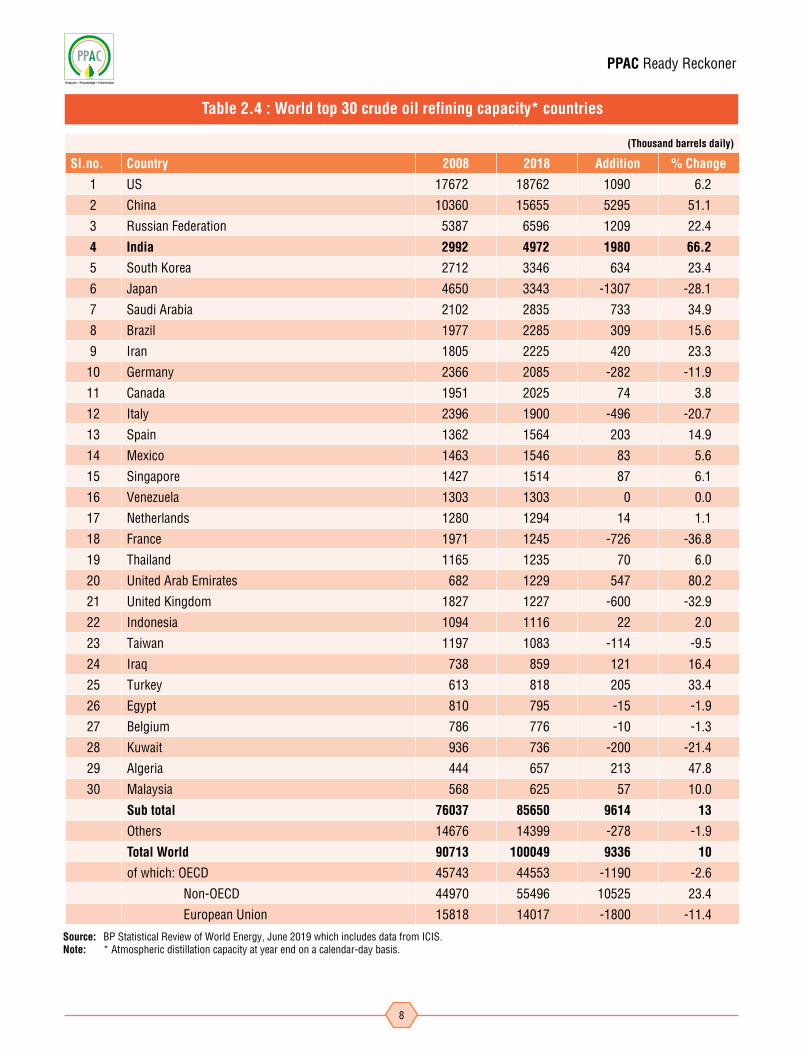
Sl.no. Country 2008 2018 Addition % Change
1 US 17672 18762 1090 6.2
2 China 10360 15655 5295 51.1
3 Russian Federation 5387 6596 1209 22.4
4 India 2992 4972 1980 66.2
5 South Korea 2712 3346 634 23.4
6 Japan 4650 3343 -1307 -28.1
7 Saudi Arabia 2102 2835 733 34.9
8 Brazil 1977 2285 309 15.6
9 Iran 1805 2225 420 23.3
10 Germany 2366 2085 -282 -11.9
11 Canada 1951 2025 74 3.8
12 Italy 2396 1900 -496 -20.7
13 Spain 1362 1564 203 14.9
14 Mexico 1463 1546 83 5.6
15 Singapore 1427 1514 87 6.1
16 Venezuela 1303 1303 0 0.0
17 Netherlands 1280 1294 14 1.1
18 France 1971 1245 -726 -36.8
19 Thailand 1165 1235 70 6.0
20 United Arab Emirates 682 1229 547 80.2
21 United Kingdom 1827 1227 -600 -32.9
22 Indonesia 1094 1116 22 2.0
23 Taiwan 1197 1083 -114 -9.5
24 Iraq 738 859 121 16.4
25 Turkey 613 818 205 33.4
26 Egypt 810 795 -15 -1.9
27 Belgium 786 776 -10 -1.3
28 Kuwait 936 736 -200 -21.4
29 Algeria 444 657 213 47.8
30 Malaysia 568 625 57 10.0
Sub total 76037 85650 9614 13
Others 14676 14399 -278 -1.9
Total World 90713 100049 9336 10
of which: OECD 45743 44553 -1190 -2.6
Non-OECD 44970 55496 10525 23.4
European Union 15818 14017 -1800 -11.4
Table 2.4 : World top 30 crude oil refining capacity* countries
Source: BP Statistical Review of World Energy, June 2019 which includes data from ICIS.Note: * Atmospheric distillation capacity at year end on a calendar-day basis.
PPAC Ready Reckoner
9
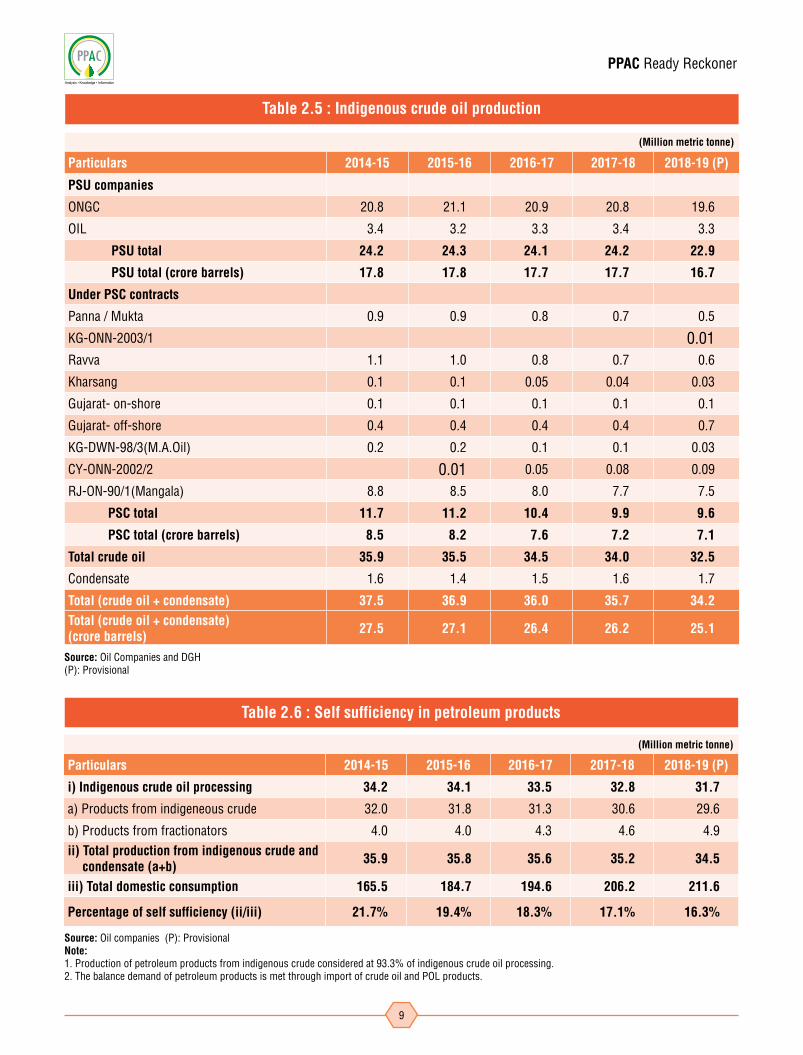
Table 2.5 : Indigenous crude oil production
Table 2.6 : Self sufficiency in petroleum products
(Million metric tonne)
Particulars 2014-15 2015-16 2016-17 2017-18 2018-19 (P)
PSU companies
ONGC 20.8 21.1 20.9 20.8 19.6
OIL 3.4 3.2 3.3 3.4 3.3
PSU total 24.2 24.3 24.1 24.2 22.9
PSU total (crore barrels) 17.8 17.8 17.7 17.7 16.7
Under PSC contracts
Panna / Mukta 0.9 0.9 0.8 0.7 0.5
KG-ONN-2003/1 0.01Ravva 1.1 1.0 0.8 0.7 0.6
Kharsang 0.1 0.1 0.05 0.04 0.03
Gujarat- on-shore 0.1 0.1 0.1 0.1 0.1
Gujarat- off-shore 0.4 0.4 0.4 0.4 0.7
KG-DWN-98/3(M.A.Oil) 0.2 0.2 0.1 0.1 0.03
CY-ONN-2002/2 0.01 0.05 0.08 0.09
RJ-ON-90/1(Mangala) 8.8 8.5 8.0 7.7 7.5
PSC total 11.7 11.2 10.4 9.9 9.6
PSC total (crore barrels) 8.5 8.2 7.6 7.2 7.1
Total crude oil 35.9 35.5 34.5 34.0 32.5
Condensate 1.6 1.4 1.5 1.6 1.7
Total (crude oil + condensate) 37.5 36.9 36.0 35.7 34.2Total (crude oil + condensate) (crore barrels) 27.5 27.1 26.4 26.2 25.1
(Million metric tonne)
Particulars 2014-15 2015-16 2016-17 2017-18 2018-19 (P)
i) Indigenous crude oil processing 34.2 34.1 33.5 32.8 31.7
a) Products from indigeneous crude 32.0 31.8 31.3 30.6 29.6
b) Products from fractionators 4.0 4.0 4.3 4.6 4.9ii) Total production from indigenous crude and
condensate (a+b) 35.9 35.8 35.6 35.2 34.5
iii) Total domestic consumption 165.5 184.7 194.6 206.2 211.6
Percentage of self sufficiency (ii/iii) 21.7% 19.4% 18.3% 17.1% 16.3%
Source: Oil Companies and DGH(P): Provisional
Source: Oil companies (P): ProvisionalNote: 1. Production of petroleum products from indigenous crude considered at 93.3% of indigenous crude oil processing. 2. The balance demand of petroleum products is met through import of crude oil and POL products.

PPAC Ready Reckoner
10
Round Offered
Awarded Relinquished/Proposed for Relinquishment
Operational
Deep water
Shallow water
Onland Total Deep water
Shallow water
Onland Total Deep water
Shallow water
Onland Total
NELP-I 48 7 16 1 24 5 15 1 21 2 1 0 3
NELP-II 25 8 8 7 23 8 7 5 20 0 1 2 3
NELP-III 27 9 6 8 23 9 5 5 19 0 1 3 4
NELP-IV 24 10 0 10 20 10 0 6 16 0 0 4 4
NELP-V 20 6 2 12 20 6 1 9 16 0 1 3 4
NELP-VI 55 21 6 25 52 21 3 18 42 0 3 7 10
NELP-VII 57 11 7 23 41 11 4 15 30 0 3 8 11
NELP-VIII 70 8 13 11 32 8 9 9 26 0 4 2 6
NELP-IX 34 1 7 11 19 1 2 5 8 0 5 6 11
Total 360 81 65 108 254 79 46 73 198 2 19 35 56
Table 2.7 (A) : Status of blocks under NELP (as on 01.04.2019)
Source: DGH
Round Offered
Awarded Relinquished/Proposed for Relinquishment
Operational
Deep water
Shallow water
Onland Total Deep water
Shallow water
Onland Total Deep water
Shallow water
Onland Total
OALP Round-I 55 1 8 46 55 0 0 0 0 1 8 46 55
DSF Round-I 46 0 7 23 30 0 0 3 3 0 7 20 27
DSF Round-II 25 0 9 14 23 0 0 0 0 0 9 14 23
TOTAL 126 1 24 83 108 0 0 3 3 1 24 80 105
Table 2.7 (B) : Status of blocks under OALP round of HELP and DSF rounds (as on 01.04.2019)
Source: DGH
Particulars 2014-15 2015-16 2016-17 2017-18 2018-19 (P)
Total domestic production (MMTOE) 71.1 69.1 67.9 68.3 67.1
Overseas production (MMTOE) 9.9 10.1 17.6 22.7 24.7
Overseas production as percentage of domestic production 14.0 14.6 25.9 33.2 36.8
Table 2.8 : Domestic oil & gas production vis a vis overseas production
Source: ONGC Videsh Ltd., OIL, GAIL, BPRL, IOCL and HPCL
PPAC Ready Reckoner
11
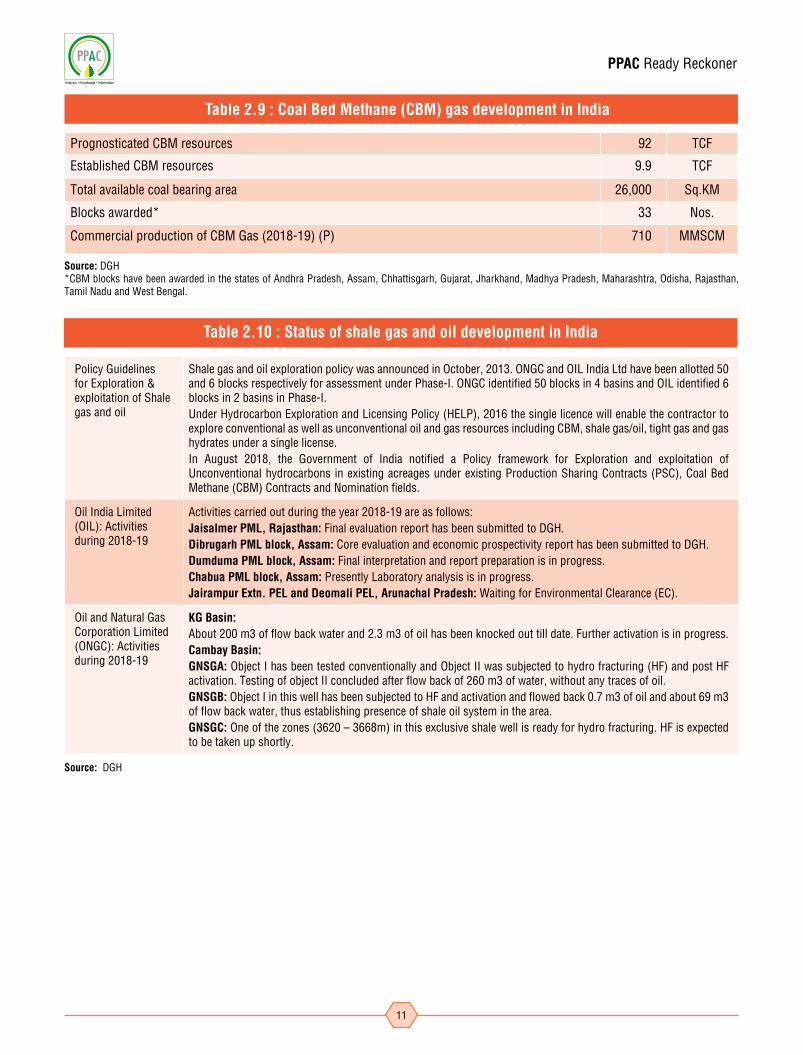
Table 2.9 : Coal Bed Methane (CBM) gas development in India
Prognosticated CBM resources 92 TCF
Established CBM resources 9.9 TCF
Total available coal bearing area 26,000 Sq.KM
Blocks awarded* 33 Nos.
Commercial production of CBM Gas (2018-19) (P) 710 MMSCM
Source: DGH *CBM blocks have been awarded in the states of Andhra Pradesh, Assam, Chhattisgarh, Gujarat, Jharkhand, Madhya Pradesh, Maharashtra, Odisha, Rajasthan, Tamil Nadu and West Bengal.
Policy Guidelines for Exploration & exploitation of Shale gas and oil
Shale gas and oil exploration policy was announced in October, 2013. ONGC and OIL India Ltd have been allotted 50 and 6 blocks respectively for assessment under Phase-I. ONGC identified 50 blocks in 4 basins and OIL identified 6 blocks in 2 basins in Phase-I. Under Hydrocarbon Exploration and Licensing Policy (HELP), 2016 the single licence will enable the contractor to explore conventional as well as unconventional oil and gas resources including CBM, shale gas/oil, tight gas and gas hydrates under a single license.In August 2018, the Government of India notified a Policy framework for Exploration and exploitation of Unconventional hydrocarbons in existing acreages under existing Production Sharing Contracts (PSC), Coal Bed Methane (CBM) Contracts and Nomination fields.
Oil India Limited (OIL): Activities during 2018-19
Activities carried out during the year 2018-19 are as follows: Jaisalmer PML, Rajasthan: Final evaluation report has been submitted to DGH.Dibrugarh PML block, Assam: Core evaluation and economic prospectivity report has been submitted to DGH.Dumduma PML block, Assam: Final interpretation and report preparation is in progress. Chabua PML block, Assam: Presently Laboratory analysis is in progress. Jairampur Extn. PEL and Deomali PEL, Arunachal Pradesh: Waiting for Environmental Clearance (EC).
Oil and Natural Gas Corporation Limited (ONGC): Activities during 2018-19
KG Basin: About 200 m3 of flow back water and 2.3 m3 of oil has been knocked out till date. Further activation is in progress.Cambay Basin:GNSGA: Object I has been tested conventionally and Object II was subjected to hydro fracturing (HF) and post HF activation. Testing of object II concluded after flow back of 260 m3 of water, without any traces of oil. GNSGB: Object I in this well has been subjected to HF and activation and flowed back 0.7 m3 of oil and about 69 m3 of flow back water, thus establishing presence of shale oil system in the area. GNSGC: One of the zones (3620 – 3668m) in this exclusive shale well is ready for hydro fracturing. HF is expected to be taken up shortly.
Table 2.10 : Status of shale gas and oil development in India
Source: DGH
PPAC Ready Reckoner
12
Natural GasChapter-3
PPAC Ready Reckoner
13
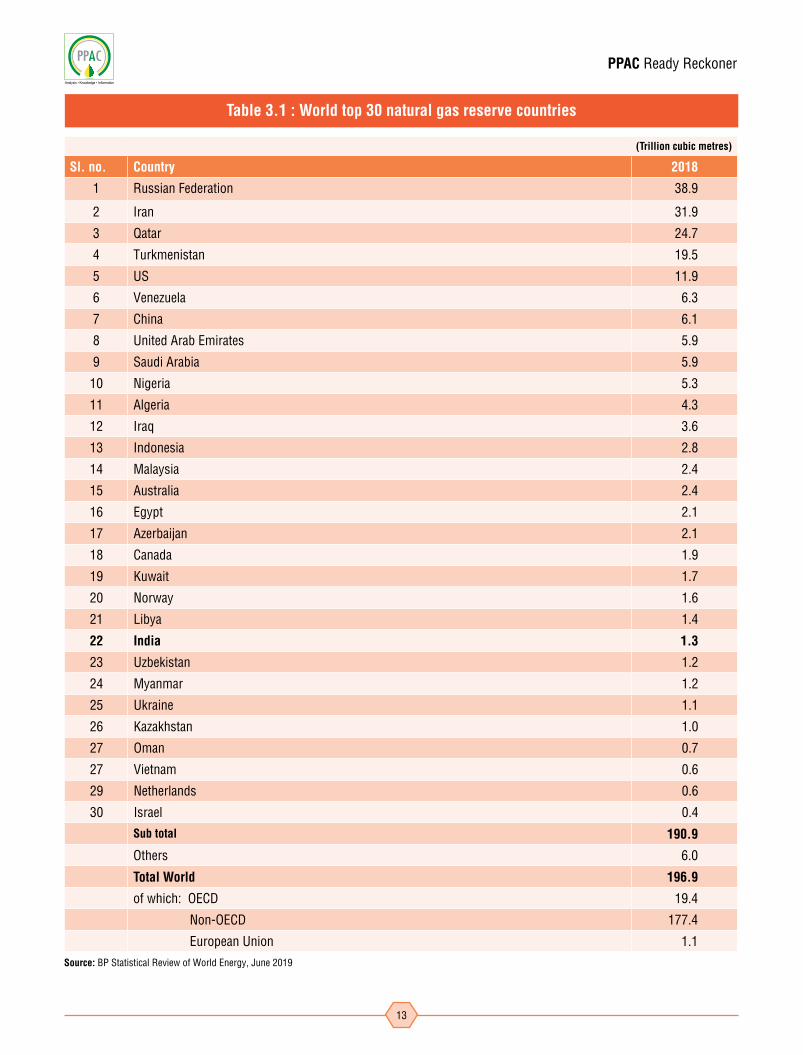
(Trillion cubic metres)
Sl. no. Country 2018
1 Russian Federation 38.9
2 Iran 31.9
3 Qatar 24.7
4 Turkmenistan 19.5
5 US 11.9
6 Venezuela 6.3
7 China 6.1
8 United Arab Emirates 5.9
9 Saudi Arabia 5.9
10 Nigeria 5.3
11 Algeria 4.3
12 Iraq 3.6
13 Indonesia 2.8
14 Malaysia 2.4
15 Australia 2.4
16 Egypt 2.1
17 Azerbaijan 2.1
18 Canada 1.9
19 Kuwait 1.7
20 Norway 1.6
21 Libya 1.4
22 India 1.3
23 Uzbekistan 1.2
24 Myanmar 1.2
25 Ukraine 1.1
26 Kazakhstan 1.0
27 Oman 0.7
27 Vietnam 0.6
29 Netherlands 0.6
30 Israel 0.4
Sub total 190.9
Others 6.0
Total World 196.9
of which: OECD 19.4
Non-OECD 177.4
European Union 1.1
Table 3.1 : World top 30 natural gas reserve countries
Source: BP Statistical Review of World Energy, June 2019
PPAC Ready Reckoner
14
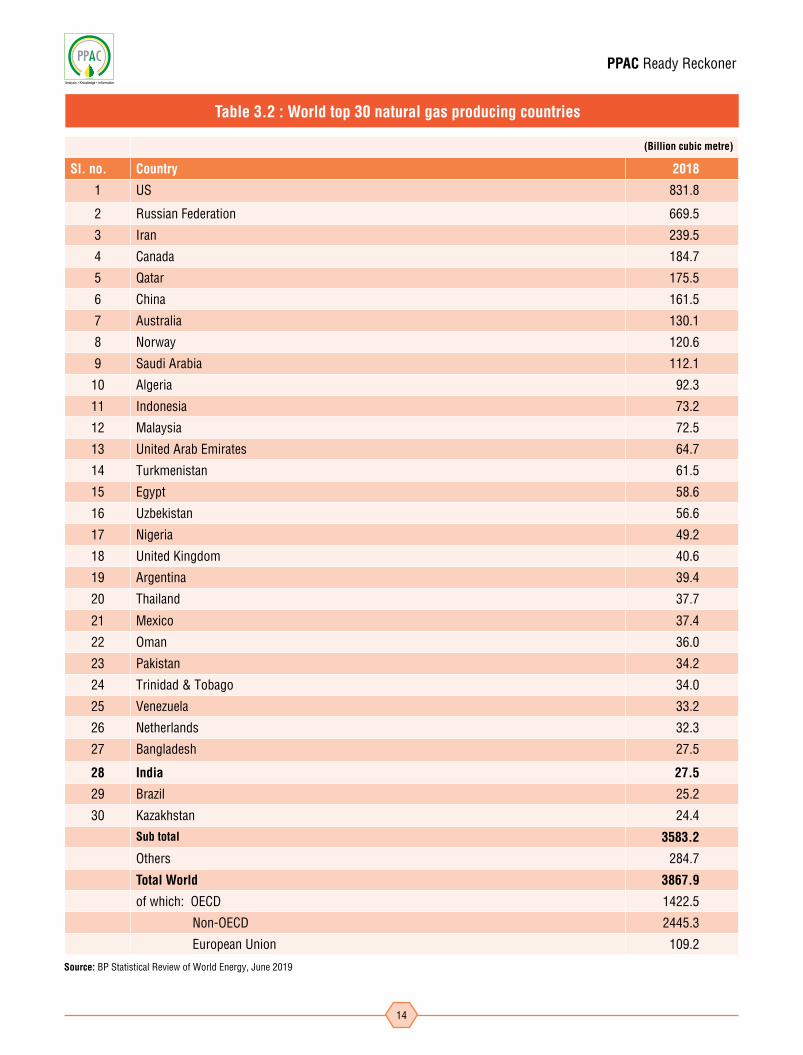
(Billion cubic metre)
Sl. no. Country 2018
1 US 831.8
2 Russian Federation 669.5
3 Iran 239.5
4 Canada 184.7
5 Qatar 175.5
6 China 161.5
7 Australia 130.1
8 Norway 120.6
9 Saudi Arabia 112.1
10 Algeria 92.3
11 Indonesia 73.2
12 Malaysia 72.5
13 United Arab Emirates 64.7
14 Turkmenistan 61.5
15 Egypt 58.6
16 Uzbekistan 56.6
17 Nigeria 49.2
18 United Kingdom 40.6
19 Argentina 39.4
20 Thailand 37.7
21 Mexico 37.4
22 Oman 36.0
23 Pakistan 34.2
24 Trinidad & Tobago 34.0
25 Venezuela 33.2
26 Netherlands 32.3
27 Bangladesh 27.5
28 India 27.5
29 Brazil 25.2
30 Kazakhstan 24.4
Sub total 3583.2
Others 284.7
Total World 3867.9
of which: OECD 1422.5
Non-OECD 2445.3
European Union 109.2
Table 3.2 : World top 30 natural gas producing countries
Source: BP Statistical Review of World Energy, June 2019
PPAC Ready Reckoner
15
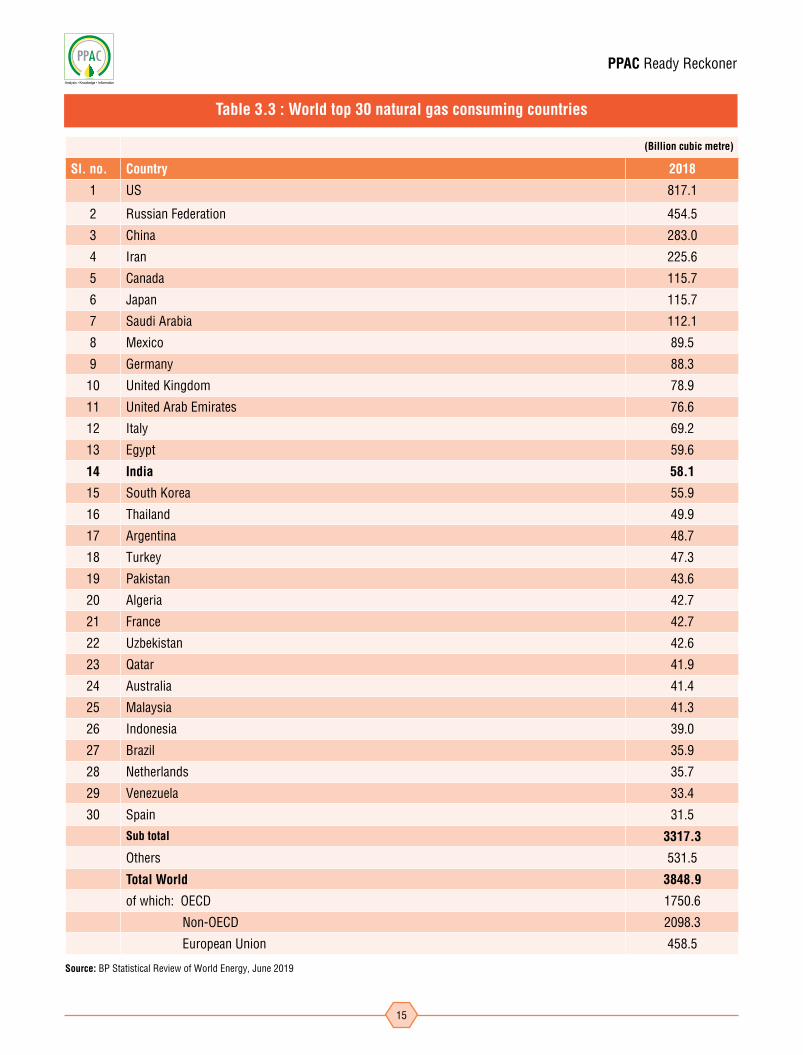
(Billion cubic metre)
Sl. no. Country 2018
1 US 817.1
2 Russian Federation 454.5
3 China 283.0
4 Iran 225.6
5 Canada 115.7
6 Japan 115.7
7 Saudi Arabia 112.1
8 Mexico 89.5
9 Germany 88.3
10 United Kingdom 78.9
11 United Arab Emirates 76.6
12 Italy 69.2
13 Egypt 59.6
14 India 58.1
15 South Korea 55.9
16 Thailand 49.9
17 Argentina 48.7
18 Turkey 47.3
19 Pakistan 43.6
20 Algeria 42.7
21 France 42.7
22 Uzbekistan 42.6
23 Qatar 41.9
24 Australia 41.4
25 Malaysia 41.3
26 Indonesia 39.0
27 Brazil 35.9
28 Netherlands 35.7
29 Venezuela 33.4
30 Spain 31.5
Sub total 3317.3
Others 531.5
Total World 3848.9
of which: OECD 1750.6
Non-OECD 2098.3
European Union 458.5
Table 3.3 : World top 30 natural gas consuming countries
Source: BP Statistical Review of World Energy, June 2019
PPAC Ready Reckoner
16
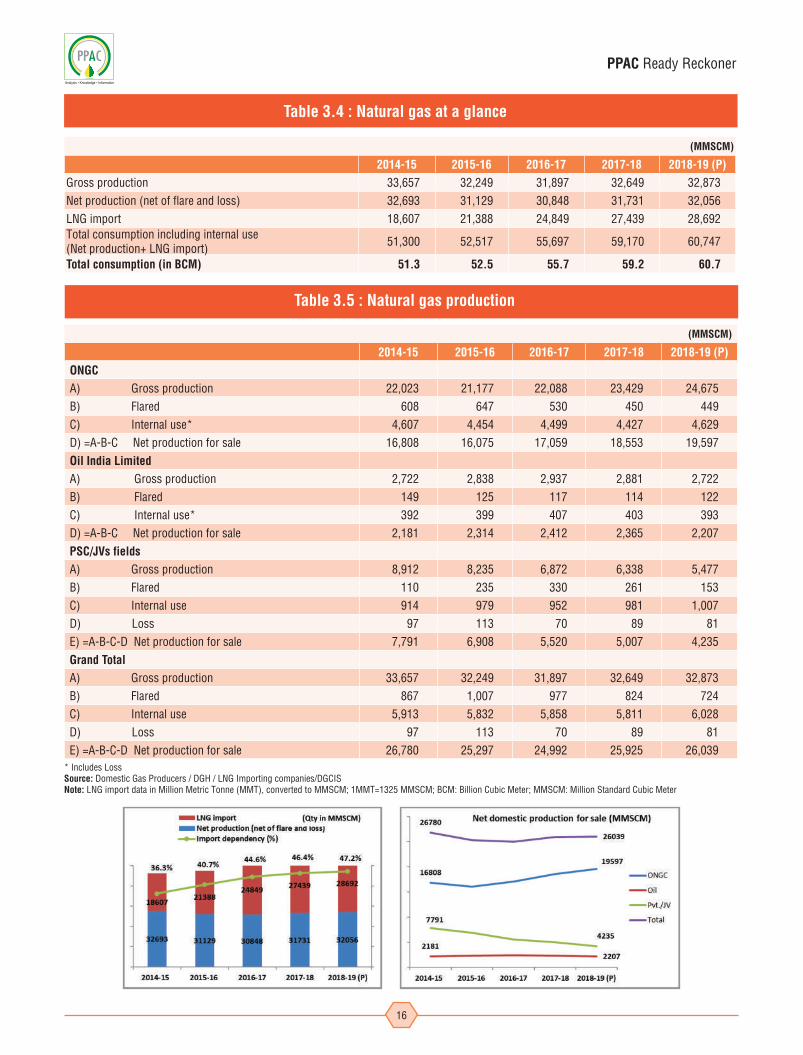
(MMSCM)
2014-15 2015-16 2016-17 2017-18 2018-19 (P)
Gross production 33,657 32,249 31,897 32,649 32,873Net production (net of flare and loss) 32,693 31,129 30,848 31,731 32,056LNG import 18,607 21,388 24,849 27,439 28,692Total consumption including internal use (Net production+ LNG import) 51,300 52,517 55,697 59,170 60,747
Total consumption (in BCM) 51.3 52.5 55.7 59.2 60.7
(MMSCM)
2014-15 2015-16 2016-17 2017-18 2018-19 (P)
ONGC
A) Gross production 22,023 21,177 22,088 23,429 24,675B) Flared 608 647 530 450 449C) Internal use* 4,607 4,454 4,499 4,427 4,629D) =A-B-C Net production for sale 16,808 16,075 17,059 18,553 19,597Oil India Limited
A) Gross production 2,722 2,838 2,937 2,881 2,722B) Flared 149 125 117 114 122C) Internal use* 392 399 407 403 393D) =A-B-C Net production for sale 2,181 2,314 2,412 2,365 2,207PSC/JVs fields
A) Gross production 8,912 8,235 6,872 6,338 5,477B) Flared 110 235 330 261 153C) Internal use 914 979 952 981 1,007D) Loss 97 113 70 89 81E) =A-B-C-D Net production for sale 7,791 6,908 5,520 5,007 4,235Grand Total
A) Gross production 33,657 32,249 31,897 32,649 32,873B) Flared 867 1,007 977 824 724C) Internal use 5,913 5,832 5,858 5,811 6,028D) Loss 97 113 70 89 81E) =A-B-C-D Net production for sale 26,780 25,297 24,992 25,925 26,039
Table 3.4 : Natural gas at a glance
Table 3.5 : Natural gas production
* Includes Loss Source: Domestic Gas Producers / DGH / LNG Importing companies/DGCIS Note: LNG import data in Million Metric Tonne (MMT), converted to MMSCM; 1MMT=1325 MMSCM; BCM: Billion Cubic Meter; MMSCM: Million Standard Cubic Meter

PPAC Ready Reckoner
17
Sl.no. State Geographical area/city covered Entity CNG
stations*PNG connections
Domestic Commercial Industrial
1 Andhra Pradesh
Vijaywada Bhagyanagar Gas Limited 19 5,658 10 0Kakinada Bhagyanagar Gas Limited 6 20,573 85 1West /East Godavari Godavari Gas Pvt.Ltd. 15 322 6 0
Krishna District excl. area already authorized Megha Engineering & Infrastructures Ltd. 4 2,882 19 3
Total 44 29,435 120 4
2 Assam Upper Assam GA Assam Gas Company Limited 0 32,469 1,074 402Total 0 32,469 1,074 402
3 Bihar Patna district GAIL (India) Ltd. 2 0 0 0Total 2 0 0 0
4 Chandigarh Chandigarh GA Indian Oil-Adani Gas Pvt. Ltd. 5 9,598 0 1Total 5 9,598 0 1
5 Daman and Diu Daman Indian Oil-Adani Gas Pvt. Ltd. 3 506 22 9Total 3 506 22 9
6 Delhi/NCR National Capital Territory of Delhi (including Noida & Ghaziabad) Indraprastha Gas Limited 482 10,92,223 2,561 1,751
Total 482 10,92,223 2,561 1,751
7Gujarat and Dadra & Nagar Haveli
Ahmedabad City & Daskroi area excl. already authorized area Adani Gas Ltd. 56 3,73,525 2,490 821
Vadodara rural Adani Gas Ltd. 6 561 1 90Anand area incl. Kanjari and Vadtal villages GA Charotar Gas Sahakari Mandali Ltd 3 27,994 641 118Surat-Bharuch-Ankleswar GA, Nadiad GA, Navsari GA, Rajkot GA, Surendranagar GA, Hazira GA, Valsad GA, Jamnagar GA, Bhavnagar GA, Kutch (West) GA, Amreli District GA, Dahej Vagra Taluka GA, Dahod District GA, Panchmahal District GA, Anand (excluding area authorised) district GA
Gujarat Gas Limited 338 13,51,340 12,275 3,523
Ahmedabad district GA HPCL (Only CNG) 22 0 0 0Banaskantha / Palanpur district IRM Energy Pvt. Ltd. 20 9,250 31 4Gandhinagar, Mehsana & Sabarkantha GA Sabarmati Gas Ltd. 74 1,51,309 725 326Patan district GA Sabarmati Gas Ltd. 14 3,629 0 0
Vadodara DistrictVadodara Gas Limited (Previously Vadodara Mahanagar Seva Sadan) VMSS
12 1,21,273 2,538 0
Dadra & Nagar Haveli GA Gujarat Gas Limited 3 2,676 18 15Total 548 20,41,557 18,719 4,897
8 Haryana
Faridabad district Adani Gas Limited 15 61,468 115 281Sonipat district Gail Gas Limited 8 8,252 27 87Gurugram district Haryana City Gas Distribution Ltd 27 17,801 133 68Panipat district Indian Oil-Adani Gas Pvt. Ltd. 3 1,484 1 5Gurugram district Indraprastha Gas Limited 1 6,209 5 1Rewari district Indraprastha Gas Limited 10 3,679 0 19Nuh and Palwal districts Adani Gas Limited 2 0 0 25
Total 66 98,893 281 486
9 Karnataka
Bengaluru rural and urban district GA Gail Gas Ltd. 12 11,076 84 61
Tumkur district GA Megha Engineering & Infrastructures Ltd. 0 3,676 25 9
Belgaum district GA Megha Engineering & Infrastructures Ltd. 0 2,108 15 5
Dharwad district Indian Oil-Adani Gas Pvt. Ltd. 1 0 0 0Total 13 16,860 124 75
10 Kerala Ernakulam district Indian Oil-Adani Gas Pvt. Ltd. 4 1,032 10 1Total 4 1,032 10 1
11 Madhya Pradesh
Indore GA incl. Ujjian city Aavantika Gas 29 37,967 77 157Gwalior GA Aavantika Gas 10 13,236 36 2Dewas Gail Gas Ltd. 3 4,907 20 30Vijaipur Gail Gas Ltd. 1 0 0 0
Total 43 56,110 133 189
Table 3.6 : CNG / PNG data as on 01.04.2019

PPAC Ready Reckoner
18
12 Maharashtra
Pune City including Pimpri Chinchwad along with adjoining contiguous areas of Hinjewadi, Chakan & Talegaon GA
Maharashtra Natural Gas Limited 67 1,69,407 302 185
Mumbai, Greater Mumbai, Thane Urban, Mira Bhayender, Navi Mumbai, Ambernath, Bhiwandi, Kalyan, Dombivli, Badlapur, Ulhasnagar, Panvel, Kharghar & Taloja, Raigarh District GA excl area already authorized
Mahanagar Gas Limited 236 12,83,284 3,754 71
Palghar district and Thane rural GA Gujarat Gas Limited 6 188 8 3
Pune excluding areas already authorized Mahesh Gas Ltd. 2 0 0 1
Ratnagiri Unison Enviro Pvt Ltd. 2 23 0 0
Total 313 14,52,902 4,064 260
13 OdishaKhorda district GA GAIL (India) Ltd. 4 225 0 0Cuttack district GA GAIL (India) Ltd. 2 0 0 0
Total 6 225 0 014 Punjab Fatehgarh Sahib district IRM Energy Pvt. Ltd. 3 400 1 11
Amritsar GSPL 3 0 0 0Total 6 400 1 11
15 RajasthanKota Rajasthan State Gas Limited 3 2,160 11 14Neemrana & Kukas Rajasthan State Gas Limited 2 0 1 0
Total 5 2,160 12 1416 Telangana Hyderabad Bhagyanagar Gas Limited 45 10,579 12 17
Total 45 10,579 12 17
17 Tripura Agartala Tripura Natural Gas Company Limited 9 39,743 415 49
Total 9 39,743 415 49
18 Uttar Pradesh
Khurja GA Adani Gas Ltd. 1 11,309 3 139Kanpur GA Central UP Gas Ltd 29 39,316 140 55Bareilly GA Central UP Gas Ltd 9 17,290 102 15Meerut Gail Gas Ltd. 10 8,243 20 31Firozabad (TTZ) GA Gail Gas Ltd. 9 916 0 340Lucknow district Green Gas Ltd 29 34,917 45 10Agra Green Gas Ltd 20 32,442 50 19Allahabad GA Indian Oil-Adani Gas Pvt. Ltd. 4 2,778 1 0Mathura Sanwaria Gas Ltd 9 4,345 67 36Moradabad GA SITI Energy Limited 3 3,847 59 6Dibiyapur Gail Gas Ltd. 1 0 0 0Varanasi district GAIL (India) Ltd. 3 2,100 8 0Auraiya,Kanpur Dehat & Etawah districts Torrent Gas Pvt Ltd 1 0 0 0
Total 128 1,57,503 495 651
19 UttarakhandUdham Singh Nagar district Indian Oil-Adani Gas Pvt. Ltd. 1 773 3 6Haridwar district GA HNGPL 0 220 0 0
Total 1 993 3 6
20 West Bengal Kultora, Asansol, Raniganj, Durgapur Great Eastern Energy Corporation Limited 7 0 0 0
Total 7 0 0 0Grand Total 1,730 50,43,188 28,046 8,823
Table 3.6 : Continued
Sl.no. State Geographical area/city covered Entity CNG
stations*PNG connections
Domestic Commercial Industrial
* OperationalSource : CGD companies
Nearly 90% of CNG stations in India are in the states/UT of Gujarat & DNH, Delhi (including Noida and Ghaziabad), Maharashtra, Uttar Pradesh and Haryana.
PPAC Ready Reckoner
19
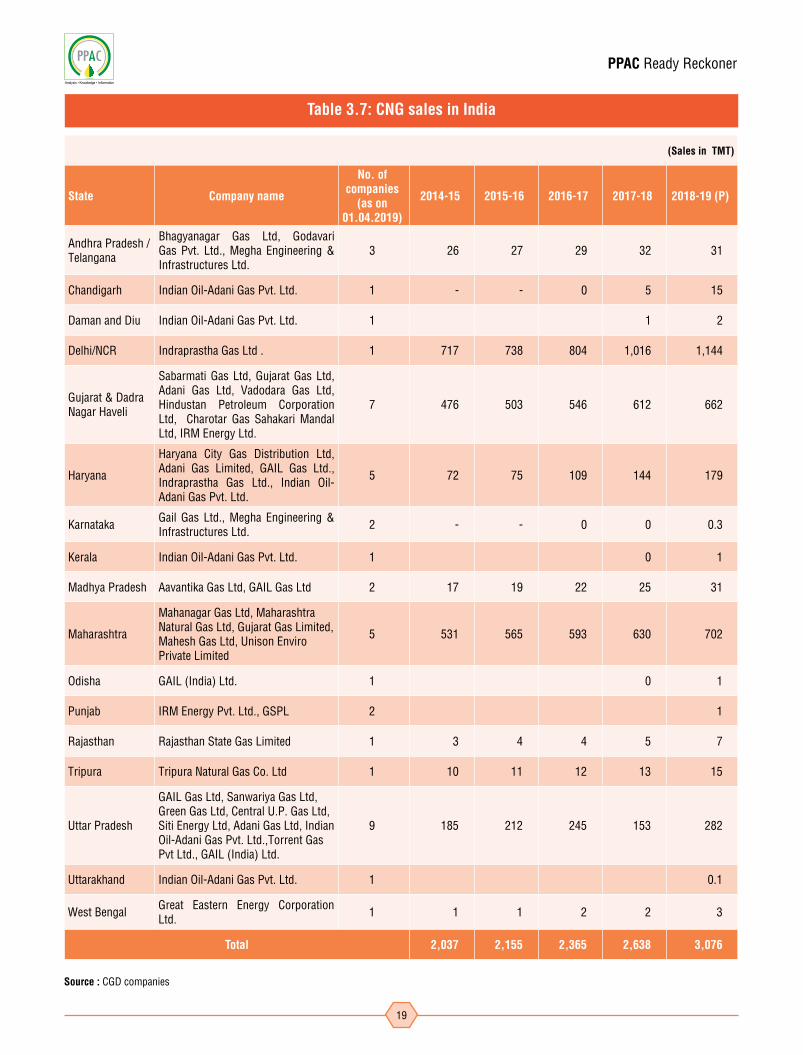
(Sales in TMT)
State Company name
No. of companies
(as on 01.04.2019)
2014-15 2015-16 2016-17 2017-18 2018-19 (P)
Andhra Pradesh / Telangana
Bhagyanagar Gas Ltd, Godavari Gas Pvt. Ltd., Megha Engineering & Infrastructures Ltd.
3 26 27 29 32 31
Chandigarh Indian Oil-Adani Gas Pvt. Ltd. 1 - - 0 5 15
Daman and Diu Indian Oil-Adani Gas Pvt. Ltd. 1 1 2
Delhi/NCR Indraprastha Gas Ltd . 1 717 738 804 1,016 1,144
Gujarat & Dadra Nagar Haveli
Sabarmati Gas Ltd, Gujarat Gas Ltd, Adani Gas Ltd, Vadodara Gas Ltd, Hindustan Petroleum Corporation Ltd, Charotar Gas Sahakari Mandal Ltd, IRM Energy Ltd.
7 476 503 546 612 662
Haryana
Haryana City Gas Distribution Ltd, Adani Gas Limited, GAIL Gas Ltd., Indraprastha Gas Ltd., Indian Oil-Adani Gas Pvt. Ltd.
5 72 75 109 144 179
Karnataka Gail Gas Ltd., Megha Engineering & Infrastructures Ltd. 2 - - 0 0 0.3
Kerala Indian Oil-Adani Gas Pvt. Ltd. 1 0 1
Madhya Pradesh Aavantika Gas Ltd, GAIL Gas Ltd 2 17 19 22 25 31
Maharashtra
Mahanagar Gas Ltd, Maharashtra Natural Gas Ltd, Gujarat Gas Limited, Mahesh Gas Ltd, Unison Enviro Private Limited
5 531 565 593 630 702
Odisha GAIL (India) Ltd. 1 0 1
Punjab IRM Energy Pvt. Ltd., GSPL 2 1
Rajasthan Rajasthan State Gas Limited 1 3 4 4 5 7
Tripura Tripura Natural Gas Co. Ltd 1 10 11 12 13 15
Uttar Pradesh
GAIL Gas Ltd, Sanwariya Gas Ltd, Green Gas Ltd, Central U.P. Gas Ltd, Siti Energy Ltd, Adani Gas Ltd, Indian Oil-Adani Gas Pvt. Ltd.,Torrent Gas Pvt Ltd., GAIL (India) Ltd.
9 185 212 245 153 282
Uttarakhand Indian Oil-Adani Gas Pvt. Ltd. 1 0.1
West Bengal Great Eastern Energy Corporation Ltd. 1 1 1 2 2 3
Total 2,037 2,155 2,365 2,638 3,076
Table 3.7: CNG sales in India
Source : CGD companies
PPAC Ready Reckoner
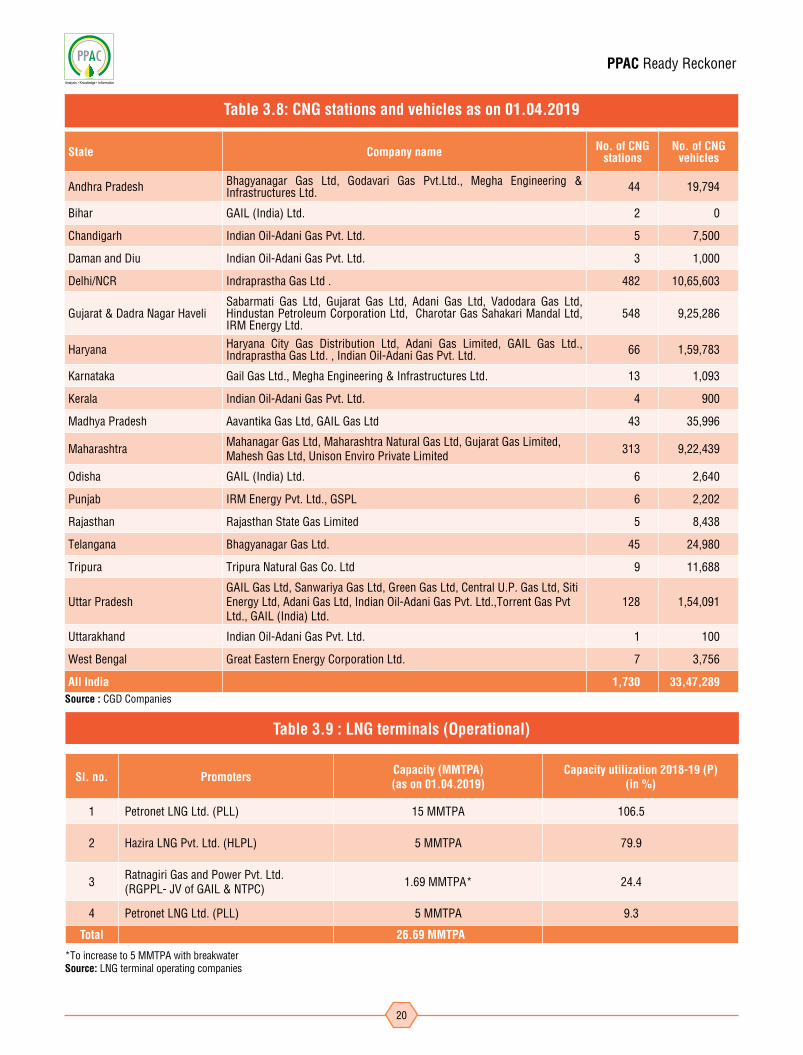
20
Sl. no. Promoters Capacity (MMTPA) (as on 01.04.2019)
Capacity utilization 2018-19 (P) (in %)
1 Petronet LNG Ltd. (PLL) 15 MMTPA 106.5
2 Hazira LNG Pvt. Ltd. (HLPL) 5 MMTPA 79.9
3 Ratnagiri Gas and Power Pvt. Ltd. (RGPPL- JV of GAIL & NTPC) 1.69 MMTPA* 24.4
4 Petronet LNG Ltd. (PLL) 5 MMTPA 9.3
Total 26.69 MMTPA
Table 3.9 : LNG terminals (Operational)
*To increase to 5 MMTPA with breakwaterSource: LNG terminal operating companies
State Company name No. of CNG stations
No. of CNG vehicles
Andhra Pradesh Bhagyanagar Gas Ltd, Godavari Gas Pvt.Ltd., Megha Engineering & Infrastructures Ltd. 44 19,794
Bihar GAIL (India) Ltd. 2 0
Chandigarh Indian Oil-Adani Gas Pvt. Ltd. 5 7,500
Daman and Diu Indian Oil-Adani Gas Pvt. Ltd. 3 1,000
Delhi/NCR Indraprastha Gas Ltd . 482 10,65,603
Gujarat & Dadra Nagar HaveliSabarmati Gas Ltd, Gujarat Gas Ltd, Adani Gas Ltd, Vadodara Gas Ltd, Hindustan Petroleum Corporation Ltd, Charotar Gas Sahakari Mandal Ltd, IRM Energy Ltd.
548 9,25,286
Haryana Haryana City Gas Distribution Ltd, Adani Gas Limited, GAIL Gas Ltd., Indraprastha Gas Ltd. , Indian Oil-Adani Gas Pvt. Ltd. 66 1,59,783
Karnataka Gail Gas Ltd., Megha Engineering & Infrastructures Ltd. 13 1,093
Kerala Indian Oil-Adani Gas Pvt. Ltd. 4 900
Madhya Pradesh Aavantika Gas Ltd, GAIL Gas Ltd 43 35,996
Maharashtra Mahanagar Gas Ltd, Maharashtra Natural Gas Ltd, Gujarat Gas Limited, Mahesh Gas Ltd, Unison Enviro Private Limited 313 9,22,439
Odisha GAIL (India) Ltd. 6 2,640
Punjab IRM Energy Pvt. Ltd., GSPL 6 2,202
Rajasthan Rajasthan State Gas Limited 5 8,438
Telangana Bhagyanagar Gas Ltd. 45 24,980
Tripura Tripura Natural Gas Co. Ltd 9 11,688
Uttar PradeshGAIL Gas Ltd, Sanwariya Gas Ltd, Green Gas Ltd, Central U.P. Gas Ltd, Siti Energy Ltd, Adani Gas Ltd, Indian Oil-Adani Gas Pvt. Ltd.,Torrent Gas Pvt Ltd., GAIL (India) Ltd.
128 1,54,091
Uttarakhand Indian Oil-Adani Gas Pvt. Ltd. 1 100
West Bengal Great Eastern Energy Corporation Ltd. 7 3,756
All India 1,730 33,47,289
Table 3.8: CNG stations and vehicles as on 01.04.2019
Source : CGD Companies
PPAC Ready Reckoner
2121
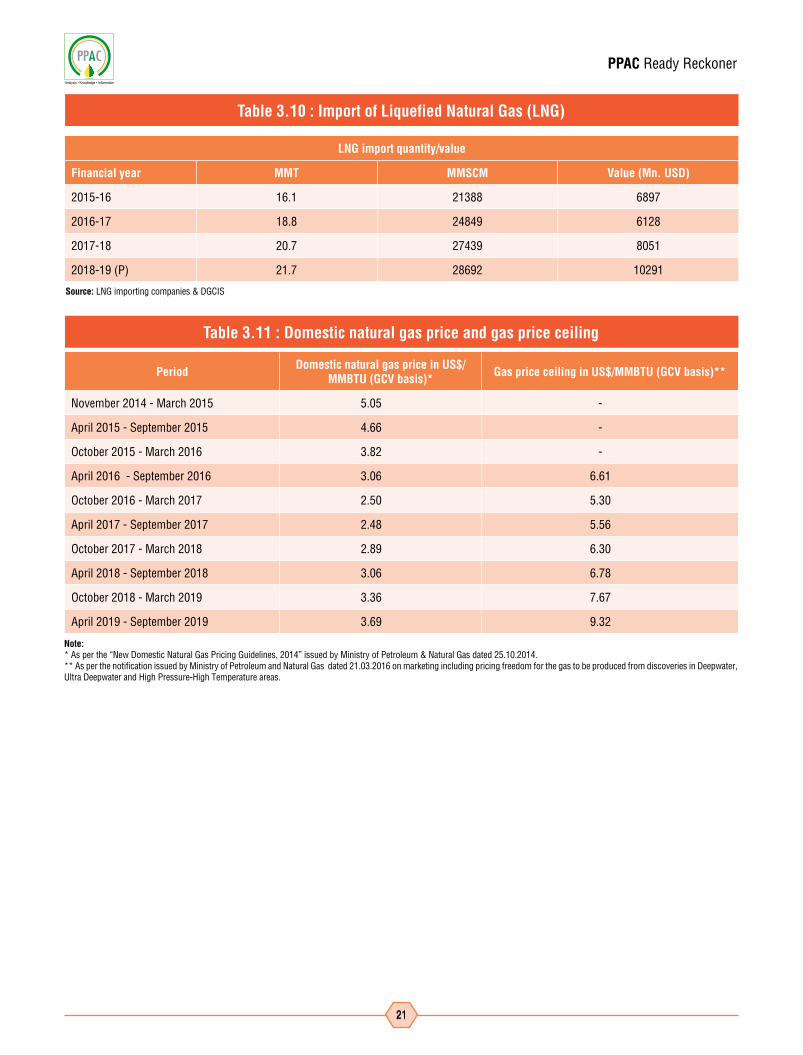
Source: LNG importing companies & DGCIS
Period Domestic natural gas price in US$/MMBTU (GCV basis)* Gas price ceiling in US$/MMBTU (GCV basis)**
November 2014 - March 2015 5.05 -
April 2015 - September 2015 4.66 -
October 2015 - March 2016 3.82 -
April 2016 - September 2016 3.06 6.61
October 2016 - March 2017 2.50 5.30
April 2017 - September 2017 2.48 5.56
October 2017 - March 2018 2.89 6.30
April 2018 - September 2018 3.06 6.78
October 2018 - March 2019 3.36 7.67
April 2019 - September 2019 3.69 9.32
Table 3.11 : Domestic natural gas price and gas price ceiling
Note:* As per the “New Domestic Natural Gas Pricing Guidelines, 2014” issued by Ministry of Petroleum & Natural Gas dated 25.10.2014.** As per the notification issued by Ministry of Petroleum and Natural Gas dated 21.03.2016 on marketing including pricing freedom for the gas to be produced from discoveries in Deepwater, Ultra Deepwater and High Pressure-High Temperature areas.
LNG import quantity/value
Financial year MMT MMSCM Value (Mn. USD)
2015-16 16.1 21388 6897
2016-17 18.8 24849 6128
2017-18 20.7 27439 8051
2018-19 (P) 21.7 28692 10291
Table 3.10 : Import of Liquefied Natural Gas (LNG)

PPAC Ready Reckoner
22
Refining & Production
Chapter-4
PPAC Ready Reckoner
2323
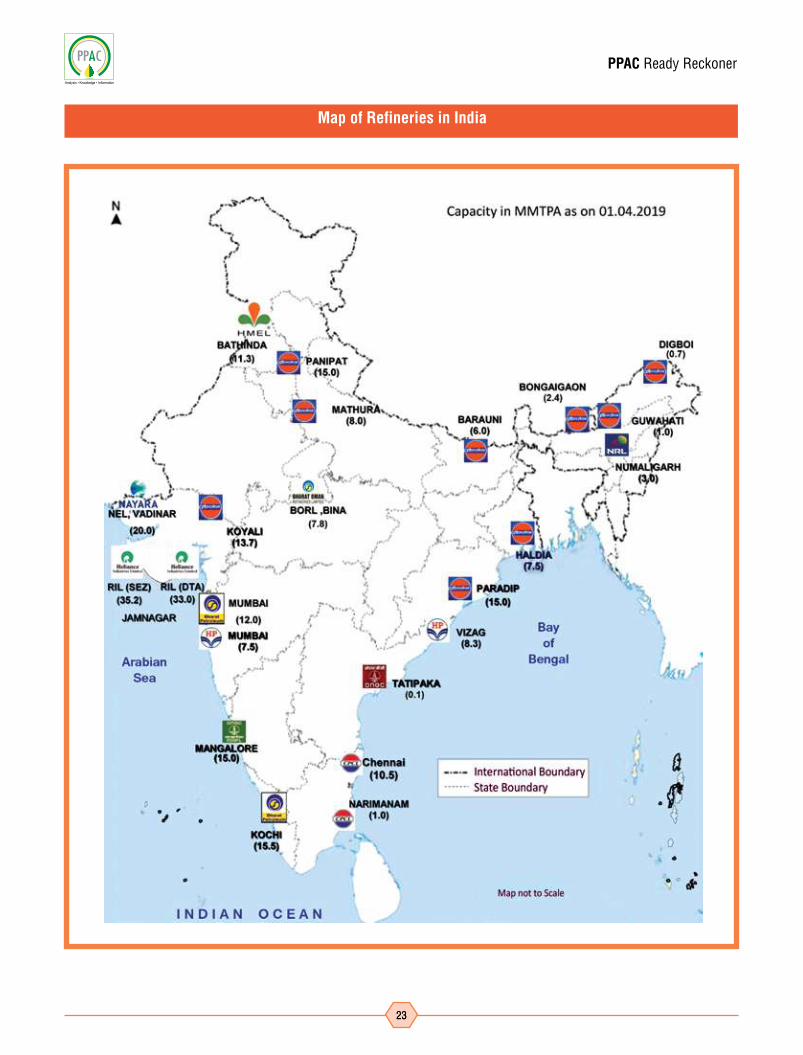
Map of Refineries in India
PPAC Ready Reckoner
24
PPAC Ready Reckoner
25
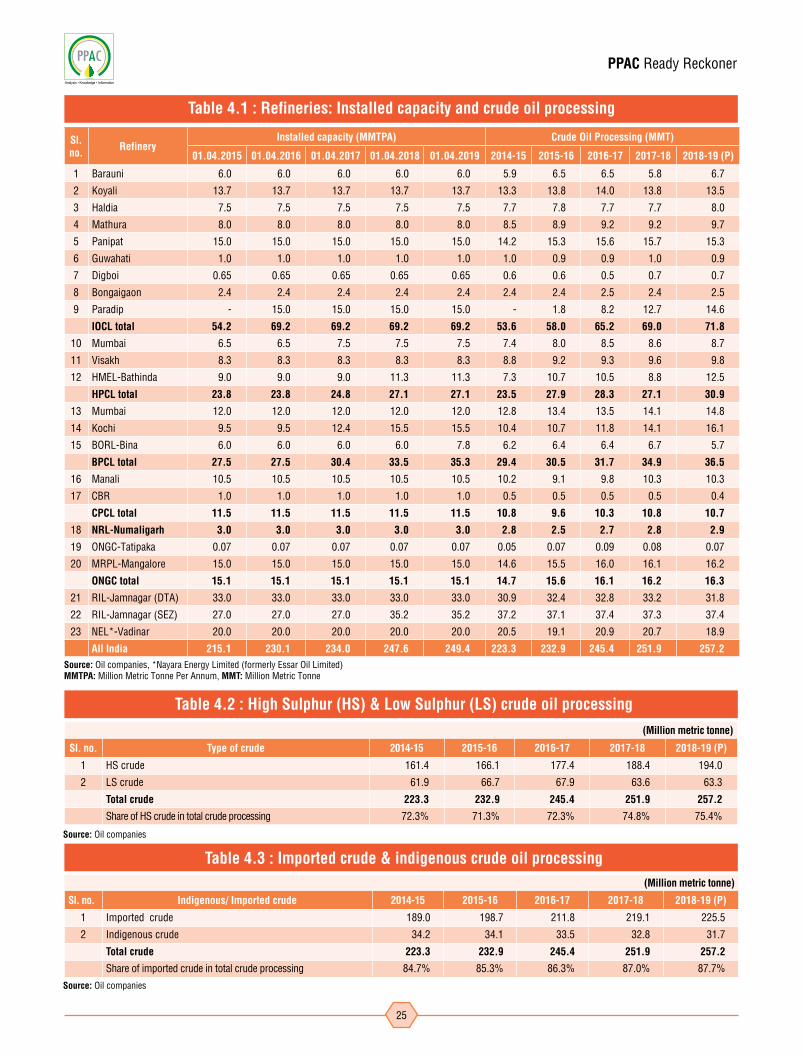
Sl. no. Refinery
Installed capacity (MMTPA) Crude Oil Processing (MMT)
01.04.2015 01.04.2016 01.04.2017 01.04.2018 01.04.2019 2014-15 2015-16 2016-17 2017-18 2018-19 (P)
1 Barauni 6.0 6.0 6.0 6.0 6.0 5.9 6.5 6.5 5.8 6.7
2 Koyali 13.7 13.7 13.7 13.7 13.7 13.3 13.8 14.0 13.8 13.5
3 Haldia 7.5 7.5 7.5 7.5 7.5 7.7 7.8 7.7 7.7 8.0
4 Mathura 8.0 8.0 8.0 8.0 8.0 8.5 8.9 9.2 9.2 9.7
5 Panipat 15.0 15.0 15.0 15.0 15.0 14.2 15.3 15.6 15.7 15.3
6 Guwahati 1.0 1.0 1.0 1.0 1.0 1.0 0.9 0.9 1.0 0.9
7 Digboi 0.65 0.65 0.65 0.65 0.65 0.6 0.6 0.5 0.7 0.7
8 Bongaigaon 2.4 2.4 2.4 2.4 2.4 2.4 2.4 2.5 2.4 2.5
9 Paradip - 15.0 15.0 15.0 15.0 - 1.8 8.2 12.7 14.6
IOCL total 54.2 69.2 69.2 69.2 69.2 53.6 58.0 65.2 69.0 71.8
10 Mumbai 6.5 6.5 7.5 7.5 7.5 7.4 8.0 8.5 8.6 8.7
11 Visakh 8.3 8.3 8.3 8.3 8.3 8.8 9.2 9.3 9.6 9.8
12 HMEL-Bathinda 9.0 9.0 9.0 11.3 11.3 7.3 10.7 10.5 8.8 12.5
HPCL total 23.8 23.8 24.8 27.1 27.1 23.5 27.9 28.3 27.1 30.9
13 Mumbai 12.0 12.0 12.0 12.0 12.0 12.8 13.4 13.5 14.1 14.8
14 Kochi 9.5 9.5 12.4 15.5 15.5 10.4 10.7 11.8 14.1 16.1
15 BORL-Bina 6.0 6.0 6.0 6.0 7.8 6.2 6.4 6.4 6.7 5.7
BPCL total 27.5 27.5 30.4 33.5 35.3 29.4 30.5 31.7 34.9 36.5
16 Manali 10.5 10.5 10.5 10.5 10.5 10.2 9.1 9.8 10.3 10.3
17 CBR 1.0 1.0 1.0 1.0 1.0 0.5 0.5 0.5 0.5 0.4
CPCL total 11.5 11.5 11.5 11.5 11.5 10.8 9.6 10.3 10.8 10.7
18 NRL-Numaligarh 3.0 3.0 3.0 3.0 3.0 2.8 2.5 2.7 2.8 2.9
19 ONGC-Tatipaka 0.07 0.07 0.07 0.07 0.07 0.05 0.07 0.09 0.08 0.07
20 MRPL-Mangalore 15.0 15.0 15.0 15.0 15.0 14.6 15.5 16.0 16.1 16.2
ONGC total 15.1 15.1 15.1 15.1 15.1 14.7 15.6 16.1 16.2 16.3
21 RIL-Jamnagar (DTA) 33.0 33.0 33.0 33.0 33.0 30.9 32.4 32.8 33.2 31.8
22 RIL-Jamnagar (SEZ) 27.0 27.0 27.0 35.2 35.2 37.2 37.1 37.4 37.3 37.4
23 NEL*-Vadinar 20.0 20.0 20.0 20.0 20.0 20.5 19.1 20.9 20.7 18.9
All India 215.1 230.1 234.0 247.6 249.4 223.3 232.9 245.4 251.9 257.2
Table 4.1 : Refineries: Installed capacity and crude oil processing
(Million metric tonne)
Sl. no. Type of crude 2014-15 2015-16 2016-17 2017-18 2018-19 (P)
1 HS crude 161.4 166.1 177.4 188.4 194.0
2 LS crude 61.9 66.7 67.9 63.6 63.3
Total crude 223.3 232.9 245.4 251.9 257.2
Share of HS crude in total crude processing 72.3% 71.3% 72.3% 74.8% 75.4%
(Million metric tonne)
Sl. no. Indigenous/ Imported crude 2014-15 2015-16 2016-17 2017-18 2018-19 (P)
1 Imported crude 189.0 198.7 211.8 219.1 225.5
2 Indigenous crude 34.2 34.1 33.5 32.8 31.7
Total crude 223.3 232.9 245.4 251.9 257.2
Share of imported crude in total crude processing 84.7% 85.3% 86.3% 87.0% 87.7%
Table 4.2 : High Sulphur (HS) & Low Sulphur (LS) crude oil processing
Table 4.3 : Imported crude & indigenous crude oil processing
Source: Oil companies
Source: Oil companies, *Nayara Energy Limited (formerly Essar Oil Limited) MMTPA: Million Metric Tonne Per Annum, MMT: Million Metric Tonne
Source: Oil companies

PPAC Ready Reckoner
26
(Million metric tonne)
Products 2014-15 2015-16 2016-17 2017-18 2018-19 (P)
A) From crude oil/refineries
Light ends 64.6 70.6 75.0 83.7 85.1
of which: LPG 7.7 8.6 9.2 10.2 10.7
MS 32.2 35.3 36.6 37.8 38.0
Naphtha 16.2 16.8 18.6 18.8 18.4
Others 8.5 9.9 10.7 17.0 18.0
Middle distillates 117.5 122.9 127.9 131.2 136.5
of which: SKO 7.6 7.4 5.9 4.2 4.0
ATF 11.1 11.8 13.8 14.6 15.5
HSD 94.3 98.6 102.1 108.0 110.5
LDO 0.4 0.4 0.6 0.6 0.7
Others 4.2 4.7 5.4 3.7 5.9
Heavy ends 34.9 34.4 36.3 34.8 35.8
of which: Furnace Oil 11.5 10.3 11.8 9.8 9.5
LSHS 0.7 0.4 0.3 0.5 0.4
Lube Oil 0.9 1.0 1.0 1.0 0.9
Bitumen 4.7 5.2 5.2 5.3 5.6
RPC/Petcoke 11.7 13.3 12.9 13.9 13.7
Others 5.5 4.2 5.2 4.3 5.6
Sub total (A) 217.1 227.9 239.2 249.7 257.4
B) From natural gas / fractionators
Sub total (B) 4.0 4.0 4.3 4.6 4.9
of which: LPG 2.2 2.0 2.1 2.2 2.1
Naphtha 1.2 1.1 1.2 1.2 1.2
SKO 0.07 0.07 0.03 0.05 0.07
HSD 0.01 0.01 0.01 0.01 0.04
Others 0.5 0.8 1.0 1.1 1.5
Total production (A +B) 221.1 231.9 243.5 254.3 262.4
Table 4.4 : Production of petroleum products
Source: Oil companies

PPAC Ready Reckoner
27
(Million metric tonne)
Major products 2014-15 2015-16 2016-17 2017-18 2018-19 (P)
HSD 94.3 98.6 102.1 108.1 110.6MS 32.2 35.3 36.6 37.8 38.0Naphtha 17.5 17.9 19.7 20.0 19.6FO 11.5 10.3 11.8 9.8 9.5ATF 11.1 11.8 13.8 14.7 15.5LPG 9.8 10.6 11.3 12.4 12.8SKO 7.6 7.5 6.0 4.3 4.1Bitumen 4.7 5.2 5.2 5.3 5.6LSHS 0.7 0.4 0.3 0.5 0.4Lubes 0.9 1.0 1.0 1.0 0.9LDO 0.4 0.4 0.6 0.6 0.7RPC/Petcoke 11.7 13.3 12.9 13.9 13.7Others# 18.7 19.6 22.3 26.2 31.0Total 221.1 231.9 243.5 254.3 262.4
(Million metric tonne)
Year Consumption $ Production from refineries & other sources*
Surplus (+ ) / Deficit (-)
(A) (B) (B)-(A)
1997-98 84.3 64.7 -19.6
1998-99 90.6 68.4 -22.2
1999-00 97.1 82.9 -14.2
2000-01 100.1 99.6 -0.5
2001-02 100.4 104.3 3.9
2002-03 104.1 108.7 4.5
2003-04 107.8 117.6 9.9
2004-05 111.6 123.3 11.6
2005-06 113.2 124.6 11.4
2006-07 120.7 140.6 19.9
2007-08 128.9 150.4 21.5
2008-09 133.6 157.9 24.3
2009-10 137.8 185.5 47.7
2010-11 141.0 196.2 55.2
2011-12 148.1 204.5 56.3
2012-13 157.1 218.2 61.2
2013-14 158.4 220.7 62.3
2014-15 165.5 221.1 55.6
2015-16 184.7 231.9 47.2
2016-17 194.6 243.5 48.9
2017-18 206.2 254.3 48.1
2018-19 (P) 211.6 262.4 50.7
Table 4.5 : Production of petroleum products : All sources
Table 4.6 : Production vis a vis consumption of petroleum products
Source: Oil companies # Others include products like Propylene, Solvents (Hexane, Benzene, Toluene, Xylene and Specialty solvents), Reformate, Mineral Turpentine Oil, Carbon Black Feed Stock, Waxes, Sulphur etc.
Note: $ includes direct imports by private parties *Fractionators and gas processing plants
PPAC Ready Reckoner
28
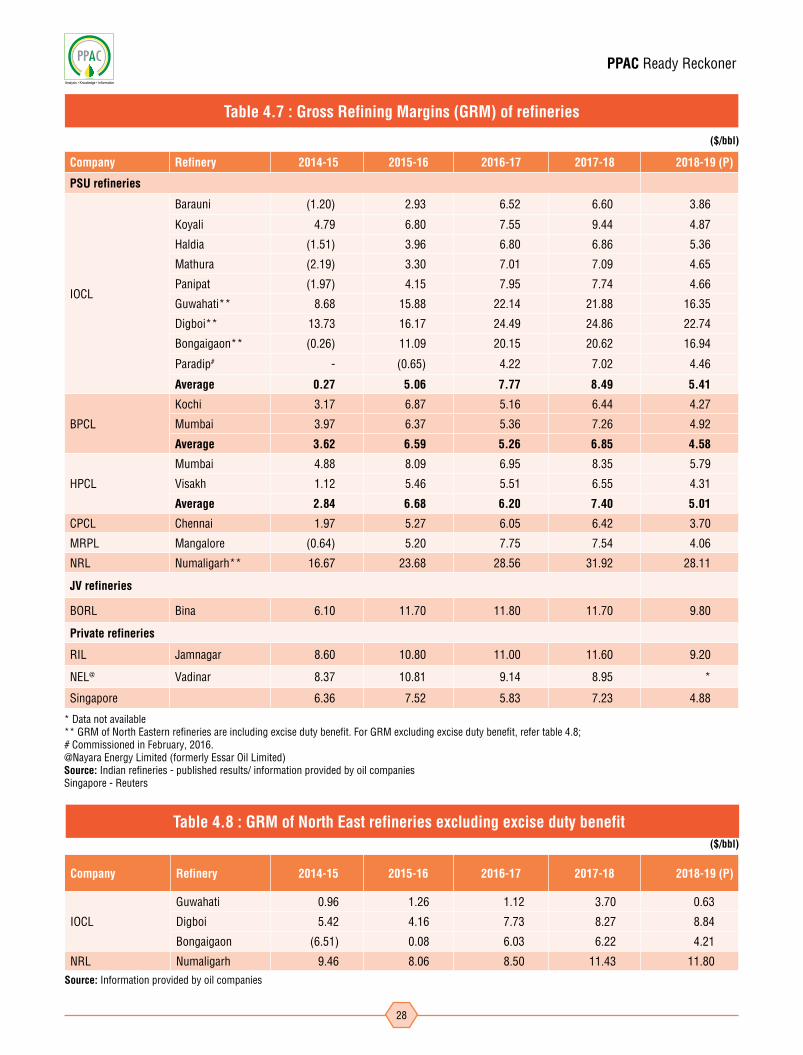
Company Refinery 2014-15 2015-16 2016-17 2017-18 2018-19 (P)
PSU refineries
IOCL
Barauni (1.20) 2.93 6.52 6.60 3.86
Koyali 4.79 6.80 7.55 9.44 4.87
Haldia (1.51) 3.96 6.80 6.86 5.36
Mathura (2.19) 3.30 7.01 7.09 4.65
Panipat (1.97) 4.15 7.95 7.74 4.66
Guwahati** 8.68 15.88 22.14 21.88 16.35
Digboi** 13.73 16.17 24.49 24.86 22.74
Bongaigaon** (0.26) 11.09 20.15 20.62 16.94
Paradip# - (0.65) 4.22 7.02 4.46
Average 0.27 5.06 7.77 8.49 5.41
BPCL
Kochi 3.17 6.87 5.16 6.44 4.27
Mumbai 3.97 6.37 5.36 7.26 4.92
Average 3.62 6.59 5.26 6.85 4.58
HPCL
Mumbai 4.88 8.09 6.95 8.35 5.79
Visakh 1.12 5.46 5.51 6.55 4.31
Average 2.84 6.68 6.20 7.40 5.01
CPCL Chennai 1.97 5.27 6.05 6.42 3.70
MRPL Mangalore (0.64) 5.20 7.75 7.54 4.06
NRL Numaligarh** 16.67 23.68 28.56 31.92 28.11
JV refineries
BORL Bina 6.10 11.70 11.80 11.70 9.80
Private refineries
RIL Jamnagar 8.60 10.80 11.00 11.60 9.20
NEL@ Vadinar 8.37 10.81 9.14 8.95 *
Singapore 6.36 7.52 5.83 7.23 4.88
Company Refinery 2014-15 2015-16 2016-17 2017-18 2018-19 (P)
IOCL
Guwahati 0.96 1.26 1.12 3.70 0.63
Digboi 5.42 4.16 7.73 8.27 8.84
Bongaigaon (6.51) 0.08 6.03 6.22 4.21
NRL Numaligarh 9.46 8.06 8.50 11.43 11.80
Table 4.7 : Gross Refining Margins (GRM) of refineries
Table 4.8 : GRM of North East refineries excluding excise duty benefit
* Data not available** GRM of North Eastern refineries are including excise duty benefit. For GRM excluding excise duty benefit, refer table 4.8; # Commissioned in February, 2016. @Nayara Energy Limited (formerly Essar Oil Limited) Source: Indian refineries - published results/ information provided by oil companies Singapore - Reuters
Source: Information provided by oil companies
($/bbl)
($/bbl)

PPAC Ready Reckoner
29
(Distillate %)
Company Refinery 2014-15 2015-16 2016-17 2017-18 2018-19 (P)
IOCL
Barauni 87.3 88.7 85.3 89.0 87.9
Koyali 80.1 83.1 81.0 82.5 81
Haldia 69.0 69.6 66.7 66.9 69.9
Mathura 71.9 74.7 73.6 75.4 76.1
Panipat 82.4 83.8 84.1 84.9 82.8
Guwahati 81.1 80.8 83.5 82.7 81
Digboi 74.8 69.7 75.3 77.9 75.8
Bongaigaon 84.0 84.5 83.8 84.3 84.8
Paradip - - 75.3 79.4 80.8
CPCLManali 71.5 71.4 71.6 72.3 75.3
CBR 71.6 79.3 78.2 79.1 77.3
HPCLMumbai 75.9 76.0 77.6 77.4 77.6
Visakh 78.8 75.7 74.0 74.5 74.5
BPCLMumbai 81.8 84.3 86.1 84.3 82.2
Kochi 84.7 85.7 85.2 83.9 82.5
NRL Numaligarh 90.7 89.9 90.5 86.7 87.1
MRPL Mangalore 72.3 76.9 77.3 76.5 76.8
PSU oil cos. average 78.3 79.9 79.3 79.7 79.7
Table 4.9 : Distillate yield of PSU refineries
Source: Centre for High Technology
PPAC Ready Reckoner
30
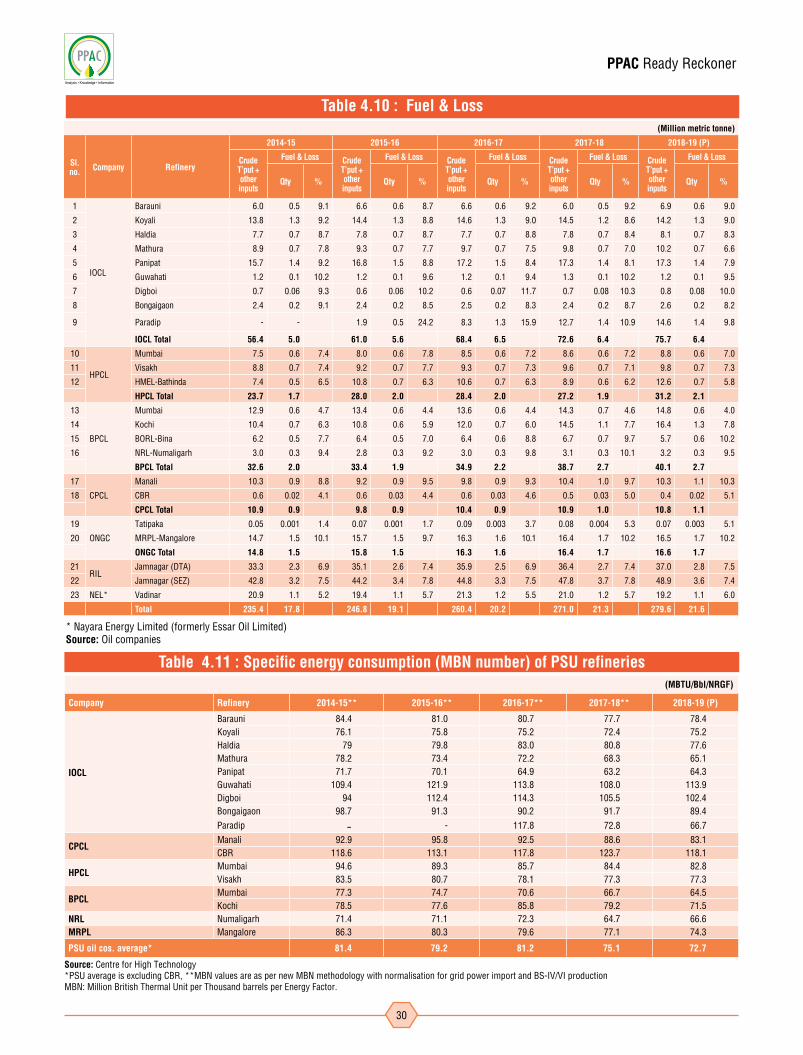
(MBTU/Bbl/NRGF)
Company Refinery 2014-15** 2015-16** 2016-17** 2017-18** 2018-19 (P)
IOCL
Barauni 84.4 81.0 80.7 77.7 78.4Koyali 76.1 75.8 75.2 72.4 75.2Haldia 79 79.8 83.0 80.8 77.6Mathura 78.2 73.4 72.2 68.3 65.1Panipat 71.7 70.1 64.9 63.2 64.3Guwahati 109.4 121.9 113.8 108.0 113.9Digboi 94 112.4 114.3 105.5 102.4Bongaigaon 98.7 91.3 90.2 91.7 89.4
Paradip - - 117.8 72.8 66.7
CPCLManali 92.9 95.8 92.5 88.6 83.1CBR 118.6 113.1 117.8 123.7 118.1
HPCLMumbai 94.6 89.3 85.7 84.4 82.8Visakh 83.5 80.7 78.1 77.3 77.3
BPCLMumbai 77.3 74.7 70.6 66.7 64.5Kochi 78.5 77.6 85.8 79.2 71.5
NRL Numaligarh 71.4 71.1 72.3 64.7 66.6MRPL Mangalore 86.3 80.3 79.6 77.1 74.3
PSU oil cos. average* 81.4 79.2 81.2 75.1 72.7
Table 4.11 : Specific energy consumption (MBN number) of PSU refineries
Source: Centre for High Technology*PSU average is excluding CBR, **MBN values are as per new MBN methodology with normalisation for grid power import and BS-IV/VI productionMBN: Million British Thermal Unit per Thousand barrels per Energy Factor.
(Million metric tonne)
Sl. no. Company Refinery
2014-15 2015-16 2016-17 2017-18 2018-19 (P)
Crude T'put + other inputs
Fuel & Loss Crude T'put + other inputs
Fuel & Loss Crude T'put + other inputs
Fuel & Loss Crude T'put + other inputs
Fuel & Loss Crude T'put + other inputs
Fuel & Loss
Qty % Qty % Qty % Qty % Qty %
1
IOCL
Barauni 6.0 0.5 9.1 6.6 0.6 8.7 6.6 0.6 9.2 6.0 0.5 9.2 6.9 0.6 9.0
2 Koyali 13.8 1.3 9.2 14.4 1.3 8.8 14.6 1.3 9.0 14.5 1.2 8.6 14.2 1.3 9.0
3 Haldia 7.7 0.7 8.7 7.8 0.7 8.7 7.7 0.7 8.8 7.8 0.7 8.4 8.1 0.7 8.3
4 Mathura 8.9 0.7 7.8 9.3 0.7 7.7 9.7 0.7 7.5 9.8 0.7 7.0 10.2 0.7 6.6
5 Panipat 15.7 1.4 9.2 16.8 1.5 8.8 17.2 1.5 8.4 17.3 1.4 8.1 17.3 1.4 7.9
6 Guwahati 1.2 0.1 10.2 1.2 0.1 9.6 1.2 0.1 9.4 1.3 0.1 10.2 1.2 0.1 9.5
7 Digboi 0.7 0.06 9.3 0.6 0.06 10.2 0.6 0.07 11.7 0.7 0.08 10.3 0.8 0.08 10.0
8 Bongaigaon 2.4 0.2 9.1 2.4 0.2 8.5 2.5 0.2 8.3 2.4 0.2 8.7 2.6 0.2 8.2
9 Paradip - - 1.9 0.5 24.2 8.3 1.3 15.9 12.7 1.4 10.9 14.6 1.4 9.8
IOCL Total 56.4 5.0 61.0 5.6 68.4 6.5 72.6 6.4 75.7 6.4
10
HPCL
Mumbai 7.5 0.6 7.4 8.0 0.6 7.8 8.5 0.6 7.2 8.6 0.6 7.2 8.8 0.6 7.0
11 Visakh 8.8 0.7 7.4 9.2 0.7 7.7 9.3 0.7 7.3 9.6 0.7 7.1 9.8 0.7 7.3
12 HMEL-Bathinda 7.4 0.5 6.5 10.8 0.7 6.3 10.6 0.7 6.3 8.9 0.6 6.2 12.6 0.7 5.8
HPCL Total 23.7 1.7 28.0 2.0 28.4 2.0 27.2 1.9 31.2 2.1
13
BPCL
Mumbai 12.9 0.6 4.7 13.4 0.6 4.4 13.6 0.6 4.4 14.3 0.7 4.6 14.8 0.6 4.0
14 Kochi 10.4 0.7 6.3 10.8 0.6 5.9 12.0 0.7 6.0 14.5 1.1 7.7 16.4 1.3 7.8
15 BORL-Bina 6.2 0.5 7.7 6.4 0.5 7.0 6.4 0.6 8.8 6.7 0.7 9.7 5.7 0.6 10.2
16 NRL-Numaligarh 3.0 0.3 9.4 2.8 0.3 9.2 3.0 0.3 9.8 3.1 0.3 10.1 3.2 0.3 9.5
BPCL Total 32.6 2.0 33.4 1.9 34.9 2.2 38.7 2.7 40.1 2.7
17
CPCL
Manali 10.3 0.9 8.8 9.2 0.9 9.5 9.8 0.9 9.3 10.4 1.0 9.7 10.3 1.1 10.3
18 CBR 0.6 0.02 4.1 0.6 0.03 4.4 0.6 0.03 4.6 0.5 0.03 5.0 0.4 0.02 5.1
CPCL Total 10.9 0.9 9.8 0.9 10.4 0.9 10.9 1.0 10.8 1.1
19
ONGC
Tatipaka 0.05 0.001 1.4 0.07 0.001 1.7 0.09 0.003 3.7 0.08 0.004 5.3 0.07 0.003 5.1
20 MRPL-Mangalore 14.7 1.5 10.1 15.7 1.5 9.7 16.3 1.6 10.1 16.4 1.7 10.2 16.5 1.7 10.2
ONGC Total 14.8 1.5 15.8 1.5 16.3 1.6 16.4 1.7 16.6 1.7
21RIL
Jamnagar (DTA) 33.3 2.3 6.9 35.1 2.6 7.4 35.9 2.5 6.9 36.4 2.7 7.4 37.0 2.8 7.5
22 Jamnagar (SEZ) 42.8 3.2 7.5 44.2 3.4 7.8 44.8 3.3 7.5 47.8 3.7 7.8 48.9 3.6 7.4
23 NEL* Vadinar 20.9 1.1 5.2 19.4 1.1 5.7 21.3 1.2 5.5 21.0 1.2 5.7 19.2 1.1 6.0
Total 235.4 17.8 246.8 19.1 260.4 20.2 271.0 21.3 279.6 21.6
Table 4.10 : Fuel & Loss
* Nayara Energy Limited (formerly Essar Oil Limited) Source: Oil companies
PPAC Ready Reckoner
31
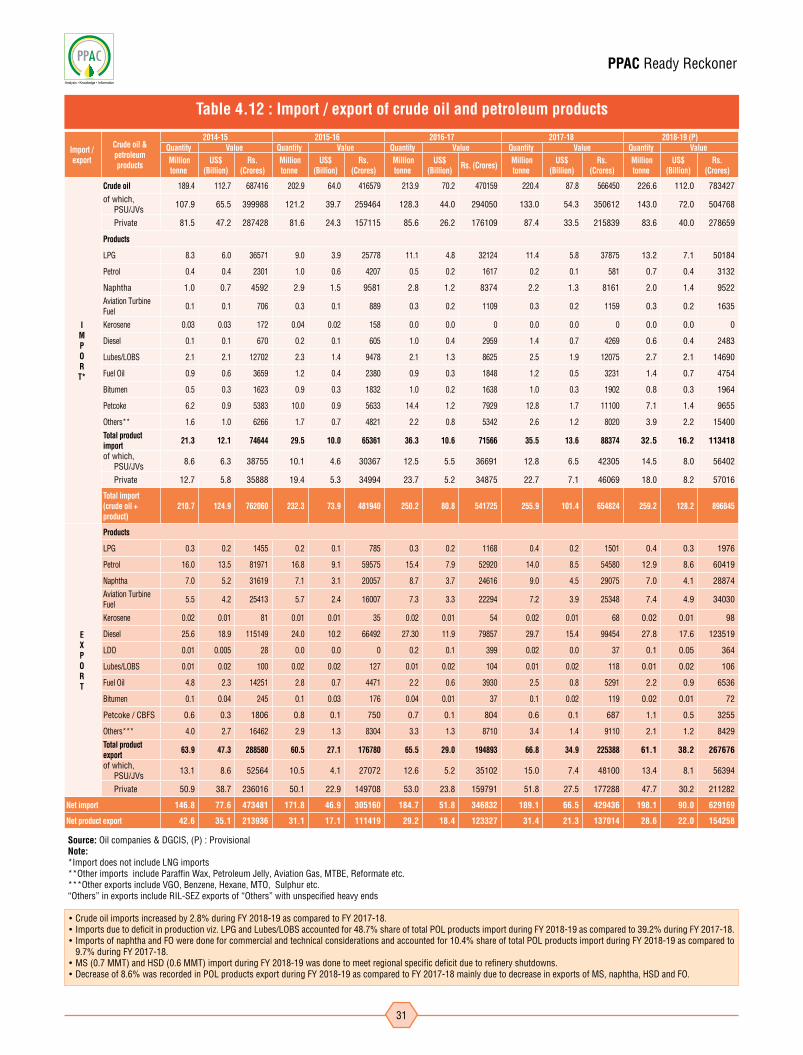
Table 4.12 : Import / export of crude oil and petroleum products
Import / export
Crude oil & petroleum products
2014-15 2015-16 2016-17 2017-18 2018-19 (P)Quantity Value Quantity Value Quantity Value Quantity Value Quantity Value Million tonne
US$ (Billion)
Rs. (Crores)
Million tonne
US$ (Billion)
Rs. (Crores)
Million tonne
US$ (Billion) Rs. (Crores) Million
tonneUS$
(Billion)Rs.
(Crores) Million tonne
US$ (Billion)
Rs. (Crores)
IMPORT*
Crude oil 189.4 112.7 687416 202.9 64.0 416579 213.9 70.2 470159 220.4 87.8 566450 226.6 112.0 783427
of which, PSU/JVs 107.9 65.5 399988 121.2 39.7 259464 128.3 44.0 294050 133.0 54.3 350612 143.0 72.0 504768
Private 81.5 47.2 287428 81.6 24.3 157115 85.6 26.2 176109 87.4 33.5 215839 83.6 40.0 278659
Products
LPG 8.3 6.0 36571 9.0 3.9 25778 11.1 4.8 32124 11.4 5.8 37875 13.2 7.1 50184
Petrol 0.4 0.4 2301 1.0 0.6 4207 0.5 0.2 1617 0.2 0.1 581 0.7 0.4 3132
Naphtha 1.0 0.7 4592 2.9 1.5 9581 2.8 1.2 8374 2.2 1.3 8161 2.0 1.4 9522
Aviation Turbine Fuel 0.1 0.1 706 0.3 0.1 889 0.3 0.2 1109 0.3 0.2 1159 0.3 0.2 1635
Kerosene 0.03 0.03 172 0.04 0.02 158 0.0 0.0 0 0.0 0.0 0 0.0 0.0 0
Diesel 0.1 0.1 670 0.2 0.1 605 1.0 0.4 2959 1.4 0.7 4269 0.6 0.4 2483
Lubes/LOBS 2.1 2.1 12702 2.3 1.4 9478 2.1 1.3 8625 2.5 1.9 12075 2.7 2.1 14690
Fuel Oil 0.9 0.6 3659 1.2 0.4 2380 0.9 0.3 1848 1.2 0.5 3231 1.4 0.7 4754
Bitumen 0.5 0.3 1623 0.9 0.3 1832 1.0 0.2 1638 1.0 0.3 1902 0.8 0.3 1964
Petcoke 6.2 0.9 5383 10.0 0.9 5633 14.4 1.2 7929 12.8 1.7 11100 7.1 1.4 9655
Others** 1.6 1.0 6266 1.7 0.7 4821 2.2 0.8 5342 2.6 1.2 8020 3.9 2.2 15400
Total product import 21.3 12.1 74644 29.5 10.0 65361 36.3 10.6 71566 35.5 13.6 88374 32.5 16.2 113418
of which, PSU/JVs 8.6 6.3 38755 10.1 4.6 30367 12.5 5.5 36691 12.8 6.5 42305 14.5 8.0 56402
Private 12.7 5.8 35888 19.4 5.3 34994 23.7 5.2 34875 22.7 7.1 46069 18.0 8.2 57016
Total import (crude oil + product)
210.7 124.9 762060 232.3 73.9 481940 250.2 80.8 541725 255.9 101.4 654824 259.2 128.2 896845
EXPORT
Products
LPG 0.3 0.2 1455 0.2 0.1 785 0.3 0.2 1168 0.4 0.2 1501 0.4 0.3 1976
Petrol 16.0 13.5 81971 16.8 9.1 59575 15.4 7.9 52920 14.0 8.5 54580 12.9 8.6 60419
Naphtha 7.0 5.2 31619 7.1 3.1 20057 8.7 3.7 24616 9.0 4.5 29075 7.0 4.1 28874
Aviation Turbine Fuel 5.5 4.2 25413 5.7 2.4 16007 7.3 3.3 22294 7.2 3.9 25348 7.4 4.9 34030
Kerosene 0.02 0.01 81 0.01 0.01 35 0.02 0.01 54 0.02 0.01 68 0.02 0.01 98
Diesel 25.6 18.9 115149 24.0 10.2 66492 27.30 11.9 79857 29.7 15.4 99454 27.8 17.6 123519
LDO 0.01 0.005 28 0.0 0.0 0 0.2 0.1 399 0.02 0.0 37 0.1 0.05 364
Lubes/LOBS 0.01 0.02 100 0.02 0.02 127 0.01 0.02 104 0.01 0.02 118 0.01 0.02 106
Fuel Oil 4.8 2.3 14251 2.8 0.7 4471 2.2 0.6 3930 2.5 0.8 5291 2.2 0.9 6536
Bitumen 0.1 0.04 245 0.1 0.03 176 0.04 0.01 37 0.1 0.02 119 0.02 0.01 72
Petcoke / CBFS 0.6 0.3 1806 0.8 0.1 750 0.7 0.1 804 0.6 0.1 687 1.1 0.5 3255
Others*** 4.0 2.7 16462 2.9 1.3 8304 3.3 1.3 8710 3.4 1.4 9110 2.1 1.2 8429
Total product export 63.9 47.3 288580 60.5 27.1 176780 65.5 29.0 194893 66.8 34.9 225388 61.1 38.2 267676
of which, PSU/JVs 13.1 8.6 52564 10.5 4.1 27072 12.6 5.2 35102 15.0 7.4 48100 13.4 8.1 56394
Private 50.9 38.7 236016 50.1 22.9 149708 53.0 23.8 159791 51.8 27.5 177288 47.7 30.2 211282
Net import 146.8 77.6 473481 171.8 46.9 305160 184.7 51.8 346832 189.1 66.5 429436 198.1 90.0 629169
Net product export 42.6 35.1 213936 31.1 17.1 111419 29.2 18.4 123327 31.4 21.3 137014 28.6 22.0 154258
Source: Oil companies & DGCIS, (P) : Provisional Note: *Import does not include LNG imports **Other imports include Paraffin Wax, Petroleum Jelly, Aviation Gas, MTBE, Reformate etc. ***Other exports include VGO, Benzene, Hexane, MTO, Sulphur etc. “Others” in exports include RIL-SEZ exports of “Others” with unspecified heavy ends
• Crude oil imports increased by 2.8% during FY 2018-19 as compared to FY 2017-18. • Imports due to deficit in production viz. LPG and Lubes/LOBS accounted for 48.7% share of total POL products import during FY 2018-19 as compared to 39.2% during FY 2017-18.• Imports of naphtha and FO were done for commercial and technical considerations and accounted for 10.4% share of total POL products import during FY 2018-19 as compared to
9.7% during FY 2017-18.• MS (0.7 MMT) and HSD (0.6 MMT) import during FY 2018-19 was done to meet regional specific deficit due to refinery shutdowns.• Decrease of 8.6% was recorded in POL products export during FY 2018-19 as compared to FY 2017-18 mainly due to decrease in exports of MS, naphtha, HSD and FO.
PPAC Ready Reckoner
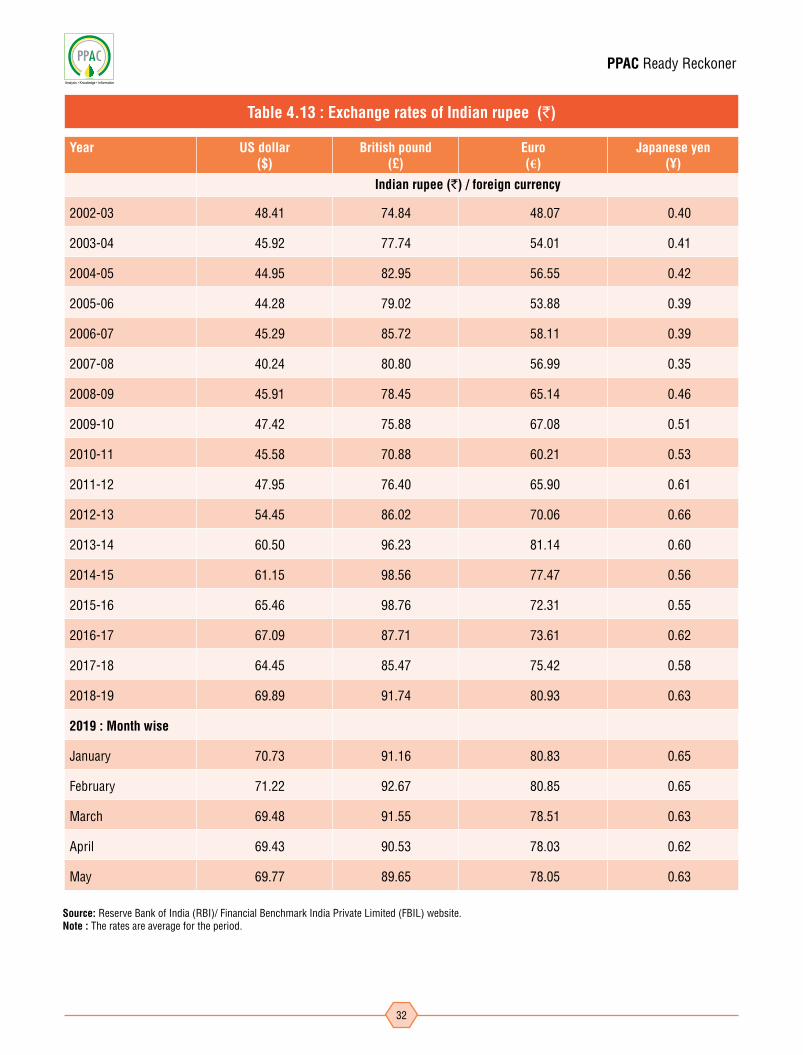
32
Year US dollar ($)
British pound (£)
Euro (€)
Japanese yen (¥)
Indian rupee (`) / foreign currency
2002-03 48.41 74.84 48.07 0.40
2003-04 45.92 77.74 54.01 0.41
2004-05 44.95 82.95 56.55 0.42
2005-06 44.28 79.02 53.88 0.39
2006-07 45.29 85.72 58.11 0.39
2007-08 40.24 80.80 56.99 0.35
2008-09 45.91 78.45 65.14 0.46
2009-10 47.42 75.88 67.08 0.51
2010-11 45.58 70.88 60.21 0.53
2011-12 47.95 76.40 65.90 0.61
2012-13 54.45 86.02 70.06 0.66
2013-14 60.50 96.23 81.14 0.60
2014-15 61.15 98.56 77.47 0.56
2015-16 65.46 98.76 72.31 0.55
2016-17 67.09 87.71 73.61 0.62
2017-18 64.45 85.47 75.42 0.58
2018-19 69.89 91.74 80.93 0.63
2019 : Month wise
January 70.73 91.16 80.83 0.65
February 71.22 92.67 80.85 0.65
March 69.48 91.55 78.51 0.63
April 69.43 90.53 78.03 0.62
May 69.77 89.65 78.05 0.63
Table 4.13 : Exchange rates of Indian rupee (`)
Source: Reserve Bank of India (RBI)/ Financial Benchmark India Private Limited (FBIL) website.Note : The rates are average for the period.
PPAC Ready Reckoner
33
Major Pipelines in India
Chapter-5

PPAC Ready Reckoner
34
Map of Pipeline Network in India
Note: Pipelines shown are indicative only.
PPAC Ready Reckoner
35
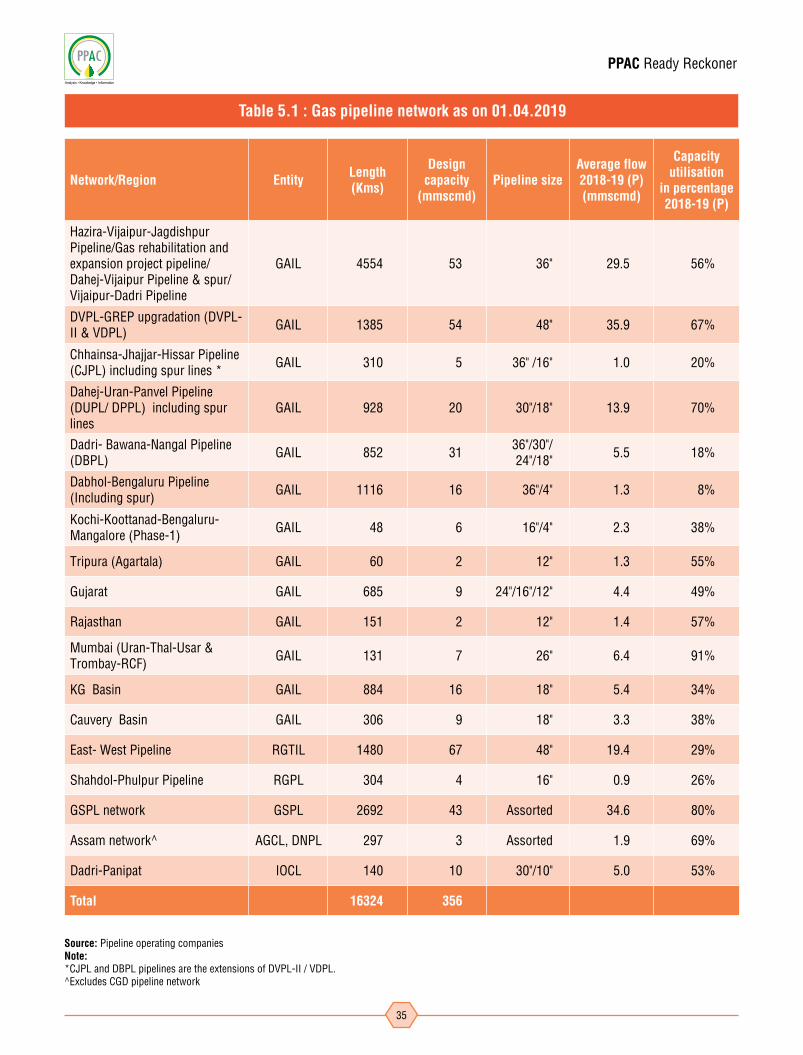
Table 5.1 : Gas pipeline network as on 01.04.2019
Network/Region Entity Length (Kms)
Design capacity
(mmscmd)Pipeline size
Average flow 2018-19 (P) (mmscmd)
Capacity utilisation
in percentage 2018-19 (P)
Hazira-Vijaipur-Jagdishpur Pipeline/Gas rehabilitation and expansion project pipeline/ Dahej-Vijaipur Pipeline & spur/ Vijaipur-Dadri Pipeline
GAIL 4554 53 36" 29.5 56%
DVPL-GREP upgradation (DVPL-II & VDPL) GAIL 1385 54 48" 35.9 67%
Chhainsa-Jhajjar-Hissar Pipeline (CJPL) including spur lines * GAIL 310 5 36" /16" 1.0 20%
Dahej-Uran-Panvel Pipeline (DUPL/ DPPL) including spur lines
GAIL 928 20 30"/18" 13.9 70%
Dadri- Bawana-Nangal Pipeline (DBPL) GAIL 852 31 36"/30"/
24"/18" 5.5 18%
Dabhol-Bengaluru Pipeline (Including spur) GAIL 1116 16 36"/4" 1.3 8%
Kochi-Koottanad-Bengaluru-Mangalore (Phase-1) GAIL 48 6 16"/4" 2.3 38%
Tripura (Agartala) GAIL 60 2 12" 1.3 55%
Gujarat GAIL 685 9 24"/16"/12" 4.4 49%
Rajasthan GAIL 151 2 12" 1.4 57%
Mumbai (Uran-Thal-Usar & Trombay-RCF) GAIL 131 7 26" 6.4 91%
KG Basin GAIL 884 16 18" 5.4 34%
Cauvery Basin GAIL 306 9 18" 3.3 38%
East- West Pipeline RGTIL 1480 67 48" 19.4 29%
Shahdol-Phulpur Pipeline RGPL 304 4 16" 0.9 26%
GSPL network GSPL 2692 43 Assorted 34.6 80%
Assam network^ AGCL, DNPL 297 3 Assorted 1.9 69%
Dadri-Panipat IOCL 140 10 30"/10" 5.0 53%
Total 16324 356
Source: Pipeline operating companiesNote:*CJPL and DBPL pipelines are the extensions of DVPL-II / VDPL.^Excludes CGD pipeline network

PPAC Ready Reckoner
36
Type of Pipeline -Onshore/ Ofshore
Name of the pipeline OwnerLength (KM) Capacity
(MMT)Throughput
(MMT)
Percentage utilisation
during31.03.2019 31.03.2019 2018-19 (P) 2018-19 (P)
Onshore CTF (Central Tank Farm) Kalol to CTF Nawagam - New (New line commissioned in August 2010)
ONGC
63 3.1 1.0 31.4
Onshore Nawagam-Koyali (18" line) New 80 5.4 2.9 53.7
Onshore Nawagam-Koyali (14" line) ( Old)(1) 78 3.3 0.6 17.1
Onshore MHN-NGM (Mehsana-Nawagam) trunk line - New (New crude oil trunk line commissioned. Under operation since December 2010) 77 2.3 2.0 89.4
Onshore CTF (Central Tank Farm), Ankleshwar to Koyali oil pipeline (AKCL- Ankleshwar Koyali Crude Line) 95 2.2 0.9 41.3
Onshore CTF (Central Tank Farm), Ankleshwar to CPF (Central Processing Facility), Gandhar 44 0.4 0.0 0.0
Onshore CPF (Central Processing Facility), Gandhar to Saraswani ‘T’ point 57 1.8 0.8 42.1
Onshore Akholjuni- Koyali oil pipe line (Commissioned in July 2010). Akholjuni to Laxmipura T' point 66 0.5 0.2 37.4
Onshore Lakwa-Moran oil line (New) 18 1.5 0.4 24.1
Onshore Lakwa-Moran oil line (Old) 15 1.5 0.015 1.0
Onshore Geleki-Jorhat oil line 49 1.5 0.3 22.2
Onshore Geleki-Jorhat oil line (New)*(2) 48 1.5 0.1 4.1
Onshore Borholla- Jorhat oil line 43 0.6 0.1 24.2
Onshore Borholla- Jorhat new TPL (New)(3) 43 0.6 0.1 8.5
Onshore NRM (Narimanam) to CPCL (Chennai Petroleum Corporation Limited) 5 0.7 0.4 52.4
Onshore KSP-WGGS to TPK Refinery (Kesnapalli-West-Group Gathering Station to Tatipaka) 14 0.1 0.003 3.7
OnshoreGMAA EPT (Gopavaram Early Production Terminal) to S. Yanam Unloading Terminal (3.5 Km long and 4"). New line commissioned on 28.07.10
4 0.1 0.016 18.3
Offshore Mumbai High - Uran - Trunk (MUT) 30’’ pipeline 204 15.6 8.8 56.4
Offshore Heera - Uran - Trunk (HUT) 24’’ pipeline 81 11.5 2.9 25.1
Offshore Bombay-Uran Trunk (BUT) 30’’ pipeline 203 6.4 0.1 1.0
Sub total ONGC 1283 60.6 21.5 35.4
Onshore Salaya-Mathura pipeline (SMPL)
IOCL
2646 25.0 26.4 105.4
Onshore Paradip-Haldia-Barauni pipeline (PHBPL) 1355 15.2 17.2 113.0
Onshore Mundra-Panipat pipeline 1194 8.4 7.8 92.9
Offshore Salaya-Mathura Pipeline (Offshore segment) 14 - 0.0
Offshore Paradip-Haldia-Barauni Pipeline (Offshore segment) 92 - 0.0
Sub total IOCL 5301 48.6 51.3 105.6
Onshore Duliajan-Digboi-Bongaigaon-Barauni pipeline OIL 1193 8.4 6.5 77.7
Onshore Mangla-Bhogat pipeline CAIRN 660 8.7 7.6 87.8
Offshore Bhogat Marine CAIRN 28 2.0 1.9 92.9
Sub total CAIRN 688 10.7 9.5 88.7
Onshore Mundra- Bathinda pipeline HMPL 1017 11.3 12.5 111.0
Onshore Vadinar-Bina pipeline(1) BORL 937 6.0 5.8 95.8
Total Crude pipelines 10419 145.6 107.1 73.5
Table 5.2 : Existing major crude oil pipelines in India
Source: Oil companies (P): Provisional Note:ONGC: (1) Mehsana-Crude oil pumping through 14” old TPL stopped from 01.09.2018 (2) New 14” Geleki CTF to Jorhat CTF Oil trunk Line commissioned on 30.12.2018 (3) Borholla-Jorhat CTF new TPL (12”X43.4 km) commissioned on 29.12.2018 BORL (1) BORL Refinery was under planned shutdown during August-October 2018 for debottlenecking its refining capacity from 6 MMTPA to 7.8 MMTPA.
PPAC Ready Reckoner
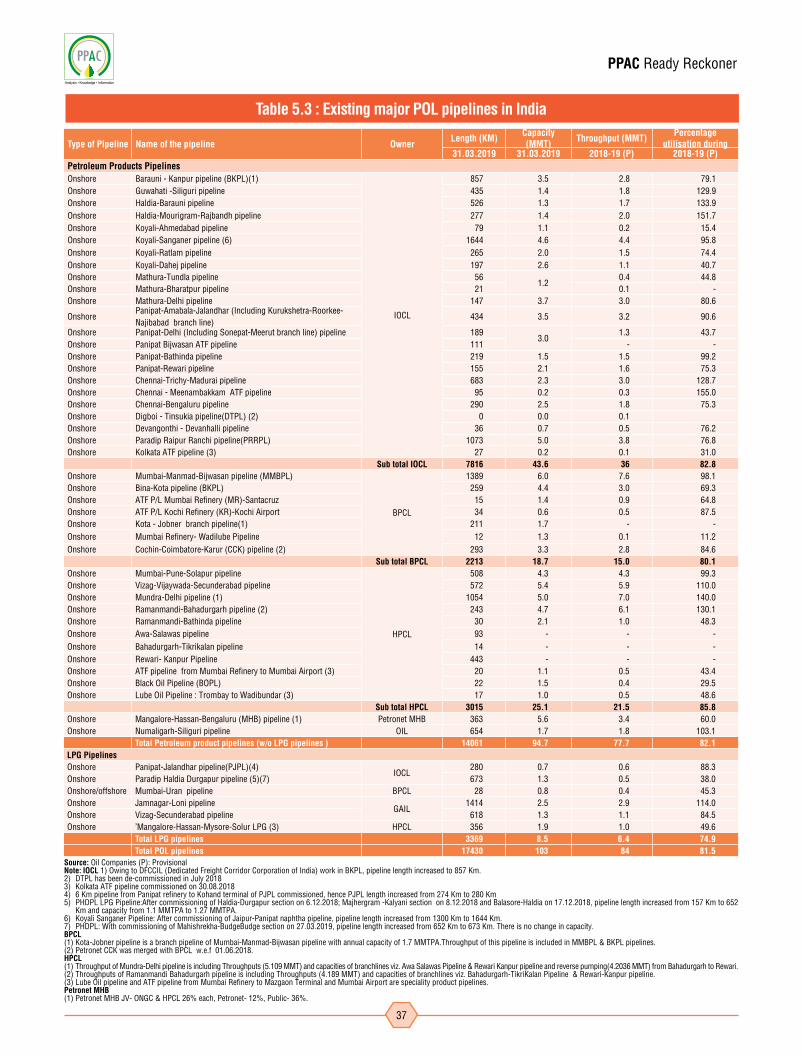
37
Type of Pipeline Name of the pipeline OwnerLength (KM) Capacity
(MMT) Throughput (MMT) Percentage utilisation during
31.03.2019 31.03.2019 2018-19 (P) 2018-19 (P)Petroleum Products PipelinesOnshore Barauni - Kanpur pipeline (BKPL)(1)
IOCL
857 3.5 2.8 79.1Onshore Guwahati -Siliguri pipeline 435 1.4 1.8 129.9Onshore Haldia-Barauni pipeline 526 1.3 1.7 133.9Onshore Haldia-Mourigram-Rajbandh pipeline 277 1.4 2.0 151.7Onshore Koyali-Ahmedabad pipeline 79 1.1 0.2 15.4Onshore Koyali-Sanganer pipeline (6) 1644 4.6 4.4 95.8Onshore Koyali-Ratlam pipeline 265 2.0 1.5 74.4Onshore Koyali-Dahej pipeline 197 2.6 1.1 40.7Onshore Mathura-Tundla pipeline 56
1.20.4 44.8
Onshore Mathura-Bharatpur pipeline 21 0.1 -Onshore Mathura-Delhi pipeline 147 3.7 3.0 80.6
OnshorePanipat-Amabala-Jalandhar (Including Kurukshetra-Roorkee-Najibabad branch line)
434 3.5 3.2 90.6
Onshore Panipat-Delhi (Including Sonepat-Meerut branch line) pipeline 1893.0
1.3 43.7Onshore Panipat Bijwasan ATF pipeline 111 - -Onshore Panipat-Bathinda pipeline 219 1.5 1.5 99.2Onshore Panipat-Rewari pipeline 155 2.1 1.6 75.3Onshore Chennai-Trichy-Madurai pipeline 683 2.3 3.0 128.7Onshore Chennai - Meenambakkam ATF pipeline 95 0.2 0.3 155.0Onshore Chennai-Bengaluru pipeline 290 2.5 1.8 75.3Onshore Digboi - Tinsukia pipeline(DTPL) (2) 0 0.0 0.1Onshore Devangonthi - Devanhalli pipeline 36 0.7 0.5 76.2Onshore Paradip Raipur Ranchi pipeline(PRRPL) 1073 5.0 3.8 76.8Onshore Kolkata ATF pipeline (3) 27 0.2 0.1 31.0
Sub total IOCL 7816 43.6 36 82.8Onshore Mumbai-Manmad-Bijwasan pipeline (MMBPL)
BPCL
1389 6.0 7.6 98.1Onshore Bina-Kota pipeline (BKPL) 259 4.4 3.0 69.3Onshore ATF P/L Mumbai Refinery (MR)-Santacruz 15 1.4 0.9 64.8Onshore ATF P/L Kochi Refinery (KR)-Kochi Airport 34 0.6 0.5 87.5Onshore Kota - Jobner branch pipeline(1) 211 1.7 - -Onshore Mumbai Refinery- Wadilube Pipeline 12 1.3 0.1 11.2Onshore Cochin-Coimbatore-Karur (CCK) pipeline (2) 293 3.3 2.8 84.6
Sub total BPCL 2213 18.7 15.0 80.1Onshore Mumbai-Pune-Solapur pipeline
HPCL
508 4.3 4.3 99.3Onshore Vizag-Vijaywada-Secunderabad pipeline 572 5.4 5.9 110.0Onshore Mundra-Delhi pipeline (1) 1054 5.0 7.0 140.0Onshore Ramanmandi-Bahadurgarh pipeline (2) 243 4.7 6.1 130.1Onshore Ramanmandi-Bathinda pipeline 30 2.1 1.0 48.3Onshore Awa-Salawas pipeline 93 - - -Onshore Bahadurgarh-Tikrikalan pipeline 14 - - -Onshore Rewari- Kanpur Pipeline 443 - - -Onshore ATF pipeline from Mumbai Refinery to Mumbai Airport (3) 20 1.1 0.5 43.4Onshore Black Oil Pipeline (BOPL) 22 1.5 0.4 29.5Onshore Lube Oil Pipeline : Trombay to Wadibundar (3) 17 1.0 0.5 48.6
Sub total HPCL 3015 25.1 21.5 85.8Onshore Mangalore-Hassan-Bengaluru (MHB) pipeline (1) Petronet MHB 363 5.6 3.4 60.0Onshore Numaligarh-Siliguri pipeline OIL 654 1.7 1.8 103.1
Total Petroleum product pipelines (w/o LPG pipelines ) 14061 94.7 77.7 82.1LPG PipelinesOnshore Panipat-Jalandhar pipeline(PJPL)(4)
IOCL280 0.7 0.6 88.3
Onshore Paradip Haldia Durgapur pipeline (5)(7) 673 1.3 0.5 38.0Onshore/offshore Mumbai-Uran pipeline BPCL 28 0.8 0.4 45.3Onshore Jamnagar-Loni pipeline
GAIL1414 2.5 2.9 114.0
Onshore Vizag-Secunderabad pipeline 618 1.3 1.1 84.5Onshore 'Mangalore-Hassan-Mysore-Solur LPG (3) HPCL 356 1.9 1.0 49.6
Total LPG pipelines 3369 8.5 6.4 74.9Total POL pipelines 17430 103 84 81.5
Table 5.3 : Existing major POL pipelines in India
Source: Oil Companies (P): ProvisionalNote: IOCL 1) Owing to DFCCIL (Dedicated Freight Corridor Corporation of India) work in BKPL, pipeline length increased to 857 Km. 2) DTPL has been de-commissioned in July 2018 3) Kolkata ATF pipeline commissioned on 30.08.2018 4) 6 Km pipeline from Panipat refinery to Kohand terminal of PJPL commissioned, hence PJPL length increased from 274 Km to 280 Km 5) PHDPL LPG Pipeline:After commissioning of Haldia-Durgapur section on 6.12.2018; Majhergram -Kalyani section on 8.12.2018 and Balasore-Haldia on 17.12.2018, pipeline length increased from 157 Km to 652
Km and capacity from 1.1 MMTPA to 1.27 MMTPA. 6) Koyali Sanganer Pipeline: After commissioning of Jaipur-Panipat naphtha pipeline, pipeline length increased from 1300 Km to 1644 Km. 7) PHDPL: With commissioning of Mahishrekha-BudgeBudge section on 27.03.2019, pipeline length increased from 652 Km to 673 Km. There is no change in capacity.BPCL(1) Kota-Jobner pipeline is a branch pipeline of Mumbai-Manmad-Bijwasan pipeline with annual capacity of 1.7 MMTPA.Throughput of this pipeline is included in MMBPL & BKPL pipelines. (2) Petronet CCK was merged with BPCL w.e.f 01.06.2018. HPCL (1) Throughput of Mundra-Delhi pipeline is including Throughputs (5.109 MMT) and capacities of branchlines viz. Awa Salawas Pipeline & Rewari Kanpur pipeline and reverse pumping(4.2036 MMT) from Bahadurgarh to Rewari.(2) Throughputs of Ramanmandi Bahadurgarh pipeline is including Throughputs (4.189 MMT) and capacities of branchlines viz. Bahadurgarh-TikriKalan Pipeline & Rewari-Kanpur pipeline. (3) Lube Oil pipeline and ATF pipeline from Mumbai Refinery to Mazgaon Terminal and Mumbai Airport are speciality product pipelines.Petronet MHB (1) Petronet MHB JV- ONGC & HPCL 26% each, Petronet- 12%, Public- 36%.

PPAC Ready Reckoner
38
SalesChapter-6
PPAC Ready Reckoner
39
(Million metric tonnes)
Products 2008-09 2009-10 2010-11 2011-12 2012-13 2013-14 2014-15 2015-16 2016-17 2017-18 2018-19 (P)
LPG 12.2 13.1 14.3 15.3 15.6 16.3 18.0 19.6 21.6 23.3 24.9
MS 11.3 12.8 14.2 15.0 15.7 17.1 19.1 21.8 23.8 26.2 28.3
Naphtha 13.9 10.1 10.7 11.2 12.3 11.3 11.1 13.3 13.2 12.9 14.1
ATF 4.4 4.6 5.1 5.5 5.3 5.5 5.7 6.3 7.0 7.6 8.3
SKO 9.3 9.3 8.9 8.2 7.5 7.2 7.1 6.8 5.4 3.8 3.5
HSD 51.7 56.2 60.1 64.8 69.1 68.4 69.4 74.6 76.0 81.1 83.5
LDO 0.6 0.5 0.5 0.4 0.4 0.4 0.4 0.4 0.4 0.5 0.6
Lubes 2.0 2.5 2.4 2.6 3.2 3.3 3.3 3.6 3.5 3.9 3.9
FO/LSHS 12.6 11.6 10.8 9.3 7.7 6.2 6.0 6.6 7.2 6.7 6.5
Bitumen 4.7 4.9 4.5 4.6 4.7 5.0 5.1 5.9 5.9 6.1 6.6
Petcoke 6.2 6.6 5.0 6.1 10.1 11.8 14.6 19.3 24.0 25.7 20.5
Others 4.7 5.4 4.6 4.9 5.5 6.0 5.9 6.4 6.6 8.3 11.0
All India 133.6 137.8 141.0 148.1 157.1 158.4 165.5 184.7 194.6 206.2 211.6
Growth (%) 3.6 3.2 2.3 5.0 6.1 0.9 4.5 11.6 5.4 5.9 2.7
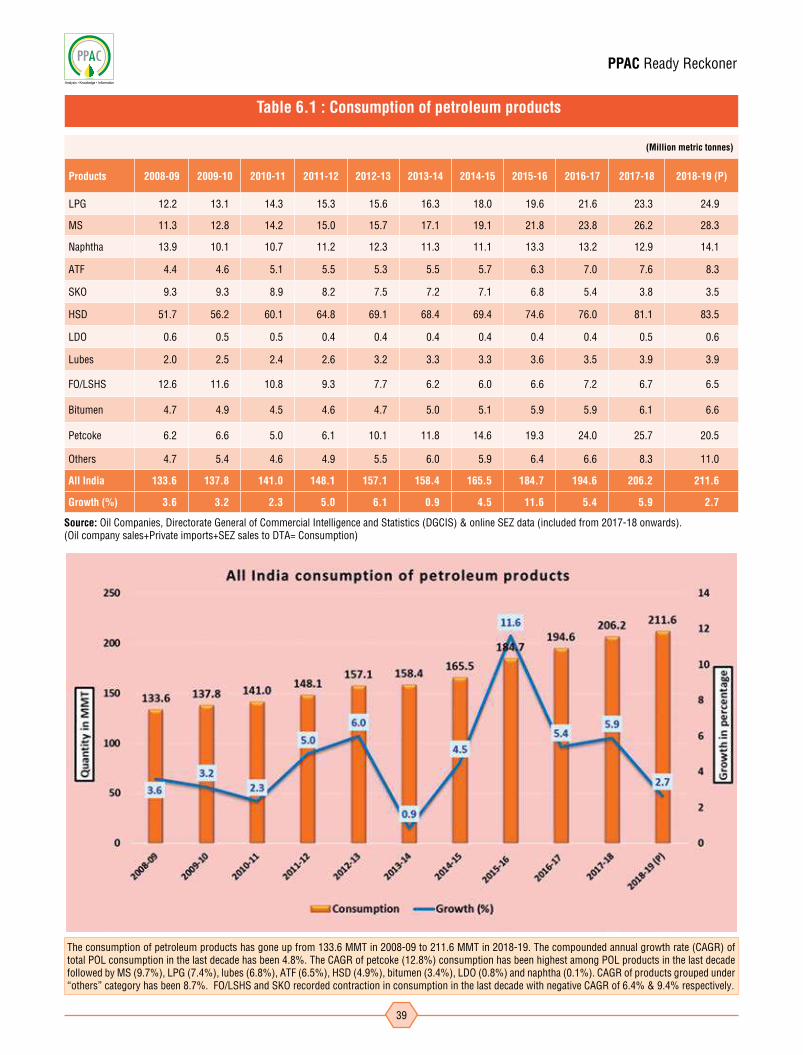
Table 6.1 : Consumption of petroleum products
Source: Oil Companies, Directorate General of Commercial Intelligence and Statistics (DGCIS) & online SEZ data (included from 2017-18 onwards). (Oil company sales+Private imports+SEZ sales to DTA= Consumption)
The consumption of petroleum products has gone up from 133.6 MMT in 2008-09 to 211.6 MMT in 2018-19. The compounded annual growth rate (CAGR) of total POL consumption in the last decade has been 4.8%. The CAGR of petcoke (12.8%) consumption has been highest among POL products in the last decade followed by MS (9.7%), LPG (7.4%), lubes (6.8%), ATF (6.5%), HSD (4.9%), bitumen (3.4%), LDO (0.8%) and naphtha (0.1%). CAGR of products grouped under “others” category has been 8.7%. FO/LSHS and SKO recorded contraction in consumption in the last decade with negative CAGR of 6.4% & 9.4% respectively.

PPAC Ready Reckoner
40
(Growth in percentage)
Products 2008-09 2009-10 2010-11 2011-12 2012-13 2013-14 2014-15 2015-16 2016-17 2017-18 2018-19 (P)
LPG 1.5 7.7 9.1 6.8 2.0 4.4 10.5 9.0 10.1 8.0 6.8
MS 9.0 13.9 10.7 5.6 5.0 8.8 11.4 14.5 8.8 10.1 8.1
Naphtha 4.6 -27.1 5.3 5.1 9.5 -8.0 -2.0 19.8 -0.2 -2.7 9.1
ATF -2.6 4.6 9.8 9.0 -4.8 4.4 4.0 9.4 11.8 9.1 9.1
SKO -0.7 0.0 -4.0 -7.8 -8.8 -4.5 -1.1 -3.7 -20.9 -28.8 -10.1
HSD 8.5 8.8 6.8 7.8 6.7 -1.0 1.5 7.5 1.8 6.6 3.0
LDO -17.3 -17.2 -0.4 -8.9 -4.0 -3.1 -5.4 11.5 10.3 16.7 14.2
Lubes -12.6 26.9 -4.3 8.4 21.4 3.4 0.1 7.9 -2.8 11.9 -0.4
FO/LSHS -1.0 -7.6 -7.2 -13.7 -17.7 -18.6 -4.4 11.3 7.8 -6.0 -3.2
Bitumen 5.3 3.9 -8.0 2.2 0.8 7.1 1.3 17.1 0.0 2.5 8.7
Petcoke 3.6 6.8 -24.4 23.2 65.1 16.0 23.8 32.6 24.2 7.1 -20.0
Others -15.2 13.7 -15.4 7.8 11.9 8.1 -1.4 8.2 3.8 26.5 31.6
All India 3.6 3.2 2.3 5.0 6.1 0.9 4.5 11.6 5.4 5.9 2.7
Table 6.2 : Consumption growth of petroleum products
Sl. no. End-use sectors % of total
sales *
(I) (II) (III)
1 Transport, of which 70.00
a Commercial vehicles 8.94
b Private vehicles 13.15
c 3 - Wheelers 6.39
d Truck 28.25
e Buses/STU 9.55
f Railways 3.24
g Others (Shipping & Aviation) 0.48
2 Agriculture 13.00
3 Industrial application 4.96
4 Power generation 4.06
5 Mobile towers 1.54
6 Others (Including private imports) 6.45
Total 100.0
End-use analysis of HSD sales (as of 2012-13)
* Figures include consumption through retail & direct imports. End use sector wise break up as per PPAC survey and direct sales as reported by oil companies for the year 2012-13.
Diesel consumption by sector (%)
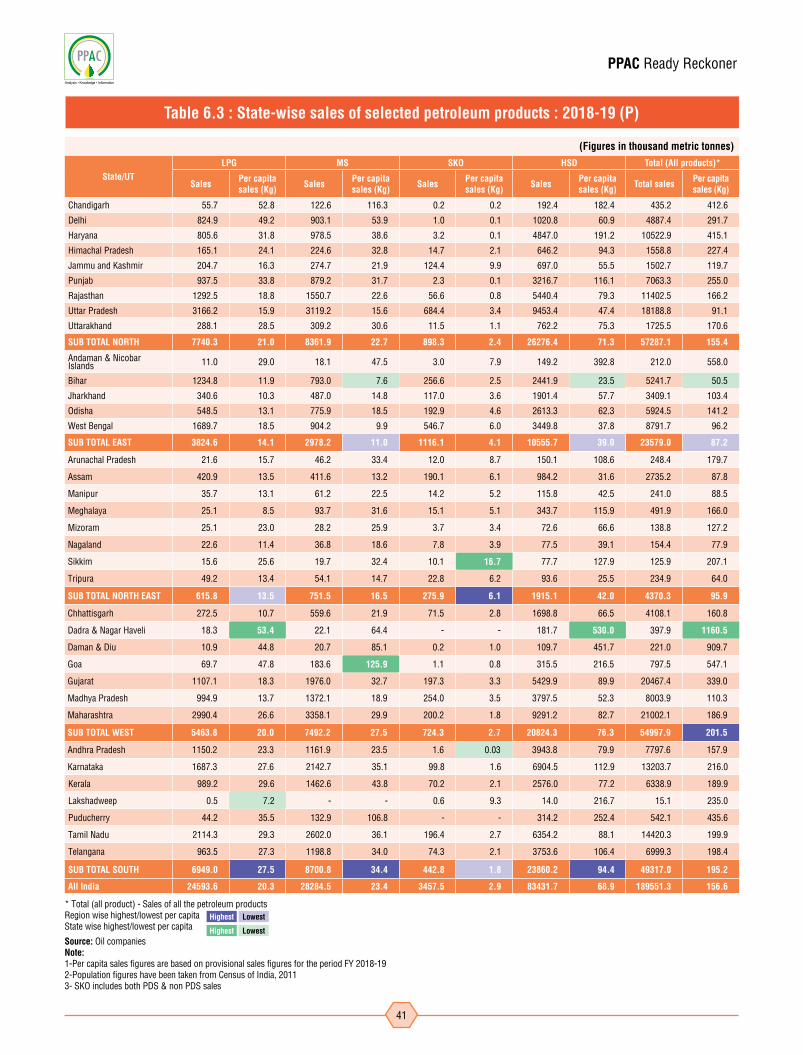
PPAC Ready Reckoner
41
* Total (all product) - Sales of all the petroleum productsRegion wise highest/lowest per capitaState wise highest/lowest per capita
Source: Oil companiesNote:1-Per capita sales figures are based on provisional sales figures for the period FY 2018-192-Population figures have been taken from Census of India, 20113- SKO includes both PDS & non PDS sales
Highest Lowest
Highest Lowest
(Figures in thousand metric tonnes)
State/UTLPG MS SKO HSD Total (All products)*
Sales Per capita sales (Kg) Sales Per capita
sales (Kg) Sales Per capita sales (Kg) Sales Per capita
sales (Kg) Total sales Per capita sales (Kg)
Chandigarh 55.7 52.8 122.6 116.3 0.2 0.2 192.4 182.4 435.2 412.6
Delhi 824.9 49.2 903.1 53.9 1.0 0.1 1020.8 60.9 4887.4 291.7
Haryana 805.6 31.8 978.5 38.6 3.2 0.1 4847.0 191.2 10522.9 415.1
Himachal Pradesh 165.1 24.1 224.6 32.8 14.7 2.1 646.2 94.3 1558.8 227.4
Jammu and Kashmir 204.7 16.3 274.7 21.9 124.4 9.9 697.0 55.5 1502.7 119.7
Punjab 937.5 33.8 879.2 31.7 2.3 0.1 3216.7 116.1 7063.3 255.0
Rajasthan 1292.5 18.8 1550.7 22.6 56.6 0.8 5440.4 79.3 11402.5 166.2
Uttar Pradesh 3166.2 15.9 3119.2 15.6 684.4 3.4 9453.4 47.4 18188.8 91.1
Uttarakhand 288.1 28.5 309.2 30.6 11.5 1.1 762.2 75.3 1725.5 170.6
SUB TOTAL NORTH 7740.3 21.0 8361.9 22.7 898.3 2.4 26276.4 71.3 57287.1 155.4
Andaman & Nicobar Islands 11.0 29.0 18.1 47.5 3.0 7.9 149.2 392.8 212.0 558.0
Bihar 1234.8 11.9 793.0 7.6 256.6 2.5 2441.9 23.5 5241.7 50.5
Jharkhand 340.6 10.3 487.0 14.8 117.0 3.6 1901.4 57.7 3409.1 103.4
Odisha 548.5 13.1 775.9 18.5 192.9 4.6 2613.3 62.3 5924.5 141.2
West Bengal 1689.7 18.5 904.2 9.9 546.7 6.0 3449.8 37.8 8791.7 96.2
SUB TOTAL EAST 3824.6 14.1 2978.2 11.0 1116.1 4.1 10555.7 39.0 23579.0 87.2
Arunachal Pradesh 21.6 15.7 46.2 33.4 12.0 8.7 150.1 108.6 248.4 179.7
Assam 420.9 13.5 411.6 13.2 190.1 6.1 984.2 31.6 2735.2 87.8
Manipur 35.7 13.1 61.2 22.5 14.2 5.2 115.8 42.5 241.0 88.5
Meghalaya 25.1 8.5 93.7 31.6 15.1 5.1 343.7 115.9 491.9 166.0
Mizoram 25.1 23.0 28.2 25.9 3.7 3.4 72.6 66.6 138.8 127.2
Nagaland 22.6 11.4 36.8 18.6 7.8 3.9 77.5 39.1 154.4 77.9
Sikkim 15.6 25.6 19.7 32.4 10.1 16.7 77.7 127.9 125.9 207.1
Tripura 49.2 13.4 54.1 14.7 22.8 6.2 93.6 25.5 234.9 64.0
SUB TOTAL NORTH EAST 615.8 13.5 751.5 16.5 275.9 6.1 1915.1 42.0 4370.3 95.9
Chhattisgarh 272.5 10.7 559.6 21.9 71.5 2.8 1698.8 66.5 4108.1 160.8
Dadra & Nagar Haveli 18.3 53.4 22.1 64.4 - - 181.7 530.0 397.9 1160.5
Daman & Diu 10.9 44.8 20.7 85.1 0.2 1.0 109.7 451.7 221.0 909.7
Goa 69.7 47.8 183.6 125.9 1.1 0.8 315.5 216.5 797.5 547.1
Gujarat 1107.1 18.3 1976.0 32.7 197.3 3.3 5429.9 89.9 20467.4 339.0
Madhya Pradesh 994.9 13.7 1372.1 18.9 254.0 3.5 3797.5 52.3 8003.9 110.3
Maharashtra 2990.4 26.6 3358.1 29.9 200.2 1.8 9291.2 82.7 21002.1 186.9
SUB TOTAL WEST 5463.8 20.0 7492.2 27.5 724.3 2.7 20824.3 76.3 54997.9 201.5
Andhra Pradesh 1150.2 23.3 1161.9 23.5 1.6 0.03 3943.8 79.9 7797.6 157.9
Karnataka 1687.3 27.6 2142.7 35.1 99.8 1.6 6904.5 112.9 13203.7 216.0
Kerala 989.2 29.6 1462.6 43.8 70.2 2.1 2576.0 77.2 6338.9 189.9
Lakshadweep 0.5 7.2 - - 0.6 9.3 14.0 216.7 15.1 235.0
Puducherry 44.2 35.5 132.9 106.8 - - 314.2 252.4 542.1 435.6
Tamil Nadu 2114.3 29.3 2602.0 36.1 196.4 2.7 6354.2 88.1 14420.3 199.9
Telangana 963.5 27.3 1198.8 34.0 74.3 2.1 3753.6 106.4 6999.3 198.4
SUB TOTAL SOUTH 6949.0 27.5 8700.8 34.4 442.8 1.8 23860.2 94.4 49317.0 195.2
All India 24593.6 20.3 28284.5 23.4 3457.5 2.9 83431.7 68.9 189551.3 156.6
Table 6.3 : State-wise sales of selected petroleum products : 2018-19 (P)

PPAC Ready Reckoner
42
(Figures in thousand kilo litres)
State/UT 2014-15 2015-16 2016-17 2017-18 2018-19 (P)Allocn Sales Allocn Sales Allocn Sales Allocn Sales Allocn Sales
Chandigarh 3.3 2.4 3.0 0.9 0.0 0.0 0.0 0.0 0.0 0.0Delhi 0.0 0.0 0.0 0.0 0.0 0.0 0.0 0.0 0.0 0.0Haryana 90.1 89.2 88.3 70.6 66.3 35.9 0.0 0.0 0.0 0.0Himachal Pradesh 24.6 24.6 24.1 24.1 18.1 17.9 14.5 14.4 14.5 14.3Jammu & Kashmir 90.2 86.4 81.2 80.1 73.1 67.9 58.5 57.6 58.5 53.9Punjab 89.7 88.7 85.4 83.2 74.3 62.3 0.0 0.0 0.0 0.0Rajasthan 505.3 497.1 495.2 481.5 371.4 355.8 260.0 110.5 138.0 69.3Uttar Pradesh 1589.4 1585.5 1557.6 1556.7 1168.2 1167.6 911.2 901.3 887.9 873.5Uttarakhand 35.9 35.7 35.2 35.0 31.7 31.2 25.3 13.3 25.3 10.0SUB TOTAL NORTH 2428.6 2409.5 2370.0 2332.1 1803.1 1738.5 1269.5 1097.0 1124.2 1021.0
Andaman & Nicobar Islands 6.4 5.6 5.8 5.8 5.2 4.9 4.1 4.0 4.1 3.8Bihar 813.0 804.3 796.7 794.7 710.7 705.3 495.4 490.3 332.6 329.6Jharkhand 267.9 267.3 262.6 260.5 219.7 219.0 186.8 176.3 186.8 150.3Odisha 397.7 396.1 389.7 385.1 292.3 283.0 248.4 244.3 248.4 247.7West Bengal 962.6 960.9 943.3 942.1 788.9 788.3 704.0 653.6 704.0 699.3SUB TOTAL EAST 2447.6 2434.2 2398.1 2388.1 2016.8 2000.4 1638.8 1568.5 1476.0 1430.7
Arunachal Pradesh 11.5 11.4 10.3 10.3 9.3 9.1 7.9 7.7 7.9 7.2Assam 327.9 327.8 321.4 321.0 289.2 287.8 245.9 245.0 245.9 242.6Manipur 25.0 24.8 23.4 23.3 21.1 15.2 17.9 18.2 17.9 17.7Meghalaya 25.9 25.9 25.4 25.4 22.9 22.7 19.4 19.4 19.4 19.3Mizoram 7.4 7.4 6.7 6.6 6.0 6.0 4.8 4.8 4.8 4.8Nagaland 17.1 17.1 16.8 16.8 15.1 9.0 12.2 9.5 10.3 9.8Sikkim 6.3 6.3 5.7 5.7 4.3 4.3 3.5 3.4 3.5 3.4Tripura 39.2 39.2 38.4 38.4 34.6 34.5 29.4 29.4 29.4 29.3SUB TOTAL NORTH EAST 460.3 460.1 448.0 447.5 402.4 388.7 340.9 337.4 339.0 334.0
Chhattisgarh 175.8 167.5 172.3 159.1 135.4 121.7 115.1 92.7 115.1 91.5Dadra & Nagar Haveli 2.0 2.0 1.8 1.8 1.7 1.7 0.3 0.3 0.0 0.0Daman & Diu 0.9 0.9 0.8 0.8 0.8 0.5 0.1 0.0 0.0 0.0Goa 5.2 5.2 5.1 5.0 4.6 2.6 2.3 1.4 2.1 1.4Gujarat 670.8 670.5 657.3 657.0 493.0 492.7 344.5 338.2 249.7 248.7Madhya Pradesh 625.6 587.2 589.8 580.1 442.4 427.2 345.0 336.9 336.2 325.9Maharashtra 695.8 695.6 626.3 614.0 563.6 518.0 384.7 377.8 286.7 241.9SUB TOTAL WEST 2176.1 2128.8 2053.5 2018.0 1641.4 1564.3 1192.0 1147.2 989.8 909.5
Andhra Pradesh 320.6 284.9 266.7 232.0 225.7 191.5 56.4 26.6 0.0 0.0Karnataka 522.8 504.3 509.8 484.2 287.5 260.3 156.0 126.5 156.0 112.5Kerala 120.2 120.2 117.8 117.7 88.3 88.3 58.7 58.7 55.6 55.6Lakshadweep 1.0 1.0 1.0 1.0 0.9 0.9 0.8 0.8 0.8 0.8Puducherry 4.3 4.2 4.3 4.2 3.8 3.8 0.8 0.7 0.0 0.0Tamil Nadu 348.7 348.7 341.7 341.7 307.6 307.6 204.5 204.9 193.8 193.8Telengana 145.4 182.4 174.5 170.1 155.4 133.9 103.4 100.8 97.9 94.3SUB TOTAL SOUTH 1463.0 1445.8 1415.7 1351.0 1069.3 986.4 580.6 519.0 504.1 456.9
All India 8975.5 8878.4 8685.4 8536.8 6933.0 6678.4 5021.8 4669.2 4433.0 4152.1
Table 6.4 : PDS SKO allocation
Allocn= Allocation Source: MoP&NG• Delhi and Chandigarh have been declared kerosene-free from Q3, 2013-14 and Q1, 2016-17 respectively. Punjab and Haryana have been declared kerosene-free from Q1, 2017-18. PDS SKO allocation for Dadra & Nagar Haveli and Daman & Diu has been reduced to “Zero” from Q2, 2017-18. PDS SKO allocation of Puducherry and Andhra Pradesh has been reduced to “Zero” wef 01.09.2017 and 01.10.2017 respectively.• On an all India basis, the drop in allocation in the last five years (2014-15 to 2018-19) has been 50.6% due to voluntary surrender of PDS SKO allocation by some of the states in addition to nil PDS SKO allocation to the above states. The allocation drop has been steepest in the Southern region (65.5%) followed by Western region (54.5%), Northern region (53.7%), Eastern region (39.7%) and North Eastern region (26.4%).

PPAC Ready Reckoner
43
State/UTNumber of Retail Outlets (as on) Number of SKO / LDO agencies (as on)
1.4.2015 1.4.2016 1.4.2017 1.4.2018 1.4.2019 (P) 1.4.2015 1.4.2016 1.4.2017 1.4.2018 1.4.2019 (P)
Chandigarh 41 41 41 41 42 12 12 12 12 12
Delhi 394 395 396 397 398 117 116 116 116 116
Haryana 2419 2534 2726 2862 2943 141 141 141 141 141
Himachal Pradesh 382 396 414 432 441 26 26 26 26 26
Jammu and Kashmir 475 485 494 503 507 47 47 47 47 47
Punjab 3248 3316 3380 3427 3443 241 239 237 237 237
Rajasthan 3465 3736 4116 4476 4672 252 250 250 250 250
Uttar Pradesh 6247 6616 7069 7473 7779 696 696 696 696 695
Uttarakhand 514 551 570 590 599 73 73 73 73 73
SUB TOTAL NORTH 17185 18070 19206 20201 20824 1605 1600 1598 1598 1597
Andaman & Nicobar Islands 9 10 12 14 14 2 2 2 2 2
Bihar 2385 2511 2604 2695 2862 372 372 372 372 371
Jharkhand 1082 1151 1189 1207 1220 87 87 87 87 87
Odisha 1464 1560 1639 1681 1702 177 177 177 177 177
West Bengal 2178 2244 2299 2333 2354 458 458 458 458 458
SUB TOTAL EAST 7118 7476 7743 7930 8152 1096 1096 1096 1096 1095
Arunachal Pradesh 71 71 74 85 94 33 33 33 33 33
Assam 759 788 828 871 895 359 359 359 359 359
Manipur 83 85 85 97 104 36 36 36 36 36
Meghalaya 179 190 198 203 209 35 35 35 35 35
Mizoram 33 36 37 41 43 19 19 19 19 19
Nagaland 68 69 70 73 79 19 19 19 19 19
Sikkim 46 47 50 51 51 12 12 12 12 12
Tripura 64 67 68 71 72 40 40 40 40 40
SUB TOTAL NORTH EAST 1303 1353 1410 1492 1547 553 553 553 553 553
Chhattisgarh 1040 1108 1176 1249 1275 108 108 108 108 108
Dadra & Nagar Haveli 31 31 31 31 31 2 2 2 2 2
Daman & Diu 31 31 32 32 32 5 5 5 5 5
Goa 111 114 115 116 118 22 22 22 22 22
Gujarat 3050 3384 3765 4025 4166 480 480 478 476 473
Madhya Pradesh 3005 3269 3528 3711 3817 285 284 284 284 284
Maharashtra 5207 5419 5684 5970 6179 769 767 767 767 767
SUB TOTAL WEST 12475 13356 14331 15134 15618 1671 1668 1666 1664 1661
Andhra Pradesh 2811 3004 3197 3336 3425 414 413 413 413 413
Karnataka 3737 3836 4027 4215 4376 325 324 323 318 315
Kerala 1932 2009 2048 2100 2130 237 237 237 237 237
Lakshadweep 0 0 0 0 0 0 0 0 0 0
Puducherry 153 156 160 165 164 8 8 8 8 8
Tamil Nadu 4616 4702 5039 5387 5625 468 466 466 466 466
Telangana 2088 2228 2434 2625 2764 183 183 183 183 183
SUB TOTAL SOUTH 15337 15935 16905 17828 18484 1635 1631 1630 1625 1622
All India 53418 56190 59595 62585 64625 6560 6548 6543 6536 6528
Source: Oil companies (Includes dealers of private oil companies)
• On an all India basis the percentage growth in the number of retail outlets in the last five years (2014-15 to 2018-19) has been 21%. The region wise growth is highest for the Western region (25.3%), followed by Northern region (21.2%), Southern region (20.5%), North Eastern region (18.6%) and Eastern region (14.4%).
• As many states have become kerosene free in the last five years and due to voluntary surrender of PDS kerosene quota by some others there has been a decline in the number of kerosene dealers in the country.
Table 6.5 : Oil industry Retail Outlets & SKO / LDO agencies

PPAC Ready Reckoner
44
Category wise SKO/LDO dealers (Total 6528) on 01.04.2019
Note:(1) SC: Scheduled Caste; ST: Scheduled Tribe; UG: Unemployed Graduate; UEG: Unemployed Engineering Graduate.; PH: Physically Handicapped; DEF: Defence Category; FF: Freedom Fighter; OSP: Outstanding Sports Persons; OBC: Other Backward Classes; PMP: Para Military/Police/Govt. Personnel; Others: Includes Social Worker Category, Dealerships given on compassionate grounds/ under discretionary quota, 2/3 wheeler outlets and Company Owned and Operated outlets, Operation Vijay. (2) SKO /LDO dealers are only PSU OMP dealers.
Particulars IOCL BPCL HPCL RIL NEL## Shell Others Total
POL terminal/depots (Nos.)$ 125 78 83 18 3 - 6 313
Aviation fuel stations (Nos.)@ 116 56 42 30 - - 1 245
Retail Outlets (total) (Nos.),^ 27,702 14,803 15,440 1,400 5,128 145 7 64,625
out of which Rural ROs (Nos.) 7,857 2,702 3,478 127 1,811 20 - 15,995
SKO/LDO agencies (Nos.) 3,889 1,001 1,638 - - - - 6,528
LPG distributors (total) (Nos.) (PSUs only) 11,964 5,907 5,866 - - - - 23,737
LPG bottling plants (Nos.) (PSUs only)# 89 51 49 - - - 3 192
LPG bottling capacity (TMTPA) (PSUs only)& 9,666 4,182 4,317 - - - 173 18,338
LPG active domestic consumers (Nos. crore) (PSUs only) 12.4 6.8 7.3 - - - - 26.5
Table 6.6 : Industry marketing infrastructure as on 01.04.2019 (P)
$(RIL= 5 terminals and 13 mini depots, Others=4 MRPL & 2 NRL); @(Others=Shell-MRPL -1); ^(Others=MRPL-7); #(Others=NRL-1, OIL-1, CPCL-1); &(Others=NRL-30, OIL-23, CPCL-120); ##Nayara Energy Limited (formerly Essar Oil Limited).
Source: Oil companies
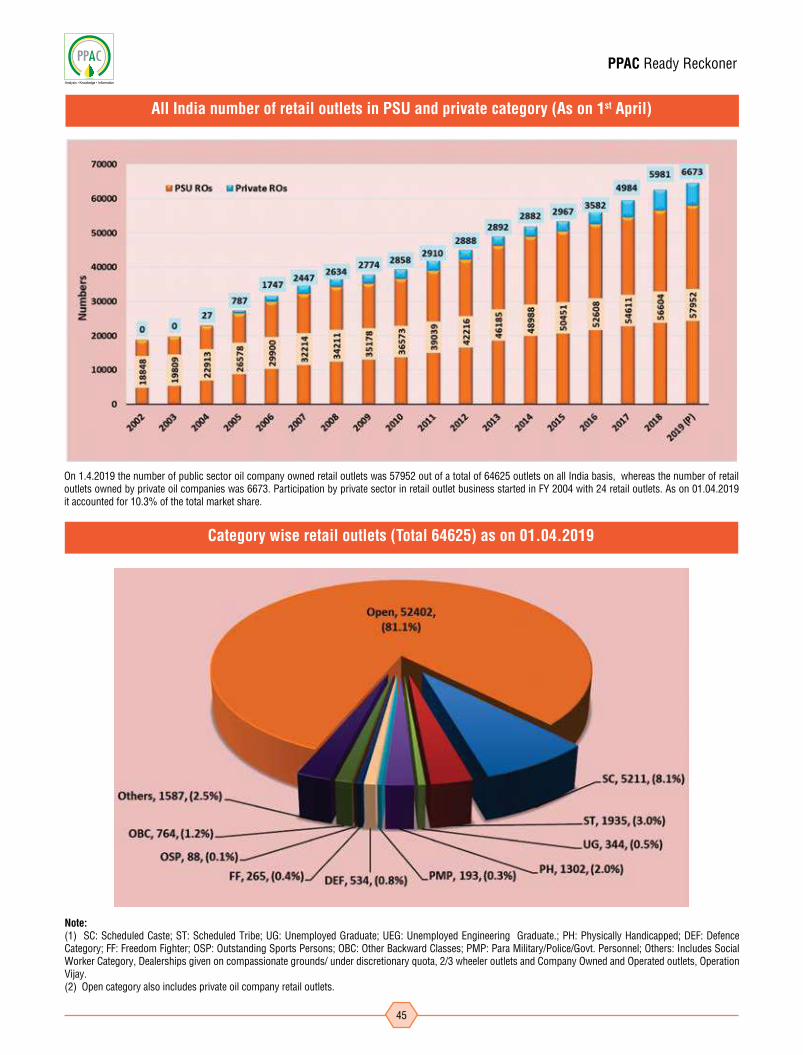
PPAC Ready Reckoner
45
Category wise retail outlets (Total 64625) as on 01.04.2019
On 1.4.2019 the number of public sector oil company owned retail outlets was 57952 out of a total of 64625 outlets on all India basis, whereas the number of retail outlets owned by private oil companies was 6673. Participation by private sector in retail outlet business started in FY 2004 with 24 retail outlets. As on 01.04.2019 it accounted for 10.3% of the total market share.
All India number of retail outlets in PSU and private category (As on 1st April)
Note:(1) SC: Scheduled Caste; ST: Scheduled Tribe; UG: Unemployed Graduate; UEG: Unemployed Engineering Graduate.; PH: Physically Handicapped; DEF: Defence Category; FF: Freedom Fighter; OSP: Outstanding Sports Persons; OBC: Other Backward Classes; PMP: Para Military/Police/Govt. Personnel; Others: Includes Social Worker Category, Dealerships given on compassionate grounds/ under discretionary quota, 2/3 wheeler outlets and Company Owned and Operated outlets, Operation Vijay. (2) Open category also includes private oil company retail outlets.
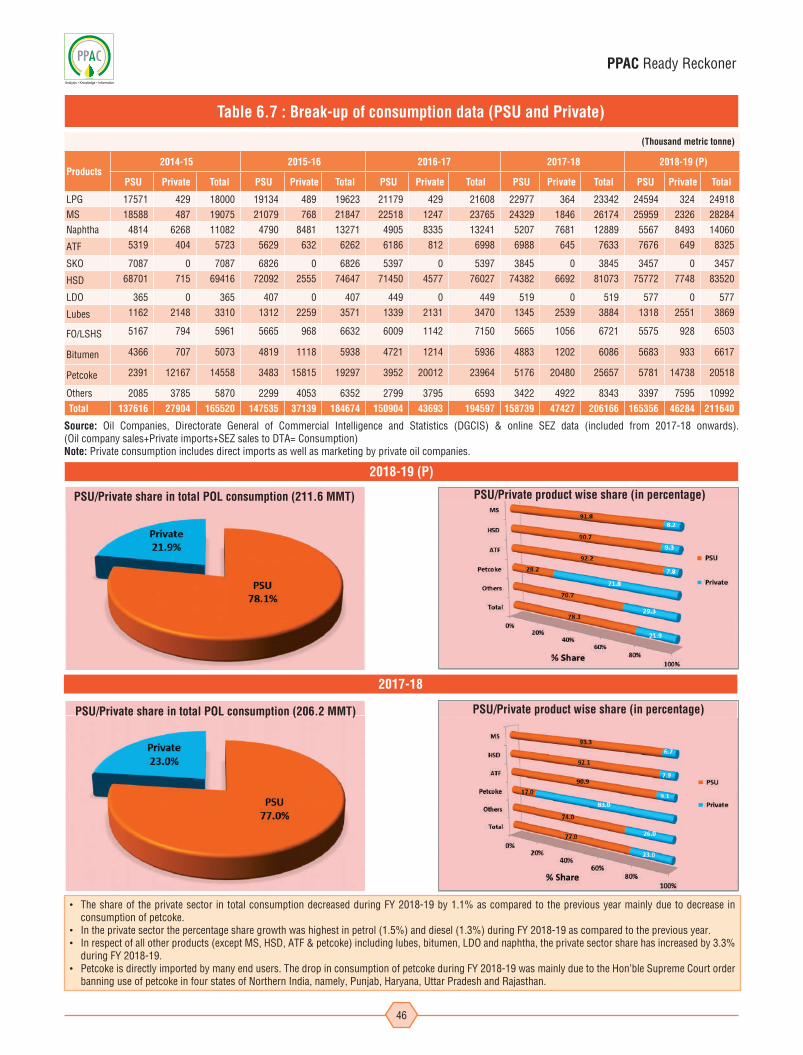
PPAC Ready Reckoner
46
(Thousand metric tonne)
Products 2014-15 2015-16 2016-17 2017-18 2018-19 (P)
PSU Private Total PSU Private Total PSU Private Total PSU Private Total PSU Private Total
LPG 17571 429 18000 19134 489 19623 21179 429 21608 22977 364 23342 24594 324 24918
MS 18588 487 19075 21079 768 21847 22518 1247 23765 24329 1846 26174 25959 2326 28284
Naphtha 4814 6268 11082 4790 8481 13271 4905 8335 13241 5207 7681 12889 5567 8493 14060
ATF 5319 404 5723 5629 632 6262 6186 812 6998 6988 645 7633 7676 649 8325
SKO 7087 0 7087 6826 0 6826 5397 0 5397 3845 0 3845 3457 0 3457
HSD 68701 715 69416 72092 2555 74647 71450 4577 76027 74382 6692 81073 75772 7748 83520
LDO 365 0 365 407 0 407 449 0 449 519 0 519 577 0 577
Lubes 1162 2148 3310 1312 2259 3571 1339 2131 3470 1345 2539 3884 1318 2551 3869
FO/LSHS 5167 794 5961 5665 968 6632 6009 1142 7150 5665 1056 6721 5575 928 6503
Bitumen 4366 707 5073 4819 1118 5938 4721 1214 5936 4883 1202 6086 5683 933 6617
Petcoke 2391 12167 14558 3483 15815 19297 3952 20012 23964 5176 20480 25657 5781 14738 20518
Others 2085 3785 5870 2299 4053 6352 2799 3795 6593 3422 4922 8343 3397 7595 10992
Total 137616 27904 165520 147535 37139 184674 150904 43693 194597 158739 47427 206166 165356 46284 211640
Table 6.7 : Break-up of consumption data (PSU and Private)
Source: Oil Companies, Directorate General of Commercial Intelligence and Statistics (DGCIS) & online SEZ data (included from 2017-18 onwards). (Oil company sales+Private imports+SEZ sales to DTA= Consumption)Note: Private consumption includes direct imports as well as marketing by private oil companies.
PSU/Private share in total POL consumption (211.6 MMT)
2018-19 (P)
2017-18
PSU/Private share in total POL consumption (206.2 MMT) PSU/Private product wise share (in percentage)
PSU/Private product wise share (in percentage)
• The share of the private sector in total consumption decreased during FY 2018-19 by 1.1% as compared to the previous year mainly due to decrease in consumption of petcoke.
• In the private sector the percentage share growth was highest in petrol (1.5%) and diesel (1.3%) during FY 2018-19 as compared to the previous year.• In respect of all other products (except MS, HSD, ATF & petcoke) including lubes, bitumen, LDO and naphtha, the private sector share has increased by 3.3%
during FY 2018-19.• Petcoke is directly imported by many end users. The drop in consumption of petcoke during FY 2018-19 was mainly due to the Hon’ble Supreme Court order
banning use of petcoke in four states of Northern India, namely, Punjab, Haryana, Uttar Pradesh and Rajasthan.
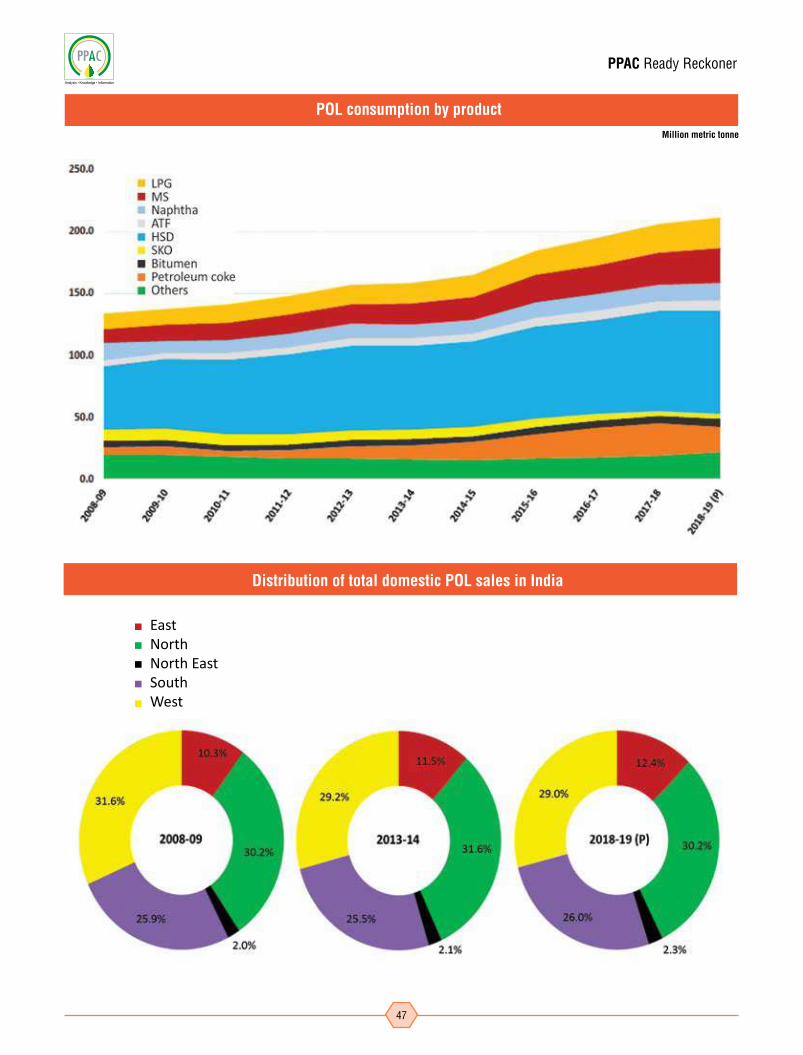
PPAC Ready Reckoner
47
POL consumption by product
Distribution of total domestic POL sales in India
Million metric tonne
EastNorthNorth EastSouthWest
PPAC Ready Reckoner
48
LPG
Chapter-7

PPAC Ready Reckoner
49
Source: Oil companies & Directorate General of Commercial Intelligence and Statistics (DGCIS)Note: 1. Data in respect of enrolment, customers, distributors, ALDS and rated bottling capacity pertain to PSU OMCs only.2. Gross tankage includes LPG tankage at LPG bottling plants owned by PSU oil companies, all refineries, fractionators and LPG import terminals.3. MOPNG vide letter no. P-20019/2/2016-LPG dated 23 June 2016 had issued unified guidelines for selection of LPG distributors. In the said guidelines, LPG
distributor categories have been redefined. The historical data on LPG distributors has been rearranged in line with the new classification for comparison.
Particulars 2014-15 2015-16 2016-17 2017-18 2018-19 (P)
(Thousand metric tonne )
LPG production 9840 10568 11253 12364 12786 LPG consumption 18000 19623 21608 23342 24918 PSU sales 17571 19134 21179 22977 24594 of which:
Domestic 16040 17182 18871 20352 21733 Non-Domestic 1051 1464 1776 2086 2359 Bulk 316 317 364 355 322 Auto LPG 164 171 167 184 180
Imports 8313 8959 11097 11379 13194 of which:
PSU imports 7884 8470 10668 11015 12870 Private imports 429 489 429 364 324
(Lakh) Enrolment (domestic) 163.4 204.5 331.7 284.7 455.1
As on 1.4.2015 1.4.2016 1.4.2017 1.4.2018 1.4.2019 LPG active domestic customers 1,486 1,663 1,988 2,243 2,654 of which:
PMUY beneficiaries - - 200.3 356.0 719.0Non-domestic customers 21.1 23.3 25.3 27.9 30.2
(Percent) LPG coverage (Estimated) 56.2 61.9 72.8 80.9 94.3
(Nos.) LPG distributors 15930 17916 18786 20146 23737 of which:
Shehri Vitrak 7334 7492 7677 7821 7908 Rurban Vitrak 2263 2852 3152 3463 3626 Gramin & Durgam Kshetriya Vitrak 6333 7572 7957 8862 12203
Auto LPG dispensing stations (ALDS) 681 676 675 672 661 (Thousand metric tonne per annum)
Bottling capacity (rated) 14044 15172 16264 17395 18338 (Thousand metric tonne)
Gross tankage 781 869 878 912 929
Table 7.1 : LPG marketing at a glance
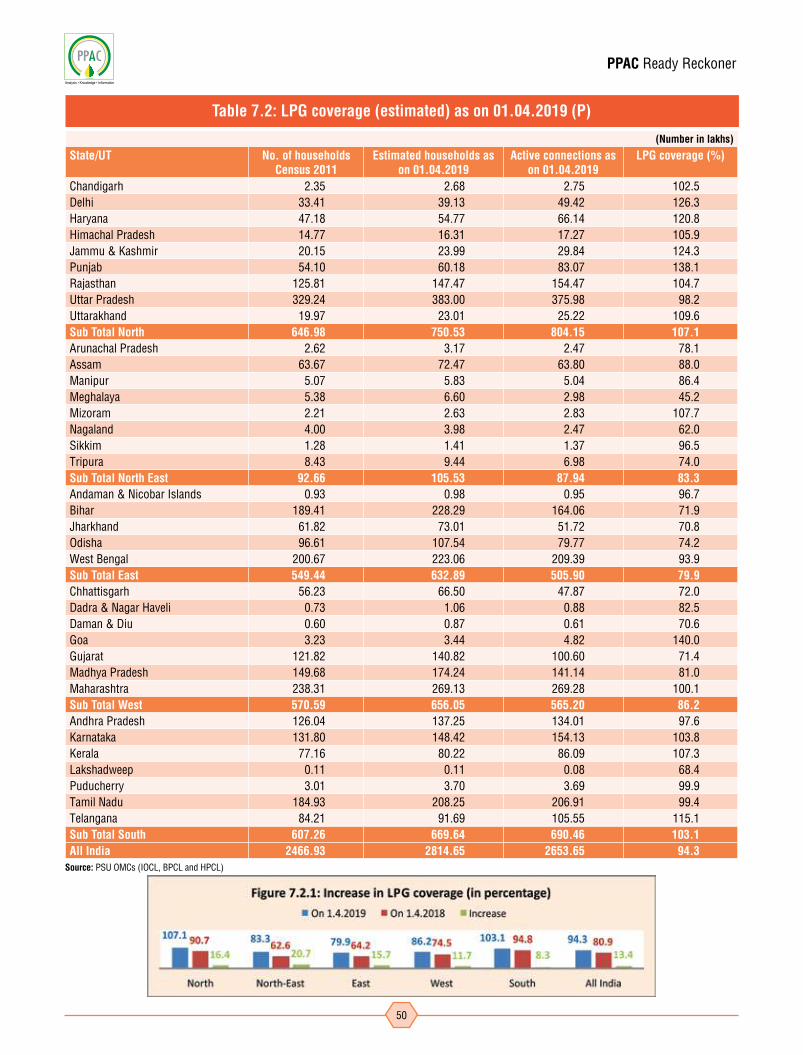
PPAC Ready Reckoner
50
(Number in lakhs)
State/UT No. of households Census 2011
Estimated households as on 01.04.2019
Active connections as on 01.04.2019
LPG coverage (%)
Chandigarh 2.35 2.68 2.75 102.5Delhi 33.41 39.13 49.42 126.3Haryana 47.18 54.77 66.14 120.8Himachal Pradesh 14.77 16.31 17.27 105.9Jammu & Kashmir 20.15 23.99 29.84 124.3Punjab 54.10 60.18 83.07 138.1Rajasthan 125.81 147.47 154.47 104.7Uttar Pradesh 329.24 383.00 375.98 98.2Uttarakhand 19.97 23.01 25.22 109.6Sub Total North 646.98 750.53 804.15 107.1Arunachal Pradesh 2.62 3.17 2.47 78.1Assam 63.67 72.47 63.80 88.0Manipur 5.07 5.83 5.04 86.4Meghalaya 5.38 6.60 2.98 45.2Mizoram 2.21 2.63 2.83 107.7Nagaland 4.00 3.98 2.47 62.0Sikkim 1.28 1.41 1.37 96.5Tripura 8.43 9.44 6.98 74.0Sub Total North East 92.66 105.53 87.94 83.3Andaman & Nicobar Islands 0.93 0.98 0.95 96.7Bihar 189.41 228.29 164.06 71.9Jharkhand 61.82 73.01 51.72 70.8Odisha 96.61 107.54 79.77 74.2West Bengal 200.67 223.06 209.39 93.9Sub Total East 549.44 632.89 505.90 79.9Chhattisgarh 56.23 66.50 47.87 72.0Dadra & Nagar Haveli 0.73 1.06 0.88 82.5Daman & Diu 0.60 0.87 0.61 70.6Goa 3.23 3.44 4.82 140.0Gujarat 121.82 140.82 100.60 71.4Madhya Pradesh 149.68 174.24 141.14 81.0Maharashtra 238.31 269.13 269.28 100.1Sub Total West 570.59 656.05 565.20 86.2Andhra Pradesh 126.04 137.25 134.01 97.6Karnataka 131.80 148.42 154.13 103.8Kerala 77.16 80.22 86.09 107.3Lakshadweep 0.11 0.11 0.08 68.4Puducherry 3.01 3.70 3.69 99.9Tamil Nadu 184.93 208.25 206.91 99.4Telangana 84.21 91.69 105.55 115.1Sub Total South 607.26 669.64 690.46 103.1All India 2466.93 2814.65 2653.65 94.3
Table 7.2: LPG coverage (estimated) as on 01.04.2019 (P)
Source: PSU OMCs (IOCL, BPCL and HPCL)
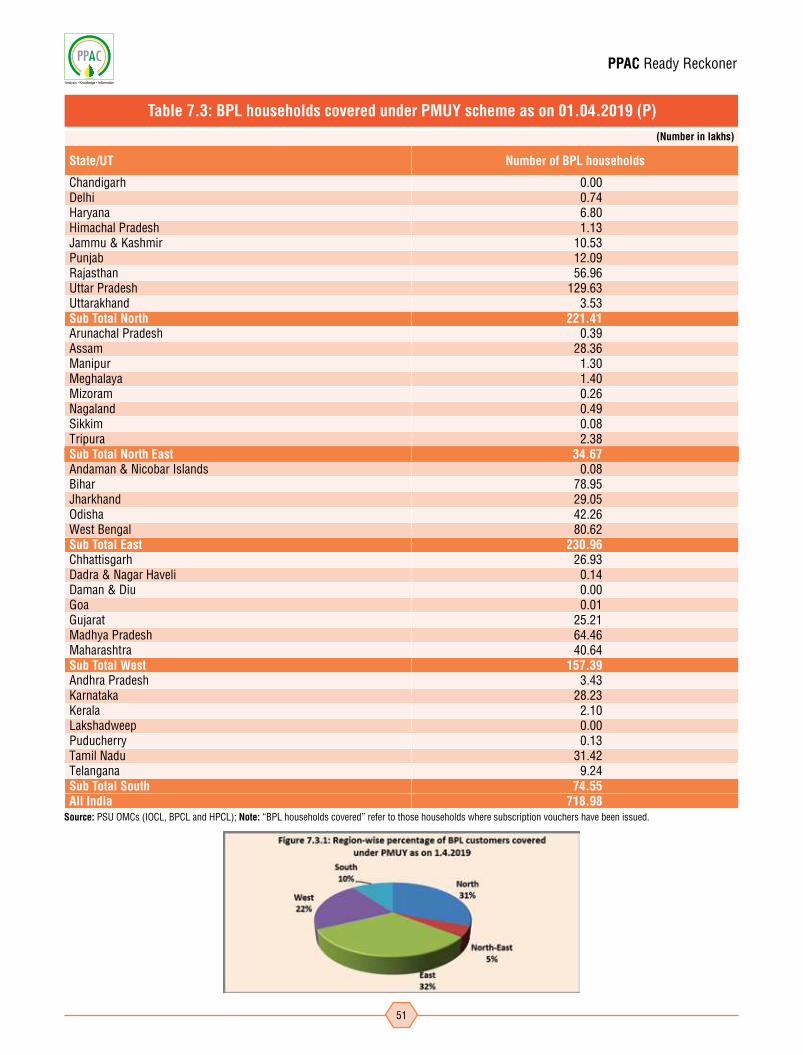
PPAC Ready Reckoner
51
(Number in lakhs)
State/UT Number of BPL households
Chandigarh 0.00Delhi 0.74Haryana 6.80Himachal Pradesh 1.13Jammu & Kashmir 10.53Punjab 12.09Rajasthan 56.96Uttar Pradesh 129.63Uttarakhand 3.53Sub Total North 221.41Arunachal Pradesh 0.39Assam 28.36Manipur 1.30Meghalaya 1.40Mizoram 0.26Nagaland 0.49Sikkim 0.08Tripura 2.38Sub Total North East 34.67Andaman & Nicobar Islands 0.08Bihar 78.95Jharkhand 29.05Odisha 42.26West Bengal 80.62Sub Total East 230.96Chhattisgarh 26.93Dadra & Nagar Haveli 0.14Daman & Diu 0.00Goa 0.01Gujarat 25.21Madhya Pradesh 64.46Maharashtra 40.64Sub Total West 157.39Andhra Pradesh 3.43Karnataka 28.23Kerala 2.10Lakshadweep 0.00Puducherry 0.13Tamil Nadu 31.42Telangana 9.24Sub Total South 74.55All India 718.98
Table 7.3: BPL households covered under PMUY scheme as on 01.04.2019 (P)
Source: PSU OMCs (IOCL, BPCL and HPCL); Note: “BPL households covered” refer to those households where subscription vouchers have been issued.
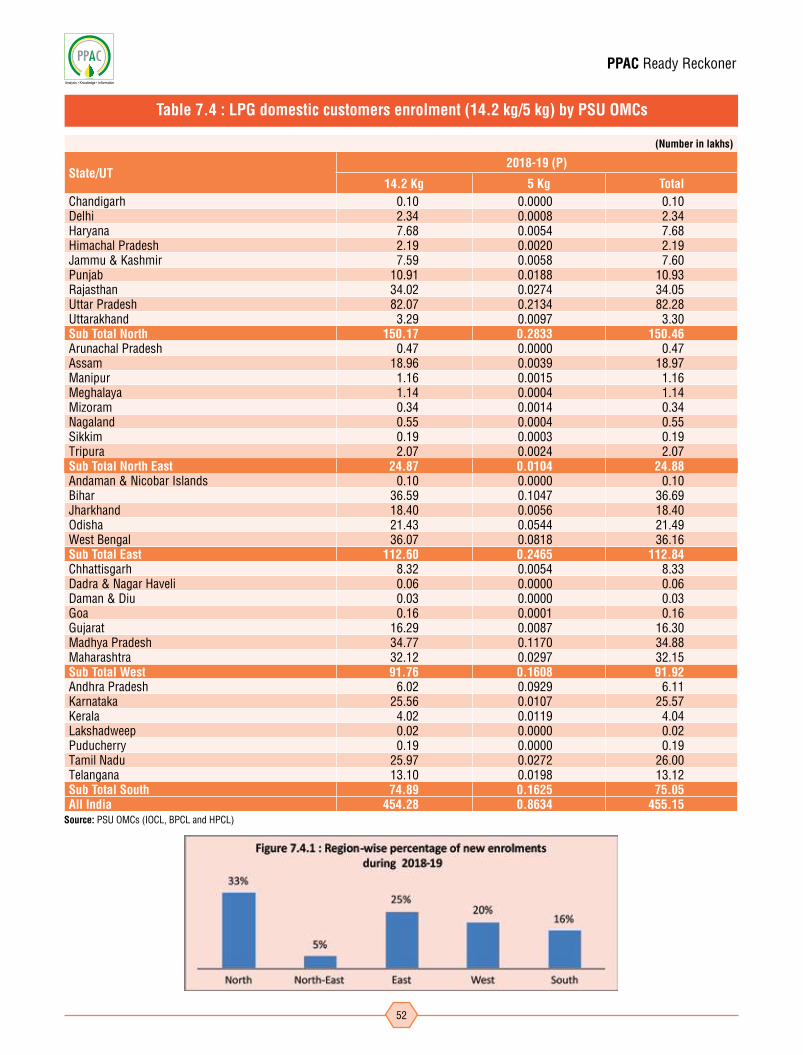
PPAC Ready Reckoner
52
(Number in lakhs)
State/UT2018-19 (P)
14.2 Kg 5 Kg TotalChandigarh 0.10 0.0000 0.10Delhi 2.34 0.0008 2.34Haryana 7.68 0.0054 7.68Himachal Pradesh 2.19 0.0020 2.19Jammu & Kashmir 7.59 0.0058 7.60Punjab 10.91 0.0188 10.93Rajasthan 34.02 0.0274 34.05Uttar Pradesh 82.07 0.2134 82.28Uttarakhand 3.29 0.0097 3.30Sub Total North 150.17 0.2833 150.46Arunachal Pradesh 0.47 0.0000 0.47Assam 18.96 0.0039 18.97Manipur 1.16 0.0015 1.16Meghalaya 1.14 0.0004 1.14Mizoram 0.34 0.0014 0.34Nagaland 0.55 0.0004 0.55Sikkim 0.19 0.0003 0.19Tripura 2.07 0.0024 2.07Sub Total North East 24.87 0.0104 24.88Andaman & Nicobar Islands 0.10 0.0000 0.10Bihar 36.59 0.1047 36.69Jharkhand 18.40 0.0056 18.40Odisha 21.43 0.0544 21.49West Bengal 36.07 0.0818 36.16Sub Total East 112.60 0.2465 112.84Chhattisgarh 8.32 0.0054 8.33Dadra & Nagar Haveli 0.06 0.0000 0.06Daman & Diu 0.03 0.0000 0.03Goa 0.16 0.0001 0.16Gujarat 16.29 0.0087 16.30Madhya Pradesh 34.77 0.1170 34.88Maharashtra 32.12 0.0297 32.15Sub Total West 91.76 0.1608 91.92Andhra Pradesh 6.02 0.0929 6.11Karnataka 25.56 0.0107 25.57Kerala 4.02 0.0119 4.04Lakshadweep 0.02 0.0000 0.02Puducherry 0.19 0.0000 0.19Tamil Nadu 25.97 0.0272 26.00Telangana 13.10 0.0198 13.12Sub Total South 74.89 0.1625 75.05All India 454.28 0.8634 455.15
Table 7.4 : LPG domestic customers enrolment (14.2 kg/5 kg) by PSU OMCs
Source: PSU OMCs (IOCL, BPCL and HPCL)

PPAC Ready Reckoner
53
(Nos.)
State/UT Sheheri Vitrak Rurban Vitrak Gramin Vitrak Durgam Kshetriya Vitrak Total
Chandigarh 27 0 0 0 27Delhi 323 0 0 0 323Haryana 279 99 222 14 614Himachal Pradesh 69 13 87 27 196Jammu & Kashmir 130 42 70 40 282Punjab 335 247 238 31 851Rajasthan 439 159 582 153 1333Uttar Pradesh 1008 700 2073 271 4052Uttarakhand 113 107 60 26 306Sub Total North 2723 1367 3332 562 7984Arunachal Pradesh 5 6 25 47 83Assam 127 104 230 61 522Manipur 15 13 29 42 99Meghalaya 22 9 13 18 62Mizoram 11 6 17 24 58Nagaland 15 11 16 36 78Sikkim 9 1 9 3 22Tripura 17 9 32 15 73Sub Total North-East 221 159 371 246 997Andaman & Nicobar Islands 0 4 4 1 9Bihar 240 251 1197 111 1799Jharkhand 162 45 249 35 491Odisha 173 95 443 201 912West Bengal 395 155 610 113 1273Sub Total East 970 550 2503 461 4484Chhattisgarh 105 74 129 215 523Dadra & Nagar Haveli 2 1 0 0 3Daman & Diu 3 0 0 0 3Goa 44 4 5 1 54Gujarat 421 117 291 72 901Madhya Pradesh 469 212 337 432 1450Maharashtra 1009 188 758 179 2134Sub Total West 2053 596 1520 899 5068Andhra Pradesh 319 230 367 99 1015Karnataka 530 137 415 89 1171Kerala 227 126 275 31 659Lakshadweep 1 0 0 0 1Puducherry 15 9 3 0 27Tamil Nadu 571 351 531 114 1567Telangana 278 101 296 89 764Sub Total South 1941 954 1887 422 5204All India 7908 3626 9613 2590 23737
Table 7.5 : Number of LPG distributors as on 01.04.2019 (P) (New Scheme)
Source: PSU OMCs (IOCL, BPCL and HPCL)Note: MOPNG vide letter no. P-20019/2/2016-LPG dated 23 June 2016 has issued unified guidelines for selection of LPG distributors. In the said guidelines, LPG distributor categories have been redefined as above.
PPAC Ready Reckoner
54
Prices andTaxes
Chapter-8
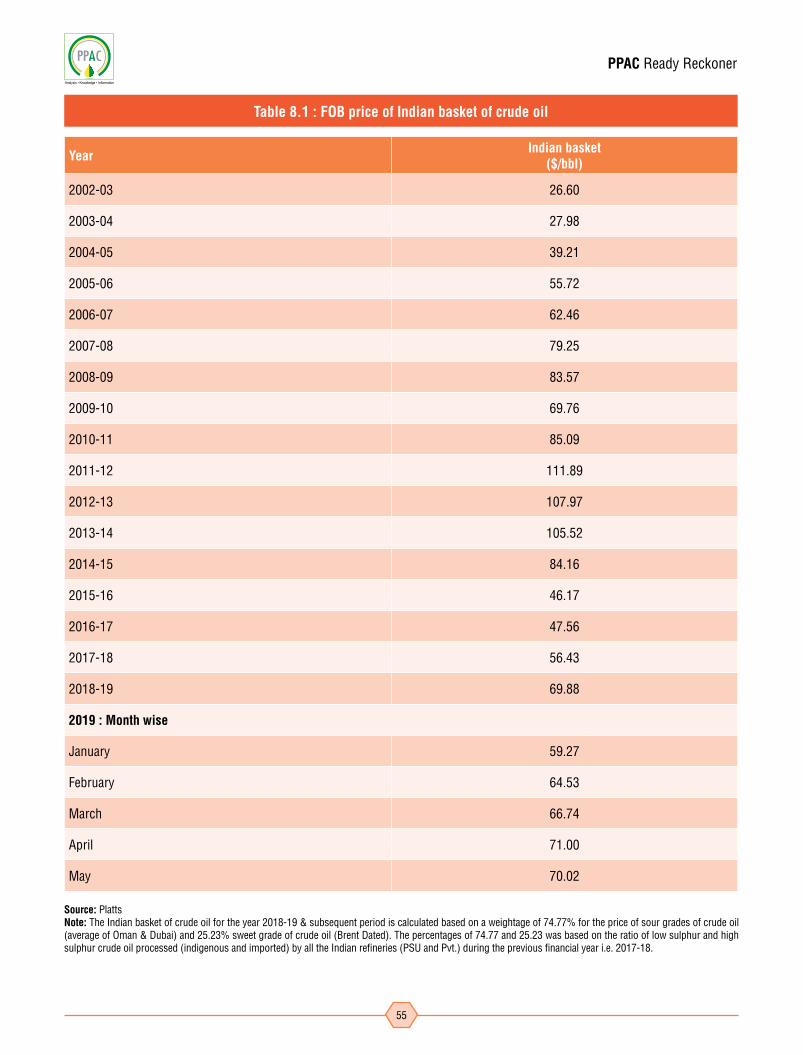
PPAC Ready Reckoner
55
Year Indian basket ($/bbl)
2002-03 26.60
2003-04 27.98
2004-05 39.21
2005-06 55.72
2006-07 62.46
2007-08 79.25
2008-09 83.57
2009-10 69.76
2010-11 85.09
2011-12 111.89
2012-13 107.97
2013-14 105.52
2014-15 84.16
2015-16 46.17
2016-17 47.56
2017-18 56.43
2018-19 69.88
2019 : Month wise
January 59.27
February 64.53
March 66.74
April 71.00
May 70.02
Table 8.1 : FOB price of Indian basket of crude oil
Source: Platts Note: The Indian basket of crude oil for the year 2018-19 & subsequent period is calculated based on a weightage of 74.77% for the price of sour grades of crude oil (average of Oman & Dubai) and 25.23% sweet grade of crude oil (Brent Dated). The percentages of 74.77 and 25.23 was based on the ratio of low sulphur and high sulphur crude oil processed (indigenous and imported) by all the Indian refineries (PSU and Pvt.) during the previous financial year i.e. 2017-18.
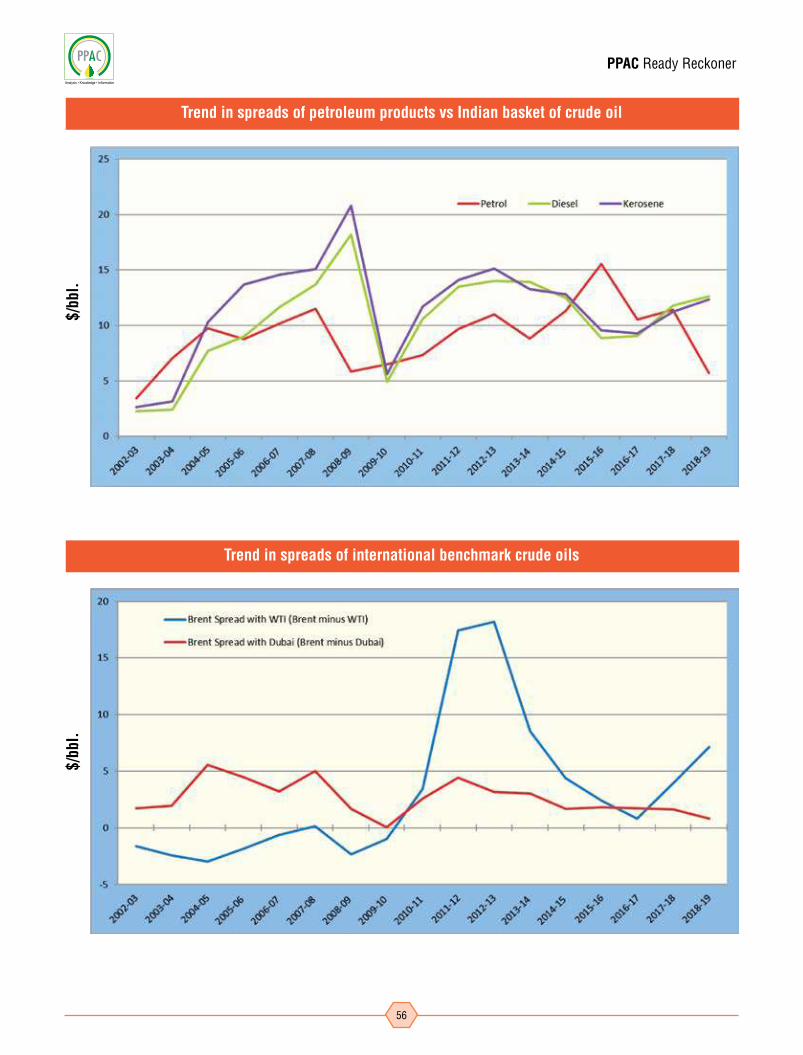
PPAC Ready Reckoner
56
Trend in spreads of petroleum products vs Indian basket of crude oil
Trend in spreads of international benchmark crude oils
$/bb
l.$/
bbl.
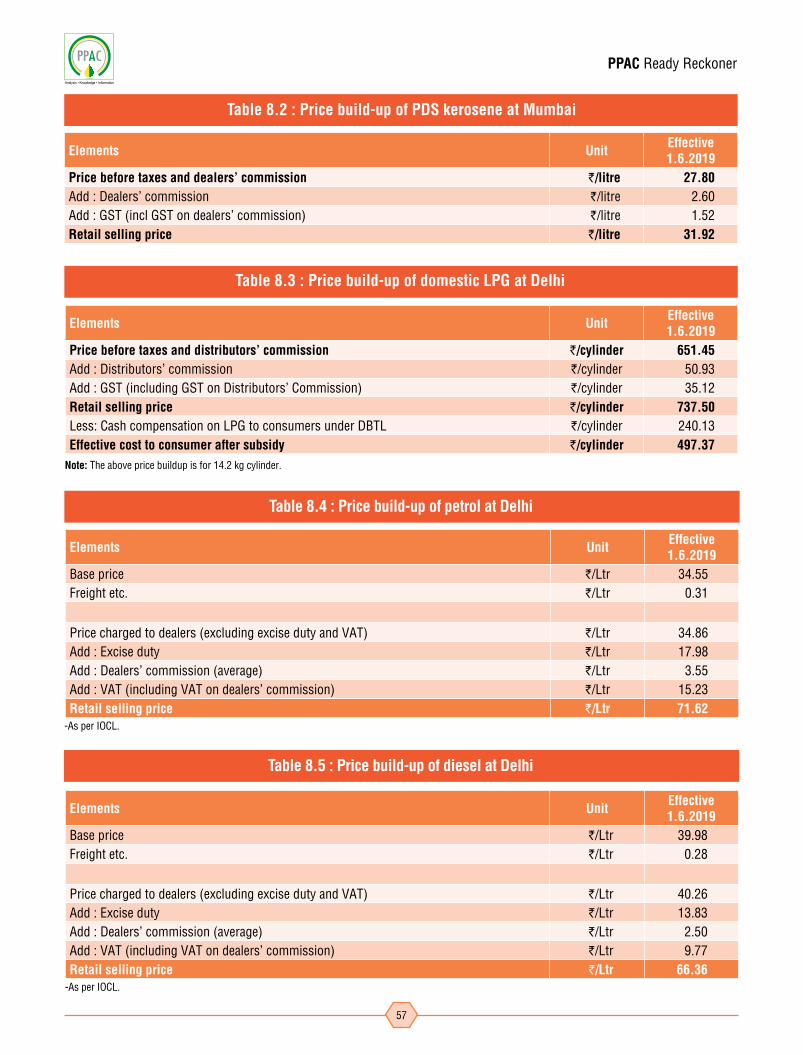
PPAC Ready Reckoner
57
Elements Unit Effective 1.6.2019
Price before taxes and dealers’ commission `/litre 27.80 Add : Dealers’ commission `/litre 2.60 Add : GST (incl GST on dealers’ commission) `/litre 1.52 Retail selling price `/litre 31.92
Table 8.2 : Price build-up of PDS kerosene at Mumbai
Table 8.3 : Price build-up of domestic LPG at Delhi
Elements Unit Effective 1.6.2019
Price before taxes and distributors’ commission `/cylinder 651.45 Add : Distributors’ commission `/cylinder 50.93 Add : GST (including GST on Distributors’ Commission) `/cylinder 35.12 Retail selling price `/cylinder 737.50 Less: Cash compensation on LPG to consumers under DBTL `/cylinder 240.13 Effective cost to consumer after subsidy `/cylinder 497.37
Note: The above price buildup is for 14.2 kg cylinder.
Elements Unit Effective 1.6.2019
Base price `/Ltr 34.55Freight etc. Rs`/Ltr 0.31
Price charged to dealers (excluding excise duty and VAT) R`/Ltr 34.86Add : Excise duty `/Ltr 17.98Add : Dealers’ commission (average) `/Ltr 3.55Add : VAT (including VAT on dealers’ commission) `/Ltr 15.23Retail selling price `/Ltr 71.62
Table 8.4 : Price build-up of petrol at Delhi
-As per IOCL.
Elements Unit Effective 1.6.2019
Base price `/Ltr 39.98Freight etc. `/Ltr 0.28
Price charged to dealers (excluding excise duty and VAT) `/Ltr 40.26Add : Excise duty `/Ltr 13.83Add : Dealers’ commission (average) `/Ltr 2.50Add : VAT (including VAT on dealers’ commission) `/Ltr 9.77Retail selling price `/Ltr 66.36
Table 8.5 : Price build-up of diesel at Delhi
-As per IOCL.
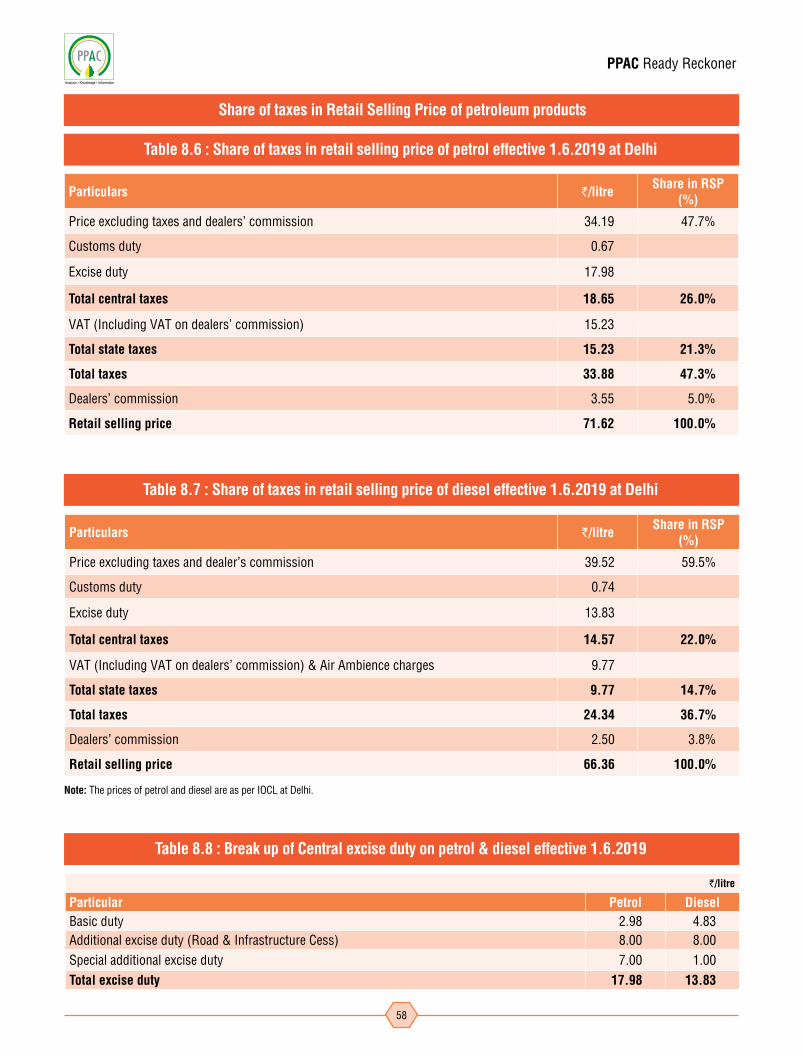
PPAC Ready Reckoner
58
Particulars `/litre Share in RSP (%)
Price excluding taxes and dealers' commission 34.19 47.7%
Customs duty 0.67
Excise duty 17.98
Total central taxes 18.65 26.0%
VAT (Including VAT on dealers’ commission) 15.23
Total state taxes 15.23 21.3%
Total taxes 33.88 47.3%
Dealers’ commission 3.55 5.0%
Retail selling price 71.62 100.0%
`/litre
Particular Petrol DieselBasic duty 2.98 4.83Additional excise duty (Road & Infrastructure Cess) 8.00 8.00Special additional excise duty 7.00 1.00Total excise duty 17.98 13.83
Table 8.8 : Break up of Central excise duty on petrol & diesel effective 1.6.2019
Note: The prices of petrol and diesel are as per IOCL at Delhi.
Table 8.6 : Share of taxes in retail selling price of petrol effective 1.6.2019 at Delhi
Share of taxes in Retail Selling Price of petroleum products
Particulars `/litre Share in RSP (%)
Price excluding taxes and dealer's commission 39.52 59.5%
Customs duty 0.74
Excise duty 13.83
Total central taxes 14.57 22.0%
VAT (Including VAT on dealers’ commission) & Air Ambience charges 9.77
Total state taxes 9.77 14.7%
Total taxes 24.34 36.7%
Dealers’ commission 2.50 3.8%
Retail selling price 66.36 100.0%
Table 8.7 : Share of taxes in retail selling price of diesel effective 1.6.2019 at Delhi
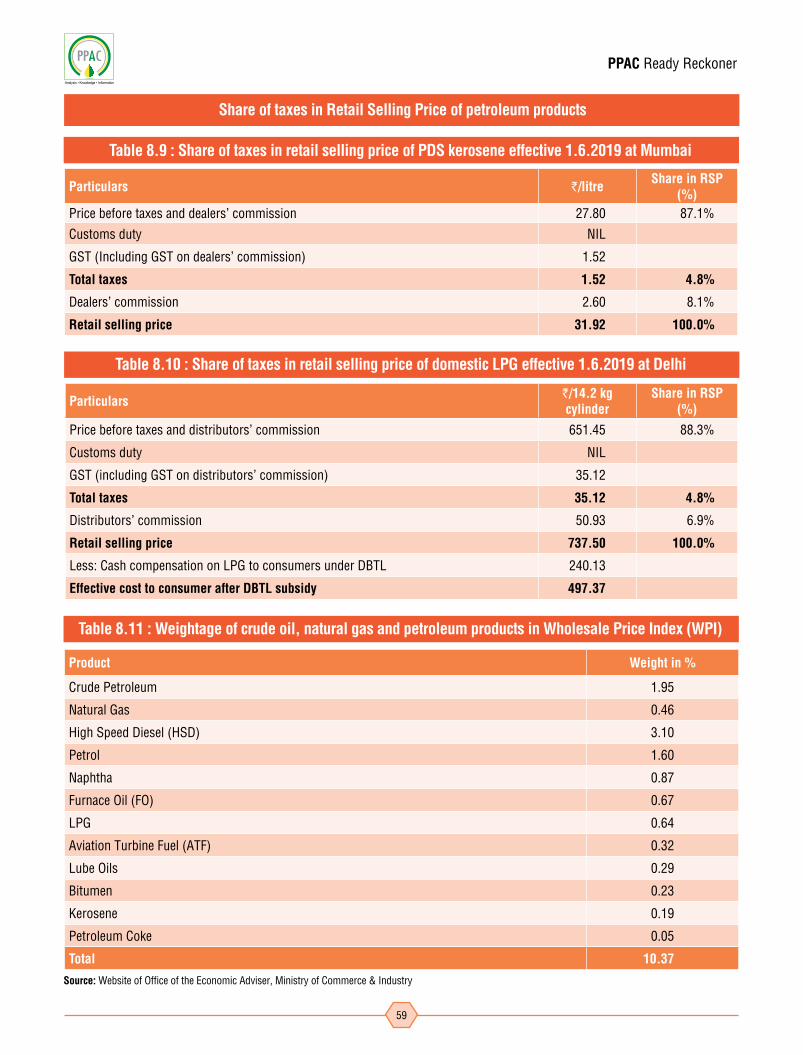
PPAC Ready Reckoner
59
Particulars `/litre Share in RSP (%)
Price before taxes and dealers’ commission 27.80 87.1%
Customs duty NIL
GST (Including GST on dealers’ commission) 1.52
Total taxes 1.52 4.8%
Dealers’ commission 2.60 8.1%
Retail selling price 31.92 100.0%
Table 8.9 : Share of taxes in retail selling price of PDS kerosene effective 1.6.2019 at Mumbai
Particulars `/14.2 kg cylinder
Share in RSP (%)
Price before taxes and distributors’ commission 651.45 88.3%
Customs duty NIL
GST (including GST on distributors’ commission) 35.12
Total taxes 35.12 4.8%
Distributors’ commission 50.93 6.9%
Retail selling price 737.50 100.0%
Less: Cash compensation on LPG to consumers under DBTL 240.13
Effective cost to consumer after DBTL subsidy 497.37
Table 8.10 : Share of taxes in retail selling price of domestic LPG effective 1.6.2019 at Delhi
Share of taxes in Retail Selling Price of petroleum products
Product Weight in %
Crude Petroleum 1.95
Natural Gas 0.46
High Speed Diesel (HSD) 3.10
Petrol 1.60
Naphtha 0.87
Furnace Oil (FO) 0.67
LPG 0.64
Aviation Turbine Fuel (ATF) 0.32
Lube Oils 0.29
Bitumen 0.23
Kerosene 0.19
Petroleum Coke 0.05
Total 10.37
Table 8.11 : Weightage of crude oil, natural gas and petroleum products in Wholesale Price Index (WPI)
Source: Website of Office of the Economic Adviser, Ministry of Commerce & Industry

PPAC Ready Reckoner
60
(`/KL)
Effective date With form XV Other than form XV
As on 01-Apr-04 204.00 161.00
01-Mar-07 243.00 200.00
24-May-08 255.00 212.00
07-Jul-09 263.00 220.00
07-Sep-10 275.00 232.00
28-Dec-12 438.24 377.73
21-Oct-14 536.09 475.58
05-Feb-16 714.18 649.16
28-Oct-16 787.82 723.87
05-Sep-17 1008.83 928.10
04-Oct-18 1016.37 1005.95
22-Feb-19 1341.88 1230.98
Table 8.13 : Wholesale dealers’ commission on PDS kerosene
Effective date Petrol Diesel
As on 01-Apr-04 707.00 425.00
21-Jun-05 778.00 467.00
01-Aug-05 848.00 509.00
01-Mar-07 894.00 529.00
16-May-07 1024.00 600.00
23-May-08 1052.00 631.00
27-Oct-09 1125.00 673.00
07-Sep-10 1218.00 757.00
01-Jul-11 1499.00 912.00
27-Oct-12 1794.00 1089.00
21-Dec-13 ` 1390.15/KL + 0.883% of product billable price 1186.00
23-Oct-14 ` 1499.37/KL + 0.887% of product billable price ` 1116.09/KL + 0.290% of product billable price
01-Aug-15 ` 1749.86/KL + 0.883% of product billable price ` 1301.70/KL + 0.286% of product billable price
16-Nov-15 ` 1750.08/KL + 0.883% of product billable price ` 1301.88/KL + 0.286% of product billable price
01-Jun-16 ` 1750.29/KL + 0.883% of product billable price ` 1302.06/KL + 0.286% of product billable price
05-Oct-16 ` 1868.14/KL + 0.875% of product billable price ` 1389.35/KL + 0.280% of product billable price
16-Nov-16 ` 2006.33/KL + 0.875% of product billable price ` 1491.72/KL + 0.280% of product billable price
01-Apr-17 ` 2020.38/KL + 0.859% of product billable price ` 1502.13/KL + 0.267% of product billable price
01-Jul-17 ` 2025.97/KL + 0.859% of product billable price ` 1506.81/KL + 0.267% of product billable price
1-Aug-17* ` 2674.74/KL + 0.859% of product billable price ` 2031.38/KL + 0.257% of product billable price
19-Feb-19* ` 2637.80/KL + 0.859% of product billable price ` 2000.60/KL + 0.257% of product billable price
Dealers’ / Distributors’ commission on petroleum productsTable 8.12 : Dealers’ commission on petrol & diesel
(`/KL)
Note: *In addition to above, effective 1st August 2017, slab based incentive is also given to eligible dealers through credit notes.

PPAC Ready Reckoner
61
(`/cylinder)
Effective date 14.2 KG cyl. Additional commission for sale at market deter-mined price (`/14.2 KG cyl.) 5 KG cyl.
01-April-04 16.71 NA 8.60
01-Mar-07 19.05 NA 9.81
04-Jun-08 20.54 NA 10.58
30-Jun-09 21.94 NA 11.30
01-Jul-11 25.83 NA 13.30
07-Oct-12 37.25 0.75 18.63
11-Dec-13 40.71 0.75 20.36
23-Oct-14 44.06 0.82 22.03
09-Dec-15 45.83 0.26 22.67
01-Jan-16 45.83 0.33 22.67
01-Feb-16 45.83 0.22 22.67
01-Mar-16 45.83 0.13 22.67
01-May-16 45.83 0.15 22.67
01-Jun-16 45.83 0.18 22.67
01-Jul-16 45.83 0.16 22.67
01-Aug-16 45.83 0.09 22.67
01-Sep-16 45.83 0.06 22.67
01-Oct-16 45.83 0.09 22.67
28-Oct-16 47.48 0.09 23.74
01-Nov-16 47.48 0.14 23.74
01-Dec-16 47.48 0.21 23.74
01-Feb-17 47.48 0.30 23.74
01-Mar-17 47.48 0.43 23.74
01-Apr-17 47.48 0.40 23.74
01-May-17 47.48 0.27 23.74
01-Jun-17 47.48 0.15 23.74
01-Jul-17 47.48 0.13 23.74
01-Aug-17 47.48 0.06 23.74
01-Sep-17 47.48 0.16 23.74
30-Sep-17 48.89 0.16 24.20
01-Oct-17 48.89 0.23 24.20
01-Nov-17 48.89 0.36 24.20
01-Jan-18 48.89 0.35 24.20
01-Feb-18 48.89 0.34 24.20
01-Mar-18 48.89 0.28 24.20
01-Apr-18 48.89 0.23 24.20
01-Jun-18 48.89 0.29 24.20
01-Jul-18 48.89 0.36 24.20
01-Aug-18 48.89 0.42 24.20
01-Sep-18 48.89 0.46 24.20
01-Oct-18 48.89 0.54 24.20
01-Nov-18 48.89 0.63 24.20
07-Nov-18 50.58 0.63 25.29
01-Dec-18 50.58 0.45 25.29
01-Jan-19 50.58 0.28 25.29
01-Feb-19 50.58 0.24 25.29
01-Mar-19 50.58 0.30 25.29
01-Apr-19 50.58 0.31 25.29
01-Jun-19 50.58 0.35 25.29
Table 8.14: Distributors’ commission on domestic LPG
Source: MoP&NG circulars & OMCs
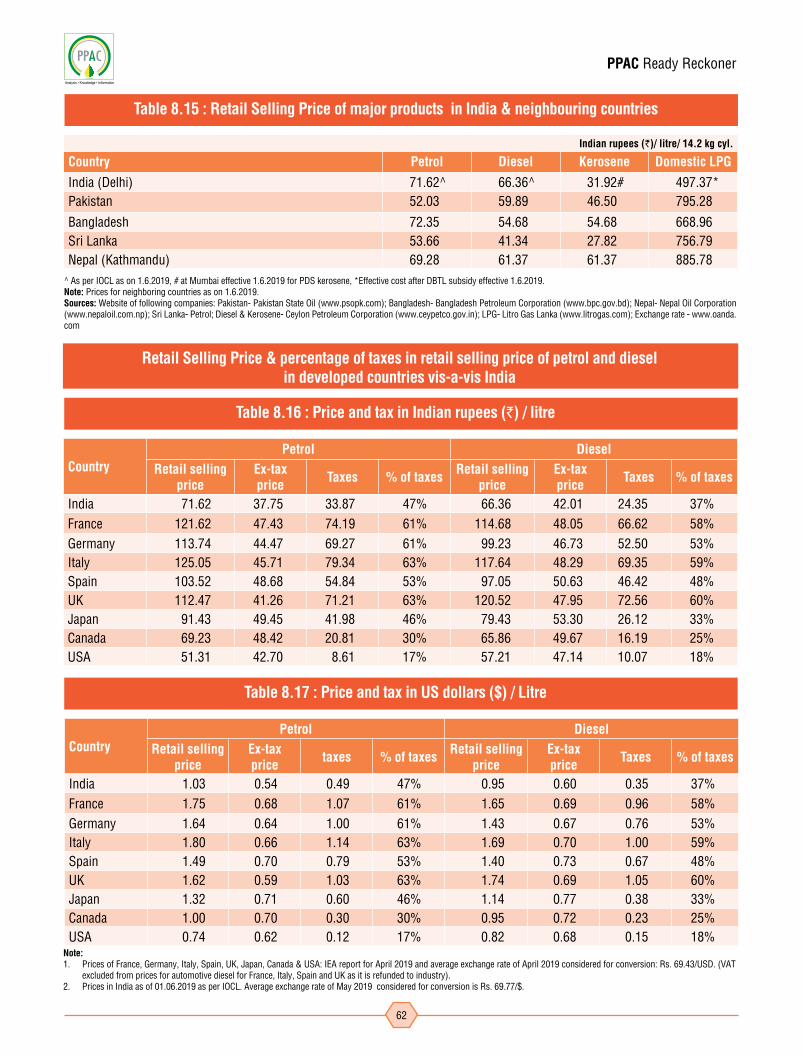
PPAC Ready Reckoner
62
Indian rupees (`)/ litre/ 14.2 kg cyl.
Country Petrol Diesel Kerosene Domestic LPG
India (Delhi) 71.62^ 66.36^ 31.92# 497.37*Pakistan 52.03 59.89 46.50 795.28
Bangladesh 72.35 54.68 54.68 668.96Sri Lanka 53.66 41.34 27.82 756.79Nepal (Kathmandu) 69.28 61.37 61.37 885.78
Table 8.15 : Retail Selling Price of major products in India & neighbouring countries
CountryPetrol Diesel
Retail selling price
Ex-tax price Taxes % of taxes Retail selling
priceEx-tax price Taxes % of taxes
India 71.62 37.75 33.87 47% 66.36 42.01 24.35 37%France 121.62 47.43 74.19 61% 114.68 48.05 66.62 58%Germany 113.74 44.47 69.27 61% 99.23 46.73 52.50 53%Italy 125.05 45.71 79.34 63% 117.64 48.29 69.35 59%Spain 103.52 48.68 54.84 53% 97.05 50.63 46.42 48%UK 112.47 41.26 71.21 63% 120.52 47.95 72.56 60%Japan 91.43 49.45 41.98 46% 79.43 53.30 26.12 33%Canada 69.23 48.42 20.81 30% 65.86 49.67 16.19 25%USA 51.31 42.70 8.61 17% 57.21 47.14 10.07 18%
Table 8.16 : Price and tax in Indian rupees (`) / litre
CountryPetrol Diesel
Retail selling price
Ex-tax price taxes % of taxes Retail selling
priceEx-tax price Taxes % of taxes
India 1.03 0.54 0.49 47% 0.95 0.60 0.35 37%France 1.75 0.68 1.07 61% 1.65 0.69 0.96 58%Germany 1.64 0.64 1.00 61% 1.43 0.67 0.76 53%Italy 1.80 0.66 1.14 63% 1.69 0.70 1.00 59%Spain 1.49 0.70 0.79 53% 1.40 0.73 0.67 48%UK 1.62 0.59 1.03 63% 1.74 0.69 1.05 60%Japan 1.32 0.71 0.60 46% 1.14 0.77 0.38 33%Canada 1.00 0.70 0.30 30% 0.95 0.72 0.23 25%USA 0.74 0.62 0.12 17% 0.82 0.68 0.15 18%
Table 8.17 : Price and tax in US dollars ($) / Litre
^ As per IOCL as on 1.6.2019, # at Mumbai effective 1.6.2019 for PDS kerosene, *Effective cost after DBTL subsidy effective 1.6.2019.Note: Prices for neighboring countries as on 1.6.2019.Sources: Website of following companies: Pakistan- Pakistan State Oil (www.psopk.com); Bangladesh- Bangladesh Petroleum Corporation (www.bpc.gov.bd); Nepal- Nepal Oil Corporation (www.nepaloil.com.np); Sri Lanka- Petrol; Diesel & Kerosene- Ceylon Petroleum Corporation (www.ceypetco.gov.in); LPG- Litro Gas Lanka (www.litrogas.com); Exchange rate - www.oanda.com
Note: 1. Prices of France, Germany, Italy, Spain, UK, Japan, Canada & USA: IEA report for April 2019 and average exchange rate of April 2019 considered for conversion: Rs. 69.43/USD. (VAT
excluded from prices for automotive diesel for France, Italy, Spain and UK as it is refunded to industry).2. Prices in India as of 01.06.2019 as per IOCL. Average exchange rate of May 2019 considered for conversion is Rs. 69.77/$.
Retail Selling Price & percentage of taxes in retail selling price of petrol and diesel in developed countries vis-a-vis India
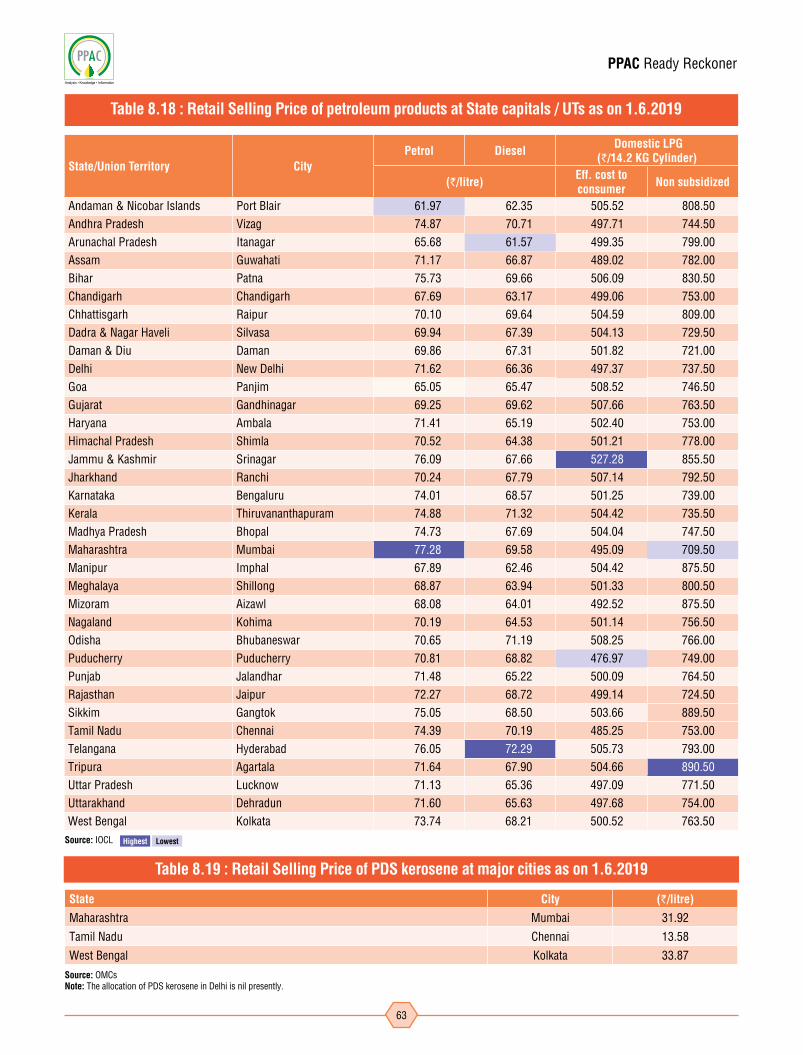
PPAC Ready Reckoner
63
State/Union Territory CityPetrol Diesel Domestic LPG
(`/14.2 KG Cylinder)
(`/litre) Eff. cost to consumer Non subsidized
Andaman & Nicobar Islands Port Blair 61.97 62.35 505.52 808.50Andhra Pradesh Vizag 74.87 70.71 497.71 744.50Arunachal Pradesh Itanagar 65.68 61.57 499.35 799.00Assam Guwahati 71.17 66.87 489.02 782.00Bihar Patna 75.73 69.66 506.09 830.50Chandigarh Chandigarh 67.69 63.17 499.06 753.00Chhattisgarh Raipur 70.10 69.64 504.59 809.00Dadra & Nagar Haveli Silvasa 69.94 67.39 504.13 729.50Daman & Diu Daman 69.86 67.31 501.82 721.00Delhi New Delhi 71.62 66.36 497.37 737.50Goa Panjim 65.05 65.47 508.52 746.50Gujarat Gandhinagar 69.25 69.62 507.66 763.50Haryana Ambala 71.41 65.19 502.40 753.00Himachal Pradesh Shimla 70.52 64.38 501.21 778.00Jammu & Kashmir Srinagar 76.09 67.66 527.28 855.50Jharkhand Ranchi 70.24 67.79 507.14 792.50Karnataka Bengaluru 74.01 68.57 501.25 739.00Kerala Thiruvananthapuram 74.88 71.32 504.42 735.50Madhya Pradesh Bhopal 74.73 67.69 504.04 747.50Maharashtra Mumbai 77.28 69.58 495.09 709.50Manipur Imphal 67.89 62.46 504.42 875.50Meghalaya Shillong 68.87 63.94 501.33 800.50Mizoram Aizawl 68.08 64.01 492.52 875.50Nagaland Kohima 70.19 64.53 501.14 756.50Odisha Bhubaneswar 70.65 71.19 508.25 766.00Puducherry Puducherry 70.81 68.82 476.97 749.00Punjab Jalandhar 71.48 65.22 500.09 764.50Rajasthan Jaipur 72.27 68.72 499.14 724.50Sikkim Gangtok 75.05 68.50 503.66 889.50Tamil Nadu Chennai 74.39 70.19 485.25 753.00Telangana Hyderabad 76.05 72.29 505.73 793.00Tripura Agartala 71.64 67.90 504.66 890.50Uttar Pradesh Lucknow 71.13 65.36 497.09 771.50Uttarakhand Dehradun 71.60 65.63 497.68 754.00West Bengal Kolkata 73.74 68.21 500.52 763.50
Table 8.18 : Retail Selling Price of petroleum products at State capitals / UTs as on 1.6.2019
Source: IOCL
Source: OMCsNote: The allocation of PDS kerosene in Delhi is nil presently.
Highest Lowest
State City (`/litre)
Maharashtra Mumbai 31.92
Tamil Nadu Chennai 13.58
West Bengal Kolkata 33.87
Table 8.19 : Retail Selling Price of PDS kerosene at major cities as on 1.6.2019

PPAC Ready Reckoner
64
Table 8.20 : Customs, excise duty and GST rates on petroleum products as on 1.6.2019
Particulars
Customs duty Central excise duty
Basic customs duty
Additional customs duty
(CVD)
Additional customs duty
Basic cenvat duty
Special additional excise duty
Additional excise duty (Road and Infrastructure
Cess)Crude oil NIL + Rs. 50/MT
as NCCDNil - Nil+ Cess @ 20%
+Rs.50/ MT as NCCD
- -
Petrol 2.50% Rs.2,98/ltr. + Rs.7.00/ ltr SAD
Rs.8.00/ltr. Rs.2.98/ltr Rs.7.00/ltr Rs.8.00/ltr.
Petrol (branded) 2.50% Rs.4.16/ltr. + Rs.7.00/ ltr SAD
Rs.8.00/ltr. Rs.4.16/ltr Rs.7.00/ltr Rs.8.00/ltr.
High speed diesel 2.50% Rs.4.83/ltr+ Rs.1.00/ ltr
Rs.8.00/ltr. Rs.4.83/ltr Rs.1.00/ltr Rs.8.00/ltr.
High speed diesel (branded) 2.50% Rs.7.19/ltr+ Rs.1.00/ ltr
Rs.8.00/ltr. Rs.7.19/Ltr Rs.1.00/ltr Rs.8.00/ltr.
Aviation Turbine Fuel (ATF) (note-2) 5.00% 11.00% - 11.00% - -
Liquefied Natural Gas (LNG) 2.50% Nil - Nil - -
Natural gas [gaseous state] 5.00% Nil - Nil - -
Natural gas [compressed] 5.00% 14.00% - 14.0% - -
Customs duty and Excise duty as on 1st June 2019 (Petroleum products on which GST is not levied)
ParticularsCustoms
Basic Customs Duty CVD (in lieu of IGST)
LPGDomestic (Note-3) Nil 5.00%
Non - Domestic 5.00% 18.00%
KerosenePDS Nil 5.00%
Non PDS 5.00% 18.00%
NaphthaFertilizer Nil 18.00%
Non- Fertilizer 5.00% 18.00%
Butane / Propane Domestic Nil 5.00%
Non - Domestic 2.50% 18.00%
Bitumen & Asphalt 5.00% 18.00%
Furnace OilFertilizer Nil 18.00%
Non- Fertilizer 5.00% 18.00%
Light Diesel Oil 5.00%18.00%
18.00%
Low Sulphur Heavy Stock/ HPS & other ResidueFertilizer Nil 18.00%
Non- Fertilizer 5.00% 18.00%
Lube oil/greases 5.00% 18.00%
Petroleum Coke 10.00% 18.00%
Petroleum Jelly 5.00% 18.00%
Transformer Oil 5.00% 18.00%
Waxes all types 5.00% 18.00%
Customs duty and GST rates as on 1st June 2019 (Petroleum products on which GST is levied)
Note: 1. In addition to the above, 10% Social Welfare Surcharge (3% in case of petrol and diesel) is also applicable on the total duties of Customs (excluding CVD in lieu of IGST). 2. In case of ATF, Basic Excise Duty /Additional Customs Duty (CVD) is 2% in place of 11%, for supply to scheduled commuter airlines (SCA) from the regional connectivity scheme (RCS)
airports. 3. Basic Customs duty is Nil for import of domestic LPG sold to household consumers (including non domestic exempted catagory) by PSU OMCs. Basic Customs duty rate is 5% for other
importers of domestic LPG
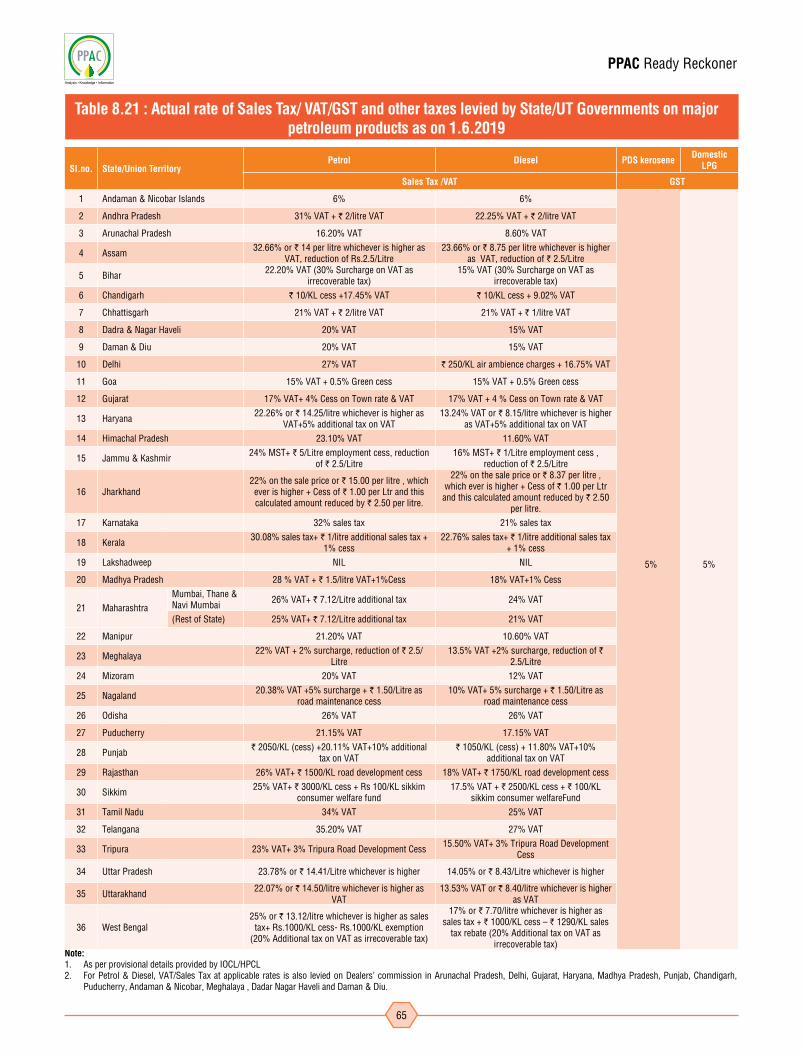
PPAC Ready Reckoner
65
Note: 1. As per provisional details provided by IOCL/HPCL 2. For Petrol & Diesel, VAT/Sales Tax at applicable rates is also levied on Dealers’ commission in Arunachal Pradesh, Delhi, Gujarat, Haryana, Madhya Pradesh, Punjab, Chandigarh,
Puducherry, Andaman & Nicobar, Meghalaya , Dadar Nagar Haveli and Daman & Diu.
Sl.no. State/Union TerritoryPetrol Diesel PDS kerosene Domestic
LPG
Sales Tax /VAT GST
1 Andaman & Nicobar Islands 6% 6%
5% 5%
2 Andhra Pradesh 31% VAT + ` 2/litre VAT 22.25% VAT + ` 2/litre VAT
3 Arunachal Pradesh 16.20% VAT 8.60% VAT
4 Assam 32.66% or ` 14 per litre whichever is higher as VAT, reduction of Rs.2.5/Litre
23.66% or ` 8.75 per litre whichever is higher as VAT, reduction of ` 2.5/Litre
5 Bihar 22.20% VAT (30% Surcharge on VAT as irrecoverable tax)
15% VAT (30% Surcharge on VAT as irrecoverable tax)
6 Chandigarh ` 10/KL cess +17.45% VAT ` 10/KL cess + 9.02% VAT
7 Chhattisgarh 21% VAT + ` 2/litre VAT 21% VAT + ` 1/litre VAT
8 Dadra & Nagar Haveli 20% VAT 15% VAT
9 Daman & Diu 20% VAT 15% VAT
10 Delhi 27% VAT ` 250/KL air ambience charges + 16.75% VAT
11 Goa 15% VAT + 0.5% Green cess 15% VAT + 0.5% Green cess
12 Gujarat 17% VAT+ 4% Cess on Town rate & VAT 17% VAT + 4 % Cess on Town rate & VAT
13 Haryana 22.26% or ` 14.25/litre whichever is higher as VAT+5% additional tax on VAT
13.24% VAT or ` 8.15/litre whichever is higher as VAT+5% additional tax on VAT
14 Himachal Pradesh 23.10% VAT 11.60% VAT
15 Jammu & Kashmir 24% MST+ ` 5/Litre employment cess, reduction of ` 2.5/Litre
16% MST+ ` 1/Litre employment cess , reduction of ` 2.5/Litre
16 Jharkhand22% on the sale price or ` 15.00 per litre , which ever is higher + Cess of ` 1.00 per Ltr and this calculated amount reduced by ` 2.50 per litre.
22% on the sale price or ` 8.37 per litre , which ever is higher + Cess of ` 1.00 per Ltr and this calculated amount reduced by ` 2.50
per litre.
17 Karnataka 32% sales tax 21% sales tax
18 Kerala 30.08% sales tax+ ` 1/litre additional sales tax + 1% cess
22.76% sales tax+ ` 1/litre additional sales tax + 1% cess
19 Lakshadweep NIL NIL
20 Madhya Pradesh 28 % VAT + ` 1.5/litre VAT+1%Cess 18% VAT+1% Cess
21 Maharashtra Mumbai, Thane & Navi Mumbai 26% VAT+ ` 7.12/Litre additional tax 24% VAT
(Rest of State) 25% VAT+ ` 7.12/Litre additional tax 21% VAT
22 Manipur 21.20% VAT 10.60% VAT
23 Meghalaya 22% VAT + 2% surcharge, reduction of ` 2.5/Litre
13.5% VAT +2% surcharge, reduction of ` 2.5/Litre
24 Mizoram 20% VAT 12% VAT
25 Nagaland 20.38% VAT +5% surcharge + ` 1.50/Litre as road maintenance cess
10% VAT+ 5% surcharge + ` 1.50/Litre as road maintenance cess
26 Odisha 26% VAT 26% VAT
27 Puducherry 21.15% VAT 17.15% VAT
28 Punjab ` 2050/KL (cess) +20.11% VAT+10% additional tax on VAT
` 1050/KL (cess) + 11.80% VAT+10% additional tax on VAT
29 Rajasthan 26% VAT+ ` 1500/KL road development cess 18% VAT+ ` 1750/KL road development cess
30 Sikkim 25% VAT+ ` 3000/KL cess + Rs 100/KL sikkim consumer welfare fund
17.5% VAT + ` 2500/KL cess + ` 100/KL sikkim consumer welfareFund
31 Tamil Nadu 34% VAT 25% VAT
32 Telangana 35.20% VAT 27% VAT
33 Tripura 23% VAT+ 3% Tripura Road Development Cess 15.50% VAT+ 3% Tripura Road Development Cess
34 Uttar Pradesh 23.78% or ` 14.41/Litre whichever is higher 14.05% or ` 8.43/Litre whichever is higher
35 Uttarakhand 22.07% or ` 14.50/litre whichever is higher as VAT
13.53% VAT or ` 8.40/litre whichever is higher as VAT
36 West Bengal25% or ` 13.12/litre whichever is higher as sales
tax+ Rs.1000/KL cess- Rs.1000/KL exemption (20% Additional tax on VAT as irrecoverable tax)
17% or ` 7.70/litre whichever is higher as sales tax + ` 1000/KL cess – ` 1290/KL sales
tax rebate (20% Additional tax on VAT as irrecoverable tax)
Table 8.21 : Actual rate of Sales Tax/ VAT/GST and other taxes levied by State/UT Governments on major petroleum products as on 1.6.2019
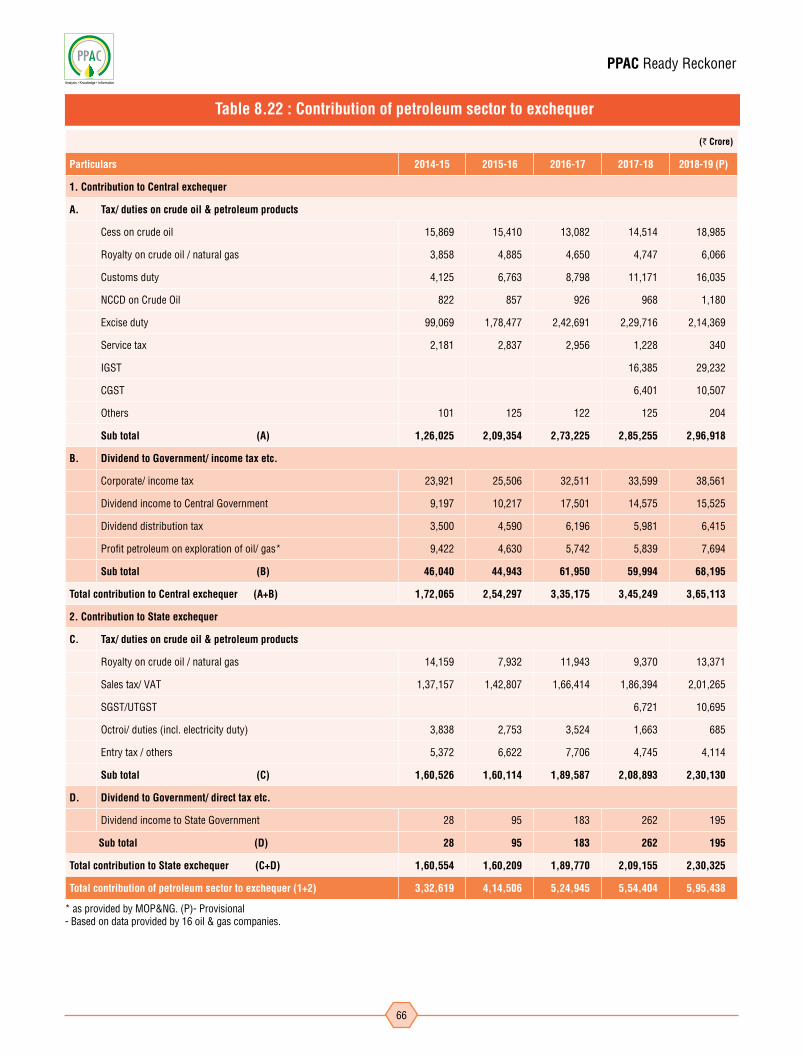
PPAC Ready Reckoner
66
(` Crore)
Particulars 2014-15 2015-16 2016-17 2017-18 2018-19 (P)
1. Contribution to Central exchequer
A. Tax/ duties on crude oil & petroleum products
Cess on crude oil 15,869 15,410 13,082 14,514 18,985
Royalty on crude oil / natural gas 3,858 4,885 4,650 4,747 6,066
Customs duty 4,125 6,763 8,798 11,171 16,035
NCCD on Crude Oil 822 857 926 968 1,180
Excise duty 99,069 1,78,477 2,42,691 2,29,716 2,14,369
Service tax 2,181 2,837 2,956 1,228 340
IGST 16,385 29,232
CGST 6,401 10,507
Others 101 125 122 125 204
Sub total (A) 1,26,025 2,09,354 2,73,225 2,85,255 2,96,918
B. Dividend to Government/ income tax etc.
Corporate/ income tax 23,921 25,506 32,511 33,599 38,561
Dividend income to Central Government 9,197 10,217 17,501 14,575 15,525
Dividend distribution tax 3,500 4,590 6,196 5,981 6,415
Profit petroleum on exploration of oil/ gas* 9,422 4,630 5,742 5,839 7,694
Sub total (B) 46,040 44,943 61,950 59,994 68,195
Total contribution to Central exchequer (A+B) 1,72,065 2,54,297 3,35,175 3,45,249 3,65,113
2. Contribution to State exchequer
C. Tax/ duties on crude oil & petroleum products
Royalty on crude oil / natural gas 14,159 7,932 11,943 9,370 13,371
Sales tax/ VAT 1,37,157 1,42,807 1,66,414 1,86,394 2,01,265
SGST/UTGST 6,721 10,695
Octroi/ duties (incl. electricity duty) 3,838 2,753 3,524 1,663 685
Entry tax / others 5,372 6,622 7,706 4,745 4,114
Sub total (C) 1,60,526 1,60,114 1,89,587 2,08,893 2,30,130
D. Dividend to Government/ direct tax etc.
Dividend income to State Government 28 95 183 262 195
Sub total (D) 28 95 183 262 195
Total contribution to State exchequer (C+D) 1,60,554 1,60,209 1,89,770 2,09,155 2,30,325
Total contribution of petroleum sector to exchequer (1+2) 3,32,619 4,14,506 5,24,945 5,54,404 5,95,438
Table 8.22 : Contribution of petroleum sector to exchequer
* as provided by MOP&NG. (P)- Provisional - Based on data provided by 16 oil & gas companies.

PPAC Ready Reckoner
67
(` Crore)
Sl. no. State/Union TerritorySales tax/VAT
2014-15 2015-16 2016-17 2017-18 2018-19 (P)
1 Andaman & Nicobar Islands 0 0 0 51 92
2 Andhra Pradesh 8,777 7,806 8,908 9,694 10,784
3 Arunachal Pradesh 56 54 62 67 49
4 Assam 2,268 2,163 2,571 3,109 3,879
5 Bihar 2,885 3,638 4,501 5,482 6,585
6 Chandigarh 84 75 54 54 62
7 Chhattisgarh 2,645 2,617 3,200 3,684 3,987
8 & 9 Dadra and Nagar Haveli and Daman & Diu 149 152 156 43 1
10 Delhi 2,797 3,158 3,589 3,944 4,378
11 Goa 478 534 650 657 694
12 Gujarat 15,879 14,701 15,958 15,659 16,229
13 Haryana 5,112 5,977 7,000 7,655 8,286
14 Himachal Pradesh 234 263 317 344 364
15 Jammu & Kashmir 951 1,004 1,110 1,329 1,449
16 Jharkhand 2,076 2,476 2,967 3,225 2,797
17 Karnataka 8,668 8,652 11,103 13,307 14,417
18 Kerala 5,378 6,121 6,899 7,299 7,995
19 Lakshadweep 0 0 0 0 0
20 Madhya Pradesh 6,832 7,631 9,160 9,380 9,486
21 Maharashtra 19,795 19,417 23,160 25,611 27,191
22 Manipur 116 115 117 162 181
23 Meghalaya 2 1 1 0 0
24 Mizoram 58 53 48 55 89
25 Nagaland 83 80 78 86 97
26 Odisha 2,865 3,027 4,283 6,871 5,660
27 Puducherry 22 18 22 15 8
28 Punjab 4,179 4,907 5,833 6,134 6,575
29 Rajasthan 8,373 9,211 10,590 12,094 12,713
30 Sikkim 74 98 105 110 134
31 Tamil Nadu 12,316 11,004 12,563 15,507 18,141
32 Telangana 4,527 6,391 7,552 8,777 10,037
33 Tripura 180 197 168 205 277
34 Uttar Pradesh 12,578 14,175 15,849 17,420 19,167
35 Uttarakhand 1,157 1,221 1,414 1,322 1,595
36 West Bengal 5,563 5,870 6,426 7,042 7,866
TOTAL 1,37,157 1,42,807 1,66,414 1,86,394 2,01,265
Table 8.23 : State/UT wise collection of sales tax/ VAT by petroleum sector
(P)- Provisional -Based on data provided by 16 oil & gas companies.Note: As the amounts have been rounded off to the nearest crore, hence some amounts are shown as zero.
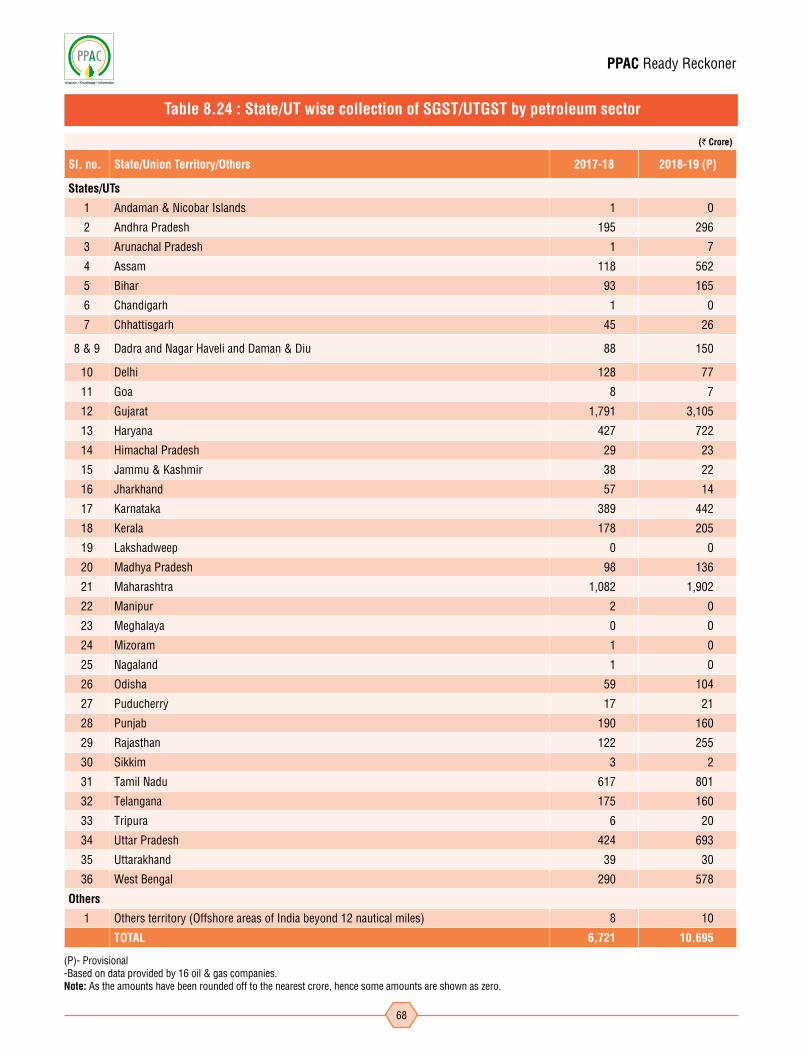
PPAC Ready Reckoner
68
(` Crore)
Sl. no. State/Union Territory/Others 2017-18 2018-19 (P)
States/UTs
1 Andaman & Nicobar Islands 1 0
2 Andhra Pradesh 195 296
3 Arunachal Pradesh 1 7
4 Assam 118 562
5 Bihar 93 165
6 Chandigarh 1 0
7 Chhattisgarh 45 26
8 & 9 Dadra and Nagar Haveli and Daman & Diu 88 150
10 Delhi 128 77
11 Goa 8 7
12 Gujarat 1,791 3,105
13 Haryana 427 722
14 Himachal Pradesh 29 23
15 Jammu & Kashmir 38 22
16 Jharkhand 57 14
17 Karnataka 389 442
18 Kerala 178 205
19 Lakshadweep 0 0
20 Madhya Pradesh 98 136
21 Maharashtra 1,082 1,902
22 Manipur 2 0
23 Meghalaya 0 0
24 Mizoram 1 0
25 Nagaland 1 0
26 Odisha 59 104
27 Puducherry 17 21
28 Punjab 190 160
29 Rajasthan 122 255
30 Sikkim 3 2
31 Tamil Nadu 617 801
32 Telangana 175 160
33 Tripura 6 20
34 Uttar Pradesh 424 693
35 Uttarakhand 39 30
36 West Bengal 290 578
Others
1 Others territory (Offshore areas of India beyond 12 nautical miles) 8 10
TOTAL 6,721 10,695
Table 8.24 : State/UT wise collection of SGST/UTGST by petroleum sector
(P)- Provisional -Based on data provided by 16 oil & gas companies.Note: As the amounts have been rounded off to the nearest crore, hence some amounts are shown as zero.

PPAC Ready Reckoner
69
(` Crore)
Companies 2014-15 2015-16 2016-17 2017-18 2018-19
PSU upstream/midstream companies
ONGC 17,733 16,140 17,900 19,945 26,716
OIL 2,510 2,302 1,549 2,668 2,590
GAIL 3,039 2,226 3,503 4,618 6,026
Total 23,282 20,668 22,952 27,231 35,332
PSU downstream Oil Marketing Companies (OMCs)
IOCL 5,273 11,242 19,106 21,346 16,894
BPCL 5,085 7,056 8,039 7,919 7,132
HPCL 2,733 3,725 6,209 6,357 6,029
Total 13,091 22,023 33,354 35,622 30,055
PSU stand alone refineries
MRPL (1,712) 1,146 3,642 2,224 332
CPCL (39) 742 1,030 913 (213)
NRL 718 1,210 2,101 2,044 1,968
Total (1,033) 3,098 6,773 5,181 2,087
PSU consultancy company
EIL 308 264 325 378 370
Total 308 264 325 378 370
Private sector companies
RIL 23,566 27,426 31,425 33,612 35,163
NEL 1,522 1,289 (2,673) 280 *
Total 25,088 28,715 28,752 33,892 35,163
Table 8.25 : Profit After Tax (PAT) of oil companies
* details not provided.Source: Published results/ information provided by oil companies.Note: Figures as per IND AS from financial year 2015-16 onwards. Details are on standalone basis

PPAC Ready Reckoner
70
2017-18
Particulars IOCL BPCL HPCL ONGC OIL GAIL MRPL CPCL NRL
(` Crore)
Net sales / income from operations 500767 276401 243227 84580 10368 53525 63067 44134 13228
Profit Before Interest and Tax (PBIT) 36013 12031 9769 30401 4125 7233 3791 1779 3158
Interest 3449 833 567 1508 416 275 440 321 16
Tax 11218 3279 2845 8947 1042 2340 1127 545 1097
Profit After Tax (PAT) 21346 7919 6357 19945 2668 4618 2224 913 2044
Net worth 110171 34152 23948 193385 22745 35142 11033 3856 5044
Borrowings (loan fund) 58030 23351 20991 25592 9004 2080 4794 4389 325
Ratios
PAT as % of turnover (net sales) 4.26% 2.87% 2.61% 23.58% 25.73% 8.63% 3.53% 2.07% 15.46%
Debt (loan fund) to equity ratio 0.53 0.68 0.88 0.13 0.40 0.06 0.43 1.14 0.06
Earnings Per Share (EPS) 22.52 40.26 41.72 15.54 23.32 20.48 12.69 61.31 27.79
Table 8.26 : Financial details of oil companies
Source: Published results/ Information provided by oil companies
2018-19
Particulars IOCL BPCL HPCL ONGC OIL GAIL MRPL CPCL NRL
(` Crore)
Net sales / income from operations 600922 336384 295713 109300 13360 74808 72283 52177 16153
Profit Before Interest and Tax (PBIT) 29438 11759 10065 42446 4396 9223 1053 122 3063
Interest 4311 1319 726 2492 479 139 472 420 11
Tax 8233 3308 3310 13238 1326 3059 249 (85) 1084
Profit After Tax (PAT) 16894 7132 6029 26716 2590 6026 332 (213) 1968
Net worth 108658 36738 28175 202993 22968 39062 10727 3310 5551
Borrowings (loan fund) 86359 29099 27240 21594 11524 1000 4230 6668 38
Ratios
PAT as % of turnover (net sales) 2.81% 2.12% 2.04% 24.44% 19.39% 8.05% 0.46% -0.41% 12.18%
Debt (loan fund) to equity ratio 0.79 0.79 0.97 0.11 0.50 0.03 0.39 2.01 0.01
Earnings Per Share (EPS) 17.89 36.26 39.56 20.86 22.88 26.72 1.89 (14.33) 26.76

PPAC Ready Reckoner
71
Table 8.27 : Total subsidy/under-recovery on petroleum products & natural gas
Particulars 2014-15 2015-16 2016-17 2017-18 2018-19
Petrol 0 0 0 0 0
Diesel 10,935 0 0 0 0
PDS kerosene 24,799 11,496 7,595 4,672 5,950
Domestic LPG 36,580 18 0 0 0
Total under-recoveries (A) 72,314 11,514 7,595 4,672 5,950
Direct Benefit Transfer for LPG (DBTL) subsidy /claims 3,971 21,811 12,905 20,880 31,447
Project Management Expenditure (PME)* 0 200 0 25 92
Total DBTL related subsidies (B) 3,971 22,011 12,905 20,905 31,539
Pradhan Mantri Ujjwala Yojana (PMUY) claims 0 0 2,999 2496 5,649
Project Management Expenditure (PME) & Information Education and Communication (IEC) expenditure under PMUY*
0 0 0 63 34
Total PMUY related subsidy (C) 0 0 2,999 2,559 5,683
Direct Benefit Transfer of Kerosene (DBTK) subsidy / claims (D) 0 0 11 113 117
PDS Kerosene and Domestic LPG subsidy scheme, 2002* 0 0 3,293 0 0
Freight subsidy (For Far-Flung Areas) Scheme, 2002* 23 0 0 0 0
Natural gas subsidy for North East 765 781 498 435 557
Other subsidies (E) 788 781 3,791 435 557
Total subsidy/ under-recovery on petroleum products & natural gas (A+B+C+D+E) 77,073 34,306 27,301 28,684 43,846
*on payment basis.
Note: DBTK subsidy excludes cash incentive/assistance for establishment of institutional mechanism for direct transfer of subsidy paid to States/UTs. DBTK claim for 2018-19 includes amount of Rs. 37.72 crores held back from the claim for November 2018 to March 2019 due to non- receipt of Quarterly Utilisation Certificate (QUC) from the State Government.
(` Crore)
Table 8.28 : Quantity and value of Indian crude oil imports
Year Quantity (MMT) $ Million ` Crore
2018-19 (P) 226.6 111,956 7,83,427
2019-20 (Estimated) 233.0 112,721 8,00,317
Note: 2019-20 Imports are estimated at average price of Indian basket crude oil at $66/bbl and average exchange rate of Rs.71/$. Impact of variation in crude oil price & exchange rate on value of crude oil imports for April 2019- March 2020 :If crude price changes by one $/bbl - Crude oil import bill changes by Rs. 12,126 croresIf exchange rate of Rs./$ changes by Rs. 1/$ - Crude oil import bill changes by Rs. 11,272 crores

PPAC Ready Reckoner
72
Miscellaneous
Chapter-9
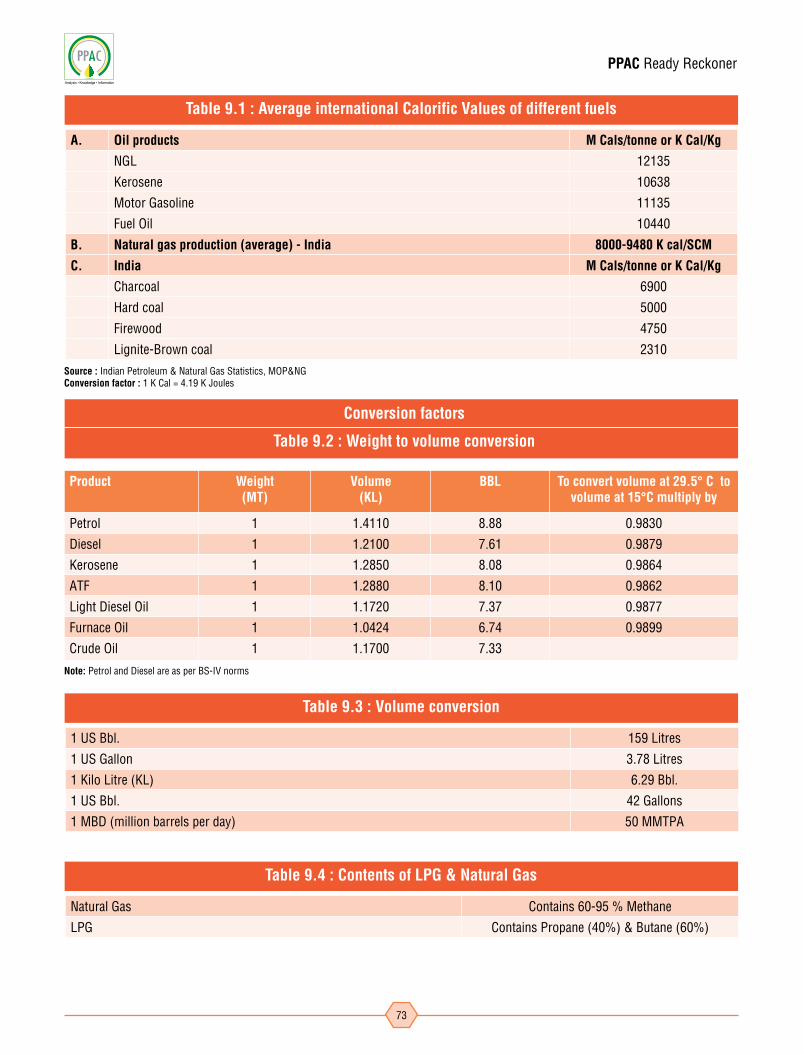
PPAC Ready Reckoner
73
Table 9.1 : Average international Calorific Values of different fuels
Table 9.3 : Volume conversion
Table 9.4 : Contents of LPG & Natural Gas
Conversion factors
Table 9.2 : Weight to volume conversion
A. Oil products M Cals/tonne or K Cal/Kg
NGL 12135
Kerosene 10638
Motor Gasoline 11135
Fuel Oil 10440
B. Natural gas production (average) - India 8000-9480 K cal/SCM
C. India M Cals/tonne or K Cal/Kg
Charcoal 6900
Hard coal 5000
Firewood 4750
Lignite-Brown coal 2310
1 US Bbl. 159 Litres
1 US Gallon 3.78 Litres
1 Kilo Litre (KL) 6.29 Bbl.
1 US Bbl. 42 Gallons
1 MBD (million barrels per day) 50 MMTPA
Natural Gas Contains 60-95 % Methane
LPG Contains Propane (40%) & Butane (60%)
Product Weight (MT)
Volume (KL)
BBL To convert volume at 29.5° C to volume at 15°C multiply by
Petrol 1 1.4110 8.88 0.9830
Diesel 1 1.2100 7.61 0.9879
Kerosene 1 1.2850 8.08 0.9864
ATF 1 1.2880 8.10 0.9862
Light Diesel Oil 1 1.1720 7.37 0.9877
Furnace Oil 1 1.0424 6.74 0.9899
Crude Oil 1 1.1700 7.33
Source : Indian Petroleum & Natural Gas Statistics, MOP&NG Conversion factor : 1 K Cal = 4.19 K Joules
Note: Petrol and Diesel are as per BS-IV norms
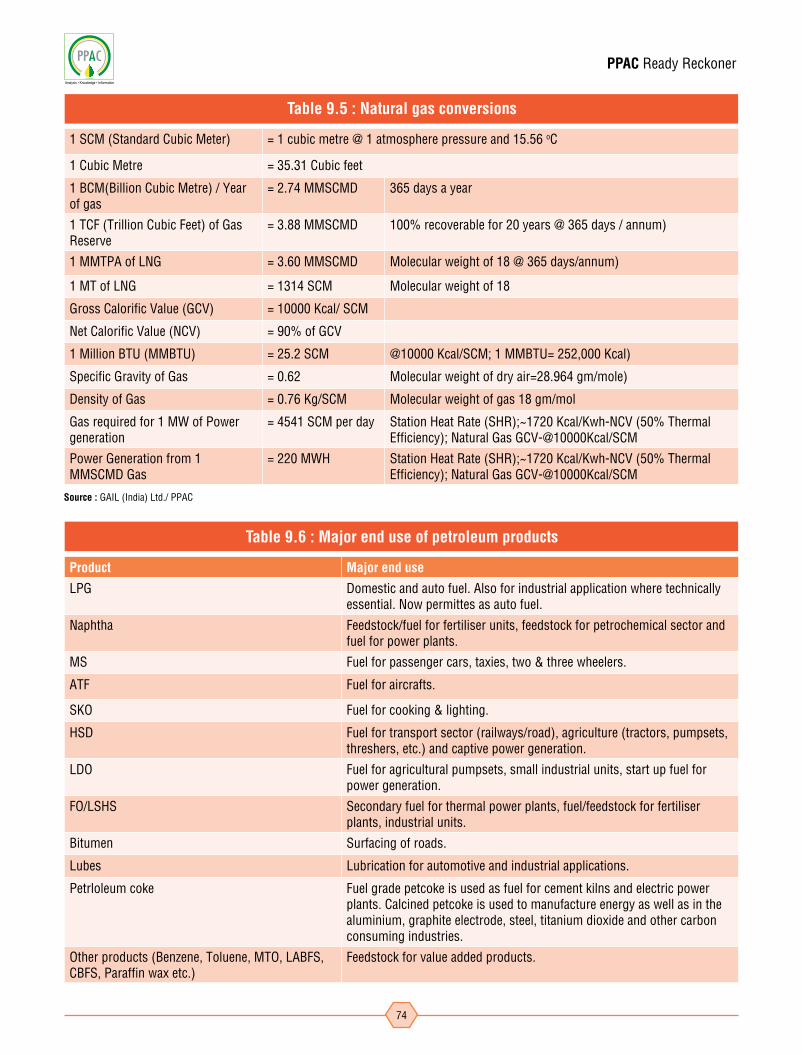
PPAC Ready Reckoner
74
Source : GAIL (India) Ltd./ PPAC
Table 9.5 : Natural gas conversions
Table 9.6 : Major end use of petroleum products
1 SCM (Standard Cubic Meter) = 1 cubic metre @ 1 atmosphere pressure and 15.56 oC
1 Cubic Metre = 35.31 Cubic feet
1 BCM(Billion Cubic Metre) / Year of gas
= 2.74 MMSCMD 365 days a year
1 TCF (Trillion Cubic Feet) of Gas Reserve
= 3.88 MMSCMD 100% recoverable for 20 years @ 365 days / annum)
1 MMTPA of LNG = 3.60 MMSCMD Molecular weight of 18 @ 365 days/annum)
1 MT of LNG = 1314 SCM Molecular weight of 18
Gross Calorific Value (GCV) = 10000 Kcal/ SCM
Net Calorific Value (NCV) = 90% of GCV
1 Million BTU (MMBTU) = 25.2 SCM @10000 Kcal/SCM; 1 MMBTU= 252,000 Kcal)
Specific Gravity of Gas = 0.62 Molecular weight of dry air=28.964 gm/mole)
Density of Gas = 0.76 Kg/SCM Molecular weight of gas 18 gm/mol
Gas required for 1 MW of Power generation
= 4541 SCM per day Station Heat Rate (SHR);~1720 Kcal/Kwh-NCV (50% Thermal Efficiency); Natural Gas GCV-@10000Kcal/SCM
Power Generation from 1 MMSCMD Gas
= 220 MWH Station Heat Rate (SHR);~1720 Kcal/Kwh-NCV (50% Thermal Efficiency); Natural Gas GCV-@10000Kcal/SCM
Product Major end use
LPG Domestic and auto fuel. Also for industrial application where technically essential. Now permittes as auto fuel.
Naphtha Feedstock/fuel for fertiliser units, feedstock for petrochemical sector and fuel for power plants.
MS Fuel for passenger cars, taxies, two & three wheelers.
ATF Fuel for aircrafts.
SKO Fuel for cooking & lighting.
HSD Fuel for transport sector (railways/road), agriculture (tractors, pumpsets, threshers, etc.) and captive power generation.
LDO Fuel for agricultural pumpsets, small industrial units, start up fuel for power generation.
FO/LSHS Secondary fuel for thermal power plants, fuel/feedstock for fertiliser plants, industrial units.
Bitumen Surfacing of roads.
Lubes Lubrication for automotive and industrial applications.
Petrloleum coke Fuel grade petcoke is used as fuel for cement kilns and electric power plants. Calcined petcoke is used to manufacture energy as well as in the aluminium, graphite electrode, steel, titanium dioxide and other carbon consuming industries.
Other products (Benzene, Toluene, MTO, LABFS, CBFS, Paraffin wax etc.)
Feedstock for value added products.
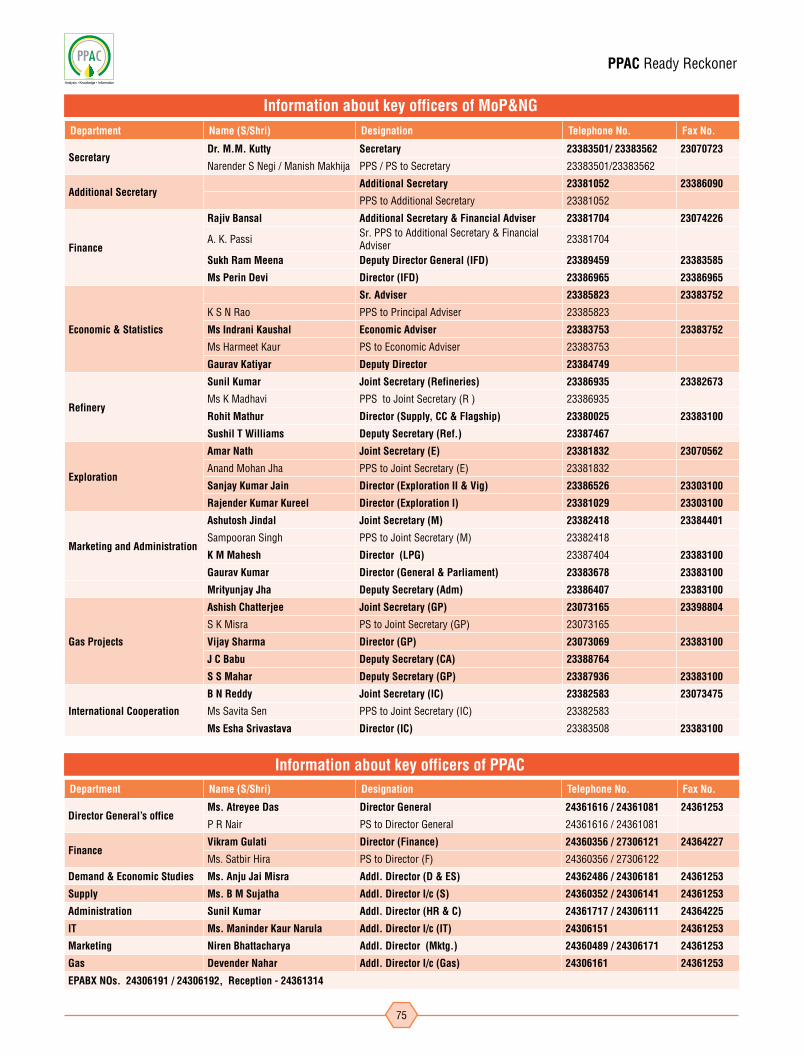
PPAC Ready Reckoner
75
Information about key officers of MoP&NG
Information about key officers of PPAC
Department Name (S/Shri) Designation Telephone No. Fax No.
SecretaryDr. M.M. Kutty Secretary 23383501/ 23383562 23070723
Narender S Negi / Manish Makhija PPS / PS to Secretary 23383501/23383562
Additional SecretaryAdditional Secretary 23381052 23386090
PPS to Additional Secretary 23381052
Finance
Rajiv Bansal Additional Secretary & Financial Adviser 23381704 23074226
A. K. Passi Sr. PPS to Additional Secretary & Financial Adviser 23381704
Sukh Ram Meena Deputy Director General (IFD) 23389459 23383585
Ms Perin Devi Director (IFD) 23386965 23386965
Economic & Statistics
Sr. Adviser 23385823 23383752
K S N Rao PPS to Principal Adviser 23385823
Ms Indrani Kaushal Economic Adviser 23383753 23383752
Ms Harmeet Kaur PS to Economic Adviser 23383753
Gaurav Katiyar Deputy Director 23384749
Refinery
Sunil Kumar Joint Secretary (Refineries) 23386935 23382673
Ms K Madhavi PPS to Joint Secretary (R ) 23386935
Rohit Mathur Director (Supply, CC & Flagship) 23380025 23383100
Sushil T Williams Deputy Secretary (Ref.) 23387467
Exploration
Amar Nath Joint Secretary (E) 23381832 23070562
Anand Mohan Jha PPS to Joint Secretary (E) 23381832
Sanjay Kumar Jain Director (Exploration II & Vig) 23386526 23303100
Rajender Kumar Kureel Director (Exploration I) 23381029 23303100
Marketing and Administration
Ashutosh Jindal Joint Secretary (M) 23382418 23384401
Sampooran Singh PPS to Joint Secretary (M) 23382418
K M Mahesh Director (LPG) 23387404 23383100
Gaurav Kumar Director (General & Parliament) 23383678 23383100
Mrityunjay Jha Deputy Secretary (Adm) 23386407 23383100
Gas Projects
Ashish Chatterjee Joint Secretary (GP) 23073165 23398804
S K Misra PS to Joint Secretary (GP) 23073165
Vijay Sharma Director (GP) 23073069 23383100
J C Babu Deputy Secretary (CA) 23388764
S S Mahar Deputy Secretary (GP) 23387936 23383100
International Cooperation
B N Reddy Joint Secretary (IC) 23382583 23073475
Ms Savita Sen PPS to Joint Secretary (IC) 23382583
Ms Esha Srivastava Director (IC) 23383508 23383100
Department Name (S/Shri) Designation Telephone No. Fax No.
Director General's officeMs. Atreyee Das Director General 24361616 / 24361081 24361253
P R Nair PS to Director General 24361616 / 24361081
FinanceVikram Gulati Director (Finance) 24360356 / 27306121 24364227
Ms. Satbir Hira PS to Director (F) 24360356 / 27306122
Demand & Economic Studies Ms. Anju Jai Misra Addl. Director (D & ES) 24362486 / 24306181 24361253
Supply Ms. B M Sujatha Addl. Director I/c (S) 24360352 / 24306141 24361253
Administration Sunil Kumar Addl. Director (HR & C) 24361717 / 24306111 24364225
IT Ms. Maninder Kaur Narula Addl. Director I/c (IT) 24306151 24361253
Marketing Niren Bhattacharya Addl. Director (Mktg.) 24360489 / 24306171 24361253
Gas Devender Nahar Addl. Director I/c (Gas) 24306161 24361253
EPABX NOs. 24306191 / 24306192, Reception - 24361314