Embed Size (px)
Citation preview

Journal of Arid Environments (2003) 54: 371–379doi:10.1006/jare.2002.1096
Preliminary results of dry-season trace gas andaerosol measurements over the Kalahari region
during SAFARI 2000
D. C. Stein%*, R. J. Swap%, S. A. Macko%, S. J. Pikethw,
B. Doddridgez & R. Bruintjes}
%Department of Enviromental Sciences, University of Virginia,Clark Hall, P.O. Box 400123, Charlottesville, VA 22904-4123, U.S.A.
wClimatology Research Group, University of Witwatersrand, Private Bag 3,2050 Wits, Johannesburg, South Africa
wUniversity of Maryland, Department of Meteorology, Computer andSpace Science Building, College Park, MD 20742, U.S.A.
}Research Applications Programme, National Center for AtmosphericResearch, P.O. Box 3000, Boulder, 10,80307-3000, U.S.A.
(Received 22 July 2002, accepted 22 July 2002)
Trace gas and aerosol data were collected through a series of flights over the aridKalahari Makgadikgadi Pan system. These data show statistically significantspatial and temporal variations in ozone concentrations, while SO2 concentra-tions were found to be relatively constant. Transport and photochemicalproduction processes are two possible mechanisms for the observed temporalvariation in ozone concentration. The presence of certain types of vegetationthat emit ozone-precursor gases may account for some of this spatial variation.Aerosols may also be formed as a result of the gases emitted. These species ofvegetation alter atmospheric chemistry characteristics and influence the climate.In arid regions, the presence of trace gases and aerosols has an important effecton radiation budget and cloud formation processes, which are significantcontrolling factors of climate. This paper is a first attempt to synthesize therelationship between surface ecology and atmospheric chemistry of aridenvironments to better understand the regional climate.
# 2003 Elsevier Science Ltd.
Keywords: volatile organic compounds (VOC); air quality; ozone formation;botswana; sua pan
Introduction
Results from the Southern African Fire-Atmosphere Research Initiative (SAFARI-92)suggested that biogenic emissions from both vegetative and microbial sources could
*Corresponding author. Fax: +1-484-924-4761; E-mail: [email protected]
0140-1963/03/020371 + 09 $35.00/0 # 2003 Elsevier Science Ltd.
372 D. C. STEIN ET AL.
contribute to the presence of seasonally occurring elevated lower tropospheric ozoneduring the late austral winter (Harris et al.,1996; Levine et al.,1996; Parsons et al.,1996, Tyson et al. 1997). The significance of these findings is that land surface covercan impact the atmospheric chemistry for a region during a season dominated bybiomass burning activities. Hayden investigated the role vegetation plays in creatingwarmer than expected minimum nocturnal temperatures in semi-arid and arid regionsof the world. Elevated levels of ozone due to biogenic emissions of compoundsincluding isoprenes, monoterpenes, and other volatile organic compounds (VOC),have been well documented in many regions of the world (Chameides et al., 1988;Fehsenfeld et al., 1992; Guenther et al., 1995). Traditionally, this type of VOCemissions research has been conducted in forested regions. However, in the regionsurrounding the pans, where vegetation is sparse, it is unlikely that the biogenicemissions would cause effects as pronounced as those described in the literature notedabove, but it is possible that biogenic emissions in this area and other arid regions likeit are important contributors to ozone precursors in southern Africa. The map shownin Fig. 1 illustrates the location of the Sua Pan region with respect to Pietersburg,which served as a base of operations for SAFARI 2000 research aircraft.
As part of the Southern African Regional Science Initiative (SAFARI 2000)August–September 2000 Intensive, trace gas and aerosol data were obtained usingSouth African Weather Bureau Aerocommander 690A JRB. Flight science objectivesfocused on the capture and description of trace gas and aerosol signatures for regionsinfluenced by pyrogenic, industrial and biogenic emissions. This paper presentspreliminary results concerning the physical and chemical characteristics of trace gasesand aerosols over the Kalahari, near the Sua Pan Region of Botswana and how thesemeasurements relate to surface ecology. Measurements obtained over the pan surfaceare compared to those measured over surrounding vegetated surfaces (Fig. 2,Tables 1, 2). Mechanisms for differences or similarities in these measurements areexplored. The hypothesis that ozone over vegetated surfaces in the Sua Pan Region
Figure 1. Detail of Pietersburg (large star) in relation to the location of the Sua Pan Region(enclosed in rectangle).

30
35
40
45
50
55
60
65
70
75
12:04:19 12:18:43 12:33:07 12:47:31
UTC
[pp
b]
0
100
200
300
400
500
600
700
800
900
1000
(pre
ssu
re le
vel h
Pa)
vegetation
pan
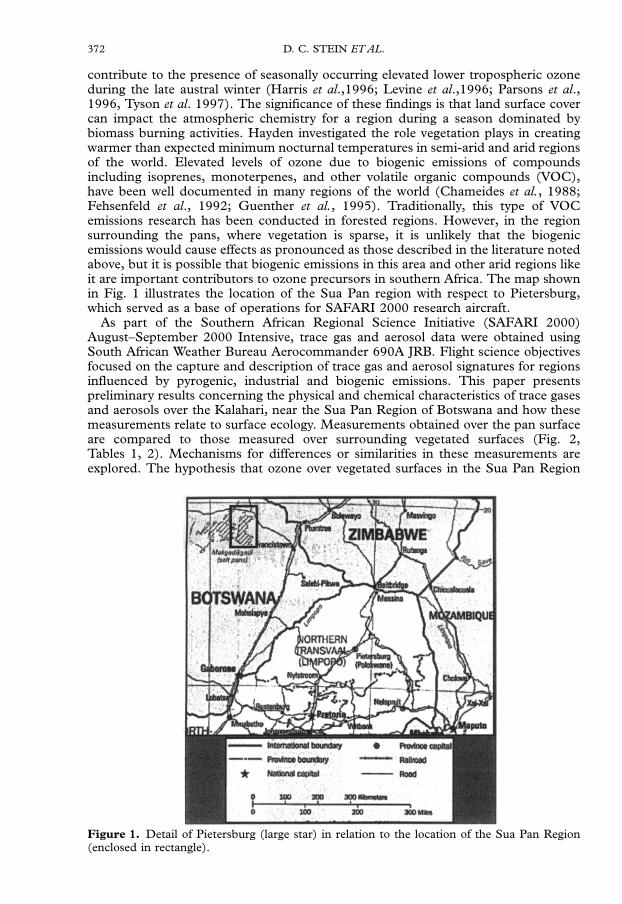
Figure 2. Detail of JRB Flight over the Sua Pan Region on 8/25/00: ozone concentration(black line) and pressure altitude (thin gray line) plotted against time (UTC) with labelsindicating portions of the flight over vegetation (thick gray line) over the pan (dashed line).
TRACE GAS AND AEROSOL MEASUREMENTS OVER THE KALAHARI REGION 373
measured at low levels should be higher, due to biogenic emissions, than theconcentration of ozone at the same level over the pan surface was developed fromsimilar ideas put forth in previous studies regarding ozone production as the result ofbiogenic emissions (Chameides et al., 1988; Fehsenfeld et al., 1992). This hypothesisis tested by examination of the data collected during near-surface portions of flighttracks. Possible mechanisms for these differences are explored through comparison ofmeteorological conditions, aerosol characteristics and the concentration of other tracegases (Fig. 2).
Methodology
Site description
Climatologic and meteorological summary
Climatological means for this region are estimated from climate data available forMahalapye, Botswana. Mahalapye is approximately 300 km south of Sua Pan and at asimilar elevation. Mean maximum/minimum temperatures for the months of Augustand September, respectively are 261C/71C and 291C/111C. Mean extreme maximumtemperature is 351C and 391C for August and September, respectively. The meanamount of precipitation received during August and September, respectively, is 2 and7 mm. It is likely that the climatology for the pan region is even lower than thesevalues. The average amount of cloudiness for these months is approximately two-tenths of total sky cover (Griffiths, 1972). No rain was observed for either flight dayand only a few thin cirrus clouds were observed on the afternoon of 9/03/00. Theprofiles of potential temperature (Fig. 3), given in Kelvin, clearly illustrate the locationof the boundary layer. The profile on the right was created from temperature andpressure data collected between 0645 and 0800 UTC using surface pressure at SuaPan Airport of 920 hPa as the reference pressure rather than the standard value of1000 hPa. The profile on the left was created using the surface pressure at PietersburgInternational Airport, South Africa (PTG) of 887 hPa. The nearly constant values ofpotential temperature between the surface and 4500 m a.s.l. indicate neutral stability.This neutral region of the profile corresponds to the location of the boundary layer.There is also a modest relative humidity increase with height throughout the neutralregion of the profile, which is also indicative of the boundary layer location. Becauserelative humidity is about 15% in the boundary layer and does not exceed 40%, the

0
1000
2000
3000
4000
5000
6000
7000
8000
9000
290.00 295.00 300.00 305.00 310.00 315.00 320.00 325.00 330.00
Alti
tude
(m
eter
s A
SL)
THETA (K)
Figure 3. Two vertical profiles of potential temperature (theta), profile over PTG (left) andprofile over Sua Pan region (right).
374 D. C. STEIN ET AL.
vertical profile of potential temperature is very similar to the profile of equivalentpotential temperature. The theta profile given in Fig. 3 indicates a significant stablelayer just above 4500 m a.s.l. This region of stability served to cap the haze layer atabout 4500 m a.s.l., which was very noticeable upon initial descent over the Sua Panarea. The height of the capped layer is consistent with the findings of Garstang et al.,(1996), Cosijn & Tyson (1996) and Swap & Tyson (1999). A marked decrease inrelative humidity, particle concentration and ozone concentration were noted justabove this level. Scattering coefficient data from the on-board nephelometer confirmthe presence of this layer as well.
Synoptic conditions on 8/25/00 featured a weak low-pressure system centered overthe southern Botswana–Namibia border region with central surface pressures between1012 and 1016 hPa. Surface flow for this days was southerly. The pattern was slightlydifferent on 9/03/00. A low with a central surface pressure of approximately 1004 hPawas located over northern central Botswana causing large-scale flow to be westerly.The surface station reported winds of about 5 knots (South African Weather Bureau,2000).
Land surface summary
The Sua Pan area is part of the larger Makgadikgadi Pan region. The characteristics ofthe region are a product of its lacustrine geologic history. The surface of the pan is ashallow mineral crust about 0?3–0?6 m thick made out of salt and various evaporites.This surface is very dry and virtually devoid of all types of vegetation. It is mostlywhite in color and therefore has a high albedo. Some of these minerals are harvestedfrom the pans and refined to make potash and sodium chloride in a nearby mine thatoperates through the use of sluice pipes and ponds. The vegetated surfaces near thepan are sparsely covered with small trees, bushes and grasses that grow out of a lightbrown sandy loam soil (De Wit & Nachtergaele, 1990). This surface has a loweralbedo and a higher roughness length (friction coefficient) than the relatively smooth,white pan surface. The most common grass species that surrounds the pan is theOdyssea paucinervis and the overall land cover of the vegetated region to the east of thepan is shrub savanna with some trees. This distribution of vegetation is described as aColophospermum mopane, Terminalia sericea alliance (Bekker & De Wit, 1991).Colophospermum mopane has been shown to be an important contributor to biogenicemissions and is considered a high emitter of monoterpenes (Guenther et al., 1996).
TRACE GAS AND AEROSOL MEASUREMENTS OVER THE KALAHARI REGION 375
Aircraft instrumentation
Data collection on the South African Weather Bureau Aerocommander 690A JRB wassimilar to the methods used by researchers from Max Planck Institute during theSAFARI-92 and the SA’ARI-94 campaigns (Helas et al., 1995; Harris et al., 1996; LeCanut et al., 1996). One-second data was obtained by logging instrument outputvoltages with analog channels. Ozone concentrations were measured using a TEI 49Cphotometric UV analyzer. This measurement is based on the principle that ozoneselectively absorbs UV wavelengths; however, other trace gases present as a result ofpyrogenic emissions absorb at a similar frequency (Huntzicker & Johnson, 1979;Grosjean & Harrison, 1985). For this reason, ozone measurements taken in thepresence of these compounds may appear to be anomalously high. The data presentedin this paper, however, were sampled in regimes where direct pyrogenic emissionswere not an influencing factor. Flaming or smoldering fires were not noted whileflying over this area. SO2 concentrations were measured with a TEI 43C analyzerprovided by Eskom, NO concentrations from a modified TEI 42C analyzer, andCO concentrations from a modified TEI 48S both from the University ofMaryland (Hallock, 1999). Total particle concentration and mean diameter ofaerosols was obtained using a PCASP-100� optical measurement system.Temperature and relative humidity data were obtained with Rosemont and Vaisalaprobes, respectively.
Methods of sampling and data analysis
All averages presented in this paper are 5-min averages and were calculated from 1-sinterval data derived from instrument voltage outputs. It should be noted that the O3
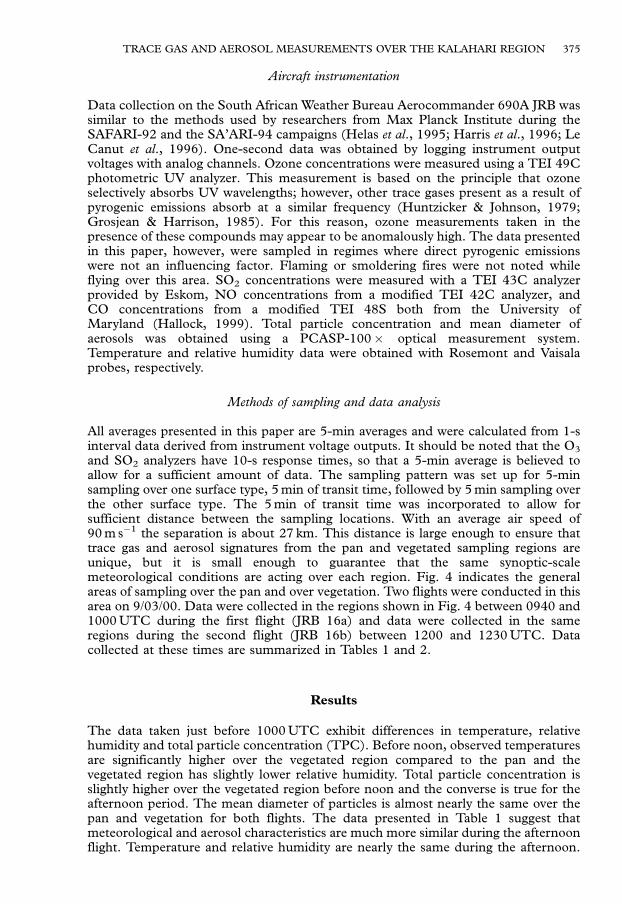
and SO2 analyzers have 10-s response times, so that a 5-min average is believed toallow for a sufficient amount of data. The sampling pattern was set up for 5-minsampling over one surface type, 5 min of transit time, followed by 5 min sampling overthe other surface type. The 5 min of transit time was incorporated to allow forsufficient distance between the sampling locations. With an average air speed of90 m s�1 the separation is about 27 km. This distance is large enough to ensure thattrace gas and aerosol signatures from the pan and vegetated sampling regions areunique, but it is small enough to guarantee that the same synoptic-scalemeteorological conditions are acting over each region. Fig. 4 indicates the generalareas of sampling over the pan and over vegetation. Two flights were conducted in thisarea on 9/03/00. Data were collected in the regions shown in Fig. 4 between 0940 and1000 UTC during the first flight (JRB 16a) and data were collected in the sameregions during the second flight (JRB 16b) between 1200 and 1230 UTC. Datacollected at these times are summarized in Tables 1 and 2.
Results
The data taken just before 1000 UTC exhibit differences in temperature, relativehumidity and total particle concentration (TPC). Before noon, observed temperaturesare significantly higher over the vegetated region compared to the pan and thevegetated region has slightly lower relative humidity. Total particle concentration isslightly higher over the vegetated region before noon and the converse is true for theafternoon period. The mean diameter of particles is almost nearly the same over thepan and vegetation for both flights. The data presented in Table 1 suggest thatmeteorological and aerosol characteristics are much more similar during the afternoonflight. Temperature and relative humidity are nearly the same during the afternoon.

Figure 4. Detail of the Sua Pan region (lightly stippled area) illustrating location of samplingregions: over the pan (cross-hatched oval region) and over vegetation(dark stippled region). Thecentral block is 11 latitude by 11 longitude, tick marks indicate 50 intervals. Corner coordinatesof the central block are: (20S, 25E) upper left; (20 S, 26 E) upper right; (21 S, 25E) lower left;and (21S, 26E) lower right.
Table 1. Summary of temperature, relative humidity, total particle concentration,and particle mean diameter data from JRB flights 16a and 16bF9/03/00
JRB Flight 16a T 1(C) RH (%) TPC (Number) Mean diameter (mm)
Over the pan 26?8 7 0?28 14?7 7 0?67 3820 7 224 0?190 7 0?002Over vegetation 29?4 7 0?35 11?5 7 1?00 4020 7 389 0?191 7 0?003
JRB Flight 16b
Over the pan 31?4 7 0?11 9?8 7 0?73 3200 7 228 0?190 7 0?002Over vegetation 31?8 7 0?26 8?6 7 0?72 2910 7 294 0?189 7 0?003
Table 2. O3 and SO2 data collected on JRB Flights 16a and 16b
JRB Flight 16a O3 (p.p.b.) SO2 (p.p.b.)
Over the pan 90?6 7 1?53 10?4 7 1?13Over vegetation 96?8 7 1?33 10?6 7 0?78
JRB Flight 16b
Over the pan 102?7 7 2?50 9?2 7 0?84Over vegetation 101?9 7 2?76 9?0 7 0?71
376 D. C. STEIN ET AL.

TRACE GAS AND AEROSOL MEASUREMENTS OVER THE KALAHARI REGION 377
The difference in ozone concentrations is no longer present in the afternoon portion ofthe flight. SO2 concentrations are nearly the same over both surface types and do notdiffer significantly from the concentrations observed just before noon. This lack ofvariability suggests that industrial emissions from the Francistown/Selibe Phikweregion did not exert a significant influence during either flight period. Highervariability in the ozone measurements may be attributed to boundary layer turbulenceduring peak heating hours. Another factor contributing to higher variability is due tothe oscillation associated with instrument ‘warm-up’. The lack of a ground-powersource at the Sua Pan airport did not allow for appropriate pre-flight instrumentoperation time (usually 1 h). To compensate for this, JRB circled in the vicinity of thedesired sampling area for 40 min before the data in Table 2 were collected. This time isadequate for accurate and reasonable measurements but not optimal. The overallincrease of 5–10 p.p.b. exhibited in ozone between morning and afternoon flights canprimarily be attributed to photochemical production. High ozone values for bothflights may partly be the result of long-range transport of ozone produced from agedpryogenic emissions from the widespread in Angola.
Discussion and conclusions
The data presented in Tables 1 and 2 suggest that biogenic emissions may have beenimportant contributors to the elevated levels of ozone before noon, but that thiscontribution may have been significantly reduced during the afternoon period due tothe atmospheric mixing associated with a growing planetary boundary layer. Theintensity of turbulent mixing during the peak time of boundary layer development mayhave also contributed to the similarity and greater variability of afternoonmeasurements. Possible evidence supporting the hypothesis includes elevatedtemperature and elevated particle number. If significant emissions of biogenic gaseswere occurring in the pre-noon period, then ambient temperatures at low-levels wouldbe higher; observed temperatures were higher over the vegetated surfaces compared tothe pan. A temperature difference in the two surfaces is also related to the albedodifference. The higher albedo of the pan surface creates a larger diurnal compared tothe vegetated surface. Nocturnal minimum temperature over the vegetated surfacemay also be higher due to the biogenic emissions as suggested by Hayden (1998). Theelevated level of total particle concentration may also be explained by increasedparticle formation through gas-to-particle conversion processes of the biogenicallyemitted gases. Emissions of certain types of monoterpenes have been documented toincrease as much as ten-fold when trees are blooming (Arey et al., 1991). Photographstaken from the aircraft of the vegetation indicate that some trees were in bloom.Blooming C. mopane may produce greater than average monoterpene emissions.
It has been shown that biogenic hydrocarbons, including monoterpenes, can onlycontribute to ozone formation in the presence of NOx (Warneck, 2000). The powergeneration plants, smelters and other industry located in the Francistown and SelibePhikwe may be significant sources of NOx depending on circulation patterns. Theseanthropogenic NOx emissions may influence the efficiency of ozone formation inregions with species like C. mopane. Biogenic hydrocarbons including monoterpenesare also important for the formation of particles that can serve as cloud condensationnuclei (CCN) (Schaefer, 1970; Fuentes et al., 2000). This type of CCN formationenhancement process has many implications for cloud formation and cloudcharacteristics including cloud optical properties and precipitation efficiency. For allthese reasons, it is critical to gain a greater understanding of the interactions betweenanthropogenic and biogenic emissions in this region and to continue efforts to mergeecological data with atmospheric chemical data. Both types of emissions have the

378 D. C. STEIN ET AL.
potential to greatly influence this arid climate. These findings also suggest that landcover and changes in that cover due to different land use practices in this region willindirectly affect climate. Alteration of the spatial extent of vegetative species like C.mopane will change atmospheric chemical properties including trace gas and aerosoldistributions, which ultimately have the ability to shape the climate of this arid region.
This study was a part of the Southern African Regional Science InitiativeFSAFARI 2000 andwas made possible through the support of the following NASA Grants: NASA–NAG5-7266,NASA–NAG5-7862, NASA–NAG5-9357, and NASA–NAG5-7939. The authors also thank K.Ross, R. Burger, and V. Whightman for their assistance in the field. D. C. Stein is supported bya University of Virginia Presidential Graduate Fellowship.
References
Arey, J., Corchnoy, S. & Atkinson, R. (1991). Emission of linalool from Valencia orangeblossoms and its observation in ambient air. Atmospheric Environment 25A: 1377–1381.
Bekker, R.P. & De Wit, P.V. (1991). Contribution to the Vegetation Classification of Botswana.Republic of Botswana: Food and Agriculture Organization of the United Nations, UnitedNations Development Programme. 66 pp.
Chameides, W., Lindsay, R.W., Richardson, J. & Kiang, C. S. (1988). The role of biogenichydrocarbons in urban photochemical smog: Atlanta as a case study. Science, 241: 1473–1475.
Cosijn, C. & Tyson, P.D. (1996). Stable discontinuities in the atmosphere over South Africa.South African Journal of Science 92: 381–386.
De Wit, P.V. & Nachtergaele, F.O. (1990). Explanatory Note on the Soil Map of the Republic ofBotswana. Republic of Botswana: Food and Agriculture Organization of the United Nations,United Nations Development Programme. 30 pp.
Fehsenfeld, F., Clavert, J., Fall, R., Goldan, P., Guenther, A. B., Hewitt, C.N., Lamb, B., Liu, S.,Trainer, M., Westberg, H. & Zimmerman, P. (1992). Emissions of VOCs from vegetation andthe implications for atmospheric chemistry. Global Biogeochemical Cycles, 6: 389–430.
Fuentes, J.D., Lerdau, M., Atkinson, R., Baldocchi, D., Bottenheim, J., Ciccioli, P., Lamb, B.,Geron, C., Gu, L., Guenther, A., Sharkey, T.D. & Stockwell, W. (2000). Biogenichydrocarbons in the atmospheric boundary layer: a review. Bulletin of the AmericanMeteorological Society, 81: 1537–1576.
Garstang, M., Tyson, P.D., Swap, R., Edwards, M., Kallberg, P. & Lindesay, J.A. (1996).Horizontal and vertical transport of air over southern Africa. Journal of Geophysical Research,101: 23 721–23 736.
Griffiths, J.F. (Ed.) (1972). Climates of Africa: World Survey of Climatology, Vol. 10. Amsterdam:Elsevier Publishing Company. 602 pp.
Grosjean, D. & Harrison, J. (1985). Response of chemiluminescence NOX analyzers andultraviolet ozone analyzers to organic air pollutants. Environmental Science and Technology, 19:862–865.
Guenther, A., Hewitt, C.N., Erickson, D., Fall, R., Geron, C., Graedel, T., Harley, P., Klinger,L., Lerdau, M., McKay, W.A., Pierce, T., Scholes, B., Steinbreacher, R., Tallamraju, R.,Taylor, J. & Zimmerman, P. (1995). A global model of natural volatile organic compoundemissions. Journal of Geophysical Research, 100: 8873–8892.
Guenther, A., Otter, L., Zimmerman, P., Greenberg, J., Scholes, R. & Scholes, M. (1996).Biogenic hydrocarbon emissions from southern African savannas. Journal of GeophysicalResearch, 101: 25 859–25 865.
Hallock, K. (1999). Instrumentation Description, Chapter 2, pp 40–81. Ph.D. dissertation,University of Maryland, Maryland, pp 40–81.
Harris, G.W., Weinhold, F.G. & Zenker, T. (1996). Airborne observation of strong biogenic NOX
emissions from the Namibian savanna at the end of the dry season. Journal of GeophysicalResearch, 101: 23 707–23 711.
Hayden, B.P. (1998). Ecosystem feedbacks on climate at the landscape scale. PhilosophicalTransactions of the Royal Society of London, 353: 5–18.

TRACE GAS AND AEROSOL MEASUREMENTS OVER THE KALAHARI REGION 379
Helas, G., Andreae, M.O., Schebeske, G. & LeCanut, P. (1995). SA’ARI-94: a preliminary viewof results. South African Journal of Science, 91: 360–362.
Huntzicker, J.J. & Johnson, R.L. (1979). Investigation of an ambient interference in themeasurement of ozone by ultraviolet absorption photometry. Environmental Science andTechnology, 13: 1414–1416.
Le Canut, P., Andreae, M.O., Harris, G.W., Weinhold, F.G., & Zenker, T. (1996). Airbornestudies of emissions from savanna fires in southern Africa. Journal of Geophysical Research, 101:23 615–23 630.
Levine, J.S., Winstead, E.L., Parsons, D.A.B., Scholes, M.C., Scholes, R.J., Cofer III, W.R.,Cahoon Jr., D.R. & Sebacher, D.I. (1996). Biogenic soil emission of nitric oxide and nitrousoxide from savannas in South Africa: the impact of wetting and burning. Journal of GeophysicalResearch, 101: 23 689–23 697.
Parsons, D.A.B., Scholes, M.C., Scholes, R.J. & Levine, J.S. (1996). Biogenic emissions fromsavanna soils as a function of fire regime, soil type, soil nitrogen, and water status. Journal ofGeophysical. Research, 101: 23 683–23 688.
Schaefer, V.J. (1970). Condensation nuclei: production of very large number in country air.Science, 170: 851–852.
South African Weather Bureau (2000). Daily Weather Bulletin for August and September. Republicof South Africa: Department of Environmental Affairs and Tourism. 63 pp.
Swap, R.J. & Tyson, P.D. (1999). Stable discontinuities as determinants of the verticaldistribution of aerosols and trace gases in the atmosphere. South African Journal of Science, 95:63–72.
Tyson, P.D., Garstang, M., Thompson, A.M., D’Abreton, P., Diab, R.D. & Browell, E.V.(1997). Atmospheric transport and photochemistry of ozone over central Southern Africaduring the Southern Africa Fire-Atmosphere Research Initiative. Journal of GeophysicalResearch, 102: 10 623–10 635.
Warneck, P. (2000). Chemistry of the Natural Atmosphere, Chapter 6, pp 265–283. San Diego, CA:Academic Press.