Embed Size (px)
Citation preview
November 2009
PREPARATORY SURVEY REPORTON
THE PROJECT FORTHE IMPROVEMENT OF WATER SUPPLY
SYSTEM IN ABBOTTABAD IN
THE ISLAMIC REPUBLIC OF PAKISTAN
GEDJR
09-118
THE DISTRICT GOVERNMENT ABBOTTABAD NORTH WEST FRONTIER PROVINCETHE ISLAMIC REPUBLIC OF PAKISTAN
JAPAN INTERNATIONAL COOPERATION AGENCY
NIHON SUIDO CONSULTANTS CO., LTD. and
JAPAN TECHNO CO., LTD.

PREFACE
Japan International Cooperation Agency (JICA) conducted the preparatory survey on the Project for the Improvement of Water Supply System in Abbottabad in the Islamic Republic of Pakistan.
JICA sent to Pakistan a survey team from April 15 to May 20, 2009.
The team held discussions with the officials concerned of the Government of Pakistan, and conducted a field study at the study area. After the team returned to Japan, further studies were made. Then, a mission was sent to Pakistan in order to discuss a draft outline design, and as this result, the present report was finalized.
I hope that this report will contribute to the promotion of the project and to the
enhancement of friendly relations between our two countries.
I wish to express my sincere appreciation to the officials concerned of the Government of the Islamic Republic of Pakistan for their close cooperation extended to the teams.
November 2009
Kikuo Nakagawa Director General, Global Environment Department Japan International Cooperation Agency
November 2009
Letter of Transmittal
We are pleased to submit to you the preparatory survey report on the Project for the
Improvement of Water Supply System in Abbottabad in the Islamic Republic of Pakistan.
This survey was conducted by the Consortium of Nihon Suido Consultants Co., Ltd. and
Japan Techno Co., Ltd., under a contract to JICA, during the period from March 2009 to
November 2009. In conducting the survey, we have examined the feasibility and rationale of the
project with due consideration to the present situation of Pakistan and formulated the most
appropriate outline design for the project under Japan’s Grant Aid scheme.
Finally, we hope that this report will contribute to further promotion of the project.
Very truly yours,
Hideki Asada
Project manager,
Preparatory Survey team on
the Project for the Improvement of
Water Supply System in Abbottabad
The Consortium of Nihon Suido
Consultants Co., Ltd. and Japan
Techno Co., Ltd.

Summary
Summary - 1
Summary (1) Outline of the Country The Islamic Republic of Pakistan has total population of 176,000,000 (in 2009) and the national land of 796,000 km2 is situated in-between Middle East and Asia, touching the Himalaya Mountains, the Karakorams and the Hindukukush Mountains east and west in the north and 8,000m high mountains like K2 and Nangapalapatt rising in Kashimir district. It is covered with the Suleimans in the west and with the Baluchistan highlands in the South west. In the east, Tar desert lies along the border of India. In about the center of the country, the Indus River flows through and forms the great plain. The country is extended long from north to south and climatically is much of variety from high mountainous ranges in the north to the Arabian Sea coastal regions in the south. Administratively it is consisting of four provinces such as North West Frontier Province where Abbottabad District, the target area of this project is located, Punjab, Sindh and Baiochistan, and in addition of FATA, NA and AJK. Population of the target area is about 200,000 in total, where about 67,000 in Abbottabad TMA (where the water supply service is made by the municipality), 27,000 in Nawansher area and 105,000 in the surrounding area. The target area is in the valley of Hazara Mountains, located in the south east of North West Frontier Province and has been a place of strategic importance for NWFP where Karakoram Highway to China passes through. Dor River also flows down to South in the east of the valley. The target area is situated at an altitude of 1,200m above sea level and is mild in summer but cold in winter. It snows sometimes in winter. The temperature in winter is below freezing and above 35ºC in summer. Average monthly precipitation in June and August exceeds 200 mm, according to the data during 2000 to 2008 of Kakur meteorological observatory station which is located 10 km away to the north from the target area. In the other months, it is less than 100 mm. As to the development strategy of Pakistan, they have listed 9 fields of importance such as “Stabilization and economic growth of macroeconomics”, “Welfare for the poverty and the weak of society”, “Improvement of agricultural productivity and added value”, ”Strengthening international competitiveness of industries” and etc., during 3 years of F/Y 2008/09 and F/Y 2010/ 11 according to the document No.11 on strategic decrease of the poor and needy announced in January 2009. In addition, “Medium Term Development Framework 2005-2010” and “Vision 2030” for the long term development have been formulated. (2) Background and Outline of the Project According to the “Medium Term Development Framework 2005-2010”, the target of water supply improvement is to achieve the access ratio to potable water to 76% (96% in urban and 65% rural) of total population in 2010 from 65% (85% in urban and 55% in rural) of it in 2004/2005. Also, the policy target of “National Drinking Water Policy, 2007 (draft) ” states to supply potable and stable water for entire population by 2020, and to reduce water borne diseases and patients for improving the quality of life.
Summary - 2
The water supplies in Abbottabad TMA and the surrounding U/Cs in Abbottabad District in North West Frontier Province (NWFP) have depended on groundwater as water sources for a long period. In recent years, however, the enhancement of water supply capacity is urgently required because of the rapid development and population increase in the target area, and the decrease of discharges of the existing wells. The service ratio of potable water at present is 57% only and in addition the duration time of water supply is less than one hour at many places. It is far from the situation of stable water supply. Also, the current water supply system, which is to pump up the well water to the distribution reservoirs located at a high elevation for water distribution, results the financial difficulty for water supply management due to high power cost. Further, the long term and stable operation is becoming difficult because of the shortage of well water due to excessive discharge of water and of the unexpected failures of pumps due to the lack of proper maintenance. In due consideration of the situation mentioned above, the District Government Abbottabad has made a plan to introduce the surface water by gravity from a ravine in the east of Abbottabad TMA in 1990. As to this plan, F/S by ADB was carried out in 1994 and their request for Grant Aid Project to Japanese Government has been made in December 2000. In response to their request, although Preliminary Study in 2002 and Basic Design Study in 2004 by JICA have been carried out, the implementation of the Grant Aid was cancelled because of the water rights conflict with the authorities down stream. However, since all the issues including water rights conflict has recently been settled, this Preparatory Survey of the project has been conducted. (3) Outline of Preparatory Survey and its Contents The objective of project is to mitigate the shortage of water supply capacity, to improve the water supply service ratio and to improve the living environment in Abbottabad TMA and the surrounding area in Abbottabad District. The preparatory survey was conducted during the period from April 15 to May 20, 2009, and a discussion on a draft outline design was held during the period from September 9 to 19, 2009. In order to achieve the objectives mentioned above, this Grant Aid Project consists of both the construction of surface water system and groundwater system including the development of new well units, and the capacity building based on Soft Component (Technical Assistance) for the sound operation and maintenance of facilities/systems, in Abbottabad TMA and the surrounding areas. Based on the request of Pakistan Government and results of discussion and survey at site, the planning of project has been carried out in accordance with the policies as follows. ① Policy for Target Year
Target Year is 2015 from the view point of high priority of Grant Aid and the size of the project.
② Policy for the design of facilities a) The target service coverage ratio is to achieve 92% of the population in 2015 from 57 %
(population served of about 114,000) service coverage at present in 2009 and to cover the future population served of 216,000.
b) In “National Drinking Water Policy, 2007 (draft)”, on domestic per capita consumption, it is recommended of 45 lpcd for rural area and 120 lpcd for urban area. The target area
Summary - 3
of this Grant Aid is consisting of urban area and non-urban area, but commercial area is included. In due comprehensive consideration of this fact and as a result of discussion with the District Government Abbottabad, the design per capita consumption is decided as 90 lpcd which is in between 45 lpcd for rural area and 120 lpcd for urban area, recommended by the National policy.
c) Surface water system is newly developed based on survey on the cost for pumping up and the possibility of groundwater quantity to be newly developed.
d) Intake flow rate from surface water is maximum 200 liter/sec which is agreed upon water rights with local authorities in the down stream, and four locations of intake facilities are settled based on the survey of actual flow rate of the river, and in due consideration of stable intake throughout a year, checking water flow in dry season as well. The locations of intake facilities are also decided to be available by gravity, from the survey of the cost on both construction and O&M for the intake facilities and pumping stations.
e) Surface water system is basically applied for distribution to the area of supply where is conveyed to distribution basin by gravity.
f) Groundwater system is basically applied for compensation for the shortage of surface water against the maximum daily supply in 2015. Further, groundwater is planned to take from the existing well as much as possible.
g) Water treatment system is designed to obtain the treated water quality meeting the water quality criteria specified in “National Standard of Drinking Water Quality (NSDWD) Pakistan Environmental Protection Agency, June 2008”, to be less chemicals requirement and to be user friendly operation and maintenance. From the view point of raw water characteristics, target treated water quality and etc., it is planned to apply Roughing Filters for medium fluctuation of turbidity and to apply Sedimentation Basins for high turbid water. For final treatment, Slow Sand Filters and Chlorine Disinfection are planned.
h) “Guideline for Design Criteria for Waterworks Facilities, 2000 (Japan Water Works Association)” is referred for the design of water supply facilities, due to unavailability of such guidelines in Pakistan. However, the Building Code of Pakistan (Seismic Provisions - 2007) from Ministry of Housing & Works of the Government of Pakistan is complied with.
③ Policy for operation and maintenance
It is planned to carry out the promotion on activities of Soft Component (Technical Assistance) for the necessary capacity building for the proper operation and maintenance of surface water system and for the sound management of existing three water supply agencies.
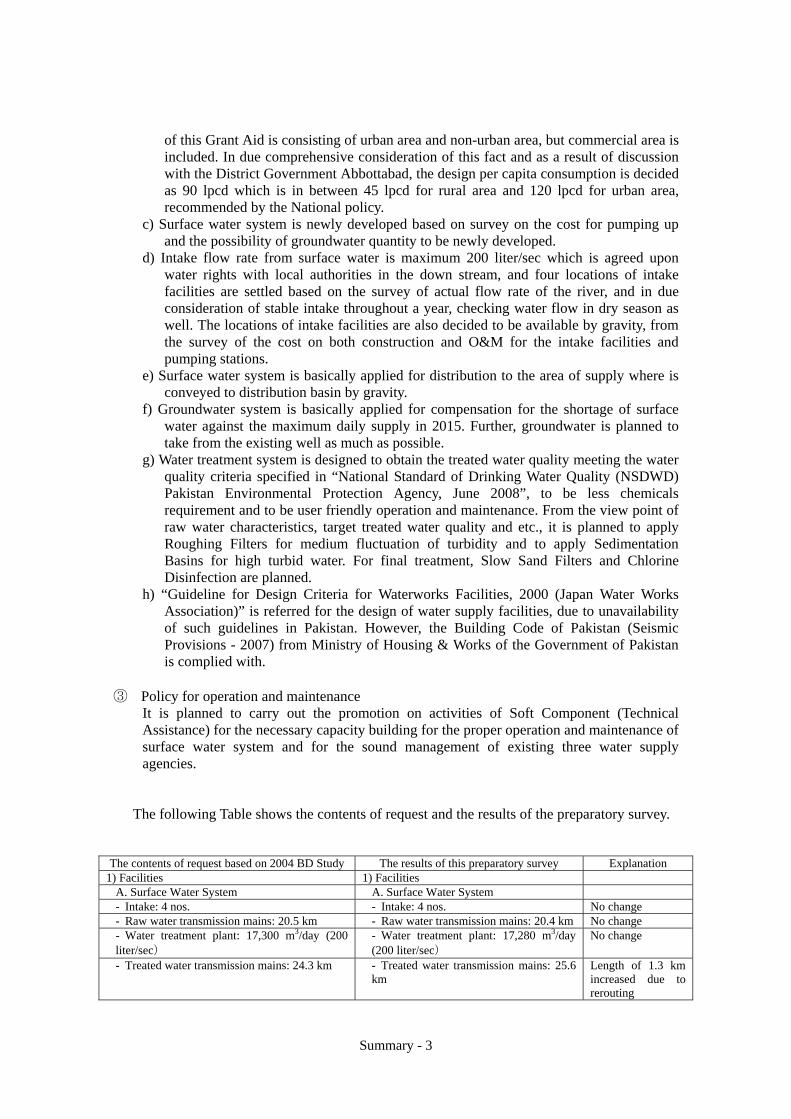
The following Table shows the contents of request and the results of the preparatory survey.
The contents of request based on 2004 BD Study The results of this preparatory survey Explanation
1) Facilities 1) Facilities A. Surface Water System A. Surface Water System - Intake: 4 nos. - Intake: 4 nos. No change - Raw water transmission mains: 20.5 km - Raw water transmission mains: 20.4 km No change - Water treatment plant: 17,300 m3/day (200 liter/sec)
- Water treatment plant: 17,280 m3/day (200 liter/sec)
No change
- Treated water transmission mains: 24.3 km - Treated water transmission mains: 25.6 km
Length of 1.3 km increased due to rerouting
Summary - 4
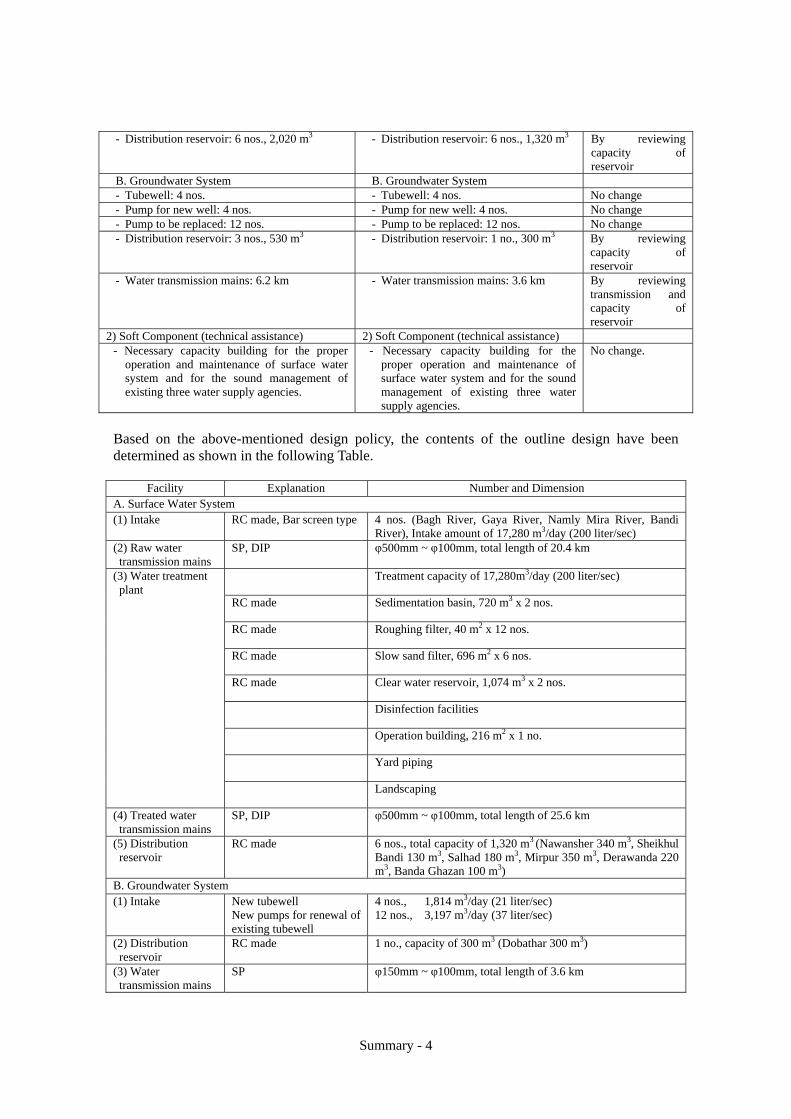
- Distribution reservoir: 6 nos., 2,020 m3 - Distribution reservoir: 6 nos., 1,320 m3 By reviewing capacity of reservoir
B. Groundwater System B. Groundwater System - Tubewell: 4 nos. - Tubewell: 4 nos. No change - Pump for new well: 4 nos. - Pump for new well: 4 nos. No change - Pump to be replaced: 12 nos. - Pump to be replaced: 12 nos. No change - Distribution reservoir: 3 nos., 530 m3 - Distribution reservoir: 1 no., 300 m3 By reviewing
capacity of reservoir
- Water transmission mains: 6.2 km - Water transmission mains: 3.6 km By reviewing transmission and capacity of reservoir
2) Soft Component (technical assistance) 2) Soft Component (technical assistance) - Necessary capacity building for the proper
operation and maintenance of surface water system and for the sound management of existing three water supply agencies.
- Necessary capacity building for the proper operation and maintenance of surface water system and for the sound management of existing three water supply agencies.
No change.
Based on the above-mentioned design policy, the contents of the outline design have been determined as shown in the following Table.
Facility Explanation Number and Dimension
A. Surface Water System (1) Intake RC made, Bar screen type 4 nos. (Bagh River, Gaya River, Namly Mira River, Bandi
River), Intake amount of 17,280 m3/day (200 liter/sec) (2) Raw water transmission mains
SP, DIP φ500mm ~ φ100mm, total length of 20.4 km
Treatment capacity of 17,280m3/day (200 liter/sec)
RC made Sedimentation basin, 720 m3 x 2 nos.
RC made Roughing filter, 40 m2 x 12 nos.
RC made Slow sand filter, 696 m2 x 6 nos.
RC made Clear water reservoir, 1,074 m3 x 2 nos.
Disinfection facilities
Operation building, 216 m2 x 1 no.
Yard piping
(3) Water treatment plant
Landscaping
(4) Treated water transmission mains
SP, DIP φ500mm ~ φ100mm, total length of 25.6 km
(5) Distribution reservoir
RC made 6 nos., total capacity of 1,320 m3 (Nawansher 340 m3, Sheikhul Bandi 130 m3, Salhad 180 m3, Mirpur 350 m3, Derawanda 220 m3, Banda Ghazan 100 m3)
B. Groundwater System (1) Intake New tubewell
New pumps for renewal of existing tubewell
4 nos., 1,814 m3/day (21 liter/sec) 12 nos., 3,197 m3/day (37 liter/sec)
(2) Distribution reservoir
RC made 1 no., capacity of 300 m3 (Dobathar 300 m3)
(3) Water transmission mains
SP φ150mm ~ φ100mm, total length of 3.6 km
Summary - 5
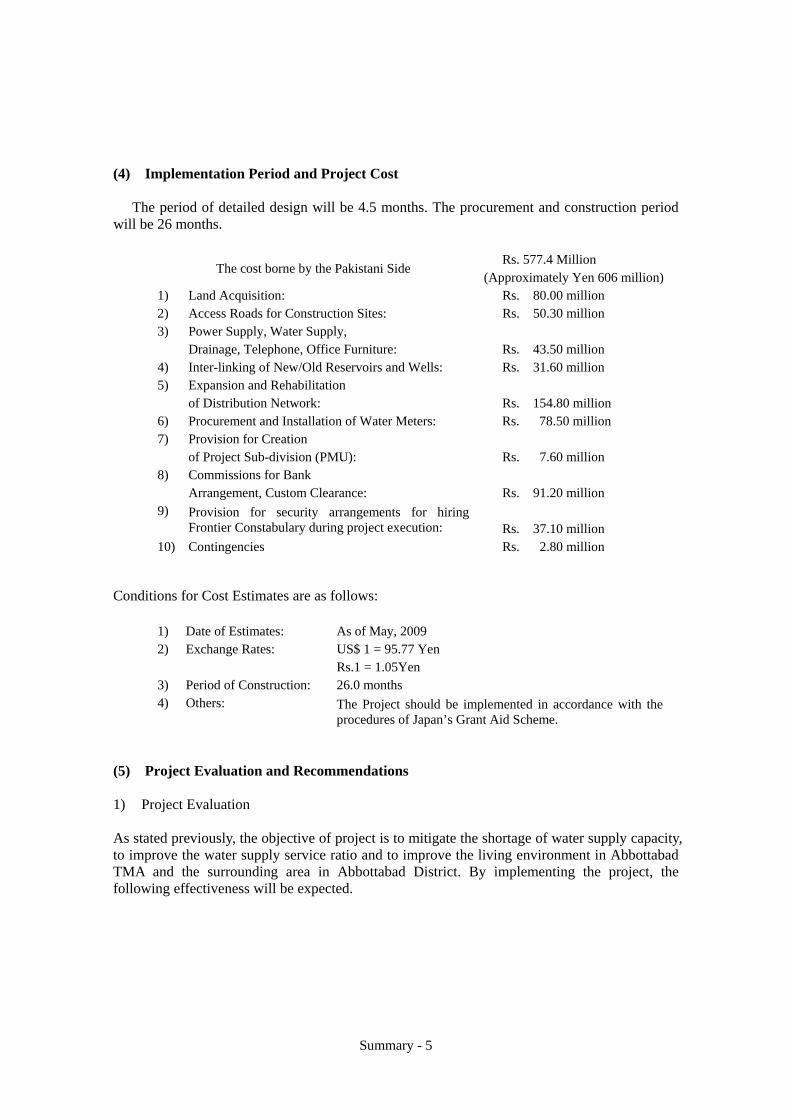
(4) Implementation Period and Project Cost
The period of detailed design will be 4.5 months. The procurement and construction period will be 26 months.
The cost borne by the Pakistani Side Rs. 577.4 Million
(Approximately Yen 606 million)1) Land Acquisition: Rs. 80.00 million 2) Access Roads for Construction Sites: Rs. 50.30 million 3)
Power Supply, Water Supply, Drainage, Telephone, Office Furniture:
Rs. 43.50 million
4) Inter-linking of New/Old Reservoirs and Wells: Rs. 31.60 million 5)
Expansion and Rehabilitation of Distribution Network:
Rs. 154.80 million
6) Procurement and Installation of Water Meters: Rs. 78.50 million 7)
Provision for Creation of Project Sub-division (PMU):
Rs. 7.60 million
8)
Commissions for Bank Arrangement, Custom Clearance:
Rs. 91.20 million
9)
Provision for security arrangements for hiring Frontier Constabulary during project execution:
Rs. 37.10 million
10) Contingencies Rs. 2.80 million
Conditions for Cost Estimates are as follows:
1) Date of Estimates: As of May, 2009 2)
Exchange Rates:
US$ 1 = 95.77 Yen Rs.1 = 1.05Yen
3) Period of Construction: 26.0 months 4)
Others:
The Project should be implemented in accordance with the procedures of Japan’s Grant Aid Scheme.
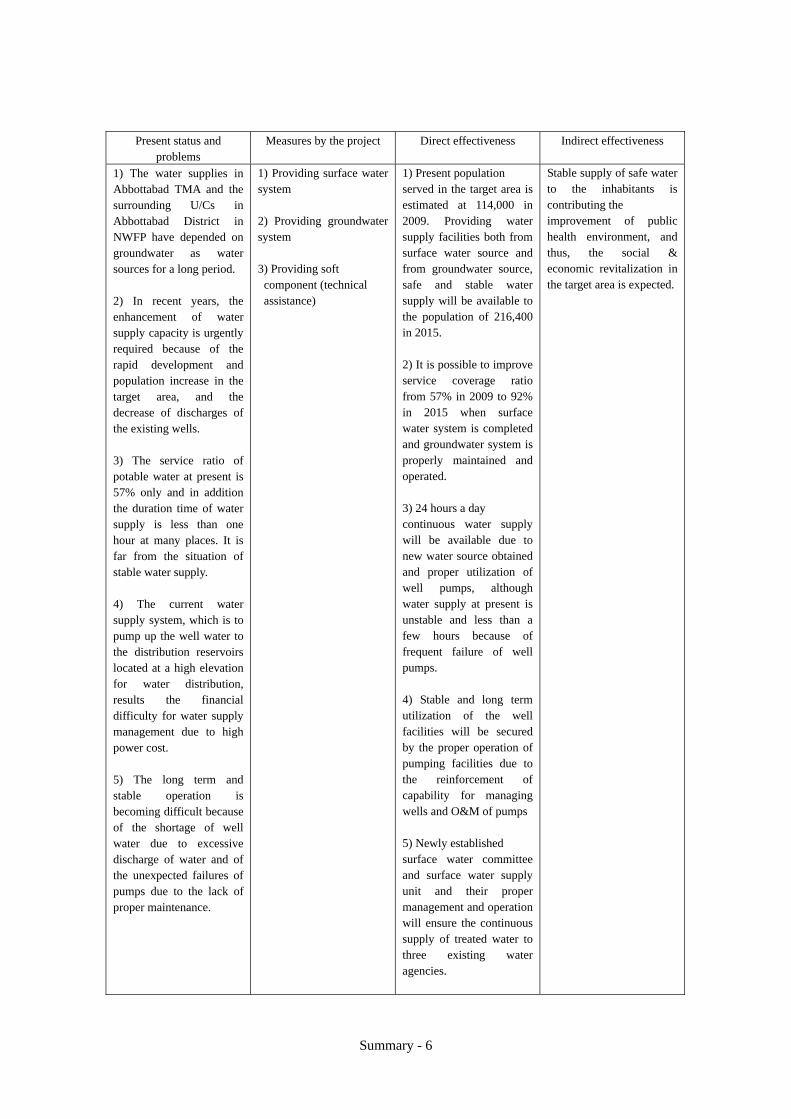
(5) Project Evaluation and Recommendations 1) Project Evaluation As stated previously, the objective of project is to mitigate the shortage of water supply capacity, to improve the water supply service ratio and to improve the living environment in Abbottabad TMA and the surrounding area in Abbottabad District. By implementing the project, the following effectiveness will be expected.
Summary - 6
Present status and problems
Measures by the project Direct effectiveness Indirect effectiveness
1) The water supplies in Abbottabad TMA and the surrounding U/Cs in Abbottabad District in NWFP have depended on groundwater as water sources for a long period. 2) In recent years, the enhancement of water supply capacity is urgently required because of the rapid development and population increase in the target area, and the decrease of discharges of the existing wells. 3) The service ratio of potable water at present is 57% only and in addition the duration time of water supply is less than one hour at many places. It is far from the situation of stable water supply. 4) The current water supply system, which is to pump up the well water to the distribution reservoirs located at a high elevation for water distribution, results the financial difficulty for water supply management due to high power cost. 5) The long term and stable operation is becoming difficult because of the shortage of well water due to excessive discharge of water and of the unexpected failures of pumps due to the lack of proper maintenance.
1) Providing surface water system 2) Providing groundwater system 3) Providing soft component (technical assistance)
1) Present population served in the target area is estimated at 114,000 in 2009. Providing water supply facilities both from surface water source and from groundwater source, safe and stable water supply will be available to the population of 216,400 in 2015. 2) It is possible to improve service coverage ratio from 57% in 2009 to 92% in 2015 when surface water system is completed and groundwater system is properly maintained and operated. 3) 24 hours a day continuous water supply will be available due to new water source obtained and proper utilization of well pumps, although water supply at present is unstable and less than a few hours because of frequent failure of well pumps. 4) Stable and long term utilization of the well facilities will be secured by the proper operation of pumping facilities due to the reinforcement of capability for managing wells and O&M of pumps 5) Newly established surface water committee and surface water supply unit and their proper management and operation will ensure the continuous supply of treated water to three existing water agencies.
Stable supply of safe water to the inhabitants is contributing the improvement of public health environment, and thus, the social & economic revitalization in the target area is expected.
Summary - 7
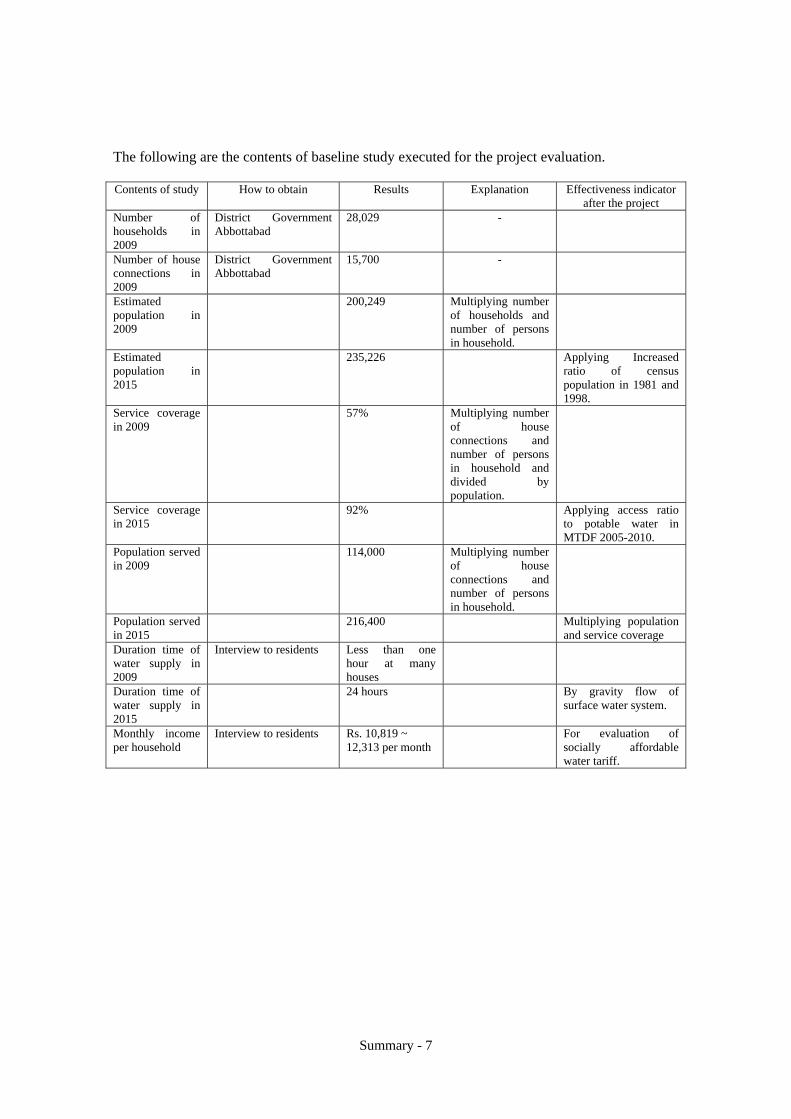
The following are the contents of baseline study executed for the project evaluation. Contents of study How to obtain Results Explanation Effectiveness indicator
after the project Number of households in 2009
District Government Abbottabad
28,029 -
Number of house connections in 2009
District Government Abbottabad
15,700 -
Estimated population in 2009
200,249 Multiplying number of households and number of persons in household.
Estimated population in 2015
235,226 Applying Increased ratio of census population in 1981 and 1998.
Service coverage in 2009
57% Multiplying number of house connections and number of persons in household and divided by population.
Service coverage in 2015
92% Applying access ratio to potable water in MTDF 2005-2010.
Population served in 2009
114,000 Multiplying number of house connections and number of persons in household.
Population served in 2015
216,400 Multiplying population and service coverage
Duration time of water supply in 2009
Interview to residents Less than one hour at many houses
Duration time of water supply in 2015
24 hours By gravity flow of surface water system.
Monthly income per household
Interview to residents Rs. 10,819 ~ 12,313 per month
For evaluation of socially affordable water tariff.

Summary - 8
2) Recommendations ① Establishment of surface water supply unit The existing water supply facilities in the service areas are operated and maintained by the three water supply agencies: 1) Works & Services Dept., the District Government Abbottabad, 2) Infrastructure, Abbottabad TMA and 3) Nawansher Service Unit. There is no bulk water supply and experience in management of water treatment plant in Abbottabad District. It is therefore proposed to establish a new Surface Water Supply Unit under the District Government Abbottabad, which will supply water to the three water supply agencies. It is required to recruit human resources with qualification and capability suitable for the operation and maintenance of bulk water supply system. Hence, it is necessary to provide advice and guidance through discussion with the three agencies and other related organizations, and facilitate preparation and coordination for establishment of the new Unit. To achieve the project goal, smooth operation by reinforcing the organizational structure and capacity building is indispensable. For a purpose of consideration of setting of appropriate water tariff and distribution of bulk water supply to the three existing water supply agencies with appropriate manner, it is simultaneously proposed to establish Water Committee whose members consist of the representatives of the District Government, Abbottabad TMA and Nawansher Service Unit for regulation and advice to activities of the new Unit, and the coordination with the existing agencies. It is desirable to establish this Water Committee in an early stage obtaining the understanding of the relevant organizations. The support with technical and managerial guidance is planned under the project for the establishment of Water Committee and Surface Water Supply Unit.
② Conservation and Control of Development of Groundwater Resource
The water balance of the basin in the project area is estimated to be currently balanced, with the intake of groundwater held to less than the recharge. The increasing intake of groundwater in the future, however, will eventually lead to decrease of yield, gradual fall of groundwater level, land subsidence and other environmental troubles across the area, unless measures for control of groundwater intake are taken. Impact is anticipated especially on the communities of the Western Terrace area as well as Nawansher, where tubewells are already congested. As a recommendation based on the results of this study, the development of groundwater resources in the area should be controlled with a regulation that new tubewells will be allowed to be installed only at locations more than 500 m apart from existing ones.
To ensure sustainable development and conservation of groundwater resources in the future at the same time, proper ground monitoring of discharges and water levels is indispensable. Immediate action should be taken for establishing such a monitoring system by rallying all the concerned stakeholders in the area.
③ Development of water distribution network
The Project is planned to supply bulk water to the distribution reservoirs of the three existing
Summary - 9
water supply agencies, and the effect of the project can be born by the appropriate distribution of water to the service areas through the distribution networks. Therefore, execution of necessary strengthening and expansion of the existing distribution networks is required including rehabilitation of the existing pipelines where required in conjunction with the implementation of the Project. PC-1 contains the development cost for the existing distribution networks. It is essential to implement the development of the distribution network with steadily manner.
④ Improvement of drainage system and construction of sewerage system
The improvement of water supply by increasing supply capacity results increase of waste water. It will be necessary to consider the improvement of drainage system first against waste water increase followed by the construction of sewerage system in the future to minimize the water pollution to the downstream.
Table of Contents - i
Preparatory Survey Report on
The Project for the Improvement of Water Supply System in Abbottabad in the Islamic Republic of Pakistan
- Contents -
Preface Letter of Transmittal Summary Contents Location Map/Perspective List of Figures & Tables Abbreviations
Chapter 1 Background of the Project --------------------------------------------------------------- 1 - 1 1-1 Background of the Project ----------------------------------------------------------- 1 - 1 1-2 Natural Conditions -------------------------------------------------------------------- 1 - 1 1-3 Environmental and Social Considerations --------------------------------------- 1 - 11
Chapter 2 Contents of the Project ------------------------------------------------------------------- 2 - 1 2-1 Basic Concept of the Project--------------------------------------------------------- 2 - 1
2-1-1 Overall Goal and Project Objective ---------------------------------------- 2 - 1 2-1-2 General Description of the Project ----------------------------------------- 2 - 1
2-2 Outline Design of the Japanese Assistance ---------------------------------------- 2 - 3 2-2-1 Design Policy ----------------------------------------------------------------- 2 - 3 2-2-2 Basic Plan---------------------------------------------------------------------- 2 - 7
2-2-2-1 Population and Water Demand in the target year of 2015------ 2 - 7 2-2-2-2 Allocation Plan for Surface Water and Groundwater --------- 2 - 10 2-2-2-3 Surface Water System --------------------------------------------- 2 - 13 2-2-2-4 Groundwater system----------------------------------------------- 2 - 24 2-2-2-5 Locations and Capacities of New Distribution Reservoirs --- 2 - 26
2-2-3 Outline Design Drawings-------------------------------------------------- 2 - 37 2-2-4 Implementation Plan ------------------------------------------------------- 2 - 59
2-2-4-1 Implementation Policy -------------------------------------------- 2 - 59 2-2-4-2 Implementation Conditions --------------------------------------- 2 - 60
Table of Contents - ii
2-2-4-3 Scope of Works ---------------------------------------------------- 2 - 61 2-2-4-4 Consultant Supervision-------------------------------------------- 2 - 62 2-2-4-5 Quality Control Plan----------------------------------------------- 2 - 63 2-2-4-6 Procurement Plan -------------------------------------------------- 2 - 65 2-2-4-7 Operational Guidance Plan --------------------------------------- 2 - 66 2-2-4-8 Soft Component (Technical Assistance) Plan------------------ 2 - 66 2-2-4-9 Implementation Schedule ----------------------------------------- 2 - 69
2-3 Obligations of Recipient Country ------------------------------------------------- 2 - 71 2-3-1 Land Acquisition ----------------------------------------------------------- 2 - 71 2-3-2 Construction of Access Roads to Intake Sites, Water Treatment Plant and Distribution Reservoirs ------------------------------------------------ 2 - 71 2-3-3 Power and Telephone Lines to the Project Site------------------------- 2 - 71 2-3-4 Obligations for New and Existing Distribution Reservoirs ----------- 2 - 71 2-3-5 Right of Way for Raw and Treated Water Transmission Mains ----- 2 - 72 2-3-6 Procurement and Installation of Water Meters ------------------------- 2 - 72 2-3-7 Implementation of Measures to Reduce Non-Revenue Water (NRW) ----------------------------------------------------------------------------- 2 - 72 2-3-8 Approval of PC-1 ----------------------------------------------------------- 2 - 72 2-3-9 Other Requirements -------------------------------------------------------- 2 - 72
2-4 Project Operation Plan-------------------------------------------------------------- 2 - 74 2-4-1 Organization for Management and Operation --------------------------- 2 - 74
2-4-1-1 Operation and Management of the Surface Water System ---- 2 - 74 2-4-1-2 Operation and Management of the Groundwater System------ 2 - 75 2-4-1-3 Strengthening of Water Bill Collection -------------------------- 2 - 76
2-4-2 Operation and Maintenance of the Surface Water System------------- 2 - 76 2-4-2-1 Operation and Maintenance of the Water Treatment Plant ---- 2 - 76 2-4-2-2 Operation and Maintenance of Intake, Raw Water Transmission Mains and Treated Water Transmission Mains- 2 - 77
2-5 Project Cost Estimation ------------------------------------------------------------ 2 - 78 2-5-1 Initial Cost Estimation ----------------------------------------------------- 2 - 78 2-5-2 Operation and Maintenance Cost----------------------------------------- 2 - 78
2-5-2-1 Water Tariff--------------------------------------------------------- 2 - 78 2-5-2-2 Operation and Maintenance Costs and Water Revenues ----- 2 - 80
2-6 Other Relevant Issues--------------------------------------------------------------- 2 - 84
Chapter 3 Project Evaluation and Recommendations -------------------------------------------- 3 - 1 3-1 Project Evaluation--------------------------------------------------------------------- 3 - 1 3-2 Recommendations--------------------------------------------------------------------- 3 - 3
Table of Contents - iii
[Appendices]
1.----------------------- Member List of the Study Team 2.----------------------- Study Schedule 3.----------------------- List of Parties Concerned in the Recipient Country 4.----------------------- Minutes of Discussions 5.----------------------- Soft Component (Technical Assistance) Plan 6.----------------------- Other Relevant Data 7.----------------------- References
7-1 ---------- Hydrogeological Background and Data 7-2------------Allocation Plan for Surface Water & Groundwater
7-3------------Questionnaire on Socio & Economic Conditions
7-4------------Environmental Check List
7-5 ---------- Hydraulic Analysis of Water Transmission Mains

Location Map
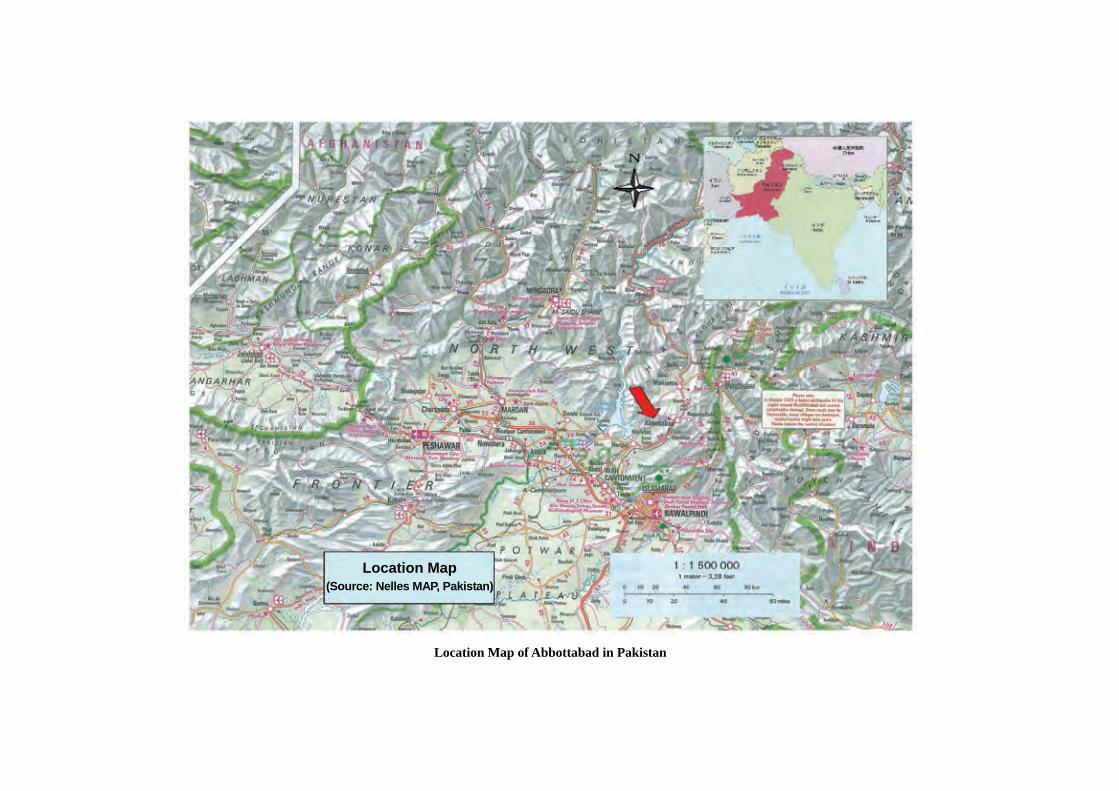
Location Map of Abbottabad in Pakistan
Location Map (Source: Nelles MAP, Pakistan)
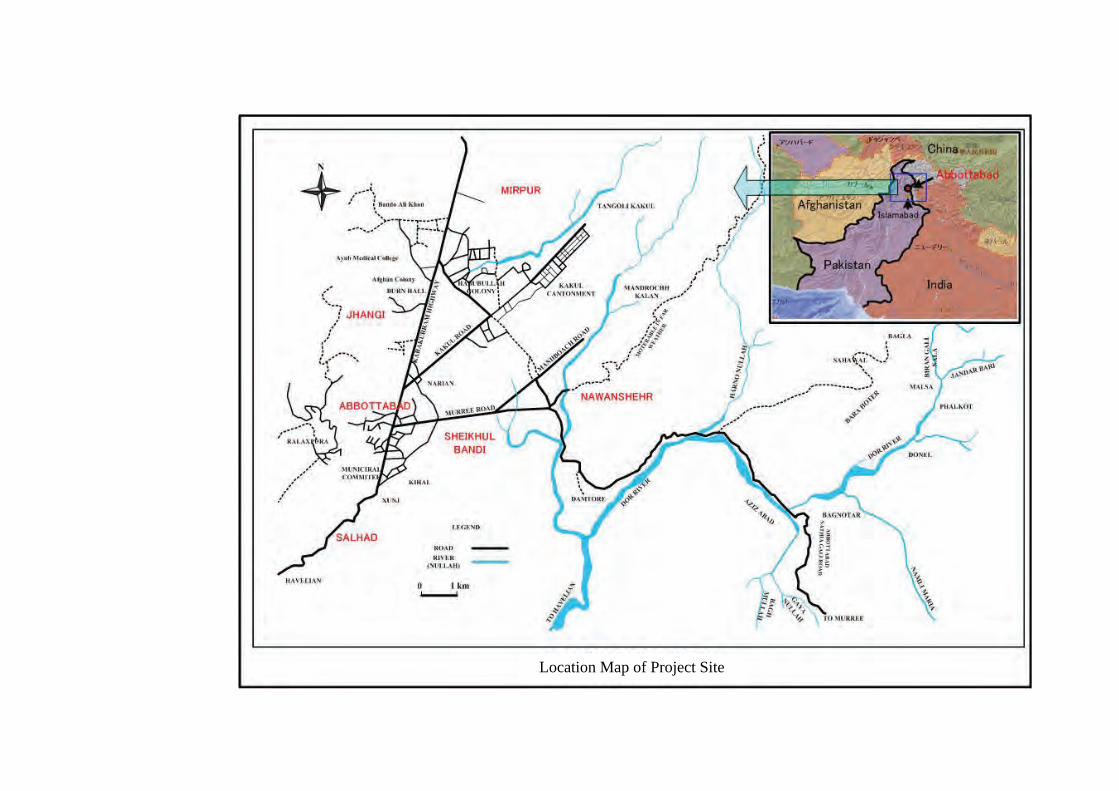
Location Map of Project Site

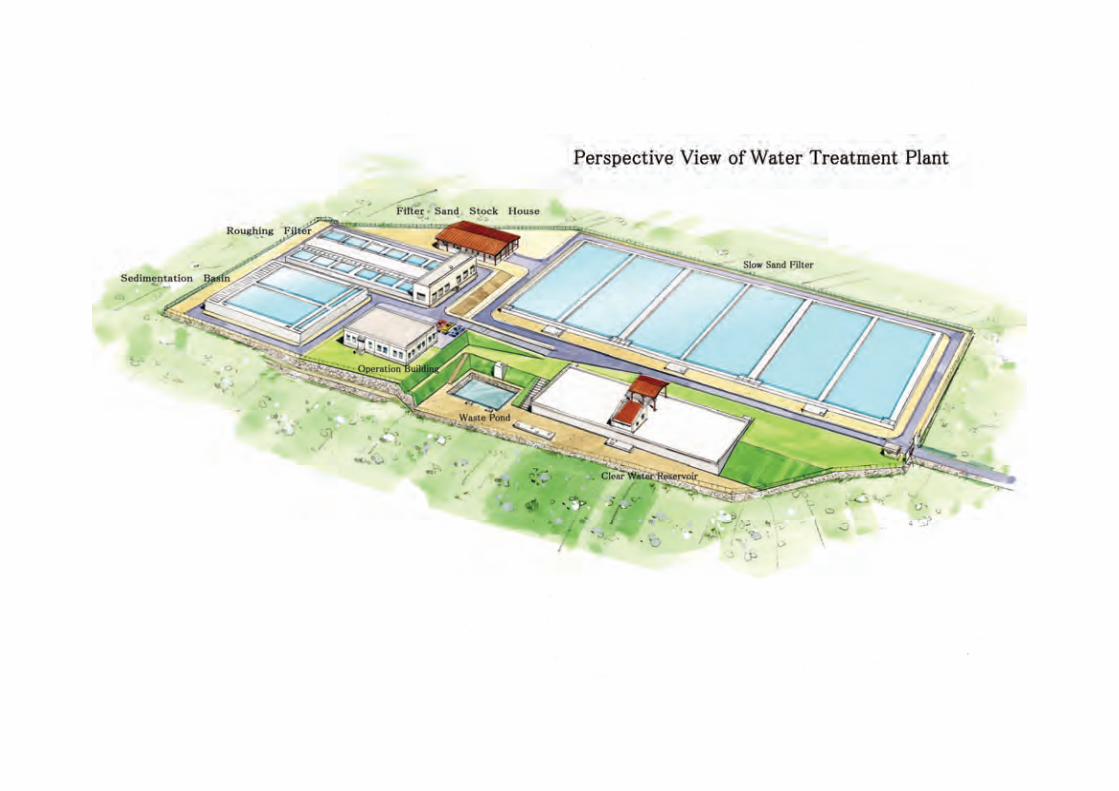
Perspective View of Water Treatment Plant

List of Tables & Figures
List of Tables & Figures - i
List of Tables & Figures
List of Tables
Table 1-1-1 Outline of request based on 2004 BD Study............................................................1-1
Table 1-2-1 Monthly Precipitation Data at Kakul Station (mm) .................................................1-2
Table 1-2-2 Present Condition of Existing Tubewells and Future Measures ..............................1-4
Table 1-2-3 List of Specifications of New Tubewells .................................................................1-5
Table 1-2-4 Range of Sustainable Groundwater Development in the Project Area ....................1-8
Table 1-2-5 Results of Groundwater Quality Analysis................................................................1-9
Table 1-2-6 (1) Flow Measurement Results in May and June of 2009 ..........................................1-9
Table 1-2-6 (2) Flow Measurement Results in July and August of 2009 .......................................1-9
Table 1-2-7 Yearly Minimum Flow Data for Dor River ...........................................................1-10
Table 1-2-8 Monthly Precipitation Data at Kakul Station (mm) ...............................................1-11
Table 1-2-9 Results of Raw Water Quality Analysis in Four Intake Sites.................................1-11
Table 1-3-1 Mitigation Measures on the Environmental and Social Impacts ...........................1-12
Table 2-2-1 Number of Households and House Connections .....................................................2-7
Table 2-2-2 The Current Population, Population Served and Service Coverage ........................2-7
Table 2-2-3 Future Population.....................................................................................................2-8
Table 2-2-4 Service Coverage and Population Served in year 2015 ...........................................2-9
Table 2-2-5 Future per capita Consumption, NRW ratio and Peak Factor..................................2-9
Table 2-2-6 Average Daily Water Demand and Maximum Daily Water Demand ....................2-10
Table 2-2-7 Existing and Under-construction Wells Available for the Future Supply ..............2-11
Table 2-2-8 Groundwater Development Plan including New Wells .........................................2-12
Table 2-2-9 Distribution Plan for Groundwater and Surface Water in the Service Areas .........2-13
Table 2-2-10 Pipe Diameters, Pipe Materials and Lengths of Pipelines for Raw Water
Transmission Mains...............................................................................................2-14
Table 2-2-11 Major Features of the Water Treatment Plant ........................................................2-18
Table 2-2-12 Treated Water Transmission to Service Areas........................................................2-20
Table 2-2-13 Diameters, Pipe Materials, Lengths of Pipelines for Treated Water
Transmission Mains (Surface Water System) ........................................................2-23
Table 2-2-14 Existing and New Reservoirs Requiring Water Level Control Valves
and Flowmeters......................................................................................................2-24
Table 2-2-15 List of Tubewells in Need of Pump Replacement .................................................2-25
Table 2-2-16 List of New Transmission Pipelines for Groundwater System ..............................2-26
List of Tables & Figures - ii
Table 2-2-17 List of New Distribution Reservoirs to be constructed..........................................2-26
Table 2-2-18 Scope of Well Construction and Existing Well Pump Replacement......................2-61
Table 2-2-19 Scope of Intake Construction.................................................................................2-61
Table 2-2-20 Scope of Raw and Treated Water Mains................................................................2-61
Table 2-2-21 Scope of Water Treatment Plant Construction.......................................................2-61
Table 2-2-22 Scope of Distribution Reservoir Construction.......................................................2-62
Table 2-2-23 Major Work Items and Methods for Quality Control.............................................2-64
Table 2-2-24 Procurement Plan for Major Construction Materials and Equipment....................2-65
Table 2-2-25 Inland Transportation.............................................................................................2-66
Table 2-5-1 Abbottabad TMA 2008 Water Tariff ......................................................................2-79
Table 2-5-2 Present Water Revenue and Operation & Maintenance Cost in 2007/2008...........2-79
Table 2-5-3 Operation & Maintenance Cost for Surface Water System and Those Costs
Incurred by Abbottabad TMA, Nawansher Service Unit and District Government
Abbottabad.............................................................................................................2-81
Table 2-5-4 Comparison of Annual Operation & Maintenance Costs and
Water Revenues with Increased Water Tariff.........................................................2-82
Table 2-5-5 Degree of Water Tariff Increase and Effects on Household Income......................2-83
List of Tables & Figures - iii
List of Figures
Figure 1-2-1 Monthly River Flow Variation for the Past 9 Years .............................................1-10
Figure 2-2-1 Location of Intakes, Raw Water Transmission Mains, Pressure
Releasing Chambers, Water Treatment Plant.........................................................2-16
Figure 2-2-2 Location of Treated Water Transmission Main, Tube Wells and Reservoirs .........2-22
Figure 2-2-3 Abbottabad City Water Supply Scheme (Aram Bagh System)..............................2-27
Figure 2-2-4 Abbottabad City Water Supply Scheme (Kunj System) ........................................2-28
Figure 2-2-5 Abbottabad City Water Supply Scheme (Jinnah System)......................................2-29
Figure 2-2-6 Nawansher Water Supply Scheme .........................................................................2-30
Figure 2-2-7 Abbottabad District Water Supply Scheme (Sheikhul Bandi System) ..................2-31
Figure 2-2-8 Abbottabad District Water Supply Scheme (Salhad System) ................................2-32
Figure 2-2-9 Abbottabad District Water Supply Scheme (Mirpur System)................................2-32
Figure 2-2-10 Abbottabad District Water Supply Scheme (Derawanda System) .........................2-33
Figure 2-2-11 Abbottabad District Water Supply Scheme at Jhangi UC......................................2-34
Figure 2-2-12 Abbottabad District Water Supply Scheme (Banda Phugwarian System) .............2-36
Figure 2-2-13 Abbottabad District Water Supply Scheme (Dobather System) ............................2-36
Figure 2-2-14 Organizational Concept for Project Implementation .............................................2-59
Figure 2-2-15 Implementation Schedule ......................................................................................2-70
Figure 2-4-1 Proportions of Dependence on Surface Water System and Groundwater System .2-74
Figure 2-4-2 Organization Chart for the Surface Water Supply Unit .........................................2-75
Figure 2-5-1 Balance of Operation and Maintenance Cost and Water Revenue
after the Project......................................................................................................2-83

Abbreviations

Abbreviations
Abbreviations
ADB: Asian Development Bank
ADO: Assistant District Officer
AJK: Azad Jammu Kashmir
A/P: Authorization to Pay
BD (B/D): Basic Design
BHN: Basic Human Needs
BOD: Biochemical Oxygen Demand
DCO: District Coordination Officer
DDO: Deputy District Officer
DIP: Ductile Iron Pipe
EDO: Executive District Officer
EIA: Environmental Impact Assessment
E/N: Exchange of Notes
FATA: Federally Administered Tribal Areas
FS (F/S): Feasibility Study
GAWS: Greater Abbottabad Gravity Water Supply Scheme
G/A: Grant Agreement
GDP: Gross Domestic Product
GNP: Gross National Product
IEE: Initial Environmental Examination
IMF: International Monetary Fund
JICA: Japan International Cooperation Agency
JIS: Japan Industrial Standards
KfW: The German Development Bank
LGE&RDD: The Local Government, Election and Rural Development
lpcd: litre per capita day, unit water consumption per day per capita
LWL: Low Water Level
M/D: Minute of Discussion
NA: Northern Areas
NOC: No Objection Certificate
NSDWG: National Standards for Drinking Water Quality
NUDP: NWFP Urban Development Project
NWFP: North West Frontier Province
PC-1: Planning Commission-1
PHED: Public Health Engineering Department
PMA: Pakistan Military Academy
PMU: Project Management Unit
PSDP: Public Sector Development Programme
PVC: Polyvinyl Chloride Pipe
SP: Steel Pipe
SUDP: Second Urban Development Project
TMA: Town Municipal Administration
U/C: Union Council
WASA: Water and Sanitation Agency
WHO: World Health Organization
WS&S: Water Supply and Sanitation
Units
cm: centimeter
kg/m3: kilogram per cubic meter
km: kilometer
km2: square kilometer
kW: kilowatt
m: meter
mm: millimeter
m3: cubic meter
m3/d: cubic meter per day
l/s: liter per second
lpcd: liter per capita per day
N/mm2: Newton per square millimeter
Rs.: Pakistan Rupee
Rs./m3: Rupees per cubic meter
US$: United States Dollar

Chapter 1 Background of the Project
1 - 1
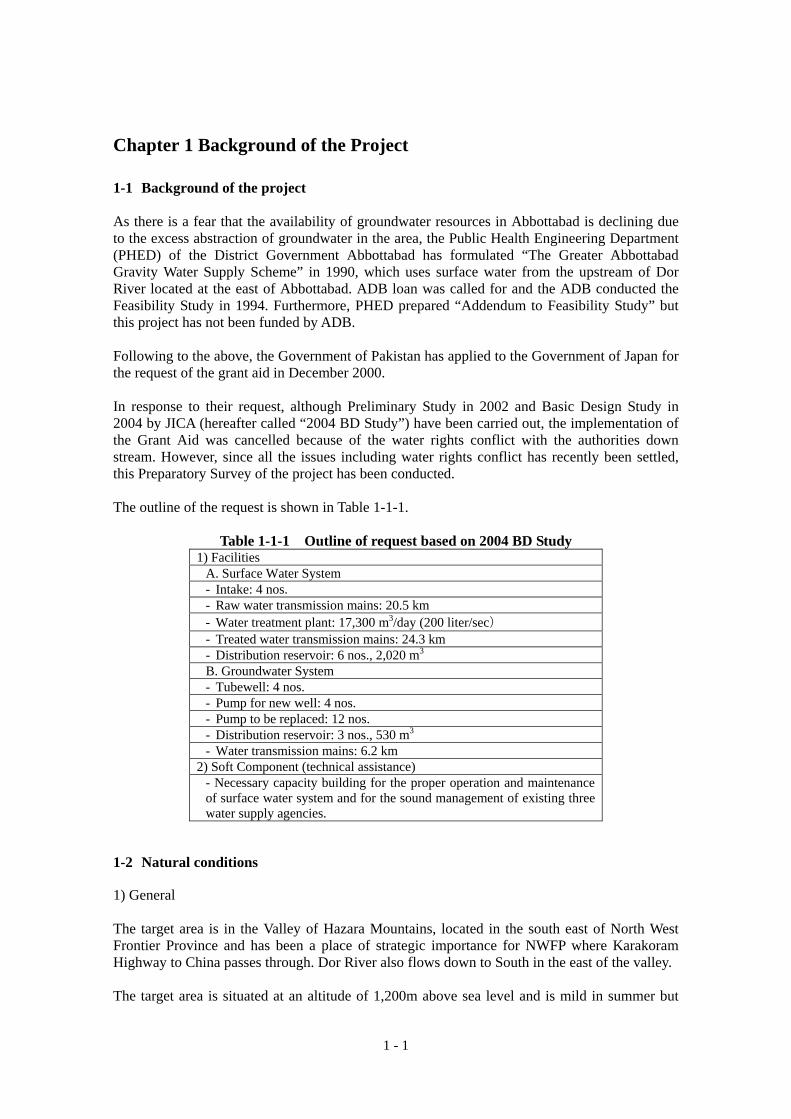
Chapter 1 Background of the Project 1-1 Background of the project As there is a fear that the availability of groundwater resources in Abbottabad is declining due to the excess abstraction of groundwater in the area, the Public Health Engineering Department (PHED) of the District Government Abbottabad has formulated “The Greater Abbottabad Gravity Water Supply Scheme” in 1990, which uses surface water from the upstream of Dor River located at the east of Abbottabad. ADB loan was called for and the ADB conducted the Feasibility Study in 1994. Furthermore, PHED prepared “Addendum to Feasibility Study” but this project has not been funded by ADB. Following to the above, the Government of Pakistan has applied to the Government of Japan for the request of the grant aid in December 2000. In response to their request, although Preliminary Study in 2002 and Basic Design Study in 2004 by JICA (hereafter called “2004 BD Study”) have been carried out, the implementation of the Grant Aid was cancelled because of the water rights conflict with the authorities down stream. However, since all the issues including water rights conflict has recently been settled, this Preparatory Survey of the project has been conducted. The outline of the request is shown in Table 1-1-1.
Table 1-1-1 Outline of request based on 2004 BD Study 1) Facilities
A. Surface Water System - Intake: 4 nos. - Raw water transmission mains: 20.5 km - Water treatment plant: 17,300 m3/day (200 liter/sec) - Treated water transmission mains: 24.3 km - Distribution reservoir: 6 nos., 2,020 m3
B. Groundwater System - Tubewell: 4 nos. - Pump for new well: 4 nos. - Pump to be replaced: 12 nos. - Distribution reservoir: 3 nos., 530 m3 - Water transmission mains: 6.2 km
2) Soft Component (technical assistance) - Necessary capacity building for the proper operation and maintenance of surface water system and for the sound management of existing three water supply agencies.
1-2 Natural conditions 1) General The target area is in the Valley of Hazara Mountains, located in the south east of North West Frontier Province and has been a place of strategic importance for NWFP where Karakoram Highway to China passes through. Dor River also flows down to South in the east of the valley. The target area is situated at an altitude of 1,200m above sea level and is mild in summer but
1 - 2
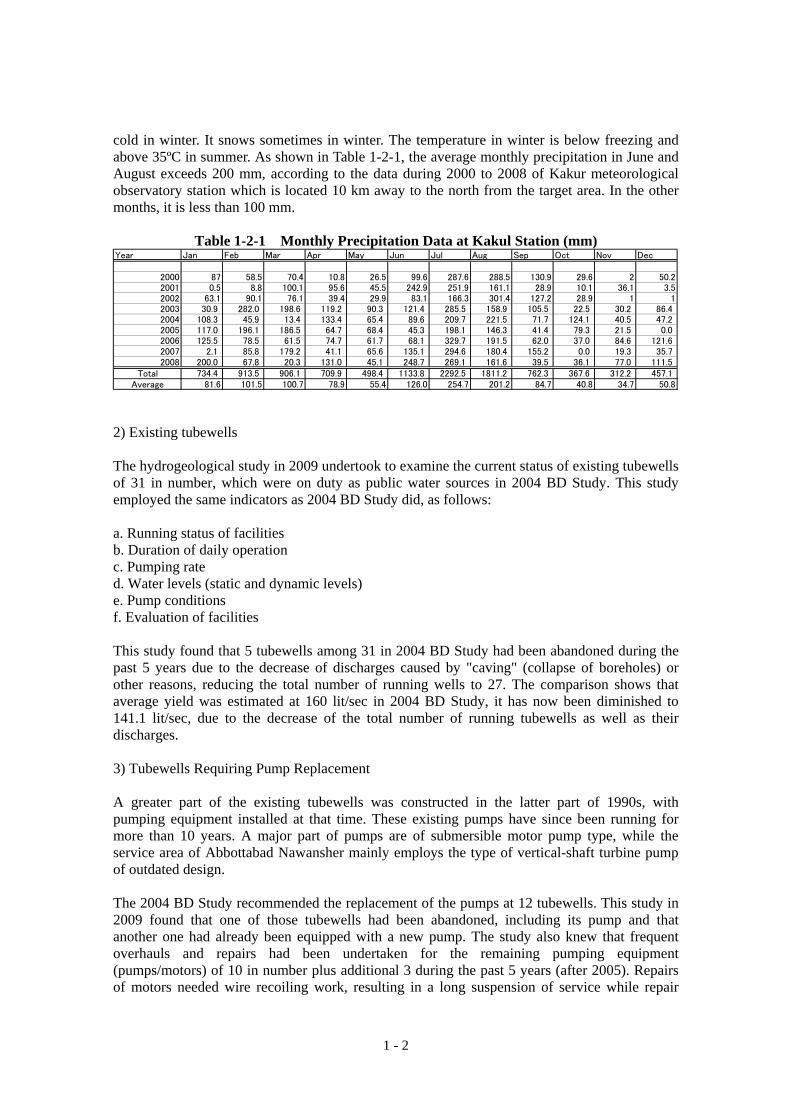
cold in winter. It snows sometimes in winter. The temperature in winter is below freezing and above 35ºC in summer. As shown in Table 1-2-1, the average monthly precipitation in June and August exceeds 200 mm, according to the data during 2000 to 2008 of Kakur meteorological observatory station which is located 10 km away to the north from the target area. In the other months, it is less than 100 mm.
Table 1-2-1 Monthly Precipitation Data at Kakul Station (mm) Year Jan Feb Mar Apr May Jun Jul Aug Sep Oct Nov Dec
2000 87 58.5 70.4 10.8 26.5 99.6 287.6 288.5 130.9 29.6 2 50.22001 0.5 8.8 100.1 95.6 45.5 242.9 251.9 161.1 28.9 10.1 36.1 3.52002 63.1 90.1 76.1 39.4 29.9 83.1 166.3 301.4 127.2 28.9 1 12003 30.9 282.0 198.6 119.2 90.3 121.4 285.5 158.9 105.5 22.5 30.2 86.42004 108.3 45.9 13.4 133.4 65.4 89.6 209.7 221.5 71.7 124.1 40.5 47.22005 117.0 196.1 186.5 64.7 68.4 45.3 198.1 146.3 41.4 79.3 21.5 0.02006 125.5 78.5 61.5 74.7 61.7 68.1 329.7 191.5 62.0 37.0 84.6 121.62007 2.1 85.8 179.2 41.1 65.6 135.1 294.6 180.4 155.2 0.0 19.3 35.72008 200.0 67.8 20.3 131.0 45.1 248.7 269.1 161.6 39.5 36.1 77.0 111.5
Total 734.4 913.5 906.1 709.9 498.4 1133.8 2292.5 1811.2 762.3 367.6 312.2 457.1Average 81.6 101.5 100.7 78.9 55.4 126.0 254.7 201.2 84.7 40.8 34.7 50.8
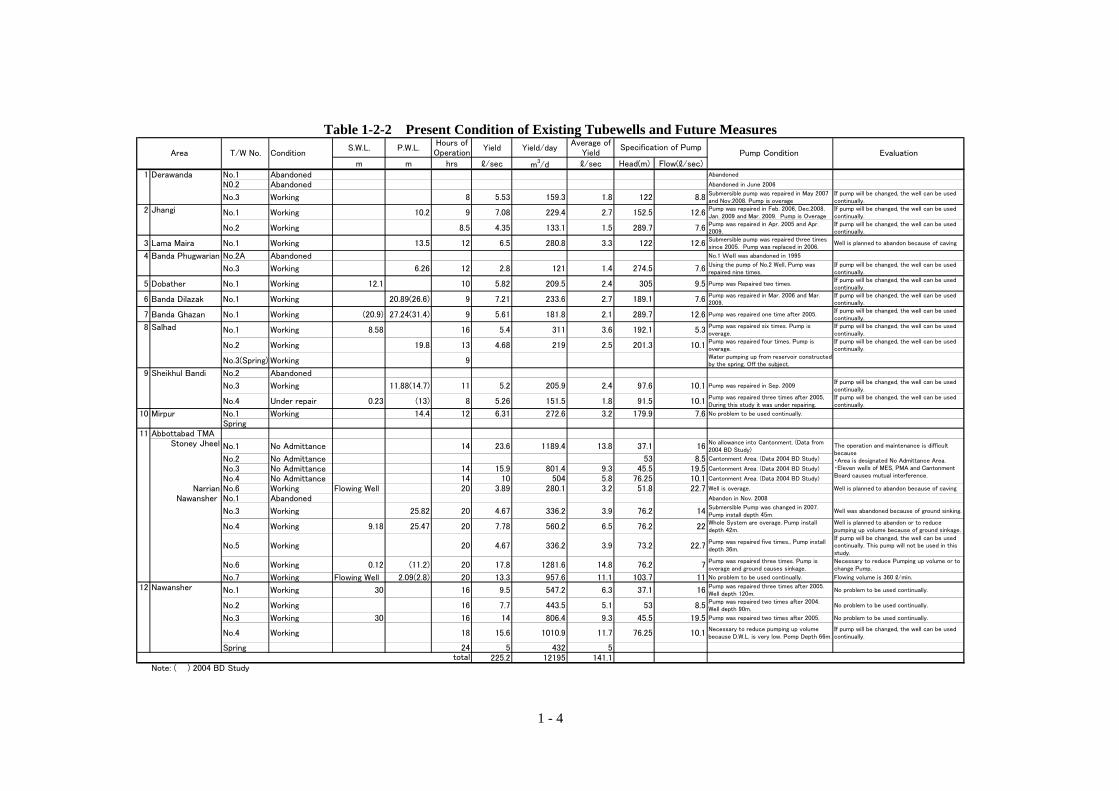
2) Existing tubewells The hydrogeological study in 2009 undertook to examine the current status of existing tubewells of 31 in number, which were on duty as public water sources in 2004 BD Study. This study employed the same indicators as 2004 BD Study did, as follows: a. Running status of facilities b. Duration of daily operation c. Pumping rate d. Water levels (static and dynamic levels) e. Pump conditions f. Evaluation of facilities This study found that 5 tubewells among 31 in 2004 BD Study had been abandoned during the past 5 years due to the decrease of discharges caused by "caving" (collapse of boreholes) or other reasons, reducing the total number of running wells to 27. The comparison shows that average yield was estimated at 160 lit/sec in 2004 BD Study, it has now been diminished to 141.1 lit/sec, due to the decrease of the total number of running tubewells as well as their discharges. 3) Tubewells Requiring Pump Replacement A greater part of the existing tubewells was constructed in the latter part of 1990s, with pumping equipment installed at that time. These existing pumps have since been running for more than 10 years. A major part of pumps are of submersible motor pump type, while the service area of Abbottabad Nawansher mainly employs the type of vertical-shaft turbine pump of outdated design. The 2004 BD Study recommended the replacement of the pumps at 12 tubewells. This study in 2009 found that one of those tubewells had been abandoned, including its pump and that another one had already been equipped with a new pump. The study also knew that frequent overhauls and repairs had been undertaken for the remaining pumping equipment (pumps/motors) of 10 in number plus additional 3 during the past 5 years (after 2005). Repairs of motors needed wire recoiling work, resulting in a long suspension of service while repair
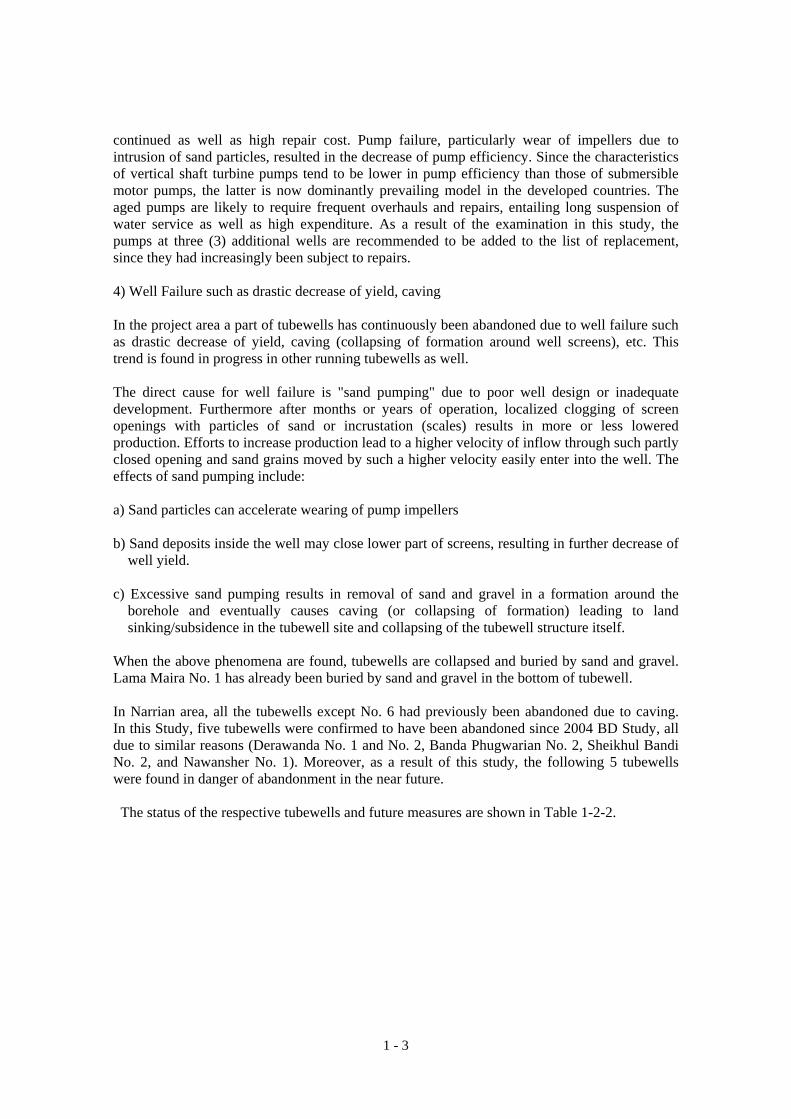
1 - 3
continued as well as high repair cost. Pump failure, particularly wear of impellers due to intrusion of sand particles, resulted in the decrease of pump efficiency. Since the characteristics of vertical shaft turbine pumps tend to be lower in pump efficiency than those of submersible motor pumps, the latter is now dominantly prevailing model in the developed countries. The aged pumps are likely to require frequent overhauls and repairs, entailing long suspension of water service as well as high expenditure. As a result of the examination in this study, the pumps at three (3) additional wells are recommended to be added to the list of replacement, since they had increasingly been subject to repairs. 4) Well Failure such as drastic decrease of yield, caving In the project area a part of tubewells has continuously been abandoned due to well failure such as drastic decrease of yield, caving (collapsing of formation around well screens), etc. This trend is found in progress in other running tubewells as well. The direct cause for well failure is "sand pumping" due to poor well design or inadequate development. Furthermore after months or years of operation, localized clogging of screen openings with particles of sand or incrustation (scales) results in more or less lowered production. Efforts to increase production lead to a higher velocity of inflow through such partly closed opening and sand grains moved by such a higher velocity easily enter into the well. The effects of sand pumping include: a) Sand particles can accelerate wearing of pump impellers b) Sand deposits inside the well may close lower part of screens, resulting in further decrease of
well yield. c) Excessive sand pumping results in removal of sand and gravel in a formation around the
borehole and eventually causes caving (or collapsing of formation) leading to land sinking/subsidence in the tubewell site and collapsing of the tubewell structure itself.
When the above phenomena are found, tubewells are collapsed and buried by sand and gravel. Lama Maira No. 1 has already been buried by sand and gravel in the bottom of tubewell. In Narrian area, all the tubewells except No. 6 had previously been abandoned due to caving. In this Study, five tubewells were confirmed to have been abandoned since 2004 BD Study, all due to similar reasons (Derawanda No. 1 and No. 2, Banda Phugwarian No. 2, Sheikhul Bandi No. 2, and Nawansher No. 1). Moreover, as a result of this study, the following 5 tubewells were found in danger of abandonment in the near future. The status of the respective tubewells and future measures are shown in Table 1-2-2.
1 - 4
Table 1-2-2 Present Condition of Existing Tubewells and Future Measures S.W.L. P.W.L.
Hours ofOperation
Yield Yield/dayAverage of
Yieldm m hrs ℓ/sec m3/d ℓ/sec Head(m) Flow(ℓ/sec)
No.1 Abandoned Abandoned
N0.2 Abandoned Abandoned in June 2006
No.3 Working 8 5.53 159.3 1.8 122 8.8Submersible pump was repaired in May 2007and Nov.2008. Pump is overage
If pump will be changed, the well can be usedcontinually.
No.1 Working 10.2 9 7.08 229.4 2.7 152.5 12.6Pump was repaired in Feb. 2006, Dec.2008,Jan. 2009 and Mar. 2009. Pump is Overage
If pump will be changed, the well can be usedcontinually.
No.2 Working 8.5 4.35 133.1 1.5 289.7 7.6Pump was repaired in Apr. 2005 and Apr.2009.
If pump will be changed, the well can be usedcontinually.
3 Lama Maira No.1 Working 13.5 12 6.5 280.8 3.3 122 12.6Submersible pump was repaired three timessince 2005. Pump was replaced in 2006.
Well is planned to abandon because of caving
No.2A Abandoned No.1 Well was abandoned in 1995
No.3 Working 6.26 12 2.8 121 1.4 274.5 7.6Using the pump of No.2 Well, Pump wasrepaired nine times.
If pump will be changed, the well can be usedcontinually.
5 Dobather No.1 Working 12.1 10 5.82 209.5 2.4 305 9.5 Pump was Repaired two times.If pump will be changed, the well can be usedcontinually.
6 Banda Dilazak No.1 Working 20.89(26.6) 9 7.21 233.6 2.7 189.1 7.6Pump was repaired in Mar. 2006 and Mar.2009.
If pump will be changed, the well can be usedcontinually.
7 Banda Ghazan No.1 Working (20.9) 27.24(31.4) 9 5.61 181.8 2.1 289.7 12.6 Pump was repaired one time after 2005.If pump will be changed, the well can be usedcontinually.
No.1 Working 8.58 16 5.4 311 3.6 192.1 5.3Pump was repaired six times. Pump isoverage.
If pump will be changed, the well can be usedcontinually.
No.2 Working 19.8 13 4.68 219 2.5 201.3 10.1Pump was repaired four times. Pump isoverage.
If pump will be changed, the well can be usedcontinually.
No.3(Spring) Working 9Water pumping up from reservoir constructedby the spring. Off the subject.
No.2 Abandoned
No.3 Working 11.88(14.7) 11 5.2 205.9 2.4 97.6 10.1 Pump was repaired in Sep. 2009If pump will be changed, the well can be usedcontinually.
No.4 Under repair 0.23 (13) 8 5.26 151.5 1.8 91.5 10.1Pump was repaired three times after 2005,During this study it was under repairing.
If pump will be changed, the well can be usedcontinually.
No.1 Working 14.4 12 6.31 272.6 3.2 179.9 7.6 No problem to be used continually.
SpringAbbottabad TMA
No.1 No Admittance 14 23.6 1189.4 13.8 37.1 16No allowance into Cantonment. (Data from2004 BD Study)
No.2 No Admittance 53 8.5 Cantonment Area. (Data 2004 BD Study)
No.3 No Admittance 14 15.9 801.4 9.3 45.5 19.5 Cantonment Area. (Data 2004 BD Study)
No.4 No Admittance 14 10 504 5.8 76.25 10.1 Cantonment Area. (Data 2004 BD Study)
Narrian No.6 Working Flowing Well 20 3.89 280.1 3.2 51.8 22.7 Well is overage. Well is planned to abandon because of caving
No.1 Abandoned Abandon in Nov. 2008
No.3 Working 25.82 20 4.67 336.2 3.9 76.2 14Submersible Pump was changed in 2007.Pump install depth 45m.
Well was abandoned because of ground sinking.
No.4 Working 9.18 25.47 20 7.78 560.2 6.5 76.2 22Whole System are overage. Pump installdepth 42m.
Well is planned to abandon or to reducepumping up volume because of ground sinkage.
No.5 Working 20 4.67 336.2 3.9 73.2 22.7Pump was repaired five times., Pump installdepth 36m.
If pump will be changed, the well can be usedcontinually. This pump will not be used in thisstudy.
No.6 Working 0.12 (11.2) 20 17.8 1281.6 14.8 76.2 7Pump was repaired three times. Pump isoverage and ground causes sinkage.
Necessary to reduce Pumping up volume or tochange Pump.
No.7 Working Flowing Well 2.09(2.8) 20 13.3 957.6 11.1 103.7 11 No problem to be used continually. Flowing volume is 360 ℓ/min.
No.1 Working 30 16 9.5 547.2 6.3 37.1 16Pump was repaired three times after 2005.Well depth 120m.
No problem to be used continually.
No.2 Working 16 7.7 443.5 5.1 53 8.5Pump was repaired two times after 2004.Well depth 90m.
No problem to be used continually.
No.3 Working 30 16 14 806.4 9.3 45.5 19.5 Pump was repaired two times after 2005. No problem to be used continually.
No.4 Working 18 15.6 1010.9 11.7 76.25 10.1Necessary to reduce pumping up volumebecause D.W.L. is very low. Pomp Depth 66m.
If pump will be changed, the well can be usedcontinually.
Spring 24 5 432 5225.2 12195 141.1
Note: ( ) 2004 BD Study
11Stoney Jheel
Nawansher
12 Nawansher
8 Salhad
9
10
Sheikhul Bandi
Mirpur
Derawanda
2 Jhangi
4 Banda Phugwarian
total
The operation and maintenance is difficultbecause・Area is designated No Admittance Area.・Eleven wells of MES, PMA and CantonmentBoard causes mutual interference.
EvaluationArea T/W No. Condition Pump Condition Specification of Pump
1
1 - 5
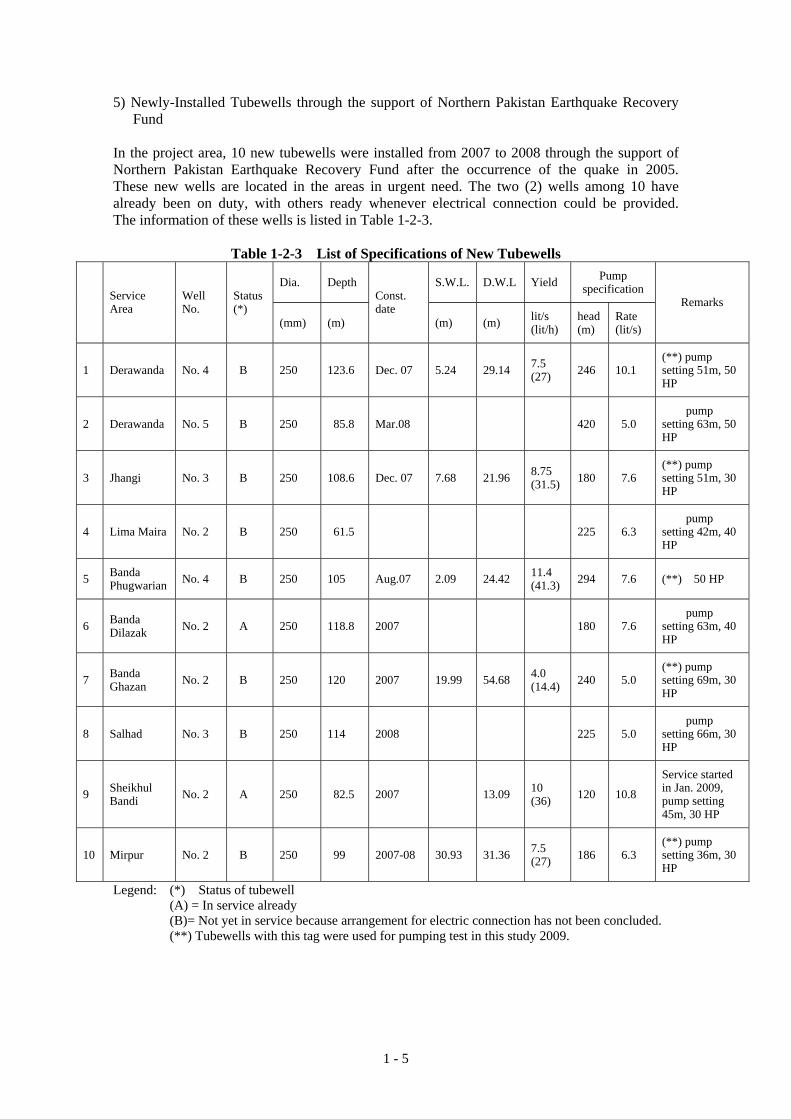
5) Newly-Installed Tubewells through the support of Northern Pakistan Earthquake Recovery Fund
In the project area, 10 new tubewells were installed from 2007 to 2008 through the support of Northern Pakistan Earthquake Recovery Fund after the occurrence of the quake in 2005. These new wells are located in the areas in urgent need. The two (2) wells among 10 have already been on duty, with others ready whenever electrical connection could be provided. The information of these wells is listed in Table 1-2-3.
Table 1-2-3 List of Specifications of New Tubewells
Dia. Depth S.W.L. D.W.L Yield Pump specification
Service Area
Well No.
Status (*)
(mm) (m)
Const. date
(m) (m) lit/s (lit/h)
head (m)
Rate (lit/s)
Remarks
1 Derawanda No. 4 B 250 123.6 Dec. 07 5.24 29.14 7.5 (27) 246 10.1
(**) pump setting 51m, 50 HP
2 Derawanda No. 5 B 250 85.8 Mar.08 420 5.0 pump setting 63m, 50 HP
3 Jhangi No. 3 B 250 108.6 Dec. 07 7.68 21.96 8.75 (31.5) 180 7.6
(**) pump setting 51m, 30 HP
4 Lima Maira No. 2 B 250 61.5 225 6.3 pump setting 42m, 40 HP
5 Banda Phugwarian No. 4 B 250 105 Aug.07 2.09 24.42 11.4
(41.3) 294 7.6 (**) 50 HP
6 Banda Dilazak No. 2 A 250 118.8 2007 180 7.6
pump setting 63m, 40 HP
7 Banda Ghazan No. 2 B 250 120 2007 19.99 54.68 4.0
(14.4) 240 5.0 (**) pump setting 69m, 30 HP
8 Salhad No. 3 B 250 114 2008 225 5.0 pump setting 66m, 30 HP
9 Sheikhul Bandi No. 2 A 250 82.5 2007 13.09 10
(36) 120 10.8
Service started in Jan. 2009, pump setting 45m, 30 HP
10 Mirpur No. 2 B 250 99 2007-08 30.93 31.36 7.5 (27) 186 6.3
(**) pump setting 36m, 30 HP
Legend: (*) Status of tubewell (A) = In service already (B)= Not yet in service because arrangement for electric connection has not been concluded. (**) Tubewells with this tag were used for pumping test in this study 2009.
1 - 6
6) Groundwater (1) Geology Based upon this analysis through the existing well data, the regional geology features three-layer structure as follows:
a) 1st Layer The 1st layer is predominantly clay and silt, partly with interbeds of gravel. While it is 30 to 40 m thick in the west side terrace, it increase the thickness in the central area of the plain to 70 to 80 m near Nawansher, where gravel interbeds in the west side is almost replaced by clay and silt.
b) 2nd Layer The 2nd layer mainly consists of gravel. In the west side terrace, this feature is typically shown in its northern part such as Banda Dilazak and Dobathar, while it occurs as interbeds of gravel and clay in places such as Jhangi and Derawanda. In the plain, gravel becomes conspicuous with its thickness increasing from 30 to 40 m in Sheikhul Bandi and Nawansher. In Banda Phugwarian, it gets thicker than 50 m. In Mirpur, the northern area of the project site, this layer is 30 m thick, according to the well log at No. 2 tubewell (T/W2). c) 3rd Layer This is the underlying bedrock in the project site, represented by shale in the west side terrace and dolomite and limestone in the east side lowland around Sheikhul Bandi
Aquifers in the project area are identified as the first and the second layers - sand and sand/gravel - classified in the previous section. In the west side terrace the main aquifer is interbeds of sand/gravel alternately occurring with interbeds of clay, while in the plain area gravel overlying the bedrock develops a horizontally extending broad aquifer. The water bearing capacity of this layer as an aquifer is much better in the plain area than in the west side terrace, where limited distribution of gravel is likely to result in limited groundwater occurrence. (2) Groundwater range and its intake Encircled with mountainous areas, Abbottabad basin receives groundwater flow mainly from the following sources: a) groundwater flow in the terrace rising in the west mountains b) springs occurring in Mirpur in the north c) springs occurring in Kakul in the east d) groundwater flow occurring in limestone in the south Groundwater moves into the central area of the plain with its levels varying from 1,190 to 1,210 m m.s.l, Springs in the east reportedly used to decrease the yield during the droughts, and groundwater from this source is likely to be subject to seasonal fluctuation. Part of the plain from Karakurram Highway, where the west side terrace falls into the plain, to the Cantonments in the east and south, forms an artesian flowing zone. They occur in the 2nd layer overlain by thick beds of clay and silt. In the existing tubewells at of the project area, groundwater are took fromures three-layer profile, in which the first and second layers are aquifers of sand and sand/gravel where groundwater mainly occurs. While these aquifers in the west terrace of the area consist of
1 - 7
alternately interbedded clay and sand/gravel, the second layer in the plain has the character of basal gravel horizontally extended across the area. The condition of aquifers is more favorable in the latter than in the former, where the aquifer is limited and discontinuous with smaller yield. The tubewells in the western terrace of the study area tap both the first and second aquifers of sand and gravel. However, these aquifers tend to be thin-bedded with an average yield from the existing tubewells limited to 1 to 3 lit/sec. On the other hand, in the plain area of the site including Cantonment, Sheikul Bandi and Nawansher), most of the tubewells depend upon the second aquifer only, because the first layer consists of interbeds of clay and silt. However, this aquifer can generally provide larger yield than that in the terrace, ranging from 3 to 6 lit/sec on average, and reaching 10 lit/sec in a part of the area. 7) Groundwater Potential (1) The volume of drainage of groundwater Groundwater is constantly moving through aquifers under the local hydraulic gradient. The volume of such drainage of groundwater from aquifers may be roughly estimated through the analysis of the regional groundwater level contour map, employing Darcy's formula as follows: Q= K x A x i in which Q= Volume , K= hydraulic conductivity, A=Aquifer section (aquifer width x thickness) and i = hydraulic gradient To estimate a range of drainage in the plain, the following data are employed in this equation, as follows: K= values obtained from the pumping test carried out under this study Thickness of aquifers decided, based on the drilling data of existing tubewells Width of aquifers (extent of aquifer distribution) decided through analysis of groundwater level contour map, and i decided through analysis of groundwater level contour map Drainage into the plain occurs from all the four directions; a) from the west side terrace, b) from the north of the plain, c) from the spring area of the south and d) from the east. The flow from the east depends upon spring sources, although it is not clearly shown in the water level map. The calculation results are summarized as follows.
Estimated drainage from west terrace: 1,775 m3/d (647,875 m3/y) Estimated drainage from North of plain: 2,310 m3/d (843,150 m3/y) Estimated drainage from south springs 2,957 m3/d (1,079,232 m3/y) Estimated drainage from east springs: 2,970 m3/d (1,084,050 m3/y) Total: 10,012 m3/d (3,654,307 m3/y)
As a result of this estimate, a daily volume of drainage in the project area is about 10,000 m3/d (yearly about 3,700,000 m3). (2) Criteria for Groundwater Development in the Project Area In the project area groundwater including springs has so far been the sole water source, which is recharged by precipitation. If an overall discharge of groundwater throughout the area is within the range of recharge, it could be one of criteria for ensuring sustainable groundwater development. For this purpose, the previous studies, 2004 BD Study and the preliminary study in 2008 made efforts to estimate its range. This study proposes to reduce a natural drainage rate from aquifers estimated in the previous section from the recharge rate as a parameter for setting
1 - 8
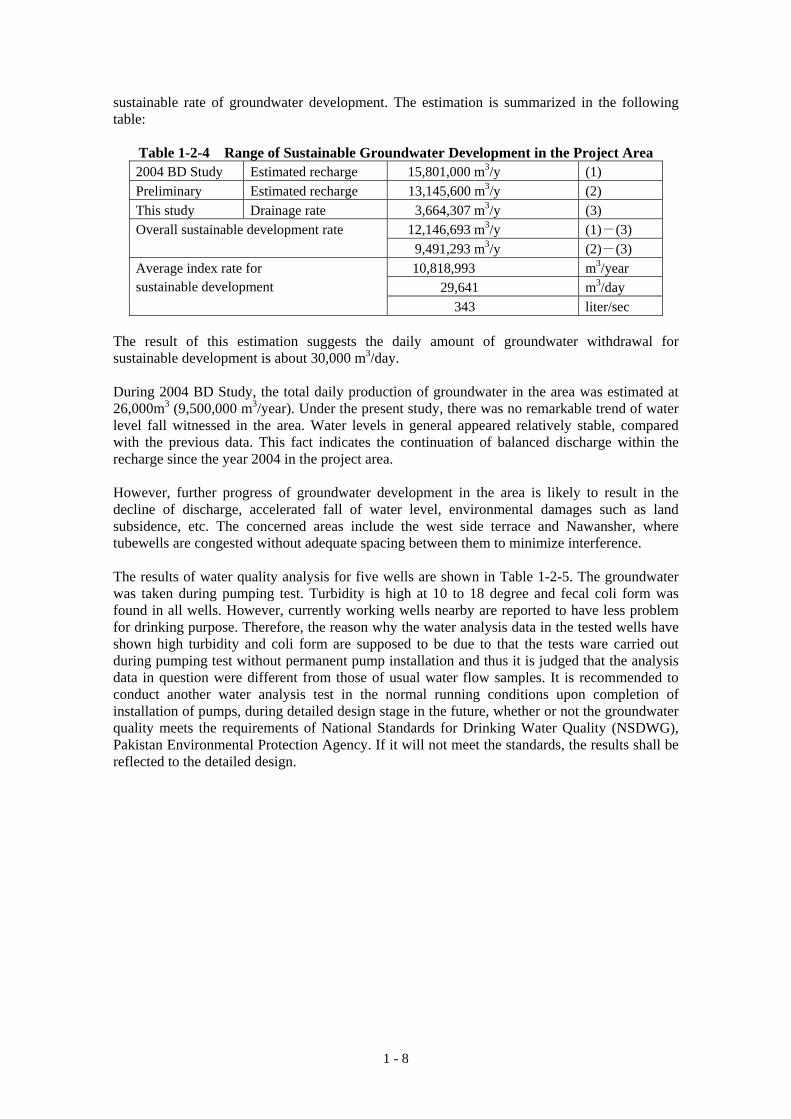
sustainable rate of groundwater development. The estimation is summarized in the following table:
Table 1-2-4 Range of Sustainable Groundwater Development in the Project Area 2004 BD Study Estimated recharge 15,801,000 m3/y (1) Preliminary Estimated recharge 13,145,600 m3/y (2) This study Drainage rate 3,664,307 m3/y (3)
12,146,693 m3/y (1)-(3) Overall sustainable development rate 9,491,293 m3/y (2)-(3)
10,818,993 m3/year 29,641 m3/day
Average index rate for sustainable development
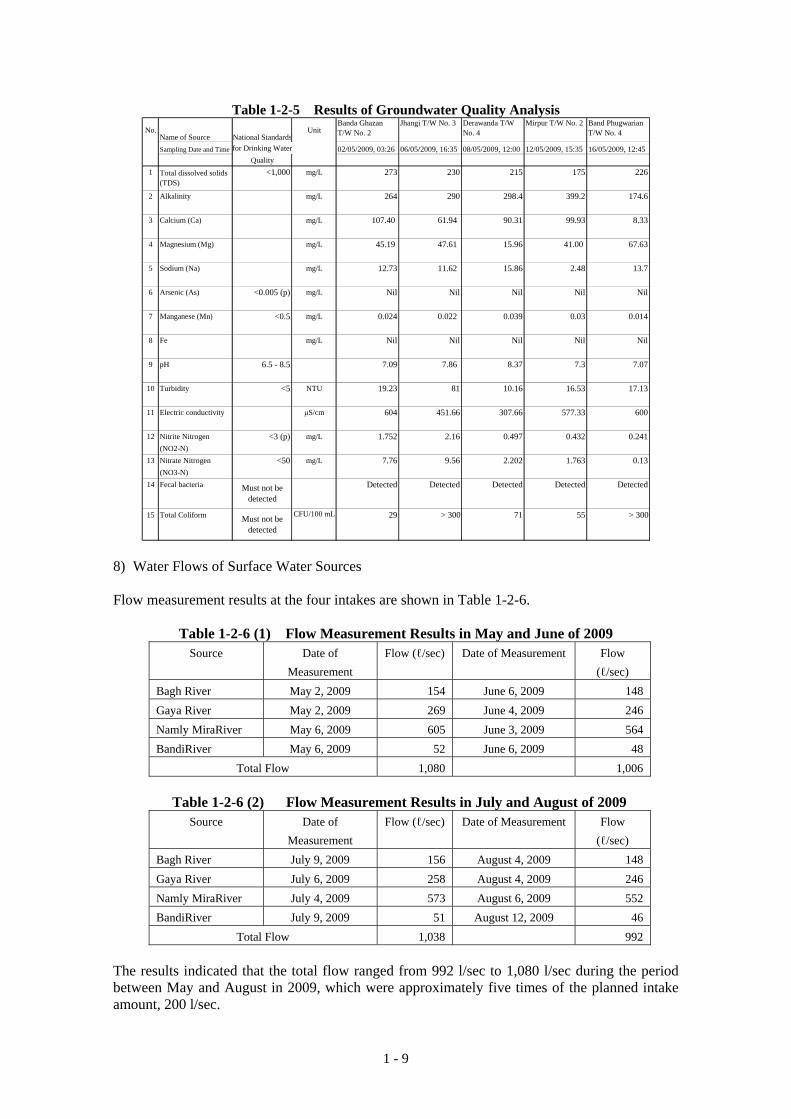
343 liter/sec The result of this estimation suggests the daily amount of groundwater withdrawal for sustainable development is about 30,000 m3/day. During 2004 BD Study, the total daily production of groundwater in the area was estimated at 26,000m3 (9,500,000 m3/year). Under the present study, there was no remarkable trend of water level fall witnessed in the area. Water levels in general appeared relatively stable, compared with the previous data. This fact indicates the continuation of balanced discharge within the recharge since the year 2004 in the project area. However, further progress of groundwater development in the area is likely to result in the decline of discharge, accelerated fall of water level, environmental damages such as land subsidence, etc. The concerned areas include the west side terrace and Nawansher, where tubewells are congested without adequate spacing between them to minimize interference. The results of water quality analysis for five wells are shown in Table 1-2-5. The groundwater was taken during pumping test. Turbidity is high at 10 to 18 degree and fecal coli form was found in all wells. However, currently working wells nearby are reported to have less problem for drinking purpose. Therefore, the reason why the water analysis data in the tested wells have shown high turbidity and coli form are supposed to be due to that the tests ware carried out during pumping test without permanent pump installation and thus it is judged that the analysis data in question were different from those of usual water flow samples. It is recommended to conduct another water analysis test in the normal running conditions upon completion of installation of pumps, during detailed design stage in the future, whether or not the groundwater quality meets the requirements of National Standards for Drinking Water Quality (NSDWG), Pakistan Environmental Protection Agency. If it will not meet the standards, the results shall be reflected to the detailed design.
1 - 9
Table 1-2-5 Results of Groundwater Quality Analysis No.
Name of Source National StandardsUnit
Banda GhazanT/W No. 2
Jhangi T/W No. 3 Derawanda T/WNo. 4
Mirpur T/W No. 2 Band PhugwarianT/W No. 4
Sampling Date and Time for Drinking Water 02/05/2009, 03:26 06/05/2009, 16:35 08/05/2009, 12:00 12/05/2009, 15:35 16/05/2009, 12:45Quality
1 <1,000 mg/L 273 230 215 175 226
2 Alkalinity mg/L 264 290 298.4 399.2 174.6
3 Calcium (Ca) mg/L 107.40 61.94 90.31 99.93 8.33
4 Magnesium (Mg) mg/L 45.19 47.61 15.96 41.00 67.63
5 Sodium (Na) mg/L 12.73 11.62 15.86 2.48 13.7
6 Arsenic (As) <0.005 (p) mg/L Nil Nil Nil Nil Nil
7 Manganese (Mn) <0.5 mg/L 0.024 0.022 0.039 0.03 0.014
8 Fe mg/L Nil Nil Nil Nil Nil
9 pH 6.5 - 8.5 7.09 7.86 8.37 7.3 7.07
10 Turbidity <5 NTU 19.23 81 10.16 16.53 17.13
11 Electric conductivity μS/cm 604 451.66 307.66 577.33 600
12 Nitrite Nitrogen <3 (p) mg/L 1.752 2.16 0.497 0.432 0.241(NO2-N)
13 Nitrate Nitrogen <50 mg/L 7.76 9.56 2.202 1.763 0.13(NO3-N)
14 Fecal bacteria Detected Detected Detected Detected Detected
15 Total Coliform 29 > 300 71 55 > 300
Total dissolved solids(TDS)
CFU/100 mL
Must not bedetected
Must not bedetected
8) Water Flows of Surface Water Sources Flow measurement results at the four intakes are shown in Table 1-2-6.
Table 1-2-6 (1) Flow Measurement Results in May and June of 2009 Source Date of
Measurement Flow (ℓ/sec) Date of Measurement Flow
(ℓ/sec) Bagh River May 2, 2009 154 June 6, 2009 148 Gaya River May 2, 2009 269 June 4, 2009 246 Namly MiraRiver May 6, 2009 605 June 3, 2009 564 BandiRiver May 6, 2009 52 June 6, 2009 48
Total Flow 1,080 1,006
Table 1-2-6 (2) Flow Measurement Results in July and August of 2009 Source Date of
Measurement Flow (ℓ/sec) Date of Measurement Flow
(ℓ/sec) Bagh River July 9, 2009 156 August 4, 2009 148 Gaya River July 6, 2009 258 August 4, 2009 246 Namly MiraRiver July 4, 2009 573 August 6, 2009 552 BandiRiver July 9, 2009 51 August 12, 2009 46
Total Flow 1,038 992 The results indicated that the total flow ranged from 992 l/sec to 1,080 l/sec during the period between May and August in 2009, which were approximately five times of the planned intake amount, 200 l/sec.
1 - 10
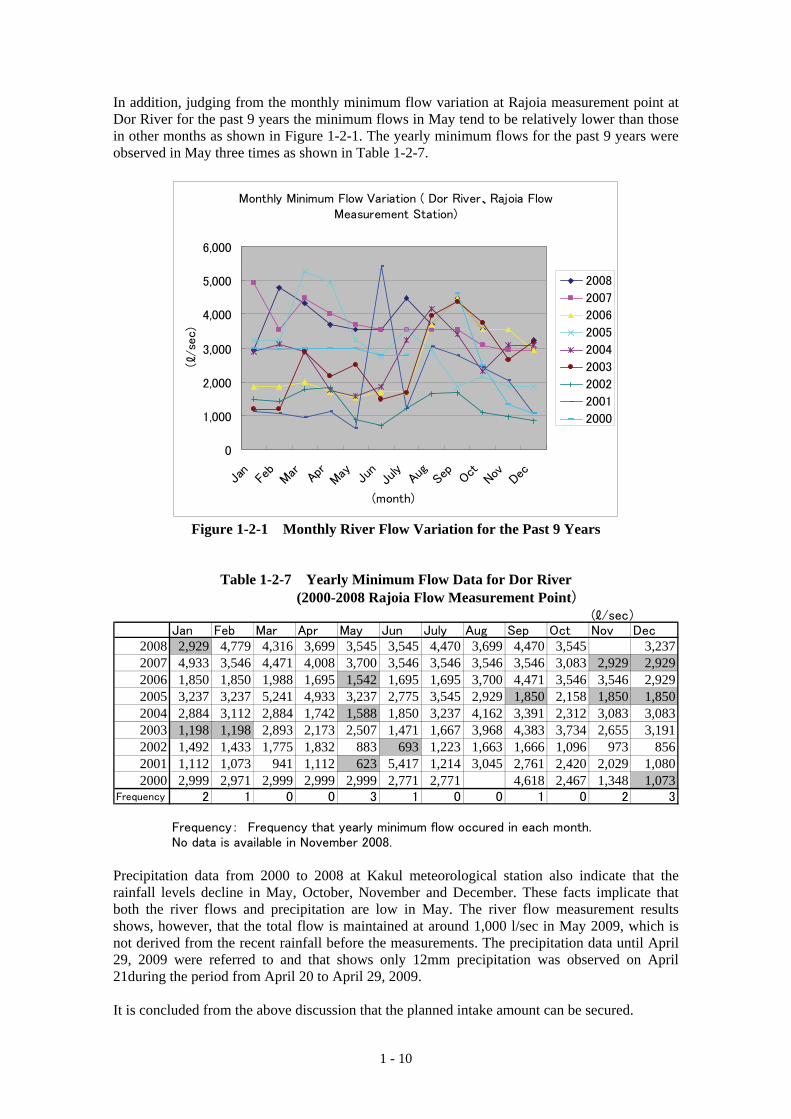
In addition, judging from the monthly minimum flow variation at Rajoia measurement point at Dor River for the past 9 years the minimum flows in May tend to be relatively lower than those in other months as shown in Figure 1-2-1. The yearly minimum flows for the past 9 years were observed in May three times as shown in Table 1-2-7.
Monthly Minimum Flow Variation ( Dor River、Rajoia FlowMeasurement Station)
0
1,000
2,000
3,000
4,000
5,000
6,000
Jan
Feb
Mar Ap
rMay Ju
nJu
lyAu
gSe
pOct
Nov
Dec
(month)
(ℓ/s
ec)
2008
2007
2006
2005
2004
2003
2002
2001
2000
Figure 1-2-1 Monthly River Flow Variation for the Past 9 Years
Table 1-2-7 Yearly Minimum Flow Data for Dor River (2000-2008 Rajoia Flow Measurement Point)
(ℓ/sec)Jan Feb Mar Apr May Jun July Aug Sep Oct Nov Dec
2008 2,929 4,779 4,316 3,699 3,545 3,545 4,470 3,699 4,470 3,545 3,2372007 4,933 3,546 4,471 4,008 3,700 3,546 3,546 3,546 3,546 3,083 2,929 2,9292006 1,850 1,850 1,988 1,695 1,542 1,695 1,695 3,700 4,471 3,546 3,546 2,9292005 3,237 3,237 5,241 4,933 3,237 2,775 3,545 2,929 1,850 2,158 1,850 1,8502004 2,884 3,112 2,884 1,742 1,588 1,850 3,237 4,162 3,391 2,312 3,083 3,0832003 1,198 1,198 2,893 2,173 2,507 1,471 1,667 3,968 4,383 3,734 2,655 3,1912002 1,492 1,433 1,775 1,832 883 693 1,223 1,663 1,666 1,096 973 8562001 1,112 1,073 941 1,112 623 5,417 1,214 3,045 2,761 2,420 2,029 1,0802000 2,999 2,971 2,999 2,999 2,999 2,771 2,771 4,618 2,467 1,348 1,073
Frequency 2 1 0 0 3 1 0 0 1 0 2 3
Frequency: Frequency that yearly minimum flow occured in each month. No data is available in November 2008.
Precipitation data from 2000 to 2008 at Kakul meteorological station also indicate that the rainfall levels decline in May, October, November and December. These facts implicate that both the river flows and precipitation are low in May. The river flow measurement results shows, however, that the total flow is maintained at around 1,000 l/sec in May 2009, which is not derived from the recent rainfall before the measurements. The precipitation data until April 29, 2009 were referred to and that shows only 12mm precipitation was observed on April 21during the period from April 20 to April 29, 2009.
It is concluded from the above discussion that the planned intake amount can be secured.
1 - 11
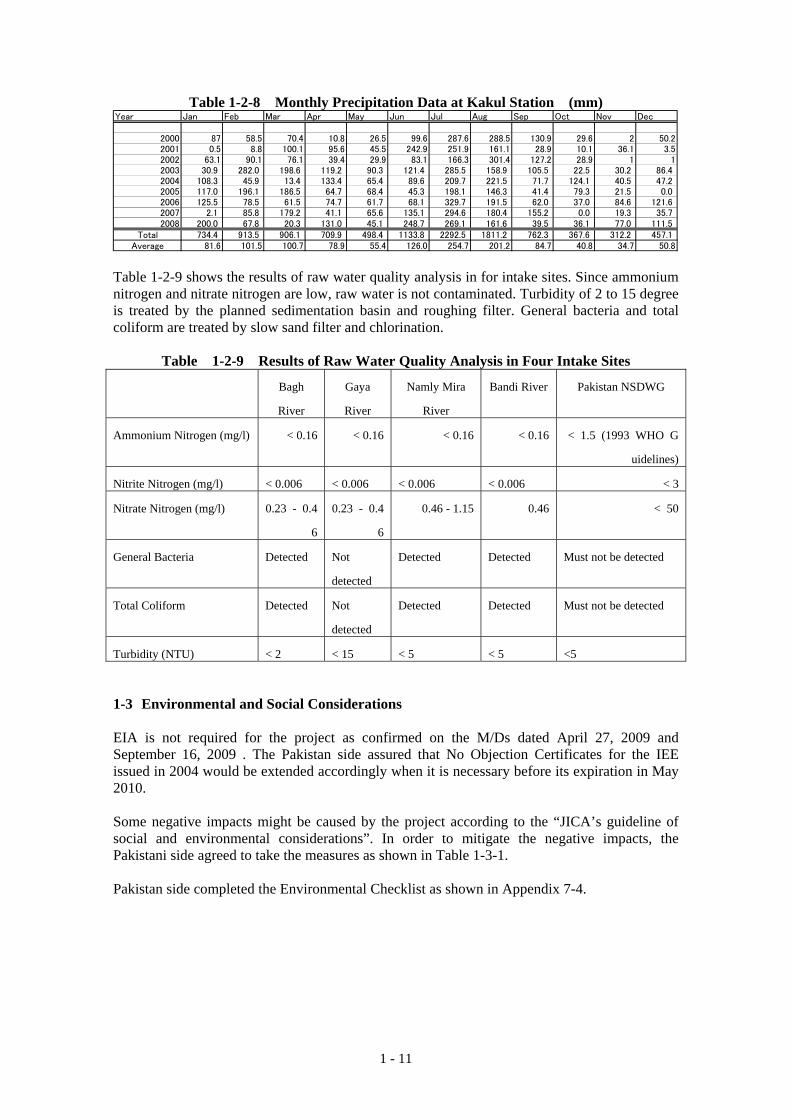
Table 1-2-8 Monthly Precipitation Data at Kakul Station (mm) Year Jan Feb Mar Apr May Jun Jul Aug Sep Oct Nov Dec
2000 87 58.5 70.4 10.8 26.5 99.6 287.6 288.5 130.9 29.6 2 50.22001 0.5 8.8 100.1 95.6 45.5 242.9 251.9 161.1 28.9 10.1 36.1 3.52002 63.1 90.1 76.1 39.4 29.9 83.1 166.3 301.4 127.2 28.9 1 12003 30.9 282.0 198.6 119.2 90.3 121.4 285.5 158.9 105.5 22.5 30.2 86.42004 108.3 45.9 13.4 133.4 65.4 89.6 209.7 221.5 71.7 124.1 40.5 47.22005 117.0 196.1 186.5 64.7 68.4 45.3 198.1 146.3 41.4 79.3 21.5 0.02006 125.5 78.5 61.5 74.7 61.7 68.1 329.7 191.5 62.0 37.0 84.6 121.62007 2.1 85.8 179.2 41.1 65.6 135.1 294.6 180.4 155.2 0.0 19.3 35.72008 200.0 67.8 20.3 131.0 45.1 248.7 269.1 161.6 39.5 36.1 77.0 111.5
Total 734.4 913.5 906.1 709.9 498.4 1133.8 2292.5 1811.2 762.3 367.6 312.2 457.1Average 81.6 101.5 100.7 78.9 55.4 126.0 254.7 201.2 84.7 40.8 34.7 50.8
Table 1-2-9 shows the results of raw water quality analysis in for intake sites. Since ammonium nitrogen and nitrate nitrogen are low, raw water is not contaminated. Turbidity of 2 to 15 degree is treated by the planned sedimentation basin and roughing filter. General bacteria and total coliform are treated by slow sand filter and chlorination.
Table 1-2-9 Results of Raw Water Quality Analysis in Four Intake Sites
Bagh
River
Gaya
River
Namly Mira
River
Bandi River Pakistan NSDWG
Ammonium Nitrogen (mg/l) < 0.16 < 0.16 < 0.16 < 0.16 < 1.5 (1993 WHO G
uidelines)
Nitrite Nitrogen (mg/l) < 0.006 < 0.006 < 0.006 < 0.006 < 3
Nitrate Nitrogen (mg/l) 0.23 - 0.4
6
0.23 - 0.4
6
0.46 - 1.15 0.46 < 50
General Bacteria Detected Not
detected
Detected Detected Must not be detected
Total Coliform Detected Not
detected
Detected Detected Must not be detected
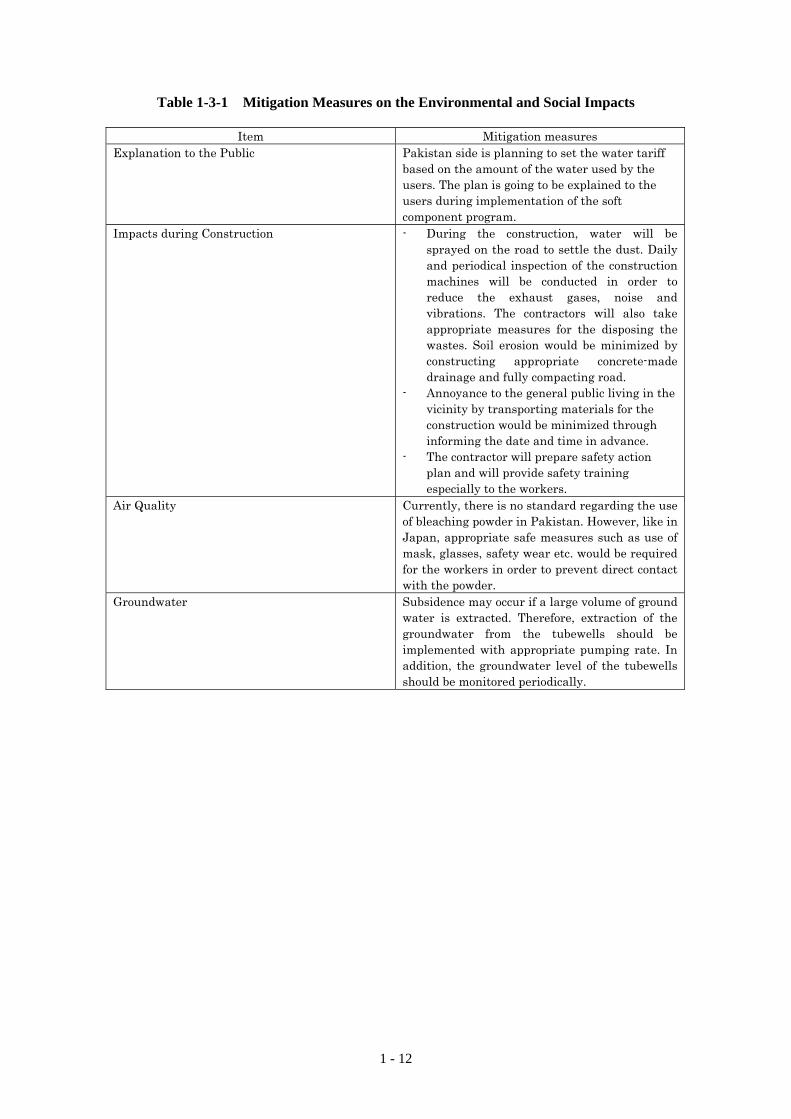
Turbidity (NTU) < 2 < 15 < 5 < 5 <5 1-3 Environmental and Social Considerations EIA is not required for the project as confirmed on the M/Ds dated April 27, 2009 and September 16, 2009 . The Pakistan side assured that No Objection Certificates for the IEE issued in 2004 would be extended accordingly when it is necessary before its expiration in May 2010. Some negative impacts might be caused by the project according to the “JICA’s guideline of social and environmental considerations”. In order to mitigate the negative impacts, the Pakistani side agreed to take the measures as shown in Table 1-3-1. Pakistan side completed the Environmental Checklist as shown in Appendix 7-4.
1 - 12
Table 1-3-1 Mitigation Measures on the Environmental and Social Impacts
Item Mitigation measures Explanation to the Public Pakistan side is planning to set the water tariff
based on the amount of the water used by the users. The plan is going to be explained to the users during implementation of the soft component program.
Impacts during Construction - During the construction, water will be sprayed on the road to settle the dust. Daily and periodical inspection of the construction machines will be conducted in order to reduce the exhaust gases, noise and vibrations. The contractors will also take appropriate measures for the disposing the wastes. Soil erosion would be minimized by constructing appropriate concrete-made drainage and fully compacting road.
- Annoyance to the general public living in the vicinity by transporting materials for the construction would be minimized through informing the date and time in advance.
- The contractor will prepare safety action plan and will provide safety training especially to the workers.
Air Quality Currently, there is no standard regarding the use of bleaching powder in Pakistan. However, like in Japan, appropriate safe measures such as use of mask, glasses, safety wear etc. would be required for the workers in order to prevent direct contact with the powder.
Groundwater Subsidence may occur if a large volume of ground water is extracted. Therefore, extraction of the groundwater from the tubewells should be implemented with appropriate pumping rate. In addition, the groundwater level of the tubewells should be monitored periodically.

Chapter 2 Contents of the Project
2 - 1
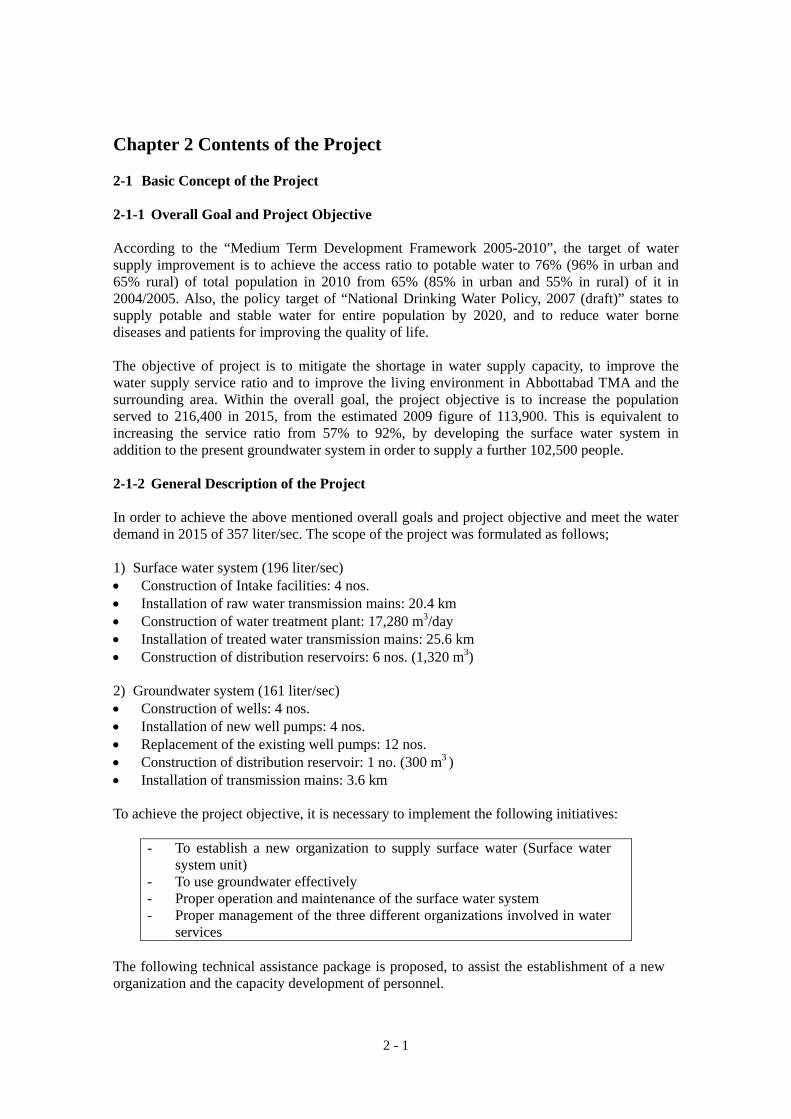
Chapter 2 Contents of the Project 2-1 Basic Concept of the Project 2-1-1 Overall Goal and Project Objective According to the “Medium Term Development Framework 2005-2010”, the target of water supply improvement is to achieve the access ratio to potable water to 76% (96% in urban and 65% rural) of total population in 2010 from 65% (85% in urban and 55% in rural) of it in 2004/2005. Also, the policy target of “National Drinking Water Policy, 2007 (draft)” states to supply potable and stable water for entire population by 2020, and to reduce water borne diseases and patients for improving the quality of life. The objective of project is to mitigate the shortage in water supply capacity, to improve the water supply service ratio and to improve the living environment in Abbottabad TMA and the surrounding area. Within the overall goal, the project objective is to increase the population served to 216,400 in 2015, from the estimated 2009 figure of 113,900. This is equivalent to increasing the service ratio from 57% to 92%, by developing the surface water system in addition to the present groundwater system in order to supply a further 102,500 people. 2-1-2 General Description of the Project In order to achieve the above mentioned overall goals and project objective and meet the water demand in 2015 of 357 liter/sec. The scope of the project was formulated as follows; 1) Surface water system (196 liter/sec) • Construction of Intake facilities: 4 nos. • Installation of raw water transmission mains: 20.4 km • Construction of water treatment plant: 17,280 m3/day • Installation of treated water transmission mains: 25.6 km • Construction of distribution reservoirs: 6 nos. (1,320 m3) 2) Groundwater system (161 liter/sec) • Construction of wells: 4 nos. • Installation of new well pumps: 4 nos. • Replacement of the existing well pumps: 12 nos. • Construction of distribution reservoir: 1 no. (300 m3 ) • Installation of transmission mains: 3.6 km To achieve the project objective, it is necessary to implement the following initiatives:
- To establish a new organization to supply surface water (Surface water system unit)
- To use groundwater effectively - Proper operation and maintenance of the surface water system - Proper management of the three different organizations involved in water
services The following technical assistance package is proposed, to assist the establishment of a new organization and the capacity development of personnel.

2 - 2
• Training for tubewell management and operation and maintenance of pumps • Capacity development for operation and maintenance of slow sand filtration systems • Assistance in establishing a surface water system unit • Improvement in water tariff collection systems
2 - 3
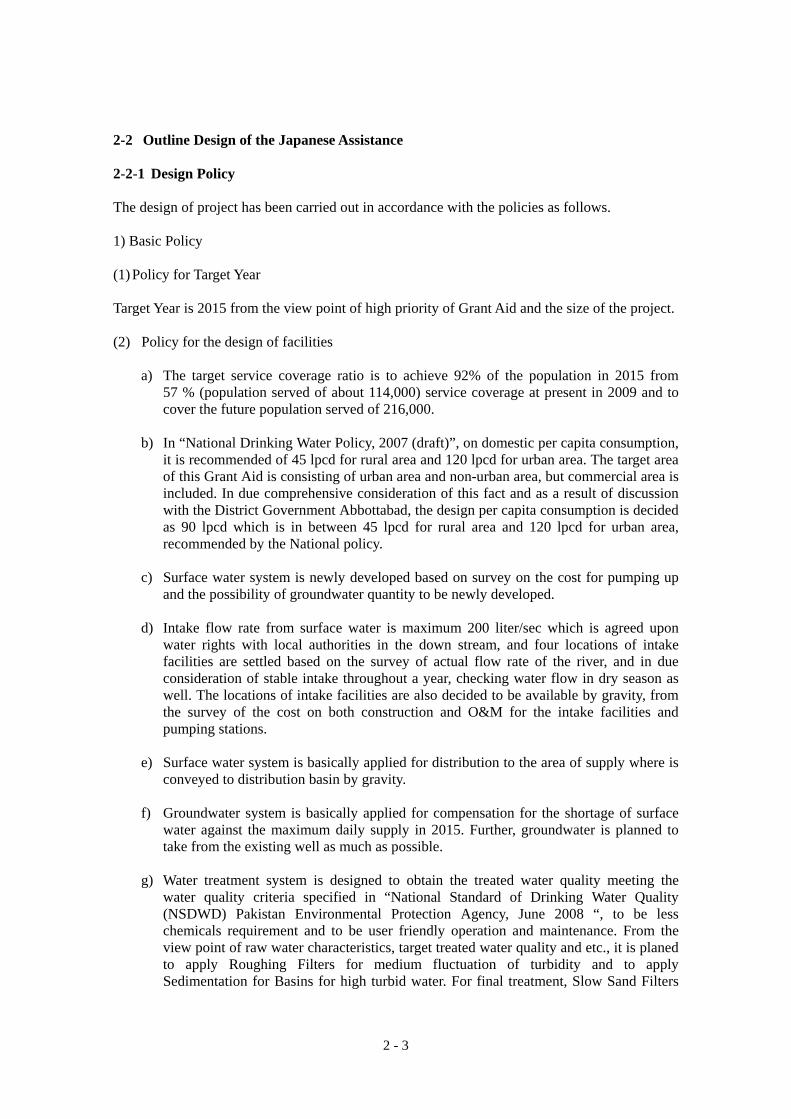
2-2 Outline Design of the Japanese Assistance 2-2-1 Design Policy
The design of project has been carried out in accordance with the policies as follows. 1) Basic Policy (1) Policy for Target Year Target Year is 2015 from the view point of high priority of Grant Aid and the size of the project.
(2) Policy for the design of facilities
a) The target service coverage ratio is to achieve 92% of the population in 2015 from 57 % (population served of about 114,000) service coverage at present in 2009 and to cover the future population served of 216,000.
b) In “National Drinking Water Policy, 2007 (draft)”, on domestic per capita consumption,
it is recommended of 45 lpcd for rural area and 120 lpcd for urban area. The target area of this Grant Aid is consisting of urban area and non-urban area, but commercial area is included. In due comprehensive consideration of this fact and as a result of discussion with the District Government Abbottabad, the design per capita consumption is decided as 90 lpcd which is in between 45 lpcd for rural area and 120 lpcd for urban area, recommended by the National policy.
c) Surface water system is newly developed based on survey on the cost for pumping up
and the possibility of groundwater quantity to be newly developed. d) Intake flow rate from surface water is maximum 200 liter/sec which is agreed upon
water rights with local authorities in the down stream, and four locations of intake facilities are settled based on the survey of actual flow rate of the river, and in due consideration of stable intake throughout a year, checking water flow in dry season as well. The locations of intake facilities are also decided to be available by gravity, from the survey of the cost on both construction and O&M for the intake facilities and pumping stations.
e) Surface water system is basically applied for distribution to the area of supply where is
conveyed to distribution basin by gravity. f) Groundwater system is basically applied for compensation for the shortage of surface
water against the maximum daily supply in 2015. Further, groundwater is planned to take from the existing well as much as possible.
g) Water treatment system is designed to obtain the treated water quality meeting the
water quality criteria specified in “National Standard of Drinking Water Quality (NSDWD) Pakistan Environmental Protection Agency, June 2008 “, to be less chemicals requirement and to be user friendly operation and maintenance. From the view point of raw water characteristics, target treated water quality and etc., it is planed to apply Roughing Filters for medium fluctuation of turbidity and to apply Sedimentation for Basins for high turbid water. For final treatment, Slow Sand Filters
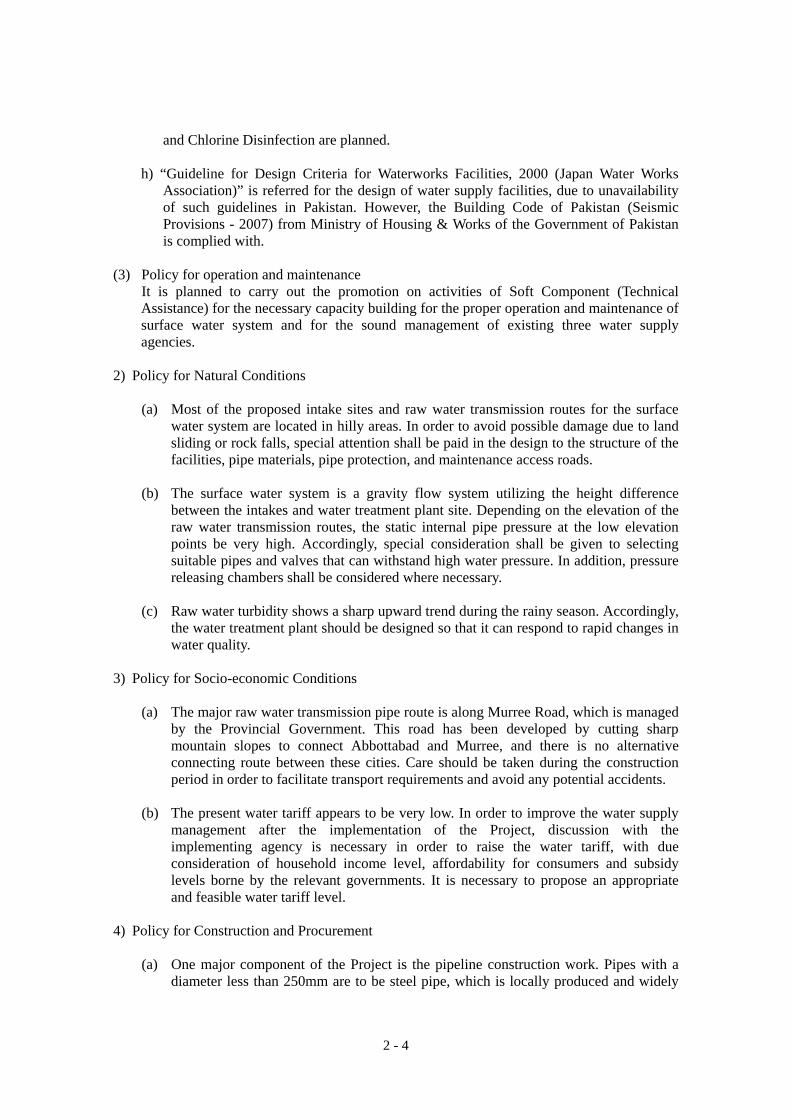
2 - 4
and Chlorine Disinfection are planned. h) “Guideline for Design Criteria for Waterworks Facilities, 2000 (Japan Water Works
Association)” is referred for the design of water supply facilities, due to unavailability of such guidelines in Pakistan. However, the Building Code of Pakistan (Seismic Provisions - 2007) from Ministry of Housing & Works of the Government of Pakistan is complied with.
(3) Policy for operation and maintenance
It is planned to carry out the promotion on activities of Soft Component (Technical Assistance) for the necessary capacity building for the proper operation and maintenance of surface water system and for the sound management of existing three water supply agencies.
2) Policy for Natural Conditions
(a) Most of the proposed intake sites and raw water transmission routes for the surface
water system are located in hilly areas. In order to avoid possible damage due to land sliding or rock falls, special attention shall be paid in the design to the structure of the facilities, pipe materials, pipe protection, and maintenance access roads.
(b) The surface water system is a gravity flow system utilizing the height difference
between the intakes and water treatment plant site. Depending on the elevation of the raw water transmission routes, the static internal pipe pressure at the low elevation points be very high. Accordingly, special consideration shall be given to selecting suitable pipes and valves that can withstand high water pressure. In addition, pressure releasing chambers shall be considered where necessary.
(c) Raw water turbidity shows a sharp upward trend during the rainy season. Accordingly,
the water treatment plant should be designed so that it can respond to rapid changes in water quality.
3) Policy for Socio-economic Conditions
(a) The major raw water transmission pipe route is along Murree Road, which is managed
by the Provincial Government. This road has been developed by cutting sharp mountain slopes to connect Abbottabad and Murree, and there is no alternative connecting route between these cities. Care should be taken during the construction period in order to facilitate transport requirements and avoid any potential accidents.
(b) The present water tariff appears to be very low. In order to improve the water supply
management after the implementation of the Project, discussion with the implementing agency is necessary in order to raise the water tariff, with due consideration of household income level, affordability for consumers and subsidy levels borne by the relevant governments. It is necessary to propose an appropriate and feasible water tariff level.
4) Policy for Construction and Procurement
(a) One major component of the Project is the pipeline construction work. Pipes with a
diameter less than 250mm are to be steel pipe, which is locally produced and widely
2 - 5
used in Pakistan. However, pipes with a diameter greater than 300mm are to be Ductile Cast Iron Pipe (DIP), due to its strength against external load, high pressure resistance and ease of installation. As DIP is not available locally, procurement from other countries is to be considered.
5) Policy for Utilizing Local Contractors
(a) There are contractors available in Abbottabad District and North West Frontier
Province with experience in tubewell construction in Abbottabad Basin, and those contractors will be utilized for the Project. Pumps for tubewells are also manufactured locally and will be utilized for the Project.
(b) Regarding the construction works for the water treatment plant, intakes, raw water and
treated water transmission mains and reservoirs, the utilization of major contractors in Pakistan should be considered in view of the magnitude of the works.
6) Policy for the Management Capacity of Implementation Agency
(a) It is necessary to set up a new organization to operate and manage the new surface
water gravity system. It is also necessary to clearly define the roles and responsibilities of the three agencies, namely Abbottabad TMA, Nawansher Service Unit and Abbottabad District (Works & Services Dept), in operating the new system. With regard to the establishment and effective commencement of the new institution, managerial guidance by the Japanese consultants should be considered in order to assist the process.
(b) The water treatment plant introduced in the Project will be the district’s first
experience in operation and maintenance of a water treatment plant. Technical guidance from the Japanese consultants should be also provided to ensure capacity building for operation and maintenance of the new system.
7) Policy for Facilities The major components of the facilities are intake facilities, raw water transmission facilities, water treatment plant, treated water transmission facilities and distribution reservoirs for the surface water system. For the groundwater system, the major components are tubewells, treated water transmission facilities and distribution reservoirs.
(a) Regarding raw water transmission mains installed along sharp slopes upstream of
Namly Maira River, Bagh River and Gaya River, various alternative pipe installations should be considered. This applies not only to underground pipes but to exposed installations, hanging installations etc, depending on the surrounding site conditions.
(b) The raw water transmission facilities are one of the most important facilities in the
surface water system. As the static water pressure in the pipeline becomes very high at the lower elevations of the pipeline route, it is necessary to consider these high pressures when selecting pipe materials and valves. Pressure releasing chambers should be constructed at the appropriate locations to achieve the maximum static pressure of 25kg/cm2.
(c) The treatment plant facilities are designed to achieve a finished water quality which
2 - 6
complies with the National Standards for Drinking Water Quality (NSDWG), Pakistan Environmental Protection Agency, June 2008. Adopting facilities with easier operation and maintenance should be considered, so that manual operation is preferred rather than automatic control.
(d) In order to avoid the excess abstraction and well caving issues observed in the existing
tubewells, it is necessary to set appropriate abstraction capacities for the wells to be constructed or rehabilitated in the Project. In addition, devices to ensure minimum monitoring and controlling of the operation of the wells should be provided.
8) Policy for Construction Method and Period
(a) Access to the upstream areas of the rivers is not easy, as only footpaths with sharp
slopes are available. In such sites tractors may be used to carry construction materials as far as possible, and then manpower used to transfer materials to the construction sites. Widening the existing footpaths may be necessary in such cases.
(b) The construction site for the water treatment plant is mostly covered with rock, and
excavation with giant breakers, backhoes and blasting will be required. The volume of rock excavation is significant, and sufficient time for this excavation work must be considered in the construction schedule.
(c) The magnitude of pipe laying work is significant. As the total construction period is
very limited, the pipe laying work should be done simultaneously by several teams dedicated exclusively to pipe laying. It is necessary to deploy sufficient contractors as well as local consultant staff to inspect the different sites.
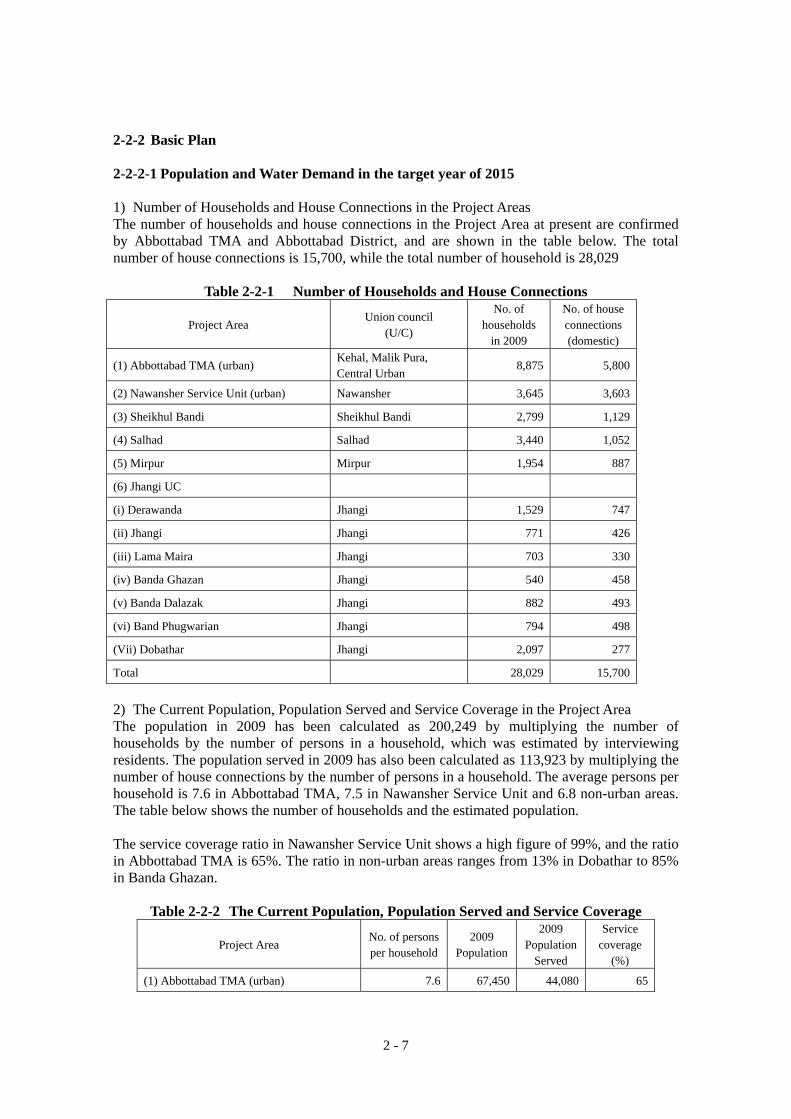
2 - 7
2-2-2 Basic Plan 2-2-2-1 Population and Water Demand in the target year of 2015 1) Number of Households and House Connections in the Project Areas The number of households and house connections in the Project Area at present are confirmed by Abbottabad TMA and Abbottabad District, and are shown in the table below. The total number of house connections is 15,700, while the total number of household is 28,029
Table 2-2-1 Number of Households and House Connections
Project Area Union council
(U/C)
No. of households
in 2009
No. of house connections (domestic)
(1) Abbottabad TMA (urban) Kehal, Malik Pura, Central Urban
8,875 5,800
(2) Nawansher Service Unit (urban) Nawansher 3,645 3,603
(3) Sheikhul Bandi Sheikhul Bandi 2,799 1,129
(4) Salhad Salhad 3,440 1,052
(5) Mirpur Mirpur 1,954 887
(6) Jhangi UC
(i) Derawanda Jhangi 1,529 747
(ii) Jhangi Jhangi 771 426
(iii) Lama Maira Jhangi 703 330
(iv) Banda Ghazan Jhangi 540 458
(v) Banda Dalazak Jhangi 882 493
(vi) Band Phugwarian Jhangi 794 498
(Vii) Dobathar Jhangi 2,097 277
Total 28,029 15,700
2) The Current Population, Population Served and Service Coverage in the Project Area The population in 2009 has been calculated as 200,249 by multiplying the number of households by the number of persons in a household, which was estimated by interviewing residents. The population served in 2009 has also been calculated as 113,923 by multiplying the number of house connections by the number of persons in a household. The average persons per household is 7.6 in Abbottabad TMA, 7.5 in Nawansher Service Unit and 6.8 non-urban areas. The table below shows the number of households and the estimated population. The service coverage ratio in Nawansher Service Unit shows a high figure of 99%, and the ratio in Abbottabad TMA is 65%. The ratio in non-urban areas ranges from 13% in Dobathar to 85% in Banda Ghazan.
Table 2-2-2 The Current Population, Population Served and Service Coverage
Project Area No. of persons per household
2009 Population
2009 Population
Served
Service coverage
(%)
(1) Abbottabad TMA (urban) 7.6 67,450 44,080 65
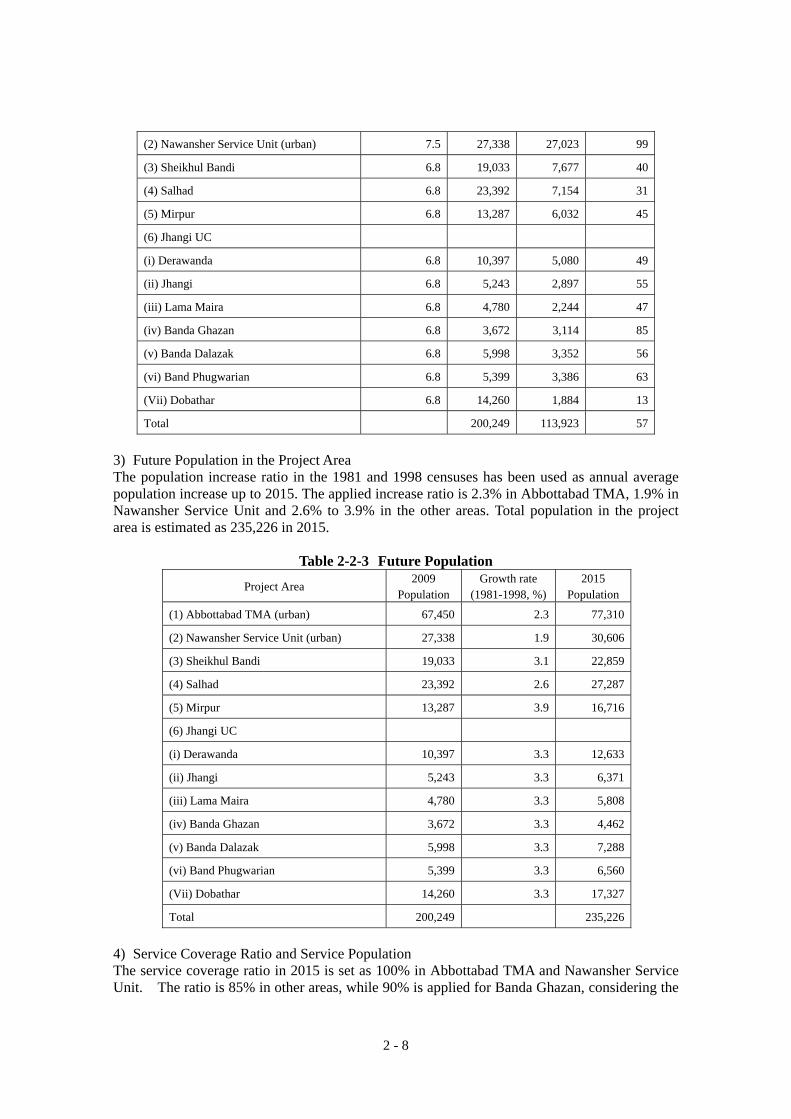
2 - 8
(2) Nawansher Service Unit (urban) 7.5 27,338 27,023 99
(3) Sheikhul Bandi 6.8 19,033 7,677 40
(4) Salhad 6.8 23,392 7,154 31
(5) Mirpur 6.8 13,287 6,032 45
(6) Jhangi UC
(i) Derawanda 6.8 10,397 5,080 49
(ii) Jhangi 6.8 5,243 2,897 55
(iii) Lama Maira 6.8 4,780 2,244 47
(iv) Banda Ghazan 6.8 3,672 3,114 85
(v) Banda Dalazak 6.8 5,998 3,352 56
(vi) Band Phugwarian 6.8 5,399 3,386 63
(Vii) Dobathar 6.8 14,260 1,884 13
Total 200,249 113,923 57
3) Future Population in the Project Area The population increase ratio in the 1981 and 1998 censuses has been used as annual average population increase up to 2015. The applied increase ratio is 2.3% in Abbottabad TMA, 1.9% in Nawansher Service Unit and 2.6% to 3.9% in the other areas. Total population in the project area is estimated as 235,226 in 2015.
Table 2-2-3 Future Population
Project Area 2009
PopulationGrowth rate
(1981-1998, %)2015
Population
(1) Abbottabad TMA (urban) 67,450 2.3 77,310
(2) Nawansher Service Unit (urban) 27,338 1.9 30,606
(3) Sheikhul Bandi 19,033 3.1 22,859
(4) Salhad 23,392 2.6 27,287
(5) Mirpur 13,287 3.9 16,716
(6) Jhangi UC
(i) Derawanda 10,397 3.3 12,633
(ii) Jhangi 5,243 3.3 6,371
(iii) Lama Maira 4,780 3.3 5,808
(iv) Banda Ghazan 3,672 3.3 4,462
(v) Banda Dalazak 5,998 3.3 7,288
(vi) Band Phugwarian 5,399 3.3 6,560
(Vii) Dobathar 14,260 3.3 17,327
Total 200,249 235,226
4) Service Coverage Ratio and Service Population The service coverage ratio in 2015 is set as 100% in Abbottabad TMA and Nawansher Service Unit. The ratio is 85% in other areas, while 90% is applied for Banda Ghazan, considering the
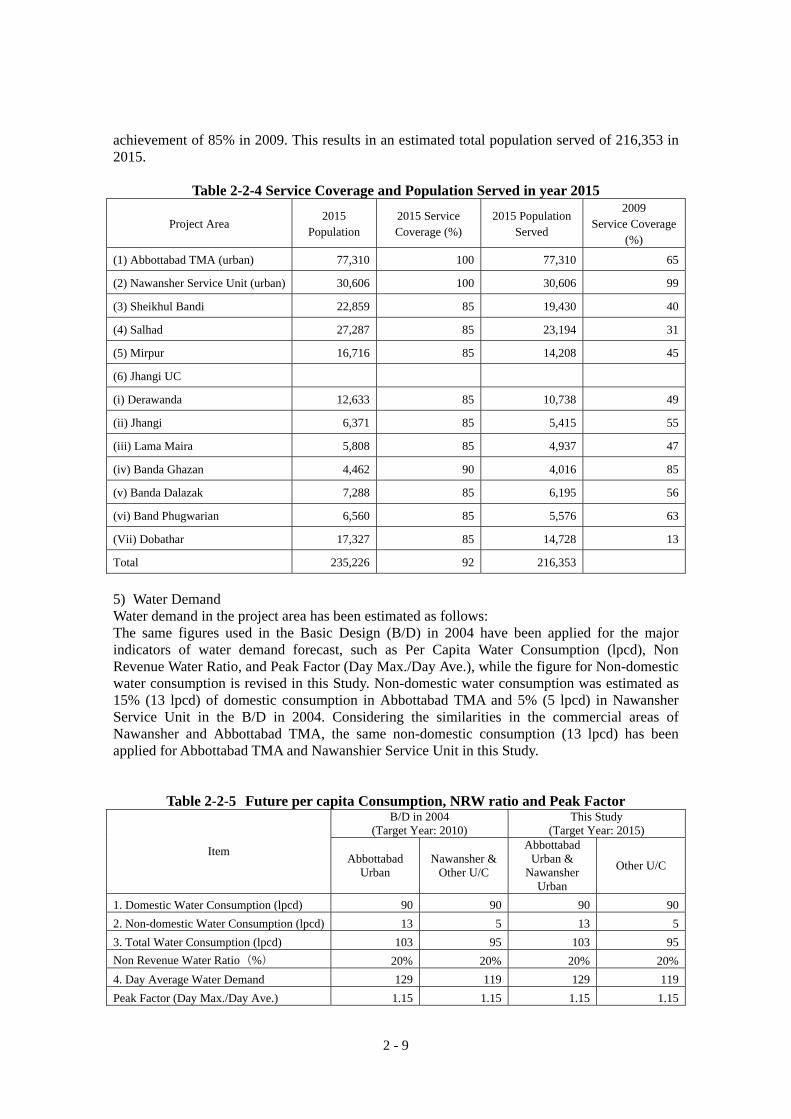
2 - 9
achievement of 85% in 2009. This results in an estimated total population served of 216,353 in 2015.
Table 2-2-4 Service Coverage and Population Served in year 2015
Project Area 2015
Population 2015 Service Coverage (%)
2015 Population Served
2009 Service Coverage
(%)
(1) Abbottabad TMA (urban) 77,310 100 77,310 65
(2) Nawansher Service Unit (urban) 30,606 100 30,606 99
(3) Sheikhul Bandi 22,859 85 19,430 40
(4) Salhad 27,287 85 23,194 31
(5) Mirpur 16,716 85 14,208 45
(6) Jhangi UC
(i) Derawanda 12,633 85 10,738 49
(ii) Jhangi 6,371 85 5,415 55
(iii) Lama Maira 5,808 85 4,937 47
(iv) Banda Ghazan 4,462 90 4,016 85
(v) Banda Dalazak 7,288 85 6,195 56
(vi) Band Phugwarian 6,560 85 5,576 63
(Vii) Dobathar 17,327 85 14,728 13
Total 235,226 92 216,353
5) Water Demand Water demand in the project area has been estimated as follows: The same figures used in the Basic Design (B/D) in 2004 have been applied for the major indicators of water demand forecast, such as Per Capita Water Consumption (lpcd), Non Revenue Water Ratio, and Peak Factor (Day Max./Day Ave.), while the figure for Non-domestic water consumption is revised in this Study. Non-domestic water consumption was estimated as 15% (13 lpcd) of domestic consumption in Abbottabad TMA and 5% (5 lpcd) in Nawansher Service Unit in the B/D in 2004. Considering the similarities in the commercial areas of Nawansher and Abbottabad TMA, the same non-domestic consumption (13 lpcd) has been applied for Abbottabad TMA and Nawanshier Service Unit in this Study.
Table 2-2-5 Future per capita Consumption, NRW ratio and Peak Factor B/D in 2004
(Target Year: 2010) This Study
(Target Year: 2015)
Item Abbottabad Urban
Nawansher & Other U/C
Abbottabad Urban &
Nawansher Urban
Other U/C
1. Domestic Water Consumption (lpcd) 90 90 90 90 2. Non-domestic Water Consumption (lpcd) 13 5 13 5 3. Total Water Consumption (lpcd) 103 95 103 95 Non Revenue Water Ratio(%) 20% 20% 20% 20%4. Day Average Water Demand 129 119 129 119 Peak Factor (Day Max./Day Ave.) 1.15 1.15 1.15 1.15
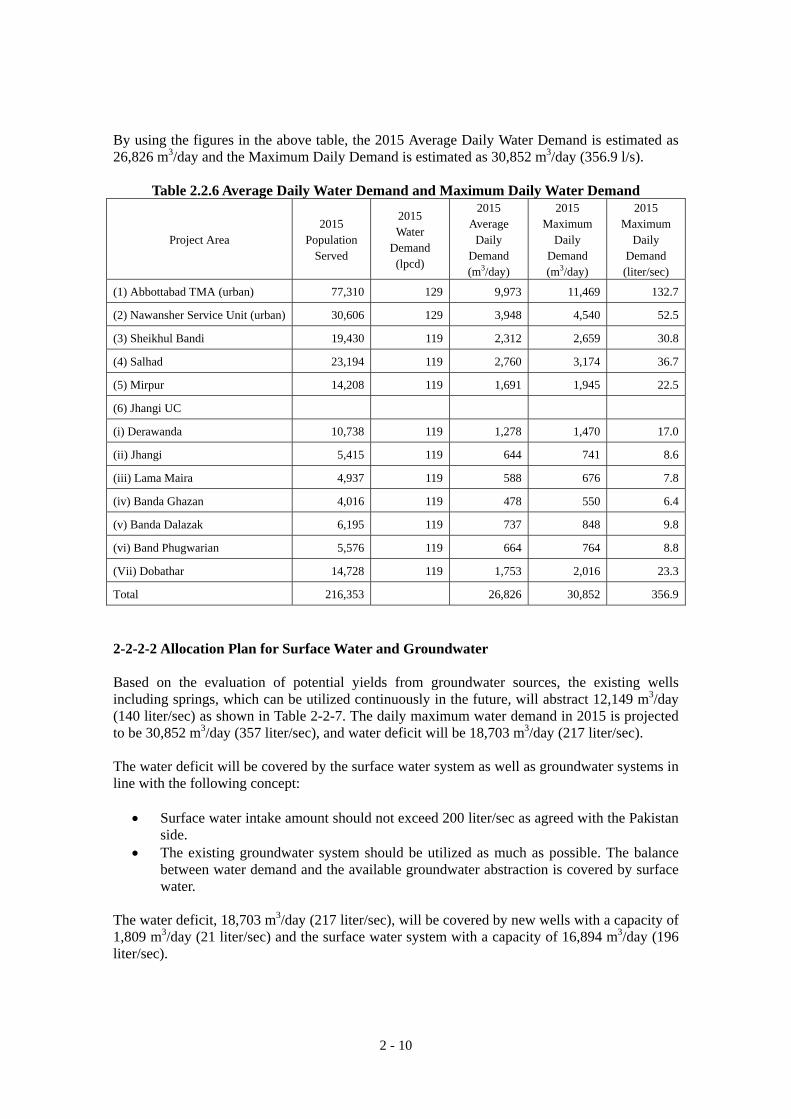
2 - 10
By using the figures in the above table, the 2015 Average Daily Water Demand is estimated as 26,826 m3/day and the Maximum Daily Demand is estimated as 30,852 m3/day (356.9 l/s).
Table 2.2.6 Average Daily Water Demand and Maximum Daily Water Demand
Project Area 2015
Population Served
2015 Water
Demand (lpcd)
2015 Average
Daily Demand (m3/day)
2015 Maximum
Daily Demand (m3/day)
2015 Maximum
Daily Demand (liter/sec)
(1) Abbottabad TMA (urban) 77,310 129 9,973 11,469 132.7
(2) Nawansher Service Unit (urban) 30,606 129 3,948 4,540 52.5
(3) Sheikhul Bandi 19,430 119 2,312 2,659 30.8
(4) Salhad 23,194 119 2,760 3,174 36.7
(5) Mirpur 14,208 119 1,691 1,945 22.5
(6) Jhangi UC
(i) Derawanda 10,738 119 1,278 1,470 17.0
(ii) Jhangi 5,415 119 644 741 8.6
(iii) Lama Maira 4,937 119 588 676 7.8
(iv) Banda Ghazan 4,016 119 478 550 6.4
(v) Banda Dalazak 6,195 119 737 848 9.8
(vi) Band Phugwarian 5,576 119 664 764 8.8
(Vii) Dobathar 14,728 119 1,753 2,016 23.3
Total 216,353 26,826 30,852 356.9
2-2-2-2 Allocation Plan for Surface Water and Groundwater
Based on the evaluation of potential yields from groundwater sources, the existing wells including springs, which can be utilized continuously in the future, will abstract 12,149 m3/day (140 liter/sec) as shown in Table 2-2-7. The daily maximum water demand in 2015 is projected to be 30,852 m3/day (357 liter/sec), and water deficit will be 18,703 m3/day (217 liter/sec).
The water deficit will be covered by the surface water system as well as groundwater systems in line with the following concept:
• Surface water intake amount should not exceed 200 liter/sec as agreed with the Pakistan side.
• The existing groundwater system should be utilized as much as possible. The balance between water demand and the available groundwater abstraction is covered by surface water.
The water deficit, 18,703 m3/day (217 liter/sec), will be covered by new wells with a capacity of 1,809 m3/day (21 liter/sec) and the surface water system with a capacity of 16,894 m3/day (196 liter/sec).
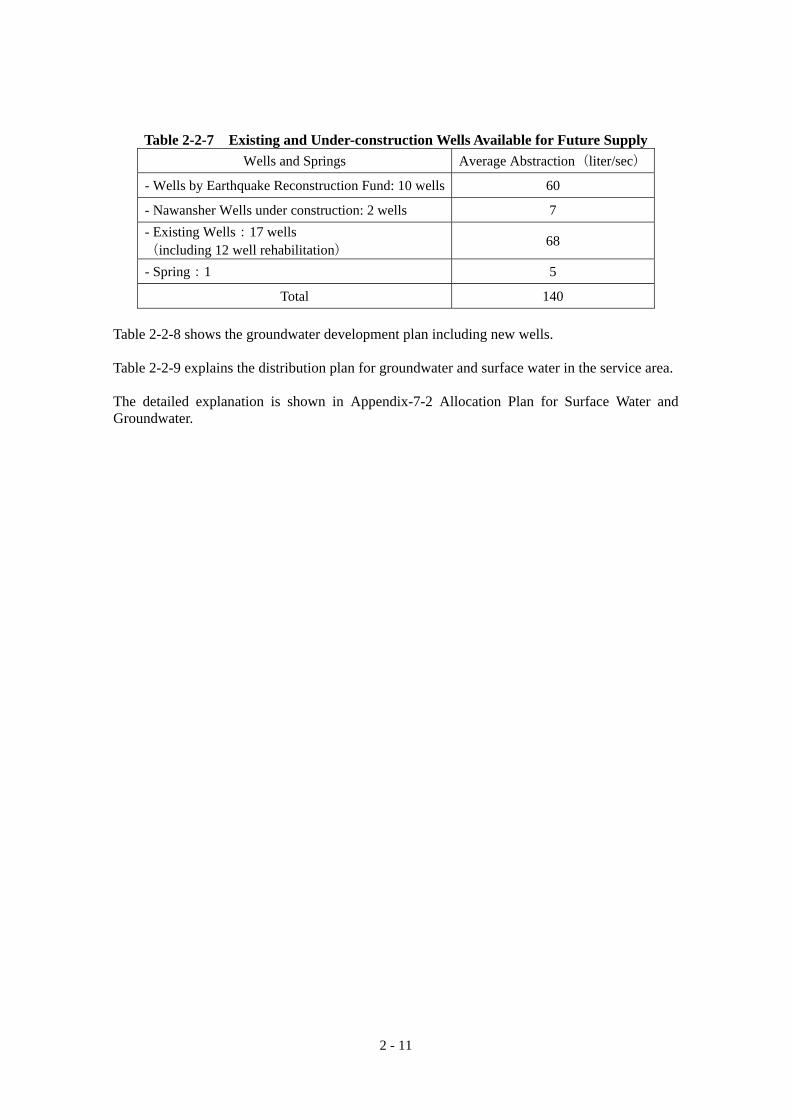
2 - 11
Table 2-2-7 Existing and Under-construction Wells Available for Future Supply Wells and Springs Average Abstraction(liter/sec)
- Wells by Earthquake Reconstruction Fund: 10 wells 60
- Nawansher Wells under construction: 2 wells 7 - Existing Wells:17 wells (including 12 well rehabilitation) 68
- Spring:1 5
Total 140 Table 2-2-8 shows the groundwater development plan including new wells. Table 2-2-9 explains the distribution plan for groundwater and surface water in the service area. The detailed explanation is shown in Appendix-7-2 Allocation Plan for Surface Water and Groundwater.
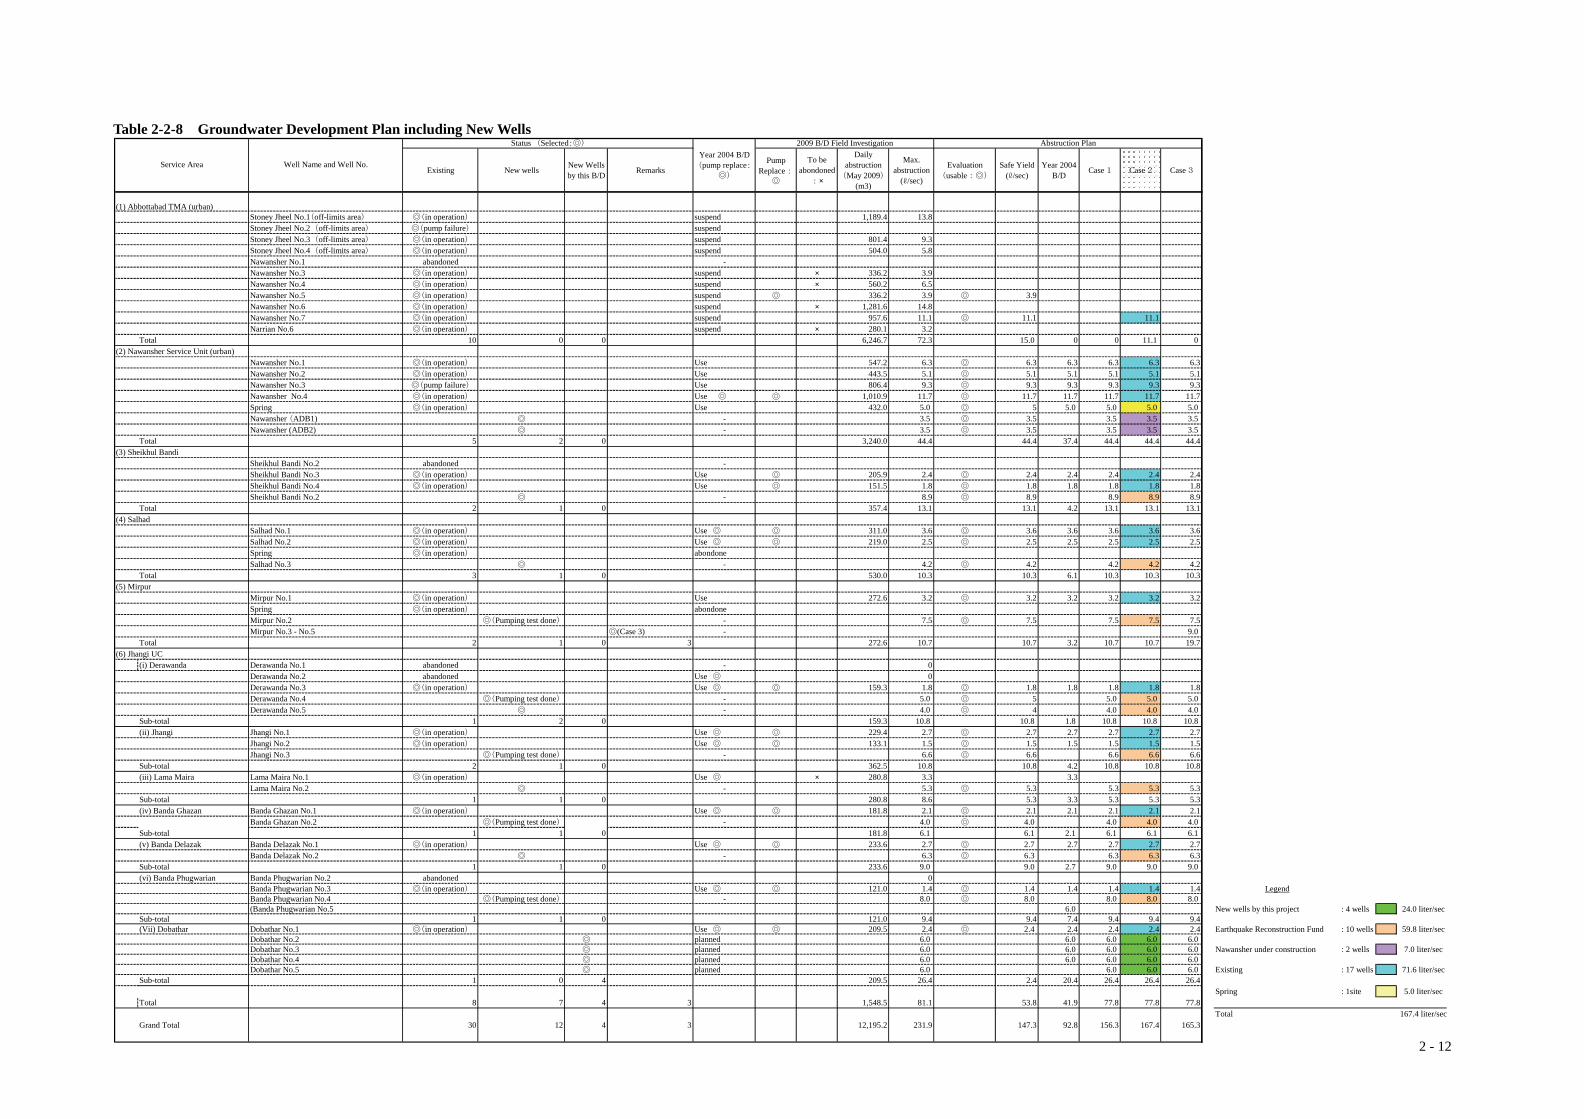
2 - 12
Table 2-2-8 Groundwater Development Plan including New Wells
Existing New wells New Wellsby this B/D Remarks
PumpReplace:
◎
To beabondoned
:×
Dailyabstruction(May 2009)
(m3)
Max.abstruction
(ℓ/sec)
Evaluation(usable:◎)
Safe Yield(ℓ/sec)
Year 2004B/D Case 1 Case 2 Case 3
(1) Abbottabad TMA (urban)Stoney Jheel No.1(off-limits area) ◎(in operation) suspend 1,189.4 13.8Stoney Jheel No.2(off-limits area) ◎(pump failure) suspendStoney Jheel No.3(off-limits area) ◎(in operation) suspend 801.4 9.3Stoney Jheel No.4(off-limits area) ◎(in operation) suspend 504.0 5.8Nawansher No.1 abandoned -Nawansher No.3 ◎(in operation) suspend × 336.2 3.9Nawansher No.4 ◎(in operation) suspend × 560.2 6.5Nawansher No.5 ◎(in operation) suspend ◎ 336.2 3.9 ◎ 3.9Nawansher No.6 ◎(in operation) suspend × 1,281.6 14.8Nawansher No.7 ◎(in operation) suspend 957.6 11.1 ◎ 11.1 11.1Narrian No.6 ◎(in operation) suspend × 280.1 3.2
Total 10 0 0 6,246.7 72.3 15.0 0 0 11.1 0(2) Nawansher Service Unit (urban)
Nawansher No.1 ◎(in operation) Use 547.2 6.3 ◎ 6.3 6.3 6.3 6.3 6.3Nawansher No.2 ◎(in operation) Use 443.5 5.1 ◎ 5.1 5.1 5.1 5.1 5.1Nawansher No.3 ◎(pump failure) Use 806.4 9.3 ◎ 9.3 9.3 9.3 9.3 9.3Nawansher No.4 ◎(in operation) Use ◎ ◎ 1,010.9 11.7 ◎ 11.7 11.7 11.7 11.7 11.7Spring ◎(in operation) Use 432.0 5.0 ◎ 5 5.0 5.0 5.0 5.0Nawansher (ADB1) ◎ - 3.5 ◎ 3.5 3.5 3.5 3.5Nawansher (ADB2) ◎ - 3.5 ◎ 3.5 3.5 3.5 3.5
Total 5 2 0 3,240.0 44.4 44.4 37.4 44.4 44.4 44.4(3) Sheikhul Bandi
Sheikhul Bandi No.2 abandoned -Sheikhul Bandi No.3 ◎(in operation) Use ◎ 205.9 2.4 ◎ 2.4 2.4 2.4 2.4 2.4Sheikhul Bandi No.4 ◎(in operation) Use ◎ 151.5 1.8 ◎ 1.8 1.8 1.8 1.8 1.8Sheikhul Bandi No.2 ◎ - 8.9 ◎ 8.9 8.9 8.9 8.9
Total 2 1 0 357.4 13.1 13.1 4.2 13.1 13.1 13.1(4) Salhad
Salhad No.1 ◎(in operation) Use ◎ ◎ 311.0 3.6 ◎ 3.6 3.6 3.6 3.6 3.6Salhad No.2 ◎(in operation) Use ◎ ◎ 219.0 2.5 ◎ 2.5 2.5 2.5 2.5 2.5Spring ◎(in operation) abondoneSalhad No.3 ◎ - 4.2 ◎ 4.2 4.2 4.2 4.2
Total 3 1 0 530.0 10.3 10.3 6.1 10.3 10.3 10.3(5) Mirpur
Mirpur No.1 ◎(in operation) Use 272.6 3.2 ◎ 3.2 3.2 3.2 3.2 3.2Spring ◎(in operation) abondoneMirpur No.2 ◎(Pumping test done) - 7.5 ◎ 7.5 7.5 7.5 7.5Mirpur No.3 - No.5 ◎(Case 3) - 9.0
Total 2 1 0 3 272.6 10.7 10.7 3.2 10.7 10.7 19.7(6) Jhangi UC
(i) Derawanda Derawanda No.1 abandoned - 0Derawanda No.2 abandoned Use ◎ 0Derawanda No.3 ◎(in operation) Use ◎ ◎ 159.3 1.8 ◎ 1.8 1.8 1.8 1.8 1.8Derawanda No.4 ◎(Pumping test done) - 5.0 ◎ 5 5.0 5.0 5.0Derawanda No.5 ◎ - 4.0 ◎ 4 4.0 4.0 4.0
Sub-total 1 2 0 159.3 10.8 10.8 1.8 10.8 10.8 10.8(ii) Jhangi Jhangi No.1 ◎(in operation) Use ◎ ◎ 229.4 2.7 ◎ 2.7 2.7 2.7 2.7 2.7
Jhangi No.2 ◎(in operation) Use ◎ ◎ 133.1 1.5 ◎ 1.5 1.5 1.5 1.5 1.5Jhangi No.3 ◎(Pumping test done) - 6.6 ◎ 6.6 6.6 6.6 6.6
Sub-total 2 1 0 362.5 10.8 10.8 4.2 10.8 10.8 10.8(iii) Lama Maira Lama Maira No.1 ◎(in operation) Use ◎ × 280.8 3.3 3.3
Lama Maira No.2 ◎ - 5.3 ◎ 5.3 5.3 5.3 5.3Sub-total 1 1 0 280.8 8.6 5.3 3.3 5.3 5.3 5.3(iv) Banda Ghazan Banda Ghazan No.1 ◎(in operation) Use ◎ ◎ 181.8 2.1 ◎ 2.1 2.1 2.1 2.1 2.1
Banda Ghazan No.2 ◎(Pumping test done) - 4.0 ◎ 4.0 4.0 4.0 4.0Sub-total 1 1 0 181.8 6.1 6.1 2.1 6.1 6.1 6.1(v) Banda Delazak Banda Delazak No.1 ◎(in operation) Use ◎ ◎ 233.6 2.7 ◎ 2.7 2.7 2.7 2.7 2.7
Banda Delazak No.2 ◎ - 6.3 ◎ 6.3 6.3 6.3 6.3Sub-total 1 1 0 233.6 9.0 9.0 2.7 9.0 9.0 9.0(vi) Banda Phugwarian Banda Phugwarian No.2 abandoned 0
Banda Phugwarian No.3 ◎(in operation) Use ◎ ◎ 121.0 1.4 ◎ 1.4 1.4 1.4 1.4 1.4 LegendBanda Phugwarian No.4 ◎(Pumping test done) - 8.0 ◎ 8.0 8.0 8.0 8.0(Banda Phugwarian No.5 6.0 New wells by this project : 4 wells 24.0 liter/sec
Sub-total 1 1 0 121.0 9.4 9.4 7.4 9.4 9.4 9.4(Vii) Dobathar Dobathar No.1 ◎(in operation) Use ◎ ◎ 209.5 2.4 ◎ 2.4 2.4 2.4 2.4 2.4 Earthquake Reconstruction Fund : 10 wells 59.8 liter/sec
Dobathar No.2 ◎ planned 6.0 6.0 6.0 6.0 6.0Dobathar No.3 ◎ planned 6.0 6.0 6.0 6.0 6.0 Nawansher under construction : 2 wells 7.0 liter/secDobathar No.4 ◎ planned 6.0 6.0 6.0 6.0 6.0Dobathar No.5 ◎ planned 6.0 6.0 6.0 6.0 Existing : 17 wells 71.6 liter/sec
Sub-total 1 0 4 209.5 26.4 2.4 20.4 26.4 26.4 26.4Spring : 1site 5.0 liter/sec
Total 8 7 4 3 1,548.5 81.1 53.8 41.9 77.8 77.8 77.8Total 167.4 liter/sec
Grand Total 30 12 4 3 12,195.2 231.9 147.3 92.8 156.3 167.4 165.3
Abstruction PlanStatus (Selected:◎)
Service Area Well Name and Well No.Year 2004 B/D(pump replace:
◎)
2009 B/D Field Investigation
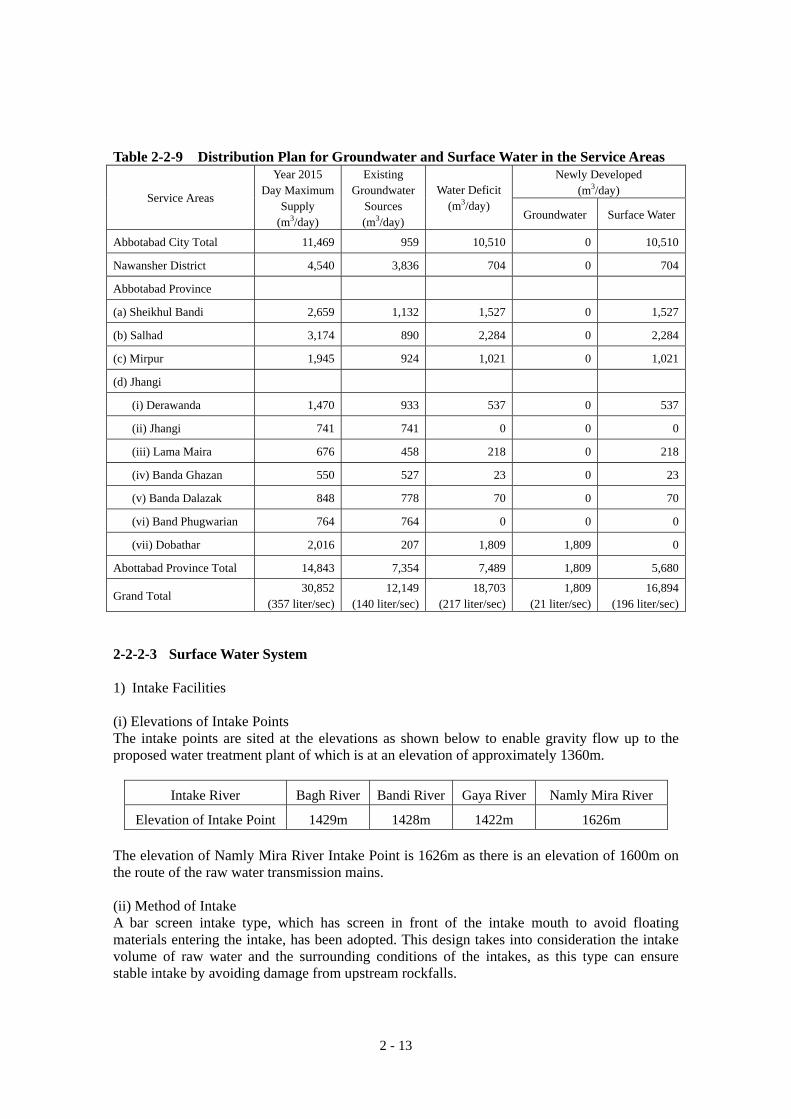
2 - 13
Table 2-2-9 Distribution Plan for Groundwater and Surface Water in the Service Areas
Newly Developed (m3/day) Service Areas
Year 2015 Day Maximum
Supply (m3/day)
Existing Groundwater
Sources (m3/day)
Water Deficit(m3/day)
Groundwater Surface Water
Abbotabad City Total 11,469 959 10,510 0 10,510
Nawansher District 4,540 3,836 704 0 704
Abbotabad Province
(a) Sheikhul Bandi 2,659 1,132 1,527 0 1,527
(b) Salhad 3,174 890 2,284 0 2,284
(c) Mirpur 1,945 924 1,021 0 1,021
(d) Jhangi
(i) Derawanda 1,470 933 537 0 537
(ii) Jhangi 741 741 0 0 0
(iii) Lama Maira 676 458 218 0 218
(iv) Banda Ghazan 550 527 23 0 23
(v) Banda Dalazak 848 778 70 0 70
(vi) Band Phugwarian 764 764 0 0 0
(vii) Dobathar 2,016 207 1,809 1,809 0
Abottabad Province Total 14,843 7,354 7,489 1,809 5,680
Grand Total 30,852
(357 liter/sec) 12,149
(140 liter/sec)18,703
(217 liter/sec)1,809
(21 liter/sec) 16,894
(196 liter/sec) 2-2-2-3 Surface Water System 1) Intake Facilities (i) Elevations of Intake Points The intake points are sited at the elevations as shown below to enable gravity flow up to the proposed water treatment plant of which is at an elevation of approximately 1360m.
Intake River Bagh River Bandi River Gaya River Namly Mira River
Elevation of Intake Point 1429m 1428m 1422m 1626m The elevation of Namly Mira River Intake Point is 1626m as there is an elevation of 1600m on the route of the raw water transmission mains. (ii) Method of Intake A bar screen intake type, which has screen in front of the intake mouth to avoid floating materials entering the intake, has been adopted. This design takes into consideration the intake volume of raw water and the surrounding conditions of the intakes, as this type can ensure stable intake by avoiding damage from upstream rockfalls.
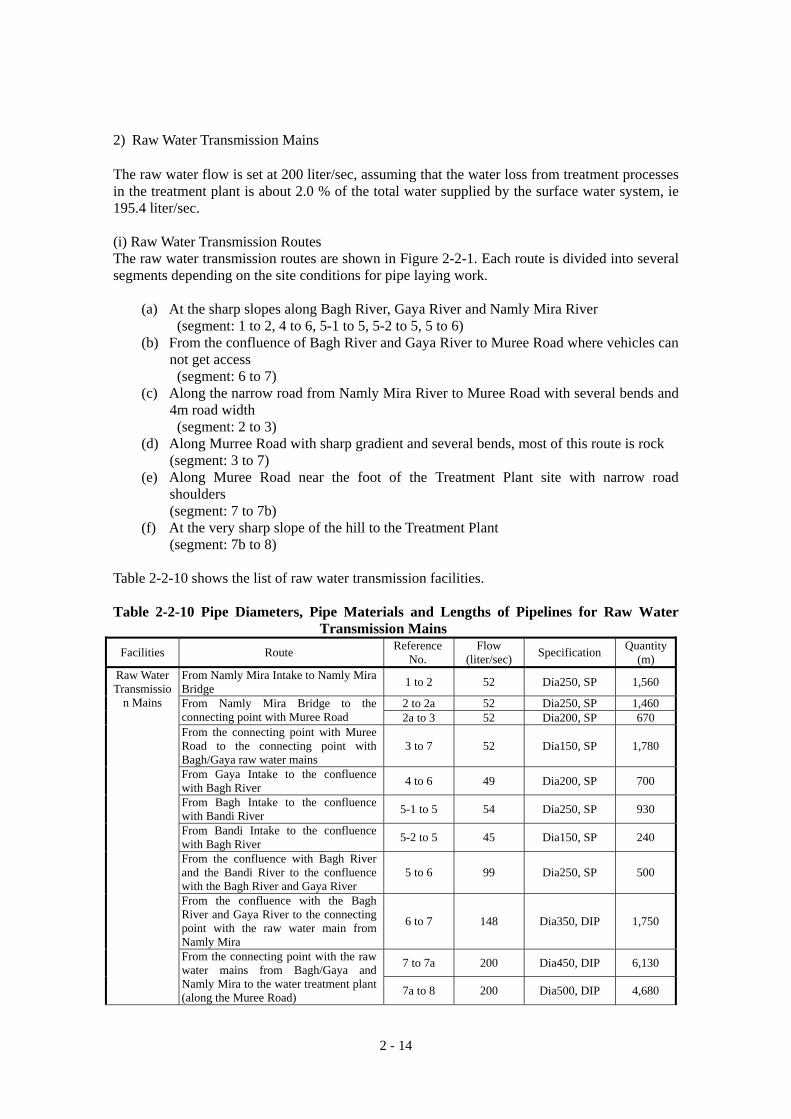
2 - 14
2) Raw Water Transmission Mains The raw water flow is set at 200 liter/sec, assuming that the water loss from treatment processes in the treatment plant is about 2.0 % of the total water supplied by the surface water system, ie 195.4 liter/sec. (i) Raw Water Transmission Routes The raw water transmission routes are shown in Figure 2-2-1. Each route is divided into several segments depending on the site conditions for pipe laying work.
(a) At the sharp slopes along Bagh River, Gaya River and Namly Mira River (segment: 1 to 2, 4 to 6, 5-1 to 5, 5-2 to 5, 5 to 6)
(b) From the confluence of Bagh River and Gaya River to Muree Road where vehicles can not get access (segment: 6 to 7)
(c) Along the narrow road from Namly Mira River to Muree Road with several bends and 4m road width (segment: 2 to 3)
(d) Along Murree Road with sharp gradient and several bends, most of this route is rock (segment: 3 to 7)
(e) Along Muree Road near the foot of the Treatment Plant site with narrow road shoulders (segment: 7 to 7b)
(f) At the very sharp slope of the hill to the Treatment Plant (segment: 7b to 8)
Table 2-2-10 shows the list of raw water transmission facilities. Table 2-2-10 Pipe Diameters, Pipe Materials and Lengths of Pipelines for Raw Water
Transmission Mains Facilities Route Reference
No. Flow
(liter/sec) Specification Quantity (m)
From Namly Mira Intake to Namly Mira Bridge 1 to 2 52 Dia250, SP 1,560
2 to 2a 52 Dia250, SP 1,460 From Namly Mira Bridge to the connecting point with Muree Road 2a to 3 52 Dia200, SP 670 From the connecting point with Muree Road to the connecting point with Bagh/Gaya raw water mains
3 to 7 52 Dia150, SP 1,780
From Gaya Intake to the confluence with Bagh River 4 to 6 49 Dia200, SP 700
From Bagh Intake to the confluence with Bandi River 5-1 to 5 54 Dia250, SP 930
From Bandi Intake to the confluence with Bagh River 5-2 to 5 45 Dia150, SP 240
From the confluence with Bagh River and the Bandi River to the confluence with the Bagh River and Gaya River
5 to 6 99 Dia250, SP 500
From the confluence with the Bagh River and Gaya River to the connecting point with the raw water main from Namly Mira
6 to 7 148 Dia350, DIP 1,750
7 to 7a 200 Dia450, DIP 6,130
Raw Water Transmissio
n Mains
From the connecting point with the raw water mains from Bagh/Gaya and Namly Mira to the water treatment plant (along the Muree Road) 7a to 8 200 Dia500, DIP 4,680
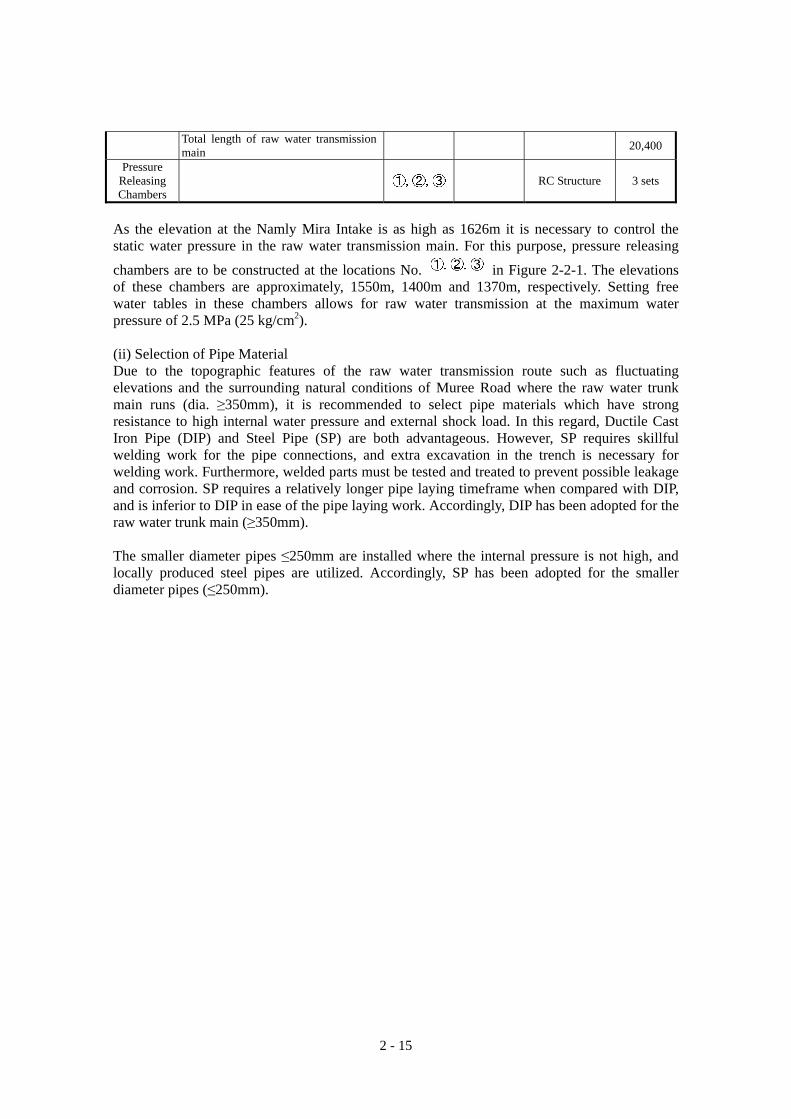
2 - 15
Total length of raw water transmission main 20,400
Pressure Releasing Chambers
RC Structure 3 sets
As the elevation at the Namly Mira Intake is as high as 1626m it is necessary to control the static water pressure in the raw water transmission main. For this purpose, pressure releasing
chambers are to be constructed at the locations No. in Figure 2-2-1. The elevations of these chambers are approximately, 1550m, 1400m and 1370m, respectively. Setting free water tables in these chambers allows for raw water transmission at the maximum water pressure of 2.5 MPa (25 kg/cm2). (ii) Selection of Pipe Material Due to the topographic features of the raw water transmission route such as fluctuating elevations and the surrounding natural conditions of Muree Road where the raw water trunk main runs (dia. ≥350mm), it is recommended to select pipe materials which have strong resistance to high internal water pressure and external shock load. In this regard, Ductile Cast Iron Pipe (DIP) and Steel Pipe (SP) are both advantageous. However, SP requires skillful welding work for the pipe connections, and extra excavation in the trench is necessary for welding work. Furthermore, welded parts must be tested and treated to prevent possible leakage and corrosion. SP requires a relatively longer pipe laying timeframe when compared with DIP, and is inferior to DIP in ease of the pipe laying work. Accordingly, DIP has been adopted for the raw water trunk main (≥350mm). The smaller diameter pipes ≤250mm are installed where the internal pressure is not high, and locally produced steel pipes are utilized. Accordingly, SP has been adopted for the smaller diameter pipes (≤250mm).
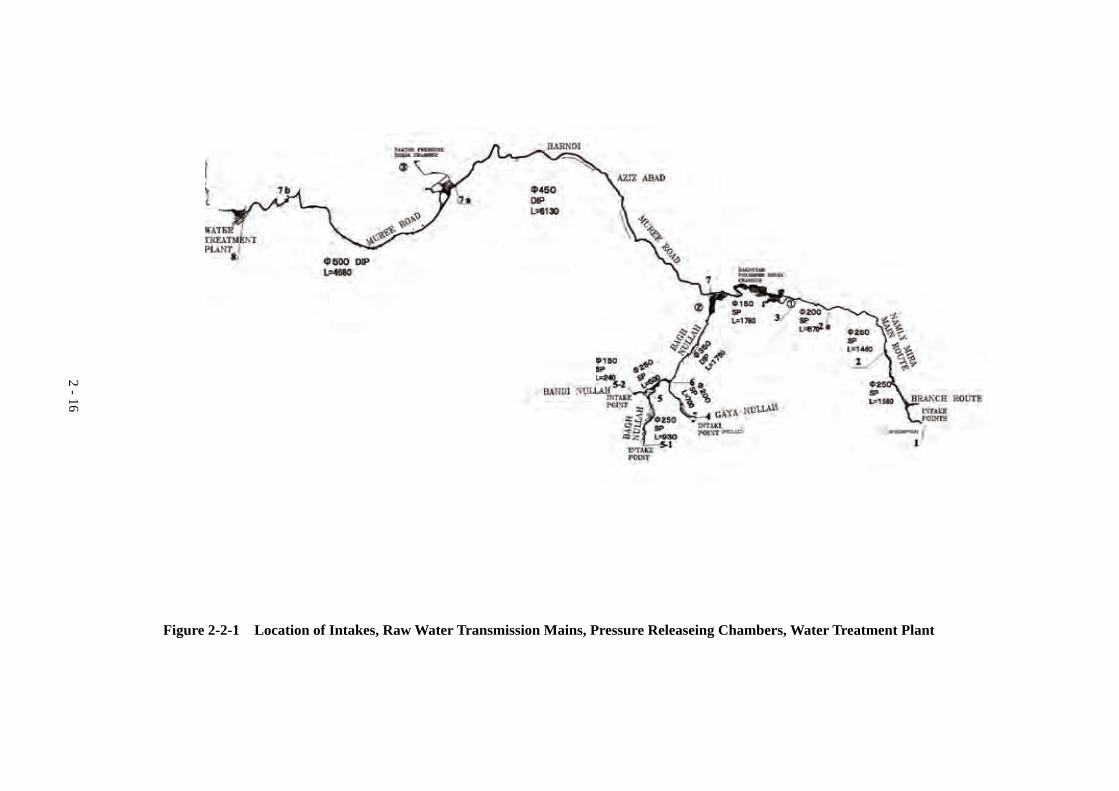
2 - 16
Figure 2-2-1 Location of Intakes, Raw Water Transmission Mains, Pressure Releaseing Chambers, Water Treatment Plant
2 - 17
3) Water Treatment Plant Raw water turbidity is usually low, but tends to increase sharply for a certain period following rainfall. Raw water quality meets the criteria of the NSDWG, with the exception of coliform bacteria. Taking into account the result of raw water quality analysis mentioned above and the result of continuous measurement of raw water turbidity carried out on the basic design survey in 2004, the following treatment processes are required. ①Sedimentation Basin (Raw Water Reservoir) →②Roughing Filter→③Slow Sand Filter
→④Chlorination→⑤Clear Water Reservoir (i) Sedimentation Basin It is assumed that extremely high raw water turbidity may occur several times a year. During these periods of high turbidity the treatment plant should suspend operations. Sedimentation basins are planned to avoid this highly turbid water entering into the subsequent treatment processes, by retaining inflow so that the operator can take necessary action against the high turbidity. In practical terms, a certain period of time is necessary for the operators to judge whether to stop the operation (by closing a stop valve upstream of the sedimentation basin) after analyzing the turbidity. Considering this requirement, the retention time of the sedimentation basin is set at two hours. Desludging from the basin is designed to be via manual scraping after emptying the basin. (ii) Roughing Filter The filter run period of slow sand filters is severely limited by the increase in raw water turbidity after rainfall. In order to alleviate the turbidity load in the slow sand filters, roughing filters are introduced to reduce raw water turbidity by 50%. There are three types of roughing filters, namely horizontal flow, downflow and upflow. Horizontal flow is of simpler structure but requires a lower flow rate. The upflow type can achieve the highest filtration rate and the downflow type is designed for medium flow rate. The upflow type is adopted in this project as it can obtain a higher filtration rate and filter media washing is easier. A filtration rate of 1.5 m/hr (36m/day) has been adopted. (iii) Slow Sand Filter Slow sand filters are commonly designed to have a filtration rate of 4 to 5m/day. If raw water turbidity is consistently low, a filtration rate of 8m/day can sometimes be applied. The raw water turbidity, however, must be reduced by roughing filters if the filtration rate of the slow sand filters is to be set at 5m/day. The filter media are sand and gravel which are locally available. (iv) Clear Water Reservoir The clear water reservoir is designed to provide constant and stable water transmission to the service areas and to maintain the transmission during periods when the raw water intake is suspended. According to the results of continuous measurement of raw water turbidity, the storage duration necessary if raw water inflow into the plant is cut off in an emergency is approximately six hours. Such cases, however, may happen only a few times a year. It is considered very conservative to have a full capacity of six hours. The capacity is designed at three hours, which is sufficient to maintain stable and constant transmission and provide effective chlorine contact time for disinfection. (v) Disinfection Facilities The existing water supply systems have no disinfection facilities, as water from deep wells is generally free from pathogenic contamination. However, the surface water sources are exposed to such contamination risk and disinfection processes are necessary to ensure the bacteriological
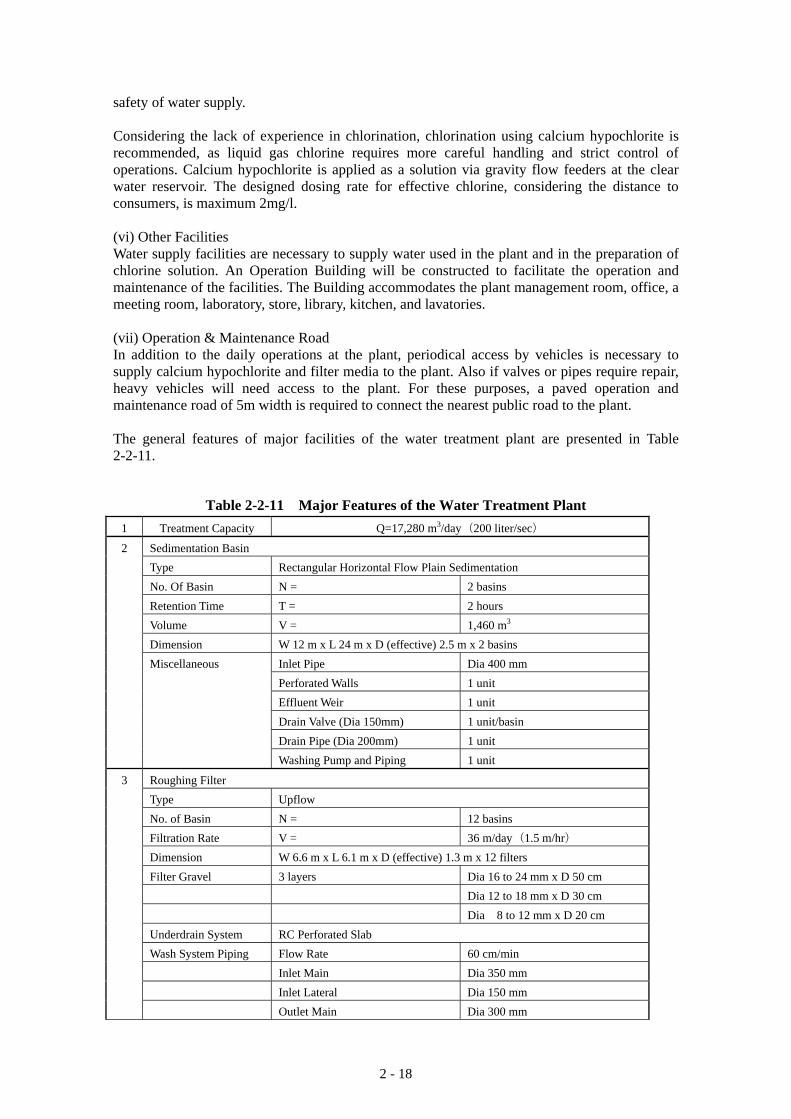
2 - 18
safety of water supply. Considering the lack of experience in chlorination, chlorination using calcium hypochlorite is recommended, as liquid gas chlorine requires more careful handling and strict control of operations. Calcium hypochlorite is applied as a solution via gravity flow feeders at the clear water reservoir. The designed dosing rate for effective chlorine, considering the distance to consumers, is maximum 2mg/l. (vi) Other Facilities Water supply facilities are necessary to supply water used in the plant and in the preparation of chlorine solution. An Operation Building will be constructed to facilitate the operation and maintenance of the facilities. The Building accommodates the plant management room, office, a meeting room, laboratory, store, library, kitchen, and lavatories. (vii) Operation & Maintenance Road In addition to the daily operations at the plant, periodical access by vehicles is necessary to supply calcium hypochlorite and filter media to the plant. Also if valves or pipes require repair, heavy vehicles will need access to the plant. For these purposes, a paved operation and maintenance road of 5m width is required to connect the nearest public road to the plant. The general features of major facilities of the water treatment plant are presented in Table 2-2-11.
Table 2-2-11 Major Features of the Water Treatment Plant 1 Treatment Capacity Q=17,280 m3/day(200 liter/sec)
Sedimentation Basin Type Rectangular Horizontal Flow Plain Sedimentation No. Of Basin N = 2 basins Retention Time T = 2 hours Volume V = 1,460 m3 Dimension W 12 m x L 24 m x D (effective) 2.5 m x 2 basins
Inlet Pipe Dia 400 mm Perforated Walls 1 unit Effluent Weir 1 unit Drain Valve (Dia 150mm) 1 unit/basin Drain Pipe (Dia 200mm) 1 unit
2
Miscellaneous
Washing Pump and Piping 1 unit
Roughing Filter Type Upflow No. of Basin N = 12 basins Filtration Rate V = 36 m/day(1.5 m/hr) Dimension W 6.6 m x L 6.1 m x D (effective) 1.3 m x 12 filters Filter Gravel 3 layers Dia 16 to 24 mm x D 50 cm Dia 12 to 18 mm x D 30 cm Dia 8 to 12 mm x D 20 cm Underdrain System RC Perforated Slab Wash System Piping Flow Rate 60 cm/min Inlet Main Dia 350 mm Inlet Lateral Dia 150 mm
3
Outlet Main Dia 300 mm
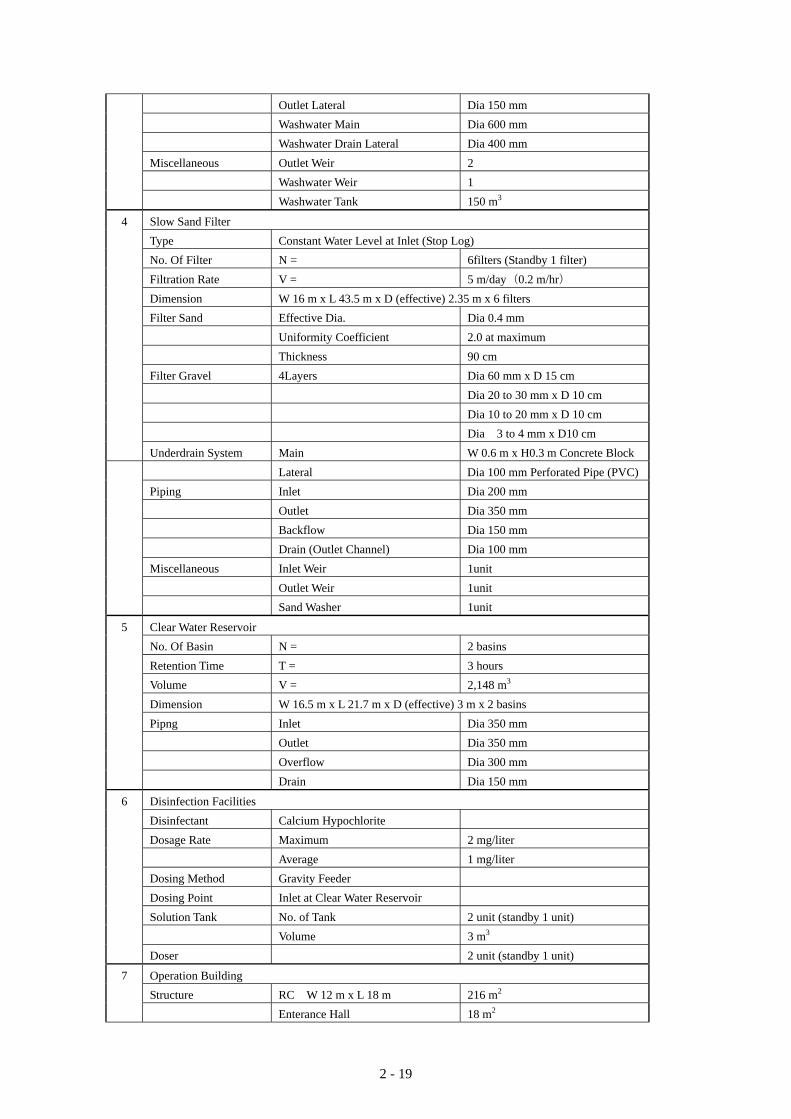
2 - 19
Outlet Lateral Dia 150 mm Washwater Main Dia 600 mm Washwater Drain Lateral Dia 400 mm Miscellaneous Outlet Weir 2 Washwater Weir 1 Washwater Tank 150 m3
Slow Sand Filter Type Constant Water Level at Inlet (Stop Log) No. Of Filter N = 6filters (Standby 1 filter) Filtration Rate V = 5 m/day(0.2 m/hr) Dimension W 16 m x L 43.5 m x D (effective) 2.35 m x 6 filters Filter Sand Effective Dia. Dia 0.4 mm Uniformity Coefficient 2.0 at maximum Thickness 90 cm Filter Gravel 4Layers Dia 60 mm x D 15 cm Dia 20 to 30 mm x D 10 cm Dia 10 to 20 mm x D 10 cm Dia 3 to 4 mm x D10 cm
4
Underdrain System Main W 0.6 m x H0.3 m Concrete Block Lateral Dia 100 mm Perforated Pipe (PVC) Piping Inlet Dia 200 mm Outlet Dia 350 mm Backflow Dia 150 mm Drain (Outlet Channel) Dia 100 mm Miscellaneous Inlet Weir 1unit Outlet Weir 1unit
Sand Washer 1unit
Clear Water Reservoir No. Of Basin N = 2 basins Retention Time T = 3 hours Volume V = 2,148 m3 Dimension W 16.5 m x L 21.7 m x D (effective) 3 m x 2 basins Pipng Inlet Dia 350 mm Outlet Dia 350 mm Overflow Dia 300 mm
5
Drain Dia 150 mm
Disinfection Facilities Disinfectant Calcium Hypochlorite Dosage Rate Maximum 2 mg/liter Average 1 mg/liter Dosing Method Gravity Feeder Dosing Point Inlet at Clear Water Reservoir Solution Tank No. of Tank 2 unit (standby 1 unit) Volume 3 m3
6
Doser 2 unit (standby 1 unit)
Operation Building Structure RC W 12 m x L 18 m 216 m2
7
Enterance Hall 18 m2
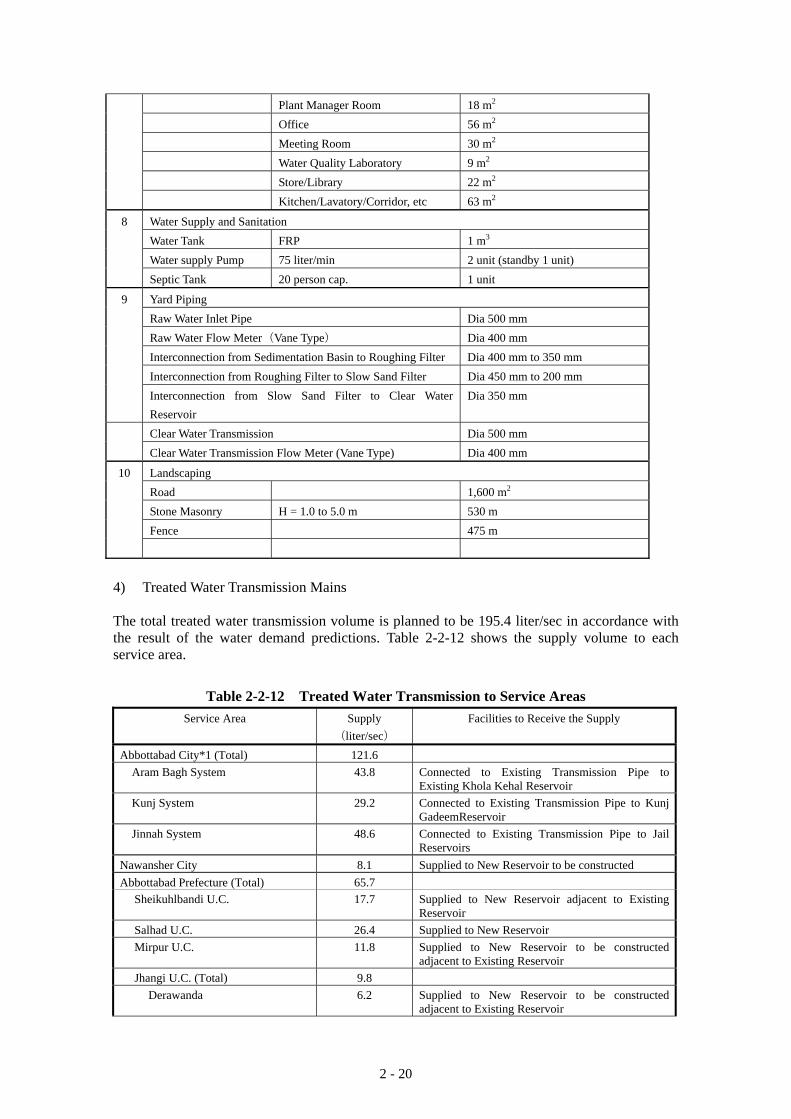
2 - 20
Plant Manager Room 18 m2 Office 56 m2 Meeting Room 30 m2 Water Quality Laboratory 9 m2 Store/Library 22 m2 Kitchen/Lavatory/Corridor, etc 63 m2
Water Supply and Sanitation Water Tank FRP 1 m3 Water supply Pump 75 liter/min 2 unit (standby 1 unit)
8
Septic Tank 20 person cap. 1 unit
Yard Piping Raw Water Inlet Pipe Dia 500 mm Raw Water Flow Meter(Vane Type) Dia 400 mm Interconnection from Sedimentation Basin to Roughing Filter Dia 400 mm to 350 mm Interconnection from Roughing Filter to Slow Sand Filter Dia 450 mm to 200 mm
9
Interconnection from Slow Sand Filter to Clear Water Reservoir
Dia 350 mm
Clear Water Transmission Dia 500 mm Clear Water Transmission Flow Meter (Vane Type) Dia 400 mm
Landscaping Road 1,600 m2 Stone Masonry H = 1.0 to 5.0 m 530 m Fence 475 m
10
4) Treated Water Transmission Mains The total treated water transmission volume is planned to be 195.4 liter/sec in accordance with the result of the water demand predictions. Table 2-2-12 shows the supply volume to each service area.
Table 2-2-12 Treated Water Transmission to Service Areas Service Area Supply
(liter/sec) Facilities to Receive the Supply
Abbottabad City*1 (Total) 121.6 Aram Bagh System 43.8 Connected to Existing Transmission Pipe to
Existing Khola Kehal Reservoir Kunj System 29.2 Connected to Existing Transmission Pipe to Kunj
GadeemReservoir Jinnah System 48.6 Connected to Existing Transmission Pipe to Jail
Reservoirs Nawansher City 8.1 Supplied to New Reservoir to be constructed Abbottabad Prefecture (Total) 65.7
Sheikuhlbandi U.C. 17.7 Supplied to New Reservoir adjacent to Existing Reservoir
Salhad U.C. 26.4 Supplied to New Reservoir Mirpur U.C. 11.8 Supplied to New Reservoir to be constructed
adjacent to Existing Reservoir Jhangi U.C. (Total) 9.8
Derawanda 6.2 Supplied to New Reservoir to be constructed adjacent to Existing Reservoir
2 - 21
Jhangi, Lama Maira, Banda Gazan, Banda Dilazak
3.6 Supplied to New Reservoir to be constructed adjacent to Existing Reservoir
Grand Total 195.4 Note : *1 Distribution to the three systems in Abbottabad City is determined by proportions of the existing
reservoir capacities. (i) Treated Water Transmission Routes for Surface Water System The Treated Water Transmission System for the Surface Water Gravity System is divided into two routes as shown in Figure 2-2-2. (a) Abbottabad – Salhad Route
The transmission main will be laid along the sharp hill slope from the treatment plant and takes the western route after meeting Murree Road. Then, it branches towards New Sheikulbandi Reservoir and goes along Shinar/Link Road. It will be connected to the existing transmission pipes at Aram Bagh Booster Pump Station and Kunj Booster Pump Station. After meeting Kala Kolum Highway (KKH) it divides further into two directions - one to Jinnah Booster Pumping Station and the other to the new and exisiting Salhad Reservoirs. The pipes to Salhad are installed along KKH, which is a national highway.
(b) Nawansher – Mirpur Route The transmission pipeline to this route branches from the transmission main at Murree Road. It goes through Nawansher City and then reaches KKH via PMA Road. After that it is divided into the northern direction and southern direction. The former will be extended through KKH to New Mirpur Reservoir and will also branch to New Derawanda Reservoir. The latter will be laid along KKH to supply water for New Banda Gazan Reservoir.
(ii) Diameters, Pipe Materials and Pipeline Lengths of Treated Water Transmission Main Table 2-2-13 tabulates the diameter, pipe material and length of each pipeline to be newly installed for the surface water system.
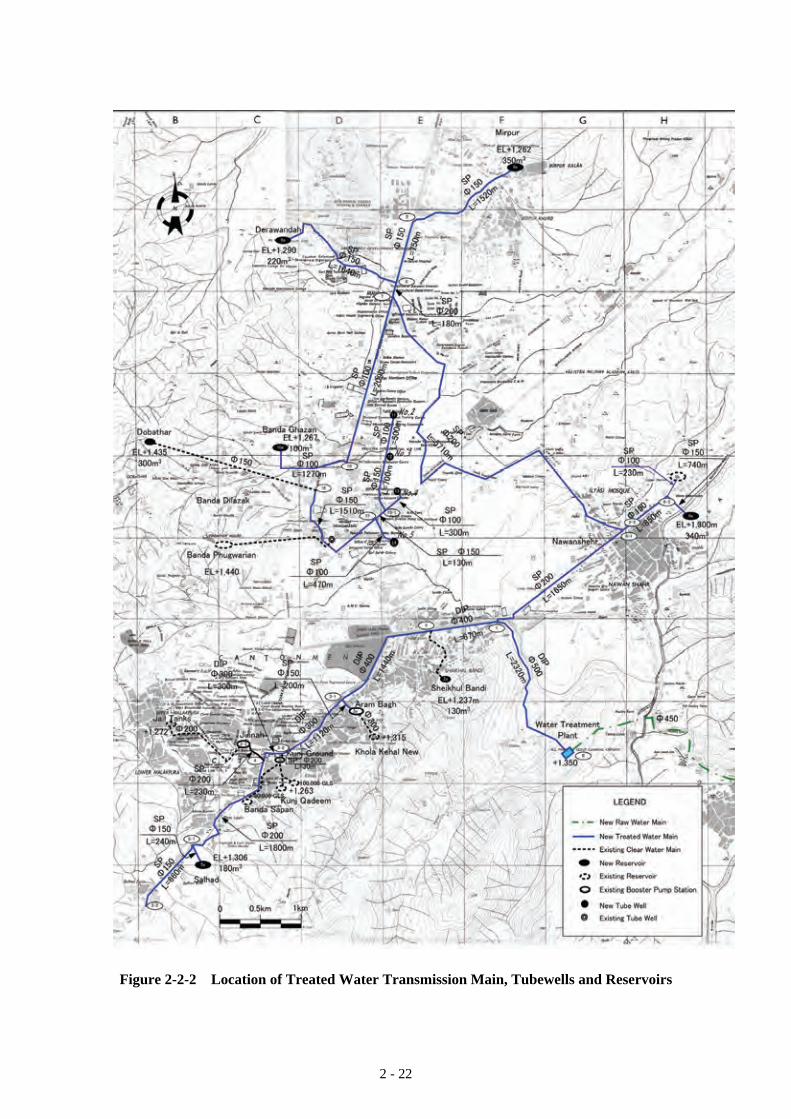
2 - 22
Figure 2-2-2 Location of Treated Water Transmission Main, Tubewells and Reservoirs
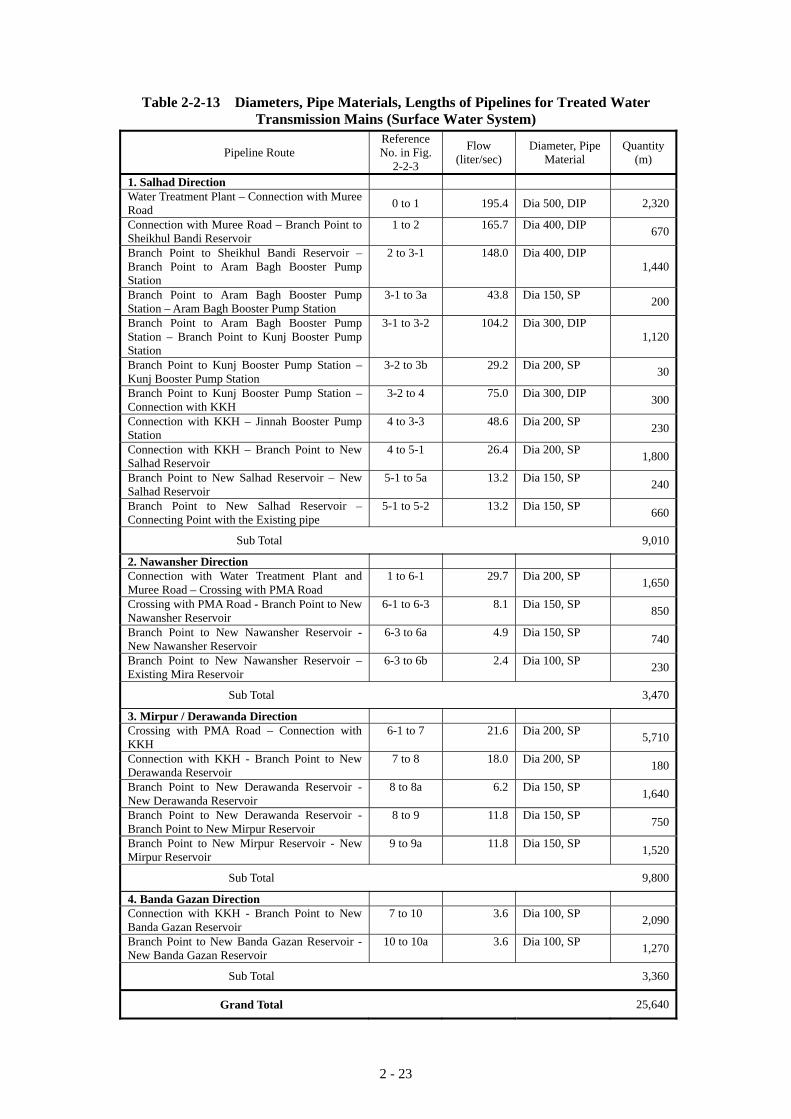
2 - 23
Table 2-2-13 Diameters, Pipe Materials, Lengths of Pipelines for Treated Water Transmission Mains (Surface Water System)
Pipeline Route Reference No. in Fig.
2-2-3
Flow (liter/sec)
Diameter, Pipe Material
Quantity (m)
1. Salhad Direction Water Treatment Plant – Connection with Muree Road 0 to 1 195.4 Dia 500, DIP 2,320
Connection with Muree Road – Branch Point to Sheikhul Bandi Reservoir
1 to 2 165.7 Dia 400, DIP 670
Branch Point to Sheikhul Bandi Reservoir – Branch Point to Aram Bagh Booster Pump Station
2 to 3-1 148.0 Dia 400, DIP 1,440
Branch Point to Aram Bagh Booster Pump Station – Aram Bagh Booster Pump Station
3-1 to 3a 43.8 Dia 150, SP 200
Branch Point to Aram Bagh Booster Pump Station – Branch Point to Kunj Booster Pump Station
3-1 to 3-2 104.2 Dia 300, DIP 1,120
Branch Point to Kunj Booster Pump Station – Kunj Booster Pump Station
3-2 to 3b 29.2 Dia 200, SP 30
Branch Point to Kunj Booster Pump Station – Connection with KKH
3-2 to 4 75.0 Dia 300, DIP 300
Connection with KKH – Jinnah Booster Pump Station
4 to 3-3 48.6 Dia 200, SP 230
Connection with KKH – Branch Point to New Salhad Reservoir
4 to 5-1 26.4 Dia 200, SP 1,800
Branch Point to New Salhad Reservoir – New Salhad Reservoir
5-1 to 5a 13.2 Dia 150, SP 240
Branch Point to New Salhad Reservoir – Connecting Point with the Existing pipe
5-1 to 5-2 13.2 Dia 150, SP 660
Sub Total 9,010
2. Nawansher Direction Connection with Water Treatment Plant and Muree Road – Crossing with PMA Road
1 to 6-1 29.7 Dia 200, SP 1,650
Crossing with PMA Road - Branch Point to New Nawansher Reservoir
6-1 to 6-3 8.1 Dia 150, SP 850
Branch Point to New Nawansher Reservoir - New Nawansher Reservoir
6-3 to 6a 4.9 Dia 150, SP 740
Branch Point to New Nawansher Reservoir – Existing Mira Reservoir
6-3 to 6b 2.4 Dia 100, SP 230
Sub Total 3,470
3. Mirpur / Derawanda Direction Crossing with PMA Road – Connection with KKH
6-1 to 7 21.6 Dia 200, SP 5,710
Connection with KKH - Branch Point to New Derawanda Reservoir
7 to 8 18.0 Dia 200, SP 180
Branch Point to New Derawanda Reservoir - New Derawanda Reservoir
8 to 8a 6.2 Dia 150, SP 1,640
Branch Point to New Derawanda Reservoir - Branch Point to New Mirpur Reservoir
8 to 9 11.8 Dia 150, SP 750
Branch Point to New Mirpur Reservoir - New Mirpur Reservoir
9 to 9a 11.8 Dia 150, SP 1,520
Sub Total 9,800
4. Banda Gazan Direction Connection with KKH - Branch Point to New Banda Gazan Reservoir
7 to 10 3.6 Dia 100, SP 2,090
Branch Point to New Banda Gazan Reservoir - New Banda Gazan Reservoir
10 to 10a 3.6 Dia 100, SP 1,270
Sub Total 3,360
Grand Total 25,640
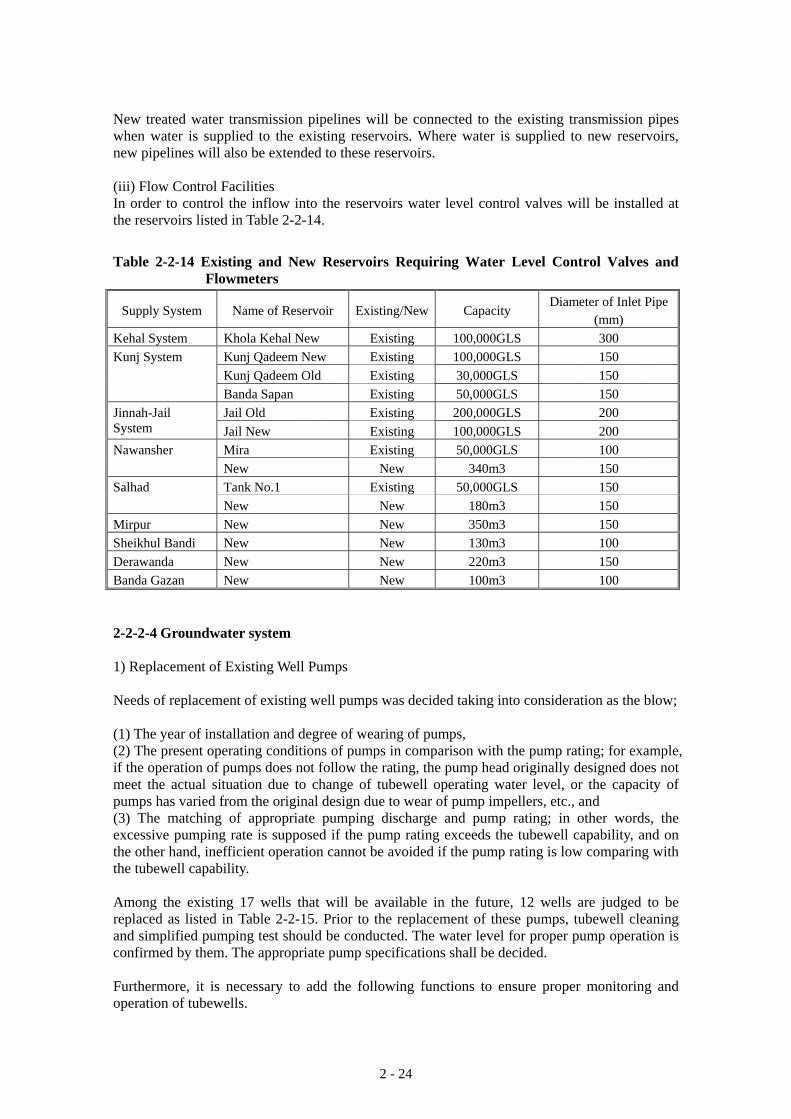
2 - 24
New treated water transmission pipelines will be connected to the existing transmission pipes when water is supplied to the existing reservoirs. Where water is supplied to new reservoirs, new pipelines will also be extended to these reservoirs. (iii) Flow Control Facilities In order to control the inflow into the reservoirs water level control valves will be installed at the reservoirs listed in Table 2-2-14.
Table 2-2-14 Existing and New Reservoirs Requiring Water Level Control Valves and Flowmeters
Supply System Name of Reservoir Existing/New Capacity Diameter of Inlet Pipe
(mm) Kehal System Khola Kehal New Existing 100,000GLS 300
Kunj Qadeem New Existing 100,000GLS 150 Kunj Qadeem Old Existing 30,000GLS 150
Kunj System
Banda Sapan Existing 50,000GLS 150 Jail Old Existing 200,000GLS 200 Jinnah-Jail
System Jail New Existing 100,000GLS 200 Mira Existing 50,000GLS 100 Nawansher New New 340m3 150 Tank No.1 Existing 50,000GLS 150 Salhad New New 180m3 150
Mirpur New New 350m3 150 Sheikhul Bandi New New 130m3 100 Derawanda New New 220m3 150 Banda Gazan New New 100m3 100 2-2-2-4 Groundwater system 1) Replacement of Existing Well Pumps Needs of replacement of existing well pumps was decided taking into consideration as the blow; (1) The year of installation and degree of wearing of pumps, (2) The present operating conditions of pumps in comparison with the pump rating; for example, if the operation of pumps does not follow the rating, the pump head originally designed does not meet the actual situation due to change of tubewell operating water level, or the capacity of pumps has varied from the original design due to wear of pump impellers, etc., and (3) The matching of appropriate pumping discharge and pump rating; in other words, the excessive pumping rate is supposed if the pump rating exceeds the tubewell capability, and on the other hand, inefficient operation cannot be avoided if the pump rating is low comparing with the tubewell capability. Among the existing 17 wells that will be available in the future, 12 wells are judged to be replaced as listed in Table 2-2-15. Prior to the replacement of these pumps, tubewell cleaning and simplified pumping test should be conducted. The water level for proper pump operation is confirmed by them. The appropriate pump specifications shall be decided. Furthermore, it is necessary to add the following functions to ensure proper monitoring and operation of tubewells.
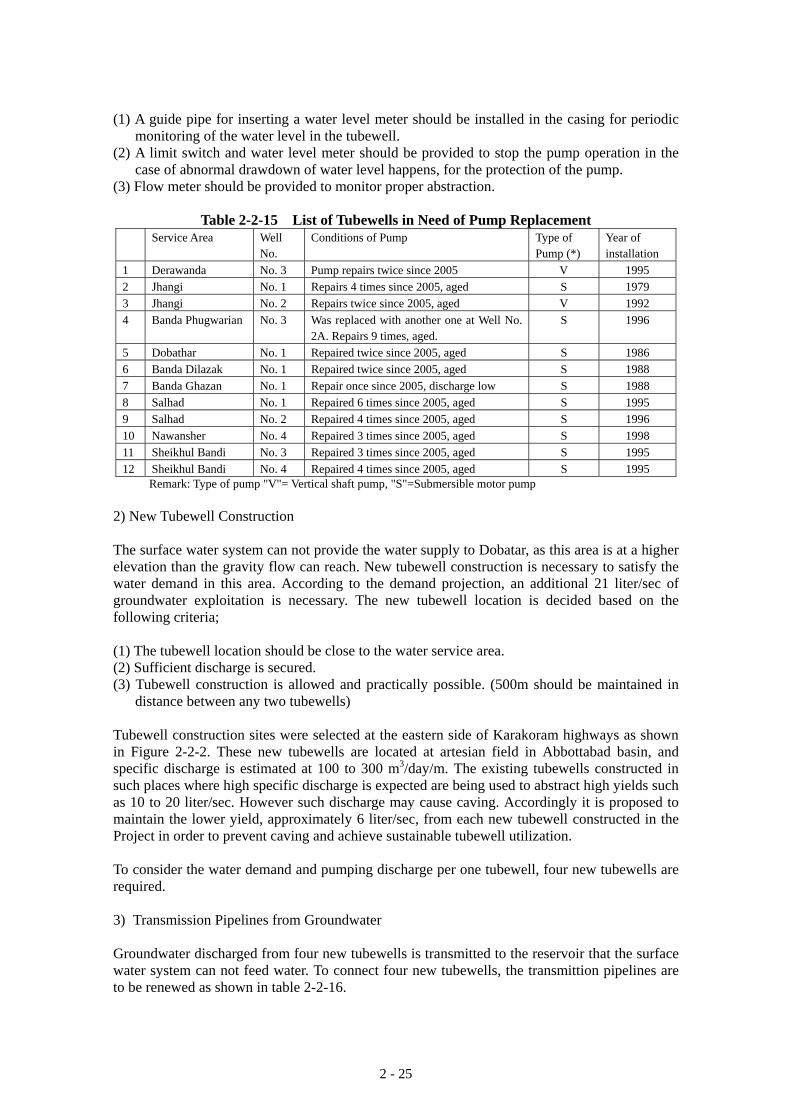
2 - 25
(1) A guide pipe for inserting a water level meter should be installed in the casing for periodic
monitoring of the water level in the tubewell. (2) A limit switch and water level meter should be provided to stop the pump operation in the
case of abnormal drawdown of water level happens, for the protection of the pump. (3) Flow meter should be provided to monitor proper abstraction.
Table 2-2-15 List of Tubewells in Need of Pump Replacement Service Area Well
No. Conditions of Pump Type of
Pump (*) Year of installation
1 Derawanda No. 3 Pump repairs twice since 2005 V 1995 2 Jhangi No. 1 Repairs 4 times since 2005, aged S 1979 3 Jhangi No. 2 Repairs twice since 2005, aged V 1992 4 Banda Phugwarian No. 3 Was replaced with another one at Well No.
2A. Repairs 9 times, aged. S 1996
5 Dobathar No. 1 Repaired twice since 2005, aged S 1986 6 Banda Dilazak No. 1 Repaired twice since 2005, aged S 1988 7 Banda Ghazan No. 1 Repair once since 2005, discharge low S 1988 8 Salhad No. 1 Repaired 6 times since 2005, aged S 1995 9 Salhad No. 2 Repaired 4 times since 2005, aged S 1996 10 Nawansher No. 4 Repaired 3 times since 2005, aged S 1998 11 Sheikhul Bandi No. 3 Repaired 3 times since 2005, aged S 1995 12 Sheikhul Bandi No. 4 Repaired 4 times since 2005, aged S 1995
Remark: Type of pump "V"= Vertical shaft pump, "S"=Submersible motor pump 2) New Tubewell Construction The surface water system can not provide the water supply to Dobatar, as this area is at a higher elevation than the gravity flow can reach. New tubewell construction is necessary to satisfy the water demand in this area. According to the demand projection, an additional 21 liter/sec of groundwater exploitation is necessary. The new tubewell location is decided based on the following criteria; (1) The tubewell location should be close to the water service area. (2) Sufficient discharge is secured. (3) Tubewell construction is allowed and practically possible. (500m should be maintained in
distance between any two tubewells) Tubewell construction sites were selected at the eastern side of Karakoram highways as shown in Figure 2-2-2. These new tubewells are located at artesian field in Abbottabad basin, and specific discharge is estimated at 100 to 300 m3/day/m. The existing tubewells constructed in such places where high specific discharge is expected are being used to abstract high yields such as 10 to 20 liter/sec. However such discharge may cause caving. Accordingly it is proposed to maintain the lower yield, approximately 6 liter/sec, from each new tubewell constructed in the Project in order to prevent caving and achieve sustainable tubewell utilization. To consider the water demand and pumping discharge per one tubewell, four new tubewells are required. 3) Transmission Pipelines from Groundwater
Groundwater discharged from four new tubewells is transmitted to the reservoir that the surface water system can not feed water. To connect four new tubewells, the transmittion pipelines are to be renewed as shown in table 2-2-16.
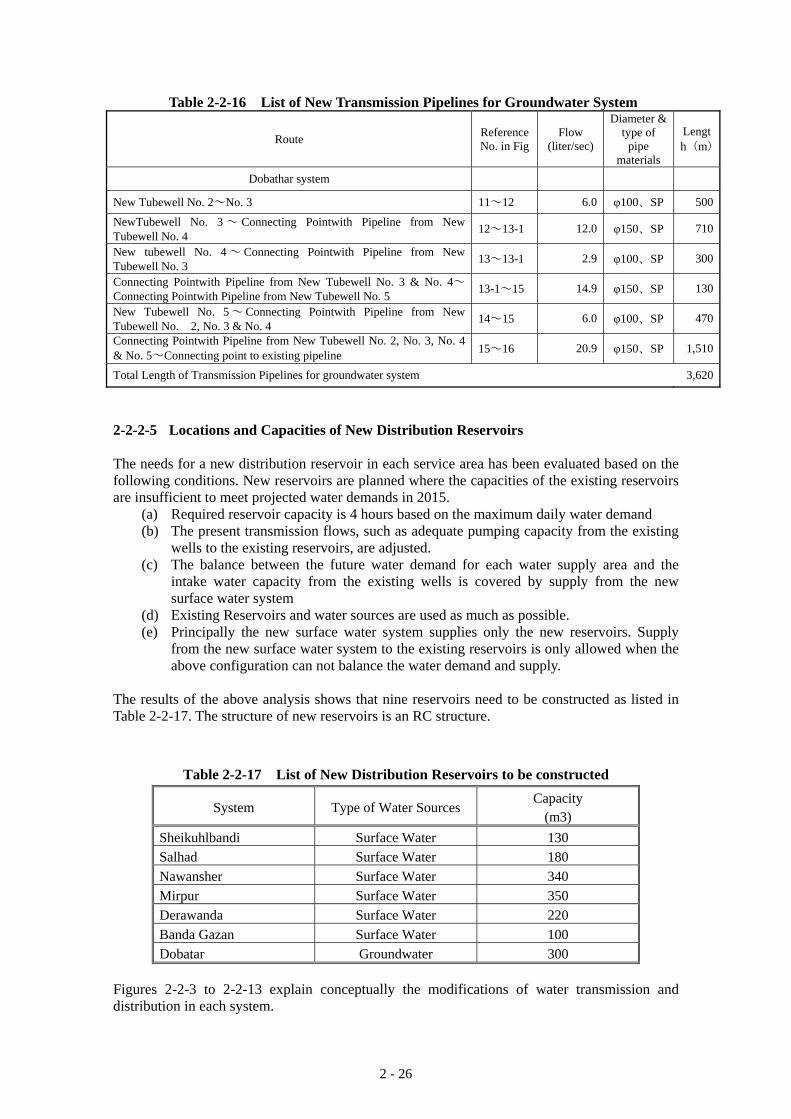
2 - 26
Table 2-2-16 List of New Transmission Pipelines for Groundwater System
Route Reference No. in Fig
Flow (liter/sec)
Diameter & type of
pipe materials
Length(m)
Dobathar system
New Tubewell No. 2~No. 3 11~12 6.0 φ100、SP 500
NewTubewell No. 3 ~ Connecting Pointwith Pipeline from New Tubewell No. 4 12~13-1 12.0 φ150、SP 710
New tubewell No. 4 ~ Connecting Pointwith Pipeline from New Tubewell No. 3 13~13-1 2.9 φ100、SP 300
Connecting Pointwith Pipeline from New Tubewell No. 3 & No. 4~Connecting Pointwith Pipeline from New Tubewell No. 5 13-1~15 14.9 φ150、SP 130
New Tubewell No. 5~Connecting Pointwith Pipeline from New Tubewell No. 2, No. 3 & No. 4 14~15 6.0 φ100、SP 470
Connecting Pointwith Pipeline from New Tubewell No. 2, No. 3, No. 4 & No. 5~Connecting point to existing pipeline 15~16 20.9 φ150、SP 1,510
Total Length of Transmission Pipelines for groundwater system 3,620
2-2-2-5 Locations and Capacities of New Distribution Reservoirs The needs for a new distribution reservoir in each service area has been evaluated based on the following conditions. New reservoirs are planned where the capacities of the existing reservoirs are insufficient to meet projected water demands in 2015.
(a) Required reservoir capacity is 4 hours based on the maximum daily water demand (b) The present transmission flows, such as adequate pumping capacity from the existing
wells to the existing reservoirs, are adjusted. (c) The balance between the future water demand for each water supply area and the
intake water capacity from the existing wells is covered by supply from the new surface water system
(d) Existing Reservoirs and water sources are used as much as possible. (e) Principally the new surface water system supplies only the new reservoirs. Supply
from the new surface water system to the existing reservoirs is only allowed when the above configuration can not balance the water demand and supply.
The results of the above analysis shows that nine reservoirs need to be constructed as listed in Table 2-2-17. The structure of new reservoirs is an RC structure.
Table 2-2-17 List of New Distribution Reservoirs to be constructed
System Type of Water Sources Capacity
(m3) Sheikuhlbandi Surface Water 130 Salhad Surface Water 180 Nawansher Surface Water 340 Mirpur Surface Water 350 Derawanda Surface Water 220 Banda Gazan Surface Water 100 Dobatar Groundwater 300
Figures 2-2-3 to 2-2-13 explain conceptually the modifications of water transmission and distribution in each system.
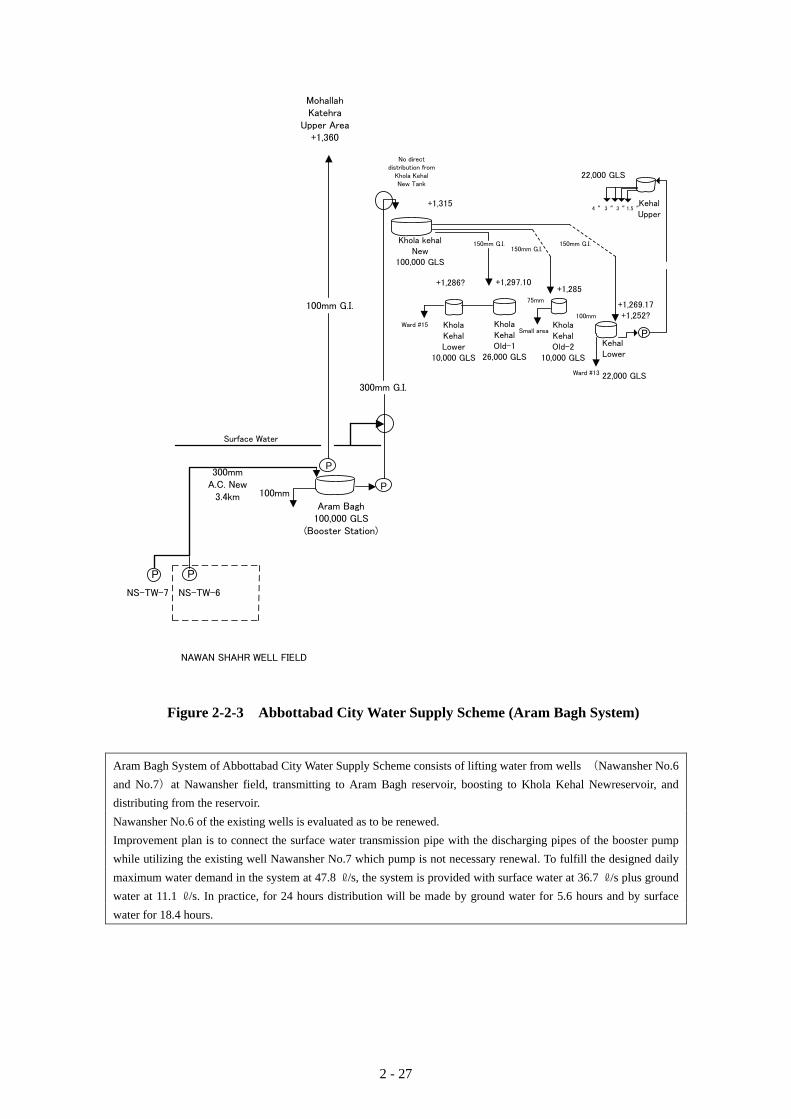
2 - 27
MohallahKatehra
Upper Area+1,360
300mmA.C. New
3.4km
NS-TW-7 NS-TW-6
100mm
Aram Bagh100,000 GLS
(Booster Station)
P
P
100mm G.I.
NAWAN SHAHR WELL FIELD
300mm G.I.
PKholaKehalLower
10,000 GLS
KholaKehalOld-1
26,000 GLS
Ward #15Small area
KholaKehalOld-2
10,000 GLS
75mm
+1,286? +1,297.10+1,285
KehalLower
22,000 GLSWard #13
100mm
Khola kehalNew
100,000 GLS
150mm G.I.150mm G.I.
150mm G.I.
No directdistribution from
Khola KehalNew Tank
+1,315
22,000 GLS
KehalUpper
4〝 3〝 3〝 1.5〝
+1,269.17+1,252?
Surface Water
P P
Figure 2-2-3 Abbottabad City Water Supply Scheme (Aram Bagh System)
Aram Bagh System of Abbottabad City Water Supply Scheme consists of lifting water from wells (Nawansher No.6 and No.7)at Nawansher field, transmitting to Aram Bagh reservoir, boosting to Khola Kehal Newreservoir, and distributing from the reservoir. Nawansher No.6 of the existing wells is evaluated as to be renewed. Improvement plan is to connect the surface water transmission pipe with the discharging pipes of the booster pump while utilizing the existing well Nawansher No.7 which pump is not necessary renewal. To fulfill the designed daily maximum water demand in the system at 47.8 ℓ/s, the system is provided with surface water at 36.7 ℓ/s plus ground water at 11.1 ℓ/s. In practice, for 24 hours distribution will be made by ground water for 5.6 hours and by surface water for 18.4 hours.
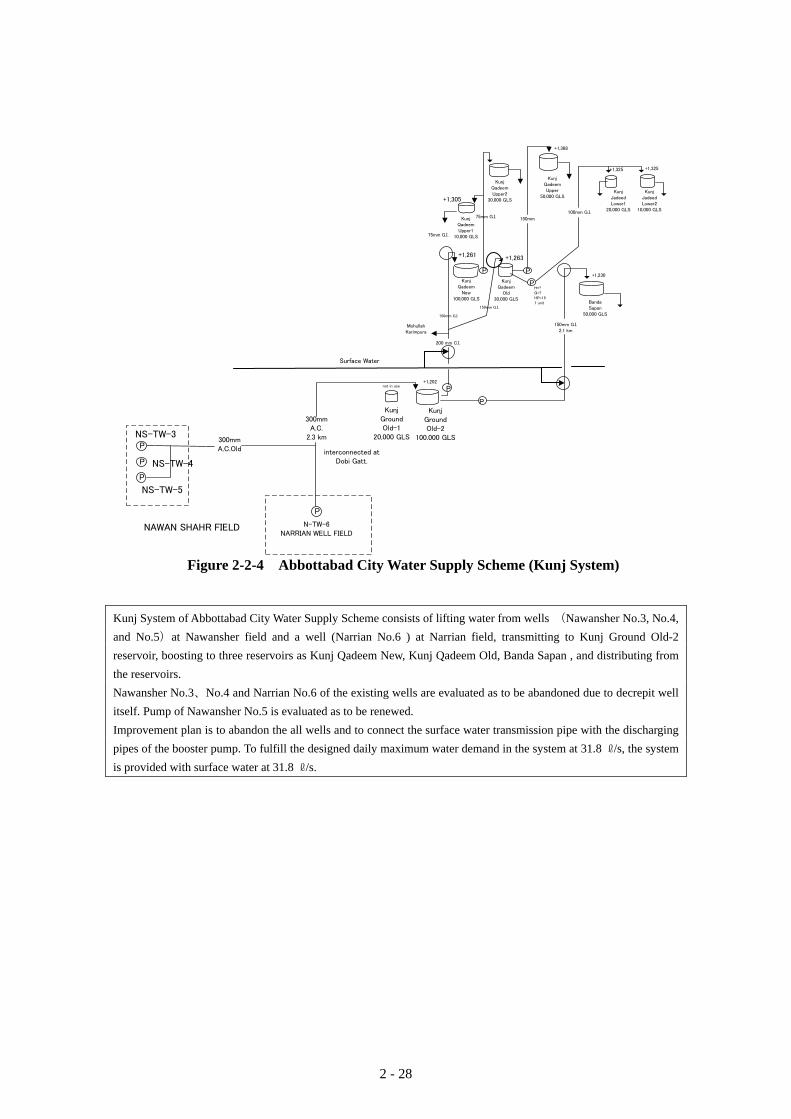
2 - 28
KunjGroundOld-2
100.000 GLS
P
P
P P
P
75mm G.I.
+1,305
KunjQadeemUpper1
10,000 GLS
75mm G.I. 150mm
100mm G.I.
KunjJadeedLower1
20,000 GLS
KunjJadeedLower2
10,000 GLS
KunjQadeemUpper2
30,000 GLS
KunjQadeemUpper
50,000 GLS
+1,368
+1,325 +1,325
150mm G.I.2.1 km
200 mm C.I.
150mm G.I.
150mm G.I.
KunjQadeem
New100,000 GLS
KunjQadeem
Old30,000 GLS
H=?Q=?HP=151 unit Banda
Sapan50,000 GLS
+1,230
+1,261 +1,263
300mmA.C.Old
N-TW-6NARRIAN WELL FIELD
300mmA.C.
2.3 km
interconnected at Dobi Gatt.
KunjGroundOld-1
20,000 GLS
+1,202not in use
MohullahKarimpura
Surface Water
P
P
P
P
NS-TW-3
NS-TW-4
NS-TW-5
NAWAN SHAHR FIELD
Figure 2-2-4 Abbottabad City Water Supply Scheme (Kunj System)
Kunj System of Abbottabad City Water Supply Scheme consists of lifting water from wells (Nawansher No.3, No.4, and No.5)at Nawansher field and a well (Narrian No.6 ) at Narrian field, transmitting to Kunj Ground Old-2 reservoir, boosting to three reservoirs as Kunj Qadeem New, Kunj Qadeem Old, Banda Sapan , and distributing from the reservoirs. Nawansher No.3、No.4 and Narrian No.6 of the existing wells are evaluated as to be abandoned due to decrepit well itself. Pump of Nawansher No.5 is evaluated as to be renewed. Improvement plan is to abandon the all wells and to connect the surface water transmission pipe with the discharging pipes of the booster pump. To fulfill the designed daily maximum water demand in the system at 31.8 ℓ/s, the system is provided with surface water at 31.8 ℓ/s.
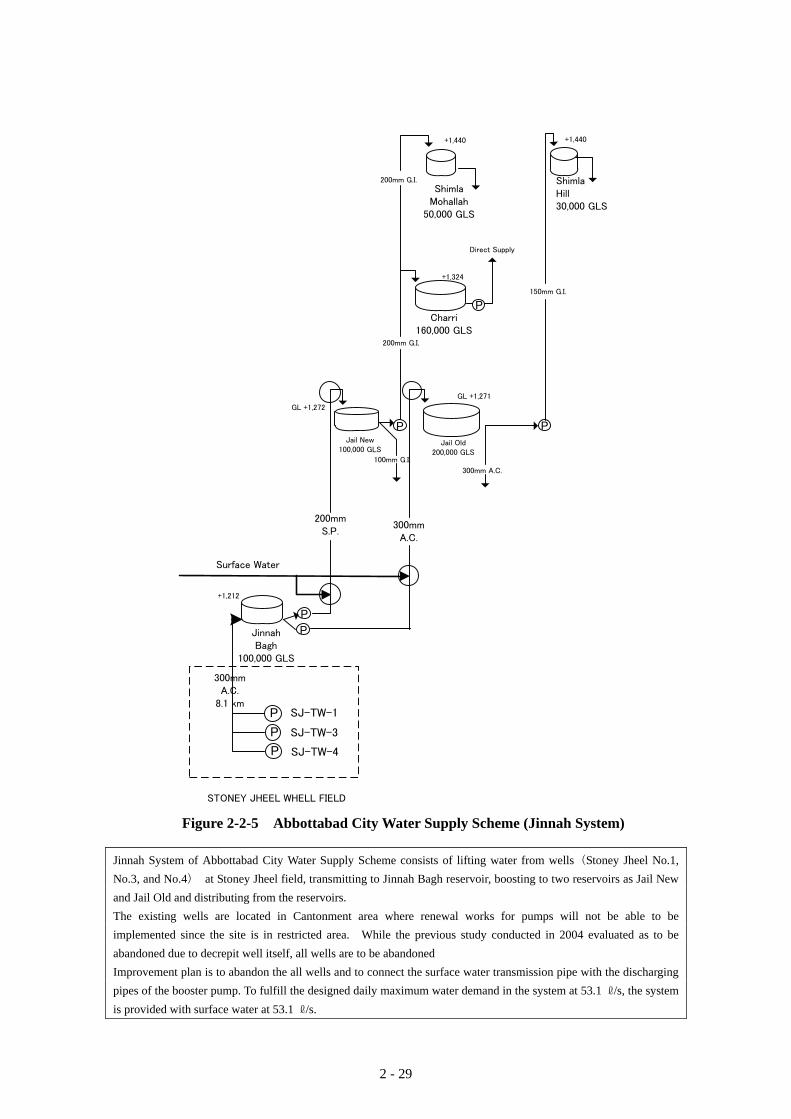
2 - 29
200mm G.I.
200mm G.I.
+1,324
Charri160,000 GLS
P
+1,440 +1,440
ShimlaMohallah
50,000 GLS
ShimlaHill30,000 GLS
150mm G.I.
Direct Supply
P P
SJ-TW-1
SJ-TW-3
SJ-TW-4
STONEY JHEEL WHELL FIELD
300mmA.C.
200mmS.P.
Jail New100,000 GLS
Jail Old200,000 GLS
100mm G.I.
300mm A.C.
GL +1,271
P
P
300mmA.C.
8.1 km
JinnahBagh
100,000 GLS
+1,212
GL +1,272
Surface Water
P
P
P
Figure 2-2-5 Abbottabad City Water Supply Scheme (Jinnah System)
Jinnah System of Abbottabad City Water Supply Scheme consists of lifting water from wells(Stoney Jheel No.1, No.3, and No.4) at Stoney Jheel field, transmitting to Jinnah Bagh reservoir, boosting to two reservoirs as Jail New and Jail Old and distributing from the reservoirs. The existing wells are located in Cantonment area where renewal works for pumps will not be able to be implemented since the site is in restricted area. While the previous study conducted in 2004 evaluated as to be abandoned due to decrepit well itself, all wells are to be abandoned Improvement plan is to abandon the all wells and to connect the surface water transmission pipe with the discharging pipes of the booster pump. To fulfill the designed daily maximum water demand in the system at 53.1 ℓ/s, the system is provided with surface water at 53.1 ℓ/s.
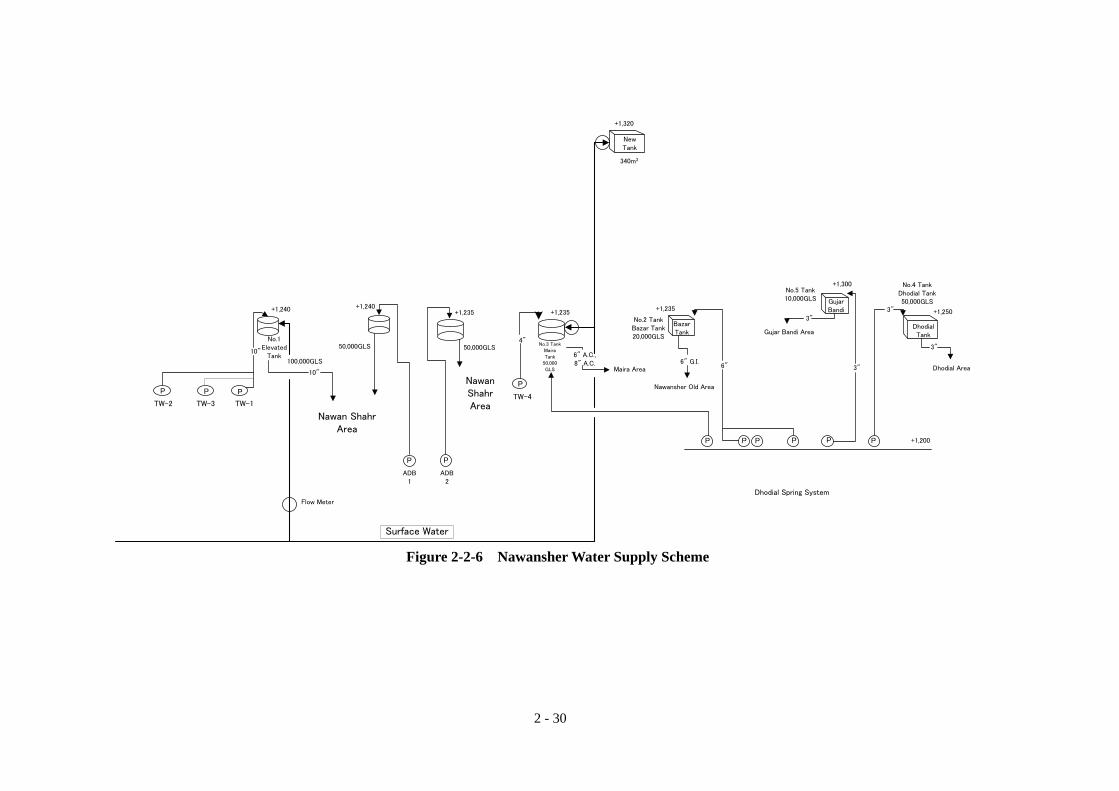
2 - 30
P P P P P
TW-4
4"
+1,235
No.3 TankMaira Tank
50,000GLS
6" A.C.,8" A.C.
Maira Area
No.2 TankBazar Tank20,000GLS
+1,235
BazarTank
6" G.I.
Nawansher Old Area
6"
P
Dhodial Spring System
3"
3"
3"
No.5 Tank10,000GLS Gujar
Bandi
DhodialTankGujar Bandi Area
3"
No.4 TankDhodial Tank50,000GLS
+1,250
Dhodial Area
+1,300
+1,200
P
TW-2 TW-3 TW-1
10"
No.1Elevated
Tank
+1,240
100,000GLS
10"
P P P
PP
+1,240+1,235
ADB1
ADB2
50,000GLS 50,000GLS
NewTank
+1,320
340m3
Surface Water
Flow Meter
Nawan Shahr Area
Nawan Shahr Area
Figure 2-2-6 Nawansher Water Supply Scheme

2 - 31
Nawansher Water Supply Scheme consists of lifting water from wells (Nawansher No.1, No.2, No.3, and No.4)at Nawansher field and a spring located at southeast of the are, transmitting to five reservoirs, and distributing from the reservoirs. Nawansher No.4 of the existing wells is evaluated as to be renewed. Two wells and two reservoirs are under construction by ADB fund. The elevated tank located in the commercial area leaks water caused due to the 2005 earthquake. The proposed improvement plan is to intake all of the existing wells (Nawansher No.1, No.2, and No.3) and a spring. Thus, Nawansher No.4 pump is necessary to be renewed. New two wells under construction are also utilized. The surface water transmission pipe is to be connected to the existing reservoirs and to new proposed reservoir. To fulfill the designed daily maximum water demand in the system at 52.5 ℓ/s, the system is provided with ground water at 44.4 ℓ/s plus surface water at 8.1 ℓ/s. The amount of surface water is allocated 0.8 ℓ/s to the elevated tank, 2.4 ℓ/s to the existing reservoir and 4.9 ℓ/s to the proposed reservoir. The proposed new reservoir is to distribute surface water to surrounding area of the built up area since new two wells and reservoirs under construction funded by ADB are planned to supply water to the center and the built up area.
Figure 2-2-7 Abbottabad District Water Supply Scheme (Sheikhul Bandi System)
Sheikhul Bandi Water Supply System of Abbottabad District Water Supply Scheme consists of lifting water from wells (Sheikhul Bandi No.3, No.4, and new No.2 constructed with the earthquake recovery fund)at Sheikhul Bandi area, transmitting to three reservoirs (No.1 and No.3, and new reservoir constructed with the earthquake recovery fund as No.2) and distributing from the reservoirs. The proposed improvement plan is to intake all of the existing wells (Sheikhul Bandi No.3, No.4, and No.2) . However, Sheikhul Bandi No.3 and No.4 pumps are necessary to be renewed. The surface water transmission pipe is to be connected to the existing inlet pipes to existing reservoirs No.3. The proposed reservoir and the No.3 reservoir are to be connected. The both reservoirs are used for surface water supply. To fulfill the designed daily maximum water demand in the system at 30.8 ℓ/s, the system is provided with ground water at 13.1 ℓ/s plus surface water at 17.7 ℓ/s.
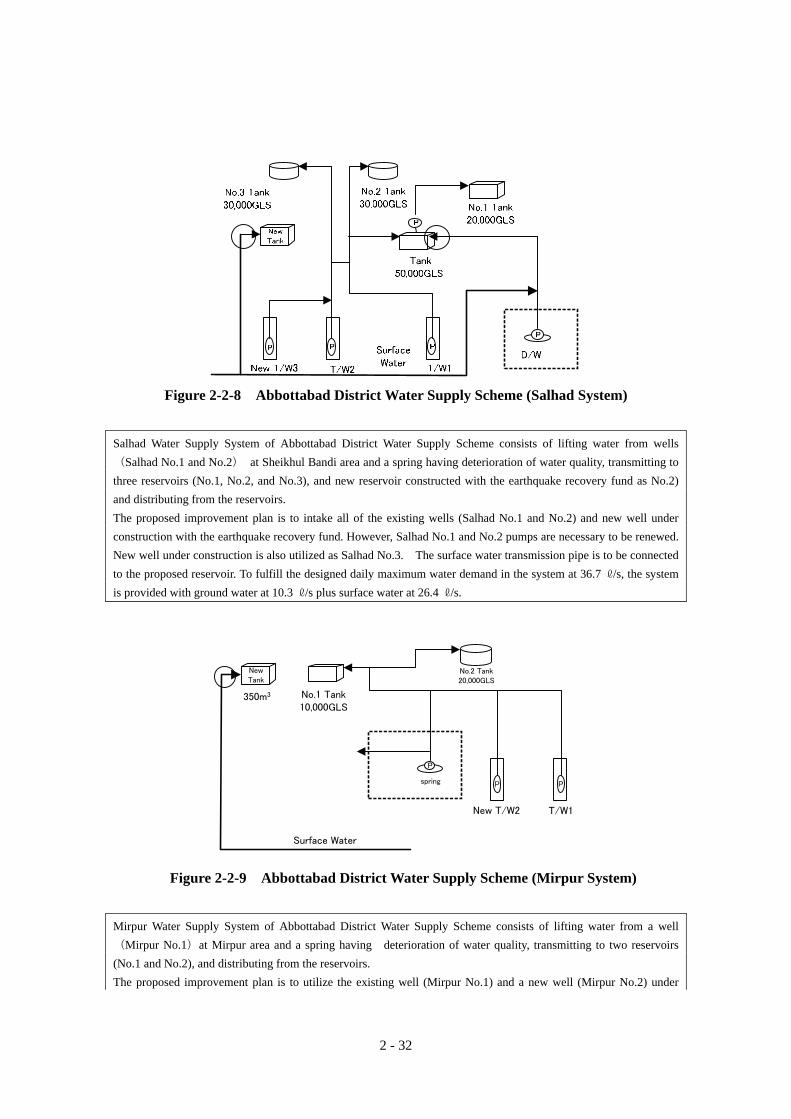
2 - 32
Figure 2-2-8 Abbottabad District Water Supply Scheme (Salhad System)
Salhad Water Supply System of Abbottabad District Water Supply Scheme consists of lifting water from wells (Salhad No.1 and No.2) at Sheikhul Bandi area and a spring having deterioration of water quality, transmitting to three reservoirs (No.1, No.2, and No.3), and new reservoir constructed with the earthquake recovery fund as No.2) and distributing from the reservoirs. The proposed improvement plan is to intake all of the existing wells (Salhad No.1 and No.2) and new well under construction with the earthquake recovery fund. However, Salhad No.1 and No.2 pumps are necessary to be renewed. New well under construction is also utilized as Salhad No.3. The surface water transmission pipe is to be connected to the proposed reservoir. To fulfill the designed daily maximum water demand in the system at 36.7 ℓ/s, the system is provided with ground water at 10.3 ℓ/s plus surface water at 26.4 ℓ/s.
No.2 Tank20,000GLS
No.1 Tank10,000GLS
spring
P
T/W1
PP
New T/W2
NewTank
Surface Water
350m3
Figure 2-2-9 Abbottabad District Water Supply Scheme (Mirpur System)
Mirpur Water Supply System of Abbottabad District Water Supply Scheme consists of lifting water from a well (Mirpur No.1)at Mirpur area and a spring having deterioration of water quality, transmitting to two reservoirs (No.1 and No.2), and distributing from the reservoirs. The proposed improvement plan is to utilize the existing well (Mirpur No.1) and a new well (Mirpur No.2) under
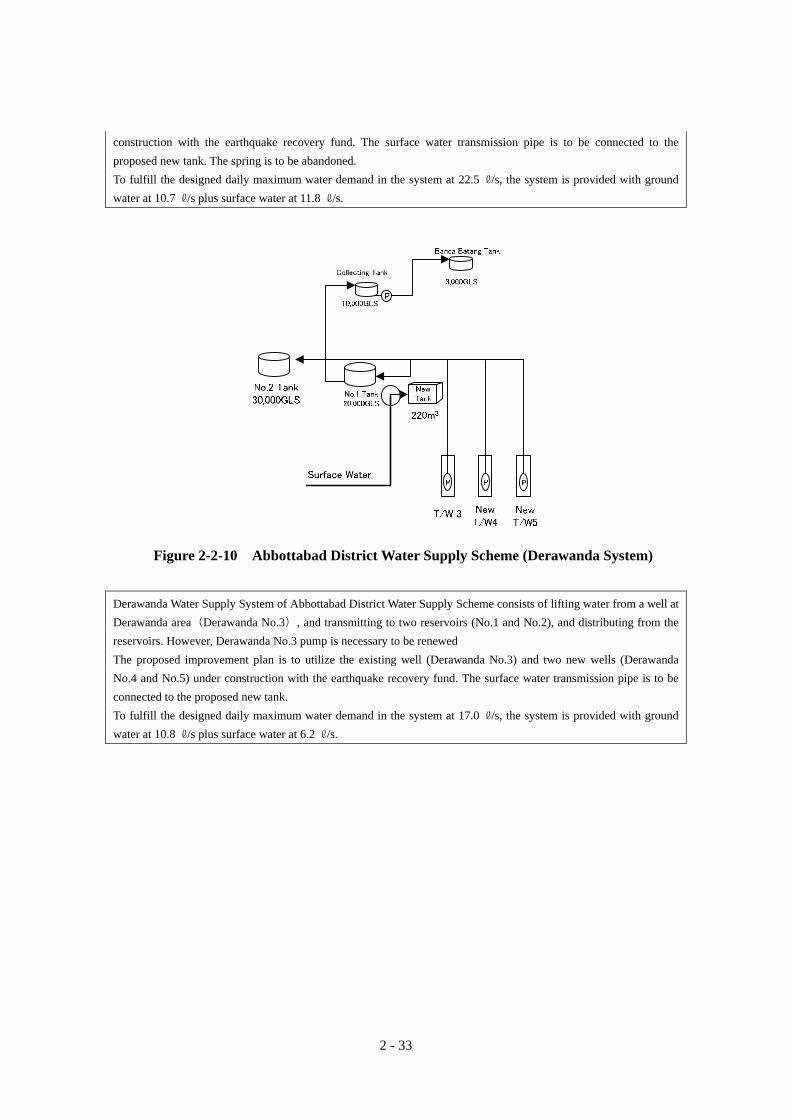
2 - 33
construction with the earthquake recovery fund. The surface water transmission pipe is to be connected to the proposed new tank. The spring is to be abandoned. To fulfill the designed daily maximum water demand in the system at 22.5 ℓ/s, the system is provided with ground water at 10.7 ℓ/s plus surface water at 11.8 ℓ/s.
Figure 2-2-10 Abbottabad District Water Supply Scheme (Derawanda System)
Derawanda Water Supply System of Abbottabad District Water Supply Scheme consists of lifting water from a well at Derawanda area(Derawanda No.3), and transmitting to two reservoirs (No.1 and No.2), and distributing from the reservoirs. However, Derawanda No.3 pump is necessary to be renewed The proposed improvement plan is to utilize the existing well (Derawanda No.3) and two new wells (Derawanda No.4 and No.5) under construction with the earthquake recovery fund. The surface water transmission pipe is to be connected to the proposed new tank. To fulfill the designed daily maximum water demand in the system at 17.0 ℓ/s, the system is provided with ground water at 10.8 ℓ/s plus surface water at 6.2 ℓ/s.
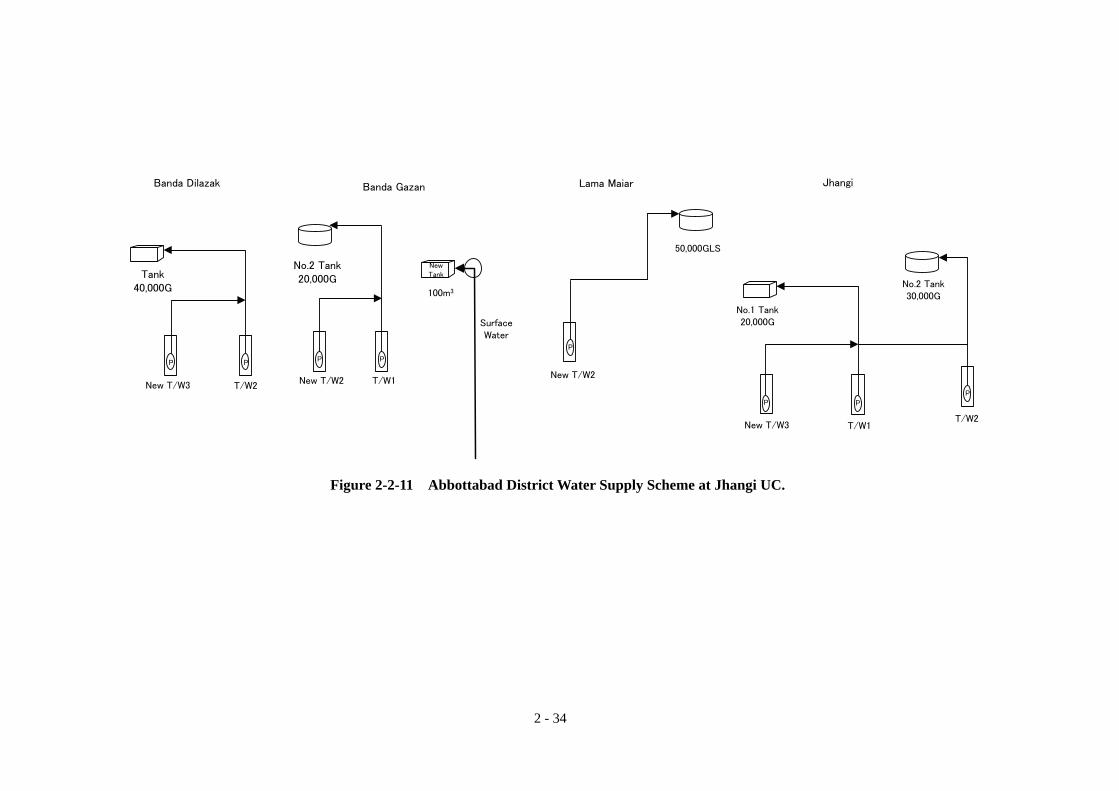
2 - 34
T/W2
PP
New T/W3 T/W1
PP
New T/W2
50,000GLS
No.1 Tank20,000G
P
No.2 Tank30,000G
T/W2T/W1
PP
New T/W3
Lama Maiar JhangiBanda Gazan
P
New T/W2
100m3
NewTank
No.2 Tank20,000G
Banda Dilazak
Tank 40,000G
Surface Water
Figure 2-2-11 Abbottabad District Water Supply Scheme at Jhangi UC.
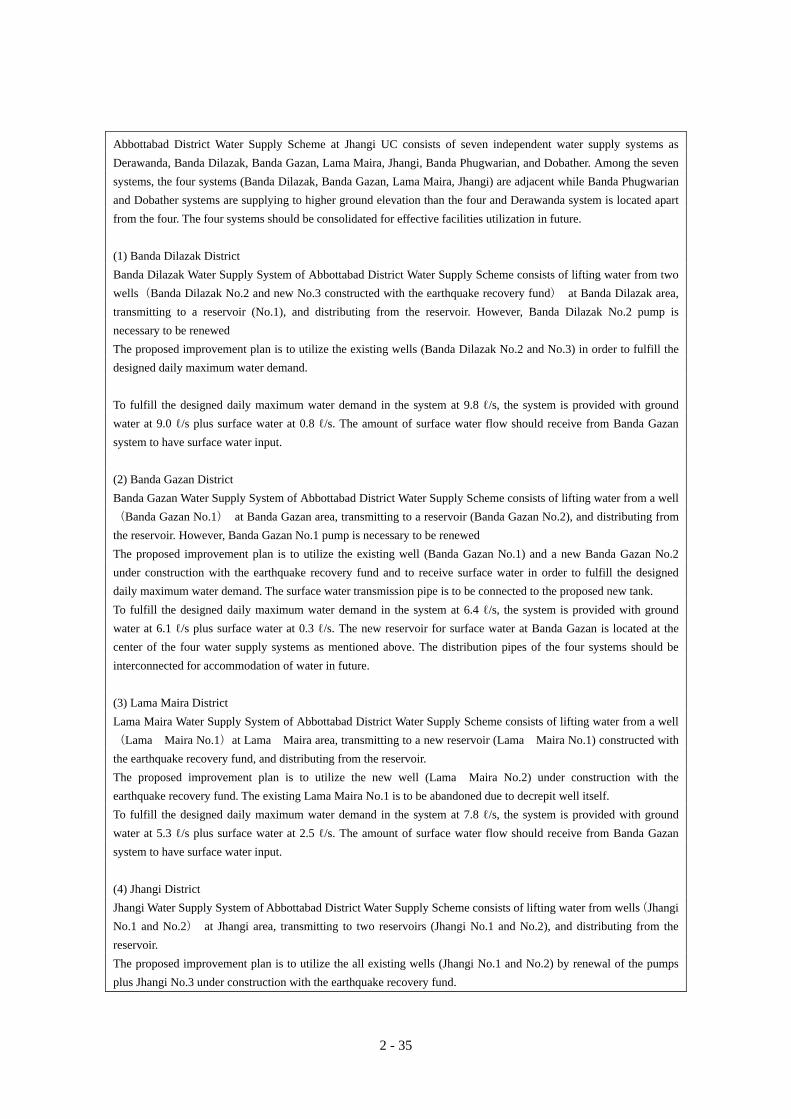
2 - 35
Abbottabad District Water Supply Scheme at Jhangi UC consists of seven independent water supply systems as Derawanda, Banda Dilazak, Banda Gazan, Lama Maira, Jhangi, Banda Phugwarian, and Dobather. Among the seven systems, the four systems (Banda Dilazak, Banda Gazan, Lama Maira, Jhangi) are adjacent while Banda Phugwarian and Dobather systems are supplying to higher ground elevation than the four and Derawanda system is located apart from the four. The four systems should be consolidated for effective facilities utilization in future. (1) Banda Dilazak District Banda Dilazak Water Supply System of Abbottabad District Water Supply Scheme consists of lifting water from two wells(Banda Dilazak No.2 and new No.3 constructed with the earthquake recovery fund) at Banda Dilazak area, transmitting to a reservoir (No.1), and distributing from the reservoir. However, Banda Dilazak No.2 pump is necessary to be renewed The proposed improvement plan is to utilize the existing wells (Banda Dilazak No.2 and No.3) in order to fulfill the designed daily maximum water demand. To fulfill the designed daily maximum water demand in the system at 9.8 ℓ/s, the system is provided with ground water at 9.0 ℓ/s plus surface water at 0.8 ℓ/s. The amount of surface water flow should receive from Banda Gazan system to have surface water input. (2) Banda Gazan District Banda Gazan Water Supply System of Abbottabad District Water Supply Scheme consists of lifting water from a well(Banda Gazan No.1) at Banda Gazan area, transmitting to a reservoir (Banda Gazan No.2), and distributing from the reservoir. However, Banda Gazan No.1 pump is necessary to be renewed The proposed improvement plan is to utilize the existing well (Banda Gazan No.1) and a new Banda Gazan No.2 under construction with the earthquake recovery fund and to receive surface water in order to fulfill the designed daily maximum water demand. The surface water transmission pipe is to be connected to the proposed new tank. To fulfill the designed daily maximum water demand in the system at 6.4 ℓ/s, the system is provided with ground water at 6.1 ℓ/s plus surface water at 0.3 ℓ/s. The new reservoir for surface water at Banda Gazan is located at the center of the four water supply systems as mentioned above. The distribution pipes of the four systems should be interconnected for accommodation of water in future. (3) Lama Maira District Lama Maira Water Supply System of Abbottabad District Water Supply Scheme consists of lifting water from a well (Lama Maira No.1)at Lama Maira area, transmitting to a new reservoir (Lama Maira No.1) constructed with the earthquake recovery fund, and distributing from the reservoir. The proposed improvement plan is to utilize the new well (Lama Maira No.2) under construction with the earthquake recovery fund. The existing Lama Maira No.1 is to be abandoned due to decrepit well itself. To fulfill the designed daily maximum water demand in the system at 7.8 ℓ/s, the system is provided with ground water at 5.3 ℓ/s plus surface water at 2.5 ℓ/s. The amount of surface water flow should receive from Banda Gazan system to have surface water input. (4) Jhangi District Jhangi Water Supply System of Abbottabad District Water Supply Scheme consists of lifting water from wells(Jhangi No.1 and No.2) at Jhangi area, transmitting to two reservoirs (Jhangi No.1 and No.2), and distributing from the reservoir. The proposed improvement plan is to utilize the all existing wells (Jhangi No.1 and No.2) by renewal of the pumps plus Jhangi No.3 under construction with the earthquake recovery fund.
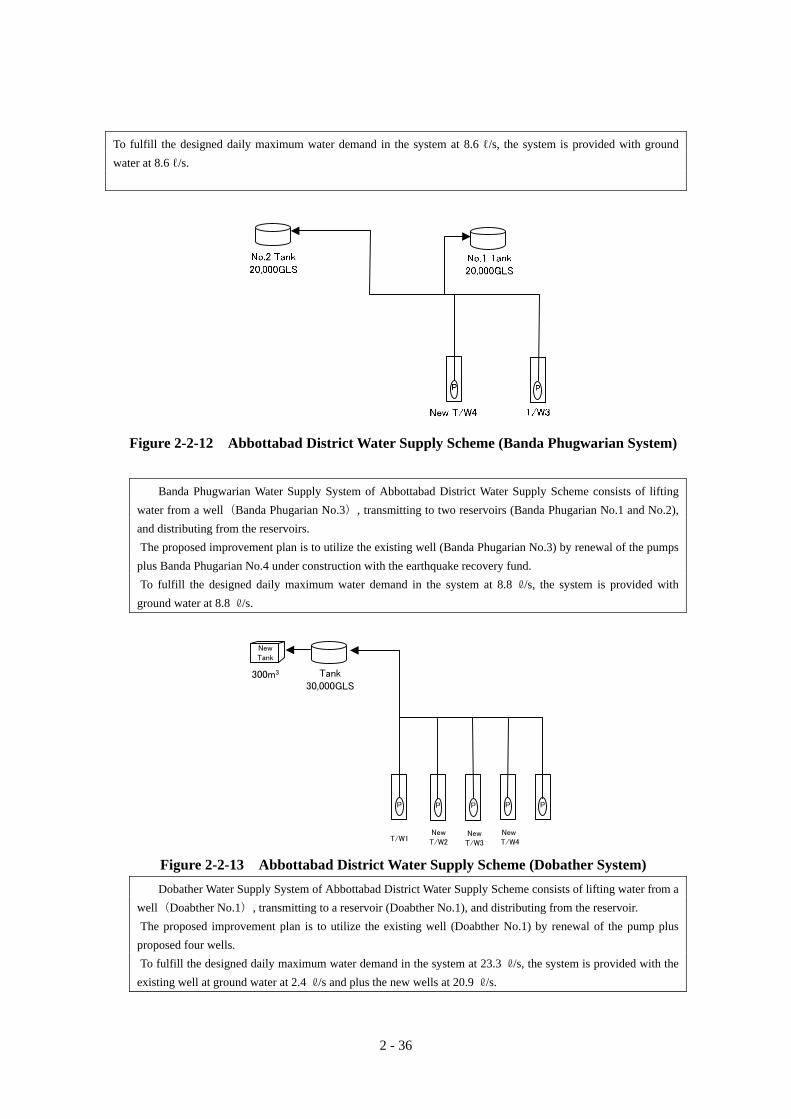
2 - 36
To fulfill the designed daily maximum water demand in the system at 8.6 ℓ/s, the system is provided with ground water at 8.6 ℓ/s.
Figure 2-2-12 Abbottabad District Water Supply Scheme (Banda Phugwarian System)
Banda Phugwarian Water Supply System of Abbottabad District Water Supply Scheme consists of lifting water from a well(Banda Phugarian No.3), transmitting to two reservoirs (Banda Phugarian No.1 and No.2), and distributing from the reservoirs. The proposed improvement plan is to utilize the existing well (Banda Phugarian No.3) by renewal of the pumps
plus Banda Phugarian No.4 under construction with the earthquake recovery fund. To fulfill the designed daily maximum water demand in the system at 8.8 ℓ/s, the system is provided with
ground water at 8.8 ℓ/s.
Tank30,000GLS
T/W1
P P P P P
NewTank
300m3
New T/W2
New T/W3
NewT/W4
Figure 2-2-13 Abbottabad District Water Supply Scheme (Dobather System) Dobather Water Supply System of Abbottabad District Water Supply Scheme consists of lifting water from a
well(Doabther No.1), transmitting to a reservoir (Doabther No.1), and distributing from the reservoir. The proposed improvement plan is to utilize the existing well (Doabther No.1) by renewal of the pump plus
proposed four wells. To fulfill the designed daily maximum water demand in the system at 23.3 ℓ/s, the system is provided with the
existing well at ground water at 2.4 ℓ/s and plus the new wells at 20.9 ℓ/s.
2 - 37
2-2-3 Outline Design Drawings Based on the basic plan, the outline design drawings are prepared and shown in the succeeding paper. The list of the outline design drawings is as follows;
Surface Water System
Drawing No. 1 Namly Intake Plan 2 Gaya Intake Plan 3 Bagh Intake Plan 4 Bandi Intake Plan 5 Intake Structure 6 Structural and Piping Drawing of Bandi Intake 7 System Flow 8 General Plan of Water Treatment Plant 9 General Plan of Sheikhul Bandi Service Reservoir 10 General Plan of Salhad Service Reservoir 11 General Plan of Nawanshar Service Reservoir 12 General Plan of Derawanda Service Reservoir 13 General Plan of Mirpur Service Reservoir 14 General Plan of Banda Ghazan Service Reservoir 15 Typical Structure of Service Reservoir
Groundwater System Drawing No.
1 Tubewell Pump Station General Plan (New) 2 Tubewell Pump Piping Plan (New) 3 Tubewell Pump Piping Plan (Existing) 4 General Plan of Dobathar Service Reservoir

2 - 38
Surface Water System
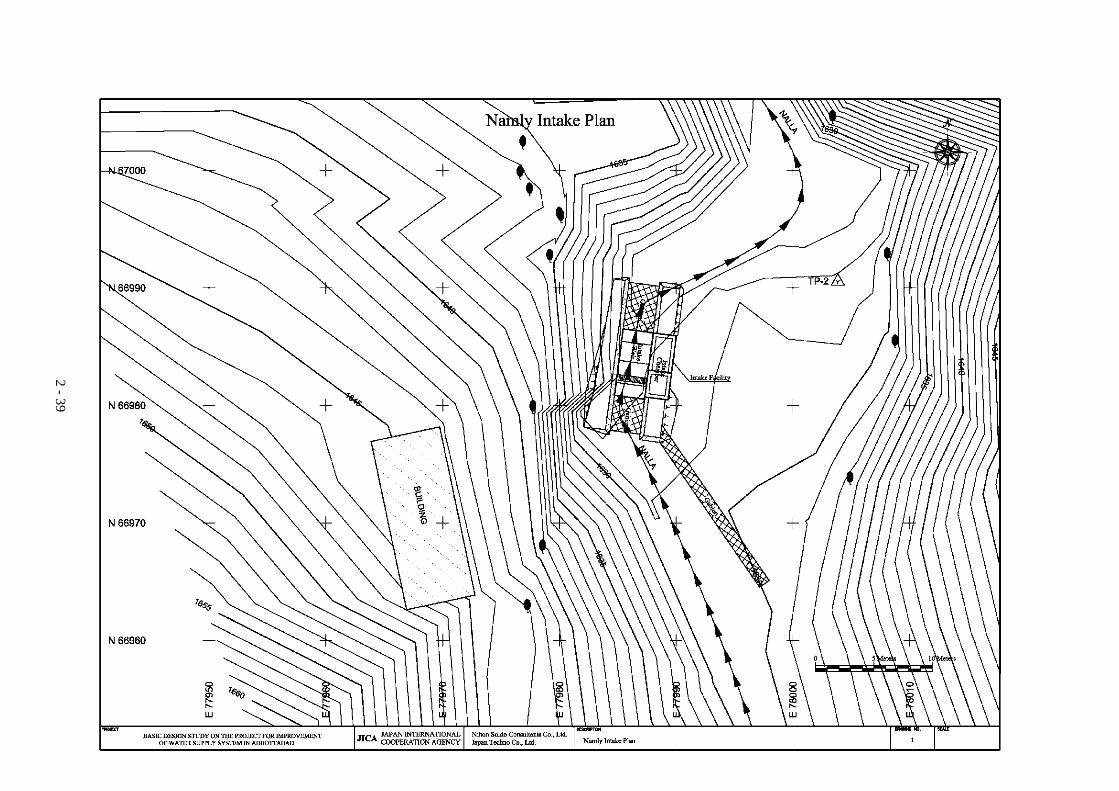
2 - 39
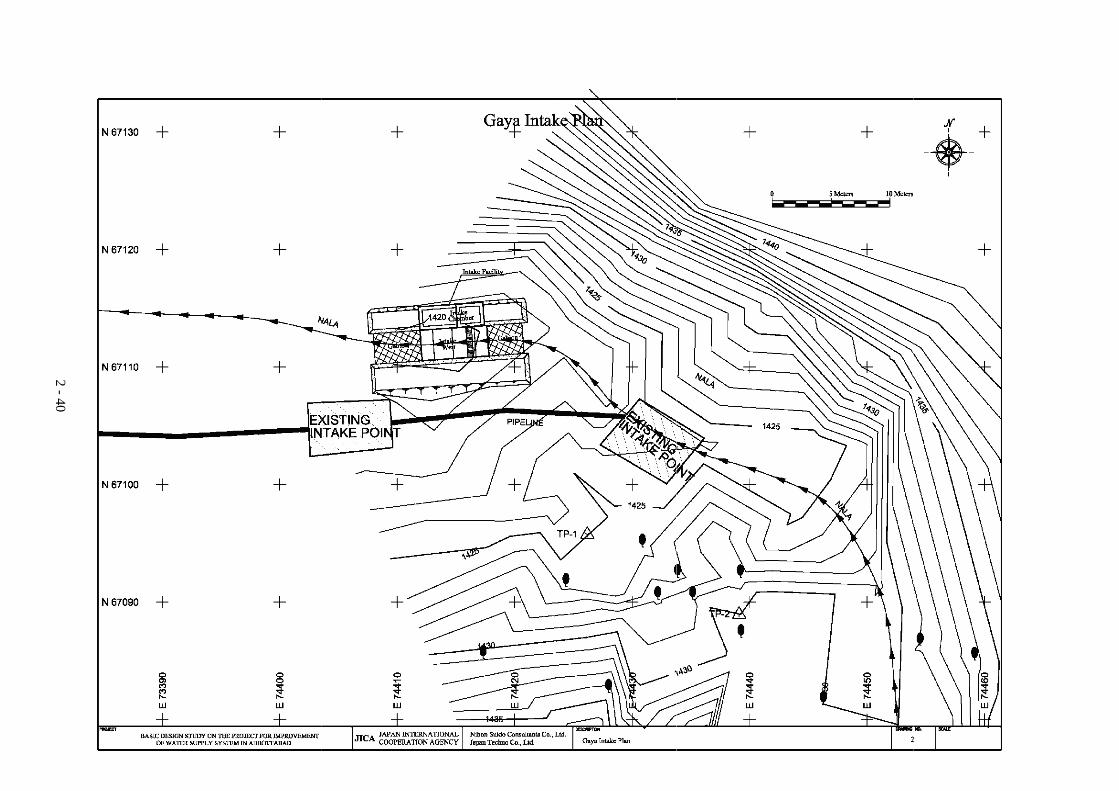
2 - 40
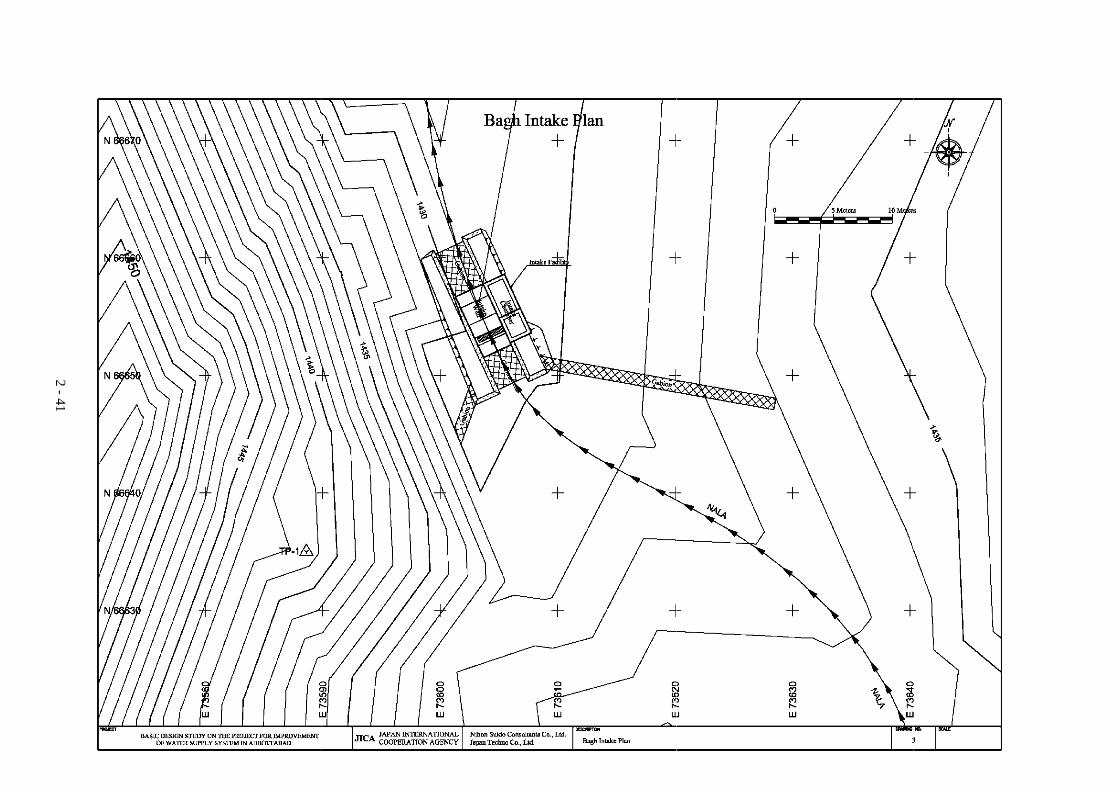
2 - 41
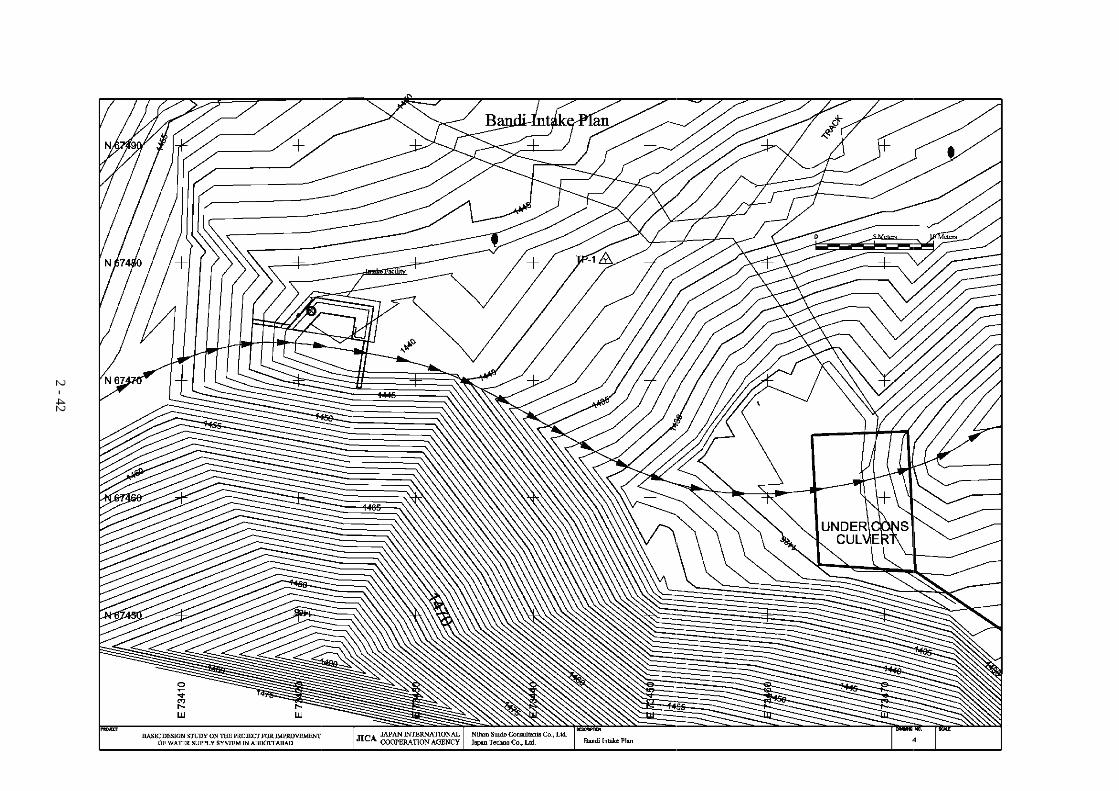
2 - 42
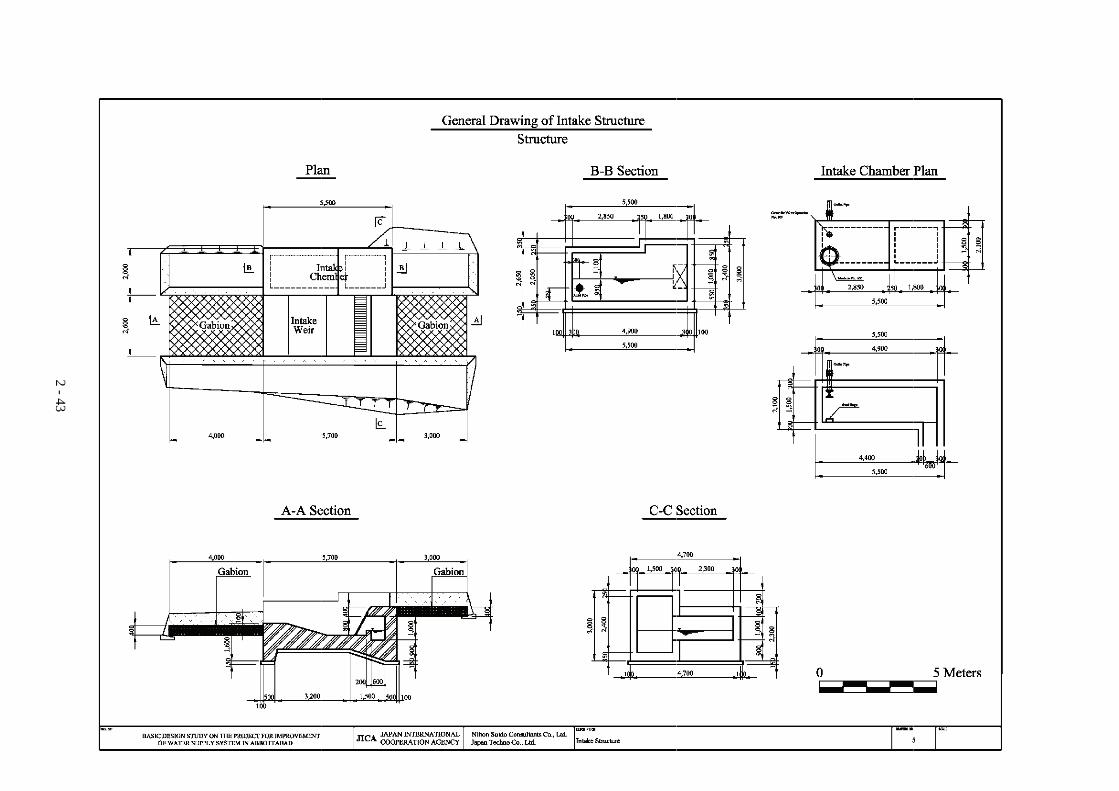
2 - 43
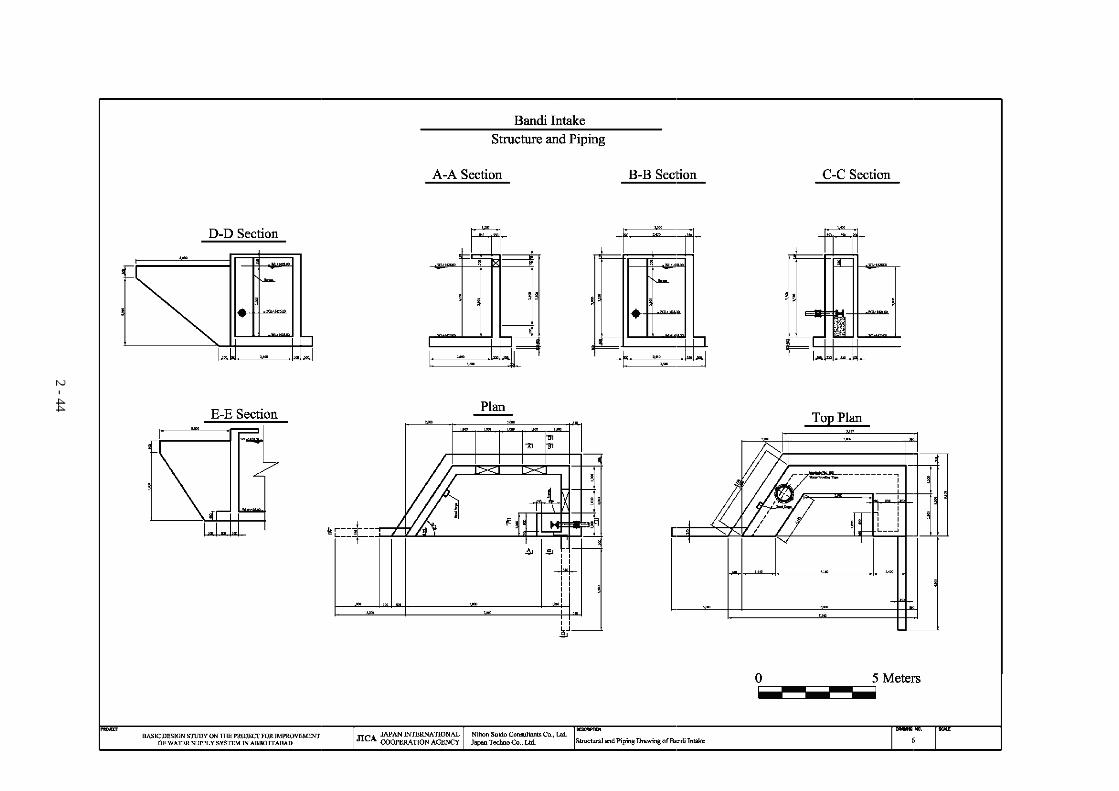
2 - 44
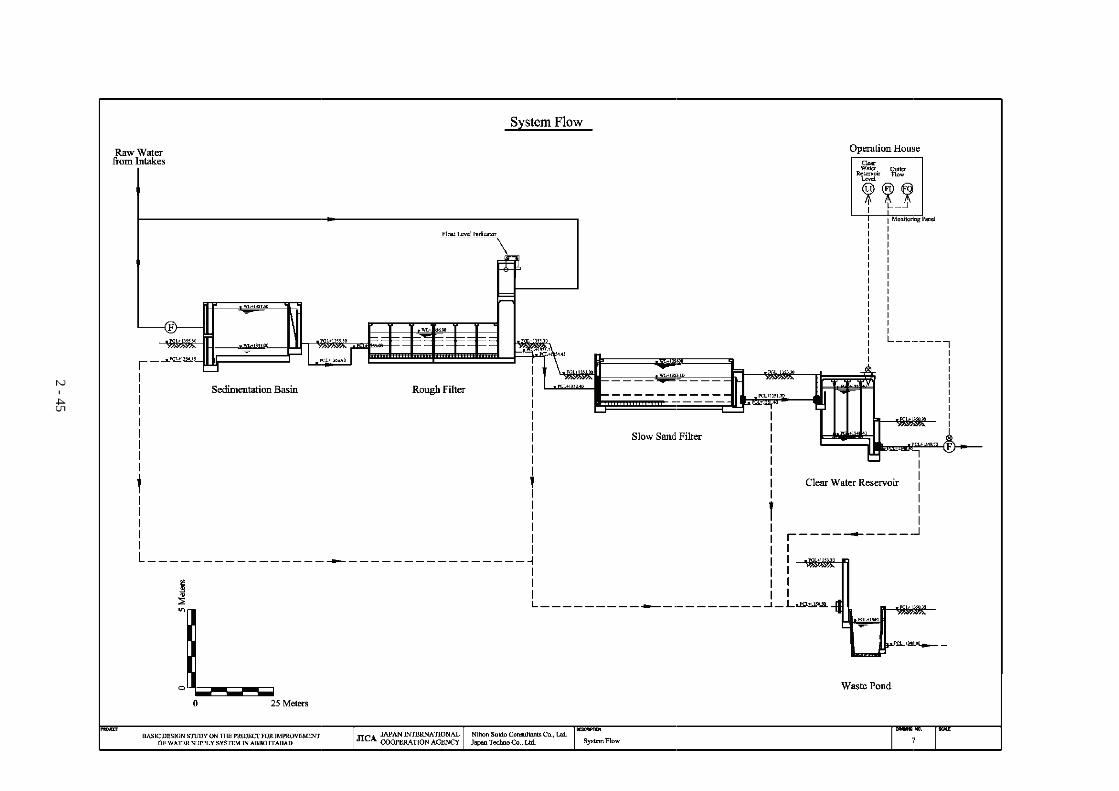
2 - 45
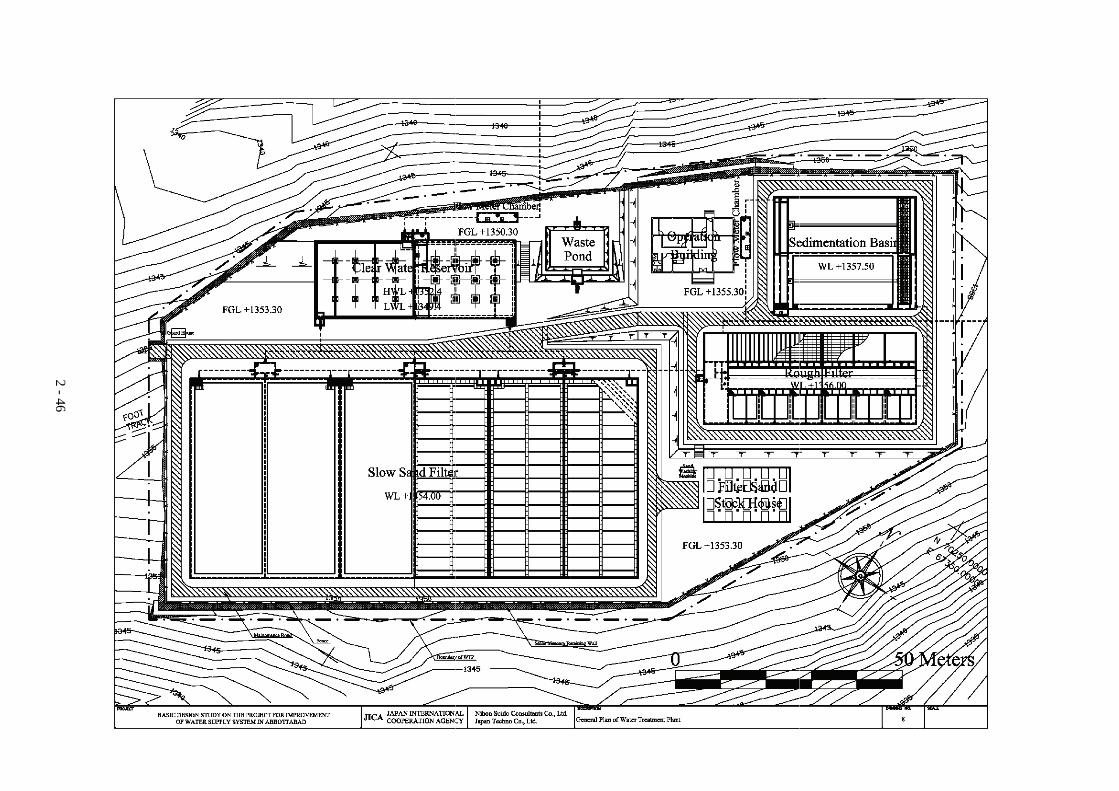
2 - 46
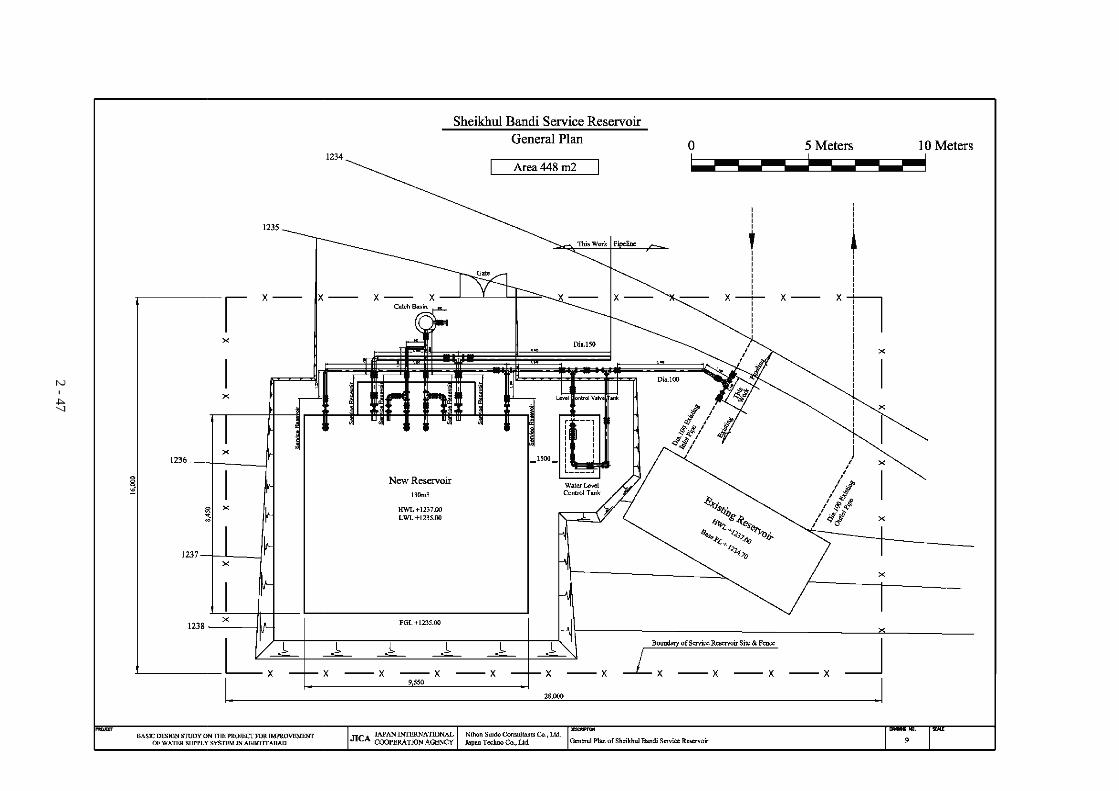
2 - 47
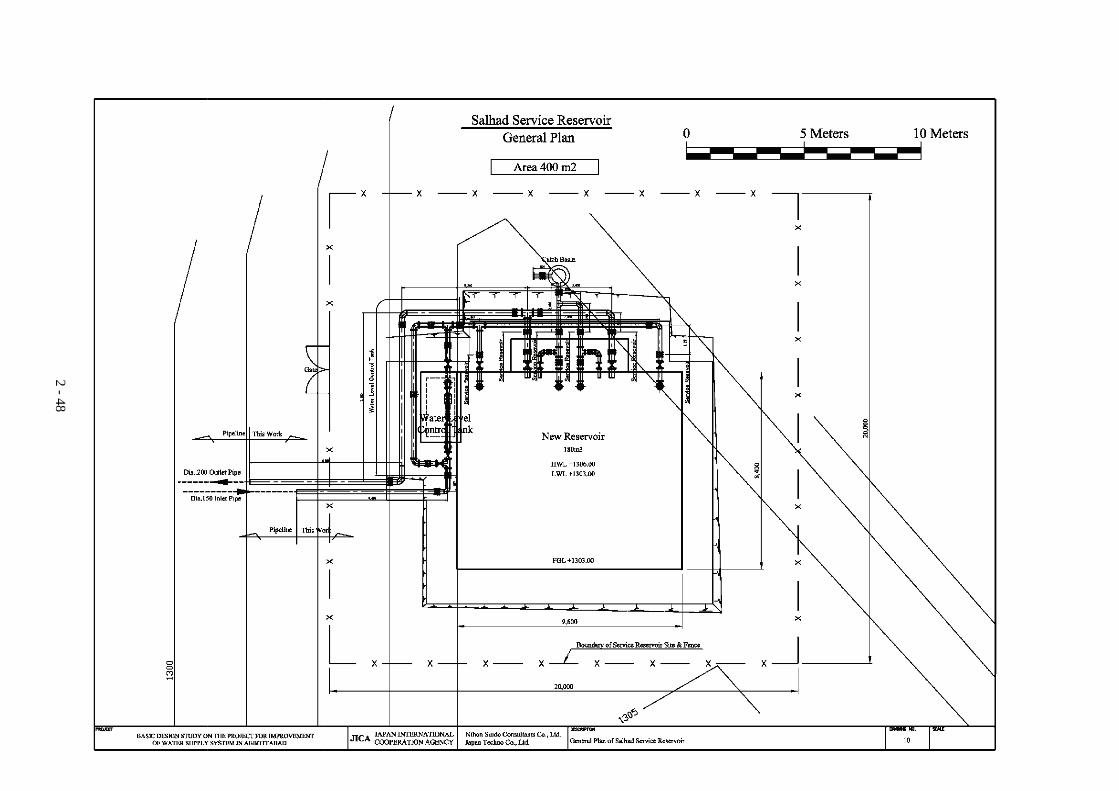
2 - 48
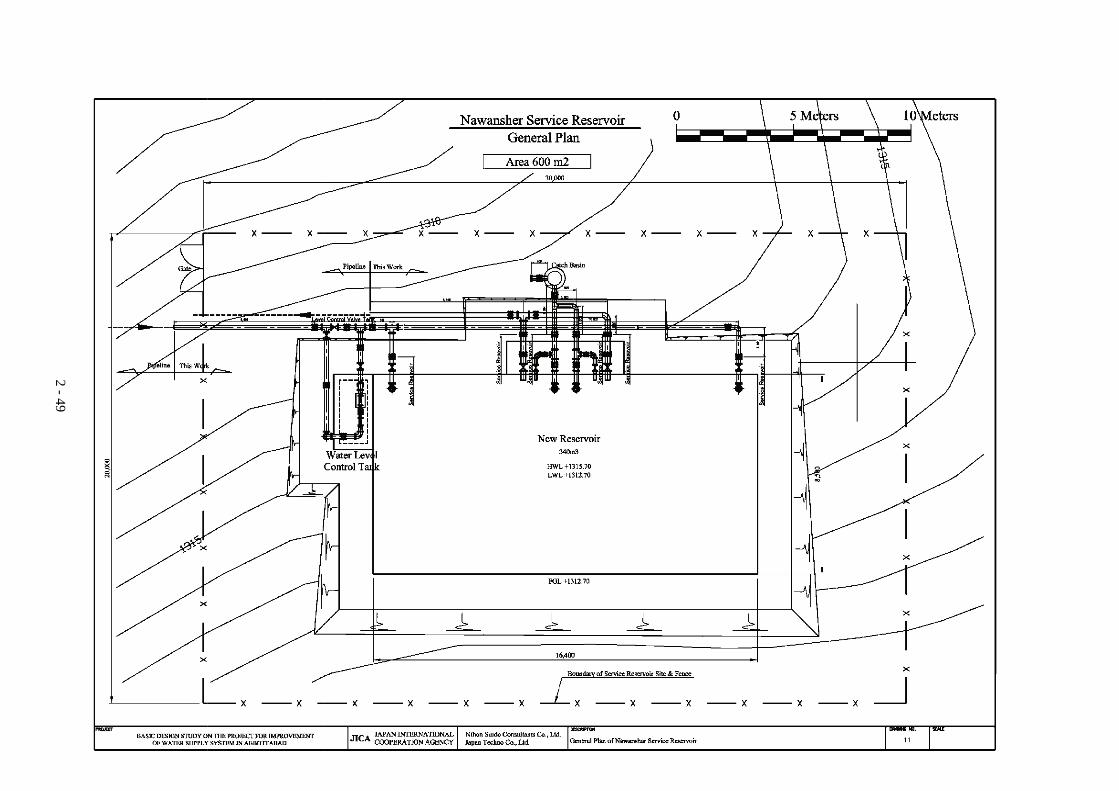
2 - 49

2 - 50
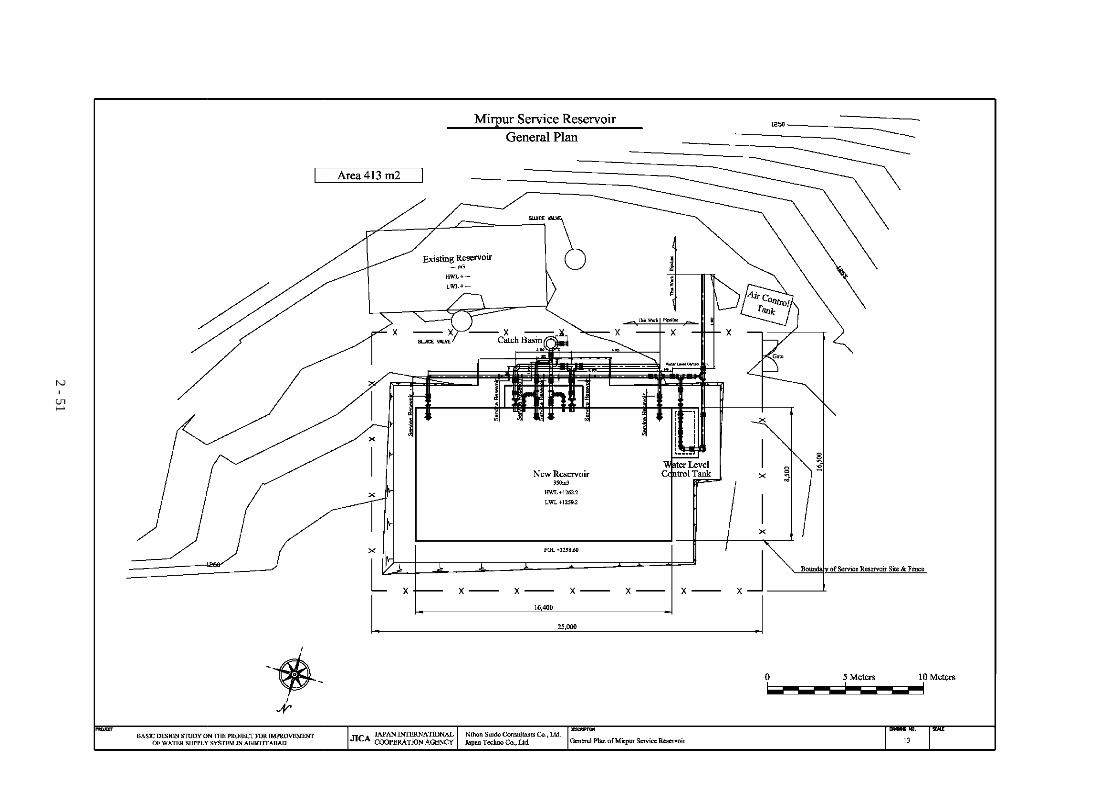
2 - 51
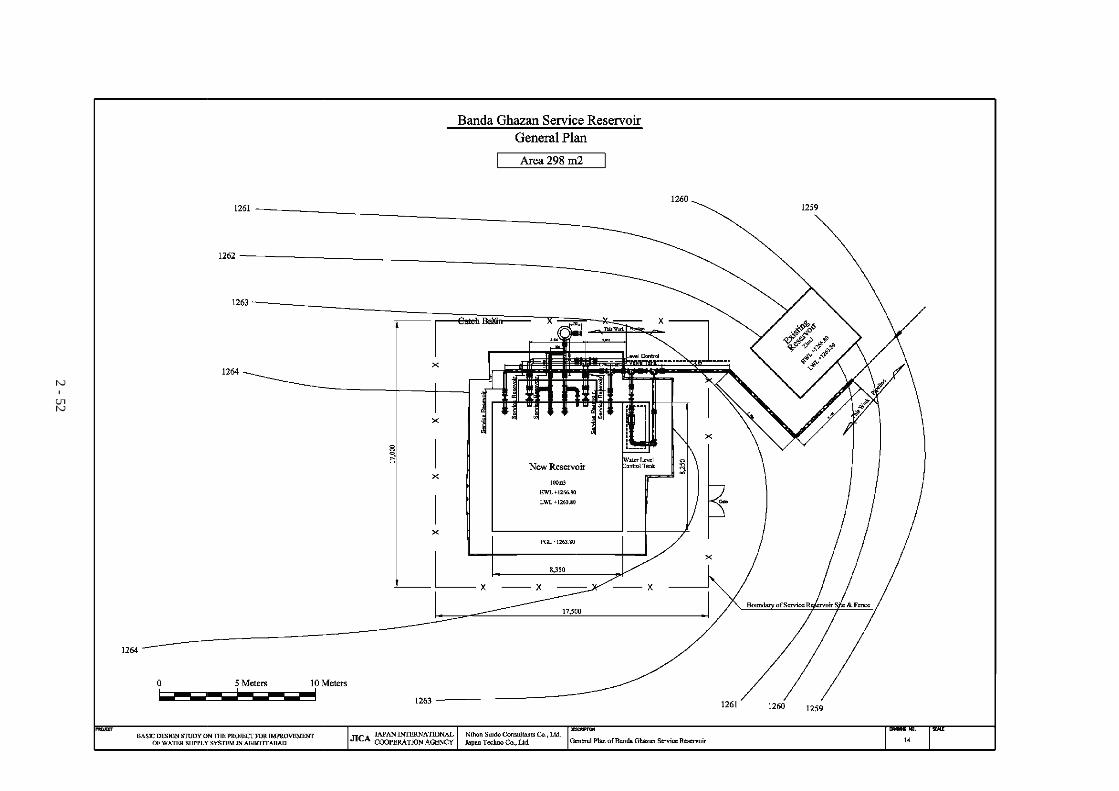
2 - 52
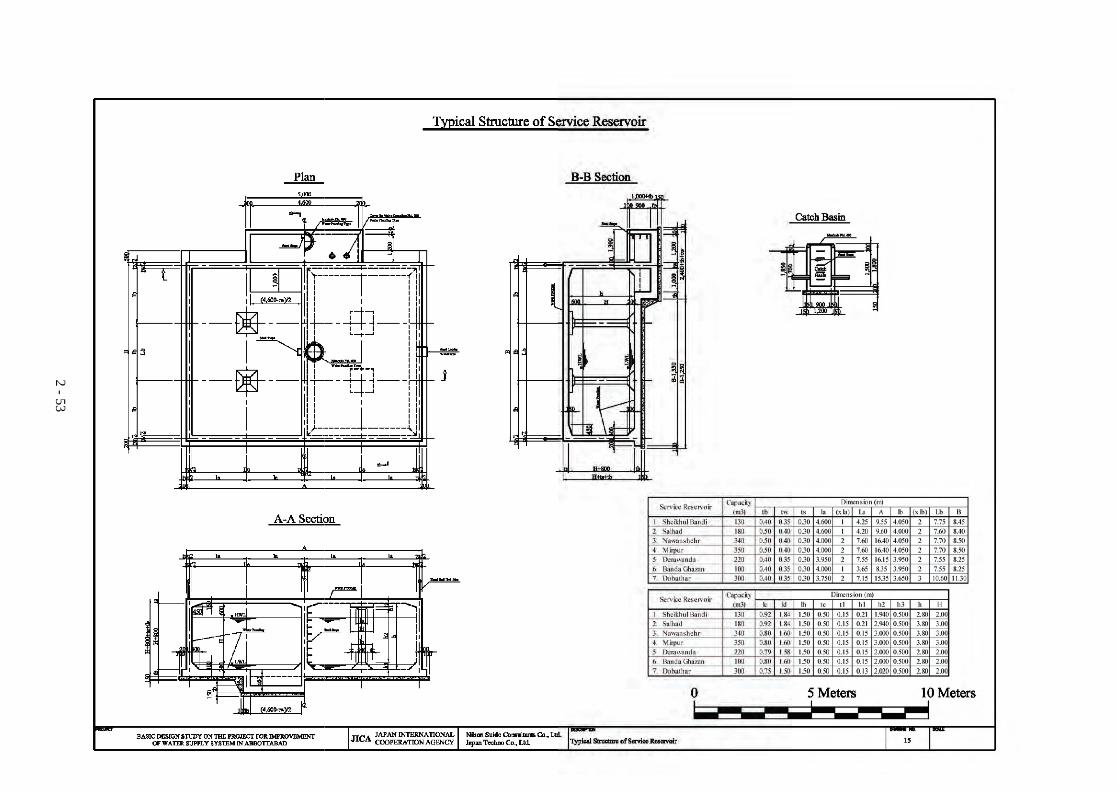
2 - 53

2 - 54
Groundwater System
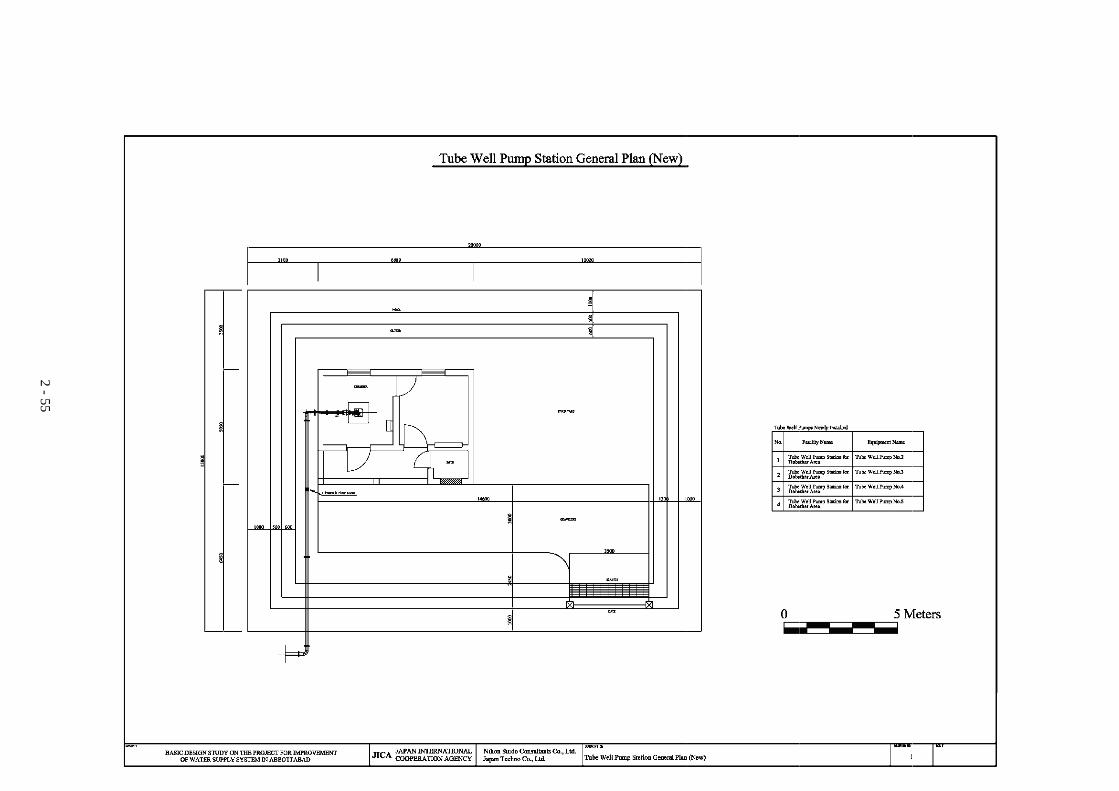
2 - 55
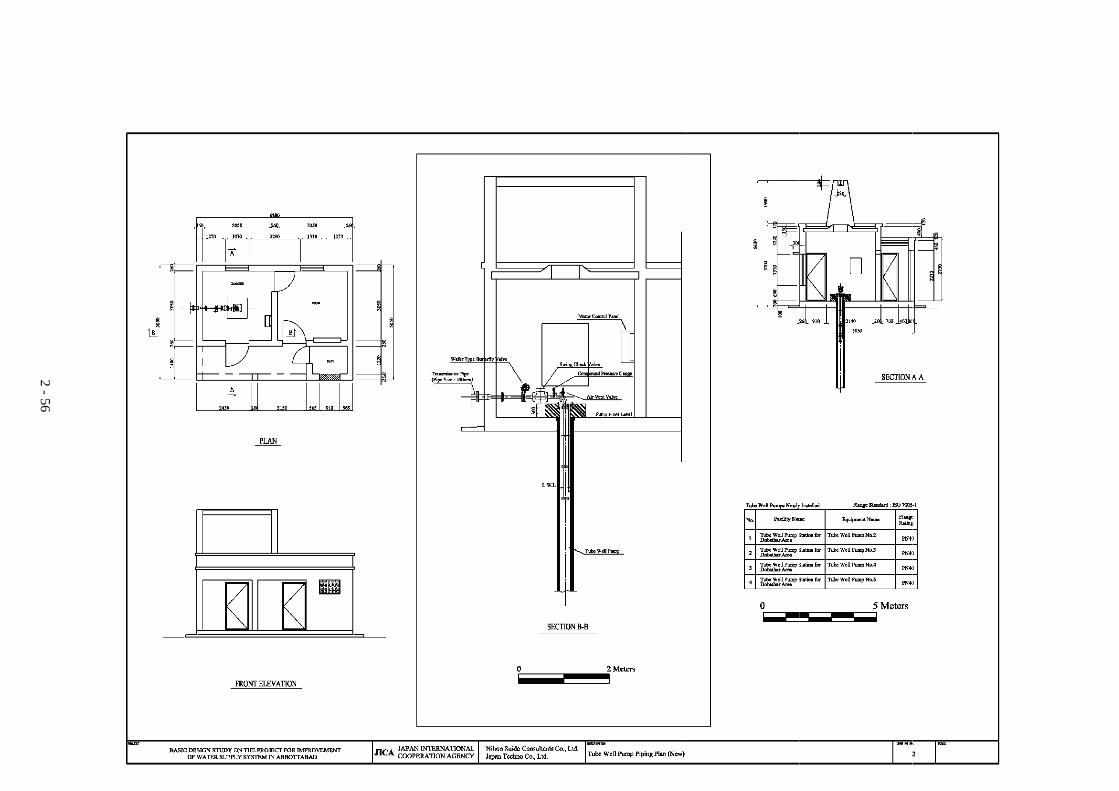
2 - 56
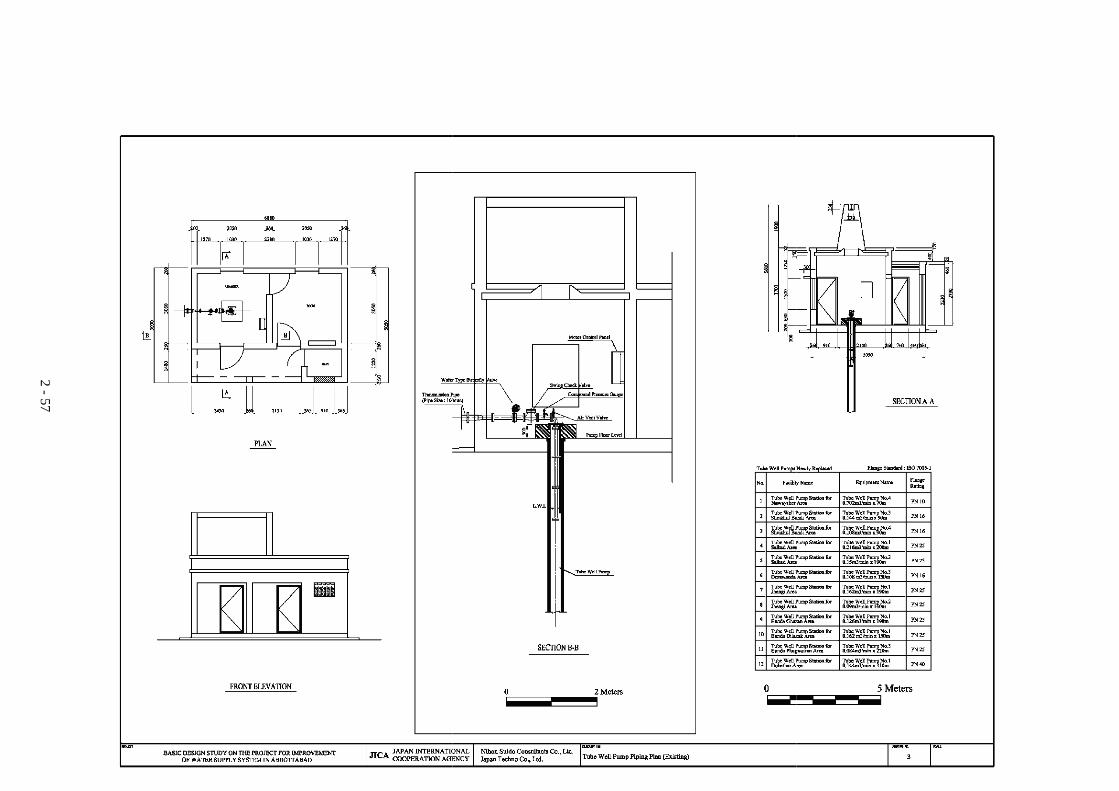
2 - 57
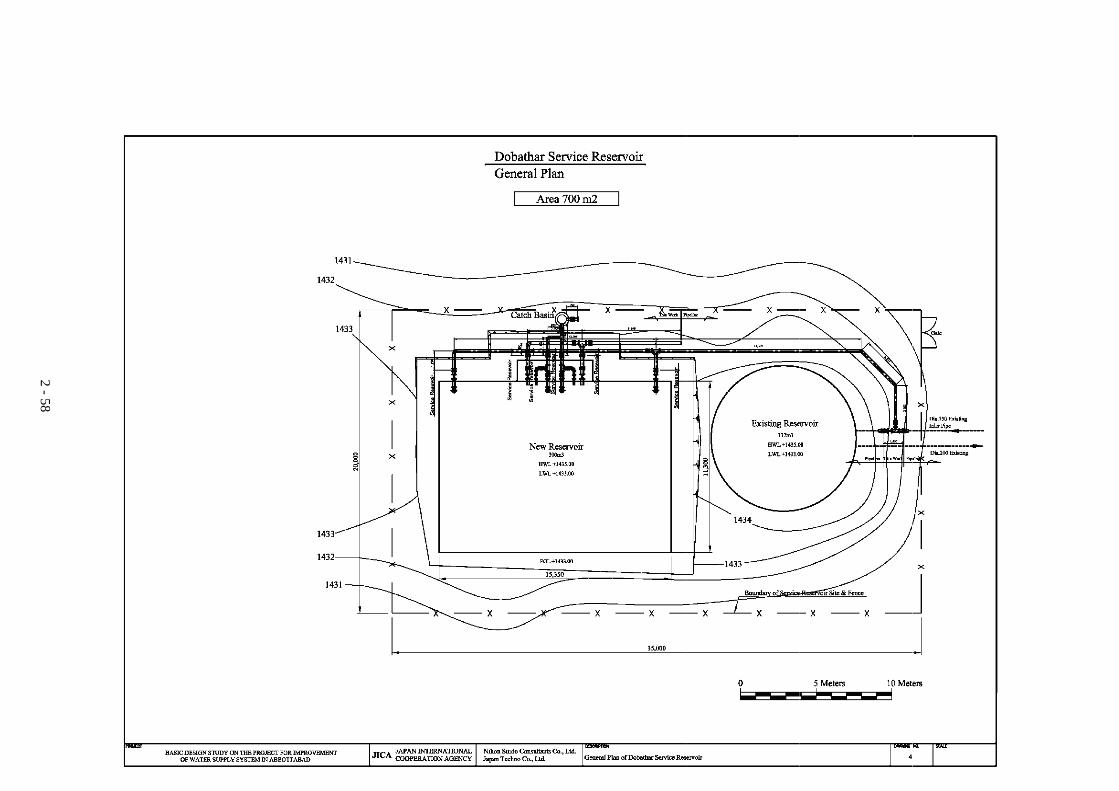
2 - 58

2 - 59
2-2-4 Implementation Plan 2-2-4-1 Implementation Policy 1) Organization for the Implementation of the Project The Project will be executed based on the scheme of the Grant Aid of the Government of Japan. After the Exchange of Note between the two governments regarding the implementation of the Project, the Government of Pakistan will select the consultant and contractor who must be both Japanese corporate entities for the implementation of the Project. Figure 2-2-14 shows the organizational concept for the Project implementation.
Figure 2-2-14 Organizational Concept for Project Implementation
(i) Implementing Agency The implementing agency is the Abbottabad District Government under the Government of North West Frontier Province (NWFP). The Water Supply & Sanitation Section under the Works & Services Department is responsible for implementing the Project smoothly in cooperation with the provincial and central government organizations concerned. (ii) Consulting Firm The detailed design and construction supervision for the works financed by the Japanese side will be carried out by the consulting firm, having experiences in design and construction supervision for water supply facilities, and who is a Japanese corporate entity. (iii) Contractor for Construction Work
The construction works financed by the Japanese grant aid will be carried out by the contractor who is a Japanese corporate entity. The construction sites for intake facilities and raw water mains for the surface water system are located in precipitous terrain in a mountainous area. The components of the facilities vary and include two systems: the surface water system (intake facility, raw water main, water treatment plant, treated water main, distribution reservoir) and
Government of Japan
Japan International
Cooperation Agency (JICA)
Government of Pakistan Abbottabad District
Government
North West Frontier Province (NWFP)
Exchange of Notes
Consulting Firm (Japanese Corporate Body)
1) Detailed Design 2) Preparation of Tender Documents 3) Assistance of Tendering 4) Tender Evaluation 5) Advice for Contract Negotiation 6) Construction Supervision 7) Technical Management Guidance
Construction Company (Japanese Corporate Body)
Construction Work for 1) Intake Facilities 2) Raw Water Mains 3) Water Treatment Plant 4) Treated Water Mains 5) Distribution Reservoirs 6) Tube Wells 7) Replacement of Well Pumps
Report
Construction Supervision
Agreement Contract
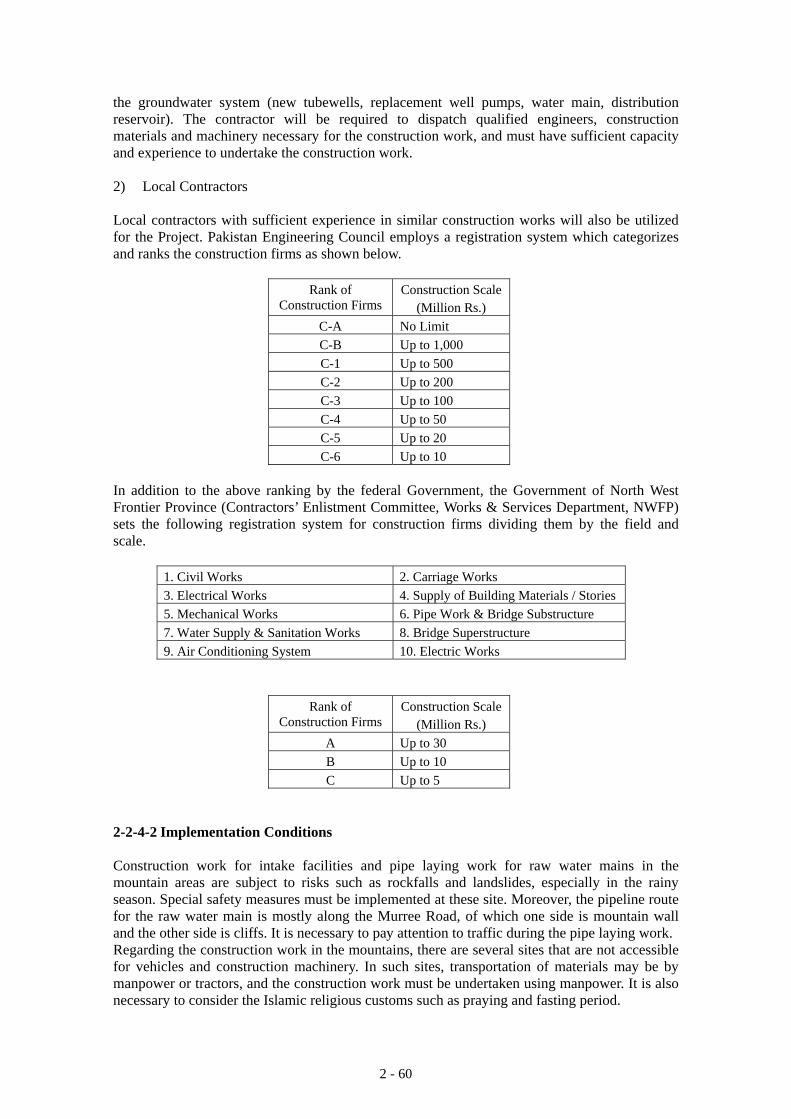
2 - 60
the groundwater system (new tubewells, replacement well pumps, water main, distribution reservoir). The contractor will be required to dispatch qualified engineers, construction materials and machinery necessary for the construction work, and must have sufficient capacity and experience to undertake the construction work.
2) Local Contractors Local contractors with sufficient experience in similar construction works will also be utilized for the Project. Pakistan Engineering Council employs a registration system which categorizes and ranks the construction firms as shown below.
Rank of Construction Firms
Construction Scale(Million Rs.)
C-A No Limit C-B Up to 1,000 C-1 Up to 500 C-2 Up to 200 C-3 Up to 100 C-4 Up to 50 C-5 Up to 20 C-6 Up to 10
In addition to the above ranking by the federal Government, the Government of North West Frontier Province (Contractors’ Enlistment Committee, Works & Services Department, NWFP) sets the following registration system for construction firms dividing them by the field and scale.
1. Civil Works 2. Carriage Works 3. Electrical Works 4. Supply of Building Materials / Stories 5. Mechanical Works 6. Pipe Work & Bridge Substructure 7. Water Supply & Sanitation Works 8. Bridge Superstructure 9. Air Conditioning System 10. Electric Works
Rank of Construction Firms
Construction Scale(Million Rs.)
A Up to 30 B Up to 10 C Up to 5
2-2-4-2 Implementation Conditions Construction work for intake facilities and pipe laying work for raw water mains in the mountain areas are subject to risks such as rockfalls and landslides, especially in the rainy season. Special safety measures must be implemented at these site. Moreover, the pipeline route for the raw water main is mostly along the Murree Road, of which one side is mountain wall and the other side is cliffs. It is necessary to pay attention to traffic during the pipe laying work. Regarding the construction work in the mountains, there are several sites that are not accessible for vehicles and construction machinery. In such sites, transportation of materials may be by manpower or tractors, and the construction work must be undertaken using manpower. It is also necessary to consider the Islamic religious customs such as praying and fasting period.
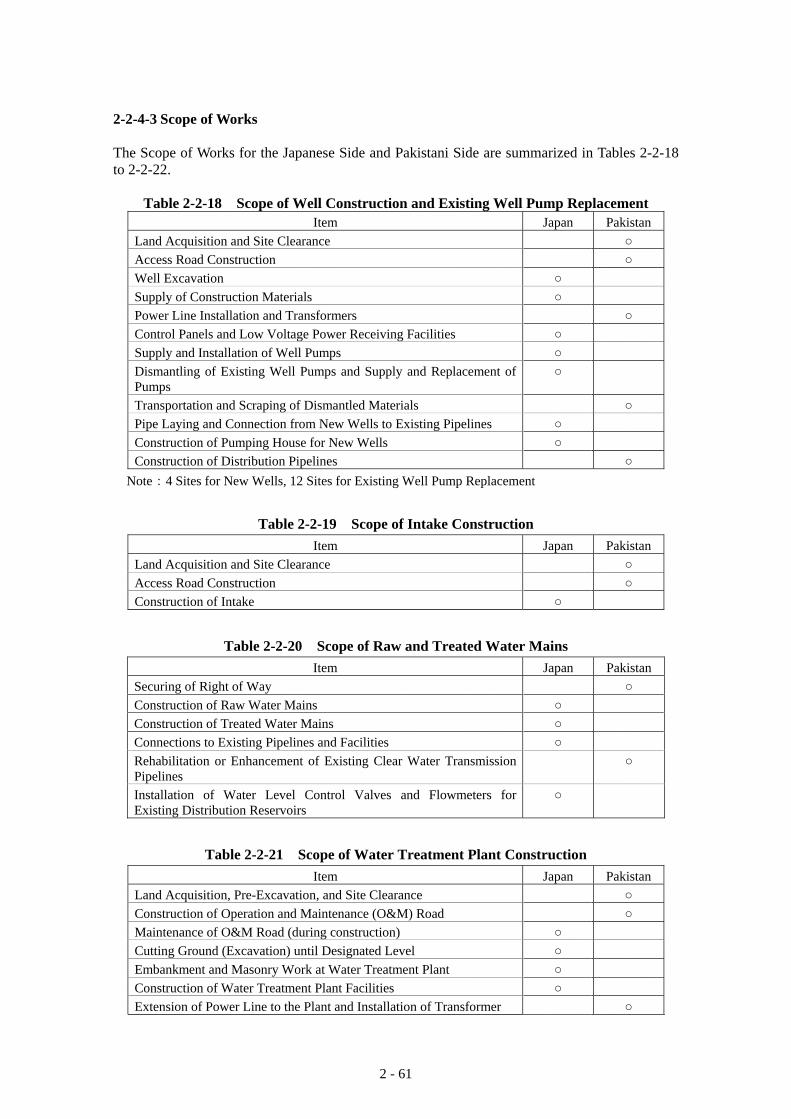
2 - 61
2-2-4-3 Scope of Works The Scope of Works for the Japanese Side and Pakistani Side are summarized in Tables 2-2-18 to 2-2-22.
Table 2-2-18 Scope of Well Construction and Existing Well Pump Replacement Item Japan Pakistan
Land Acquisition and Site Clearance ○ Access Road Construction ○ Well Excavation ○ Supply of Construction Materials ○ Power Line Installation and Transformers ○ Control Panels and Low Voltage Power Receiving Facilities ○ Supply and Installation of Well Pumps ○ Dismantling of Existing Well Pumps and Supply and Replacement of Pumps
○
Transportation and Scraping of Dismantled Materials ○ Pipe Laying and Connection from New Wells to Existing Pipelines ○ Construction of Pumping House for New Wells ○ Construction of Distribution Pipelines ○
Note:4 Sites for New Wells, 12 Sites for Existing Well Pump Replacement
Table 2-2-19 Scope of Intake Construction Item Japan Pakistan
Land Acquisition and Site Clearance ○ Access Road Construction ○ Construction of Intake ○
Table 2-2-20 Scope of Raw and Treated Water Mains Item Japan Pakistan
Securing of Right of Way ○ Construction of Raw Water Mains ○ Construction of Treated Water Mains ○ Connections to Existing Pipelines and Facilities ○ Rehabilitation or Enhancement of Existing Clear Water Transmission Pipelines
○
Installation of Water Level Control Valves and Flowmeters for Existing Distribution Reservoirs
○
Table 2-2-21 Scope of Water Treatment Plant Construction Item Japan Pakistan
Land Acquisition, Pre-Excavation, and Site Clearance ○ Construction of Operation and Maintenance (O&M) Road ○ Maintenance of O&M Road (during construction) ○ Cutting Ground (Excavation) until Designated Level ○ Embankment and Masonry Work at Water Treatment Plant ○ Construction of Water Treatment Plant Facilities ○ Extension of Power Line to the Plant and Installation of Transformer ○
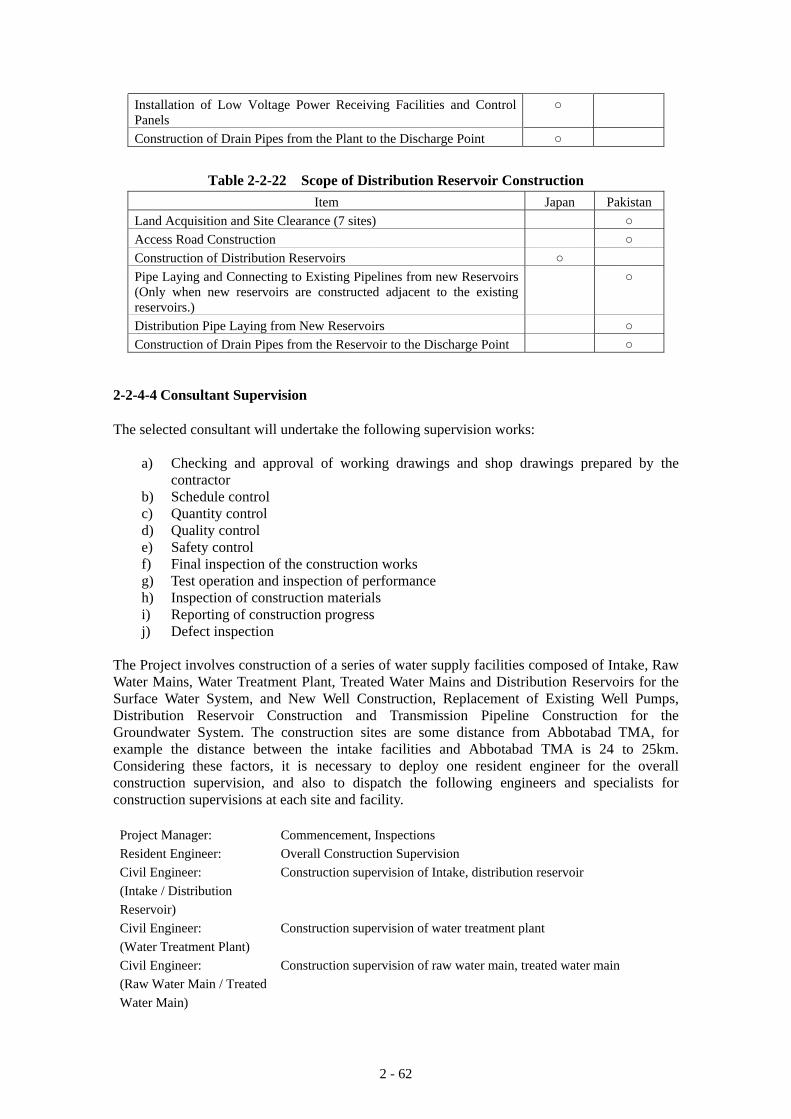
2 - 62
Installation of Low Voltage Power Receiving Facilities and Control Panels
○
Construction of Drain Pipes from the Plant to the Discharge Point ○
Table 2-2-22 Scope of Distribution Reservoir Construction Item Japan Pakistan
Land Acquisition and Site Clearance (7 sites) ○ Access Road Construction ○ Construction of Distribution Reservoirs ○ Pipe Laying and Connecting to Existing Pipelines from new Reservoirs (Only when new reservoirs are constructed adjacent to the existing reservoirs.)
○
Distribution Pipe Laying from New Reservoirs ○ Construction of Drain Pipes from the Reservoir to the Discharge Point ○
2-2-4-4 Consultant Supervision The selected consultant will undertake the following supervision works:
a) Checking and approval of working drawings and shop drawings prepared by the contractor
b) Schedule control c) Quantity control d) Quality control e) Safety control f) Final inspection of the construction works g) Test operation and inspection of performance h) Inspection of construction materials i) Reporting of construction progress j) Defect inspection
The Project involves construction of a series of water supply facilities composed of Intake, Raw Water Mains, Water Treatment Plant, Treated Water Mains and Distribution Reservoirs for the Surface Water System, and New Well Construction, Replacement of Existing Well Pumps, Distribution Reservoir Construction and Transmission Pipeline Construction for the Groundwater System. The construction sites are some distance from Abbotabad TMA, for example the distance between the intake facilities and Abbotabad TMA is 24 to 25km. Considering these factors, it is necessary to deploy one resident engineer for the overall construction supervision, and also to dispatch the following engineers and specialists for construction supervisions at each site and facility. Project Manager: Commencement, Inspections Resident Engineer: Overall Construction Supervision Civil Engineer: (Intake / Distribution Reservoir)
Construction supervision of Intake, distribution reservoir
Civil Engineer: (Water Treatment Plant)
Construction supervision of water treatment plant
Civil Engineer: (Raw Water Main / Treated Water Main)
Construction supervision of raw water main, treated water main
2 - 63
Well Specialist: Supervision of well construction and pump replacement Moreover, the Project site is large, the construction sites are far apart from each other, and many construction works will be undertaken simultaneously at different sites. Accordingly, it is necessary to deploy the following local engineers at various construction sites to ensure adequate inspection works and safety measures at the sites. Civil Engineer (Intake) Civil Engineer (Water Treatment Plant) Civil Engineer (Distribution Reservoir) Pipeline Engineer (Raw Water Mains) Pipeline Engineer (Treated Water Mains) Well Specialist
2-2-4-5 Quality Control Plan The quality control of the construction works is to be conducted in accordance with the technical specifications prepared by the consultants during the detailed design work. The major control work items are listed in Table 2-2-23 together with indicators, control methods, and standards to be adopted. JIS or other equivalent International Standards are, in principle, to be used for the quality control.
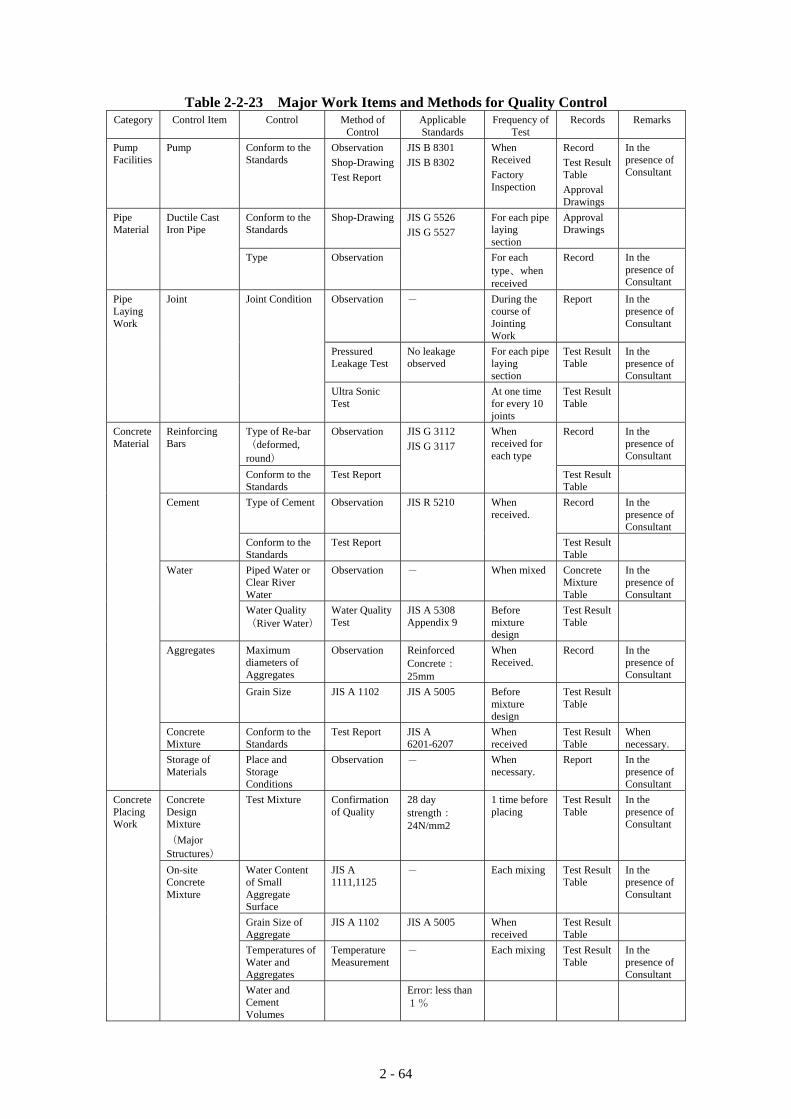
2 - 64
Table 2-2-23 Major Work Items and Methods for Quality Control Category Control Item Control Method of
Control Applicable Standards
Frequency of Test
Records Remarks
Pump Facilities
Pump Conform to the Standards
Observation Shop-DrawingTest Report
JIS B 8301 JIS B 8302
When Received Factory Inspection
Record Test Result Table Approval Drawings
In the presence of Consultant
Conform to the Standards
Shop-Drawing For each pipe laying section
Approval Drawings
Pipe Material
Ductile Cast Iron Pipe
Type Observation
JIS G 5526 JIS G 5527
For each type、when received
Record In the presence of Consultant
Observation - During the course of Jointing Work
Report In the presence of Consultant
Pressured Leakage Test
No leakage observed
For each pipe laying section
Test Result Table
In the presence of Consultant
Pipe Laying Work
Joint Joint Condition
Ultra Sonic Test
At one time for every 10 joints
Test Result Table
Type of Re-bar(deformed, round)
Observation Record In the presence of Consultant
Reinforcing Bars
Conform to the Standards
Test Report
JIS G 3112 JIS G 3117
When received for each type
Test Result Table
Type of Cement Observation Record In the presence of Consultant
Cement
Conform to the Standards
Test Report
JIS R 5210 When received.
Test Result Table
Piped Water or Clear River Water
Observation - When mixed Concrete Mixture Table
In the presence of Consultant
Water
Water Quality(River Water)
Water Quality Test
JIS A 5308 Appendix 9
Before mixture design
Test Result Table
Maximum diameters of Aggregates
Observation Reinforced Concrete: 25mm
When Received.
Record In the presence of Consultant
Aggregates
Grain Size JIS A 1102 JIS A 5005 Before mixture design
Test Result Table
Concrete Mixture
Conform to the Standards
Test Report JIS A 6201-6207
When received
Test Result Table
When necessary.
Concrete Material
Storage of Materials
Place and Storage Conditions
Observation - When necessary.
Report In the presence of Consultant
Concrete Design Mixture (Major Structures)
Test Mixture Confirmation of Quality
28 day strength:24N/mm2
1 time before placing
Test Result Table
In the presence of Consultant
Water Content of Small Aggregate Surface
JIS A 1111,1125
- Each mixing Test Result Table
In the presence of Consultant
Grain Size of Aggregate
JIS A 1102 JIS A 5005 When received
Test Result Table
Temperatures of Water and Aggregates
Temperature Measurement
- Each mixing Test Result Table
In the presence of Consultant
Concrete Placing Work
On-site Concrete Mixture
Water and Cement Volumes
Error: less than1%
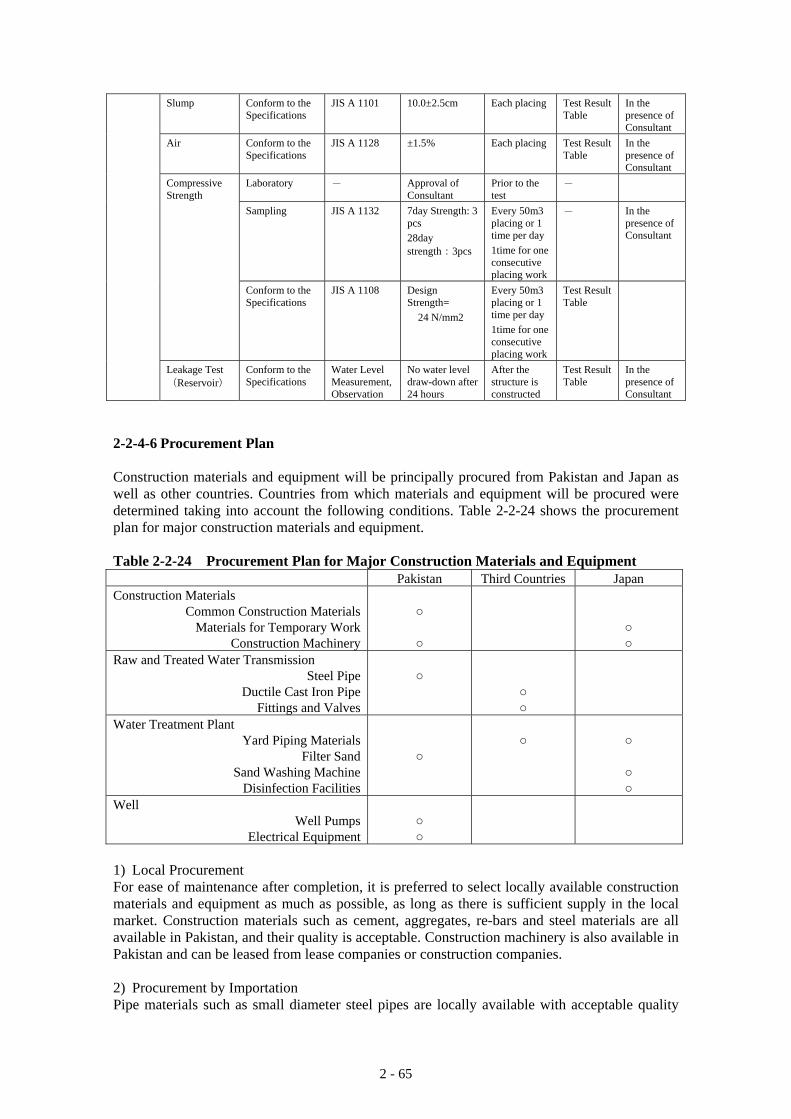
2 - 65
Slump Conform to the Specifications
JIS A 1101 10.0±2.5cm Each placing Test Result Table
In the presence of Consultant
Air Conform to the Specifications
JIS A 1128 ±1.5% Each placing Test Result Table
In the presence of Consultant
Laboratory - Approval of Consultant
Prior to the test
-
Sampling JIS A 1132 7day Strength: 3 pcs 28day strength:3pcs
Every 50m3 placing or 1 time per day 1time for one consecutive placing work
- In the presence of Consultant
Compressive Strength
Conform to the Specifications
JIS A 1108 Design Strength= 24 N/mm2
Every 50m3 placing or 1 time per day 1time for one consecutive placing work
Test Result Table
Leakage Test(Reservoir)
Conform to the Specifications
Water Level Measurement, Observation
No water level draw-down after 24 hours
After the structure is constructed
Test Result Table
In the presence of Consultant
2-2-4-6 Procurement Plan Construction materials and equipment will be principally procured from Pakistan and Japan as well as other countries. Countries from which materials and equipment will be procured were determined taking into account the following conditions. Table 2-2-24 shows the procurement plan for major construction materials and equipment. Table 2-2-24 Procurement Plan for Major Construction Materials and Equipment
Pakistan Third Countries Japan Construction Materials
Common Construction MaterialsMaterials for Temporary Work
Construction Machinery
○ ○
○ ○
Raw and Treated Water Transmission Steel Pipe
Ductile Cast Iron PipeFittings and Valves
○
○ ○
Water Treatment Plant Yard Piping Materials
Filter SandSand Washing Machine
Disinfection Facilities
○
○
○ ○ ○
Well Well Pumps
Electrical Equipment
○ ○
1) Local Procurement For ease of maintenance after completion, it is preferred to select locally available construction materials and equipment as much as possible, as long as there is sufficient supply in the local market. Construction materials such as cement, aggregates, re-bars and steel materials are all available in Pakistan, and their quality is acceptable. Construction machinery is also available in Pakistan and can be leased from lease companies or construction companies. 2) Procurement by Importation Pipe materials such as small diameter steel pipes are locally available with acceptable quality
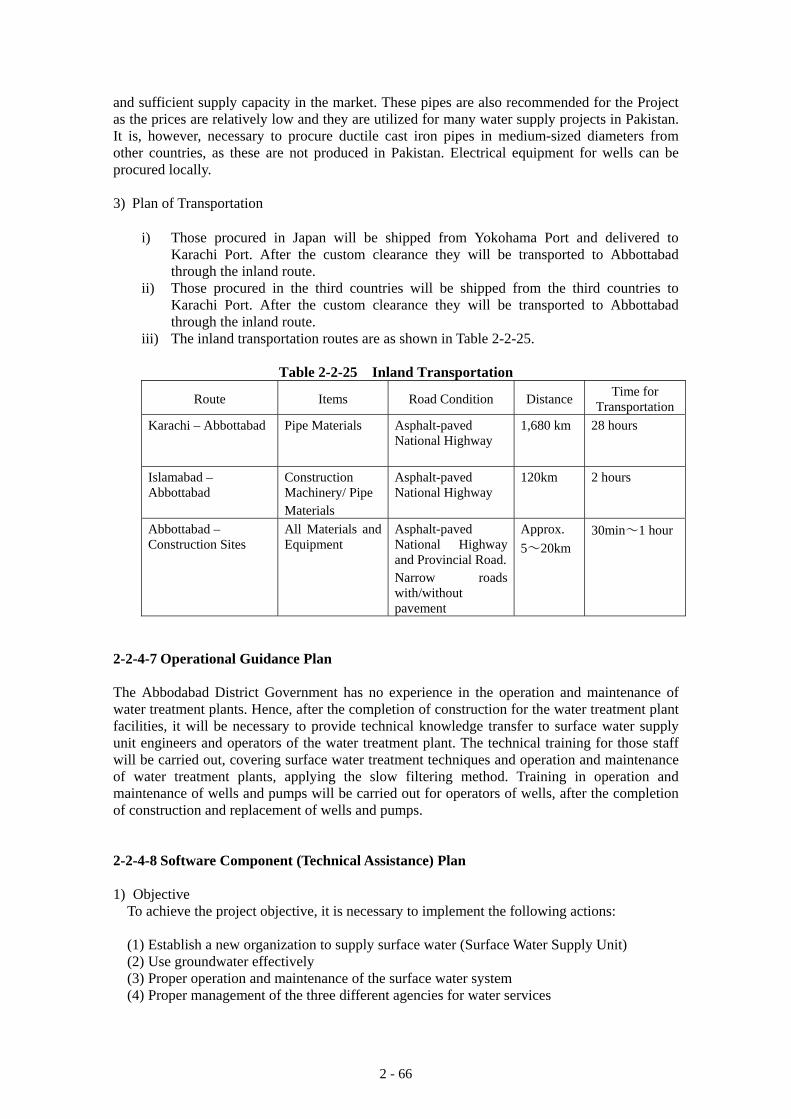
2 - 66
and sufficient supply capacity in the market. These pipes are also recommended for the Project as the prices are relatively low and they are utilized for many water supply projects in Pakistan. It is, however, necessary to procure ductile cast iron pipes in medium-sized diameters from other countries, as these are not produced in Pakistan. Electrical equipment for wells can be procured locally. 3) Plan of Transportation
i) Those procured in Japan will be shipped from Yokohama Port and delivered to Karachi Port. After the custom clearance they will be transported to Abbottabad through the inland route.
ii) Those procured in the third countries will be shipped from the third countries to Karachi Port. After the custom clearance they will be transported to Abbottabad through the inland route.
iii) The inland transportation routes are as shown in Table 2-2-25.
Table 2-2-25 Inland Transportation
Route Items Road Condition Distance Time for Transportation
Karachi – Abbottabad Pipe Materials Asphalt-paved National Highway
1,680 km 28 hours
Islamabad – Abbottabad
Construction Machinery/ Pipe Materials
Asphalt-paved National Highway
120km 2 hours
Abbottabad – Construction Sites
All Materials and Equipment
Asphalt-paved National Highway and Provincial Road.Narrow roads with/without pavement
Approx. 5~20km
30min~1 hour
2-2-4-7 Operational Guidance Plan The Abbodabad District Government has no experience in the operation and maintenance of water treatment plants. Hence, after the completion of construction for the water treatment plant facilities, it will be necessary to provide technical knowledge transfer to surface water supply unit engineers and operators of the water treatment plant. The technical training for those staff will be carried out, covering surface water treatment techniques and operation and maintenance of water treatment plants, applying the slow filtering method. Training in operation and maintenance of wells and pumps will be carried out for operators of wells, after the completion of construction and replacement of wells and pumps. 2-2-4-8 Software Component (Technical Assistance) Plan 1) Objective
To achieve the project objective, it is necessary to implement the following actions: (1) Establish a new organization to supply surface water (Surface Water Supply Unit) (2) Use groundwater effectively (3) Proper operation and maintenance of the surface water system (4) Proper management of the three different agencies for water services
2 - 67
The following software component is proposed to assist in the establishment of the new organization and to developing the capacity of personnel: (1) Training on tubewell management and operation and maintenance of pumps (2) Capacity development in operation and maintenance of slow sand filtration systems (3) Assistance in establishing the Surface Water Supply Unit (4) Improvement of water tariff collection systems
2) Expected outputs
Implementation of the software component according to the above objective will have the following direct effects:
(1) Training in operation and maintenance of tubewells
Enhance capacity development of operators for tubewell management and pump operation and maintenance
(2) Management guidance for the management unit of the surface water supply system
Establish the committee for surface water supply system and become cross-functional with the existing water service agencies Start-up of activities of the Surface Water Supply Unit
(3) Capacity development for management and technical knowledge of the surface water
supply Enhance capacity development in managing the Surface Water Supply Unit Enhance capacity development of operators in operation and maintenance of slow sand filtration systems
(4) Improvement of water tariff collection system
Improve the metered tariff system transferred from the fixed tariff system
3) Activities The groundwater system and surface water supply system will be constructed in this Project. To execute the software component, the following experts and activities are required.
Japanese consultant (Tubewell management/Operation and Maintenance of pumps) 1 person
A Japanese consultant will undertake the lectures and on-the-job training for tubewell management and operation and maintenance of pumps. The Japanese consultant is responsible for: • Formulation and supervision of the Software Component program for tubewell
management/Operation and Maintenance of pumps; • Reporting to the executing agency, Japanese side and coordination parties concerned
in the program; and • Coordinating implementation of the program with the construction schedule.
Japanese consultant (Institution): 1 person A Japanese consultant will assist in enhancing the establishment of the surface water supply committee/unit by the executing agency. The Japanese consultant is responsible for: • Formulation and supervision of the Software Component program for organization
enhancement; • Reporting to the executing agency, Japanese side, and coordination parties concerned
in the program; and • Coordinating implementation of the program with the construction schedule.
2 - 68
Japanese consultant (Operation and Maintenance of surface water supply system): 1
person A Japanese consultant will undertake the lecturing and on-the-job training for operation and maintenance of the slow sand filtration system. The Japanese consultant is responsible for: • Formulation and supervision of the Software Component program for operation and
maintenance of the slow sand filtration system; • Reporting to the executing agency, Japanese side, and coordination parties concerned
in the program; and • Coordinating implementation of the program with the construction schedule.
Japanese consultant (Water tariff system): 1 person A Japanese consultant will assist the executing agency in transitioning the fixed water tariff system to a metered water tariff system. The Japanese consultant is responsible for: • Formulation and supervision of the Software Component program for assistance in the
revision of the water tariff system and improvement of the billed collection system by the executing agency;
• Reporting to the executing agency, Japanese side, and coordination parties concerned in the program; and
• Coordinating implementation of the program with the construction schedule.
Japanese consultant (Education): 1person A Japanese consultant will facilitate consensus-building efforts and public hearings between the executing agency and residents regarding the transition to the metered water tariff system by the executing agency. The Japanese consultant is responsible for: • Formulation and supervision of the Software Component program for assistance in
facilitating consensus-building efforts for transition of the water tariff system and improvement of the billed collection system by the executing agency;
• Reporting to the executing agency, Japanese side, and coordination parties concerned in the program; and
• Coordinating implementation of the program with the construction schedule. Local consultant Since the executing agency has less experience and fewer skills in implementation of software component programs, an experienced local consultant will be employed to carry out the activities. Skills and technology will be transferred to the executing agency through lectures and on-the-job training. Staff from the local consultant must be experienced in implementation of similar programs and have fluent communication with the executing agency and residents.
i) Institution / water tariff system: 4 persons Under the supervision of a Japanese consultant, a local consultant (Institution/water tariff system) will act to establish the Surface Water Supply Unit and new water tariff system with the executing agency. The local consultant shall be experienced in establishment of operation and maintenance systems and capacity development for finance and accounting in similar programs.
ii) Education: 1 person Under the supervision of a Japanese consultant, a local consultant (Education) will act to carry out consensus building efforts between residents and the executing agency regarding the transition to a metered water tariff. The local consultant shall be experienced in the establishment of community-based management, participatory planning, monitoring and evaluation and capacity development.

2 - 69
2-2-4-9 Implementation Schedule In terms of the project scale and components, the implementation schedule for the Project has been formulated over a term of multiple fiscal years. The expected periods are 4.5 months for detailed design and 26.0 months for construction and procurement. Figure 2-2-15 shows the implementation schedule for the Project.
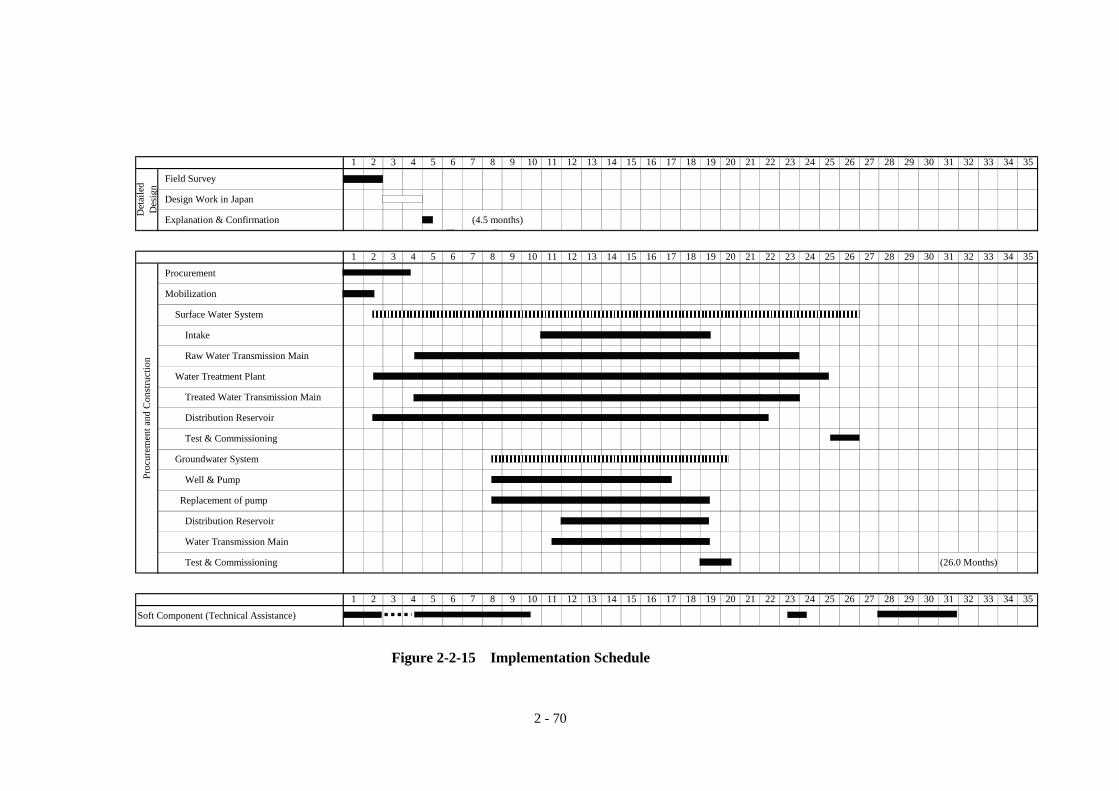
2 - 70
Water Transmission Main
Test & Commissioning (26.0 Months)
Soft Component (Technical Assistance)
Proc
urem
ent a
nd C
onst
ruct
ion
9 10 11 12
Intake
Groundwater System
Well & Pump
Replacement of pump
Distribution Reservoir
Water Treatment Plant
Treated Water Transmission Main
Distribution Reservoir
Test & Commissioning
(4.5 months)
10 11 12 13 144 5 6 7 8 16 17 20 219 191 2 3 1815
Surface Water System
Raw Water Transmission Main
Mobilization
Procurement
24
Det
aile
dD
esig
n
Field Survey
Design Work in Japan
Explanation & Confirmation
22 23
25 26 3529 30 31 32 33 3417 18 27 2819 20 21 22 23 2413 14 15 169 10 11 125 6 7 8
27 28 29
1 2
25 26
3 4
30 31 32 33 34 35
1 2 3 4 5 6 7 8 13 14 15 16 17 18 19 20 21 22 23 24 25 26 27 28 29 30 31 32 33 34 35
Figure 2-2-15 Implementation Schedule
2 - 71
2-3 Obligations of Recipient Country 2-3-1 Land Acquisition Land acquisition for construction sites for Intake, Water Treatment Plant, Distribution Reservoirs, Wells and Pressure Releasing Chambers is the responsibility of the Government of Pakistan. Intake (4 sites): 1) Namly Maira 153 m2 2) Gaya 176 m2 3) Bagh 238 m2 4) Bandi 150 m2 Water Treatment Plant: 1) Plant Site 15,650 m2 2) Access and O&M Road 7,700 m2 Distribution Reservoirs (7 sites): 1) Sheikhul Bandi 448 m2 2) Salhad 400 m2 3) Nawansher 600 m2 4) Mirpur 413 m2 5) Derawanda 480 m2 6) Banda Ghazan 298 m2 7) Dobathar 700 m2 Wells (4 sites): each 300 m2 x 4 sites Pressure Releasing Chamber (3sites): 1) No.1 50m2 2) No.2 50m2 3) No.3 100m2 2-3-2 Construction of Access Roads to Intake Sites, Water Treatment Plant and
Distribution Reservoirs The access roads to the four intake sites, water treatment plant site and seven distribution reservoirs shall be constructed by the Pakistani side. 2-3-3 Power and Telephone Lines to the Project Site It is the obligation of the Government of Pakistan to provide the power distribution lines to the water treatment plant site and the four well construction sites, as well as the installation of main circuit breakers and transformers and to provide the telephone line to the water treatment plant site. The capacity required is estimated at 15 KVA for the water treatment plant and 40 KVA for each well site. 2-3-4 Obligations for New and Existing Distribution Reservoirs The construction works for the new distribution reservoirs to be carried out by Japanese side includes installation of water transmission pipes into the reservoirs, installation of water level control valves, installation of overflow pipes and drain pipes up to the manholes. The Pakistani side should install the overflow pipes and drain pipes extended to the discharge points.
2 - 72
The installation of distribution pipes is the full responsibility of the Pakistani side. The Japanese side, however, only has responsibility for the installation of outlet valves and outlet pipes at the reservoirs up to the valve chamber. Regarding the installation of new water transmission pipes to the existing reservoirs, the Japanese side will install new pipelines to the connecting points with the existing transmission pipes as well as water level control valves. If the existing reservoirs’ distribution pipes overflow pipes and drain pipes need any expansion or rehabilitation, these works are all the responsibility of the Pakistani side. 2-3-5 Right of Way for Raw and Treated Water Transmission Mains The Implementing Agency should obtain necessary consents from the landowners where pipes are installed under private land or land under the control of other organizations. Regarding the pipe laying under the pavement, road shoulder, drainage and sidewalks of the National Highway, Provincial Roads and other roads, the implementing agency should obtain a No Objection Certificate (NOC) from the road authorities concerned. Road restoration is the responsibility of the Japanese side, but for issuing of the NOC, the implementing agency should deposit the advance rental charges for the roads. 2-3-6 Procurement and Installation of Water Meters In conjunction with the implementation of the Project, the Pakistani side is planning to introduce the water meters for the Abbottabad TMA and the peripheral U/Cs. Procurement and installation of the water meters is the responsibility of the Pakistani side. 2-3-7 Implementation of Measures to Reduce Non-Revenue Water (NRW) The water demand in 2015 includes 20% of NRW. Therefore, the implementation organization shall take necessary measures such as leakage reduction, to reduce NRW ratio to 20% in 2015. 2-3-8 Approval of PC-1 Planning Commission-1 (PC-1), which guarantees the obligations of the Pakistani side, shall be approved by the Central Government and Provincial Government for the implementation of the Project. The Pakistani side requires amendment of the PC-1 for approval as soon as possible. 2-3-9 Other Requirements In addition to the above obligations, the Pakistani side shall take the following actions.
(a) Provide facilities for the distribution of electricity, water supply, drainage and other incidental facilities for construction works;
(b) Issue public notices regarding the effects of construction work; (c) Exempt any taxes, duties and levies for importing materials, equipment and products
for the project; (d) Bear the following commissions to the Japanese bank for banking services based upon
the B/A: - Advising commission of A/P - Payment Commission;

2 - 73
(e) Bear the payment commissions to the Pakistani bank for banking services; (f) Ensure tax exemption and custom clearance of the products at the port of
disembarkation in Pakistan; (g) Exempt Japanese nationals from customs duties, internal taxes and other fiscal levies
which may be imposed in Pakistan with respect to the supply of the products and services under the verified contracts;
(h) Accord Japanese nationals, whose service may be required in connection with the supply of the products and the services under the verified contract, such facilities as may be necessary for their entry into Pakistan and stay therein for the performance of their work;
(i) Maintain and use properly and effectively the facilities constructed and equipment provided under the Grant; and
(j) Bear all the expenses, other than those to be borne by the Grant, necessary for construction of the facilities as well as for the transportation and installation of the equipment.
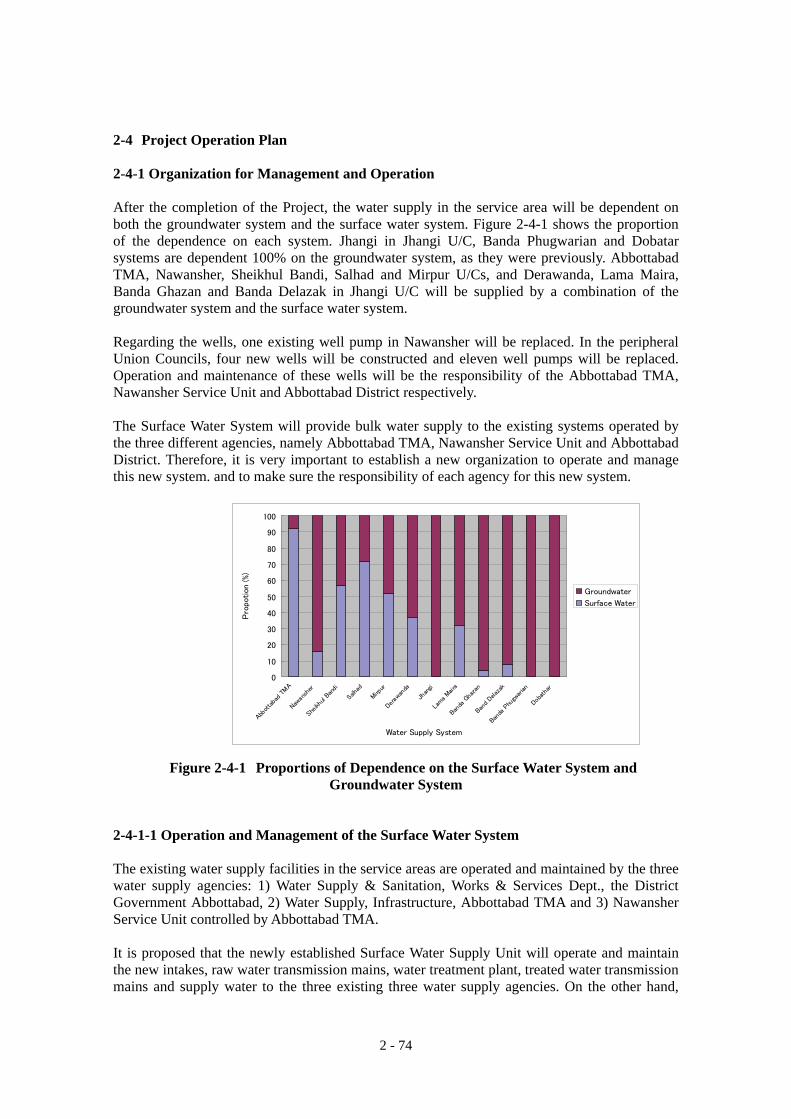
2 - 74
2-4 Project Operation Plan 2-4-1 Organization for Management and Operation After the completion of the Project, the water supply in the service area will be dependent on both the groundwater system and the surface water system. Figure 2-4-1 shows the proportion of the dependence on each system. Jhangi in Jhangi U/C, Banda Phugwarian and Dobatar systems are dependent 100% on the groundwater system, as they were previously. Abbottabad TMA, Nawansher, Sheikhul Bandi, Salhad and Mirpur U/Cs, and Derawanda, Lama Maira, Banda Ghazan and Banda Delazak in Jhangi U/C will be supplied by a combination of the groundwater system and the surface water system.
Regarding the wells, one existing well pump in Nawansher will be replaced. In the peripheral Union Councils, four new wells will be constructed and eleven well pumps will be replaced. Operation and maintenance of these wells will be the responsibility of the Abbottabad TMA, Nawansher Service Unit and Abbottabad District respectively. The Surface Water System will provide bulk water supply to the existing systems operated by the three different agencies, namely Abbottabad TMA, Nawansher Service Unit and Abbottabad District. Therefore, it is very important to establish a new organization to operate and manage this new system. and to make sure the responsibility of each agency for this new system.
Figure 2-4-1 Proportions of Dependence on the Surface Water System and Groundwater System
2-4-1-1 Operation and Management of the Surface Water System The existing water supply facilities in the service areas are operated and maintained by the three water supply agencies: 1) Water Supply & Sanitation, Works & Services Dept., the District Government Abbottabad, 2) Water Supply, Infrastructure, Abbottabad TMA and 3) Nawansher Service Unit controlled by Abbottabad TMA. It is proposed that the newly established Surface Water Supply Unit will operate and maintain the new intakes, raw water transmission mains, water treatment plant, treated water transmission mains and supply water to the three existing three water supply agencies. On the other hand,
0
10
20
30
40
50
60
70
80
90
100
Abbo
ttab
ad TMA
Nawa
nshe
r
Sheikh
ul Ba
ndi
Salhad
Mirp
ur
Derawa
nda
Jhan
gi
Lama Maira
Band
a Gh
azan
Band
Delaz
ak
Band
a Ph
ugwa
rian
Doba
thar
Water Supply System
Pro
potion (%)
Groundwater
Surface Water
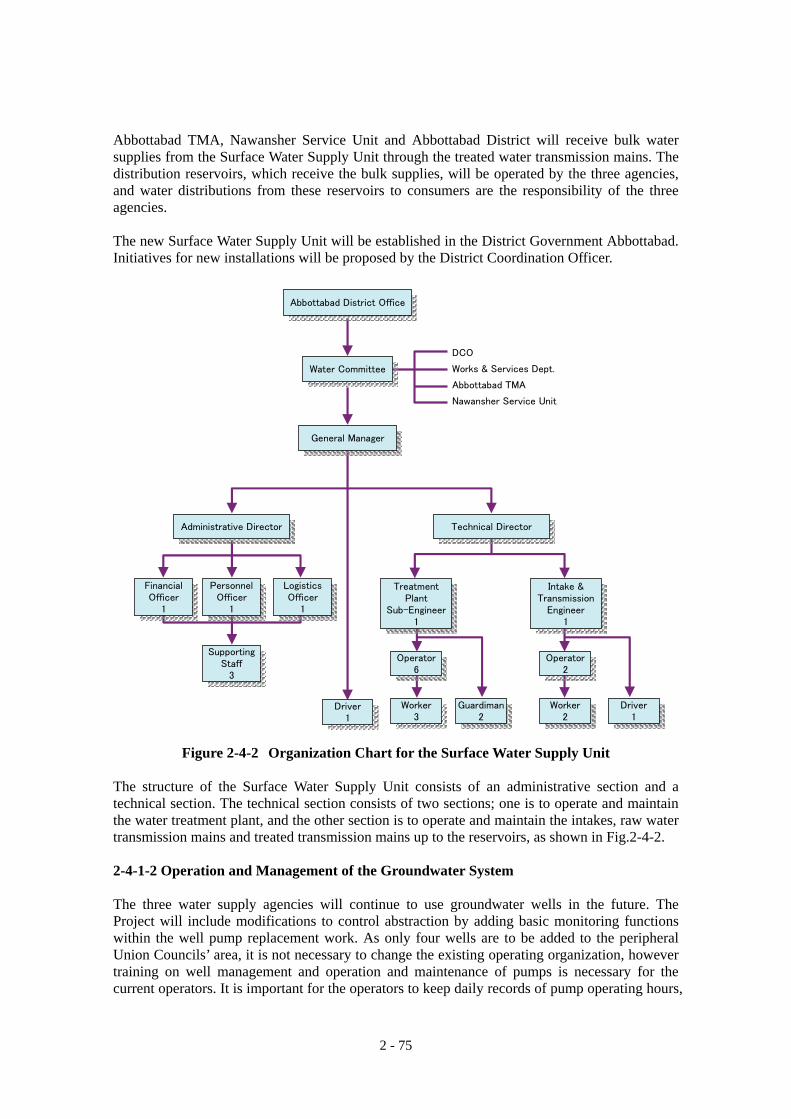
2 - 75
Abbottabad TMA, Nawansher Service Unit and Abbottabad District will receive bulk water supplies from the Surface Water Supply Unit through the treated water transmission mains. The distribution reservoirs, which receive the bulk supplies, will be operated by the three agencies, and water distributions from these reservoirs to consumers are the responsibility of the three agencies. The new Surface Water Supply Unit will be established in the District Government Abbottabad. Initiatives for new installations will be proposed by the District Coordination Officer.
DCO
Works & Services Dept.
Abbottabad TMA
Nawansher Service Unit
Abbottabad District Office
General Manager
Driver1
Administrative Director Technical Director
PersonnelOfficer
1
FinancialOfficer
1
LogisticsOfficer
1
SupportingStaff
3
TreatmentPlant
Sub-Engineer1
Intake &Transmission
Engineer1
Operator6
Worker3
Guardiman2
Operator2
Worker2
Driver1
Water Committee
Figure 2-4-2 Organization Chart for the Surface Water Supply Unit
The structure of the Surface Water Supply Unit consists of an administrative section and a technical section. The technical section consists of two sections; one is to operate and maintain the water treatment plant, and the other section is to operate and maintain the intakes, raw water transmission mains and treated transmission mains up to the reservoirs, as shown in Fig.2-4-2. 2-4-1-2 Operation and Management of the Groundwater System The three water supply agencies will continue to use groundwater wells in the future. The Project will include modifications to control abstraction by adding basic monitoring functions within the well pump replacement work. As only four wells are to be added to the peripheral Union Councils’ area, it is not necessary to change the existing operating organization, however training on well management and operation and maintenance of pumps is necessary for the current operators. It is important for the operators to keep daily records of pump operating hours,
2 - 76
water pressure, flow data and periodic water level readings. 2-4-1-3 Strengthening of Water Bill Collection A flat rate water tariff is presently adopted in Abbottabad TMA and Peripheral Union Councils. The Implementing Agency is, however, keen to introduce metered water charges in conjunction with the Project implementation. Water wastage by flat rate consumers is considered significant, and it is to the introduction of water meters will aid the conservation of water in an area already short of water resources. As Abbottabad TMA and Peripheral Union Councils have no experience in metered billing systems, it is necessary to build capacity in various areas such as water meter installation, meter reading, customer education, and new consumption-based bill collection systems. Setting of the bulk supply tariff will be coordinated and determined among Abbottabad TMA, Nawansher Service Unit, Abbottabad District Works & Services Dept. and the Surface Water Supply Unit. To ensure sustainability, a self-supporting accounting system will be adopted. It is recommended that a component of the consulting services are used to assist the capacity building of the agencies concerned in the management of the Surface Water System, introduction of water meters and revision of tariff policy. 2-4-2 Operation and Maintenance of the Surface Water System 2-4-2-1 Operation and Maintenance of the Water Treatment Plant The Water Treatment Plant will operate on a 24-hour basis with three shifts of operators under the control of the engineer as shown in Fig.2-4-2. Major daily operation and maintenance work is as follows:
(a) Raw Water Quality Monitoring Raw Water Quality is generally stable with low turbidity, but sudden increases may occur when it rains upstream of the intakes. It is necessary to monitor the raw water turbidity periodically and take immediate actions such as stopping the inflow when necessary. (b) Sedimentation and Filtration Processes Periodic observation is necessary to know the degree of accumulation of sediments in sedimentation basins, as well as the clogging of roughing filters and slow sand filters. Desludging from sedimentation basins, backwashing of roughing filters and scraping of slow sand filters will be carried out as required. (c) Disinfection Process Preparation of the bleaching powder solution and controlling the dosage to maintain appropriate residual chlorine is necessary. (d) Data Record Treatment process monitoring such as flow, water quality, frequency of filter washing, filter scraping and consumption of bleaching powder must be recorded.
The District Government Abbottabad has no experience in operating slow sand filtration system or disinfection by bleaching powder. It is necessary to provide technical training on operation of the treatment plant, through technical guidance as a component of the consulting services.
2 - 77
2-4-2-2 Operation and Maintenance of Intake, Raw Water Transmission Mains and
Treated Water Transmission Mains Periodic patrol of the intakes as well as water mains routes should be done by the operators under the control of the transmission engineer. It is important to identify any abnormal conditions at the facilities or their surrounds at an early stage. Leaks identified during the patrol should be immediately reported and repaired. The supply of bulk water to the distribution reservoirs is controlled by the water level control valves installed at the reservoirs. The operators should check the function of the valves and provide necessary maintenance. In addition, the operators should read water flowmeters installed upstream of the inlet of each distribution reservoir, record the transmission flow data and check the function of the flowmeter. Two operators will be deployed for operation and maintenance of the intakes, raw and treated water transmission mains, flow meters and water level control valves at the distribution reservoirs under the control of the transmission engineer as shown in Fig.2-4-2.
2 - 78
2-5 Project Cost Estimation 2-5-1 Initial Cost Estimation The period of detailed design will be 4.5 months. The procurement and construction period will be 26 months.
The cost borne by the Pakistani Side Rs. 577.4 Million
(Approximately Yen 606 million)1) Land Acquisition: Rs. 80.00 million 2) Access Roads for Construction Sites: Rs. 50.30 million 3)
Power Supply, Water Supply, Drainage, Telephone, Office Furniture:
Rs. 43.50 million
4) Inter-linking of New/Old Reservoirs and Wells: Rs. 31.60 million 5)
Expansion and Rehabilitation of Distribution Network:
Rs. 154.80 million
6) Procurement and Installation of Water Meters: Rs. 78.50 million 7)
Provision for Creation of Project Sub-division (PMU):
Rs. 7.60 million
8)
Commissions for Bank Arrangement, Custom Clearance:
Rs. 91.20 million
9)
Provision for security arrangements for hiring Frontier Constabulary during project execution:
Rs. 37.10 million
10) Contingencies Rs. 2.80 million
Conditions for Cost Estimates are as follows:
1) Date of Estimates: As of May, 2009 2)
Exchange Rates:
US$ 1 = 95.77 Yen Rs.1 = 1.05Yen
3) Period of Construction: 26.0 months 4)
Others:
The Project should be implemented in accordance with the procedures of Japan’s Grant Aid Scheme.
2-5-2 Operation and Maintenance Cost This section discusses the balance of the water revenue (water tariff collection) and expenses (power costs, chemical cost, personnel cost, etc), the need for water tariff revision, and the need for subsidy from the Provincial Government. 2-5-2-1 Water Tariff Abbottabad TMA, Nawansher Service Unit and Abbottabad District Government (for peripheral UCs) are presently adopting different water tariff systems. The water tariff of Abbottabad TMA is set as indicated in Table 2-5-1. It is the flat rate system which does not account for the actual consumption of customers. The water tariff falls into two categories for domestic use and commercial use. The tariff for commercial use is further divided into nine subcategories including hotels, barbershops, schools, and cinemas.
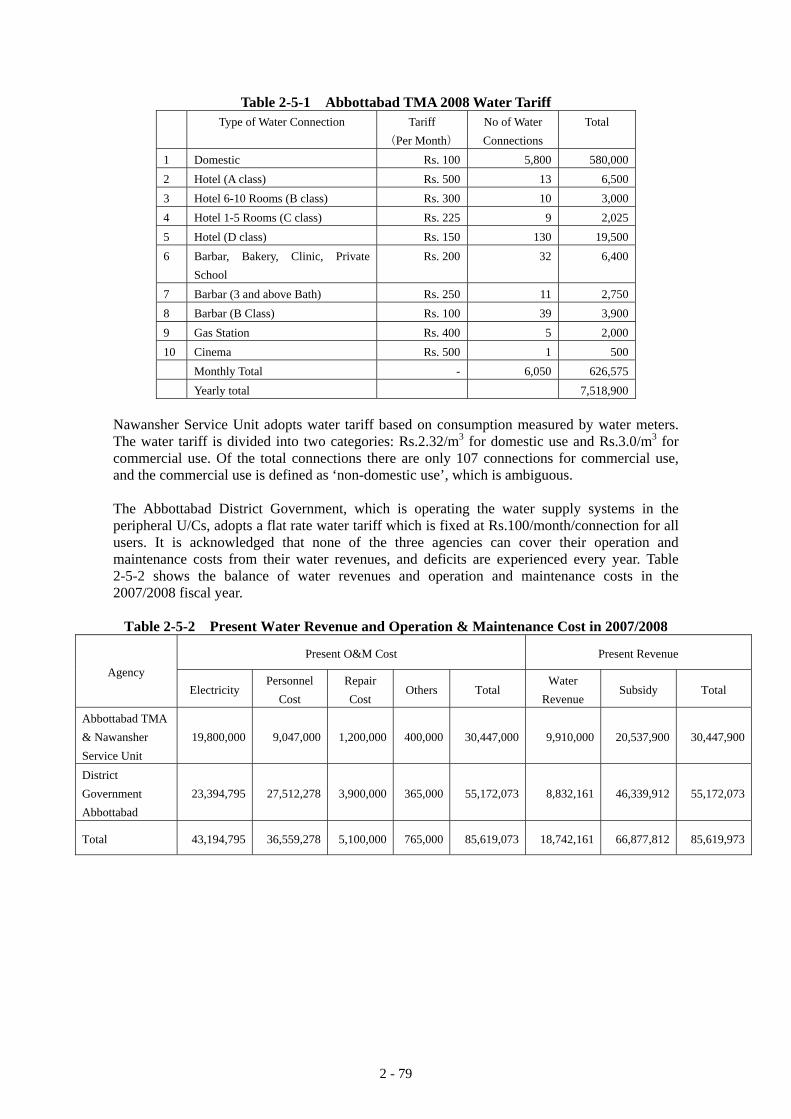
2 - 79
Table 2-5-1 Abbottabad TMA 2008 Water Tariff Type of Water Connection
Tariff
(Per Month)No of Water Connections
Total
1 Domestic Rs. 100 5,800 580,000 2 Hotel (A class) Rs. 500 13 6,500 3 Hotel 6-10 Rooms (B class) Rs. 300 10 3,000 4 Hotel 1-5 Rooms (C class) Rs. 225 9 2,025 5 Hotel (D class) Rs. 150 130 19,500 6 Barbar, Bakery, Clinic, Private
School Rs. 200 32 6,400
7 Barbar (3 and above Bath) Rs. 250 11 2,750 8 Barbar (B Class) Rs. 100 39 3,900 9 Gas Station Rs. 400 5 2,000 10 Cinema Rs. 500 1 500 Monthly Total - 6,050 626,575 Yearly total 7,518,900
Nawansher Service Unit adopts water tariff based on consumption measured by water meters. The water tariff is divided into two categories: Rs.2.32/m3 for domestic use and Rs.3.0/m3 for commercial use. Of the total connections there are only 107 connections for commercial use, and the commercial use is defined as ‘non-domestic use’, which is ambiguous. The Abbottabad District Government, which is operating the water supply systems in the peripheral U/Cs, adopts a flat rate water tariff which is fixed at Rs.100/month/connection for all users. It is acknowledged that none of the three agencies can cover their operation and maintenance costs from their water revenues, and deficits are experienced every year. Table 2-5-2 shows the balance of water revenues and operation and maintenance costs in the 2007/2008 fiscal year.
Table 2-5-2 Present Water Revenue and Operation & Maintenance Cost in 2007/2008
Present O&M Cost Present Revenue Agency
Electricity Personnel
Cost Repair Cost
Others Total Water
Revenue Subsidy Total
Abbottabad TMA & Nawansher Service Unit
19,800,000 9,047,000 1,200,000 400,000 30,447,000 9,910,000 20,537,900 30,447,900
District Government Abbottabad
23,394,795 27,512,278 3,900,000 365,000 55,172,073 8,832,161 46,339,912 55,172,073
Total 43,194,795 36,559,278 5,100,000 765,000 85,619,073 18,742,161 66,877,812 85,619,973
2 - 80
2-5-2-2 Operation and Maintenance Costs and Water Revenues Operation and maintenance costs and water tariff revenues are estimated based on the following conditions:
a. Personnel cost: Calculated from the present level of salaries b. Chemical cost: Calculated using the market price of bleaching powder for
disinfection in Pakistan (Rs. 200/kg) c. Repair cost: 0.2% of the construction cost per year d. Power cost: Calculated from necessary electricity for pump operation based on
WAPDA electricity tariff (Rs. 10/kWh, Tariff D-1) e. Non-Revenue Water
ratio: Non-Revenue Water ratio is 20% of daily water demand in 2015.
f. Water Tariff Increased annually considering the socially affordable tariff which is 4% of the average household income at maximum
Table 2-5-3 shows the annual operation and maintenance costs for the Surface Water System and the costs for Abbottabad TMA, Nawansher Service Unit and District Government Abbottabad. Table 2-5-4 shows a comparison of the annual operation and maintenance costs and water revenues by water tariff collection. The results of the comparison are explained as follows: i) Abbottabad TMA will be able to cover the operation and maintenance costs from their
water revenue after the year of 2016, provided that water tariffs increase annually by 30%. Monthly water charges per connection as a proportion of average monthly household income is 1.90%.
ii) Nawansher Service Unit will be able to cover the operation and maintenance costs from
their water revenue after the year of 2020, provided that water tariffs increase annually by 30%. Monthly water charges per connection as a proportion of average monthly household income is 3.77%.
iii) District Government Abbottabad will be able to cover the operation and maintenance costs
from their water revenue after the year of 2019, provided that water tariffs increase annually by 30%. Monthly water charges per connection as a proportion of average monthly household income is 3.59%.
The overall water revenue of the three agencies will be almost balanced with the total cost in the year 2019, and revenue will exceed costs after this year. It is desirable to adopt a cross subsidy policy between the three water supply agencies, to reduce the burden on other U/Cs of District Government Abbottabad. Accordingly, the Provincial Government will subsidize the deficits that will occur for several years after the Project is completed.
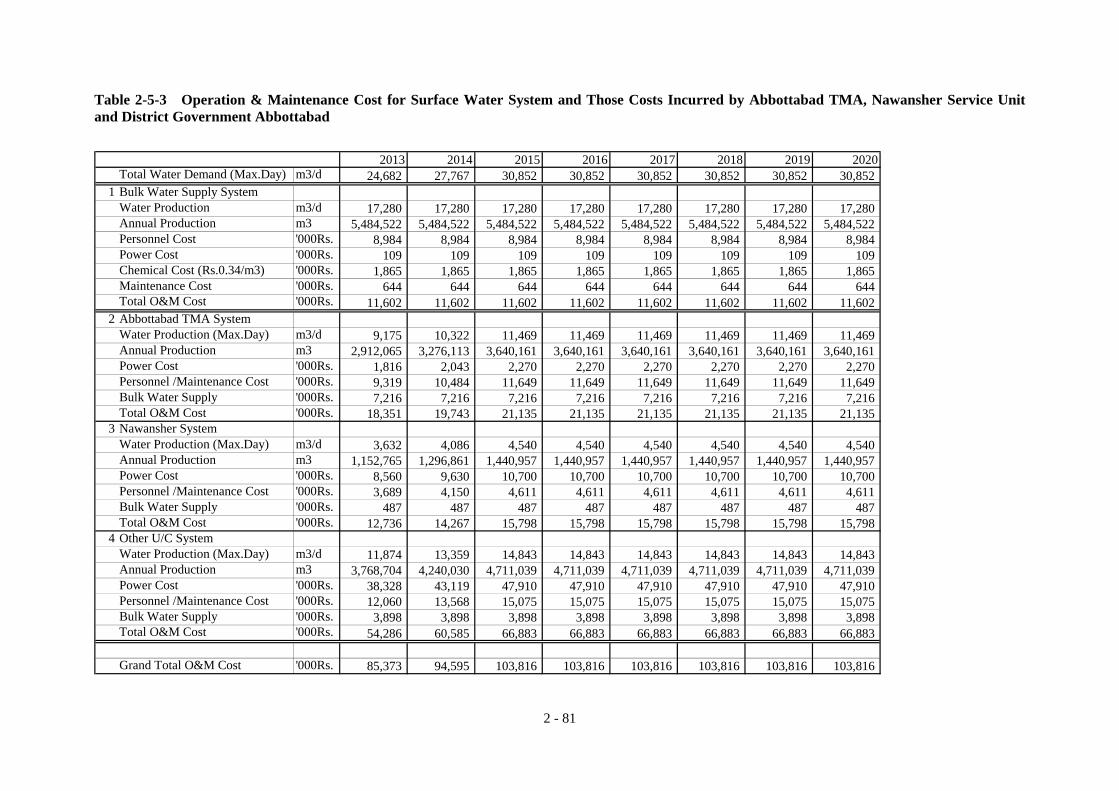
2 - 81
Table 2-5-3 Operation & Maintenance Cost for Surface Water System and Those Costs Incurred by Abbottabad TMA, Nawansher Service Unit and District Government Abbottabad
2013 2014 2015 2016 2017 2018 2019 2020Total Water Demand (Max.Day) m3/d 24,682 27,767 30,852 30,852 30,852 30,852 30,852 30,852
1 Bulk Water Supply SystemWater Production m3/d 17,280 17,280 17,280 17,280 17,280 17,280 17,280 17,280Annual Production m3 5,484,522 5,484,522 5,484,522 5,484,522 5,484,522 5,484,522 5,484,522 5,484,522Personnel Cost '000Rs. 8,984 8,984 8,984 8,984 8,984 8,984 8,984 8,984Power Cost '000Rs. 109 109 109 109 109 109 109 109Chemical Cost (Rs.0.34/m3) '000Rs. 1,865 1,865 1,865 1,865 1,865 1,865 1,865 1,865Maintenance Cost '000Rs. 644 644 644 644 644 644 644 644Total O&M Cost '000Rs. 11,602 11,602 11,602 11,602 11,602 11,602 11,602 11,602
2 Abbottabad TMA SystemWater Production (Max.Day) m3/d 9,175 10,322 11,469 11,469 11,469 11,469 11,469 11,469Annual Production m3 2,912,065 3,276,113 3,640,161 3,640,161 3,640,161 3,640,161 3,640,161 3,640,161Power Cost '000Rs. 1,816 2,043 2,270 2,270 2,270 2,270 2,270 2,270Personnel /Maintenance Cost '000Rs. 9,319 10,484 11,649 11,649 11,649 11,649 11,649 11,649Bulk Water Supply '000Rs. 7,216 7,216 7,216 7,216 7,216 7,216 7,216 7,216Total O&M Cost '000Rs. 18,351 19,743 21,135 21,135 21,135 21,135 21,135 21,135
3 Nawansher SystemWater Production (Max.Day) m3/d 3,632 4,086 4,540 4,540 4,540 4,540 4,540 4,540Annual Production m3 1,152,765 1,296,861 1,440,957 1,440,957 1,440,957 1,440,957 1,440,957 1,440,957Power Cost '000Rs. 8,560 9,630 10,700 10,700 10,700 10,700 10,700 10,700Personnel /Maintenance Cost '000Rs. 3,689 4,150 4,611 4,611 4,611 4,611 4,611 4,611Bulk Water Supply '000Rs. 487 487 487 487 487 487 487 487Total O&M Cost '000Rs. 12,736 14,267 15,798 15,798 15,798 15,798 15,798 15,798
4 Other U/C SystemWater Production (Max.Day) m3/d 11,874 13,359 14,843 14,843 14,843 14,843 14,843 14,843Annual Production m3 3,768,704 4,240,030 4,711,039 4,711,039 4,711,039 4,711,039 4,711,039 4,711,039Power Cost '000Rs. 38,328 43,119 47,910 47,910 47,910 47,910 47,910 47,910Personnel /Maintenance Cost '000Rs. 12,060 13,568 15,075 15,075 15,075 15,075 15,075 15,075Bulk Water Supply '000Rs. 3,898 3,898 3,898 3,898 3,898 3,898 3,898 3,898Total O&M Cost '000Rs. 54,286 60,585 66,883 66,883 66,883 66,883 66,883 66,883
Grand Total O&M Cost '000Rs. 85,373 94,595 103,816 103,816 103,816 103,816 103,816 103,816
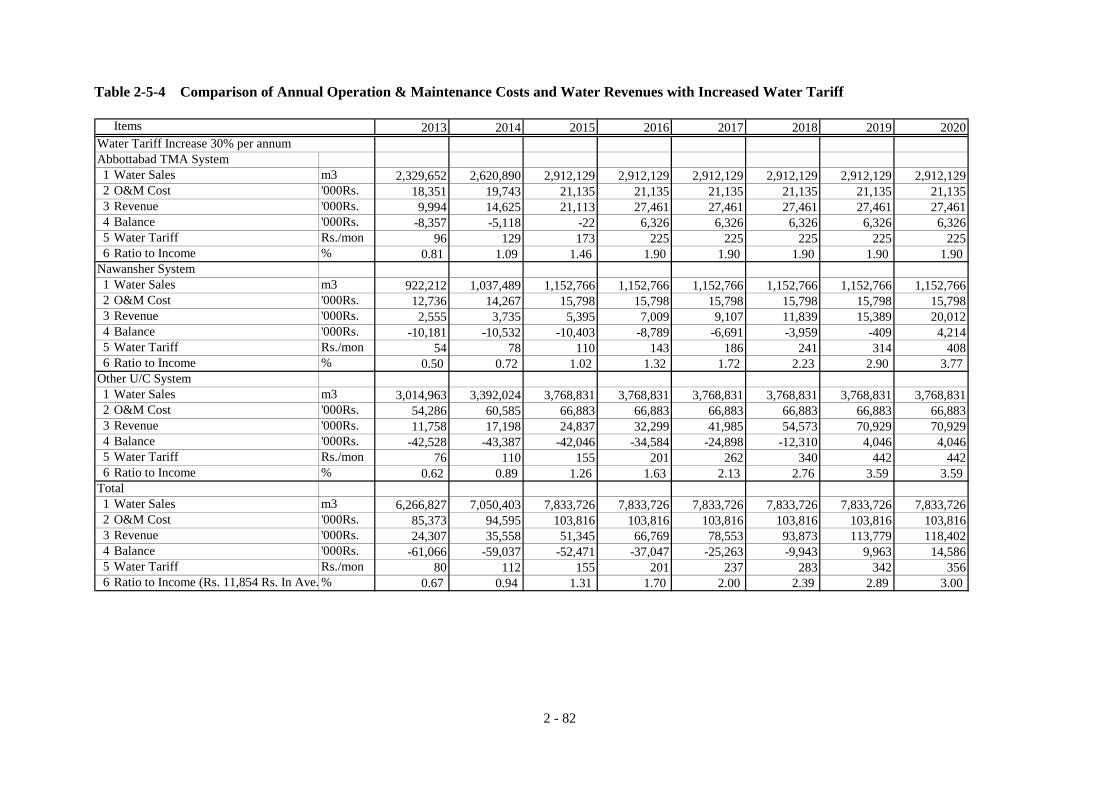
2 - 82
Table 2-5-4 Comparison of Annual Operation & Maintenance Costs and Water Revenues with Increased Water Tariff
Items 2013 2014 2015 2016 2017 2018 2019 2020Water Tariff Increase 30% per annumAbbottabad TMA System1 Water Sales m3 2,329,652 2,620,890 2,912,129 2,912,129 2,912,129 2,912,129 2,912,129 2,912,1292 O&M Cost '000Rs. 18,351 19,743 21,135 21,135 21,135 21,135 21,135 21,1353 Revenue '000Rs. 9,994 14,625 21,113 27,461 27,461 27,461 27,461 27,4614 Balance '000Rs. -8,357 -5,118 -22 6,326 6,326 6,326 6,326 6,3265 Water Tariff Rs./mon 96 129 173 225 225 225 225 2256 Ratio to Income % 0.81 1.09 1.46 1.90 1.90 1.90 1.90 1.90
Nawansher System1 Water Sales m3 922,212 1,037,489 1,152,766 1,152,766 1,152,766 1,152,766 1,152,766 1,152,7662 O&M Cost '000Rs. 12,736 14,267 15,798 15,798 15,798 15,798 15,798 15,7983 Revenue '000Rs. 2,555 3,735 5,395 7,009 9,107 11,839 15,389 20,0124 Balance '000Rs. -10,181 -10,532 -10,403 -8,789 -6,691 -3,959 -409 4,2145 Water Tariff Rs./mon 54 78 110 143 186 241 314 4086 Ratio to Income % 0.50 0.72 1.02 1.32 1.72 2.23 2.90 3.77
Other U/C System1 Water Sales m3 3,014,963 3,392,024 3,768,831 3,768,831 3,768,831 3,768,831 3,768,831 3,768,8312 O&M Cost '000Rs. 54,286 60,585 66,883 66,883 66,883 66,883 66,883 66,8833 Revenue '000Rs. 11,758 17,198 24,837 32,299 41,985 54,573 70,929 70,9294 Balance '000Rs. -42,528 -43,387 -42,046 -34,584 -24,898 -12,310 4,046 4,0465 Water Tariff Rs./mon 76 110 155 201 262 340 442 4426 Ratio to Income % 0.62 0.89 1.26 1.63 2.13 2.76 3.59 3.59
Total1 Water Sales m3 6,266,827 7,050,403 7,833,726 7,833,726 7,833,726 7,833,726 7,833,726 7,833,7262 O&M Cost '000Rs. 85,373 94,595 103,816 103,816 103,816 103,816 103,816 103,8163 Revenue '000Rs. 24,307 35,558 51,345 66,769 78,553 93,873 113,779 118,4024 Balance '000Rs. -61,066 -59,037 -52,471 -37,047 -25,263 -9,943 9,963 14,5865 Water Tariff Rs./mon 80 112 155 201 237 283 342 3566 Ratio to Income (Rs. 11,854 Rs. In Ave. % 0.67 0.94 1.31 1.70 2.00 2.39 2.89 3.00
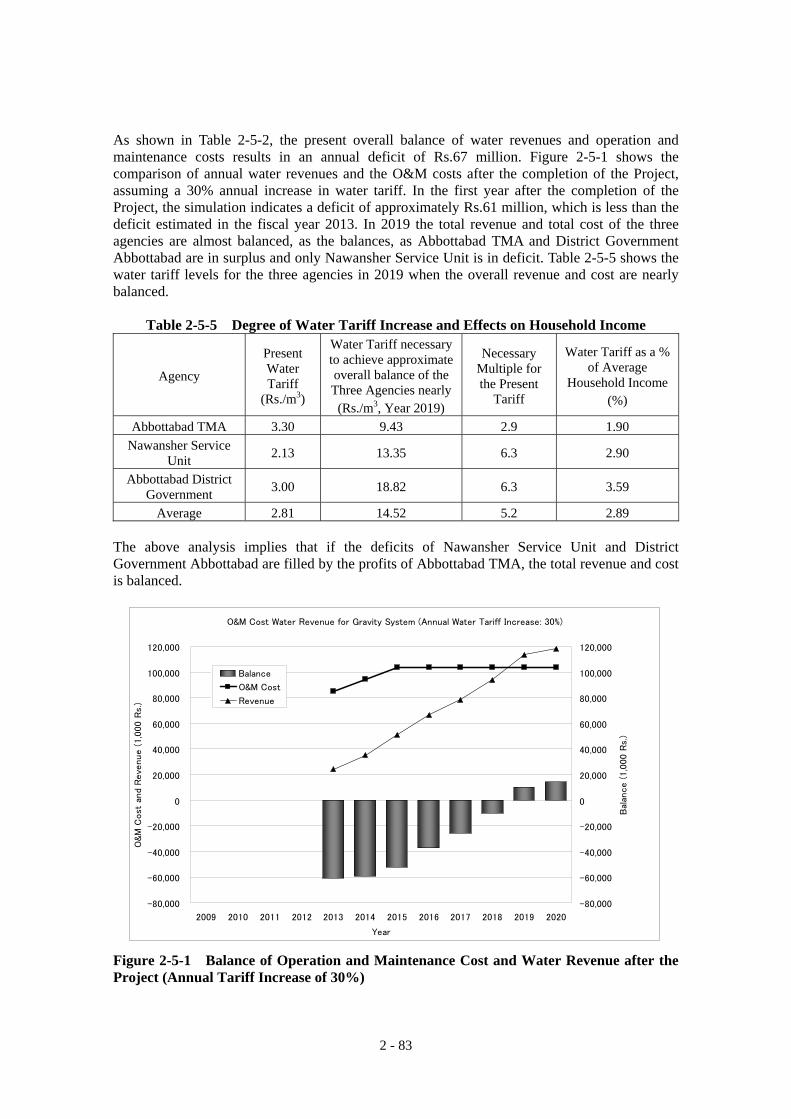
2 - 83
As shown in Table 2-5-2, the present overall balance of water revenues and operation and maintenance costs results in an annual deficit of Rs.67 million. Figure 2-5-1 shows the comparison of annual water revenues and the O&M costs after the completion of the Project, assuming a 30% annual increase in water tariff. In the first year after the completion of the Project, the simulation indicates a deficit of approximately Rs.61 million, which is less than the deficit estimated in the fiscal year 2013. In 2019 the total revenue and total cost of the three agencies are almost balanced, as the balances, as Abbottabad TMA and District Government Abbottabad are in surplus and only Nawansher Service Unit is in deficit. Table 2-5-5 shows the water tariff levels for the three agencies in 2019 when the overall revenue and cost are nearly balanced.
Table 2-5-5 Degree of Water Tariff Increase and Effects on Household Income
Agency
Present Water Tariff
(Rs./m3)
Water Tariff necessary to achieve approximate overall balance of the Three Agencies nearly(Rs./m3, Year 2019)
Necessary Multiple for the Present
Tariff
Water Tariff as a % of Average
Household Income(%)
Abbottabad TMA 3.30 9.43 2.9 1.90 Nawansher Service
Unit 2.13 13.35 6.3 2.90
Abbottabad District Government 3.00 18.82 6.3 3.59
Average 2.81 14.52 5.2 2.89 The above analysis implies that if the deficits of Nawansher Service Unit and District Government Abbottabad are filled by the profits of Abbottabad TMA, the total revenue and cost is balanced.
O&M Cost Water Revenue for Gravity System (Annual Water Tariff Increase: 30%)
-80,000
-60,000
-40,000
-20,000
0
20,000
40,000
60,000
80,000
100,000
120,000
2009 2010 2011 2012 2013 2014 2015 2016 2017 2018 2019 2020
Year
O&M
Cost
and
Reve
nue (
1,0
00 R
s.)
-80,000
-60,000
-40,000
-20,000
0
20,000
40,000
60,000
80,000
100,000
120,000
Bal
ance (
1,0
00 R
s.)
Balance
O&M Cost
Revenue
Figure 2-5-1 Balance of Operation and Maintenance Cost and Water Revenue after the Project (Annual Tariff Increase of 30%)
2 - 84
In conclusion, the following arrangements among the three agencies and support from the Provincial Government will be required: (i) The present water tariffs will be raised to the levels as indicated in Table 2-5-3. (Although
the water tariffs are raised annually by 30% in the above simulation, it may be more practical to raise the tariffs twice up to those levels by the year 2019.)
(ii) Abbottabad TMA, Nawansher Service Unit, District Government Abbottabad will fully
collect the water tariffs from consumers. These three agencies are required to pay for the bulk supply provided by the Gravity Water Supply Unit according to the actual consumption measured by the flow meters installed in the Project.
(iii) The full costs and revenues of the three agencies will balance in 2019. The balance for
Abbottabad TMA and District Government Abbottabad (Peripheral U/Cs) are in surplus, but the balance for Nawansher Service Unit is in deficit. This deficit can be, however, covered by introducing cross subsidy among the three agencies so that the total water revenues of the three agencies cover the total operation and maintenance costs. If the tariff of each agency is set at 2.9% of the average household income, the cost and revenue will be balanced. This implies that if water management in the three agencies is integrated to one body, the total costs will be covered by the water revenues at the above tariff level.
(iv) The Provincial Government will continue to subsidize the three agencies to cover the
deficits after the completion of the Project. The amount of subsidy is, however, expected to reduce year by year if the water tariff is raised sufficiently and the tariff is collected effectively. According to the simulation the subsidy will be zero after the year 2019.
(v) The water revenue is planned to cover the O&M cost in 2019 on the condition that the
NRW ratio is reduced to 20% by 2015 and maintained thereafter. It is therefore necessary that the three agencies make every effort to reduce the water losses and unbilled authorized consumption, to achieve 20% NRW ratio by 2015. In the case that there is still deficit in 2019, the Provincial Government will continue to subsidize the three agencies to cover the deficits.
2-6 Other Relevant Issues The Government of NWFP and the District Government Abbottabad had proceeded to acquire the land for the proposed facilities and access roads. The necessary procedures for land acquisition shall be completed before the commencement of the construction of the proposed facilities.

Chapter 3 Project Evaluation and Recommendations
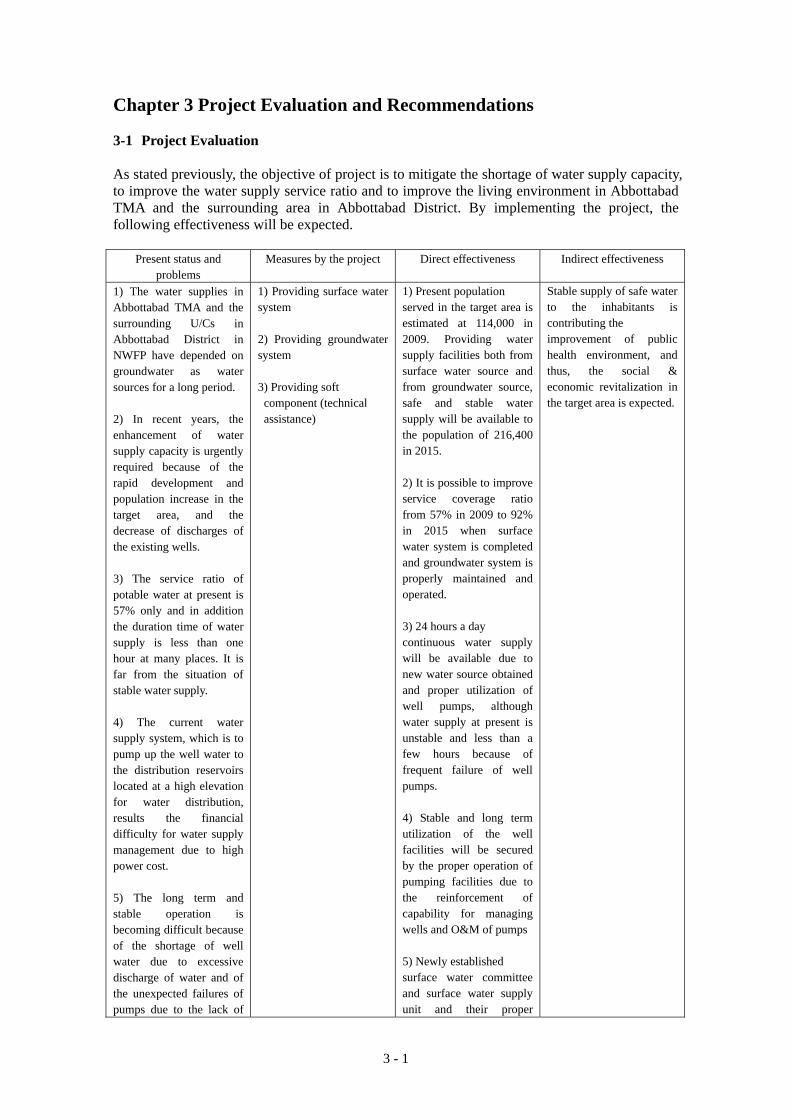
3 - 1
Chapter 3 Project Evaluation and Recommendations 3-1 Project Evaluation As stated previously, the objective of project is to mitigate the shortage of water supply capacity, to improve the water supply service ratio and to improve the living environment in Abbottabad TMA and the surrounding area in Abbottabad District. By implementing the project, the following effectiveness will be expected.
Present status and problems
Measures by the project Direct effectiveness Indirect effectiveness
1) The water supplies in Abbottabad TMA and the surrounding U/Cs in Abbottabad District in NWFP have depended on groundwater as water sources for a long period. 2) In recent years, the enhancement of water supply capacity is urgently required because of the rapid development and population increase in the target area, and the decrease of discharges of the existing wells. 3) The service ratio of potable water at present is 57% only and in addition the duration time of water supply is less than one hour at many places. It is far from the situation of stable water supply. 4) The current water supply system, which is to pump up the well water to the distribution reservoirs located at a high elevation for water distribution, results the financial difficulty for water supply management due to high power cost. 5) The long term and stable operation is becoming difficult because of the shortage of well water due to excessive discharge of water and of the unexpected failures of pumps due to the lack of
1) Providing surface water system 2) Providing groundwater system 3) Providing soft component (technical assistance)
1) Present population served in the target area is estimated at 114,000 in 2009. Providing water supply facilities both from surface water source and from groundwater source, safe and stable water supply will be available to the population of 216,400 in 2015. 2) It is possible to improve service coverage ratio from 57% in 2009 to 92% in 2015 when surface water system is completed and groundwater system is properly maintained and operated. 3) 24 hours a day continuous water supply will be available due to new water source obtained and proper utilization of well pumps, although water supply at present is unstable and less than a few hours because of frequent failure of well pumps. 4) Stable and long term utilization of the well facilities will be secured by the proper operation of pumping facilities due to the reinforcement of capability for managing wells and O&M of pumps 5) Newly established surface water committee and surface water supply unit and their proper
Stable supply of safe water to the inhabitants is contributing the improvement of public health environment, and thus, the social & economic revitalization in the target area is expected.
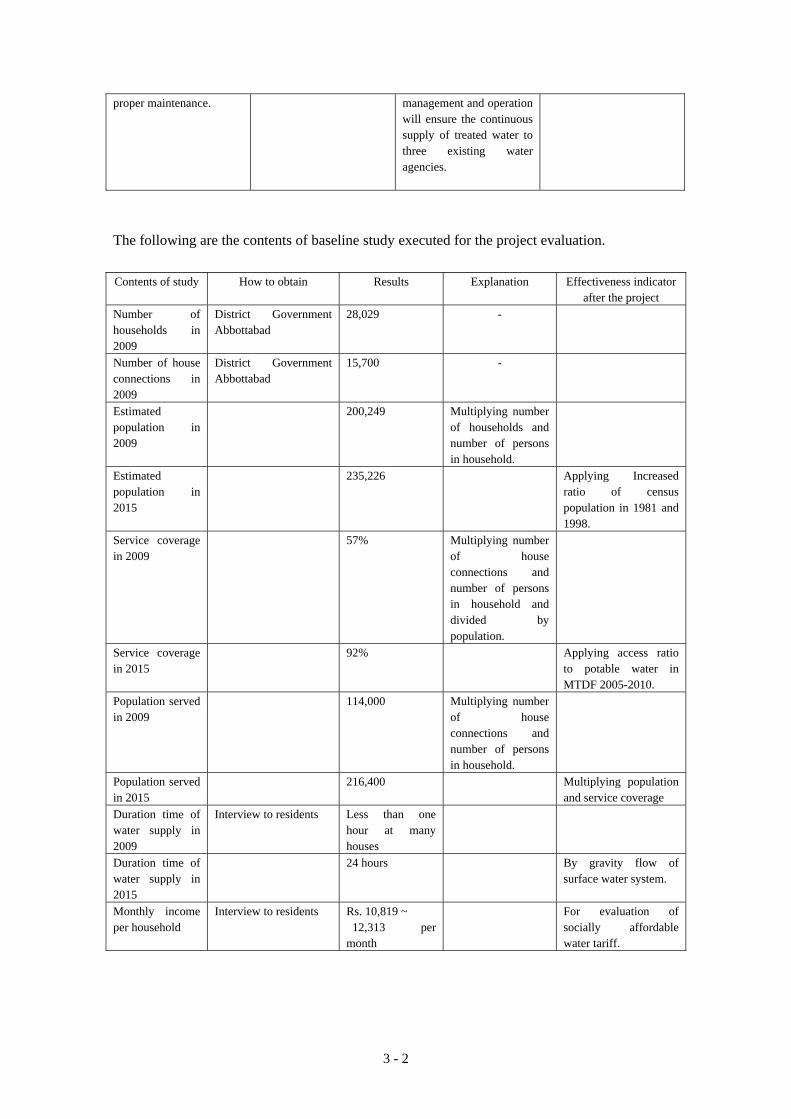
3 - 2
proper maintenance.
management and operation will ensure the continuous supply of treated water to three existing water agencies.
The following are the contents of baseline study executed for the project evaluation. Contents of study How to obtain Results Explanation Effectiveness indicator
after the project Number of households in 2009
District Government Abbottabad
28,029 -
Number of house connections in 2009
District Government Abbottabad
15,700 -
Estimated population in 2009
200,249 Multiplying number of households and number of persons in household.
Estimated population in 2015
235,226 Applying Increased ratio of census population in 1981 and 1998.
Service coverage in 2009
57% Multiplying number of house connections and number of persons in household and divided by population.
Service coverage in 2015
92% Applying access ratio to potable water in MTDF 2005-2010.
Population served in 2009
114,000 Multiplying number of house connections and number of persons in household.
Population served in 2015
216,400 Multiplying population and service coverage
Duration time of water supply in 2009
Interview to residents Less than one hour at many houses
Duration time of water supply in 2015
24 hours By gravity flow of surface water system.
Monthly income per household
Interview to residents Rs. 10,819 ~ 12,313 per month
For evaluation of socially affordable water tariff.
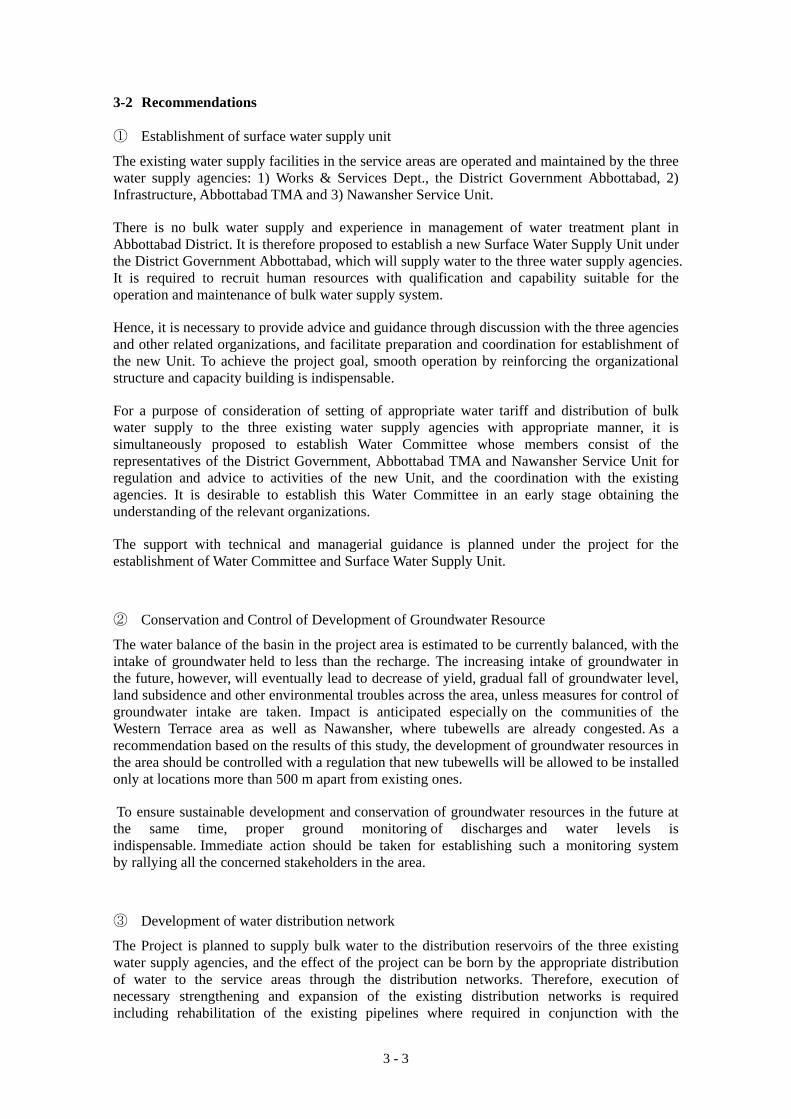
3 - 3
3-2 Recommendations ① Establishment of surface water supply unit
The existing water supply facilities in the service areas are operated and maintained by the three water supply agencies: 1) Works & Services Dept., the District Government Abbottabad, 2) Infrastructure, Abbottabad TMA and 3) Nawansher Service Unit.
There is no bulk water supply and experience in management of water treatment plant in Abbottabad District. It is therefore proposed to establish a new Surface Water Supply Unit under the District Government Abbottabad, which will supply water to the three water supply agencies. It is required to recruit human resources with qualification and capability suitable for the operation and maintenance of bulk water supply system.
Hence, it is necessary to provide advice and guidance through discussion with the three agencies and other related organizations, and facilitate preparation and coordination for establishment of the new Unit. To achieve the project goal, smooth operation by reinforcing the organizational structure and capacity building is indispensable.
For a purpose of consideration of setting of appropriate water tariff and distribution of bulk water supply to the three existing water supply agencies with appropriate manner, it is simultaneously proposed to establish Water Committee whose members consist of the representatives of the District Government, Abbottabad TMA and Nawansher Service Unit for regulation and advice to activities of the new Unit, and the coordination with the existing agencies. It is desirable to establish this Water Committee in an early stage obtaining the understanding of the relevant organizations.
The support with technical and managerial guidance is planned under the project for the establishment of Water Committee and Surface Water Supply Unit.
② Conservation and Control of Development of Groundwater Resource
The water balance of the basin in the project area is estimated to be currently balanced, with the intake of groundwater held to less than the recharge. The increasing intake of groundwater in the future, however, will eventually lead to decrease of yield, gradual fall of groundwater level, land subsidence and other environmental troubles across the area, unless measures for control of groundwater intake are taken. Impact is anticipated especially on the communities of the Western Terrace area as well as Nawansher, where tubewells are already congested. As a recommendation based on the results of this study, the development of groundwater resources in the area should be controlled with a regulation that new tubewells will be allowed to be installed only at locations more than 500 m apart from existing ones.
To ensure sustainable development and conservation of groundwater resources in the future at the same time, proper ground monitoring of discharges and water levels is indispensable. Immediate action should be taken for establishing such a monitoring system by rallying all the concerned stakeholders in the area.
③ Development of water distribution network
The Project is planned to supply bulk water to the distribution reservoirs of the three existing water supply agencies, and the effect of the project can be born by the appropriate distribution of water to the service areas through the distribution networks. Therefore, execution of necessary strengthening and expansion of the existing distribution networks is required including rehabilitation of the existing pipelines where required in conjunction with the

3 - 4
implementation of the Project. PC-1 contains the development cost for the existing distribution networks. It is essential to implement the development of the distribution network with steadily manner.
④ Improvement of drainage system and construction of sewerage system
The improvement of water supply by increasing supply capacity results increase of waste water. It will be necessary to consider the improvement of drainage system first against waste water increase followed by the construction of sewerage system in the future to minimize the water pollution to the downstream.