Embed Size (px)
Citation preview
Presentation of 2nd quarter 2005Oslo, 5 August 2005
2
Agenda
The quarter in brief
Financial result for 2nd quarter 2005
Business divisions status, strategy and outlook
Summary
3
Q2 2005 in brief - financial
Strong financial performance
Drilling Services sold
Expected sales proceeds of NOK 960 million, with a gain of about USD 80 million
New contracts enhancing contract utilisation of the rig fleet to 90 per cent in 2005
Acquired VLCC M/T Apollo
1 year bareboat contract with option to terminate on short notice
Strong financial performanceand continuous high future rig utilisation
4
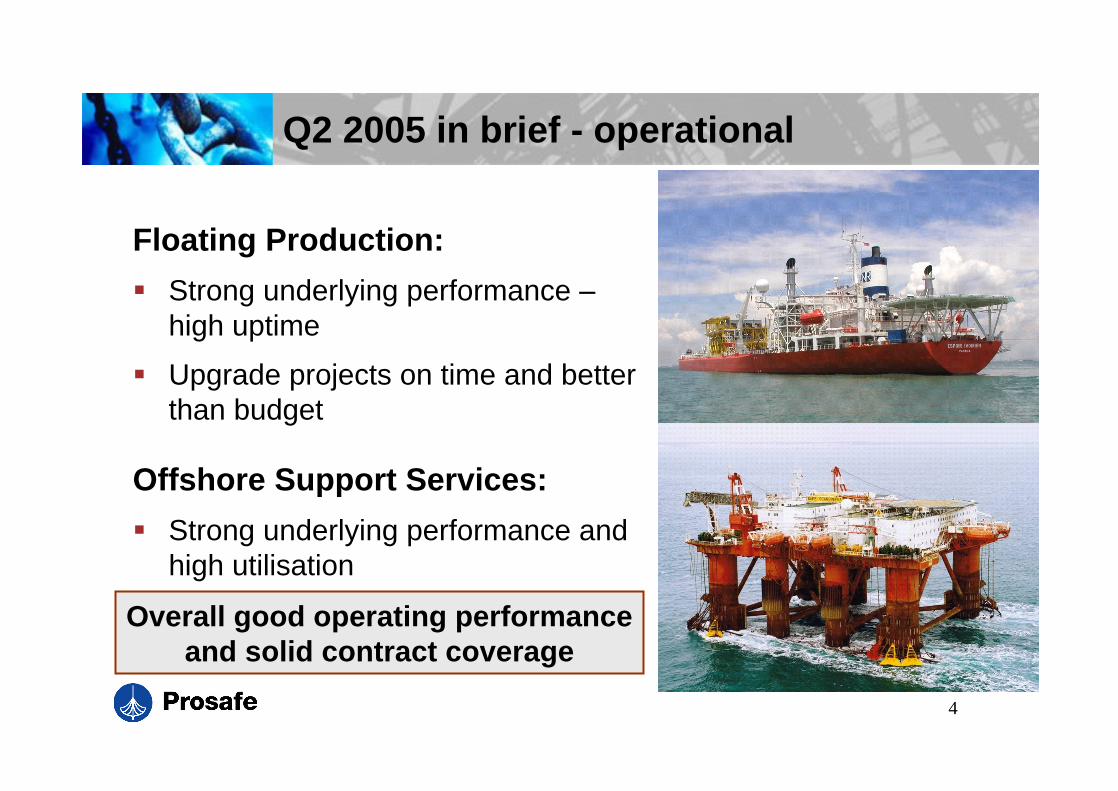
Q2 2005 in brief - operational
Floating Production:
Strong underlying performance high uptime
Upgrade projects on time and better than budget
Offshore Support Services:
Strong underlying performance and high utilisation
Overall good operating performanceand solid contract coverage
5
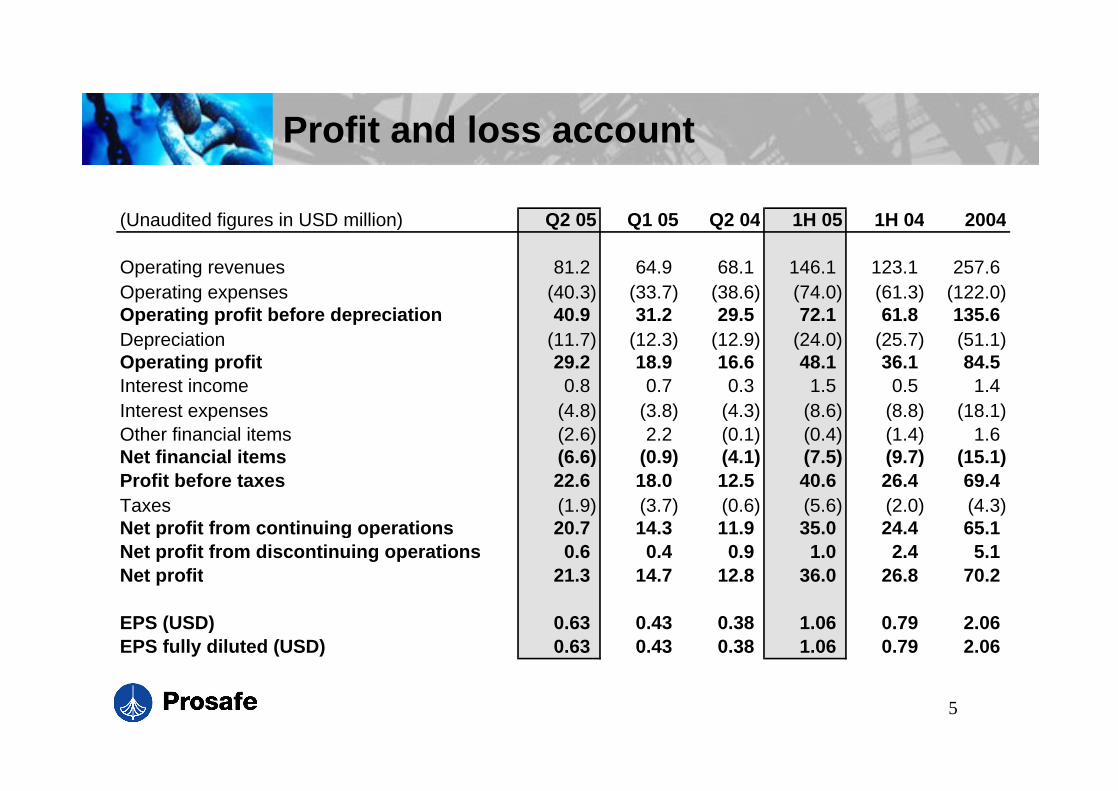
Profit and loss account
(Unaudited figures in USD million) Q2 05 Q1 05 Q2 04 1H 05 1H 04 2004
Operating revenues 81.2 64.9 68.1 146.1 123.1 257.6Operating expenses (40.3) (33.7) (38.6) (74.0) (61.3) (122.0)Operating profit before depreciation 40.9 31.2 29.5 72.1 61.8 135.6Depreciation (11.7) (12.3) (12.9) (24.0) (25.7) (51.1)Operating profit 29.2 18.9 16.6 48.1 36.1 84.5Interest income 0.8 0.7 0.3 1.5 0.5 1.4Interest expenses (4.8) (3.8) (4.3) (8.6) (8.8) (18.1)Other financial items (2.6) 2.2 (0.1) (0.4) (1.4) 1.6Net financial items (6.6) (0.9) (4.1) (7.5) (9.7) (15.1)Profit before taxes 22.6 18.0 12.5 40.6 26.4 69.4Taxes (1.9) (3.7) (0.6) (5.6) (2.0) (4.3)Net profit from continuing operations 20.7 14.3 11.9 35.0 24.4 65.1Net profit from discontinuing operations 0.6 0.4 0.9 1.0 2.4 5.1Net profit 21.3 14.7 12.8 36.0 26.8 70.2
EPS (USD) 0.63 0.43 0.38 1.06 0.79 2.06EPS fully diluted (USD) 0.63 0.43 0.38 1.06 0.79 2.06
6
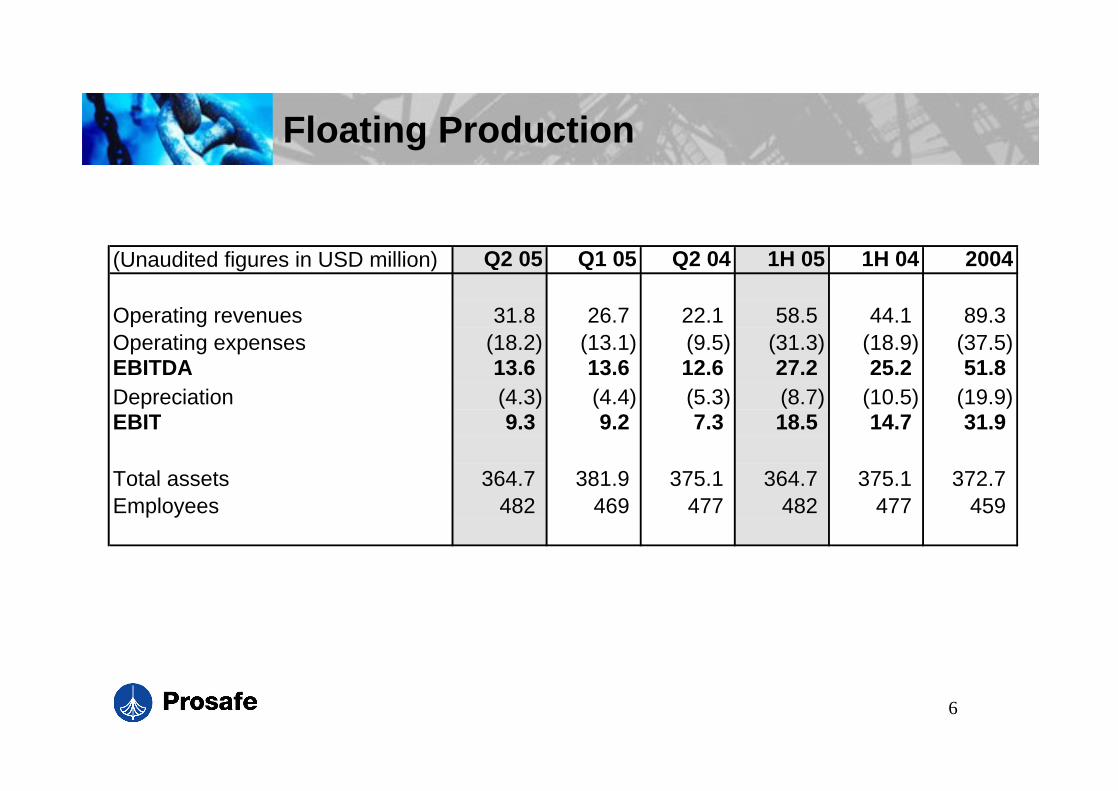
Floating Production
(Unaudited figures in USD million) Q2 05 Q1 05 Q2 04 1H 05 1H 04 2004
Operating revenues 31.8 26.7 22.1 58.5 44.1 89.3Operating expenses (18.2) (13.1) (9.5) (31.3) (18.9) (37.5)EBITDA 13.6 13.6 12.6 27.2 25.2 51.8Depreciation (4.3) (4.4) (5.3) (8.7) (10.5) (19.9)EBIT 9.3 9.2 7.3 18.5 14.7 31.9
Total assets 364.7 381.9 375.1 364.7 375.1 372.7Employees 482 469 477 482 477 459
7
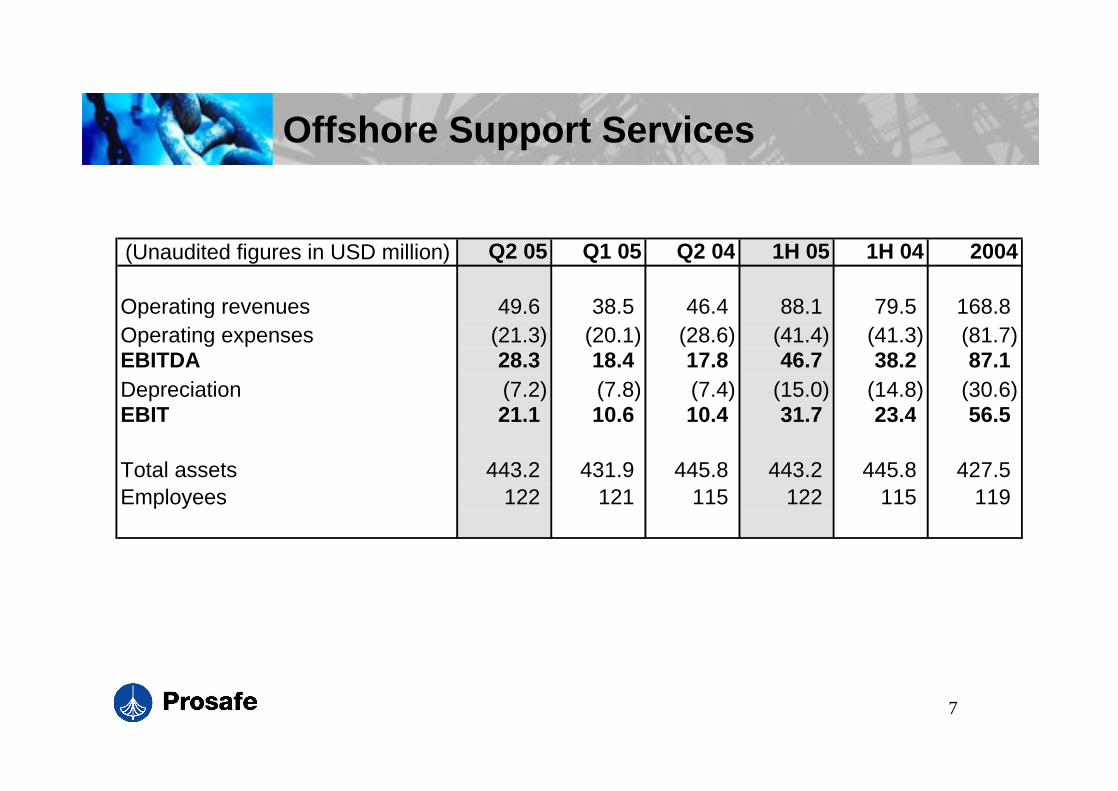
Offshore Support Services
(Unaudited figures in USD million) Q2 05 Q1 05 Q2 04 1H 05 1H 04 2004
Operating revenues 49.6 38.5 46.4 88.1 79.5 168.8Operating expenses (21.3) (20.1) (28.6) (41.4) (41.3) (81.7)EBITDA 28.3 18.4 17.8 46.7 38.2 87.1Depreciation (7.2) (7.8) (7.4) (15.0) (14.8) (30.6)EBIT 21.1 10.6 10.4 31.7 23.4 56.5
Total assets 443.2 431.9 445.8 443.2 445.8 427.5Employees 122 121 115 122 115 119
8
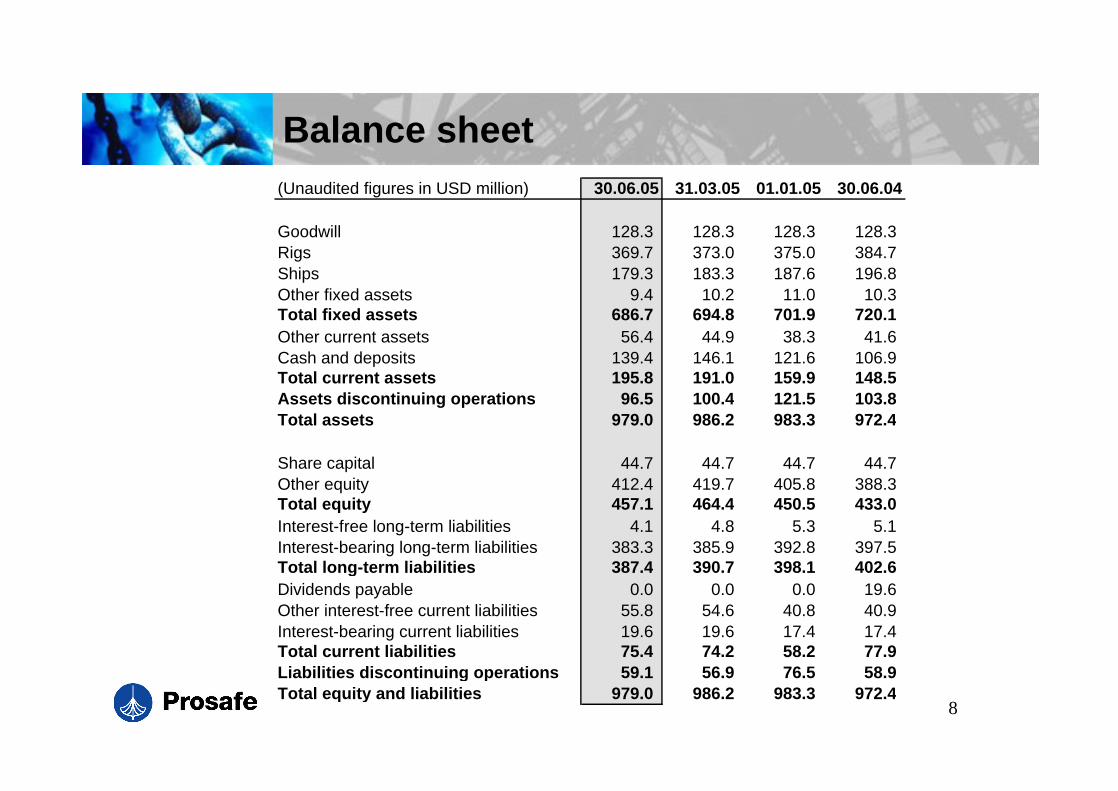
Balance sheet(Unaudited figures in USD million) 30.06.05 31.03.05 01.01.05 30.06.04
Goodwill 128.3 128.3 128.3 128.3Rigs 369.7 373.0 375.0 384.7Ships 179.3 183.3 187.6 196.8Other fixed assets 9.4 10.2 11.0 10.3Total fixed assets 686.7 694.8 701.9 720.1Other current assets 56.4 44.9 38.3 41.6Cash and deposits 139.4 146.1 121.6 106.9Total current assets 195.8 191.0 159.9 148.5Assets discontinuing operations 96.5 100.4 121.5 103.8Total assets 979.0 986.2 983.3 972.4
Share capital 44.7 44.7 44.7 44.7Other equity 412.4 419.7 405.8 388.3Total equity 457.1 464.4 450.5 433.0Interest-free long-term liabilities 4.1 4.8 5.3 5.1Interest-bearing long-term liabilities 383.3 385.9 392.8 397.5Total long-term liabilities 387.4 390.7 398.1 402.6Dividends payable 0.0 0.0 0.0 19.6Other interest-free current liabilities 55.8 54.6 40.8 40.9Interest-bearing current liabilities 19.6 19.6 17.4 17.4Total current liabilities 75.4 74.2 58.2 77.9Liabilities discontinuing operations 59.1 56.9 76.5 58.9Total equity and liabilities 979.0 986.2 983.3 972.4

9
Cash flow
(Unaudited figures in USD million) Q2 05 Q1 05 Q2 04 1H 05 1H 04 2004
Net cash flow from operating activities 18.5 31.8 9.8 50.3 27.1 116.6Net cash flow from investing activities (3.6) (5.2) (8.5) (8.8) (0.9) (8.1)Net cash flow from financing activities (26.4) (0.3) (10.8) (26.7) (29.4) (84.7)Net cash flow from continuing operations (11.5) 26.3 (9.5) 14.8 (3.2) 23.8Net cash flow from discontinuing operations 4.8 (1.8) 8.9 3.0 8.9 (3.4)Cash and deposits at beginning of period 146.1 121.6 107.5 121.6 101.2 101.2Cash and deposits at end of period 139.4 146.1 106.9 139.4 106.9 121.6
10
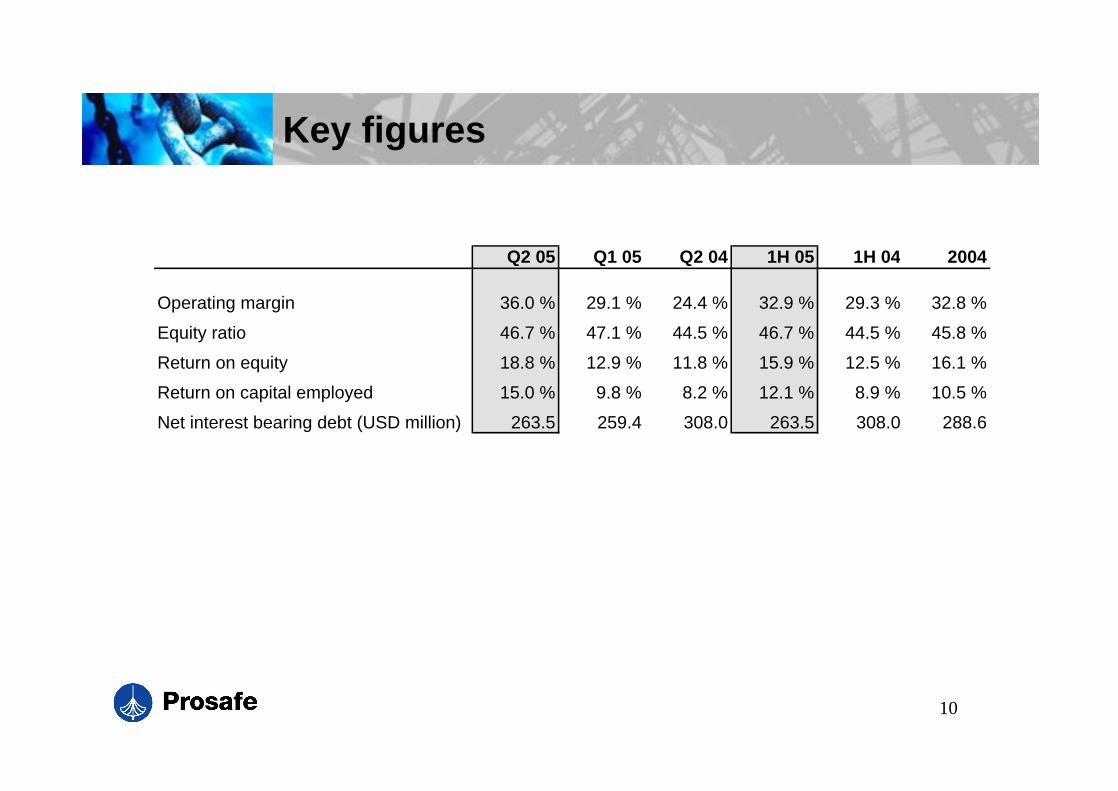
Key figures
Q2 05 Q1 05 Q2 04 1H 05 1H 04 2004
Operating margin 36.0 % 29.1 % 24.4 % 32.9 % 29.3 % 32.8 %
Equity ratio 46.7 % 47.1 % 44.5 % 46.7 % 44.5 % 45.8 %
Return on equity 18.8 % 12.9 % 11.8 % 15.9 % 12.5 % 16.1 %
Return on capital employed 15.0 % 9.8 % 8.2 % 12.1 % 8.9 % 10.5 %
Net interest bearing debt (USD million) 263.5 259.4 308.0 263.5 308.0 288.6
11
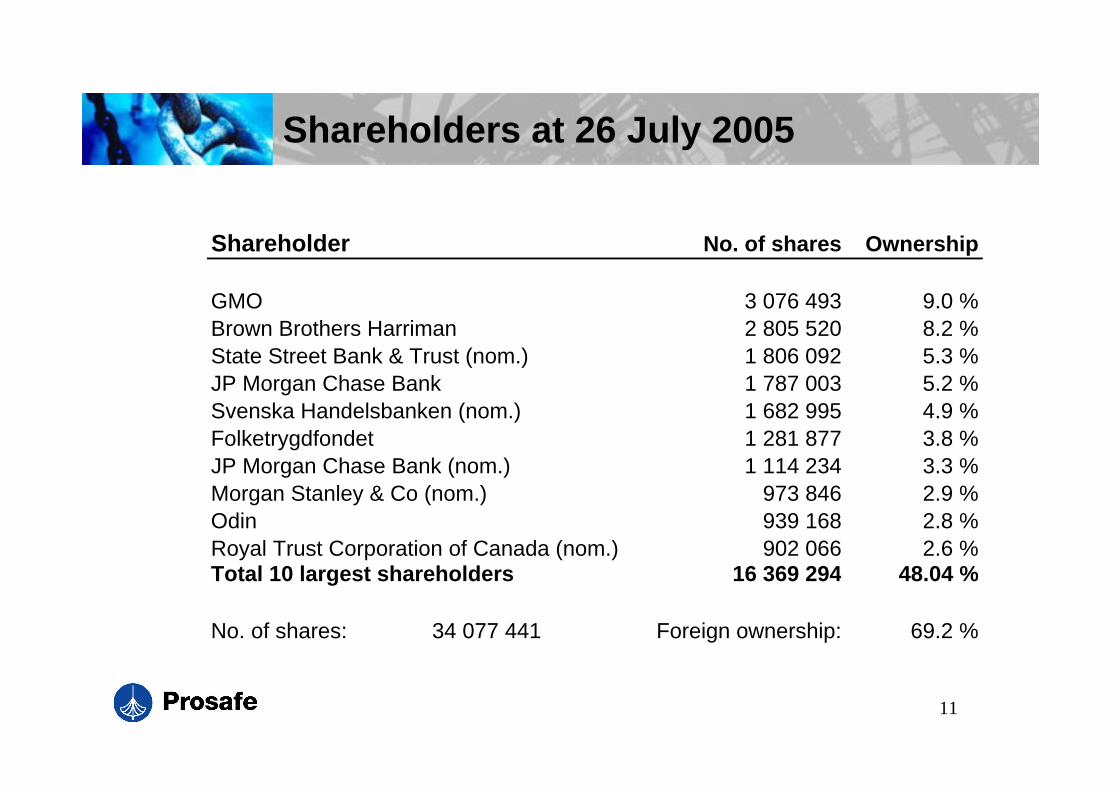
Shareholders at 26 July 2005
Shareholder No. of shares Ownership
GMO 3 076 493 9.0 %Brown Brothers Harriman 2 805 520 8.2 %State Street Bank & Trust (nom.) 1 806 092 5.3 %JP Morgan Chase Bank 1 787 003 5.2 %Svenska Handelsbanken (nom.) 1 682 995 4.9 %Folketrygdfondet 1 281 877 3.8 %JP Morgan Chase Bank (nom.) 1 114 234 3.3 %Morgan Stanley & Co (nom.) 973 846 2.9 %Odin 939 168 2.8 %Royal Trust Corporation of Canada (nom.) 902 066 2.6 %Total 10 largest shareholders 16 369 294 48.04 %
No. of shares: 34 077 441 Foreign ownership: 69.2 %
12
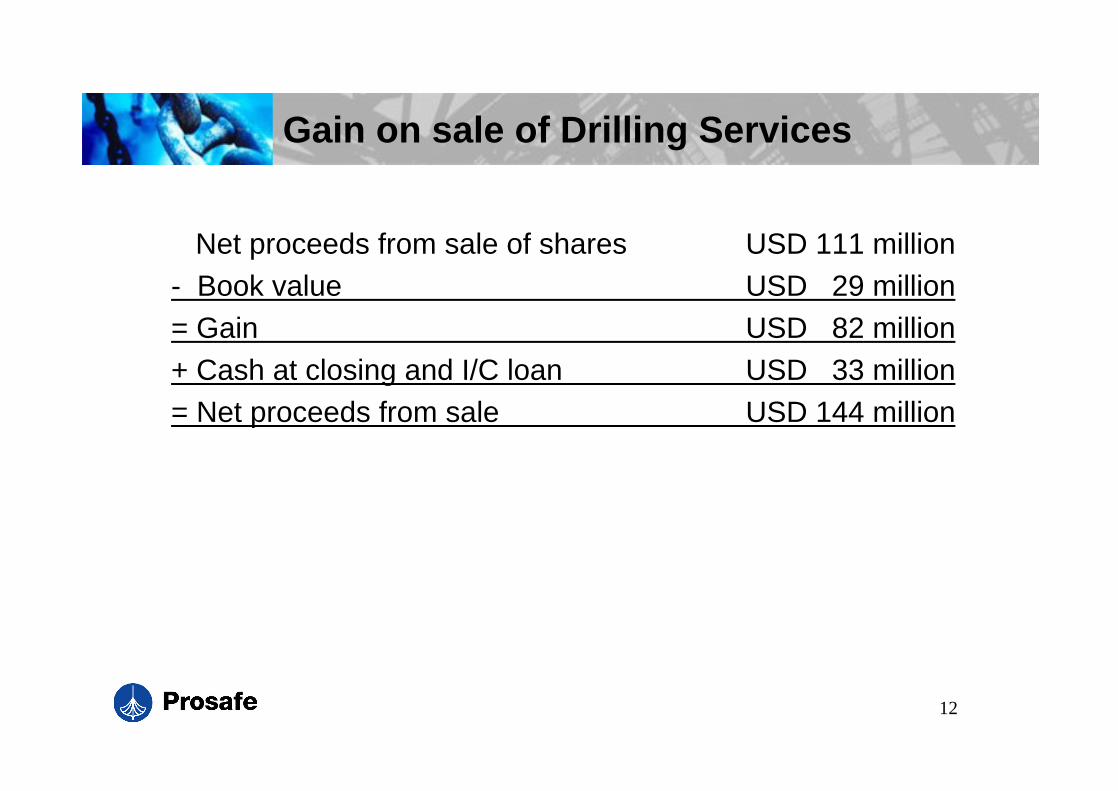
Gain on sale of Drilling Services
Net proceeds from sale of shares USD 111 million- Book value USD 29 million= Gain USD 82 million+ Cash at closing and I/C loan USD 33 million= Net proceeds from sale USD 144 million
13
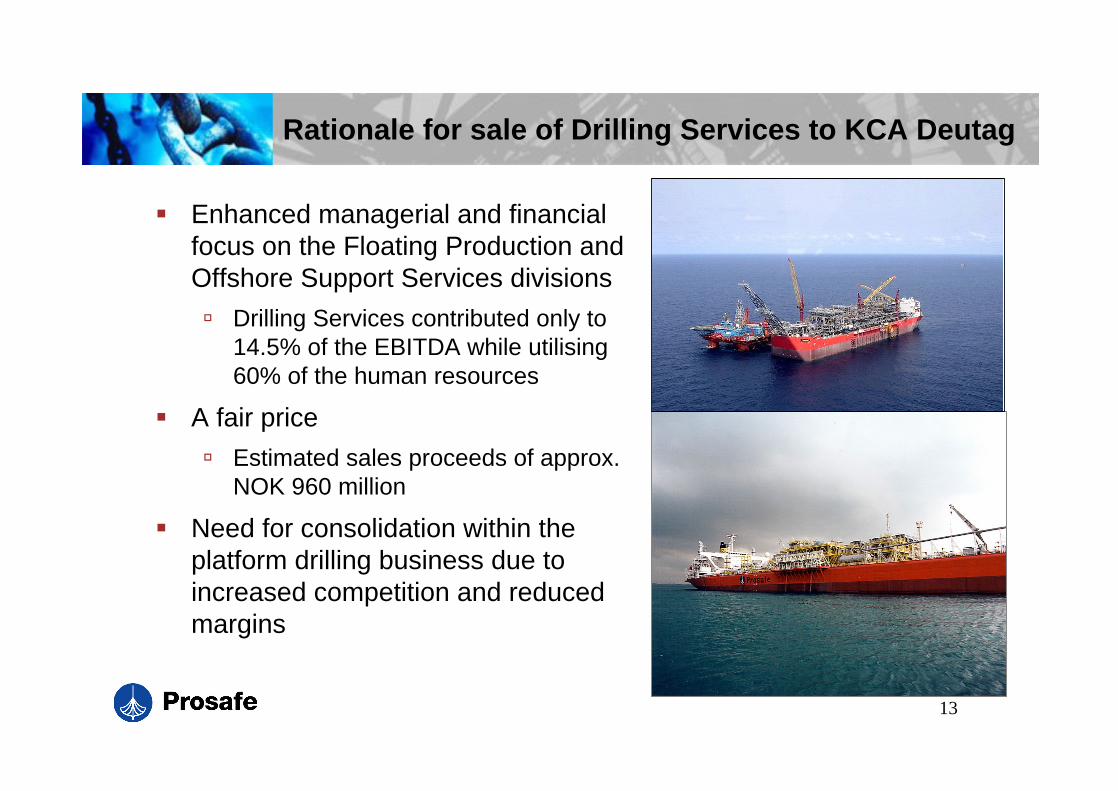
Rationale for sale of Drilling Services to KCA Deutag
Enhanced managerial and financial focus on the Floating Production and Offshore Support Services divisions
Drilling Services contributed only to 14.5% of the EBITDA while utilising 60% of the human resources
A fair price
Estimated sales proceeds of approx. NOK 960 million
Need for consolidation within the platform drilling business due to increased competition and reduced margins
14
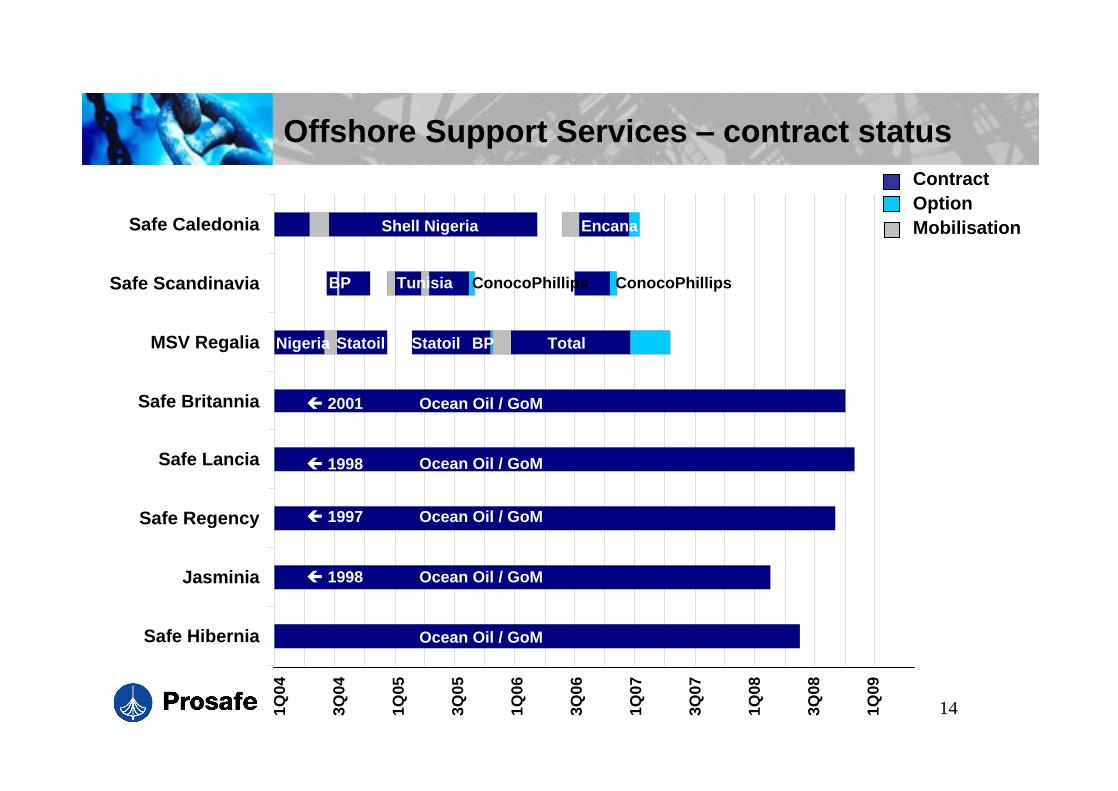
Offshore Support Services contract status
Safe Hibernia
Jasminia
Safe Regency
Safe Lancia
Safe Britannia
MSV Regalia
Safe Scandinavia
Safe Caledonia Shell Nigeria
ContractOptionMobilisationEncana
Ocean Oil / GoM
Ocean Oil / GoM
Ocean Oil / GoM
Ocean Oil / GoM
Ocean Oil / GoM
TotalNigeria Statoil Statoil BP
BP ConocoPhillipsConocoPhillipsTunisia
2001
1998
1997
1998
1Q04
3Q04
1Q05
3Q05
1Q06
3Q06
1Q07
3Q07
1Q08
3Q08
1Q09
15
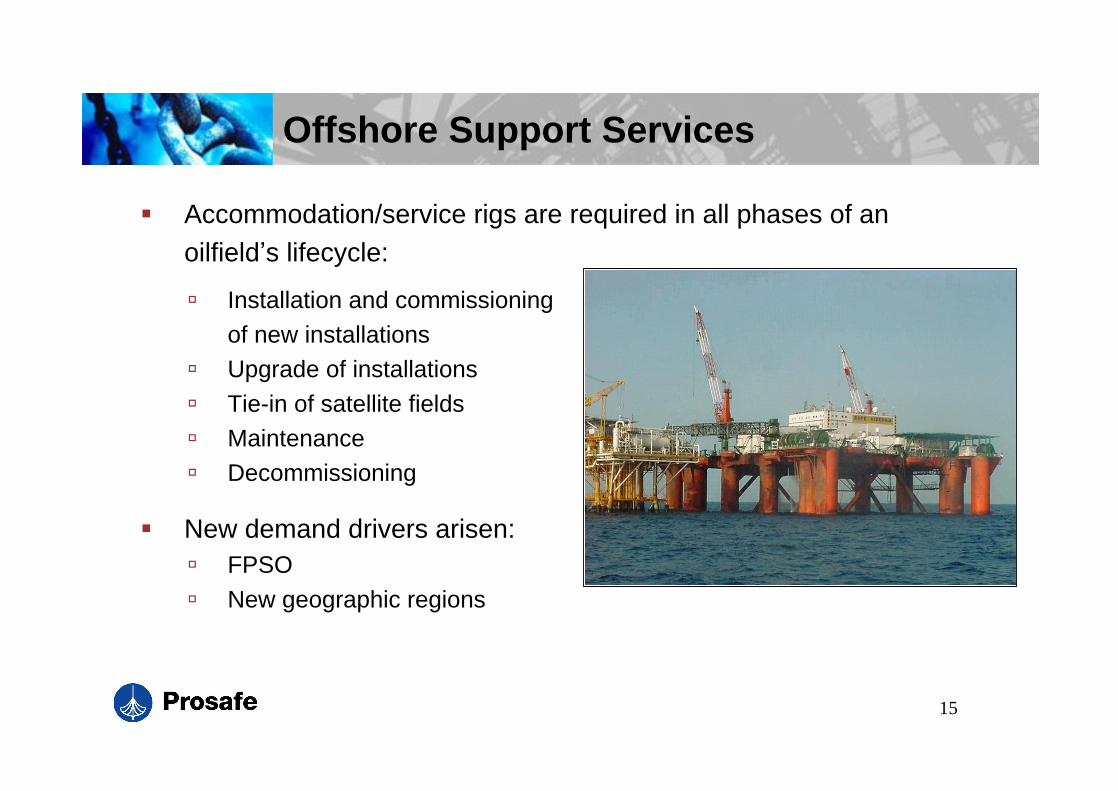
Offshore Support Services
Accommodation/service rigs are required in all phases of anoilfield s lifecycle:
Installation and commissioning of new installationsUpgrade of installations
Tie-in of satellite fieldsMaintenanceDecommissioning
New demand drivers arisen:FPSO
New geographic regions
16
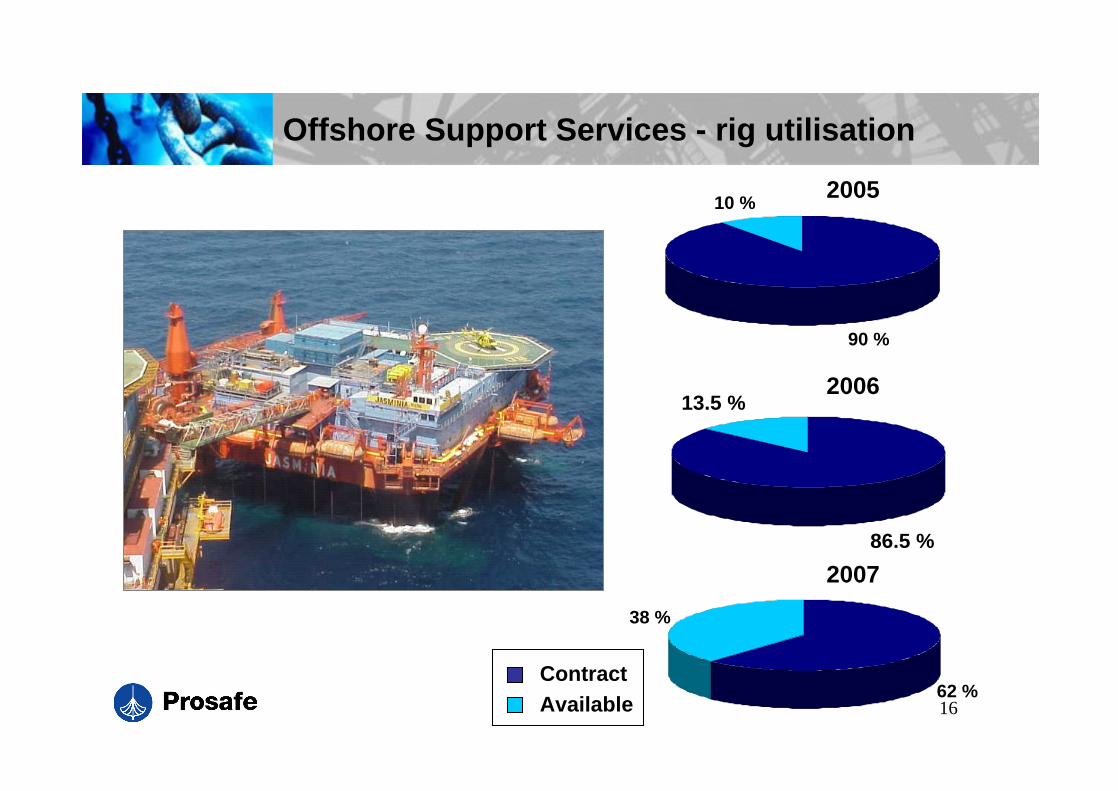
Offshore Support Services - rig utilisation
2005
ContractAvailable
2006
2007
90 %
10 %
86.5 %
13.5 %
62 %
38 %
17
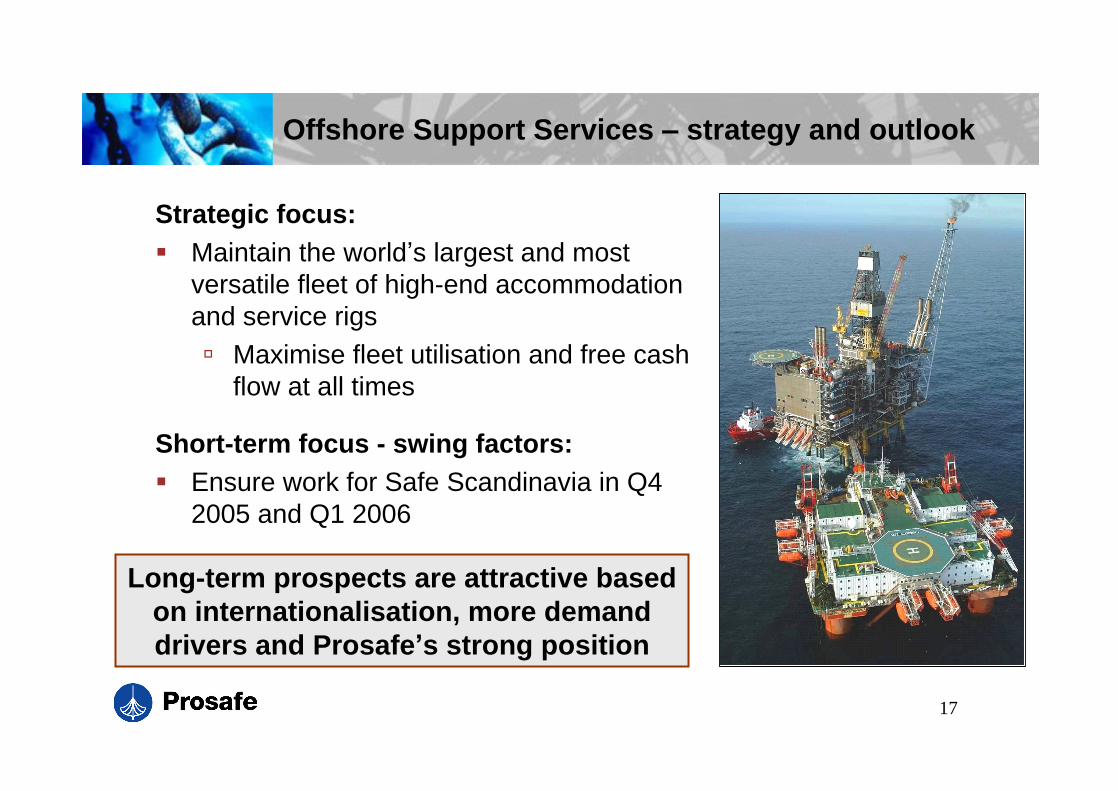
Offshore Support Services strategy and outlook
Strategic focus:Maintain the world s largest and most versatile fleet of high-end accommodation and service rigs
Maximise fleet utilisation and free cash flow at all times
Short-term focus - swing factors:Ensure work for Safe Scandinavia in Q4 2005 and Q1 2006
Long-term prospects are attractive basedon internationalisation, more demand drivers and Prosafe s strong position
18
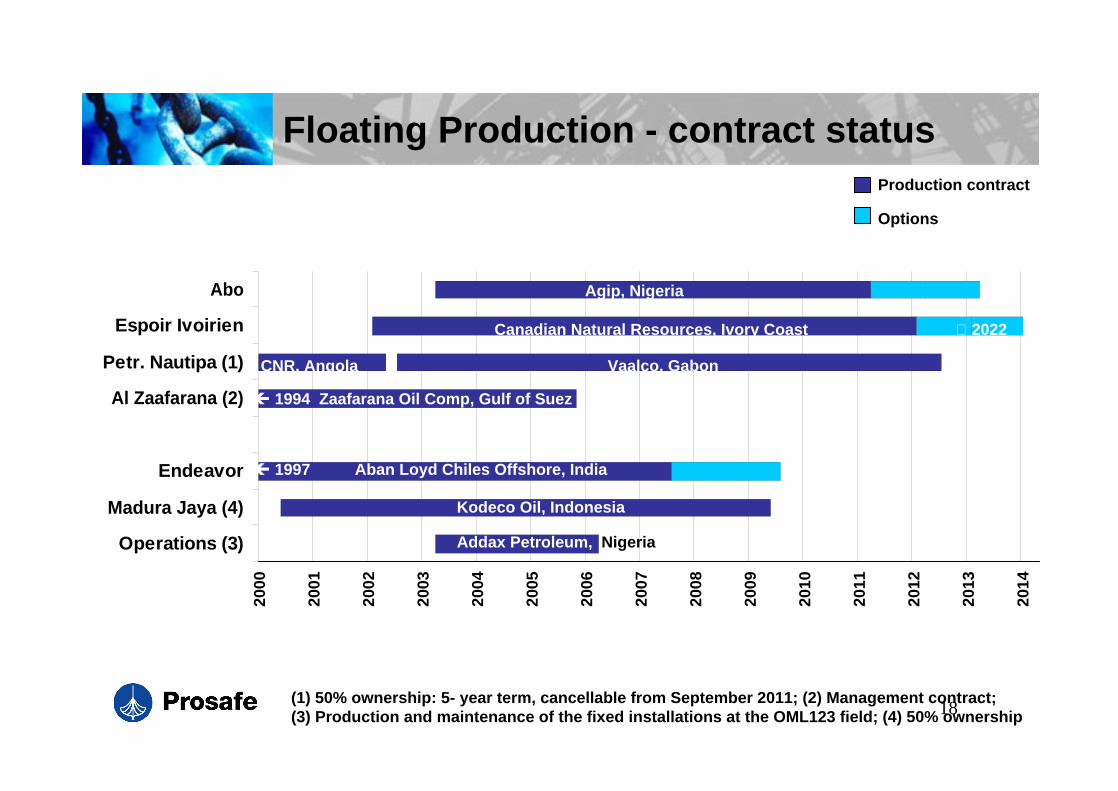
Floating Production - contract status
Operations (3)
Madura Jaya (4)
Endeavor
Al Zaafarana (2)
Petr. Nautipa (1)
Espoir Ivoirien
Abo
2000
2001
2002
2003
2004
2005
2006
2007
2008
2009
2010
2011
2012
2013
2014
Production contract
Options
CNR, Angola
Canadian Natural Resources, Ivory Coast 2022
Vaalco, Gabon
(1) 50% ownership: 5- year term, cancellable from September 2011; (2) Management contract; (3) Production and maintenance of the fixed installations at the OML123 field; (4) 50% ownership
1994 Zaafarana Oil Comp, Gulf of Suez
Addax Petroleum, Nigeria
Agip, Nigeria
Kodeco Oil, Indonesia
1997 Aban Loyd Chiles Offshore, India
19
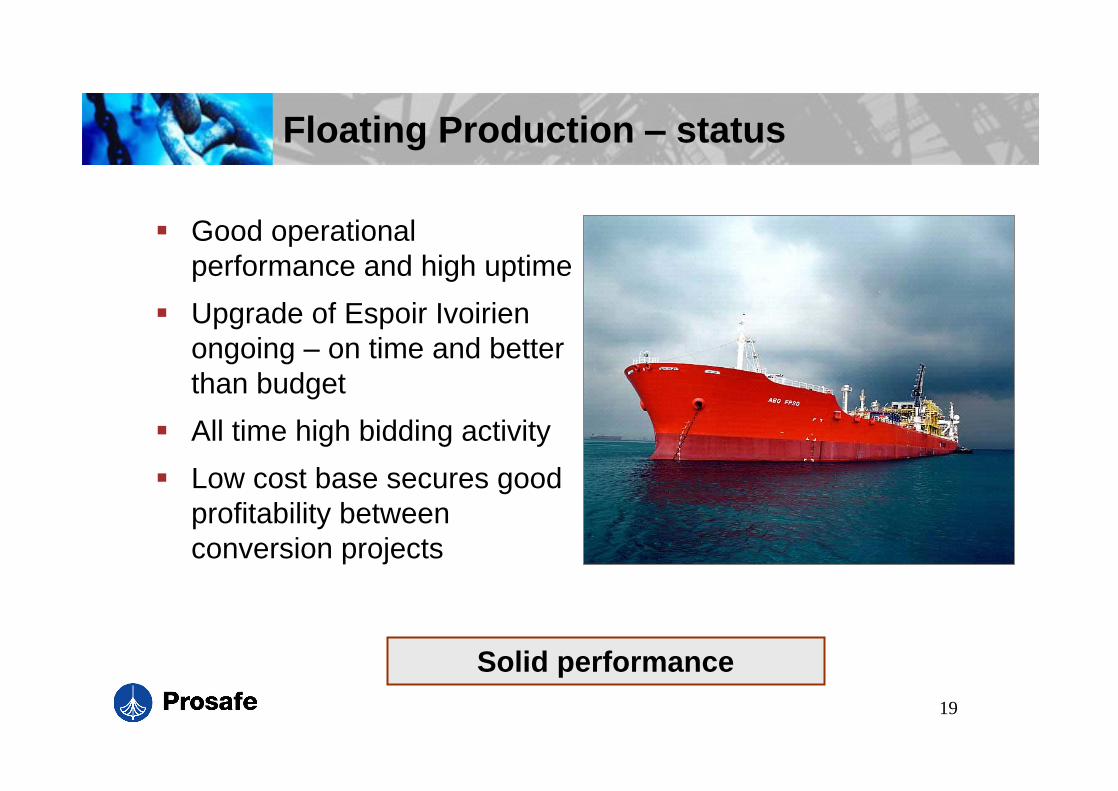
Floating Production status
Good operational performance and high uptime
Upgrade of Espoir Ivoirien ongoing on time and better than budget
All time high bidding activity
Low cost base secures good profitability between conversion projects
Solid performance
20
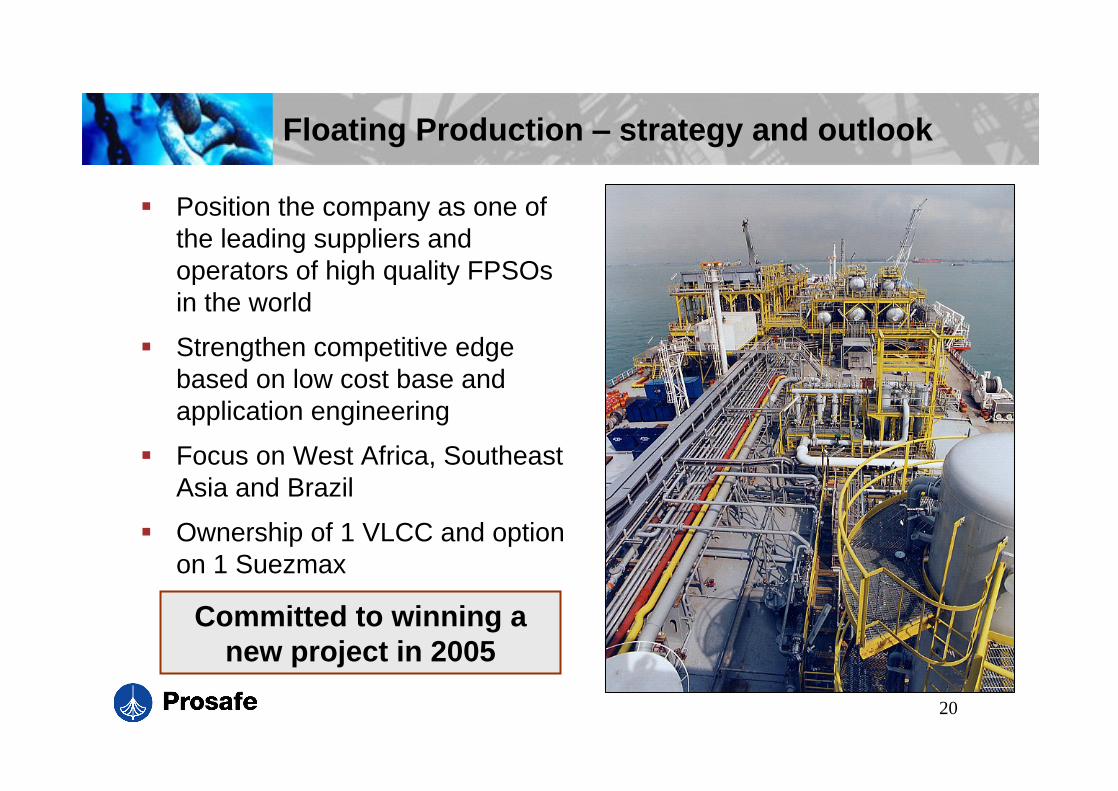
Floating Production strategy and outlook
Position the company as one of the leading suppliers and operators of high quality FPSOsin the world
Strengthen competitive edge based on low cost base and application engineering
Focus on West Africa, Southeast Asia and Brazil
Ownership of 1 VLCC and option on 1 Suezmax
Committed to winning a new project in 2005
21
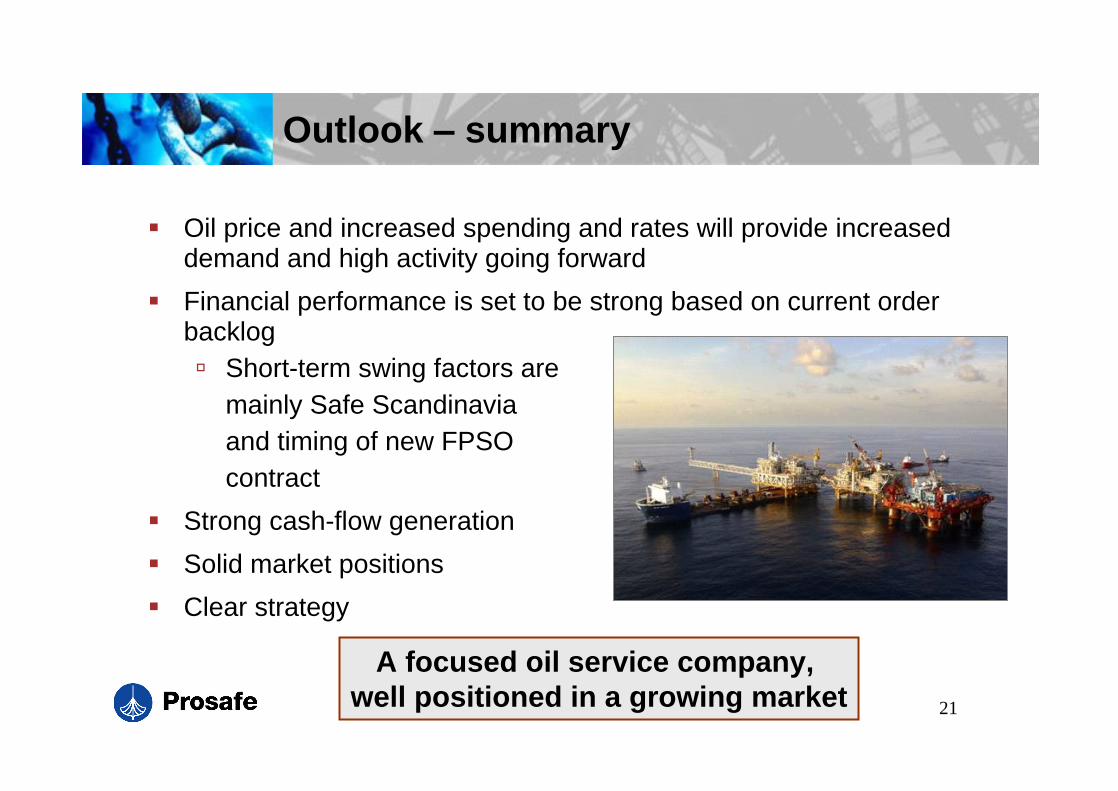
Outlook summary
Oil price and increased spending and rates will provide increased demand and high activity going forward
Financial performance is set to be strong based on current orderbacklog
Short-term swing factors are mainly Safe Scandinavia and timing of new FPSOcontract
Strong cash-flow generation
Solid market positions
Clear strategy
A focused oil service company, well positioned in a growing market