Embed Size (px)
Citation preview

PRESENTATION TO THE PRESENTATION TO THE
ILLINOIS BOARD OF ILLINOIS BOARD OF HIGHER EDUCATIONHIGHER EDUCATION
APRIL 1, 2008APRIL 1, 2008

The High Cost of Efficiency
OrAppropriate
Investment in the State’s Intellectual
Infrastructure
Many claim thatHigher Education
should be
ECONOMICALLY EFFICIENT

IT’S THE ECONOMYIT’S THE ECONOMY
It is universally acknowledged that a It is universally acknowledged that a community without quality community without quality educational institutions is a model educational institutions is a model for economic and social decay.for economic and social decay.

Utopia
The simulation game Utopia anticipates that without a competent education system the technical
infrastructure of a community – subways, sewer systems, telephones, etc. –
will fail on a daily basis.
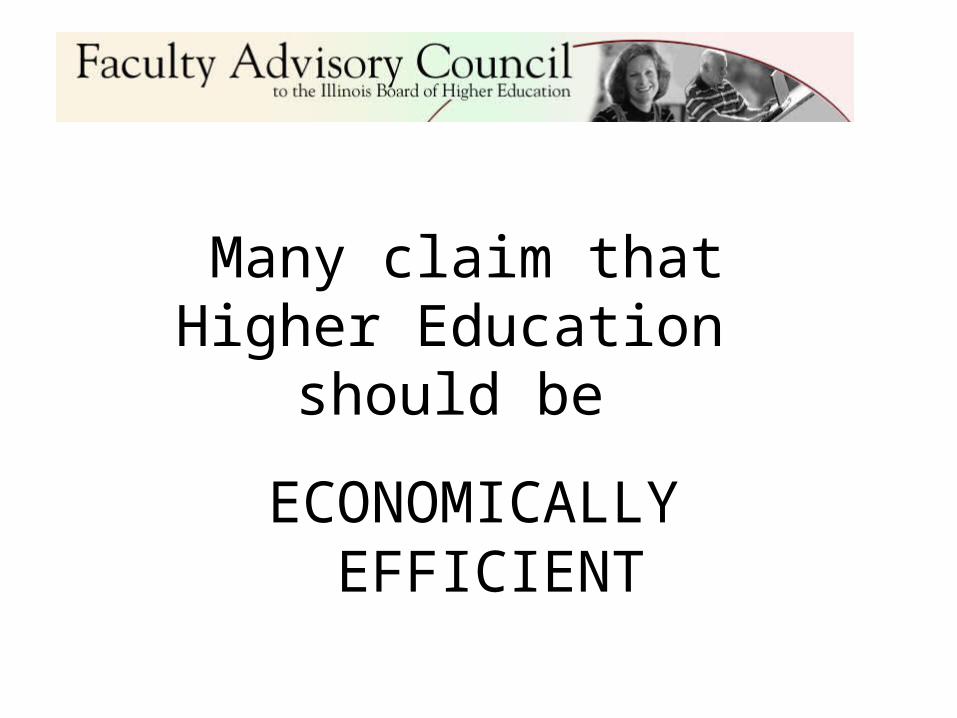
Percentage of Individuals Ages 25 and Older Living in Households in Poverty, by Education Level, 2005
Source-The College Board

Percentage of Individuals Ages 25 and Older Living in Households That Participated in Public Assistance Programs, by Education Level, 2005
Source- The College Board’
Medicaid

Percentage of Individuals Ages 25 and Older Living in Households That Participated in Public Assistance Programs, by Education Level, 2005
Source- The College Board
School Lunch

Percentage of Individuals Ages 25 and Older Living in Households That Participated in Public Assistance Programs, by Education Level, 2005
Source- The College Board
Food Stamps
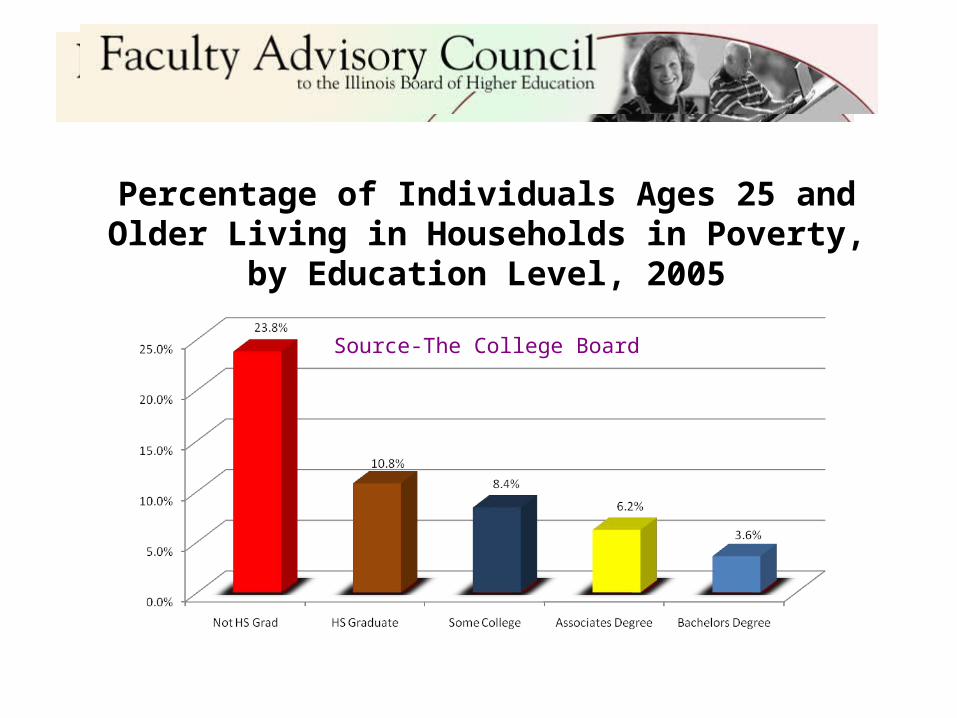
Earning and Taxes Paid by Education level


Per Capita Social Benefitsof Higher Education
• Democratization $ 1,662• Human Rights $ 3,059• Political Stability $ 6,429• Life Expectancy (Net) $ 1,082• Lower Crime Rates $ 5,347• Lower Health Costs $ 6,813• Other $ 510• Total Annual Value $24,902

Percentage of U.S. Citizens Ages 25 and OlderPercentage of U.S. Citizens Ages 25 and Older Who Voted, by Age and Education Level, 2004 Who Voted, by Age and Education Level, 2004
Source-College Board

Higher Education is less and less affordable because students are being asked to pay not only for the cost of instruction but also for:
New buildings Building maintenance
Increased support costs

Student DebtPublic Universities-State appropriations vs. Tuition and Fees FY 01-08
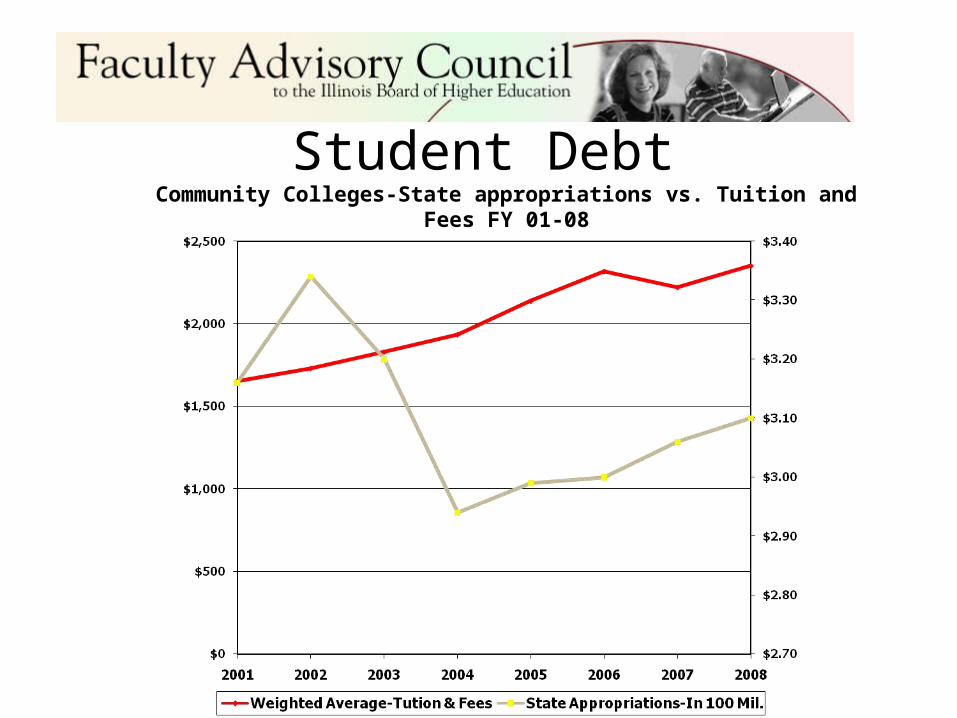
Student DebtCommunity Colleges-State appropriations vs. Tuition and Fees FY 01-08

Weighted Average Tuition & Fees-Public Universities-
9,383
8,348
7,416
6,681
5,803
5,237
4,6194,243
$3,863 4,086
$0
$1,000
$2,000
$3,000
$4,000
$5,000
$6,000
$7,000
$8,000
$9,000
$10,000
1999 2000 2001 2002 2003 2004 2005 2006 2007 2008
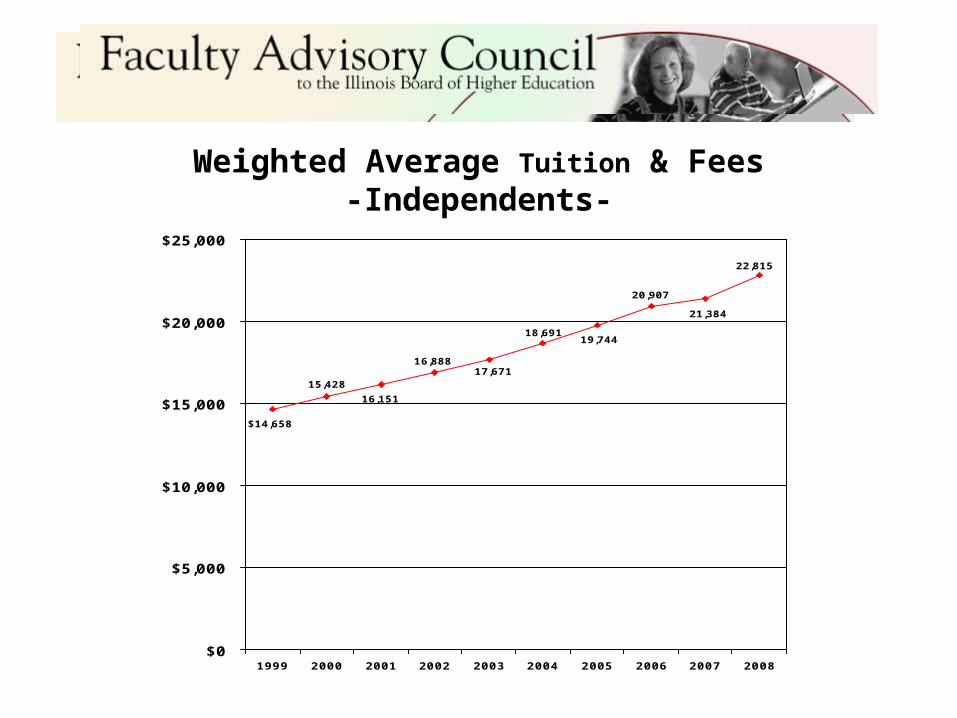
Weighted Average Tuition & Fees-Independents-
22,815
21,384
20,907
19,74418,691
17,67116,888
16,151
15,428
$14,658
$0
$5,000
$10,000
$15,000
$20,000
$25,000
1999 2000 2001 2002 2003 2004 2005 2006 2007 2008
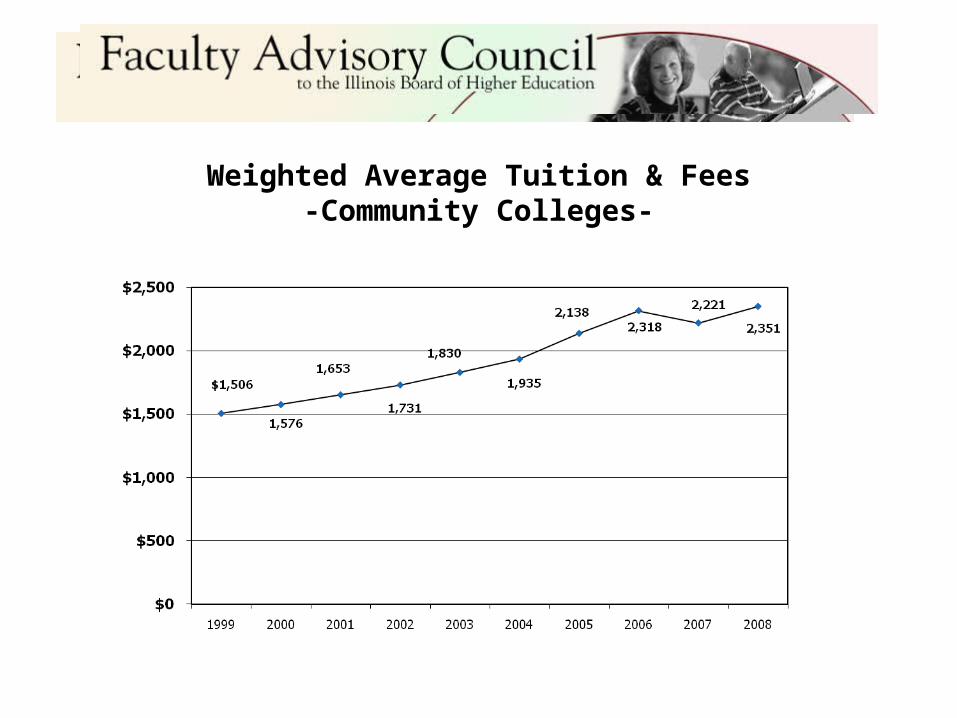
Weighted Average Tuition & Fees-Community Colleges-

Intellectual Infrastructure

World Education Percentage change in Higher education enrollment, 1990 to 2004
Source: National Center for Education Statistics, U.S. Department of Education

Enrollments by Family IncomePercent Change in Enrolled Dependent Freshman Aid
Applicants from FY2002 to FY2007Source: ISU

McMahon
State investment is not only appropriate but necessary
State investment in higher education returns at rates far in excess of 10% (Long term return is 35%)

Recommendations

Georgia’s Hope Scholarship
• All tuition and fees for the state’s top students
• Powerful financial incentive to keep students in state

South Carolina Teacher Loan Program
•Low-paying socially valuable professions
•Teach in an area of critical need – loan is cancelled

NEW YORK STATE PLAN
•Higher education endowment
•Need-based scholarships
•Financial resources grow as tuitions grow
ILLINOIS cannot afford chronic underinvestment in
higher education.