Embed Size (px)
Citation preview

Presentation Prepared for:
The Illinois Board of Higher Education
Higher Education Summit:
“Dollars & Sense”
November 9, 2005Chicago, Illinois
ADVISORY COMMITTEE ON STUDENT FINANCIAL
ASSISTANCE

2
G
About the Advisory Committee
Access and Persistence for Students from Low- and Moderate-Income Families:
Defining terms Identifying the problem Pinpointing causes Specifying solutions
ACSFA Reauthorization Recommendations
A C S F A
Overview of Presentation

3
G
Overview of the Advisory Committee
Independent: created by Congress in 1986
Purpose: To advise Congress and the Secretary of Education on higher education and financial aid policy
Primary Goal: To make recommendations that increase access and persistence for low- and moderate-income students
A C S F A
An independent committee created by Congress to
advise on higher education and student aid policy
4
A C S F A
Defining Terms
5
G
Defining Terms
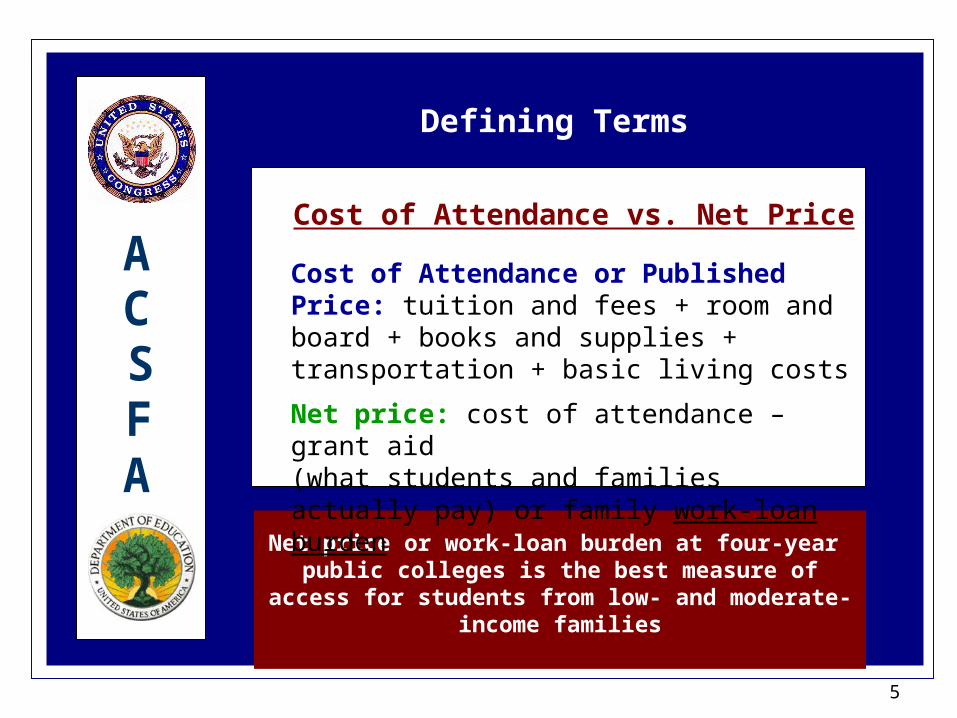
Net price or work-loan burden at four-year public colleges is the best measure of access for students from low- and moderate-income
families
Cost of Attendance vs. Net Price
Cost of Attendance or Published Price: tuition and fees + room and board + books and supplies + transportation + basic living costs
Net price: cost of attendance – grant aid (what students and families actually pay) or family work-loan burden
A C S F A
6
G
Defining Terms
A C S F A
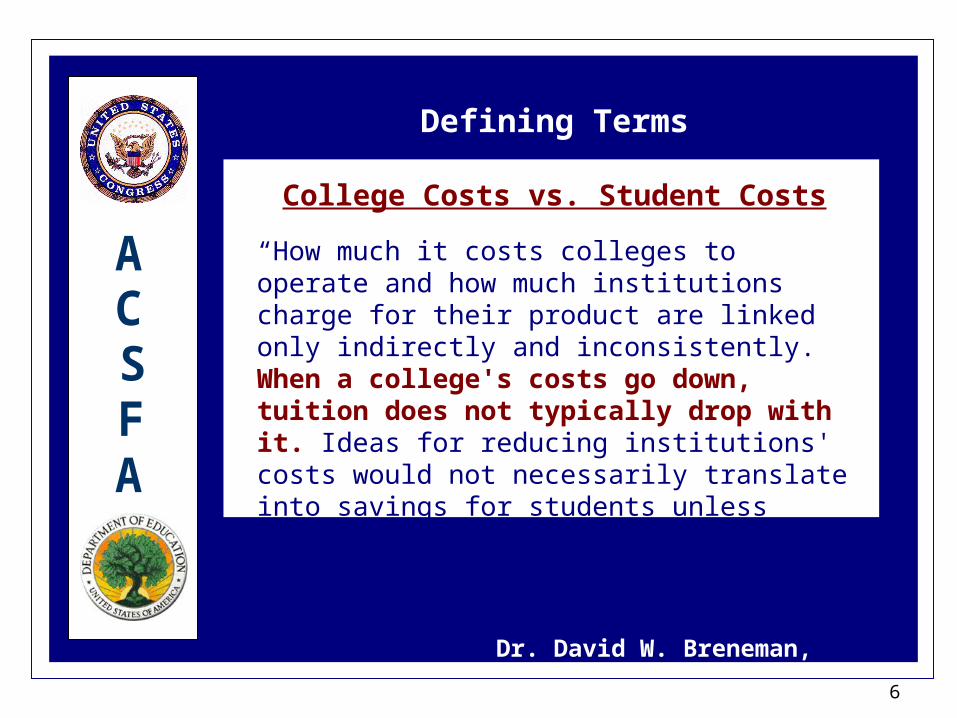
College Costs vs. Student Costs
“How much it costs colleges to operate and how much institutions charge for their product are linked only indirectly and inconsistently. When a college's costs go down, tuition does not typically drop with it. Ideas for reducing institutions' costs would not necessarily translate into savings for students unless colleges took steps to guarantee that result.”
Dr. David W. Breneman, Dean
Curry School of Education University of
Virginia
7
G
Defining Terms
A C S F A
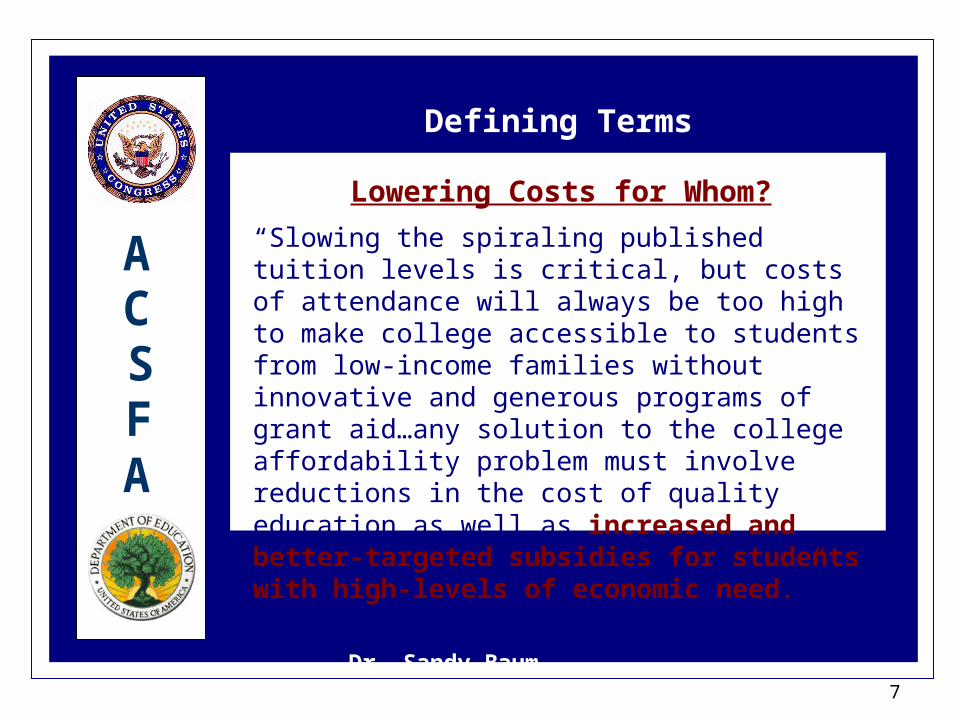
Lowering Costs for Whom?
“Slowing the spiraling published tuition levels is critical, but costs of attendance will always be too high to make college accessible to students from low-income families without innovative and generous programs of grant aid…any solution to the college affordability problem must involve reductions in the cost of quality education as well as increased and better-targeted subsidies for students with high-levels of economic need.”
Dr. Sandy BaumSenior Policy Analyst, College BoardProfessor of Economics, Skidmore
College
8
A C S F A
Identifying the Problem
9
G
Identifying the Problem
A C S F A
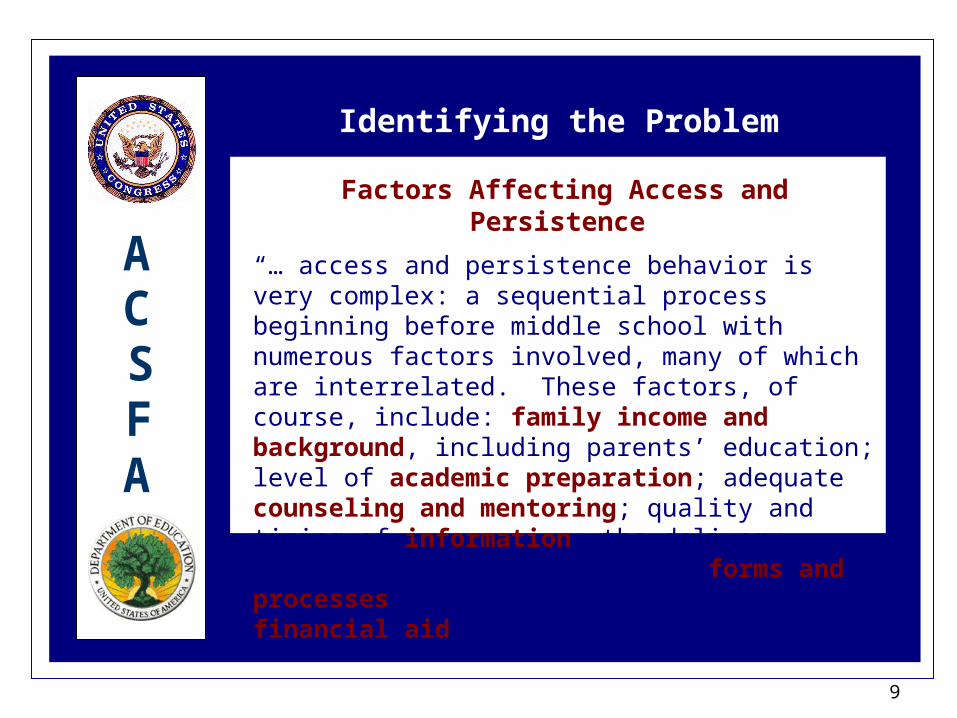
Factors Affecting Access and Persistence
“… access and persistence behavior is very complex: a sequential process beginning before middle school with numerous factors involved, many of which are interrelated. These factors, of course, include: family income and background, including parents’ education; level of academic preparation; adequate counseling and mentoring; quality and timing of information; the delivery system, including application forms and processes; and, last but not least, financial aid.”
Dr. Juliet V. García, PresidentUniversity of Texas at
BrownsvilleFormer ACSFA Chair and Vice
Chair
10
G
Identifying the Problem
A C S F A
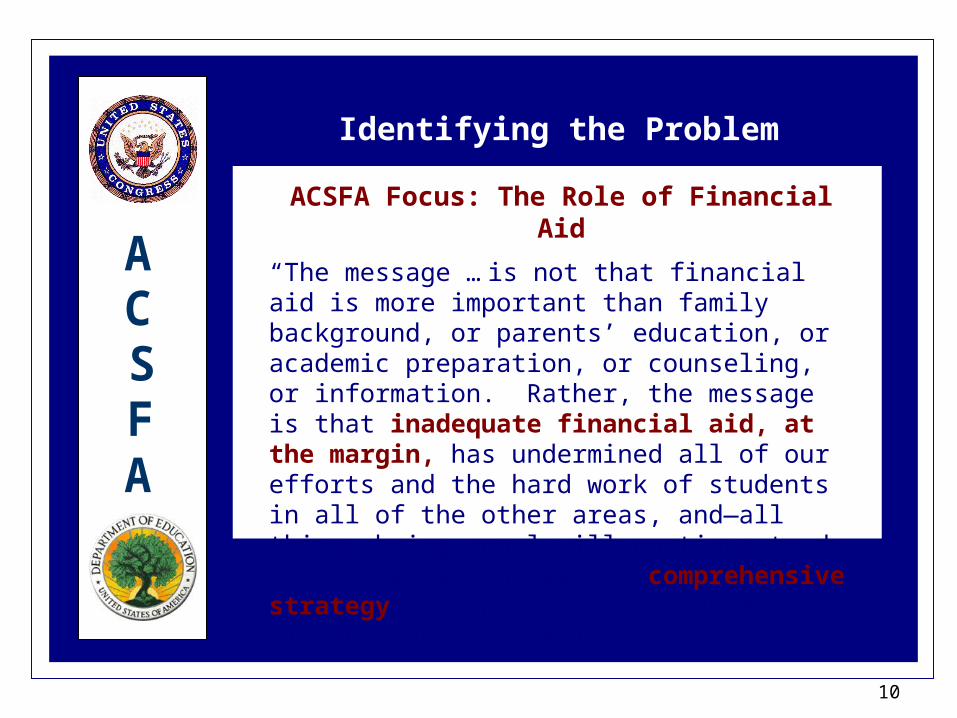
ACSFA Focus: The Role of Financial Aid
“The message … is not that financial aid is more important than family background, or parents’ education, or academic preparation, or counseling, or information. Rather, the message is that inadequate financial aid, at the margin, has undermined all of our efforts and the hard work of students in all of the other areas, and—all things being equal—will continue to do so. … The nation needs a comprehensive strategy and approach that addresses all the factors simultaneously.”
Dr. Juliet V. García, PresidentUniversity of Texas at
BrownsvilleFormer ACSFA Chair & Vice
Chair

11
G
Courtesy: Michael McPherson (2005)
Identifying the ProblemEnrollment Rate of High School Graduates
by Income, 1975-2003
A C S F A

12
G
Identifying the ProblemPercentage of 1992 High School Graduates Attending College in 1994, by Achievement
Test and Socioeconomic Status Quartile
Source: Access Denied, p. 13
A C S F A
Achievement Quartile
SES Quartile
Lowest Highest
Highest 78% 97%
Lowest 36% 77%
13
G
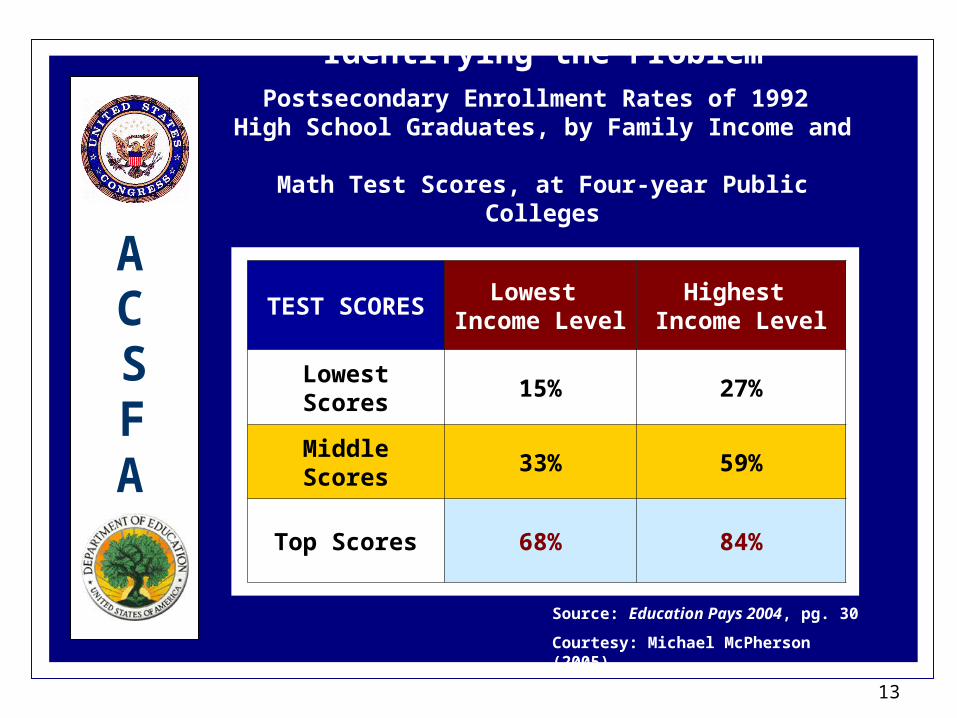
Identifying the ProblemPostsecondary Enrollment Rates of 1992 High School Graduates, by Family Income
and Math Test Scores, at Four-year Public
Colleges
Source: Education Pays 2004, pg. 30
Courtesy: Michael McPherson (2005)
A C S F A
TEST SCORES
Lowest Income Level
Highest Income Level
Lowest Scores
15% 27%
Middle Scores
33% 59%
Top Scores 68% 84%

14
Source: Postsecondary Education Opportunity
Identifying the ProblemPercentage of Students Who
Earned a BA by Age 24
A C S F A
Family Income
1975 2003
Under $35,901
7% 9%
Over $95,040
38% 95%

15
A C S F A
Pinpointing Causes
16
Pinpointing CausesKey Findings from Access Denied (2001)
A C S F A
Large differences persist in enrollment rates by income
Priorities have shifted to merit aid and affordability for the middle class
High unmet need for low-income students has a negative impact on their enrollment patterns

17
Pinpointing CausesState Grant Aid: Need vs. Merit Aid
Source: Trends in Student Aid (2005)
Courtesy: Dr. Sandy Baum
Non need-based grants
Need-based grants
A C S F A
Need-based grants
Non need-based grants

18
Pinpointing Causes
Contribution of Empty Promises (2002)
A C S F A
Focused only on those low-income students who were college-qualified, high school graduates to isolate the effects of financial aid
Refined the discussion of financial barriers to focus on net price or work/loan burden
Calculated aggregate national losses from the access pipeline over the upcoming decade
Measured the impact of financial barriers across the full access pipeline through degree completion
19
Pinpointing CausesKey Findings from Empty Promises
A C S F A
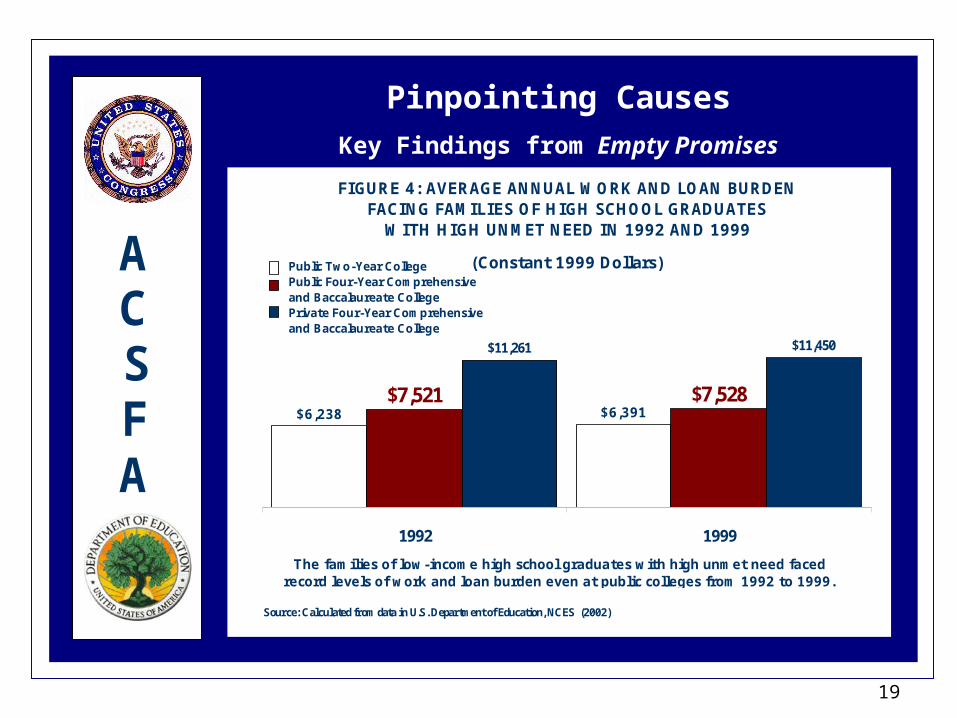
FIGURE 4: AVERAGE ANNUAL WORK AND LOAN BURDEN FACING FAMILIES OF HIGH SCHOOL GRADUATES
WITH HIGH UNMET NEED IN 1992 AND 1999
(Constant 1999 Dollars)
$6,238 $6,391$7,521 $7,528
$11,261 $11,450
1992 1999
The families of low-income high school graduates with high unmet need faced record levels of work and loan burden even at public colleges from 1992 to 1999.
Source: Calculated from data in U.S. Department of Education, NCES (2002)
Public Two-Year CollegePublic Four-Year Comprehensive and Baccalaureate CollegePrivate Four-Year Comprehensive and Baccalaureate College
20
Pinpointing CausesKey Findings from Empty Promises
A C S F A
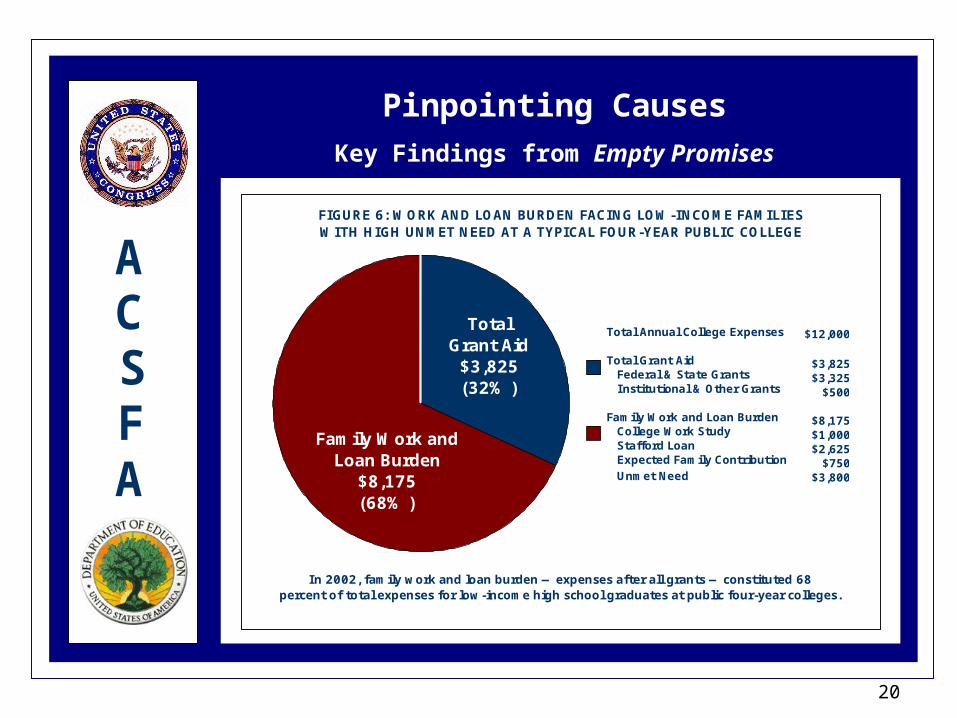
FIGURE 6: WORK AND LOAN BURDEN FACING LOW-INCOME FAMILIES WITH HIGH UNMET NEED AT A TYPICAL FOUR-YEAR PUBLIC COLLEGE
In 2002, family work and loan burden — expenses after all grants — constituted 68 percent of total expenses for low-income high school graduates at public four-year colleges.
Total Annual College Expenses
Total Grant Aid Federal & State Grants Institutional & Other Grants
Family Work and Loan Burden College Work Study Stafford Loan Expected Family Contribution Unmet Need
$12,000
$3,825$3,325
$500
$8,175 $1,000$2,625
$750$3,800
Total Grant Aid$3,825(32% )
Family Work and Loan Burden
$8,175(68% )

21
Pinpointing CausesKey Findings from Empty Promises
A C S F A
FIGURE 12: THE FULL ACCESS PIPELINE College-Qualified High School Graduates
95%88% 91%
83%
4%
70%63% 62%
52%
22%
62%
21%
Expect in 8thGrade to Finish
College
Plan in 12thGrade to Attend a
Four-YearCollege
Take EntranceExam and Apply
Enroll in a Four-Year College
Do Not Enroll inAny College
Complete aBachelor's
Degree
High unmet need has a significant sequential and cumulative impact on college-qualified low-income high school graduates throughout the Access Pipeline.
Source: Calculated from data in U.S. Department of Education, NCES (1997) and (2002)
High-income (unmet need = $400)Low-income (unmet need = $3,800)

22
Pinpointing CausesKey Findings from Empty Promises
A C S F A
FIGURE 16: CUMULATIVE IMPACT OF HIGH UNMET NEED ON LOW- AND MODERATE-INCOME HIGH SCHOOL GRADUATES FROM 2001 TO 2010
College-Qualified (in millions)
0.40.8
1.2
1.72.1
2.63.0
3.53.9
4.4
0.20.4
0.60.8
1.01.2
1.41.6
1.82.0
2001 2002 2003 2004 2005 2006 2007 2008 2009 2010
Total Not Attending a Four-Year College Within Two Years
Total Not Attending Any College Within Two Years
Between 2001 and 2010, high unmet need will prevent 4.4 million high school graduates from attending a four-year college, and 2 million of them from attending any college at all.
Source: Calculated from data in U.S. Department of Education, NCES (1997) and (2001)
23
Pinpointing Causes
Losses Attributable to Financial Barriers
A C S F A
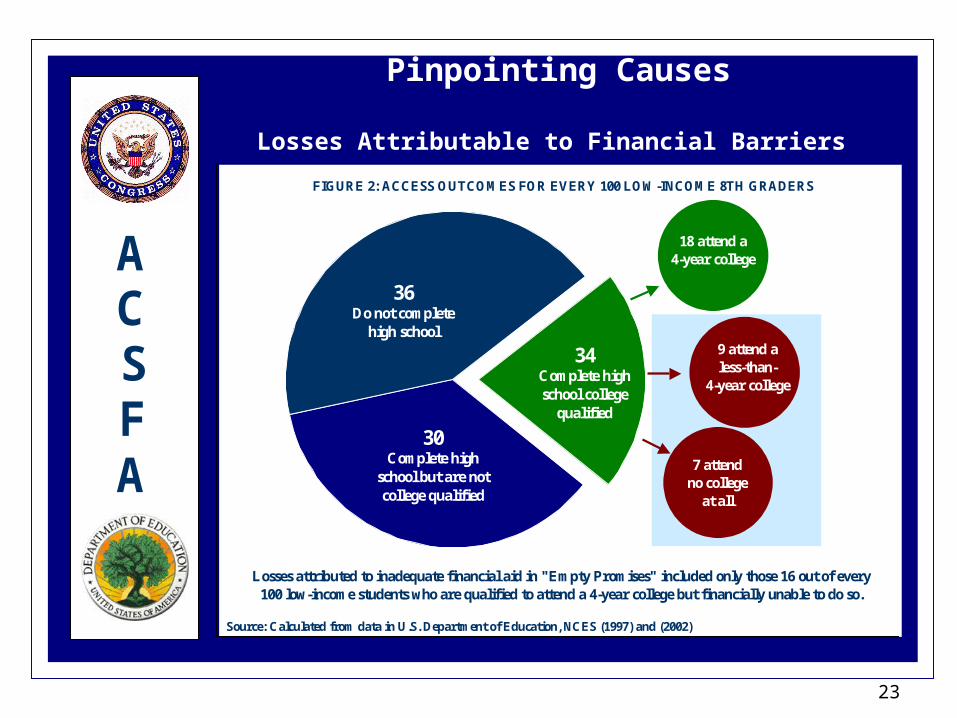
FIGURE 2: ACCESS OUTCOMES FOR EVERY 100 LOW-INCOME 8TH GRADERS
34 Complete high school college
qualified
36 Do not complete
high school
30Complete high
school but are not college qualified
Losses attributed to inadequate financial aid in "Empty Promises" included only those 16 out of every 100 low-income students who are qualified to attend a 4-year college but financially unable to do so.
18 attend a 4-year college
Source: Calculated from data in U.S. Department of Education, NCES (1997) and (2002)
9 attend a less-than-
4-year college
7 attend no college
at all
24
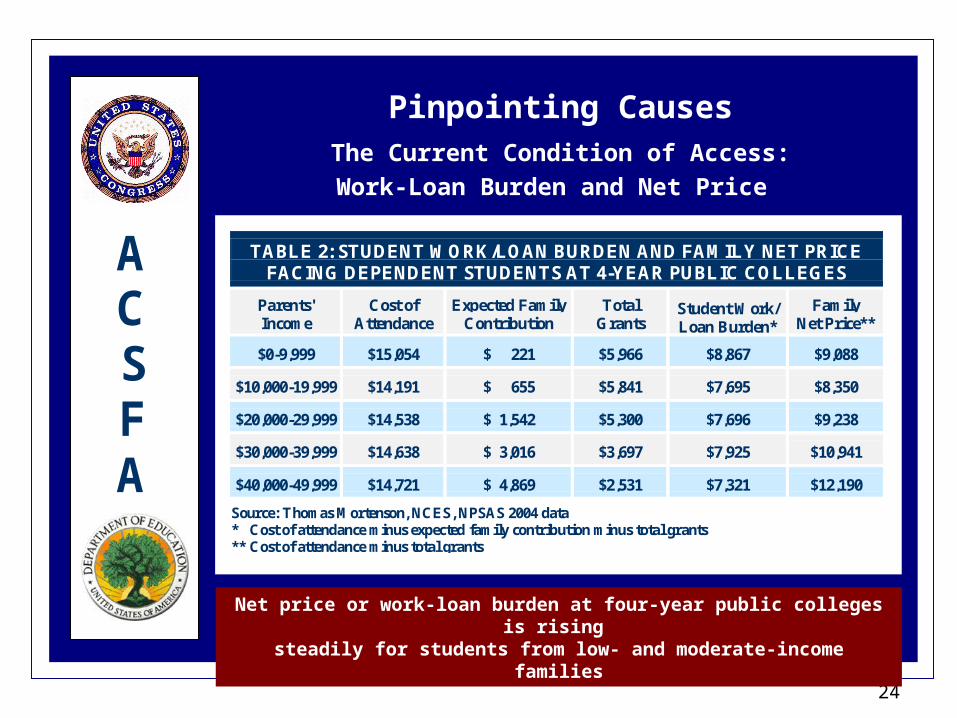
Pinpointing CausesThe Current Condition of Access:Work-Loan Burden and Net Price
A C S F A
TABLE 2: STUDENT WORK/LOAN BURDEN AND FAMILY NET PRICE FACING DEPENDENT STUDENTS AT 4-YEAR PUBLIC COLLEGES
Parents' Income
Cost of Attendance
Expected Family Contribution
Total Grants
Student Work/ Loan Burden*
Family Net Price**
$0-9,999 $15,054 $ 221 $5,966 $8,867 $9,088
$10,000-19,999 $14,191 $ 655 $5,841 $7,695 $8,350
$20,000-29,999 $14,538 $ 1,542 $5,300 $7,696 $9,238
$30,000-39,999 $14,638 $ 3,016 $3,697 $7,925 $10,941
$40,000-49,999 $14,721 $ 4,869 $2,531 $7,321 $12,190
Source: Thomas Mortenson, NCES, NPSAS 2004 data * Cost of attendance minus expected family contribution minus total grants ** Cost of attendance minus total grants
Net price or work-loan burden at four-year public colleges is rising
steadily for students from low- and moderate-income families
25
A C S F A
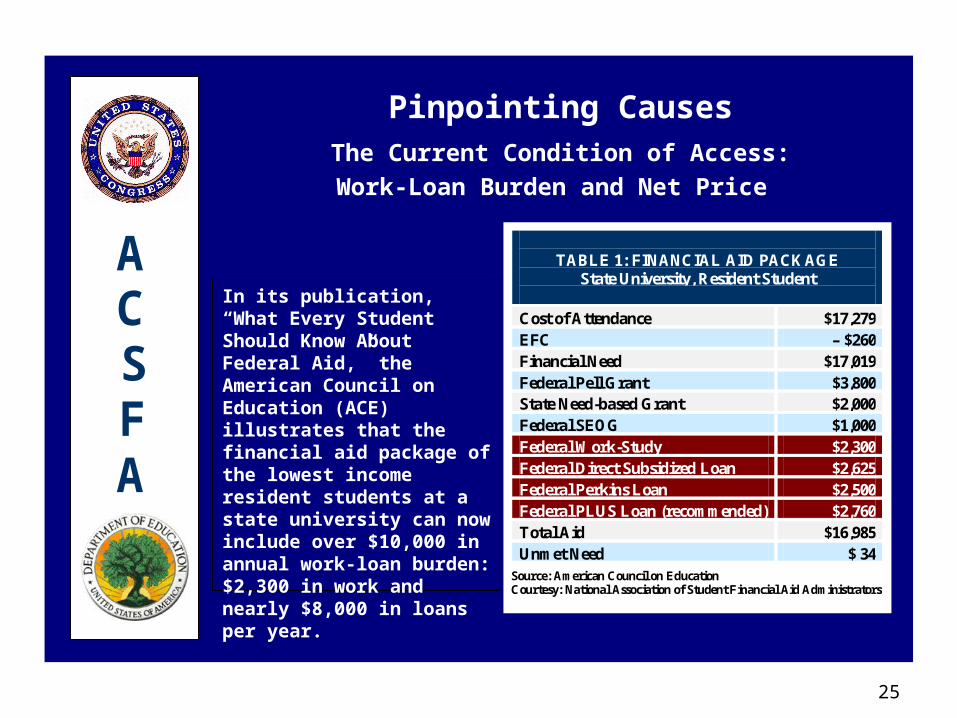
Pinpointing CausesThe Current Condition of Access:Work-Loan Burden and Net Price
TABLE 1: FINANCIAL AID PACKAGE
State University, Resident Student
Cost of Attendance $17,279 EFC – $260 Financial Need $17,019 Federal Pell Grant $3,800 State Need-based Grant $2,000 Federal SEOG $1,000 Federal Work-Study $2,300 Federal Direct Subsidized Loan $2,625 Federal Perkins Loan $2,500 Federal PLUS Loan (recommended) $2,760 Total Aid $16,985 Unmet Need $ 34
Source: American Council on Education Courtesy: National Association of Student Financial Aid Administrators
In its publication, “What Every Student Should Know About Federal Aid,” the American Council on Education (ACE) illustrates that the financial aid package of the lowest income resident students at a state university can now include over $10,000 in annual work-loan burden: $2,300 in work and nearly $8,000 in loans per year.

26
Pinpointing Causes
The Current Condition of Persistence:Bachelor’s Degree Attainment by Income
A C S F A
TABLE 3: BACHELOR’S DEGREE ATTAINMENT RATES OF COLLEGE-QUALIFIED 1992 HIGH SCHOOL GRADUATES, BY 2000
Percent Earning Bachelor’s Degrees By 2000 Family Income
In 1988 All Students
Students Whose Parents Did Not Attend College
Students Whose Parents Did
Attend College
Less than $20,000 38.4% 32.9% 41.1%
$20,000 - $34,999 46.1% 38.2% 48.7%
$35,000 - $49,999 55.5% 43.9% 59.9%
$50,000 and above 71.4% 60.5% 73.7% Source: NELS:88/2000. Analysis by JBL Associates
Large differences exist in bachelor’s degree attainment rates among college-qualified high school graduates by family
income
27
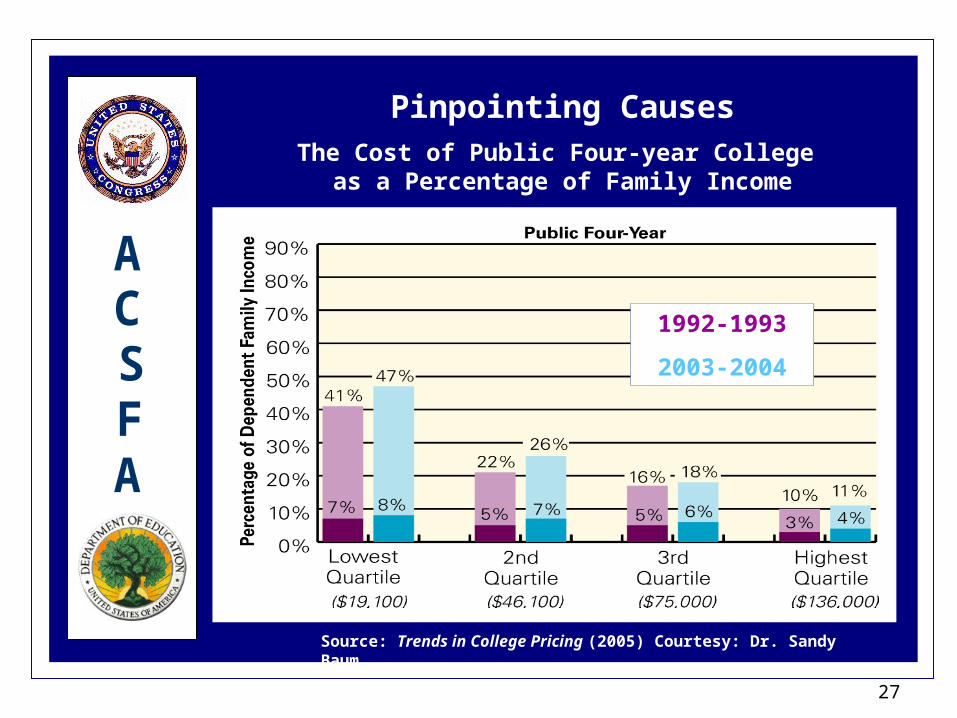
Pinpointing CausesThe Cost of Public Four-year College
as a Percentage of Family Income
Source: Trends in College Pricing (2005) Courtesy: Dr. Sandy Baum
A C S F A
1992-1993
2003-2004
28
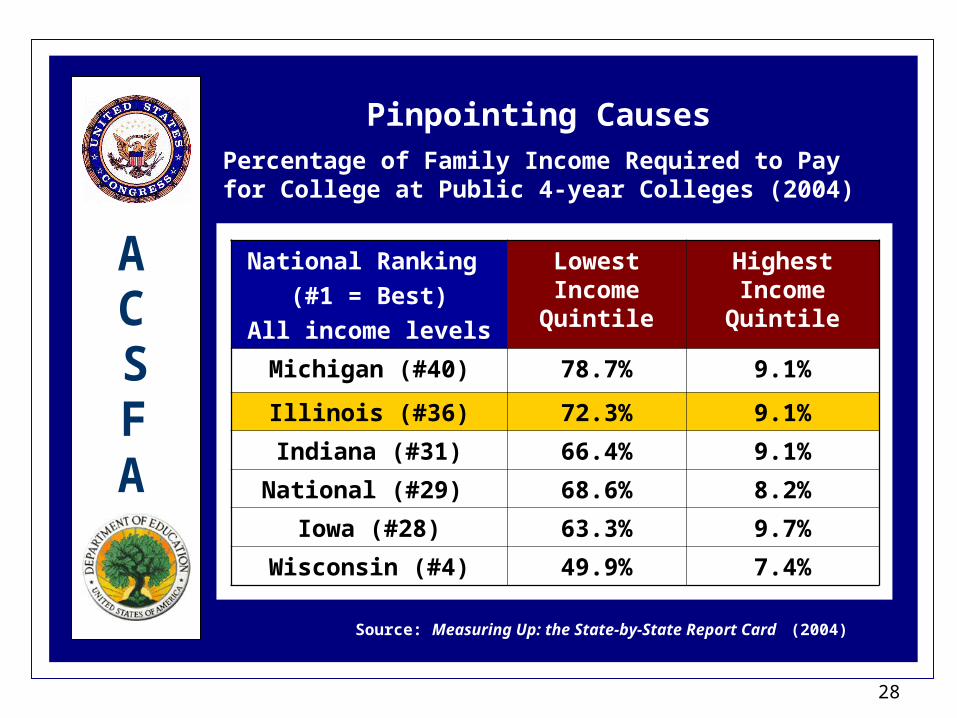
Pinpointing CausesPercentage of Family Income Required to Pay
for College at Public 4-year Colleges (2004)
Source: Measuring Up: the State-by-State Report Card (2004)
A C S F A
National Ranking (#1 = Best)
All income levels
Lowest Income Quintile
Highest Income Quintile
Michigan (#40) 78.7% 9.1%
Illinois (#36) 72.3% 9.1%
Indiana (#31) 66.4% 9.1%
National (#29) 68.6% 8.2%
Iowa (#28) 63.3% 9.7%
Wisconsin (#4) 49.9% 7.4%
29
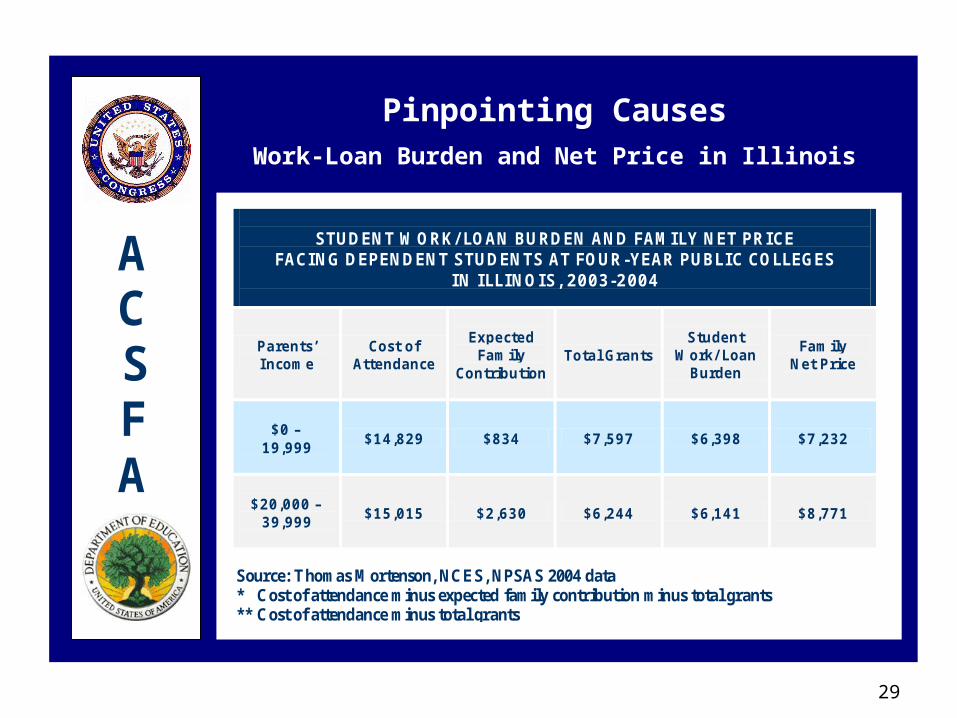
Pinpointing CausesWork-Loan Burden and Net Price in Illinois
Source: -
A C S F A
Source: Thomas Mortenson, NCES, NPSAS 2004 data * Cost of attendance minus expected family contribution minus total grants ** Cost of attendance minus total grants
STUDENT WORK/ LOAN BURDEN AND FAMILY NET PRICE FACING DEPENDENT STUDENTS AT FOUR-YEAR PUBLIC COLLEGES
IN ILLINOIS, 2003-2004
Parents’ Income
Cost of Attendance
Expected Family
Contribution
Total Grants Student
Work/ Loan Burden
Family Net Price
$0 –
19,999
$14,829 $834 $7,597 $6,398 $7,232
$20,000 –
39,999
$15,015 $2,630 $6,244 $6,141 $8,771
30
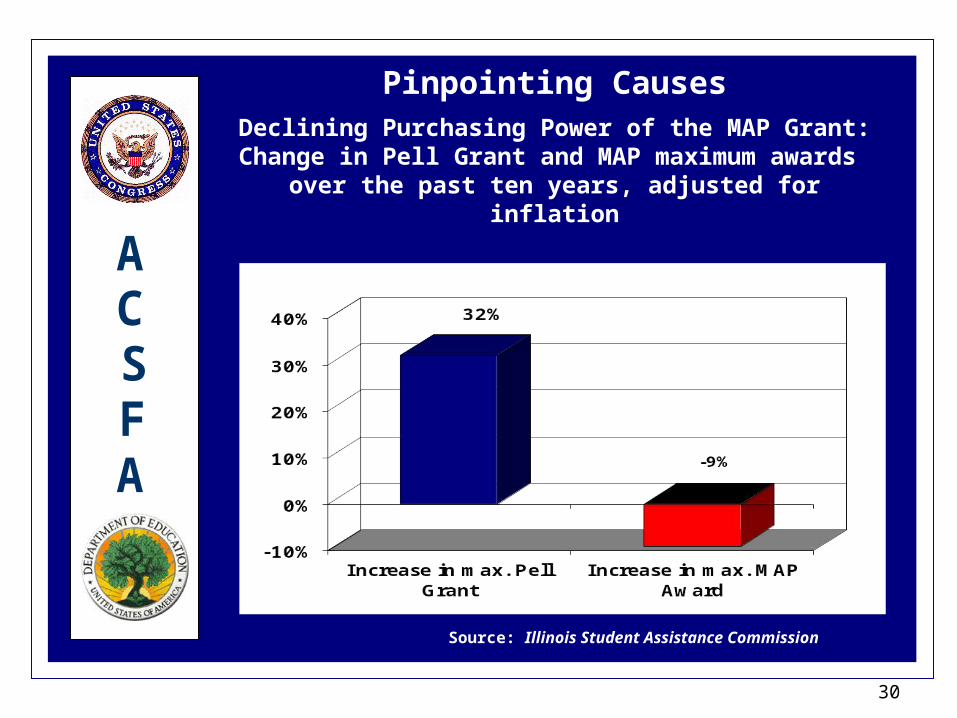
Declining Purchasing Power of the MAP Grant:Change in Pell Grant and MAP maximum awards
over the past ten years, adjusted for inflation
Source: Illinois Student Assistance Commission
Pinpointing Causes
A C S F A
31
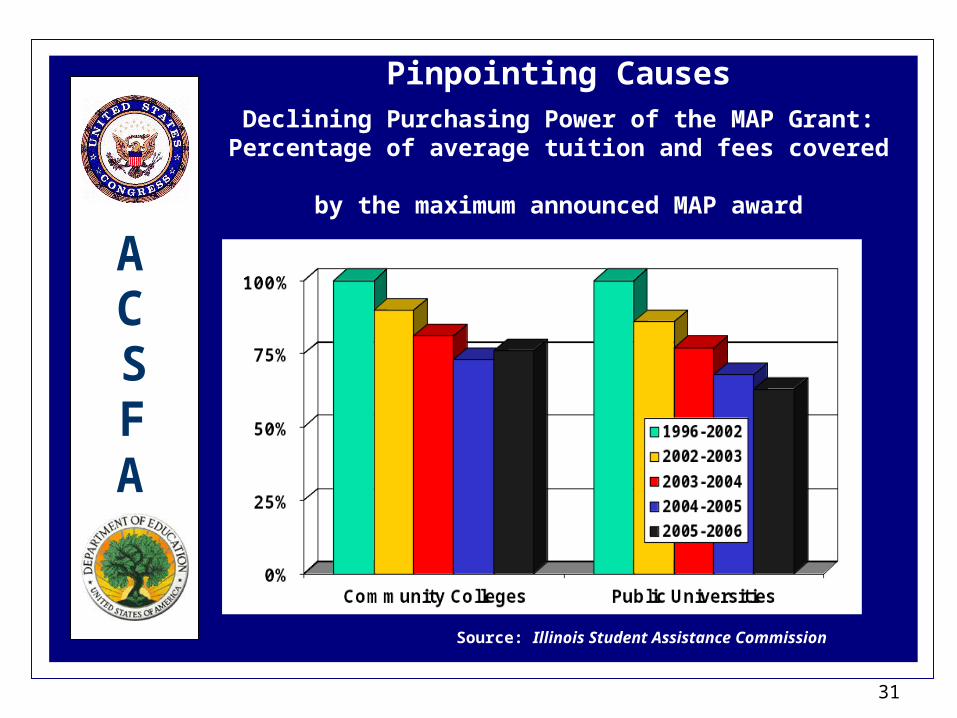
Pinpointing CausesDeclining Purchasing Power of the MAP Grant:
Percentage of average tuition and fees covered by the maximum announced MAP award
Source: Illinois Student Assistance Commission
A C S F A

32
A C S F A
Specifying Solutions

33
A C S F A
FIGURE 17: EQUALIZING AVERAGE UNMET NEED AT FOUR-YEAR PUBLIC COLLEGES BY FAMILY INCOME
College-Qualified High School Graduates
Unmet Need = $400 Unmet Need = $100
Unmet Need = $3,400 Unmet Need = $3,000
Public Two-Year College Public Four-Year College
Income = $75,000 - above(Unmet Need = $400)
Income = 0 - $49,999(Unmet Need = $3,400)
In 2002, equalizing financial barriers for college-qualified high school graduates at public colleges required an increase in grant aid of $3,000 for those with high unmet need.
Source: Calculated from data in U.S. Department of Education, NCES (1997)
About $3,000 in additional grant aid would equalize unmet need at public colleges
Specifying SolutionsLowering Unmet Need and Work-Loan Burden
Today, equalizing unmet need between low- and high-income students would require additional grant aid of over $4,000.

34
Specifying SolutionsACSFA Recommendations
A C S F A
ACSFA does not make recommendations to Congress or the Secretary of Education concerning budget levels or appropriations.
It was created to provide independent, bipartisan, technical and objective advice, not to make judgments about legislative funding priorities.
We transmitted our findings that: Record-level work-loan burden at public
colleges will exacerbate income-related gaps in access and persistence, and
Improvements in academic preparation, information, and counseling will not solve the problem.

35
Specifying SolutionsACSFA Role in HEA Reauthorization and
Reauthorization Recommendations
A C S F A
Provide technical assistance to House and Senate staff across a broad range of student aid issues.
Made two recommendations:
To create a new access and persistence partnership; and
To simplify student aid delivery, forms, and processes from middle school through degree completion.

36
A C S F A
Specifying SolutionsACSFA Partnership Proposal
Recommendation: Create an access and persistence partnership between the federal government, states, colleges, and private philanthropic groups.
Purpose Implement a comprehensive strategy effectively aimed at all
of the factors that affect access and persistence. Improve integration and coordination among existing
programs.
Objective: Provide low-income students with: Adequate grant aid to reduce work-loan burden Early assurances of financial access to four-year institutions Incentives to increase participation in early intervention
programs
37
A C S F A
Specifying SolutionsACSFA Simplification Recommendations
The Student Aid Gauntlet Report One-year study from Congress Ten recommendations to simplify the
application process and specific aspects of need analysis
Examples of Key Recommendations: Create a comprehensive system of
early financial aid information Simplify and streamline FAFSA on the
Web

38
A C S F A
Panel Discussion and Questions
39
Contact Information
A C S F A
Judith N. Flink Vice Chairperson of the Advisory Committee,
Executive Director of University Student Financial Services,
The University of [email protected]
Nicole A. BarryDeputy Director
Erin B. RennerAssistant Director
(202) 219-2099