Embed Size (px)
Citation preview
The 2012 World Congress on Advances in Civil, Environmental, and Materials Research (ACEM’ 12)Seoul, Korea, August 26-30, 2012
Pressure Measurement in A Silo Backfilled with A Cohesionless Soil
*Li Li1) , Jonathan D. Aubertin2) and Jean-Sébastien Dubé3)
1), 2), 3) Department of Construction Engineering, ÉTS, Montreal, Quebec, Canada * [email protected]
ABSTRACT
Infrastructure rehabilitation and development are very active all over the world. This creates a need to better understand the soil-structure interaction, which may lead to a better estimation of pressures in backfilled openings and improvement in infrastructure design. For such purpose, a series of experiments have been performed within an instrumented silo backfilled with a cohesionless soil. In this paper, these experimental results will be presented and compared with existing solutions, including the overburden and arching theory solutions. 1. INTRODUCTION Soil-structures interaction is a phenomenon commonly observed in geotechnical engineering (Harrop-Williams 1989). When a frictional particulate material is placed in a confined opening with rigid walls, the deformable fill material tends to yield and move downward under its own weight, while the stiffer abutments tend to hold the fill in place by shearing stresses along the interfaces. Part of the load due to the fill weight is then transferred from the fill material to the surrounding walls. The stresses within the backfill are then reduced and become smaller than those calculated with the overburden solution. The phenomenon of load transfer from a softer material to adjacent stiffer material is called “arching effect”. It is the basis of the arching theory, introduced by Janssen (1895) for estimating stresses in powder silos (Sperl 2006). The broad application of the arching theory is mostly due to Marston, who made use of Janssen’s arching theory and introduced an analytical solution for evaluating the load on conduits buried in trenches (Marston and Anderson 1913; Marston 1930). Since then, the arching theory has been widely used not only in backfilled trenches (Spangler 1948; Handy 1985, 2004; Spangler and Handy 1984; McCarthy 1988; Moore 2001; Brachman and Krushelnitzky 2005; Whidden 2009) and silos (Richmond and Gardner 1962; Richards 1966; Cowin 1977; Blight 1986a,b, 2006; Drescher 1991;
1) Associate professor 2) Trainee student 3) Associate professor
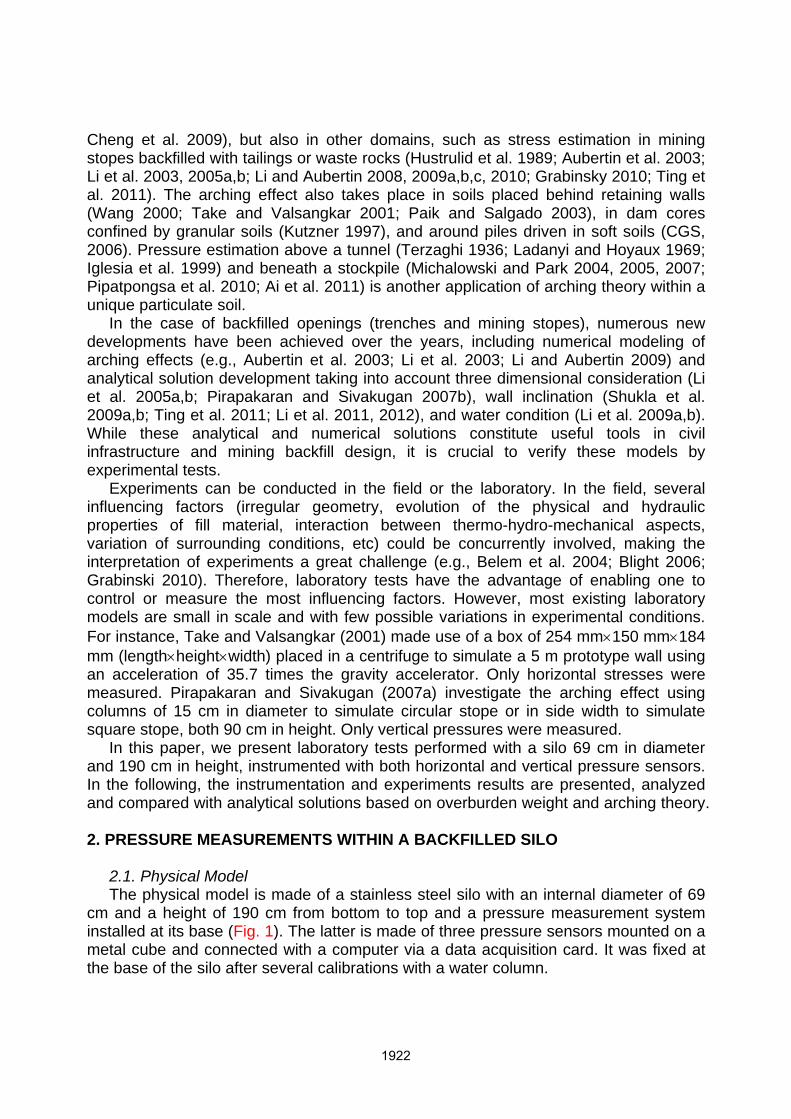
Cheng et al. 2009), but also in other domains, such as stress estimation in mining stopes backfilled with tailings or waste rocks (Hustrulid et al. 1989; Aubertin et al. 2003; Li et al. 2003, 2005a,b; Li and Aubertin 2008, 2009a,b,c, 2010; Grabinsky 2010; Ting et al. 2011). The arching effect also takes place in soils placed behind retaining walls (Wang 2000; Take and Valsangkar 2001; Paik and Salgado 2003), in dam cores confined by granular soils (Kutzner 1997), and around piles driven in soft soils (CGS, 2006). Pressure estimation above a tunnel (Terzaghi 1936; Ladanyi and Hoyaux 1969; Iglesia et al. 1999) and beneath a stockpile (Michalowski and Park 2004, 2005, 2007; Pipatpongsa et al. 2010; Ai et al. 2011) is another application of arching theory within a unique particulate soil. In the case of backfilled openings (trenches and mining stopes), numerous new developments have been achieved over the years, including numerical modeling of arching effects (e.g., Aubertin et al. 2003; Li et al. 2003; Li and Aubertin 2009) and analytical solution development taking into account three dimensional consideration (Li et al. 2005a,b; Pirapakaran and Sivakugan 2007b), wall inclination (Shukla et al. 2009a,b; Ting et al. 2011; Li et al. 2011, 2012), and water condition (Li et al. 2009a,b). While these analytical and numerical solutions constitute useful tools in civil infrastructure and mining backfill design, it is crucial to verify these models by experimental tests. Experiments can be conducted in the field or the laboratory. In the field, several influencing factors (irregular geometry, evolution of the physical and hydraulic properties of fill material, interaction between thermo-hydro-mechanical aspects, variation of surrounding conditions, etc) could be concurrently involved, making the interpretation of experiments a great challenge (e.g., Belem et al. 2004; Blight 2006; Grabinski 2010). Therefore, laboratory tests have the advantage of enabling one to control or measure the most influencing factors. However, most existing laboratory models are small in scale and with few possible variations in experimental conditions. For instance, Take and Valsangkar (2001) made use of a box of 254 mm×150 mm×184 mm (length×height×width) placed in a centrifuge to simulate a 5 m prototype wall using an acceleration of 35.7 times the gravity accelerator. Only horizontal stresses were measured. Pirapakaran and Sivakugan (2007a) investigate the arching effect using columns of 15 cm in diameter to simulate circular stope or in side width to simulate square stope, both 90 cm in height. Only vertical pressures were measured. In this paper, we present laboratory tests performed with a silo 69 cm in diameter and 190 cm in height, instrumented with both horizontal and vertical pressure sensors. In the following, the instrumentation and experiments results are presented, analyzed and compared with analytical solutions based on overburden weight and arching theory. 2. PRESSURE MEASUREMENTS WITHIN A BACKFILLED SILO 2.1. Physical Model The physical model is made of a stainless steel silo with an internal diameter of 69 cm and a height of 190 cm from bottom to top and a pressure measurement system installed at its base (Fig. 1). The latter is made of three pressure sensors mounted on a metal cube and connected with a computer via a data acquisition card. It was fixed at the base of the silo after several calibrations with a water column.
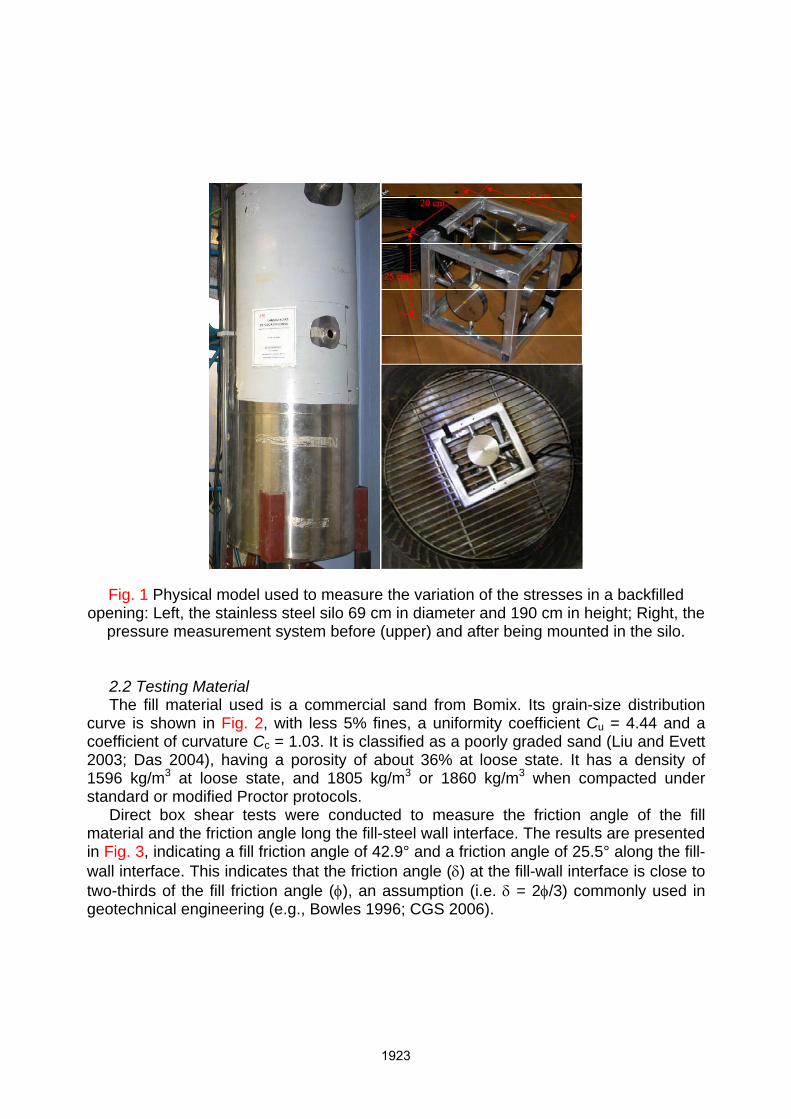
Fig. 1 Physical model used to measure the variation of the stresses in a backfilled opening: Left, the stainless steel silo 69 cm in diameter and 190 cm in height; Right, the
pressure measurement system before (upper) and after being mounted in the silo. 2.2 Testing Material The fill material used is a commercial sand from Bomix. Its grain-size distribution curve is shown in Fig. 2, with less 5% fines, a uniformity coefficient Cu = 4.44 and a coefficient of curvature Cc = 1.03. It is classified as a poorly graded sand (Liu and Evett 2003; Das 2004), having a porosity of about 36% at loose state. It has a density of 1596 kg/m3 at loose state, and 1805 kg/m3 or 1860 kg/m3 when compacted under standard or modified Proctor protocols. Direct box shear tests were conducted to measure the friction angle of the fill material and the friction angle long the fill-steel wall interface. The results are presented in Fig. 3, indicating a fill friction angle of 42.9° and a friction angle of 25.5° along the fill-wall interface. This indicates that the friction angle (δ) at the fill-wall interface is close to two-thirds of the fill friction angle (φ), an assumption (i.e. δ = 2φ/3) commonly used in geotechnical engineering (e.g., Bowles 1996; CGS 2006).
0102030405060708090
100
0.01 0.1 1 10
Perc
ent p
assin
g
Grain diameter (mm) Fig. 2 Grain-size distribution curve of Bomix sand.
Fig. 3 Experimental results of direct box shear tests on Bomix sand and along sand-
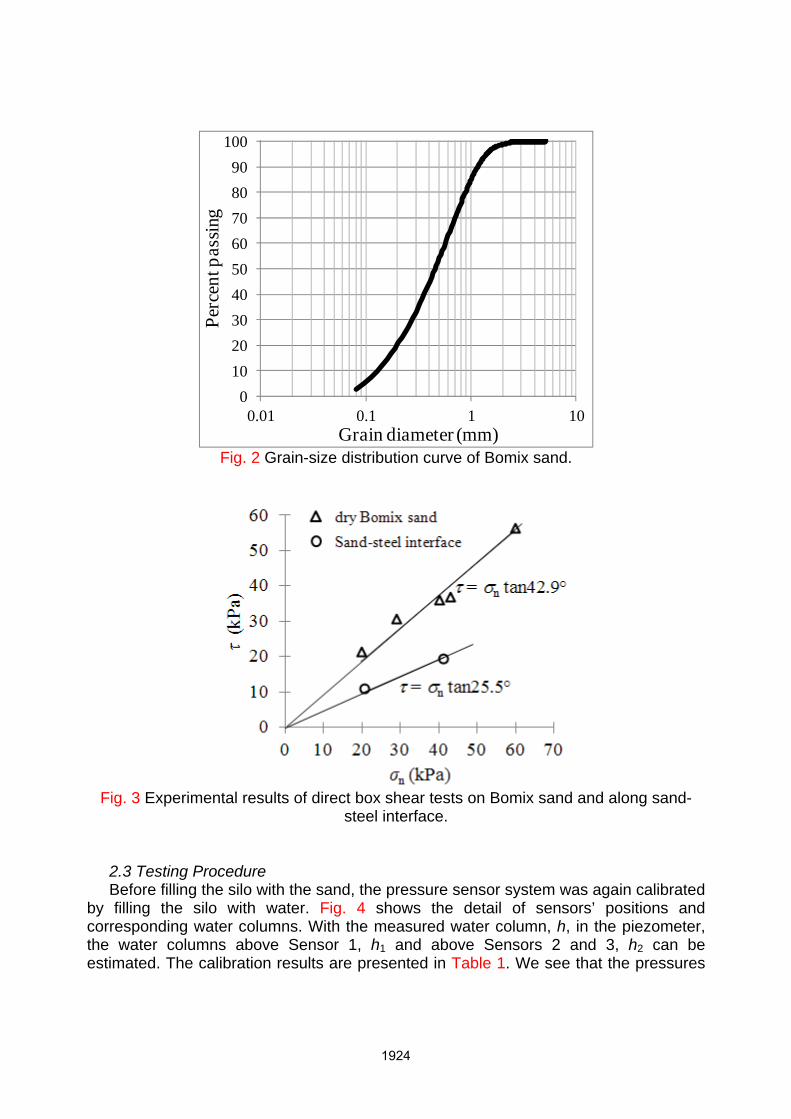
steel interface. 2.3 Testing Procedure Before filling the silo with the sand, the pressure sensor system was again calibrated by filling the silo with water. Fig. 4 shows the detail of sensors’ positions and corresponding water columns. With the measured water column, h, in the piezometer, the water columns above Sensor 1, h1 and above Sensors 2 and 3, h2 can be estimated. The calibration results are presented in Table 1. We see that the pressures
measured by the three pressure sensors correspond in general well to the hydrostatic pressures calculated with water column.
h1 h2
28 cm
25 cm
h
Sensor 1
Sensor 2 Sensor 3
grid
190 cm
Piezom
eter
69 cm
Fig. 4 Sensors’ positions and corresponding water columns during calibration.
Table 1 Calibration of the pressure measurement system with water column
h (cm)
h1 (cm)
h2 (cm)
Sensor 1 (kPa) Sensor 2 (kPa) Sensor 3 (kPa) Reading Error Reading Error Reading Error
46.5 18.5 28.0 1.73 4.7% 3.04 10.7% 2.84 3.4% 56.0 28.0 40.5 2.49 9.3% 3.95 0.6% 3.97 0.1% 66.0 38.0 50.5 3.62 2.9% 5.07 2.3% 5.10 2.9% 76.0 48.0 60.5 4.65 1.2% 6.19 4.3% 6.23 5.0%
After the calibration of the pressure measurement system, water was drained. The void below the grid on which was installed the pressure measurement system was first filled dry sand, with a surpassing of 1.5 cm over the grid level. This means that the filling operation began with a starting thickness of 4.5 cm from the grid base level. Thereafter, the filling operation proceeded with controlled sand volumes. Every step, we poured two bags of sand. One bag of sand had about 30.66 kg. With a unit weight of about 1.6 g/cm3, this represents a thickness of about 5.09 cm in the silo. On the other hand, the fill thickness can be estimated by measuring the void height between the fill surface and the top of the silo. Note that the sand pouring operation was conducted manually. Thus, when the sand was poured into the silo, precautions were taken to expand the sand over the whole area of the backfill. Nevertheless, it was difficult to obtain a perfectly leveled surface, as shown in Fig. 5. Leveling operation had to be done between each layer. After leveling each layer, several measurements were made to obtain an average value of the height between the fill surface and the top of the silo. The fill thickness between the grid base level and the top of the fill can then be calculated. It corresponds to the measured fill thickness.
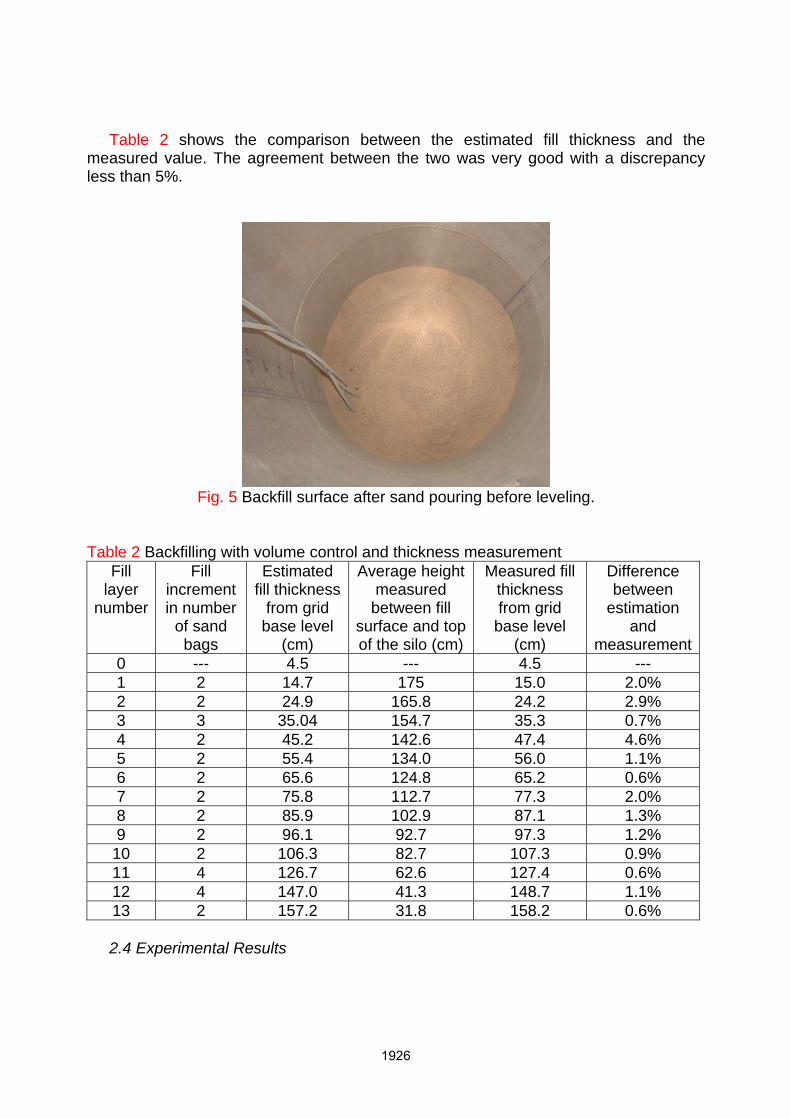
Table 2 shows the comparison between the estimated fill thickness and the measured value. The agreement between the two was very good with a discrepancy less than 5%.
Fig. 5 Backfill surface after sand pouring before leveling.
Table 2 Backfilling with volume control and thickness measurement
Fill layer
number
Fill increment in number
of sand bags
Estimated fill thickness
from grid base level
(cm)
Average height measured
between fill surface and top of the silo (cm)
Measured fill thickness from grid base level
(cm)
Difference between
estimation and
measurement0 --- 4.5 --- 4.5 --- 1 2 14.7 175 15.0 2.0% 2 2 24.9 165.8 24.2 2.9% 3 3 35.04 154.7 35.3 0.7% 4 2 45.2 142.6 47.4 4.6% 5 2 55.4 134.0 56.0 1.1% 6 2 65.6 124.8 65.2 0.6% 7 2 75.8 112.7 77.3 2.0% 8 2 85.9 102.9 87.1 1.3% 9 2 96.1 92.7 97.3 1.2% 10 2 106.3 82.7 107.3 0.9% 11 4 126.7 62.6 127.4 0.6% 12 4 147.0 41.3 148.7 1.1% 13 2 157.2 31.8 158.2 0.6%
2.4 Experimental Results
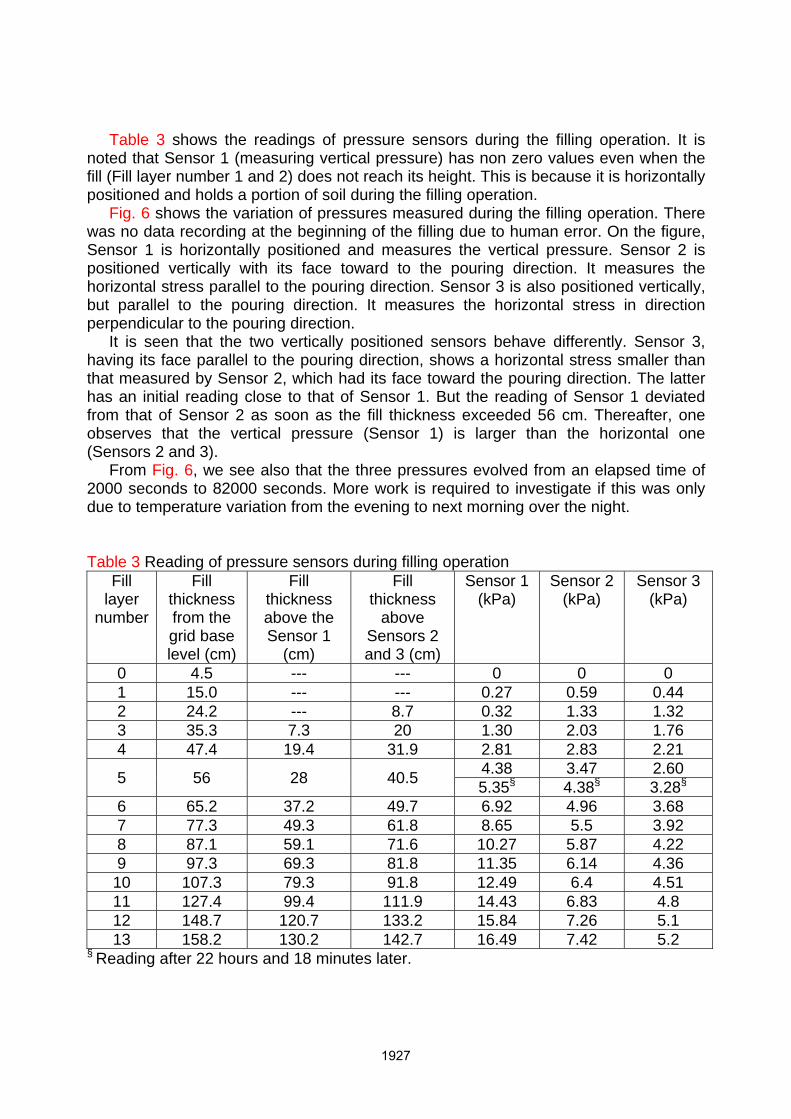
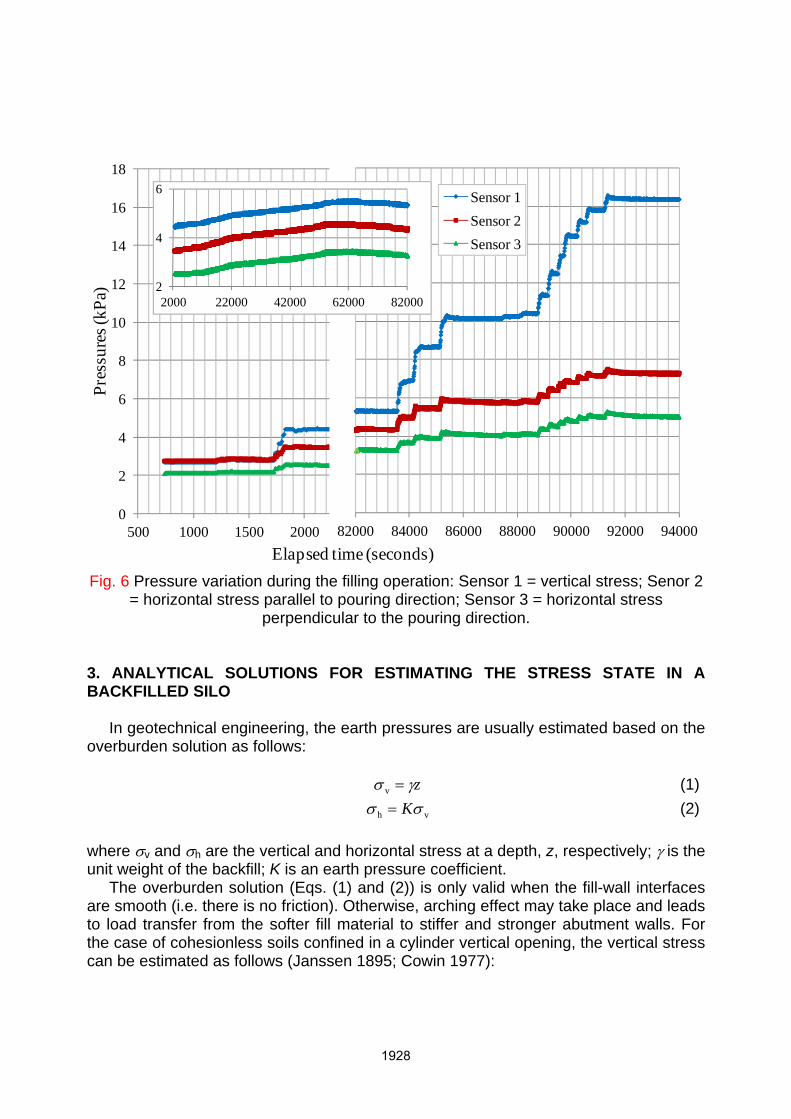
Table 3 shows the readings of pressure sensors during the filling operation. It is noted that Sensor 1 (measuring vertical pressure) has non zero values even when the fill (Fill layer number 1 and 2) does not reach its height. This is because it is horizontally positioned and holds a portion of soil during the filling operation. Fig. 6 shows the variation of pressures measured during the filling operation. There was no data recording at the beginning of the filling due to human error. On the figure, Sensor 1 is horizontally positioned and measures the vertical pressure. Sensor 2 is positioned vertically with its face toward to the pouring direction. It measures the horizontal stress parallel to the pouring direction. Sensor 3 is also positioned vertically, but parallel to the pouring direction. It measures the horizontal stress in direction perpendicular to the pouring direction. It is seen that the two vertically positioned sensors behave differently. Sensor 3, having its face parallel to the pouring direction, shows a horizontal stress smaller than that measured by Sensor 2, which had its face toward the pouring direction. The latter has an initial reading close to that of Sensor 1. But the reading of Sensor 1 deviated from that of Sensor 2 as soon as the fill thickness exceeded 56 cm. Thereafter, one observes that the vertical pressure (Sensor 1) is larger than the horizontal one (Sensors 2 and 3). From Fig. 6, we see also that the three pressures evolved from an elapsed time of 2000 seconds to 82000 seconds. More work is required to investigate if this was only due to temperature variation from the evening to next morning over the night. Table 3 Reading of pressure sensors during filling operation
Fill layer
number
Fill thickness from the grid base level (cm)
Fill thickness above the Sensor 1
(cm)
Fill thickness
above Sensors 2 and 3 (cm)
Sensor 1 (kPa)
Sensor 2 (kPa)
Sensor 3 (kPa)
0 4.5 --- --- 0 0 0 1 15.0 --- --- 0.27 0.59 0.44 2 24.2 --- 8.7 0.32 1.33 1.32 3 35.3 7.3 20 1.30 2.03 1.76 4 47.4 19.4 31.9 2.81 2.83 2.21
5 56 28 40.5 4.38 3.47 2.60 5.35§ 4.38§ 3.28§
6 65.2 37.2 49.7 6.92 4.96 3.68 7 77.3 49.3 61.8 8.65 5.5 3.92 8 87.1 59.1 71.6 10.27 5.87 4.22 9 97.3 69.3 81.8 11.35 6.14 4.36 10 107.3 79.3 91.8 12.49 6.4 4.51 11 127.4 99.4 111.9 14.43 6.83 4.8 12 148.7 120.7 133.2 15.84 7.26 5.1 13 158.2 130.2 142.7 16.49 7.42 5.2
§ Reading after 22 hours and 18 minutes later.
0
2
4
6
8
10
12
14
16
18
500 1000 1500 2000 2500
Pres
sure
s (kP
a)
82000 84000 86000 88000 90000 92000 94000
Sensor 1Sensor 2Sensor 3
2
4
6
2000 22000 42000 62000 82000
Elapsed time (seconds)
Fig. 6 Pressure variation during the filling operation: Sensor 1 = vertical stress; Senor 2 = horizontal stress parallel to pouring direction; Sensor 3 = horizontal stress
perpendicular to the pouring direction. 3. ANALYTICAL SOLUTIONS FOR ESTIMATING THE STRESS STATE IN A BACKFILLED SILO In geotechnical engineering, the earth pressures are usually estimated based on the overburden solution as follows: zγσ =v (1) vh σσ K= (2) where σv and σh are the vertical and horizontal stress at a depth, z, respectively; γ is the unit weight of the backfill; K is an earth pressure coefficient. The overburden solution (Eqs. (1) and (2)) is only valid when the fill-wall interfaces are smooth (i.e. there is no friction). Otherwise, arching effect may take place and leads to load transfer from the softer fill material to stiffer and stronger abutment walls. For the case of cohesionless soils confined in a cylinder vertical opening, the vertical stress can be estimated as follows (Janssen 1895; Cowin 1977):
⎭⎬⎫
⎩⎨⎧
⎟⎠⎞
⎜⎝⎛−−= δ
δγσ tan4exp1tan4v D
zKK
D
(3)
where D is the diameter of the cylinder opening; δ is the friction angle along the fill-wall interface. The horizontal stress is still estimated with Eq. (2), in which the value of K is usually close to Rankine’s active earth pressure coefficient, Ka (Marston 1939):
⎟⎠⎞
⎜⎝⎛ −°==
245tan2
aφKK
(4)
where φ is the friction angle of the backfill. Numerical simulations of vertical backfilled openings performed by Li et al. (2003) showed that the expected value of the earth pressure coefficient K may actually vary between Ka and K0. K0 is the at rest earth pressure coefficient (Jaky 1948):
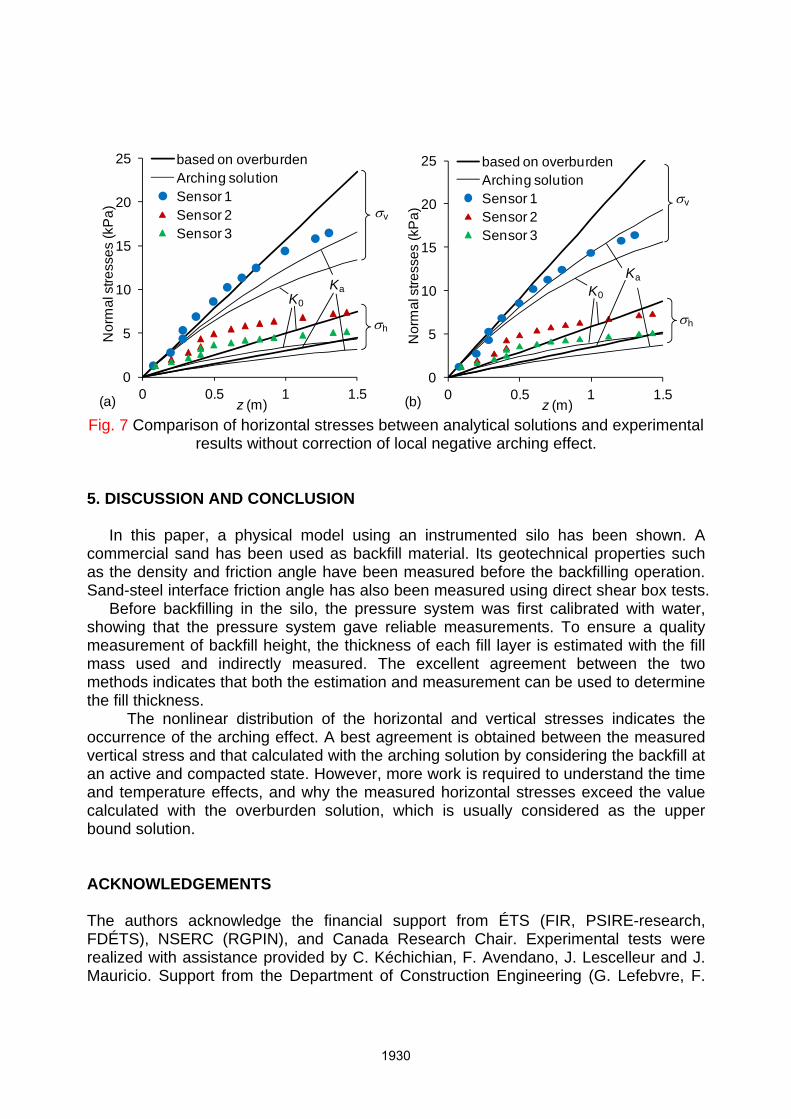
φsin10 −== KK (5) Eqs. (1) to (5) constitute the analytical solutions for estimating the vertical and horizontal stresses in a circular vertical backfilled opening. 4. COMPARISON BETWEEN PRESSURE MEASUREMENT AND THEORETICAL CALCULATIONS Fig. 7 shows the vertical and horizontal stress distributions obtained with the analytical solutions by considering the backfill in at-rest and active states, respectively. The figure also shows the pressure measurements. When the backfill is considered in a loose state (Fig. 7a), the unit weight of the backfill is taken as γ = 15.7 kN/m3 while a value of 18.2 kN/m3 is taken if the backfill is considered in compacted state (Fig. 7b). First of all, we note that both the vertical (σv) and horizontal (σh) stresses increased nonlinearly with depth, z. The deviation of the measured vertical stress, σv (Sensor 1) below the vertical stress line of the overburden solution indicated that arching took place within the backfilled opening. The best agreement between the measured and theoretical solutions was obtained by considering the arching solution with an active earth pressure coefficient K0 and considering a maximum soil density of 1860 kg/m3. For the horizontal stress (σh) component, we note that its measured values exceeded the values predicted with both the overburden and arching analytical solutions, independently from the unit weight or backfill state. Only near the end of backfilling, did their magnitudes drop below the horizontal stress line calculated with the overburden solution by considering the backfill at an at-rest state. This phenomenon has been reported but never explained in several past investigations (Blight 1986a, 1986b, 2006; Take and Valsangkar 2001). More work is required to fully understand this aspect.
0
5
10
15
20
25
0 0.5 1 1.5
Nor
mal
stre
sses
(kP
a)
z (m)
based on overburdenArching solutionSensor 1 Sensor 2Sensor 3
K0
Ka
σv
σh
(a)
0
5
10
15
20
25
0 0.5 1 1.5N
orm
al s
tress
es (k
Pa)
z (m)
based on overburdenArching solutionSensor 1 Sensor 2Sensor 3
K0
Ka
σv
σh
(b) Fig. 7 Comparison of horizontal stresses between analytical solutions and experimental
results without correction of local negative arching effect. 5. DISCUSSION AND CONCLUSION In this paper, a physical model using an instrumented silo has been shown. A commercial sand has been used as backfill material. Its geotechnical properties such as the density and friction angle have been measured before the backfilling operation. Sand-steel interface friction angle has also been measured using direct shear box tests. Before backfilling in the silo, the pressure system was first calibrated with water, showing that the pressure system gave reliable measurements. To ensure a quality measurement of backfill height, the thickness of each fill layer is estimated with the fill mass used and indirectly measured. The excellent agreement between the two methods indicates that both the estimation and measurement can be used to determine the fill thickness. The nonlinear distribution of the horizontal and vertical stresses indicates the occurrence of the arching effect. A best agreement is obtained between the measured vertical stress and that calculated with the arching solution by considering the backfill at an active and compacted state. However, more work is required to understand the time and temperature effects, and why the measured horizontal stresses exceed the value calculated with the overburden solution, which is usually considered as the upper bound solution. ACKNOWLEDGEMENTS The authors acknowledge the financial support from ÉTS (FIR, PSIRE-research, FDÉTS), NSERC (RGPIN), and Canada Research Chair. Experimental tests were realized with assistance provided by C. Kéchichian, F. Avendano, J. Lescelleur and J. Mauricio. Support from the Department of Construction Engineering (G. Lefebvre, F.

Brissette, O. Chaallal, S. Bélisle, and C. Lavoie) and from the Service of equipment (L. Paquin, M. Ouellet and B. Vachon) is also acknowledged. REFERENCES Ai, J., Chen, J.F., Rotter, J.M. and Ooi, J.Y. (2011), “Numerical and experimental studies of the base pressures beneath stockpiles”, Granular Matter, 13(2), 133-141. Aubertin, M., Li, L., Arnoldi, S., Belem, T., Bussière, B., Benzaazoua, M. and Simon, R. (2003), “Interaction between backfill and rock mass in narrow stopes”, Soil and Rock America 2003. Verlag Glückauf Essen (VGE), Essen, 1, 1157-1164. Belem, T., Harvey, A., Simon, R. and Aubertin, M. (2004), “Measurement and prediction of internal stresses in an underground opening during its filling with cemented fill”, Proc. 5th Int. Symp. on Ground support in Mining and Underground Construction. Villaescusa & Potvin (eds.), Tayler & Francis, 619 – 630. Blight, G.E. (1986a), “Pressure exerted by materials stored in silos: part I, coarse materials”, Géotech., 36(1), 33-46. Blight, G.E. (1986b), “Pressure exerted by materials stored in silos: part II, fine powders”, Géotech., 36(1), 47-56. Blight, G.E. (2006), Assessing loads on silos and other bulk storage structures: Research applied to practice. Taylor & Francis/Balkema, The Netherlands. Bowles, J.E. (1996), Foundation analysis and design, 5th edition. The McGraw-Hill Companies, Inc., Singapore. Brachman, R.W.I. and Krushelnitzky, R.P. (2005), “Response of a landfill drainage pipe buried in a trench”, Can. Geotech. J., 42, 752-762. Cheng, Y.M., Liu, Z.N., Song, W.D. and Au, S.K. (2009), “Laboratory test and particle flow simulation of silos problem with non-homogeneous materials”, ASCE J. Geotech. Geoenviron. Eng., 135(11), 1754-1761. CGS (2006), Canadian foundation engineering manual. Canadian Geotechnical Society, BiTech Publisher. Cowin, S.C. (1977), “The theory of static loads in bins.” J. Appl. Mech., 44, 409-412. Das, B.M. (2004), Principles of foundation engineering, 5th edition. Thomson. Drescher, A. (1991). Analytical methods in bin-load analysis. Elsevier, New York. Grabinsky, M.W. (2010), “Keynote address - In situ monitoring for groundtruthing paste backfill designs”, Proc 13th Int. Seminar on Paste and Thickened Tailings. Australian Centre for Geomechanics, 85-98. Handy, R.L. (1985), “The arch in soil arching”, ASCE J. Geotech. Eng., 111(3), 302-318. Handy, R.L. (2004), “Anatomy of an error”, J. Geotech. Geoenv. Eng., 130(7), 768-771. Harrop-Williams, K. 1989, “Arch in soil arching”, ASCE J. Geotech. Eng., 115(3), 415-419. Hustrulid, W., Qianyuan, Y. and Krauland, N. (1989), “Modeling of cut-and-fill mining systems – Näsliden revisited”, Innovation in Min. Backfill Technology. Balkema, Rotterdam, 147-164. Iglesia, G.R., Einstein, H.H. and Whitman, R.V. (1999), “Determination of vertical loading on underground structures based on an arching evolution concept”, Geo-
Engineering for Underground Facilities. C. Fernandez and R.A. Bauer (eds.). Geo-Institute of ASCE, 495-506. Jaky, J. (1948), “Pressure in silos”, Proc. 2nd Int. Conf. Soil Mech. Foundation Eng. Balkema, Rotterdam, 1, 103-107. Janssen, H.A. (1895), “Versuche über Getreidedruck in Silozellen”, Zeitschrift Verein Ingenieure, 39, 1045-1049. Kutzner, C. (1997), “Earth and rockfill dams: Principles of design and construction”, Balkema, Rotterdam. Ladanyi, B. and Hoyaux, B. (1969), “A study of the trap-door problem in a granular mass”, Can. Geotech. J., 6(1): 1-14. Li, L. and Aubertin, M. (2008), “An improved analytical solution to estimate the stress state in sub-vertical backfilled stopes”, Can. Geotech. J., 45(10), 1487-1496. Li, L. and Aubertin, M. (2009a), “Influence of water pressure on the stress state in stopes with cohesionless backfill”, Geotech. Geol. Eng., 27(1), 1-11. Li, L. and Aubertin, M. (2009b), “A three-dimensional analysis of the total and effective normal stresses in submerged backfilled stopes”, Geotech. Geol. Eng., 27(4), 559-569. Li, L., and Aubertin, M. (2009c). “Numerical investigation of the stress state in inclined backfilled stopes.” ASCE Int. J. Geomech., 9(2), 52-62. Li, L. and Aubertin, M. (2010), “An analytical solution for the nonlinear distribution of effective and total stresses in vertical backfilled stopes”, Geomech. Geoeng., 5(4), 237-245. Li, L., Aubertin, M., Simon, R., Bussière, B. and Belem, T. (2003), “Modeling arching effects in narrow backfilled stopes with FLAC”, FLAC and Numerical Modeling in Geomechanics – 2003. A.A Balkema, Lisse, 211-219. Li, L., Aubertin, M. and Belem, T. (2005a), “Formulation of a three dimensional analytical solution to evaluate stresses in backfilled vertical narrow openings”, Can. Geotech. J., 42(6), 1705-1717 (with Erratum 2006; 43, 338-339). Li, L., Aubertin, M. and Belem, T. (2005b), “Development of a 3D analytical solution to evaluate stresses in backfilled vertical openings”, Technical report EPM-RT-2005-04, École Polytechnique de Montréal. Li, L., Dubé, J.-S. and Aubertin, M. (2011), “An extension of Marston’s solution for the stresses in backfilled trenches with inclined walls”, Geotech. Geol. Eng. (submitted). Li, L., Dubé, J.-S. and Zangeneh-Madar, Z. (2012), “Estimation of total and effective stresses in trenches with inclined walls”, Int. J. Geotech. Eng. (accepted). Liu, C. and Evett, J.B. (2003), Soil properties testing, measurement, and evaluation, 5th edition. Prentice Hall. Marston, A. (1930), “The theory of external loads on closed conduits in the light of latest experiments”, Bulletin No. 96, Iowa Engineering Experiment Station, Ames, Iowa. Marston, A. and Anderson, A.O. (1913), “The theory of loads on pipes in ditches and tests of cement and clay drain tile and sewer pipe”, Bulletin No. 31, Iowa Engineering Experiment Station, Ames, Iowa. McCarthy, D.F. (1988), Essentials of soil mechanics and foundations: basic geotechnics. Prentice Hall. Michalowski, R.L. and Park, N. (2004), “Admissible stress fields and arching in piles of sand”, Géotech., 54(8): 529-538
Michalowski, R.L. and Park, N. (2005), “Arching in granular soils”, Geomechanics: Testing, Modeling, and Simulation, 143, 255-268. Moore, I.D. (2001), “Buried pipes and culverts”, Geotech. Geoenviron. Eng. Handbook, Rowe, R.K. (ed.). Kluwer Academic Publishing, Norwell, Mass. 541-567. Michalowski, R.L. and Park, N. (2007), “Arching in soils”, Numerical Models in Geomechanics NUMOG 10, 433-438. Paik, K.H. and Salgado, R. (2003), “Estimation of active earth pressure against rigid retaining walls considering arching effects”, Géotech., 53(7), 643-653. Pirapakaran, K. and Sivakugan, N. (2007a), “A laboratory model to study arching within a hydraulic fill stope”, Geotech. Testing J., 30(6), 1-8. Pirapakaran, K. and Sivakugan, N. (2007b), “Arching within hydraulic fill stopes”, Geotech. Geol. Eng., 25(1), 25-35. Pipatpongsa, T., Heng, S., Lizuka, A. and Ohta, H. (2010), “Statics of loose triangular embankment under Nadai's sand hill analogy”, J. Mech. Physics of Solids, 58(10): 1506-1523. Richards, J.C. (1966), The storage and recovery of particulate solids. Institution of Chemical Engineers, London. Richmond, O. and Gardner, G.C. (1962), “Limiting spans for arching of bulk materials in vertical channels”, Chemical Eng. Sci., 17, 1071-1078. Spangler, M.G. (1948), “Underground conduits – An appraisal of modern research”, Transactions, American Society of Civil Engineers, 113, 316-374. Spangler, M.G. and Handy, R.L. (1984), Soil engineering. Harper and Row, New York, N.Y. Sperl, M. (2006), “Experiments on corn pressure in silo cells - translation and comment of Janssen’s paper from 1895”, Granular Matter, 8, 59-65. Shukla, S.K., Loughran, J.G. and Sivakugan, N. (2009a), “Stress within a cohesionless granular fill in a storage vessel with sloping walls during initial static loading.” Powder Technology, 192, 389-393. Shukla, S. K., Gaurav, S. and Sivakugan, N. (2009b), “A simplified extension of the conventional theory of arching in soils”, Int. J. Geotech. Eng., 3(3), 353-359. Singh, S., Sivakugan, N. and Shukla, S. K. (2010), “Can soil arching be insensitive to φ?”, Int. J. Geomech., 10(3), 124-128. Take, W.A. and Valsangkar, A.J. (2001), “Earth pressures on unyielding retaining walls of narrow backfill width”, Can. Geotech. J., 38, 1220-1230. Terzaghi, K. (1936), “Stress distribution in dry and in saturated sand above a yielding trap-door”, Proc. 1st Int. Conf. Soil Mech. Foundation Eng., 1, 307-311. Ting, C.H., Shukla, S.K. and Sivakugan, N. (2011), “Arching in soils applied to inclined mine stopes”, ASCE Int. J. Geomech., 11(1), 29-35. Wang, Y.Z. (2000), “Distribution of earth pressure on retaining wall”, Géotech., 50(1), 83-88. Whidden, W.R. (ed.) (2010), Buried flexible steel pipe: Design and structure analysis. ASCE Manuals and Reports on Engineering Practice No. 119.