Embed Size (px)
Citation preview


Pressures on the Great Pressures on the Great Lakes EcosystemLakes Ecosystem
Donna MyersDonna MyersUnited States Geological SurveyUnited States Geological Survey

Major Pressures on the Great Major Pressures on the Great LakesLakes
NonNon--Native SpeciesNative SpeciesToxic ContaminantsToxic ContaminantsExcessive NutrientsExcessive NutrientsPhysical ProcessesPhysical Processes

Cumulative Number of NonCumulative Number of Non--native native Species Introduced since the Species Introduced since the
1830’s1830’s

Release Mechanisms for NonRelease Mechanisms for Non--Native SpeciesNative Species

Sea LampreySea Lamprey

Lampricide TreatmentLampricide Treatment

Sea Lamprey TrapSea Lamprey Trap

Toxic Contaminants: How much is Toxic Contaminants: How much is in the aquatic food web?in the aquatic food web?
Contaminants in:Contaminants in:youngyoung--ofof--year year spottailspottail shiners shiners whole fishwhole fishcolonial nesting colonial nesting waterbirdswaterbirdssnapping turtle snapping turtle eggseggs

OrganochlorineOrganochlorine PesticidesPesticides
DDTDDTDDE, DDDDDE, DDD
HexachlorobenzeneHexachlorobenzeneHeptachlor Heptachlor epoxideepoxideDieldrinDieldrinMirexMirex
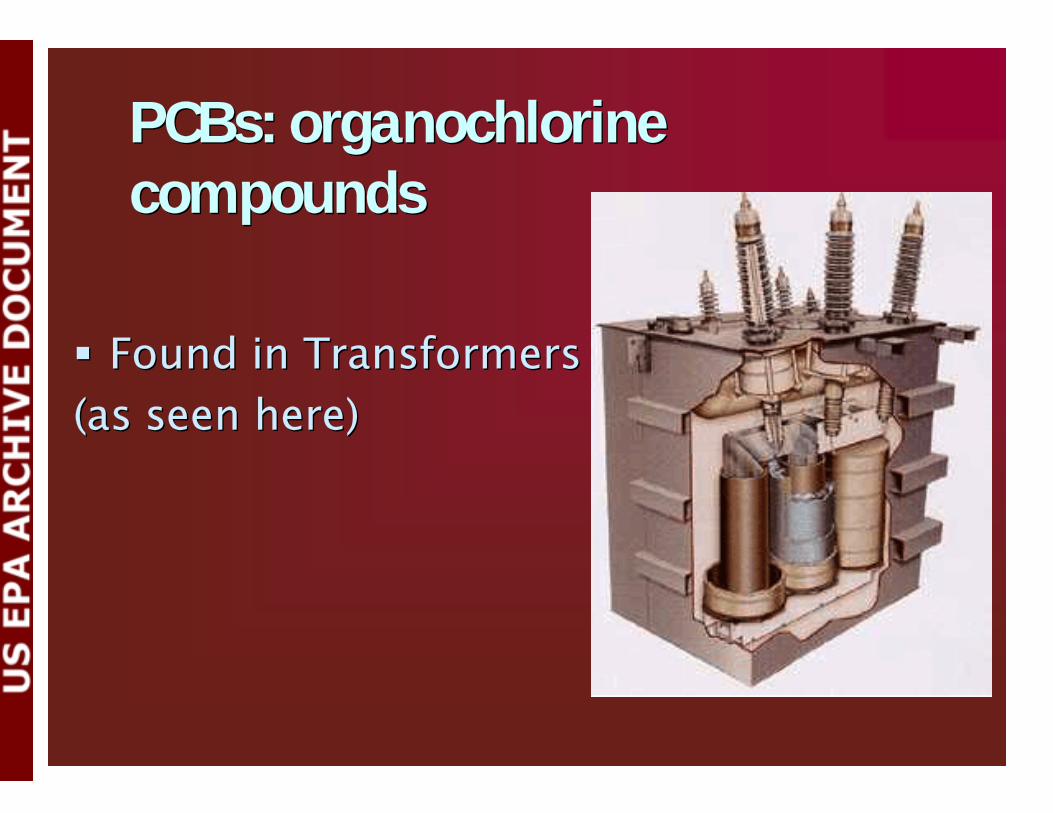
PCBs: PCBs: organochlorineorganochlorinecompoundscompounds
Found in Transformers Found in Transformers (as seen here)(as seen here)

Contaminants in YContaminants in Y--OO--Y Y SpottailSpottailShinersShiners
Total DDT Levels in Juvenile Spottail Shiners from Lake Erie at
Leamington
050
100150200250300
1975
1979
1982
1985
1988
1992
Year
Tota
l DD
T (n
g/g)
PCB Levels in Juvenile Spottail Shiners from Lake Erie at
Leamington
0200400600800
1000120014001600
1975
1978
1980
1982
1984
1986
1988
1991
1993
1995
Year
PCB
s (n
g/g)
Mirex Levels in Juvenile Spottail Shiners from Lake Ontario at the
Credit River
01020304050
1976
1979
1982
1987
1989
1992
1996
Year
Mire
x (n
g/g)
Mirex Levels in Juvenile Spottail Shiners from Lake Ontario at the
Credit River
01020304050
1976
1979
1982
1987
1989
1992
1996
Year
Mire
x (n
g/g)
PCB Levels in Juvenile Spottail Shiners from Lake Erie at
Leamington
0200400600800
1000120014001600
1975
1978
1980
1982
1984
1986
1988
1991
1993
1995
Year
PCBs
(ng/
g)
Total DDT Levels in Juve nile Spottail Shiners from Lake Erie at
Leamington
050
100150200250300
1975
1979
1982
1985
1988
1992
Year
Tota
l DD
T (n
g/g)

Lake OntarioLake Ontario
Lake ErieLake Erie
Lake SuperiorLake Superior
Lake HuronLake Huron

0
10
20
30
1972 1976 1980 1984 1988 1992 1996 2000Year
PCB
(ug/
g)PCBs in Lake Michigan Whole Lake TroutPCBs in Lake Michigan Whole Lake Trout

0
1
2
3
4
1977 1984 1991 1998Year
PCB
(ug/
g)PCBs in Lake Erie Whole WalleyePCBs in Lake Erie Whole Walleye


DDE in Herring Gull eggs, Toronto DDE in Herring Gull eggs, Toronto Harbor, 1974 Harbor, 1974 –– 20012001
(concentrations in parts per million)(concentrations in parts per million)
0
5
10
15
20
25
1974
1976
1978
1980
1982
1984
1986
1988
1990
1992
1994
1996
1998
2000
Year
Con
cent
rati
on
(ug/
g, w
et w
eigh
t)
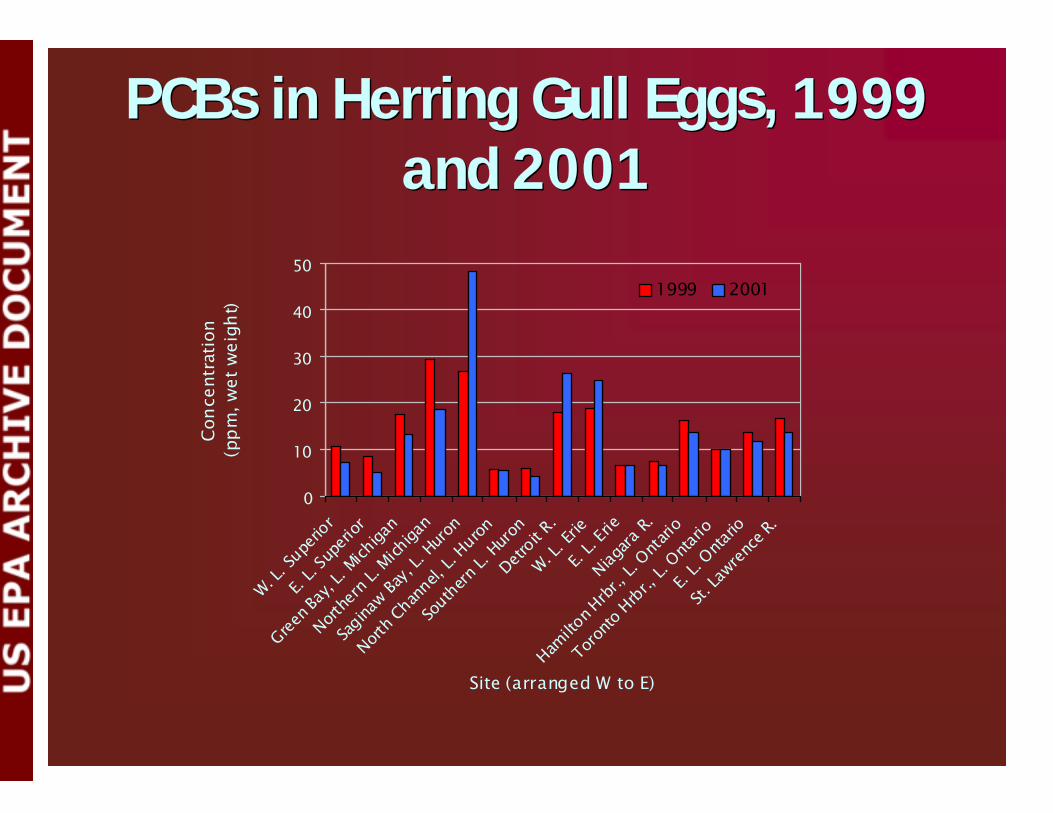
PCBs in Herring Gull Eggs, 1999 PCBs in Herring Gull Eggs, 1999 and 2001and 2001
0
10
20
30
40
50
W. L. S
uperi
or
E. L.
Supe
rior
Green B
ay, L
. Mich
igan
Northe
rn L.
Michiga
n
Sagina
w Bay,
L. Hu
ron
North C
hann
el, L.
Huron
South
ern L.
Huron
Detroit
R.W. L
. Erie
E. L.
Erie
Niagara
R.
Hamilto
n Hrbr
., L. O
ntario
Toron
to Hrbr
., L. O
ntario
E. L.
Ontario
St. La
wrence
R.
Site (arranged W to E)
Conc
entr
atio
n(p
pm, w
et w
eigh
t)
1999 2001


Total PCB concentrations (parts per Total PCB concentrations (parts per million) in Snapping Turtle eggs from million) in Snapping Turtle eggs from
selected sites and yearsselected sites and years
1984 1989-91 1998-99 2001Algonquin Pk. (Reference) 0.187 0.018 0.02 0.02St. Clair NWA, (Lake St. Clair) 1.095 - - -Turkey Creek, Detroit River - - - 1.832Wheatley Harbor, Erie - - - 0.413Rondeau Provincial Park , Erie 1.093 0.617 -Cootes Paradise, Ontario 1.315 3.575 2.956 -Lynde Creek, Ontario - 1.43 - -Akwesasne, St. Lawrence 0.869 3.946 6.373 -
YEARSite

Toxic Contaminants: How Toxic Contaminants: How much is in the environment?much is in the environment?
Contaminants in sediment coresContaminants in sediment coresToxic chemical concentrations in Toxic chemical concentrations in waterwaterAtmospheric deposition of toxic Atmospheric deposition of toxic chemicalschemicals

Sediment Quality Index (SQI) Sediment Quality Index (SQI) Scores Scores –– 1997 Samples1997 SamplesLake and BasinLake and Basin SQI ScoreSQI Score
ErieErieWesternWestern 8585CentralCentral 8686EasternEastern 9595
OntarioOntarioNiagaraNiagara 6767MississaugaMississauga 6666RochesterRochester 7070KingstonKingston 8787
Scale: 0 = Poor, 100 = ExcellentScale: 0 = Poor, 100 = Excellent

SQI scores for Five Areas of SQI scores for Five Areas of Concern in the U.S.Concern in the U.S.
SITE Lake SQI Score
Buffalo River, NY Erie 93
Saginaw River and Harbor, MIMichigan 58
Ashtabula River and Harbor, OHErie 36
Sheboygan River and Harbor, WI Michigan 29
Grand Calumet River / Indiana Harbor, IN Michigan 25
Scale: 0 = Poor, 100 = ExcellentScale: 0 = Poor, 100 = Excellent

DieldrinDieldrin (pesticide) concentrations in (pesticide) concentrations in Great Lakes Waters 1997 Great Lakes Waters 1997 -- 20002000
Legend (ng/L)< 0.15
0.15 – 0.200.20 +

PCBs in atmosphericPCBs in atmosphericdepositiondeposition
10
100
1000
10000
1991 1992 1993 1994 1995 1996 1997 1998 1999 2000
Year
Conc
entra
tion
(ppt
)
Chicago

Atmospheric Concentrations of Atmospheric Concentrations of HexachlorocyclohexaneHexachlorocyclohexane
0
50
100
150
200
250
300
350
400
1991 1992 1993 1994 1995 1996 1997 1998 1999 2000Year
Con
cent
rati
on (
pg/m
3 )
Lake SuperiorLake MichiganLake ErieLake HuronLake OntarioAll Sites Decrease

Atmospheric Deposition of Five Atmospheric Deposition of Five Organochlorine CompoundsOrganochlorine Compounds
(mass deposited per year(mass deposited per year))
-3200-2800-2400-2000-1600-1200
-800-400
0400800
12001600
kg/y
r
a -H CH lindane d ie l dr i n p ,p′-DDT sum-PCB
1992 1994 19951993 1996 1997 1998

Excessive NutrientsExcessive Nutrients
Phosphorus Phosphorus concentrationsconcentrations

Superior
OntarioMichigan
Eastern Erie
WesternErie
Huron
0
5
10
15
20
25
1970 1975 1980 1985 1990 1995 2000
TP (u
g/L)
0
5
10
15
20
25
1970 1975 1980 1985 1990 1995 2000
TP (u
g/L)
0
5
10
15
20
25
1970 1975 1980 1985 1990 1995 2000
TP (
ug/L
)
0
5
10
15
20
25
1970 1975 1980 1985 1990 1995 2000
TP (u
g/L)
Central Erie
0
5
10
15
20
25
1970 1975 1980 1985 1990 1995 2000
TP (u
g/L)
Central Erie
0
5
10
15
20
25
1970 1975 1980 1985 1990 1995 2000
TP (u
g/L)
0
5
10
15
20
25
1970 1975 1980 1985 1990 1995 2000Yea rs
TP(u
g/L
)
0
10
20
30
40
50
60
70
80
90
100
0
10
20
30
40
50
60
70
80
90
100
1970 1975 1980 1985 1990 1995 20001970 1975 1980 1985 1990 1995 2000
TP (u
g/L)

Physical ProcessesPhysical Processes
Extent of hardened shorelineExtent of hardened shorelineEffect of water level fluctuationsEffect of water level fluctuationsClimate change Climate change –– Ice on the Great Ice on the Great LakesLakes

Extent of Hardened ShorelineExtent of Hardened Shoreline

Effect of Water Level Effect of Water Level FluctuationsFluctuations

Climate Change Climate Change –– Ice on the Great LakesIce on the Great Lakes