Embed Size (px)
Citation preview
2 0 1 3 © D i s c o v e r y E n e r g y C o r p
Prime Position in Australia’s Cooper Basin Oil Fairway
A P P E A 2 0 1 3 C O N F E R E N C E
B r i s b a n e , Q L D A u s t r a l i a
May 26-29, 2013
2 0 1 3 © D i s c o v e r y E n e r g y C o r p
Strategic asset in Australia’s largest and most proven onshore oil & gas basin
Licence (PEL 512) covers 585,000 acres in the “Western Oil Flank” of South Australia’s prolific Cooper/Eromanga Basins
Low geopolitical risk, favourable royalty & tax regime and committed government support of resource development
Established regional development history with over 2,980 wells drilled over past 50 years
Licence adjacent to producing fields with exceptional drilling success using 3D seismic
Offset production in multiple oil fields directly to the north of more than 5 MMbbls and directly to the east of more than 16 MMbbls
High appraisal/development well success of operators’ recent drill programmes on surrounding acreage
Compelling well economics
Surrounding operators achieving US$70+/barrel net backs
Low cost (~US$2.5M) shallow wells and high flow rates drive quick payback, compelling IRRs and rapid value creation
Adjoining operators all pursuing aggressive 2013 drill programmes based on 2011 and 2012 success
2
Overview
2 0 1 3 © D i s c o v e r y E n e r g y C o r p
Low risk exploration & development plan
Over 110 leads and several drill ready prospects identified using reprocessed 3D seismic data Discussions also underway with possible joint venture partners to lower exploration risk
Upside potential from emerging unconventional shale story
Initial Cooper Basin shale wells producing encouraging data and flow rates; first commercial Cooper Basin unconventional production started in October 2012
Strong local infrastructure already in place
Moomba oil processing facility approximately 65 kilometres away with access via road or existing pipeline capacity with interconnection near the PEL 512 South Block
Experienced and capable management team
Seasoned professionals with strong track records in oil and gas and extensive operational experience in Cooper Basin
Clear route to value creation
Ability to invest at an attractive price versus peer group valuation parameters with multiple catalysts for value creation and a focus on early cash generation from initial wells
Strategically and geographically well placed for industry players seeking access, or additional resources, in the Cooper/Eromanga Basin Oil Fairway
3
Overview continued
2 0 1 3 © D i s c o v e r y E n e r g y C o r p 4
Cooper Basin Map
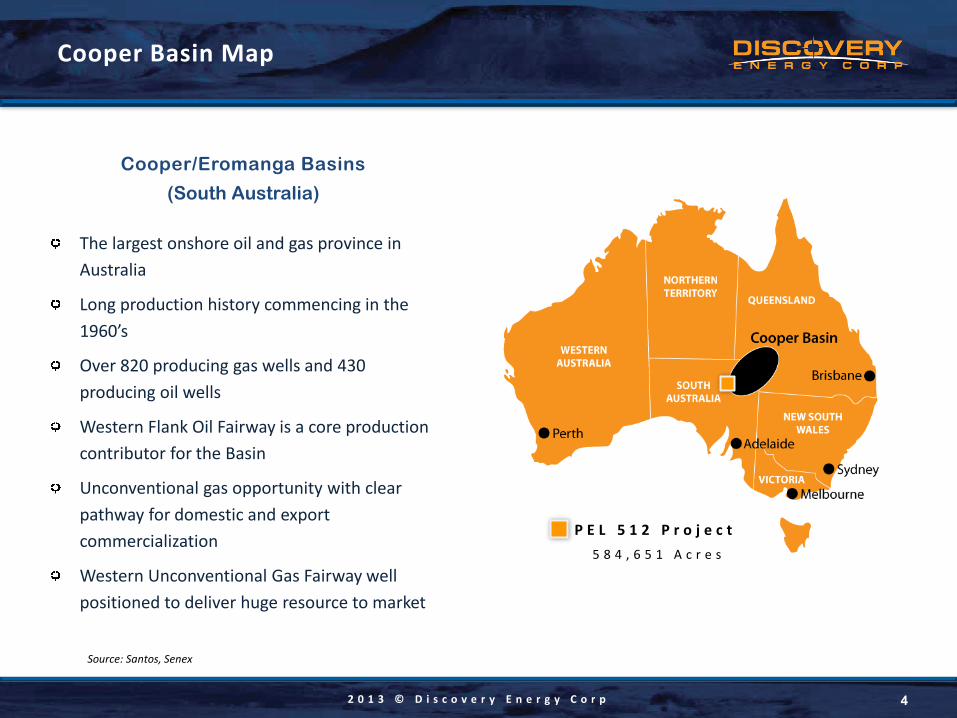
P E L 5 1 2 P r o j e c t 5 8 4 , 6 5 1 A c r e s
Cooper/Eromanga Basins
(South Australia)
The largest onshore oil and gas province in Australia
Long production history commencing in the 1960’s
Over 820 producing gas wells and 430 producing oil wells
Western Flank Oil Fairway is a core production contributor for the Basin
Unconventional gas opportunity with clear pathway for domestic and export commercialization
Western Unconventional Gas Fairway well positioned to deliver huge resource to market
Source: Santos, Senex
2 0 1 3 © D i s c o v e r y E n e r g y C o r p
Experienced Management Team with a Focused Commercial and Operations Strategy:
5
Management Team
Keith D. Spickelmier Executive Chairman
Executive Chairman of Sintana Energy Inc. – raised US$34 Million in funding in the past 12 months. Founder & Chairman of Westside Energy, a Texas Barnett shale producer founded late 2003 & sold for US$230m in 2008.
Keith J. McKenzie CEO & Director
25 years’ experience working with public companies in the industrial and resource sectors. 13 years in the Oil & Gas sector in various executive, finance, start-up, and consulting capacities. Founding principal & COO in 2004 of Paxton Energy, Inc., responsible for development drilling & operations.
William E. Begley CFO, Director & Treasurer
25 years’ energy industry & finance experience – starting his career at BP. Held senior positions in energy banking at Salomon Brothers. Recently served as Chief Financial Officer and Treasurer for Magellan Petroleum Corporation, Australia focus.
Michael D. Dahlke President & COO
Founding principal of CSB Partners, LLC, consulting with firms in oil field services, upstream & mid-stream oil & gas. Previously a member of the Jefferies & Company oil and gas banking and consulting group. Joined Jefferies after a 30-year career with Enron Corp. (and predecessors)
2 0 1 3 © D i s c o v e r y E n e r g y C o r p
A Highly Experienced Technical and Operations Team with Cooper Basin Expertise:
6
Operations Team
Andrew Adams Director & Country Manager, Discovery Energy SA Ltd.
30 years' experience in petroleum exploration ranging across technical & commercial aspects of the business. Managing Director of Bass Strait Oil Company Ltd and Commercial Manager at Cue Energy Resources. Led Santos Ltd. exploration and development teams with a focus on Australia and Southeast Asia.
Andy Carroll Director, Discovery Energy SA Ltd.
Previously Managing Director of Great Artesian Oil & Gas Ltd (ASX: GOG). Re-positioned the company from a Cooper Basin “farm-out” explorer to be an oil & gas business. Business development included organising financing for US$90 million acquisition.
Woody Leel Chief Geologist
Certified petroleum geologist with experience in domestic and international exploration and production. He has held senior positions (VP Exploration, District Geologist and Senior Geologist) at leading companies such as Hess Corp., Triton Energy and Getty Oil and with several independent oil companies.
James A. Carroll Geophysicist
Registered, licenced and certified by the Texas Board of Professional Geoscientists with more than 40 years of on and off shore domestic and international successes in oil and gas. International experience includes detailed analysis of 3D seismic data in the Cooper Basin.
2 0 1 3 © D i s c o v e r y E n e r g y C o r p
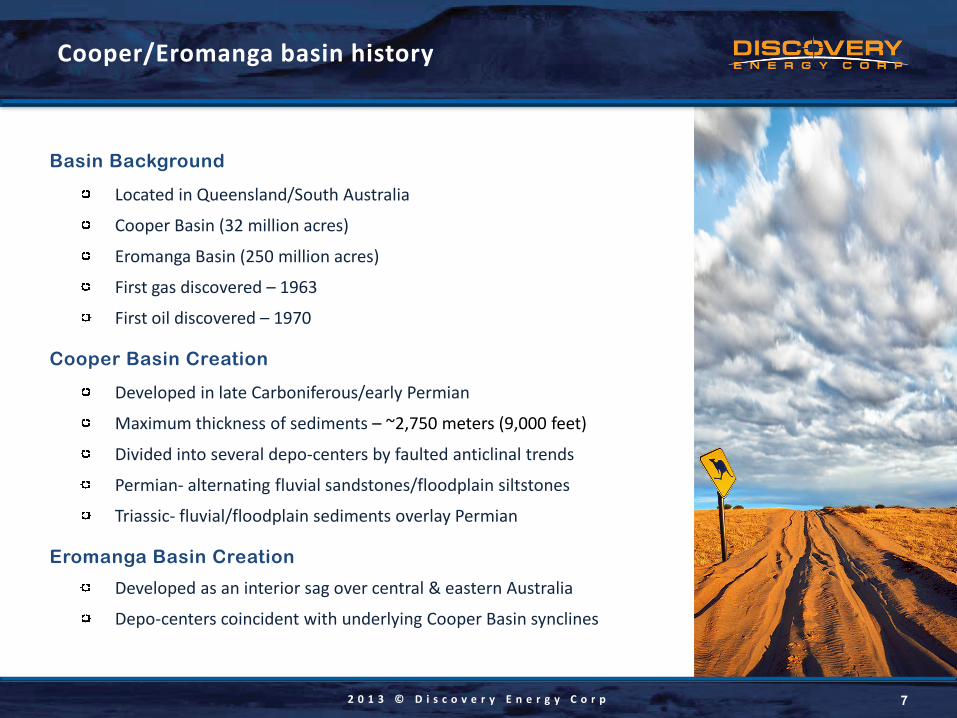
Basin Background
Located in Queensland/South Australia
Cooper Basin (32 million acres)
Eromanga Basin (250 million acres)
First gas discovered – 1963
First oil discovered – 1970
Cooper Basin Creation
Developed in late Carboniferous/early Permian
Maximum thickness of sediments – ~2,750 meters (9,000 feet)
Divided into several depo-centers by faulted anticlinal trends
Permian- alternating fluvial sandstones/floodplain siltstones
Triassic- fluvial/floodplain sediments overlay Permian
Eromanga Basin Creation
Developed as an interior sag over central & eastern Australia
Depo-centers coincident with underlying Cooper Basin synclines
7
Cooper/Eromanga basin history
2 0 1 3 © D i s c o v e r y E n e r g y C o r p 8
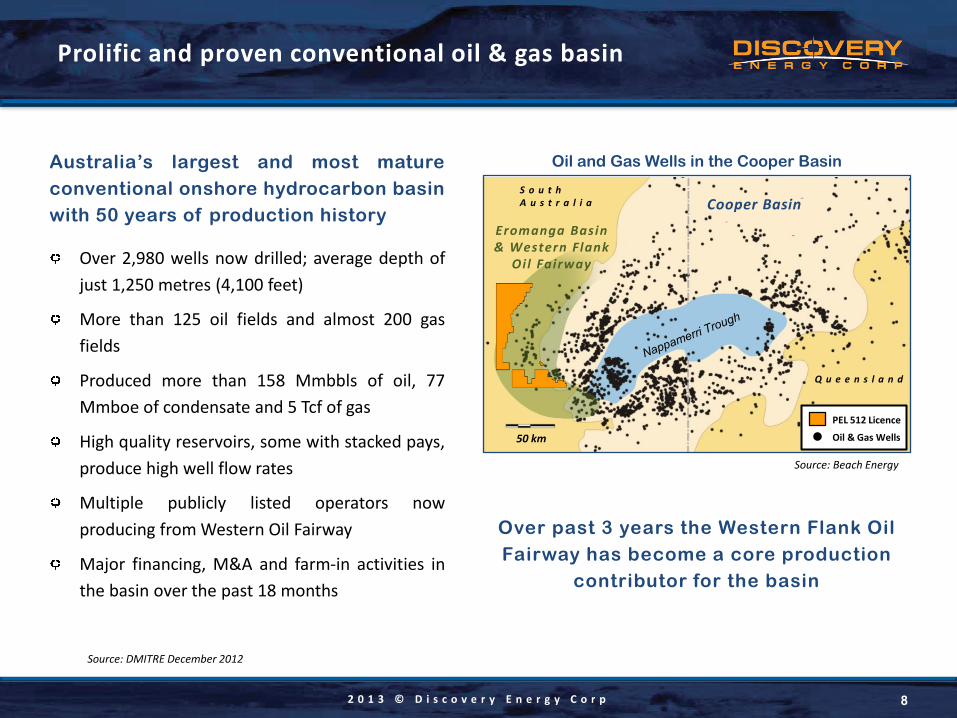
Prolific and proven conventional oil & gas basin
S o u t h A u s t r a l i a
Eromanga Basin & Western Flank
Oi l Fairway
Q u e e n s l a n d
50 km
Oil and Gas Wells in the Cooper Basin
Source: Beach Energy
Australia’s largest and most mature conventional onshore hydrocarbon basin with 50 years of production history
Over 2,980 wells now drilled; average depth of just 1,250 metres (4,100 feet)
More than 125 oil fields and almost 200 gas fields
Produced more than 158 Mmbbls of oil, 77 Mmboe of condensate and 5 Tcf of gas
High quality reservoirs, some with stacked pays, produce high well flow rates
Multiple publicly listed operators now producing from Western Oil Fairway
Major financing, M&A and farm-in activities in the basin over the past 18 months
Cooper Basin
Source: DMITRE December 2012
Over past 3 years the Western Flank Oil Fairway has become a core production
contributor for the basin
PEL 512 Licence
Oil & Gas Wells
2 0 1 3 © D i s c o v e r y E n e r g y C o r p 9
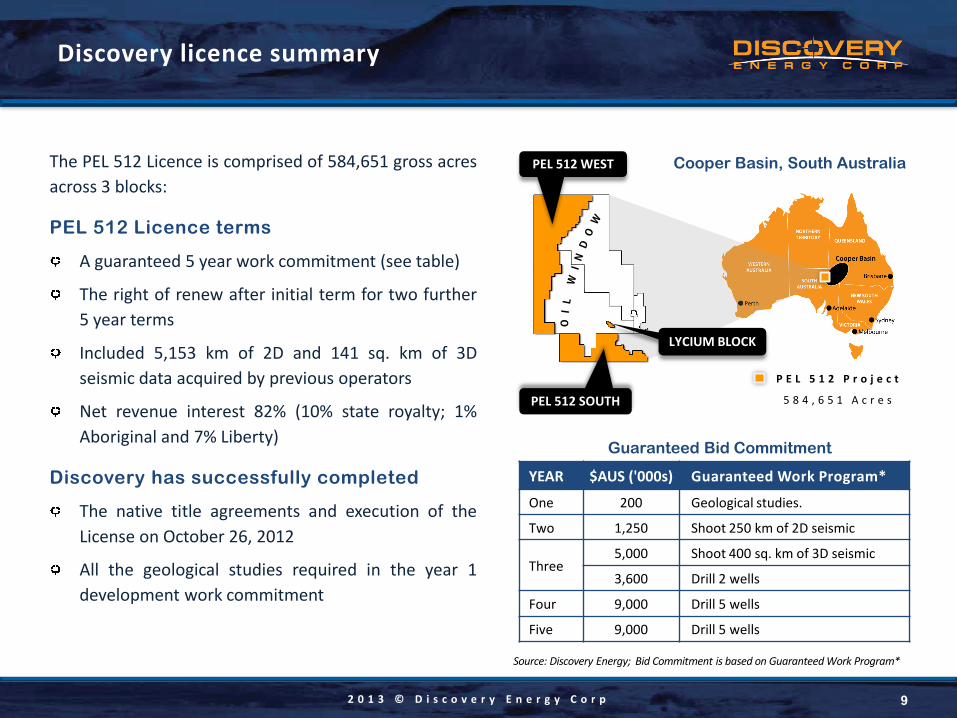
Discovery licence summary
The PEL 512 Licence is comprised of 584,651 gross acres across 3 blocks:
PEL 512 Licence terms
A guaranteed 5 year work commitment (see table)
The right of renew after initial term for two further 5 year terms
Included 5,153 km of 2D and 141 sq. km of 3D seismic data acquired by previous operators
Net revenue interest 82% (10% state royalty; 1% Aboriginal and 7% Liberty)
Discovery has successfully completed
The native title agreements and execution of the License on October 26, 2012
All the geological studies required in the year 1 development work commitment
YEAR $AUS ('000s) Guaranteed Work Program*
One 200 Geological studies.
Two 1,250 Shoot 250 km of 2D seismic
Three 5,000 Shoot 400 sq. km of 3D seismic
3,600 Drill 2 wells
Four 9,000 Drill 5 wells
Five 9,000 Drill 5 wells
Source: Discovery Energy; Bid Commitment is based on Guaranteed Work Program*
Guaranteed Bid Commitment
P E L 5 1 2 P r o j e c t
5 8 4 , 6 5 1 A c r e s
Cooper Basin, South Australia PEL 512 WEST
PEL 512 SOUTH
LYCIUM BLOCK
2 0 1 3 © D i s c o v e r y E n e r g y C o r p 10
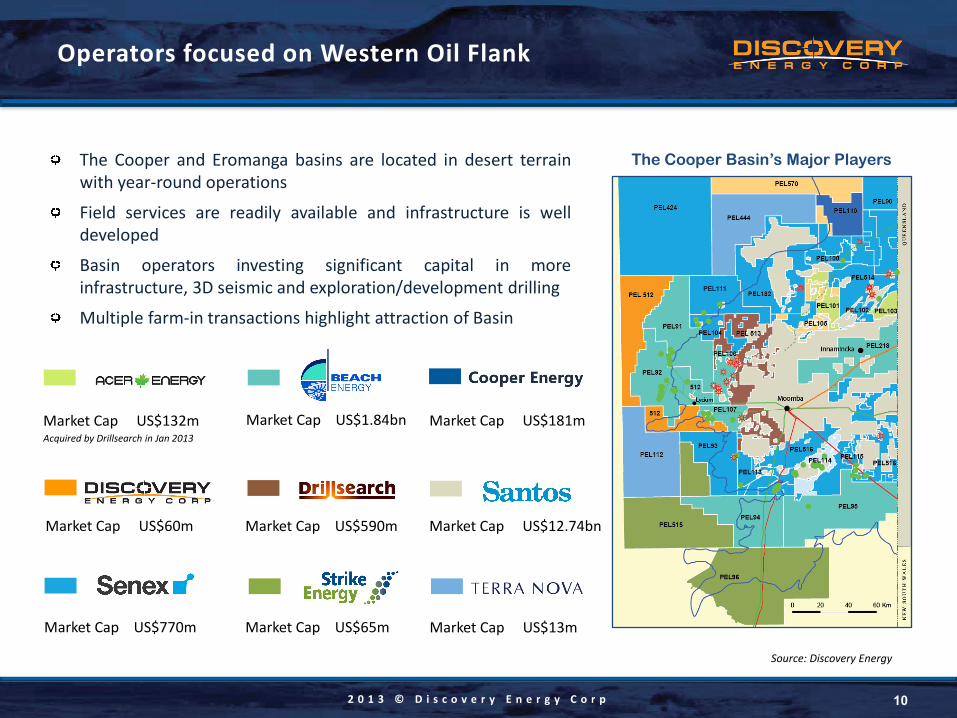
Operators focused on Western Oil Flank
The Cooper Basin’s Major Players The Cooper and Eromanga basins are located in desert terrain with year-round operations
Field services are readily available and infrastructure is well developed
Basin operators investing significant capital in more infrastructure, 3D seismic and exploration/development drilling
Multiple farm-in transactions highlight attraction of Basin
Market Cap US$132m Acquired by Drillsearch in Jan 2013
Market Cap US$1.84bn Market Cap US$181m
Market Cap US$60m Market Cap US$590m Market Cap US$12.74bn
Market Cap US$770m Market Cap US$65m Market Cap US$13m
Source: Discovery Energy
2 0 1 3 © D i s c o v e r y E n e r g y C o r p 11
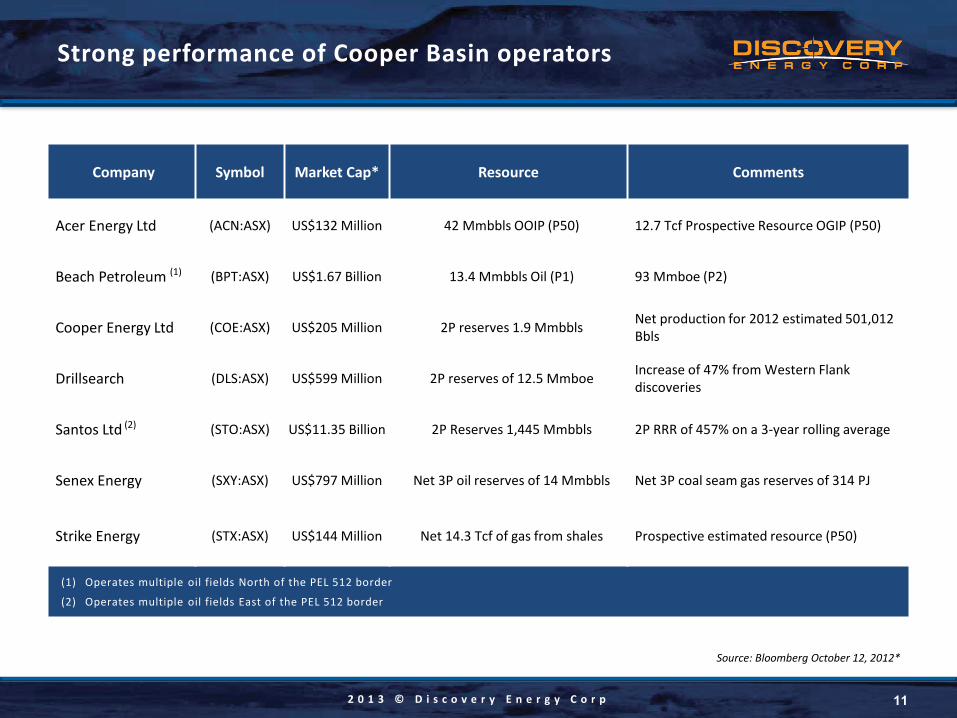
Strong performance of Cooper Basin operators
Company Symbol Market Cap* Resource Comments
Acer Energy Ltd (ACN:ASX) US$132 Million 42 Mmbbls OOIP (P50) 12.7 Tcf Prospective Resource OGIP (P50)
Beach Petroleum (1) (BPT:ASX) US$1.67 Billion 13.4 Mmbbls Oil (P1) 93 Mmboe (P2)
Cooper Energy Ltd (COE:ASX) US$205 Million 2P reserves 1.9 Mmbbls Net production for 2012 estimated 501,012 Bbls
Drillsearch (DLS:ASX) US$599 Million 2P reserves of 12.5 Mmboe Increase of 47% from Western Flank discoveries
Santos Ltd (2) (STO:ASX) US$11.35 Billion 2P Reserves 1,445 Mmbbls 2P RRR of 457% on a 3-year rolling average
Senex Energy (SXY:ASX) US$797 Million Net 3P oil reserves of 14 Mmbbls Net 3P coal seam gas reserves of 314 PJ
Strike Energy (STX:ASX) US$144 Million Net 14.3 Tcf of gas from shales Prospective estimated resource (P50)
(1) Operates multiple oil fields North of the PEL 512 border
(2) Operates multiple oil fields East of the PEL 512 border
Source: Bloomberg October 12, 2012*
2 0 1 3 © D i s c o v e r y E n e r g y C o r p 12
Major development in surrounding licences
Deloitte Access Economics, June 2012
“The most substantial onshore petroleum reserves in Australia are located in the Cooper and Eromanga Basins.”
Drillsearch press release, July 2012
“Drillsearch commits to extensive Western Flank Oil exploration & development program for FY 2013. Seven
appraisal/development wells planned for Bauer Oil Field and other Western Flank Oil discoveries. Exploration program to
include five firm exploration wells and 400 km2 of additional
3D seismic. The FY 2013 Western Flank Oil exploration and
development program will bring into production the significant oil discoveries made at PEL 91 in the previous year
and expand exploration to determine the future potential of
the Western Flank Oil Fairway.”
Strike Energy, David Wrench, Managing Director, September 2012
The sheer size of the resource gives our company unrivalled leverage to successful economic recovery of unconventional
resources from the Cooper Basin and is a pleasing result from the first significant unconventional exploration activity in the Southern Flank of the Cooper Basin”
Beach Energy Investor Presentation, September 2012
“[Cooper Basin] Western Flank oil is a core contributor to
Beach due to …. high net back per barrel, high flow rates from wells, excellent understanding of the geology resulting in high
success rate, multiple play types, an established and proposed
pipeline infrastructure to increase production rates”
Beach Energy, Reg Nelson, Managing Director, October 2012
“This discovery [of the new Windmill-1 field] in PEL 92
continues the momentum of our Western Flank exploration programme following the new field oil discovery at Mustang-1
in PEL 111. Oil discoveries such as these deserve a great deal
of attention as they are high profit generating and have the potential to grow in size with further appraisal drilling”
2 0 1 3 © D i s c o v e r y E n e r g y C o r p
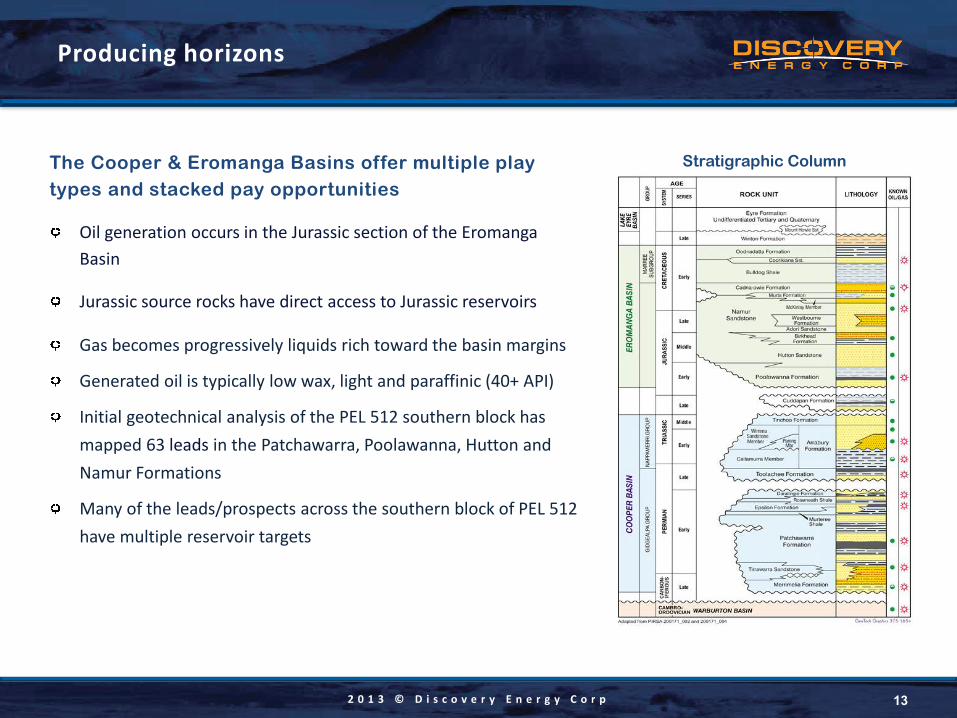
The Cooper & Eromanga Basins offer multiple play types and stacked pay opportunities
Oil generation occurs in the Jurassic section of the Eromanga Basin
Jurassic source rocks have direct access to Jurassic reservoirs
Gas becomes progressively liquids rich toward the basin margins
Generated oil is typically low wax, light and paraffinic (40+ API)
Initial geotechnical analysis of the PEL 512 southern block has mapped 63 leads in the Patchawarra, Poolawanna, Hutton and Namur Formations
Many of the leads/prospects across the southern block of PEL 512 have multiple reservoir targets
13
Producing horizons
Stratigraphic Column
2 0 1 3 © D i s c o v e r y E n e r g y C o r p
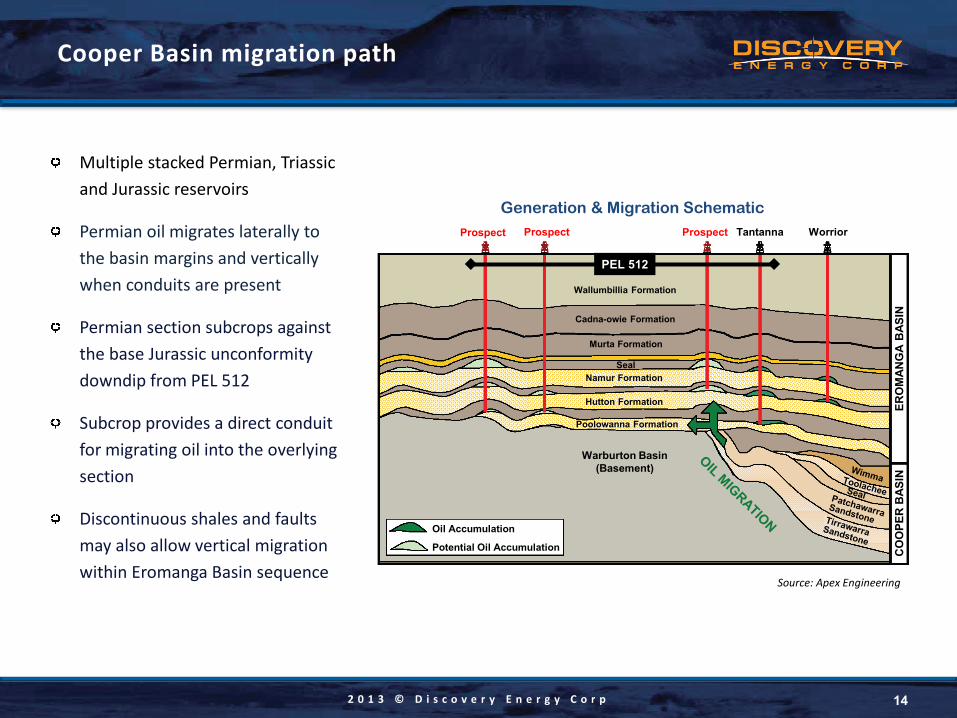
Multiple stacked Permian, Triassic and Jurassic reservoirs
Permian oil migrates laterally to the basin margins and vertically when conduits are present
Permian section subcrops against the base Jurassic unconformity downdip from PEL 512
Subcrop provides a direct conduit for migrating oil into the overlying section
Discontinuous shales and faults may also allow vertical migration within Eromanga Basin sequence
PEL 512
14
Cooper Basin migration path
Wallumbillia Formation
Cadna-owie Formation
Murta Formation
Seal Namur Formation
Hutton Formation
Poolowanna Formation
Tantanna Worrior Prospect Prospect Prospect
Oil Accumulation
Potential Oil Accumulation
Warburton Basin (Basement)
ERO
MAN
GA
BAS
IN
CO
OPE
R B
ASIN
Source: Apex Engineering
Generation & Migration Schematic
2 0 1 3 © D i s c o v e r y E n e r g y C o r p 15
Eromanga Basin sourcing & migration
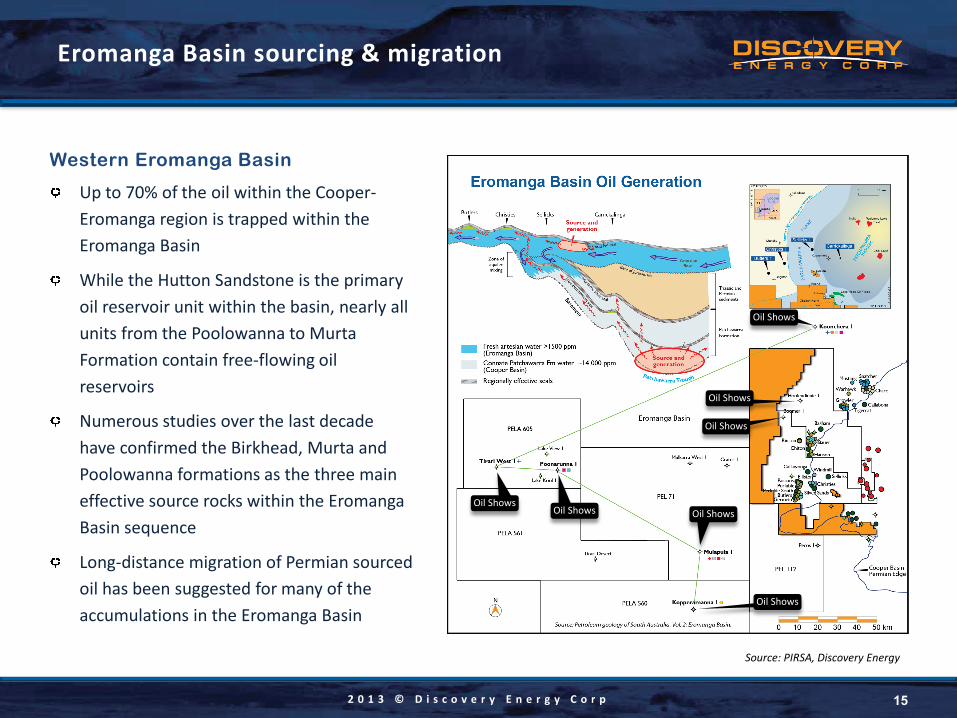
Western Eromanga Basin
Up to 70% of the oil within the Cooper-Eromanga region is trapped within the Eromanga Basin
While the Hutton Sandstone is the primary oil reservoir unit within the basin, nearly all units from the Poolowanna to Murta Formation contain free-flowing oil reservoirs
Numerous studies over the last decade have confirmed the Birkhead, Murta and Poolowanna formations as the three main effective source rocks within the Eromanga Basin sequence
Long-distance migration of Permian sourced oil has been suggested for many of the accumulations in the Eromanga Basin
Oil Shows
Oil Shows Oil Shows
Oil Shows
Oil Shows
Oil Shows
Oil Shows
Source: PIRSA, Discovery Energy
2 0 1 3 © D i s c o v e r y E n e r g y C o r p
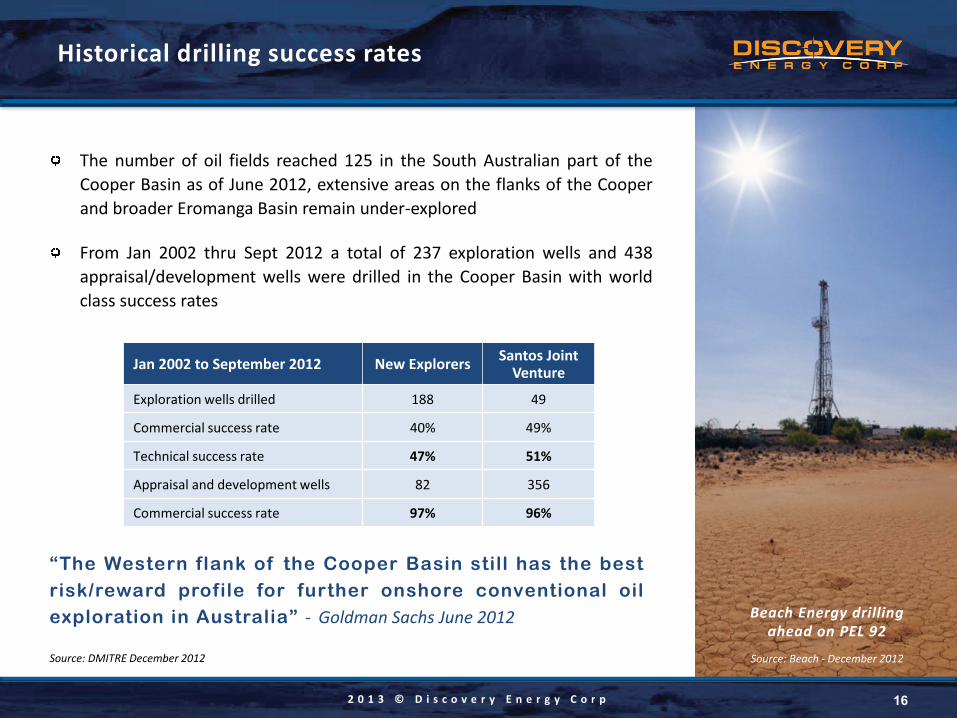
The number of oil fields reached 125 in the South Australian part of the Cooper Basin as of June 2012, extensive areas on the flanks of the Cooper and broader Eromanga Basin remain under-explored
From Jan 2002 thru Sept 2012 a total of 237 exploration wells and 438 appraisal/development wells were drilled in the Cooper Basin with world class success rates
16
Historical drilling success rates
Beach Energy drilling ahead on PEL 92
Source: Beach - December 2012 Source: DMITRE December 2012
Jan 2002 to September 2012 New Explorers Santos Joint Venture
Exploration wells drilled 188 49
Commercial success rate 40% 49%
Technical success rate 47% 51%
Appraisal and development wells 82 356
Commercial success rate 97% 96%
“The Western flank of the Cooper Basin still has the best risk/reward profile for further onshore conventional oil exploration in Australia” - Goldman Sachs June 2012
2 0 1 3 © D i s c o v e r y E n e r g y C o r p 17
Producing oil fields – eastern border of PEL 512
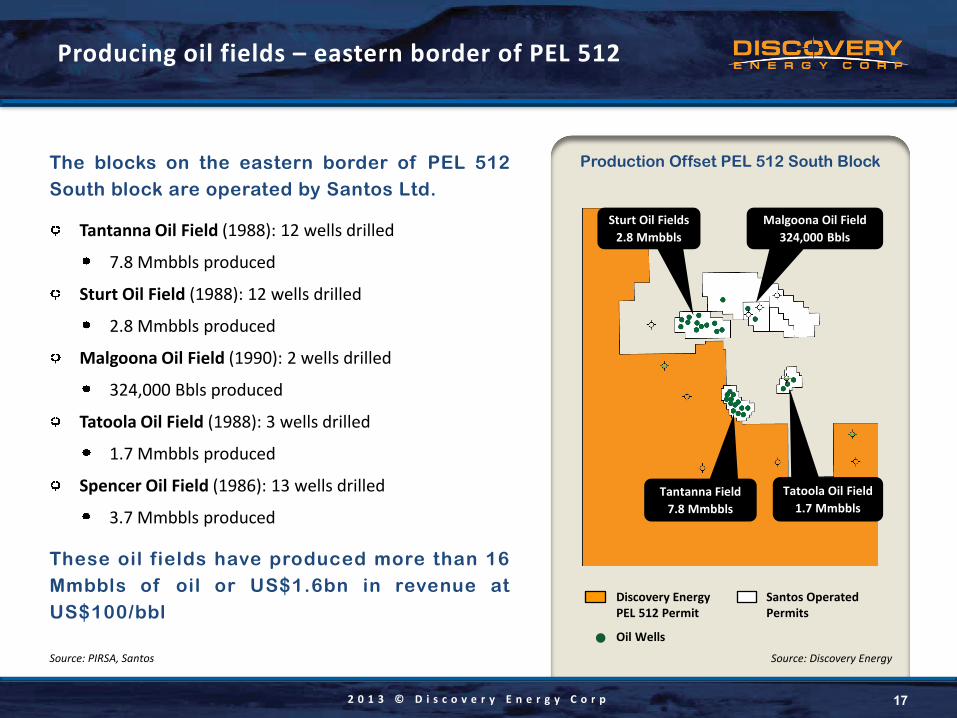
The blocks on the eastern border of PEL 512 South block are operated by Santos Ltd.
Tantanna Oil Field (1988): 12 wells drilled
7.8 Mmbbls produced
Sturt Oil Field (1988): 12 wells drilled
2.8 Mmbbls produced
Malgoona Oil Field (1990): 2 wells drilled
324,000 Bbls produced
Tatoola Oil Field (1988): 3 wells drilled
1.7 Mmbbls produced
Spencer Oil Field (1986): 13 wells drilled
3.7 Mmbbls produced
These oil fields have produced more than 16 Mmbbls of oil or US$1.6bn in revenue at US$100/bbl
Production Offset PEL 512 South Block
Sturt Oil Fields 2.8 Mmbbls
Tatoola Oil Field 1.7 Mmbbls
Malgoona Oil Field 324,000 Bbls
Tantanna Field 7.8 Mmbbls
Santos Operated Permits
Discovery Energy PEL 512 Permit
Oil Wells
Source: PIRSA, Santos Source: Discovery Energy
2 0 1 3 © D i s c o v e r y E n e r g y C o r p
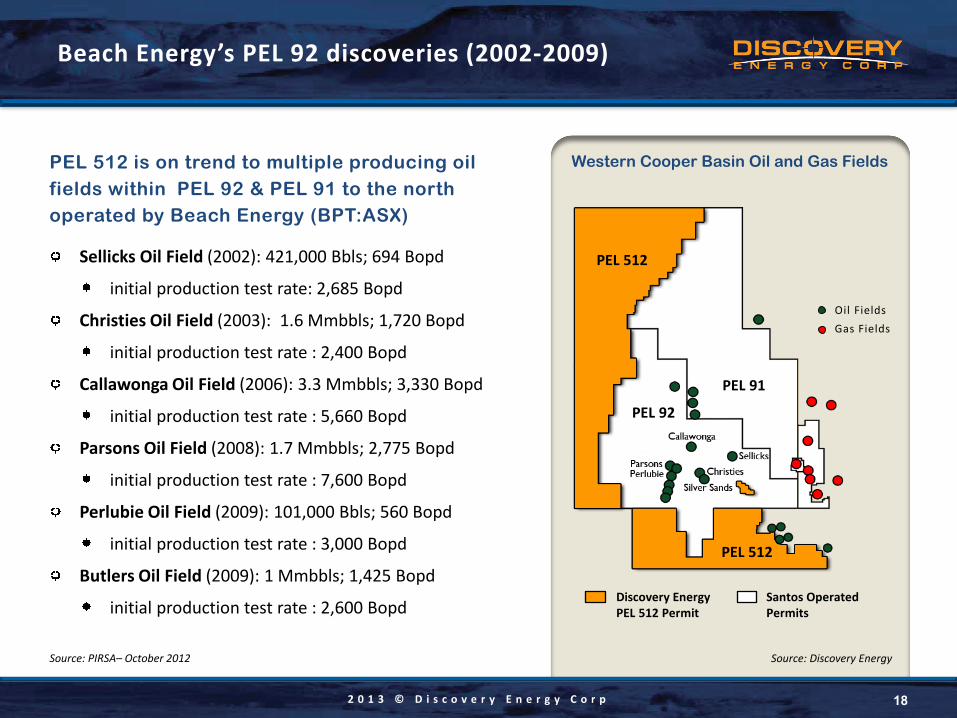
PEL 512 is on trend to multiple producing oil fields within PEL 92 & PEL 91 to the north operated by Beach Energy (BPT:ASX)
Sellicks Oil Field (2002): 421,000 Bbls; 694 Bopd
initial production test rate: 2,685 Bopd
Christies Oil Field (2003): 1.6 Mmbbls; 1,720 Bopd
initial production test rate : 2,400 Bopd
Callawonga Oil Field (2006): 3.3 Mmbbls; 3,330 Bopd
initial production test rate : 5,660 Bopd
Parsons Oil Field (2008): 1.7 Mmbbls; 2,775 Bopd
initial production test rate : 7,600 Bopd
Perlubie Oil Field (2009): 101,000 Bbls; 560 Bopd
initial production test rate : 3,000 Bopd
Butlers Oil Field (2009): 1 Mmbbls; 1,425 Bopd
initial production test rate : 2,600 Bopd
18
Beach Energy’s PEL 92 discoveries (2002-2009)
Source: PIRSA– October 2012
Western Cooper Basin Oil and Gas Fields
PEL 92
PEL 91
PEL 512
PEL 512
Oil Fields Gas Fields
Santos Operated Permits
Discovery Energy PEL 512 Permit
Source: Discovery Energy
2 0 1 3 © D i s c o v e r y E n e r g y C o r p
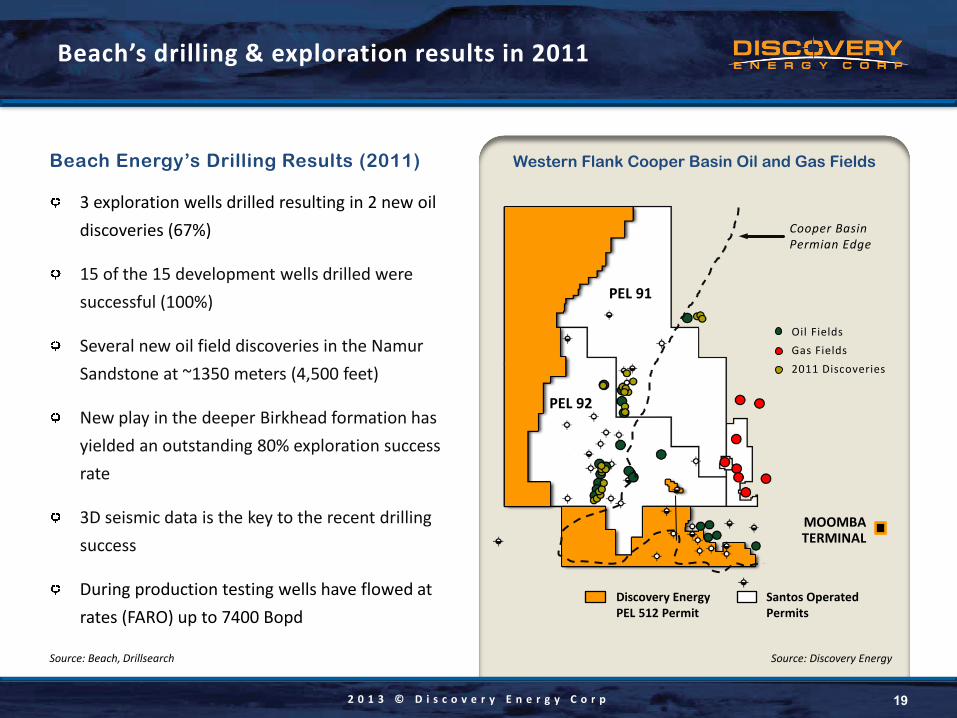
Beach Energy’s Drilling Results (2011)
3 exploration wells drilled resulting in 2 new oil discoveries (67%)
15 of the 15 development wells drilled were successful (100%)
Several new oil field discoveries in the Namur Sandstone at ~1350 meters (4,500 feet)
New play in the deeper Birkhead formation has yielded an outstanding 80% exploration success rate
3D seismic data is the key to the recent drilling success
During production testing wells have flowed at rates (FARO) up to 7400 Bopd
19
Beach’s drilling & exploration results in 2011
MOOMBA TERMINAL
PEL 91
PEL 92
Western Flank Cooper Basin Oil and Gas Fields
Oil Fields Gas Fields 2011 Discoveries
Cooper Basin Permian Edge
Source: Discovery Energy
Santos Operated Permits
Discovery Energy PEL 512 Permit
Source: Beach, Drillsearch
2 0 1 3 © D i s c o v e r y E n e r g y C o r p 20
Highly successful 2012 drilling program
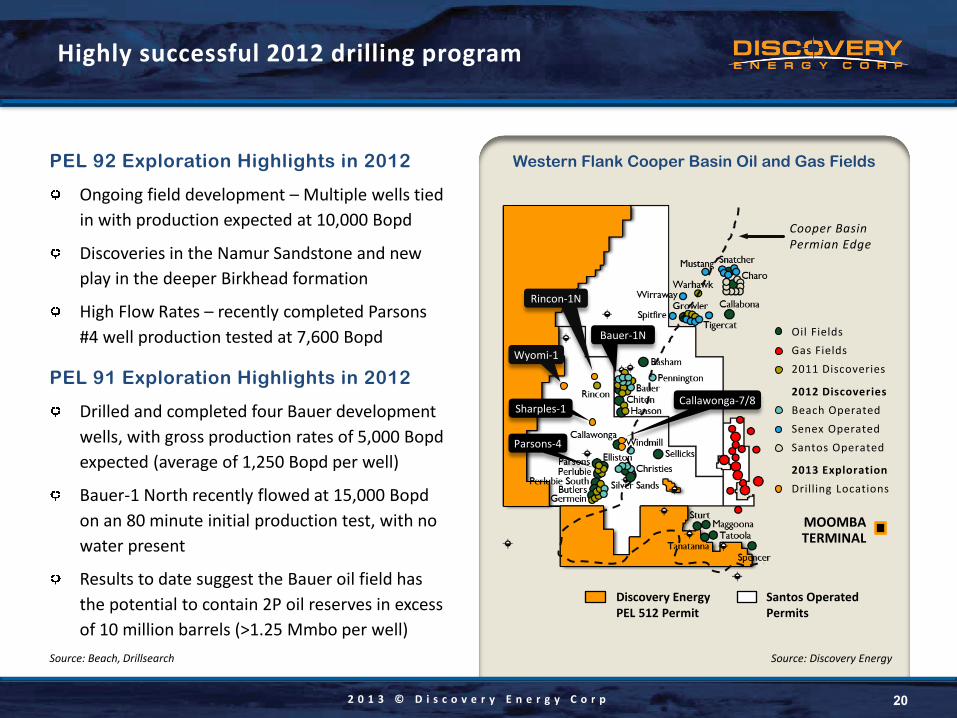
PEL 92 Exploration Highlights in 2012
Ongoing field development – Multiple wells tied in with production expected at 10,000 Bopd
Discoveries in the Namur Sandstone and new play in the deeper Birkhead formation
High Flow Rates – recently completed Parsons #4 well production tested at 7,600 Bopd
PEL 91 Exploration Highlights in 2012
Drilled and completed four Bauer development wells, with gross production rates of 5,000 Bopd expected (average of 1,250 Bopd per well)
Bauer-1 North recently flowed at 15,000 Bopd on an 80 minute initial production test, with no water present
Results to date suggest the Bauer oil field has the potential to contain 2P oil reserves in excess of 10 million barrels (>1.25 Mmbo per well)
Western Flank Cooper Basin Oil and Gas Fields
Oil Fields Gas Fields 2011 Discoveries
2012 Discoveries Beach Operated Senex Operated Santos Operated
2013 Exploration Drilling Locations
Parsons-4
Bauer-1N
MOOMBA TERMINAL
Rincon-1N
Sharples-1
Cooper Basin Permian Edge
Santos Operated Permits
Discovery Energy PEL 512 Permit
Source: Beach, Drillsearch Source: Discovery Energy
Wyomi-1
Callawonga-7/8
2 0 1 3 © D i s c o v e r y E n e r g y C o r p 21
Recent exploration & development success
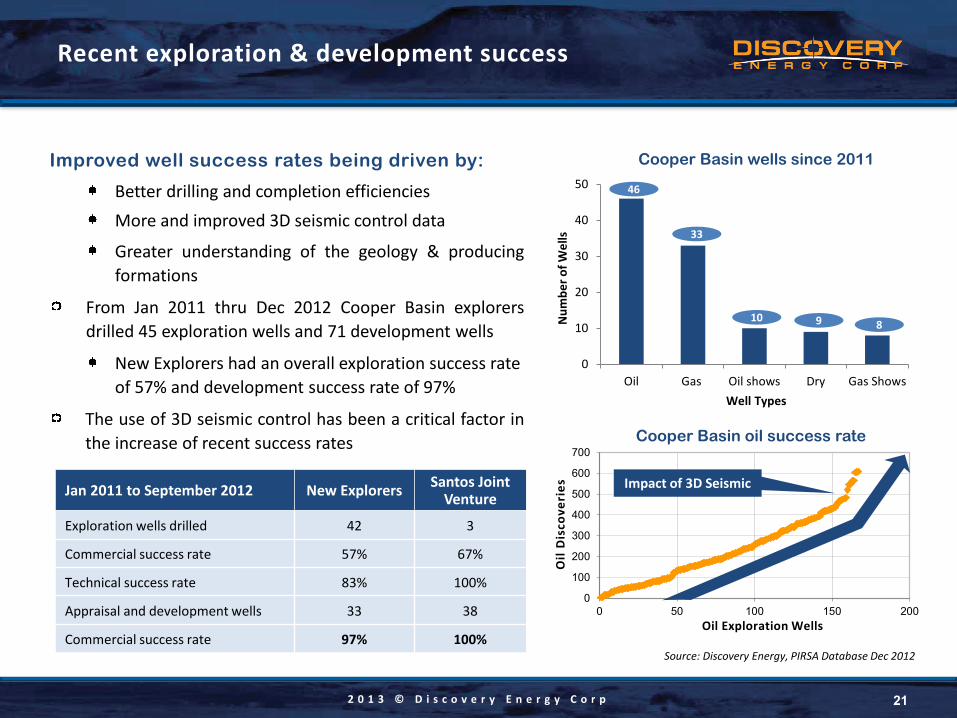
Improved well success rates being driven by:
Better drilling and completion efficiencies More and improved 3D seismic control data
Greater understanding of the geology & producing formations
From Jan 2011 thru Dec 2012 Cooper Basin explorers drilled 45 exploration wells and 71 development wells
New Explorers had an overall exploration success rate of 57% and development success rate of 97%
The use of 3D seismic control has been a critical factor in the increase of recent success rates
0
10
20
30
40
50
Oil Gas Oil shows Dry Gas Shows
Cooper Basin wells since 2011
Well Types
Num
ber o
f Wel
ls
46
33
8 10 9
Source: Discovery Energy, PIRSA Database Dec 2012
Impact of 3D Seismic
0
100
200
300
400
500
600
700
0 50 100 150 200
Oil
Dis
cove
ries
Oil Exploration Wells
Impact of 3D Seismic Jan 2011 to September 2012 New Explorers Santos Joint Venture
Exploration wells drilled 42 3
Commercial success rate 57% 67%
Technical success rate 83% 100%
Appraisal and development wells 33 38
Commercial success rate 97% 100%
Cooper Basin oil success rate
2 0 1 3 © D i s c o v e r y E n e r g y C o r p 22
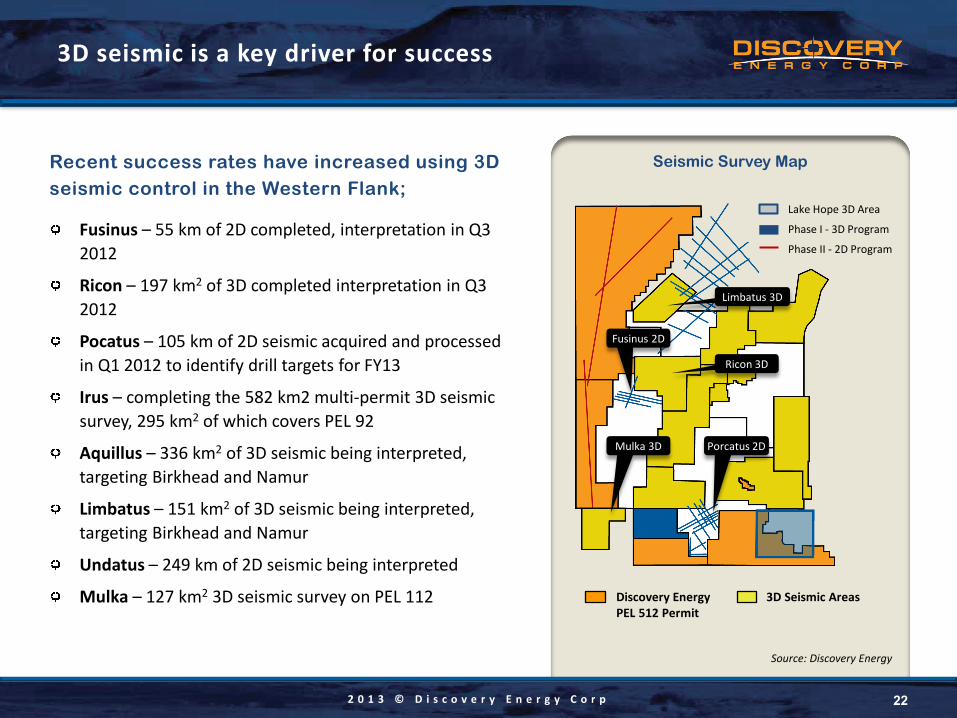
3D seismic is a key driver for success
Recent success rates have increased using 3D seismic control in the Western Flank;
Fusinus – 55 km of 2D completed, interpretation in Q3 2012
Ricon – 197 km2 of 3D completed interpretation in Q3 2012
Pocatus – 105 km of 2D seismic acquired and processed in Q1 2012 to identify drill targets for FY13
Irus – completing the 582 km2 multi-permit 3D seismic survey, 295 km2 of which covers PEL 92
Aquillus – 336 km2 of 3D seismic being interpreted, targeting Birkhead and Namur
Limbatus – 151 km2 of 3D seismic being interpreted, targeting Birkhead and Namur
Undatus – 249 km of 2D seismic being interpreted
Mulka – 127 km2 3D seismic survey on PEL 112
Lake Hope 3D Area
Phase I - 3D Program
Phase II - 2D Program
Fusinus 2D
Ricon 3D
Porcatus 2D Mulka 3D
Seismic Survey Map
Limbatus 3D
3D Seismic Areas Discovery Energy PEL 512 Permit
Source: Discovery Energy
2 0 1 3 © D i s c o v e r y E n e r g y C o r p 23
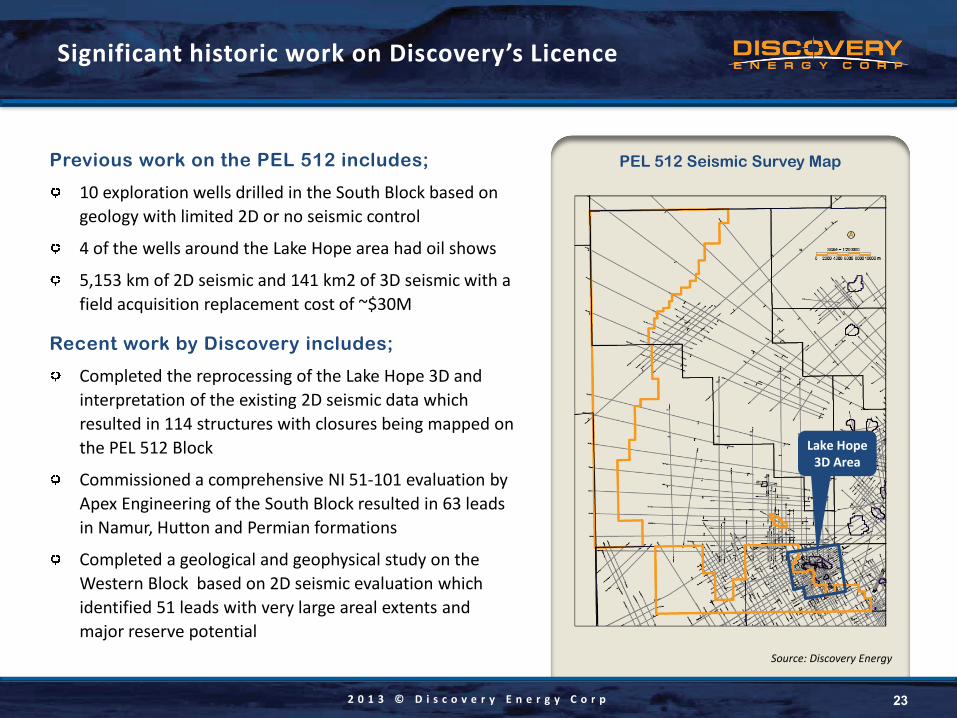
Significant historic work on Discovery’s Licence
Previous work on the PEL 512 includes;
10 exploration wells drilled in the South Block based on geology with limited 2D or no seismic control
4 of the wells around the Lake Hope area had oil shows
5,153 km of 2D seismic and 141 km2 of 3D seismic with a field acquisition replacement cost of ~$30M
Recent work by Discovery includes;
Completed the reprocessing of the Lake Hope 3D and interpretation of the existing 2D seismic data which resulted in 114 structures with closures being mapped on the PEL 512 Block
Commissioned a comprehensive NI 51-101 evaluation by Apex Engineering of the South Block resulted in 63 leads in Namur, Hutton and Permian formations
Completed a geological and geophysical study on the Western Block based on 2D seismic evaluation which identified 51 leads with very large areal extents and major reserve potential
Lake Hope 3D Area
PEL 512 Seismic Survey Map
Source: Discovery Energy
2 0 1 3 © D i s c o v e r y E n e r g y C o r p 24
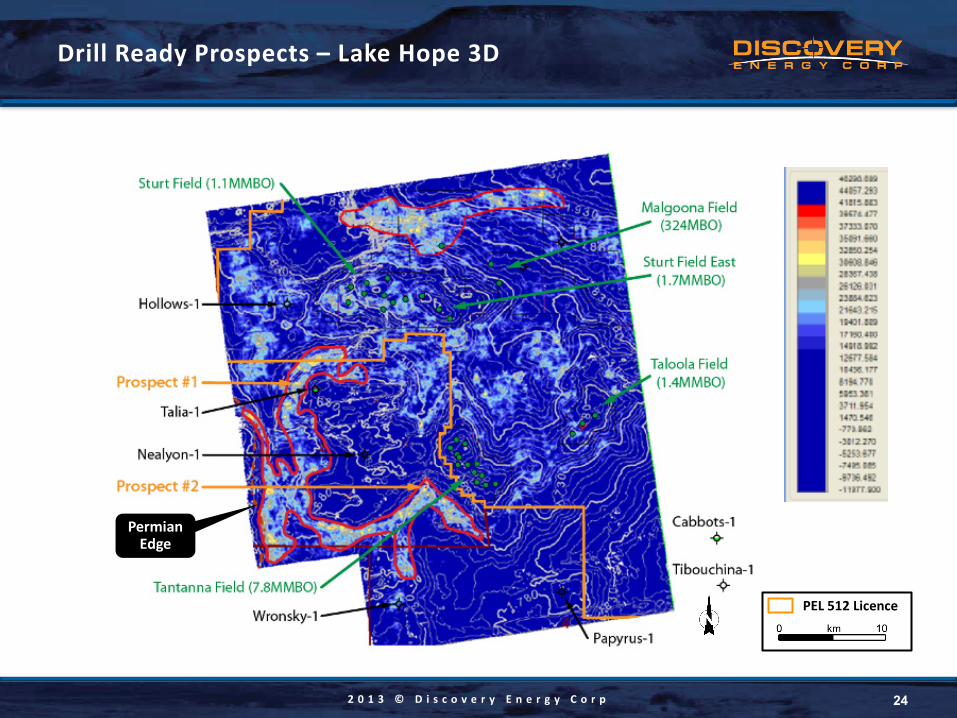
Drill Ready Prospects – Lake Hope 3D
PEL 512 Licence
Permian Edge
2 0 1 3 © D i s c o v e r y E n e r g y C o r p 25
Will Australia drive the next shale oil & gas boom?
Chevron Purses Australian Shale
BRISBANE, Australia, Feb. 25 (UPI) -- Energy giant Chevron is entering Australia's shale natural gas sector.
Under a deal announced Monday, Chevron will pay up to $349 million to farm into two shale prospects covering an estimated 810,000 acres in the Cooper Basin in central Australia controlled by Australia's Beach Energy.
The U.S. Energy Information Administration says the Cooper Basin could yield 85 trillion cubic feet of gas. Australia's current annual domestic gas usage stands at 1 trillion cubic feet of gas.
"The Cooper Basin is a huge potential resource," Reg Nelson, managing director of Adelaide's Beach Energy, was quoted as saying by the Financial Times. "This is ground breaking. This is nation building."
EIA estimates that Australia has the world's sixth biggest potential shale reserves.
While Chevron is one of the biggest foreign investors in
Australia, it previously focused on large conventional gas ventures such as its $53 billion Gorgon LNG development in Western Australia.
"We have an industry-leading queue of LNG projects under development in Australia and this agreement provides an opportunity to explore a new, prospective basin and potentially add to our natural gas portfolio," Chevron Australia Managing Director Roy Krzywosinski said of the Beach deal.
"The Cooper Basin is an established petroleum producing basin and provides the opportunity to leverage our expertise in tight gas."
Beach's Nelson said Chevron first approached his company in early 2012, Bloomberg reports.
Cooper Basin has produced conventional oil and gas since the 1960s. So far, Australian oil and gas company Santos has started producing shale from one well in the basin and is actively searching for more, the Financial Times said.
Source: UPI.com Energy News
2 0 1 3 © D i s c o v e r y E n e r g y C o r p
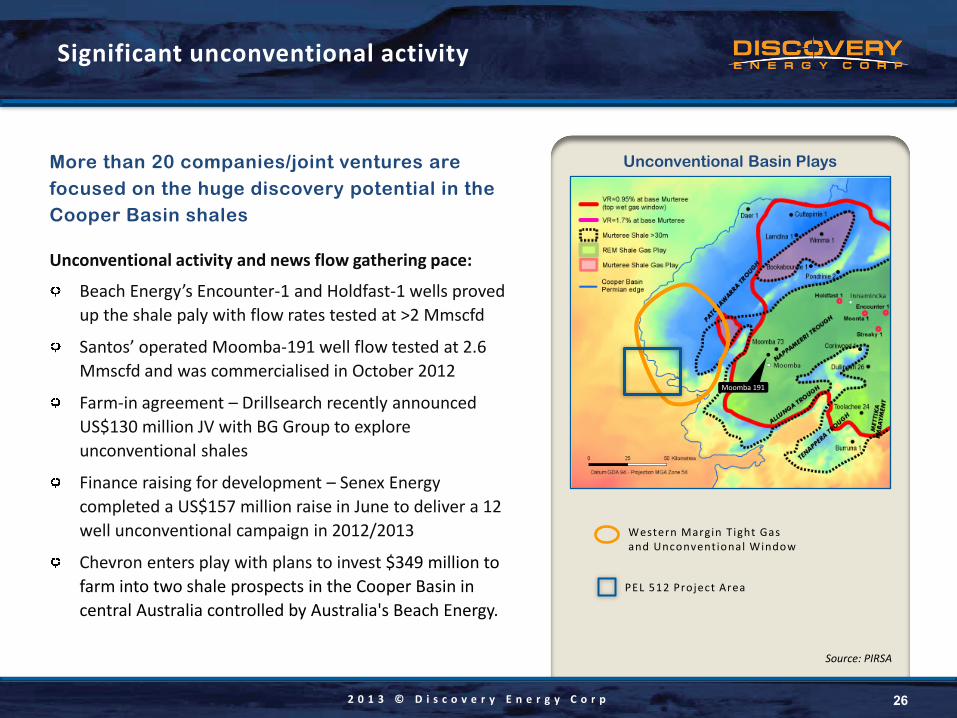
More than 20 companies/joint ventures are focused on the huge discovery potential in the Cooper Basin shales
Unconventional activity and news flow gathering pace:
Beach Energy’s Encounter-1 and Holdfast-1 wells proved up the shale paly with flow rates tested at >2 Mmscfd
Santos’ operated Moomba-191 well flow tested at 2.6 Mmscfd and was commercialised in October 2012
Farm-in agreement – Drillsearch recently announced US$130 million JV with BG Group to explore unconventional shales
Finance raising for development – Senex Energy completed a US$157 million raise in June to deliver a 12 well unconventional campaign in 2012/2013
Chevron enters play with plans to invest $349 million to farm into two shale prospects in the Cooper Basin in central Australia controlled by Australia's Beach Energy.
26
Significant unconventional activity
PEL 512 Project Area
Western Margin T ight Gas and Unconventional Window
Unconventional Basin Plays
Source: PIRSA
Moomba 191
2 0 1 3 © D i s c o v e r y E n e r g y C o r p
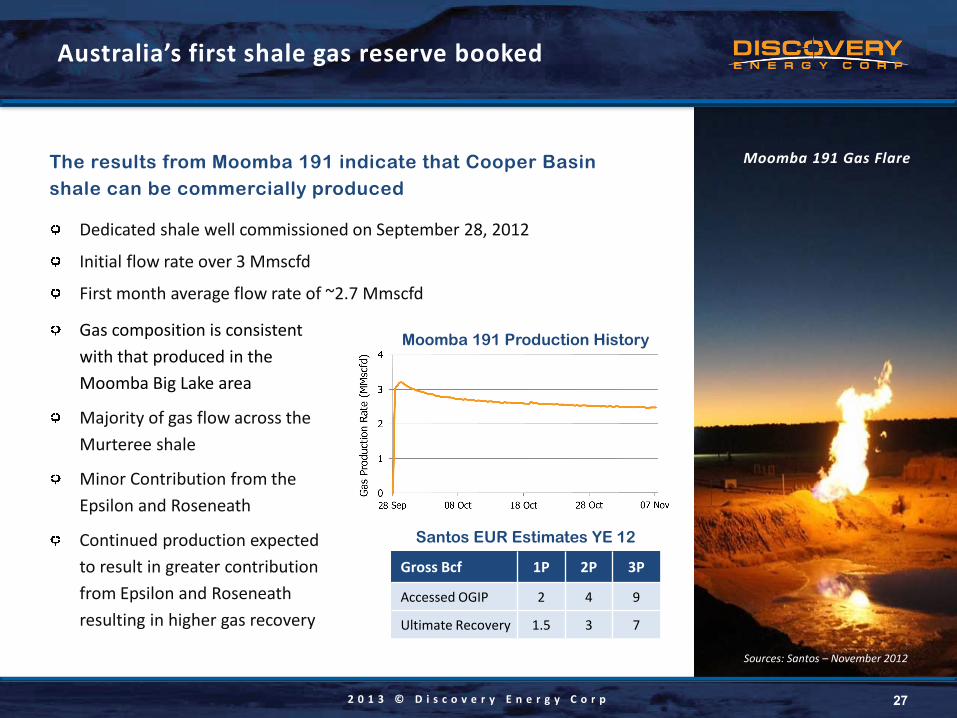
The results from Moomba 191 indicate that Cooper Basin shale can be commercially produced
Dedicated shale well commissioned on September 28, 2012
Initial flow rate over 3 Mmscfd
First month average flow rate of ~2.7 Mmscfd
27
Australia’s first shale gas reserve booked
Sources: Santos – November 2012
Moomba 191 Gas Flare
Gas composition is consistent with that produced in the Moomba Big Lake area
Majority of gas flow across the Murteree shale
Minor Contribution from the Epsilon and Roseneath
Continued production expected to result in greater contribution from Epsilon and Roseneath resulting in higher gas recovery
Gross Bcf 1P 2P 3P
Accessed OGIP 2 4 9
Ultimate Recovery 1.5 3 7
Moomba 191 Production History
Santos EUR Estimates YE 12
2 0 1 3 © D i s c o v e r y E n e r g y C o r p 28
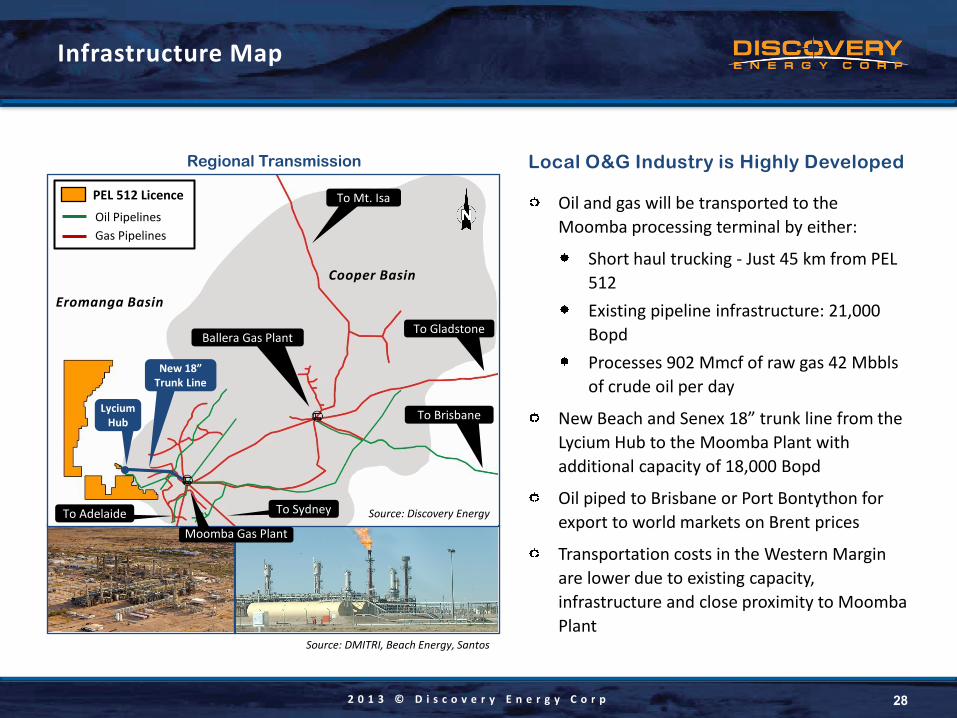
Infrastructure Map
Local O&G Industry is Highly Developed
Oil and gas will be transported to the Moomba processing terminal by either:
Short haul trucking - Just 45 km from PEL 512 Existing pipeline infrastructure: 21,000 Bopd Processes 902 Mmcf of raw gas 42 Mbbls of crude oil per day
New Beach and Senex 18” trunk line from the Lycium Hub to the Moomba Plant with additional capacity of 18,000 Bopd
Oil piped to Brisbane or Port Bontython for export to world markets on Brent prices
Transportation costs in the Western Margin are lower due to existing capacity, infrastructure and close proximity to Moomba Plant
Moomba Terminal
Pipeline to Port Bonython
Pipeline to Brisbane
PEL 512 Licence Oil Pipelines Gas Pipelines
To Gladstone
To Mt. Isa
To Sydney To Adelaide
Cooper Basin
To Brisbane Lycium Hub
New 18” Trunk Line
Regional Transmission
Source: Discovery Energy
Moomba Gas Plant
Source: DMITRI, Beach Energy, Santos
Ballera Gas Plant
Eromanga Basin
2 0 1 3 © D i s c o v e r y E n e r g y C o r p 29
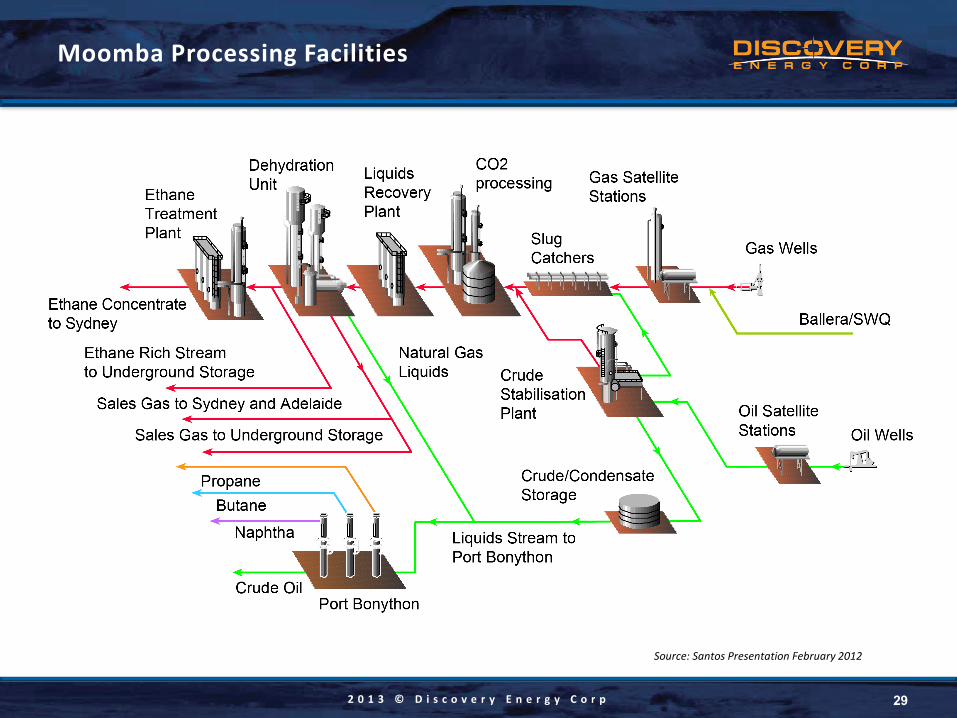
Moomba Processing Facilities
Source: Santos Presentation February 2012
2 0 1 3 © D i s c o v e r y E n e r g y C o r p
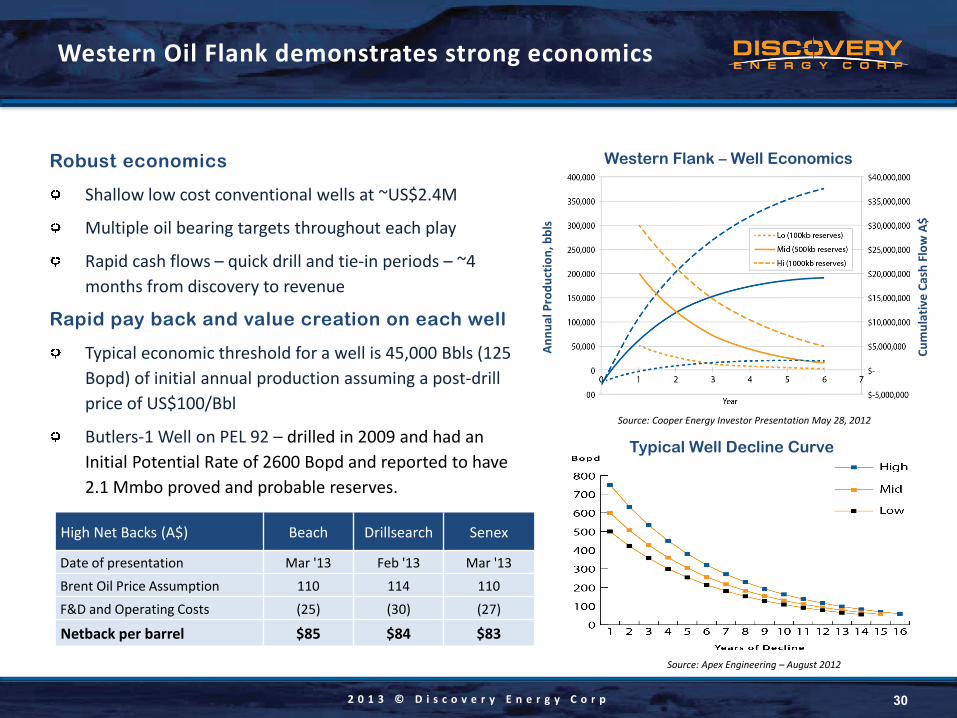
Robust economics
Shallow low cost conventional wells at ~US$2.4M
Multiple oil bearing targets throughout each play
Rapid cash flows – quick drill and tie-in periods – ~4 months from discovery to revenue
Rapid pay back and value creation on each well
Typical economic threshold for a well is 45,000 Bbls (125 Bopd) of initial annual production assuming a post-drill price of US$100/Bbl
Butlers-1 Well on PEL 92 – drilled in 2009 and had an Initial Potential Rate of 2600 Bopd and reported to have 2.1 Mmbo proved and probable reserves.
30
Western Oil Flank demonstrates strong economics
Source: Cooper Energy Investor Presentation May 28, 2012
Western Flank – Well Economics
Annu
al P
rodu
ctio
n, b
bls
Cum
ulat
ive
Cash
Flo
w A
$
Source: Apex Engineering – August 2012
Typical Well Decline Curve
High Net Backs (A$) Beach Drillsearch Senex
Date of presentation Mar '13 Feb '13 Mar '13 Brent Oil Price Assumption 110 114 110 F&D and Operating Costs (25) (30) (27)
Netback per barrel $85 $84 $83
2 0 1 3 © D i s c o v e r y E n e r g y C o r p 31
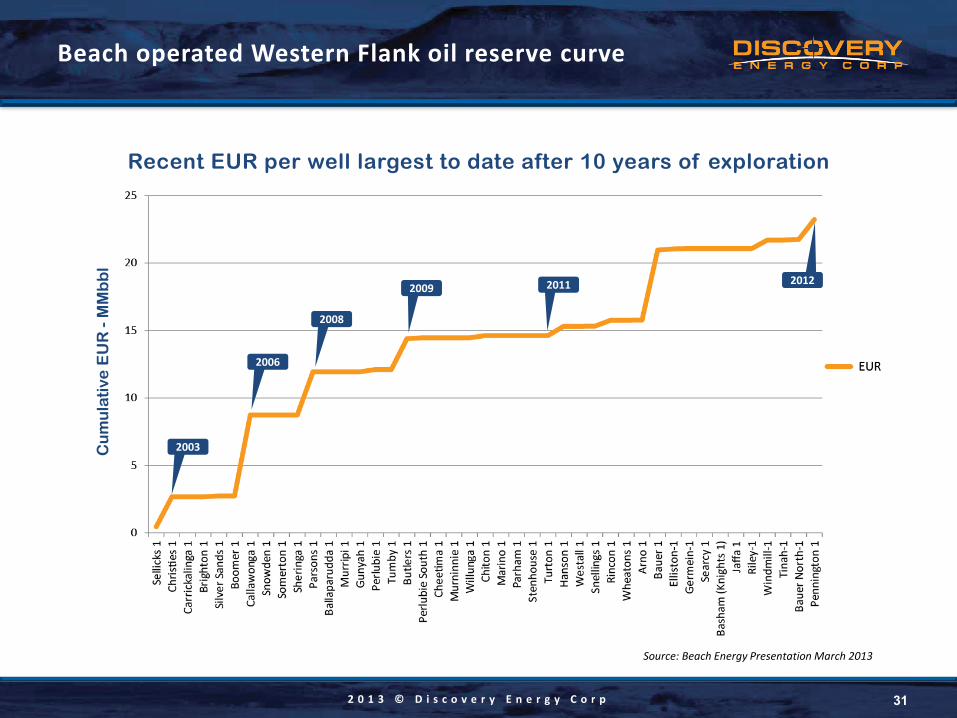
Beach operated Western Flank oil reserve curve
Source: Beach Energy Presentation March 2013
Cu
mu
lati
ve E
UR
- M
Mb
bl
Recent EUR per well largest to date after 10 years of exploration
2003
2006
2008
2009 2011 2012
2 0 1 3 © D i s c o v e r y E n e r g y C o r p 32
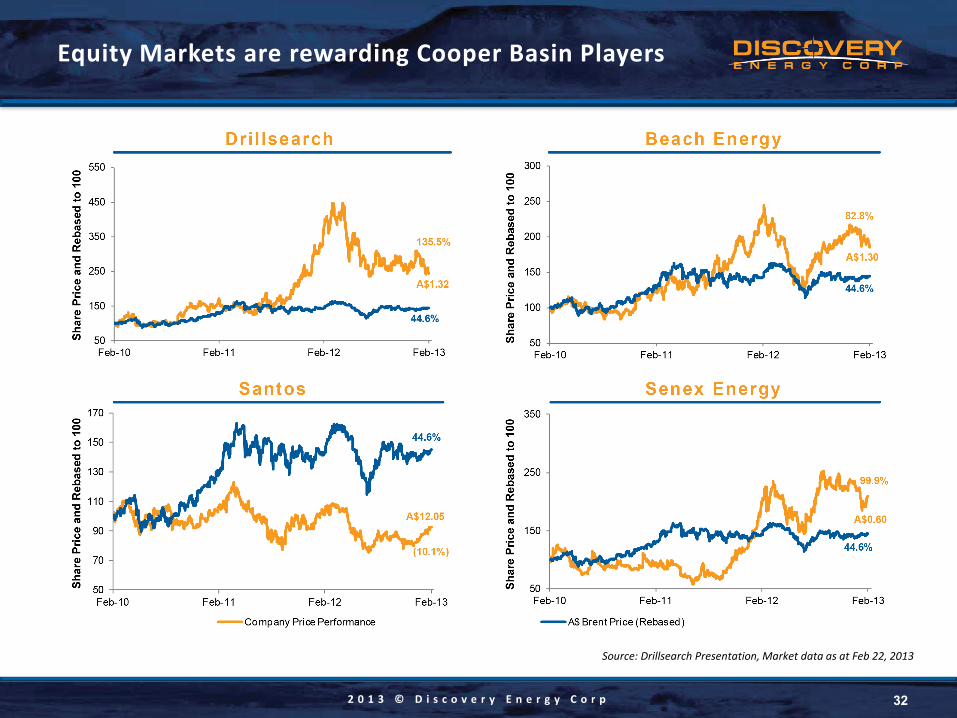
Equity Markets are rewarding Cooper Basin Players
Source: Drillsearch Presentation, Market data as at Feb 22, 2013
2 0 1 3 © D i s c o v e r y E n e r g y C o r p
Substantial exploration block in the most sought after area of Australia’s most prolific onshore producing basin
Potential for major discoveries from multiple play types; conventional & unconventional
Directly on trend with significant production
To the North: Beach Petroleum – 10,000+ Bopd net targeted by 2013
To the East: 5 producing fields have produced over 16 Mmbbls
Rapid path to oil production and cash flow with drilling prospects in inventory
Exceptional well economics and good oil flow rates
US$80+/Bbl netback and strong IRRs
Access to developed local industry infrastructure
Close proximity to the Moomba processing plant, the Lycium Hub and new 18,000 Bopd pipeline
Experienced management, operations and technical advisory teams with proven track record in the Cooper Basin
High level of interest from potential partners to joint venture/develop asset
33
Conclusion
2 0 1 3 © D i s c o v e r y E n e r g y C o r p 34
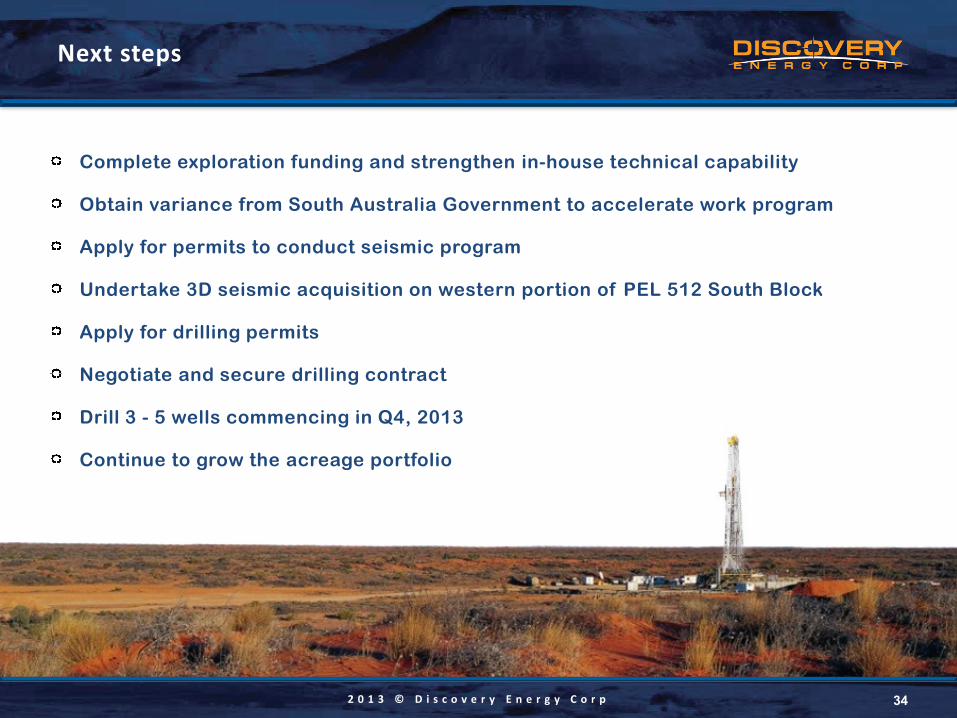
Next steps
Complete exploration funding and strengthen in-house technical capability
Obtain variance from South Australia Government to accelerate work program
Apply for permits to conduct seismic program
Undertake 3D seismic acquisition on western portion of PEL 512 South Block
Apply for drilling permits
Negotiate and secure drilling contract
Drill 3 - 5 wells commencing in Q4, 2013
Continue to grow the acreage portfolio
2 0 1 3 © D i s c o v e r y E n e r g y C o r p
O n e R i v e r w a y, S u i t e 1 7 0 0 H o u s t o n , T X 7 7 0 5 6
P : 7 1 3 . 8 4 0 . 6 4 9 5 F : 7 1 3 . 6 2 2 . 1 9 3 7
3 5 0 C o l l i n s S t r e e t , L e v e l 8 M e l b o u r n e 3 0 0 0 A u s t r a l i a
P : 6 1 . 3 . 8 6 0 1 . 1 1 3 1 F : 6 1 . 3 . 8 6 0 1 . 1 1 8 0
i n f o @ d i s c o v e r y e n e r g y . c o m
d i s c o v e r y e n e r g y . c o m
Contact Information
35
2 0 1 3 © D i s c o v e r y E n e r g y C o r p
The Recipient acknowledges and agrees that (i) the Information received from Discovery is provided to the Recipient for informational purposes only. Discovery bears no responsibility (and shall not be liable) for the accuracy or completeness (or lack thereof) of any information contained therein, (ii) no representation regarding the Information is made by Discovery, (iii) Discovery has not made any independent verification as to the accuracy or completeness of the Information, and (v) Discovery has no obligation to update or supplement any Information or otherwise provide additional information.
This presentation has been prepared to assist an interested party to make its own evaluation of Discovery and does not purport to be all inclusive or to contain all of the information that a prospective participant may consider material or desirable in making its decision to become an investor. Each Recipient of the Information should take such steps as it deems necessary to assure that it has the information it considers material or desirable in making its decision to become an investor and should perform its own independent investigation and analysis of the transactions contemplated thereby and the creditworthiness of Discovery.
Certain information respecting the Company and the Company’s projects constitutes forward-looking information. Such forward-looking information, included but not limited to statements with respect to anticipated rates of production, the estimated costs and timing of the Company’s planned work program and reserves determination involve known and unknown risks, uncertainties and other factors which may cause the actual costs and results of the Company and its operations to be materially different from estimated costs or results expressed or implied by such forward-looking statements. Such factors include, among others, risks related to operations, general risks associated with petroleum operations and risks associated with equipment procurement and equipment failure. Although the Company has attempted to take into account important factors that could cause costs of the Company’s program or results not to be as anticipated, estimated or intended. There can be no assurance that such statements will prove to be accurate as actual results and future events could differ materially from those anticipated in such statements. Accordingly, readers should not place undue reliance on forward-looking information.
This presentation does not constitute an offering of securities which can only be represented thru an offering memorandum and private placement subscription.
36
Disclaimer
2 0 1 3 © D i s c o v e r y E n e r g y C o r p
T r a d i n g S y m b o l : D E N R N A S D O T C B B
D i s c o v e r y e n e r g y . c o m