Embed Size (px)
Citation preview
1214 IEEE TRANSACTIONS ON MEDICAL IMAGING, VOL. 37, NO. 5, MAY 2018
Probe Oscillation Shear Wave Elastography:Initial In Vivo Results in Liver
Daniel C. Mellema , Student Member, IEEE, Pengfei Song, Member, IEEE, Randall R. Kinnick,Joshua D. Trzasko, Senior Member, IEEE, Matthew W. Urban, Senior Member, IEEE,
James F. Greenleaf, Life Fellow, IEEE, Armando Manduca, Member, IEEE,and Shigao Chen, Member, IEEE
Abstract— Shear wave elastography methods are able toaccurately measure tissue stiffness, allowing these tech-niques to monitor the progression of hepatic fibrosis. Whilemany methods rely on acoustic radiation force to generateshear waves for 2-D imaging, probe oscillation shear waveelastography (PROSE) provides an alternative approach bygenerating shear waves through continuous vibration ofthe ultrasound probe while simultaneously detecting theresulting motion. The generated shear wave field in in vivoliver is complicated, and the amplitude and quality of theseshear waves can be influenced by the placement of thevibrating probe. To address these challenges, a real-timeshear wave visualization tool was implemented to provideinstantaneousvisual feedback to optimize probe placement.Even with the real-time display, it was not possible tofully suppress residual motion with established filteringmethods. To solve this problem, the shear wave signal ineach frame was decoupled from motion and other sourcesthrough the use of a parameter-free empirical mode decom-position before calculating shear wave speeds. This methodwas evaluated in a phantom as well as in in vivo livers fromfive volunteers. PROSE results in the phantom as well asin vivo liver correlated well with independentmeasurementsusing the commercial General Electric Logiq E9 scanner.
Index Terms— High frame-rate, liver elastography,mechanical vibration, real-time imaging, ultrasoundelastography.
I. INTRODUCTION
MANY elastography techniques have been developed,which are capable of obtaining measurements in the
liver [1]–[8]. These methods utilize the shear wave propagation
Manuscript received October 30, 2017; accepted November 27, 2017.Date of publication December 7, 2017; date of current version May 1,2018. This work was supported by the National Institutes of Health (NIH)under Grant R01DK106957 and Grant R21AR069850. The content issolely the responsibility of the authors and does not necessarily representthe official views of the NIH. (Corresponding author: Shigao Chen.)
D. C. Mellema is with the Department of Radiology, Mayo ClinicGraduate School of Biomedical Sciences, Mayo Clinic, Rochester,MN 55905 USA (e-mail: [email protected]).
P. Song, J. D. Trzasko, M. W. Urban, and S. Chen are with theDepartment of Radiology, Mayo Clinic, Rochester, MN 55905 USA(e-mail: [email protected]).
R. R. Kinnick, J. F. Greenleaf, and A. Manduca are with the Departmentof Physiology and Biomedical Engineering, Mayo Clinic, Rochester,MN 55905 USA.
Color versions of one or more of the figures in this paper are availableonline at http://ieeexplore.ieee.org.
Digital Object Identifier 10.1109/TMI.2017.2780855
speed to quantitatively estimate the stiffness of soft tissue.Magnetic resonance elastography (MRE) was one of thefirst methods used for non-invasive measurements of hepaticstiffness [5]. In liver MRE, shear waves are delivered througha pneumatic driver placed on the abdomen, inducing wavepropagation throughout the entire liver. Current MRE acqui-sitions are capable of measuring shear wave motion in threeorthogonal directions for two-dimensional (2D) slices as wellas three-dimensional (3D) volumes. The ability to imagemotion in all directions has the added benefit of allowingthe use of the curl to decouple longitudinal waves from shearwaves [9]. MRE relies on continuous wave (CW) shear wavefields, therefore stiffness can be related to wavelength and esti-mated with local frequency estimation (LFE) [10] or from thefundamental wave equation used in direct inversion (DI) [11].With good shear wave coverage as well as the capabilitiesof detecting motion in three orthogonal directions, MRE iscapable of making accurate shear wave speed estimates forlarge field-of-view. While effective, MRE is expensive andhas limited availability.
Ultrasound elastography methods are an inexpensive alter-native to MRE. One of the first ultrasound methods capableof making hepatic stiffness measurements was TransientElastography (TE) [2]. This method uses a small single-element transducer to deliver a mechanical impulse to generatea transient longitudinally polarized shear wave, where the par-ticle motion is in the same direction as the wave propagation.The theoretical explanation of this longitudinally polarizedshear wave can be found in [12] and [13]. Propagation of theshear wave is detected by the same single-element transduceralong its beam axis, and the resulting one-dimensional (1D)motion profile can be utilized to determine a global shear wavespeed value through the use of a time-to-peak method [2].
More recently, ultrasound-based methods have utilizedacoustic radiation force (ARF) to generate propagating shearwaves with cylindrical or conic wave fronts conducive for2D imaging [1], [3], [7]. ARF-based elastography may usethe time-to-peak or time-of-flight method for shear wave speedestimations [1], [3], [4], [7], [14]–[16]. While very versatile,this technique is limited by ultrasound attenuation and shearwave attenuation. For example, the ultrasound push beamused to generate the shear wave has difficulty penetratingbeyond 7-8 cm. Even at shallower depths, the resulting shear
0278-0062 © 2017 IEEE. Personal use is permitted, but republication/redistribution requires IEEE permission.See http://www.ieee.org/publications_standards/publications/rights/index.html for more information.
MELLEMA et al.: PROSE: INITIAL IN VIVO RESULTS IN LIVER 1215
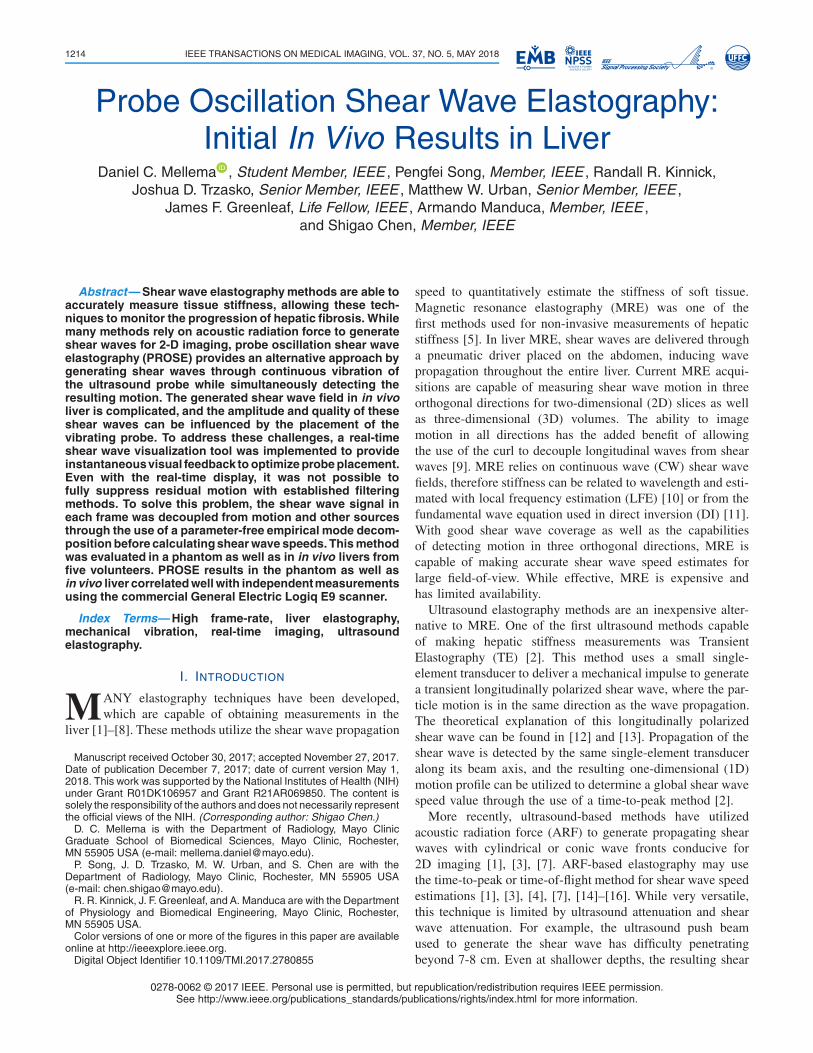
Fig. 1. a) A continuously moving probe causes different deformationsin the interrogated material at each time point. b) Pulse-echo ultrasounddetects relative motion between two pulse-echo events. If detections aremade when the probe is at separate physical locations (t1-t2), a resultingstrain-like probe motion artifact is observed (c, black line). Theoreticallyif detections are made when the probe has returned to the same location(b, t2-t3), it is possible to suppress the artifact (c, red line). d) However,line-profiles from in vivo liver images show that this symmetric detectionscheme does not fully decouple the shear waves (red line), requir-ing more advanced estimation methods to suppress residual motion(gray line).
wave rapidly attenuates, preventing the method from imaginga large 2D area. Another constraint is that scanners must beequipped with specialized hardware and power supplies togenerate the high intensity, long duration push pulses, andimaging frame-rates are typically limited to about 1 Hz toprevent tissue and probe thermal damage [17].
Probe Oscillation Shear Wave Elastography (PROSE) hasbeen developed to leverage the increased penetration andcoverage of mechanically generated shear waves with theability to continuously track the motion in 2D [18]. Thismethod generates longitudinally polarized shear waves in thetissue with a monochromatic mechanical vibration of theultrasound probe. Standard pulse-echo ultrasound detection isused to simultaneously track the resulting shear waves whilethe probe is in motion. Because ultrasound utilizes changesin individual scatterer’s position (relative to the ultrasoundtransducer) to track motion, the movement of the vibratingtransducer between subsequent detections leads to a depthdependent probe motion artifact. The artifact arises as a mate-rial compresses when the probe moves through the vibrationcycle, with scatterers near the probe moving less (relative tothe probe surface) than scatterers further from the probe. Thisresults in a non-linear strain-like artifact, causing a bias inshear wave speed estimates [18].
We have previously shown that the probe motion artifactcan be suppressed by symmetric sampling [18]. Symmetricsampling strategically selects the timing of detections whenthe probe returns to the same location, minimizing any differ-ence in the scatterer’s position due to material compression,and retaining the motion from the shear waves (Fig. 1a-c).
This method limits detections to single frames twice pervibration cycle, preventing shear wave speeds from beingestimated with time-to-peak or phase gradient methods [2],[15], [19]. However, the motion was generated with a singletone vibration source, allowing the use of LFE on a singleframe to estimate the shear wave speeds. In practice, it wasshown that PROSE was capable of creating shear wave fieldswith excellent coverage as well as estimating shear wavespeeds with a theoretical frame-rate an order of magnitudehigher than ARF-based methods [18].
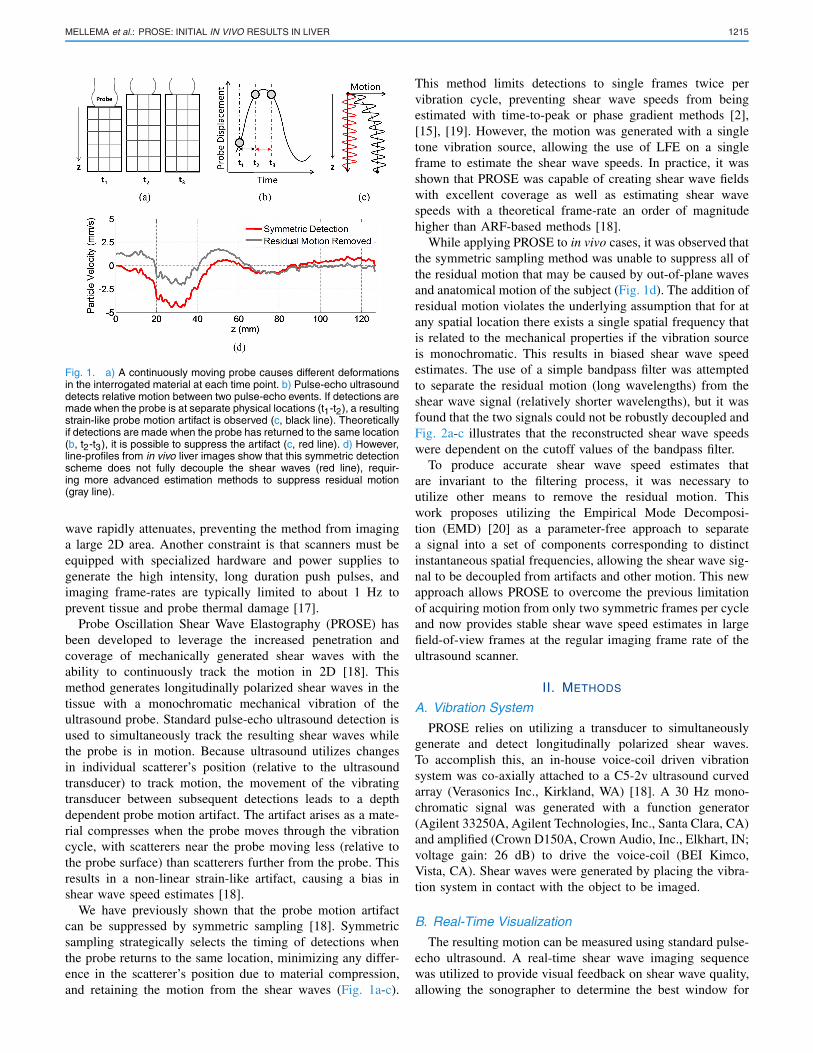
While applying PROSE to in vivo cases, it was observed thatthe symmetric sampling method was unable to suppress all ofthe residual motion that may be caused by out-of-plane wavesand anatomical motion of the subject (Fig. 1d). The addition ofresidual motion violates the underlying assumption that for atany spatial location there exists a single spatial frequency thatis related to the mechanical properties if the vibration sourceis monochromatic. This results in biased shear wave speedestimates. The use of a simple bandpass filter was attemptedto separate the residual motion (long wavelengths) from theshear wave signal (relatively shorter wavelengths), but it wasfound that the two signals could not be robustly decoupled andFig. 2a-c illustrates that the reconstructed shear wave speedswere dependent on the cutoff values of the bandpass filter.
To produce accurate shear wave speed estimates thatare invariant to the filtering process, it was necessary toutilize other means to remove the residual motion. Thiswork proposes utilizing the Empirical Mode Decomposi-tion (EMD) [20] as a parameter-free approach to separatea signal into a set of components corresponding to distinctinstantaneous spatial frequencies, allowing the shear wave sig-nal to be decoupled from artifacts and other motion. This newapproach allows PROSE to overcome the previous limitationof acquiring motion from only two symmetric frames per cycleand now provides stable shear wave speed estimates in largefield-of-view frames at the regular imaging frame rate of theultrasound scanner.
II. METHODS
A. Vibration System
PROSE relies on utilizing a transducer to simultaneouslygenerate and detect longitudinally polarized shear waves.To accomplish this, an in-house voice-coil driven vibrationsystem was co-axially attached to a C5-2v ultrasound curvedarray (Verasonics Inc., Kirkland, WA) [18]. A 30 Hz mono-chromatic signal was generated with a function generator(Agilent 33250A, Agilent Technologies, Inc., Santa Clara, CA)and amplified (Crown D150A, Crown Audio, Inc., Elkhart, IN;voltage gain: 26 dB) to drive the voice-coil (BEI Kimco,Vista, CA). Shear waves were generated by placing the vibra-tion system in contact with the object to be imaged.
B. Real-Time Visualization
The resulting motion can be measured using standard pulse-echo ultrasound. A real-time shear wave imaging sequencewas utilized to provide visual feedback on shear wave quality,allowing the sonographer to determine the best window for
1216 IEEE TRANSACTIONS ON MEDICAL IMAGING, VOL. 37, NO. 5, MAY 2018
Fig. 2. A test of bandpass frequency selection on shear wave speed reconstruction in liver of a healthy volunteer. A bandpass filter was applied toremove wavelengths corresponding to shear waves speeds outside a predetermined physiological range. The region-of-interest (ROI) was manuallydrawn to isolate areas with propagating shear waves. (a-c) Show the reconstructions using the symmetrical frame as the higher speeds (longerwavelengths) are added to the passband, resulting in the increased shear wave speed within the ROI.
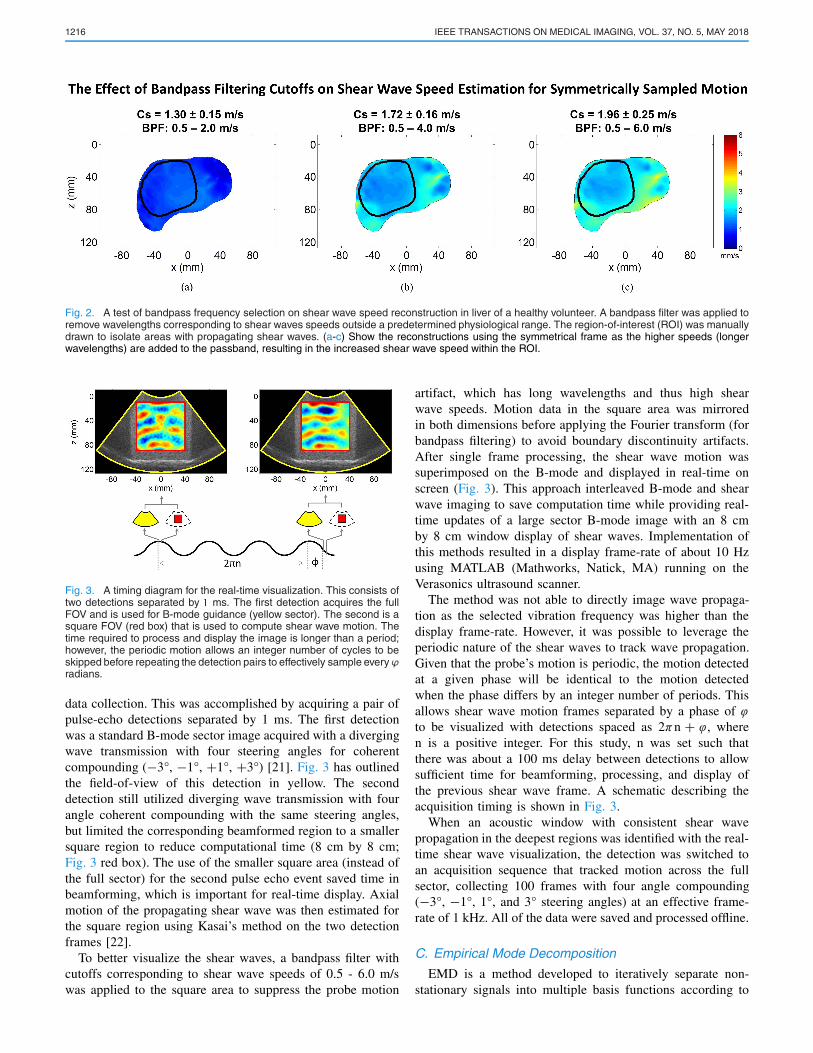
Fig. 3. A timing diagram for the real-time visualization. This consists oftwo detections separated by � ms. The first detection acquires the fullFOV and is used for B-mode guidance (yellow sector). The second is asquare FOV (red box) that is used to compute shear wave motion. Thetime required to process and display the image is longer than a period;however, the periodic motion allows an integer number of cycles to beskipped before repeating the detection pairs to effectively sample everyϕradians.
data collection. This was accomplished by acquiring a pair ofpulse-echo detections separated by 1 ms. The first detectionwas a standard B-mode sector image acquired with a divergingwave transmission with four steering angles for coherentcompounding (−3°, −1°, +1°, +3°) [21]. Fig. 3 has outlinedthe field-of-view of this detection in yellow. The seconddetection still utilized diverging wave transmission with fourangle coherent compounding with the same steering angles,but limited the corresponding beamformed region to a smallersquare region to reduce computational time (8 cm by 8 cm;Fig. 3 red box). The use of the smaller square area (instead ofthe full sector) for the second pulse echo event saved time inbeamforming, which is important for real-time display. Axialmotion of the propagating shear wave was then estimated forthe square region using Kasai’s method on the two detectionframes [22].
To better visualize the shear waves, a bandpass filter withcutoffs corresponding to shear wave speeds of 0.5 - 6.0 m/swas applied to the square area to suppress the probe motion
artifact, which has long wavelengths and thus high shearwave speeds. Motion data in the square area was mirroredin both dimensions before applying the Fourier transform (forbandpass filtering) to avoid boundary discontinuity artifacts.After single frame processing, the shear wave motion wassuperimposed on the B-mode and displayed in real-time onscreen (Fig. 3). This approach interleaved B-mode and shearwave imaging to save computation time while providing real-time updates of a large sector B-mode image with an 8 cmby 8 cm window display of shear waves. Implementation ofthis methods resulted in a display frame-rate of about 10 Hzusing MATLAB (Mathworks, Natick, MA) running on theVerasonics ultrasound scanner.
The method was not able to directly image wave propaga-tion as the selected vibration frequency was higher than thedisplay frame-rate. However, it was possible to leverage theperiodic nature of the shear waves to track wave propagation.Given that the probe’s motion is periodic, the motion detectedat a given phase will be identical to the motion detectedwhen the phase differs by an integer number of periods. Thisallows shear wave motion frames separated by a phase of ϕto be visualized with detections spaced as 2πn + ϕ, wheren is a positive integer. For this study, n was set such thatthere was about a 100 ms delay between detections to allowsufficient time for beamforming, processing, and display ofthe previous shear wave frame. A schematic describing theacquisition timing is shown in Fig. 3.
When an acoustic window with consistent shear wavepropagation in the deepest regions was identified with the real-time shear wave visualization, the detection was switched toan acquisition sequence that tracked motion across the fullsector, collecting 100 frames with four angle compounding(−3°, −1°, 1°, and 3° steering angles) at an effective frame-rate of 1 kHz. All of the data were saved and processed offline.
C. Empirical Mode Decomposition
EMD is a method developed to iteratively separate non-stationary signals into multiple basis functions according to
MELLEMA et al.: PROSE: INITIAL IN VIVO RESULTS IN LIVER 1217
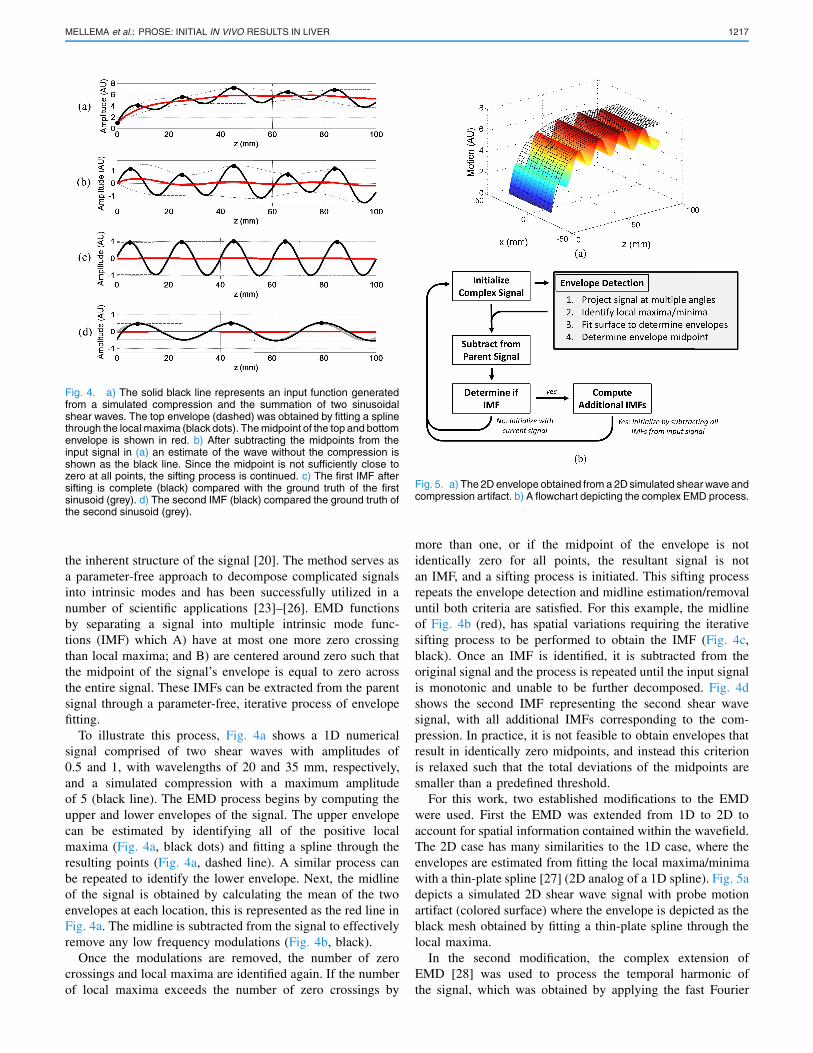
Fig. 4. a) The solid black line represents an input function generatedfrom a simulated compression and the summation of two sinusoidalshear waves. The top envelope (dashed) was obtained by fitting a splinethrough the local maxima (black dots). The midpoint of the top and bottomenvelope is shown in red. b) After subtracting the midpoints from theinput signal in (a) an estimate of the wave without the compression isshown as the black line. Since the midpoint is not sufficiently close tozero at all points, the sifting process is continued. c) The first IMF aftersifting is complete (black) compared with the ground truth of the firstsinusoid (grey). d) The second IMF (black) compared the ground truth ofthe second sinusoid (grey).
the inherent structure of the signal [20]. The method serves asa parameter-free approach to decompose complicated signalsinto intrinsic modes and has been successfully utilized in anumber of scientific applications [23]–[26]. EMD functionsby separating a signal into multiple intrinsic mode func-tions (IMF) which A) have at most one more zero crossingthan local maxima; and B) are centered around zero such thatthe midpoint of the signal’s envelope is equal to zero acrossthe entire signal. These IMFs can be extracted from the parentsignal through a parameter-free, iterative process of envelopefitting.
To illustrate this process, Fig. 4a shows a 1D numericalsignal comprised of two shear waves with amplitudes of0.5 and 1, with wavelengths of 20 and 35 mm, respectively,and a simulated compression with a maximum amplitudeof 5 (black line). The EMD process begins by computing theupper and lower envelopes of the signal. The upper envelopecan be estimated by identifying all of the positive localmaxima (Fig. 4a, black dots) and fitting a spline through theresulting points (Fig. 4a, dashed line). A similar process canbe repeated to identify the lower envelope. Next, the midlineof the signal is obtained by calculating the mean of the twoenvelopes at each location, this is represented as the red line inFig. 4a. The midline is subtracted from the signal to effectivelyremove any low frequency modulations (Fig. 4b, black).
Once the modulations are removed, the number of zerocrossings and local maxima are identified again. If the numberof local maxima exceeds the number of zero crossings by
Fig. 5. a) The 2D envelope obtained from a 2D simulated shear wave andcompression artifact. b) A flowchart depicting the complex EMD process.
more than one, or if the midpoint of the envelope is notidentically zero for all points, the resultant signal is notan IMF, and a sifting process is initiated. This sifting processrepeats the envelope detection and midline estimation/removaluntil both criteria are satisfied. For this example, the midlineof Fig. 4b (red), has spatial variations requiring the iterativesifting process to be performed to obtain the IMF (Fig. 4c,black). Once an IMF is identified, it is subtracted from theoriginal signal and the process is repeated until the input signalis monotonic and unable to be further decomposed. Fig. 4dshows the second IMF representing the second shear wavesignal, with all additional IMFs corresponding to the com-pression. In practice, it is not feasible to obtain envelopes thatresult in identically zero midpoints, and instead this criterionis relaxed such that the total deviations of the midpoints aresmaller than a predefined threshold.
For this work, two established modifications to the EMDwere used. First the EMD was extended from 1D to 2D toaccount for spatial information contained within the wavefield.The 2D case has many similarities to the 1D case, where theenvelopes are estimated from fitting the local maxima/minimawith a thin-plate spline [27] (2D analog of a 1D spline). Fig. 5adepicts a simulated 2D shear wave signal with probe motionartifact (colored surface) where the envelope is depicted as theblack mesh obtained by fitting a thin-plate spline through thelocal maxima.
In the second modification, the complex extension ofEMD [28] was used to process the temporal harmonic ofthe signal, which was obtained by applying the fast Fourier
1218 IEEE TRANSACTIONS ON MEDICAL IMAGING, VOL. 37, NO. 5, MAY 2018
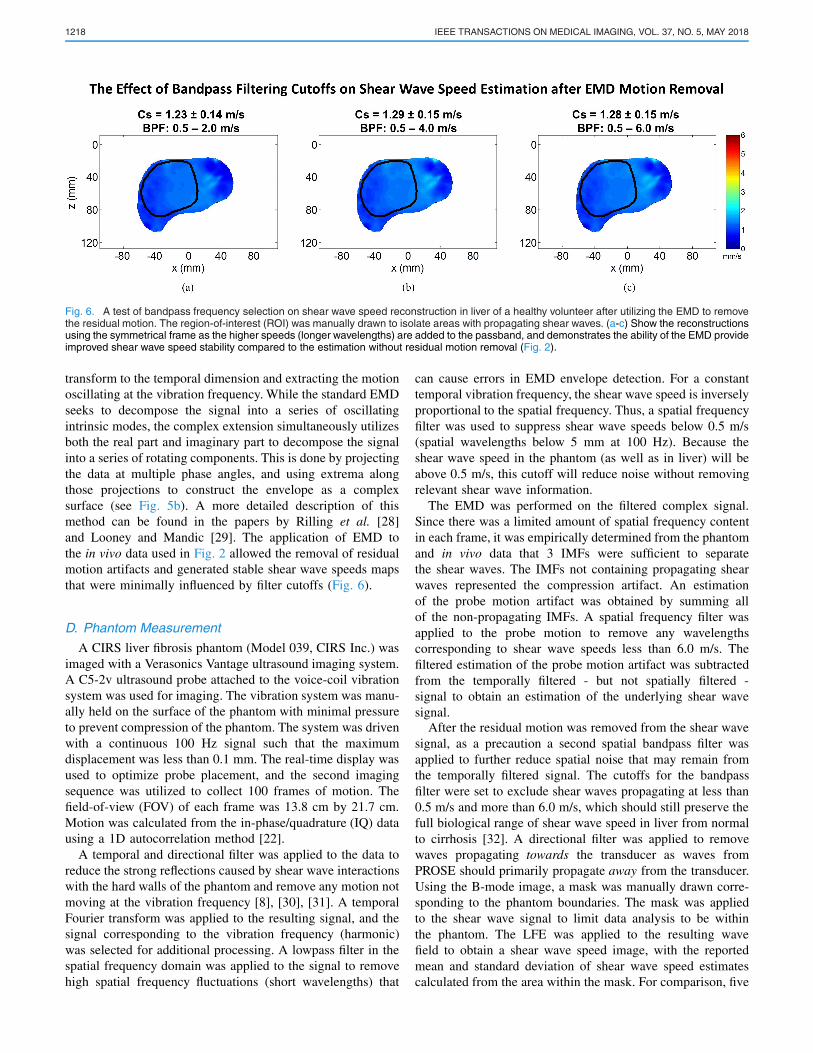
Fig. 6. A test of bandpass frequency selection on shear wave speed reconstruction in liver of a healthy volunteer after utilizing the EMD to removethe residual motion. The region-of-interest (ROI) was manually drawn to isolate areas with propagating shear waves. (a-c) Show the reconstructionsusing the symmetrical frame as the higher speeds (longer wavelengths) are added to the passband, and demonstrates the ability of the EMD provideimproved shear wave speed stability compared to the estimation without residual motion removal (Fig. 2).
transform to the temporal dimension and extracting the motionoscillating at the vibration frequency. While the standard EMDseeks to decompose the signal into a series of oscillatingintrinsic modes, the complex extension simultaneously utilizesboth the real part and imaginary part to decompose the signalinto a series of rotating components. This is done by projectingthe data at multiple phase angles, and using extrema alongthose projections to construct the envelope as a complexsurface (see Fig. 5b). A more detailed description of thismethod can be found in the papers by Rilling et al. [28]and Looney and Mandic [29]. The application of EMD tothe in vivo data used in Fig. 2 allowed the removal of residualmotion artifacts and generated stable shear wave speeds mapsthat were minimally influenced by filter cutoffs (Fig. 6).
D. Phantom Measurement
A CIRS liver fibrosis phantom (Model 039, CIRS Inc.) wasimaged with a Verasonics Vantage ultrasound imaging system.A C5-2v ultrasound probe attached to the voice-coil vibrationsystem was used for imaging. The vibration system was manu-ally held on the surface of the phantom with minimal pressureto prevent compression of the phantom. The system was drivenwith a continuous 100 Hz signal such that the maximumdisplacement was less than 0.1 mm. The real-time display wasused to optimize probe placement, and the second imagingsequence was utilized to collect 100 frames of motion. Thefield-of-view (FOV) of each frame was 13.8 cm by 21.7 cm.Motion was calculated from the in-phase/quadrature (IQ) datausing a 1D autocorrelation method [22].
A temporal and directional filter was applied to the data toreduce the strong reflections caused by shear wave interactionswith the hard walls of the phantom and remove any motion notmoving at the vibration frequency [8], [30], [31]. A temporalFourier transform was applied to the resulting signal, and thesignal corresponding to the vibration frequency (harmonic)was selected for additional processing. A lowpass filter in thespatial frequency domain was applied to the signal to removehigh spatial frequency fluctuations (short wavelengths) that
can cause errors in EMD envelope detection. For a constanttemporal vibration frequency, the shear wave speed is inverselyproportional to the spatial frequency. Thus, a spatial frequencyfilter was used to suppress shear wave speeds below 0.5 m/s(spatial wavelengths below 5 mm at 100 Hz). Because theshear wave speed in the phantom (as well as in liver) will beabove 0.5 m/s, this cutoff will reduce noise without removingrelevant shear wave information.
The EMD was performed on the filtered complex signal.Since there was a limited amount of spatial frequency contentin each frame, it was empirically determined from the phantomand in vivo data that 3 IMFs were sufficient to separatethe shear waves. The IMFs not containing propagating shearwaves represented the compression artifact. An estimationof the probe motion artifact was obtained by summing allof the non-propagating IMFs. A spatial frequency filter wasapplied to the probe motion to remove any wavelengthscorresponding to shear wave speeds less than 6.0 m/s. Thefiltered estimation of the probe motion artifact was subtractedfrom the temporally filtered - but not spatially filtered -signal to obtain an estimation of the underlying shear wavesignal.
After the residual motion was removed from the shear wavesignal, as a precaution a second spatial bandpass filter wasapplied to further reduce spatial noise that may remain fromthe temporally filtered signal. The cutoffs for the bandpassfilter were set to exclude shear waves propagating at less than0.5 m/s and more than 6.0 m/s, which should still preserve thefull biological range of shear wave speed in liver from normalto cirrhosis [32]. A directional filter was applied to removewaves propagating towards the transducer as waves fromPROSE should primarily propagate away from the transducer.Using the B-mode image, a mask was manually drawn corre-sponding to the phantom boundaries. The mask was appliedto the shear wave signal to limit data analysis to be withinthe phantom. The LFE was applied to the resulting wavefield to obtain a shear wave speed image, with the reportedmean and standard deviation of shear wave speed estimatescalculated from the area within the mask. For comparison, five
MELLEMA et al.: PROSE: INITIAL IN VIVO RESULTS IN LIVER 1219
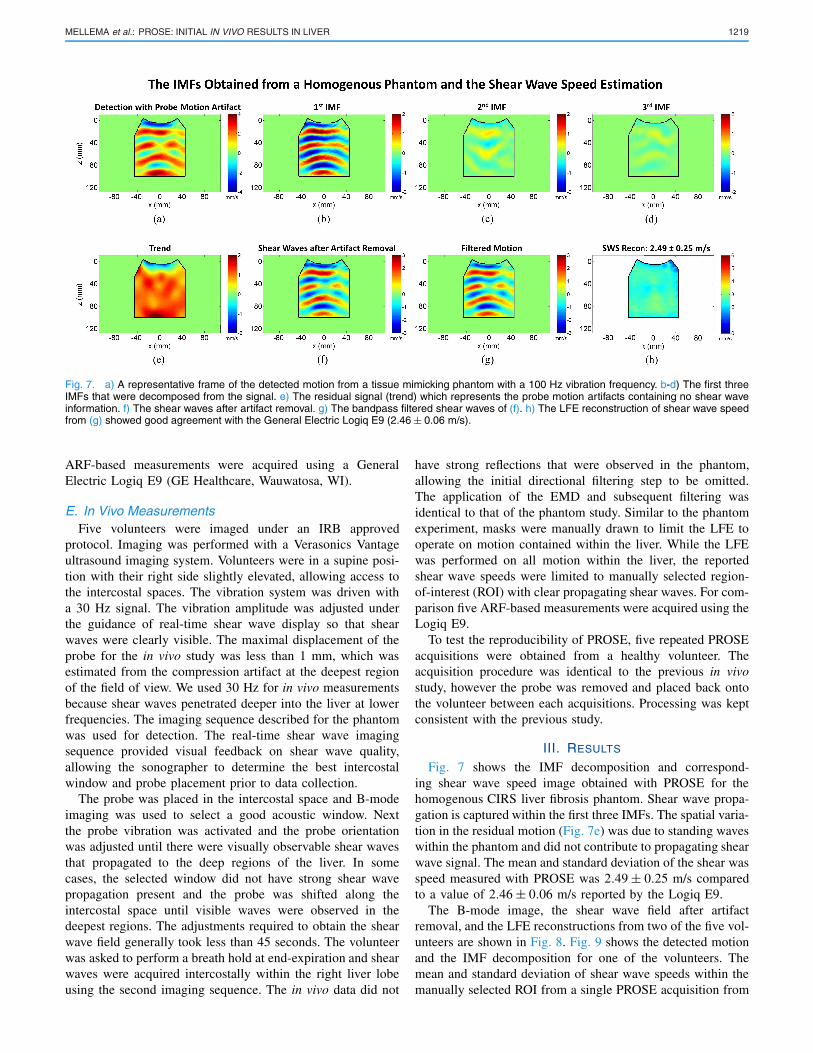
Fig. 7. a) A representative frame of the detected motion from a tissue mimicking phantom with a 100 Hz vibration frequency. b-d) The first threeIMFs that were decomposed from the signal. e) The residual signal (trend) which represents the probe motion artifacts containing no shear waveinformation. f) The shear waves after artifact removal. g) The bandpass filtered shear waves of (f). h) The LFE reconstruction of shear wave speedfrom (g) showed good agreement with the General Electric Logiq E9 (2.46 ± 0.06 m/s).
ARF-based measurements were acquired using a GeneralElectric Logiq E9 (GE Healthcare, Wauwatosa, WI).
E. In Vivo MeasurementsFive volunteers were imaged under an IRB approved
protocol. Imaging was performed with a Verasonics Vantageultrasound imaging system. Volunteers were in a supine posi-tion with their right side slightly elevated, allowing access tothe intercostal spaces. The vibration system was driven witha 30 Hz signal. The vibration amplitude was adjusted underthe guidance of real-time shear wave display so that shearwaves were clearly visible. The maximal displacement of theprobe for the in vivo study was less than 1 mm, which wasestimated from the compression artifact at the deepest regionof the field of view. We used 30 Hz for in vivo measurementsbecause shear waves penetrated deeper into the liver at lowerfrequencies. The imaging sequence described for the phantomwas used for detection. The real-time shear wave imagingsequence provided visual feedback on shear wave quality,allowing the sonographer to determine the best intercostalwindow and probe placement prior to data collection.
The probe was placed in the intercostal space and B-modeimaging was used to select a good acoustic window. Nextthe probe vibration was activated and the probe orientationwas adjusted until there were visually observable shear wavesthat propagated to the deep regions of the liver. In somecases, the selected window did not have strong shear wavepropagation present and the probe was shifted along theintercostal space until visible waves were observed in thedeepest regions. The adjustments required to obtain the shearwave field generally took less than 45 seconds. The volunteerwas asked to perform a breath hold at end-expiration and shearwaves were acquired intercostally within the right liver lobeusing the second imaging sequence. The in vivo data did not
have strong reflections that were observed in the phantom,allowing the initial directional filtering step to be omitted.The application of the EMD and subsequent filtering wasidentical to that of the phantom study. Similar to the phantomexperiment, masks were manually drawn to limit the LFE tooperate on motion contained within the liver. While the LFEwas performed on all motion within the liver, the reportedshear wave speeds were limited to manually selected region-of-interest (ROI) with clear propagating shear waves. For com-parison five ARF-based measurements were acquired using theLogiq E9.
To test the reproducibility of PROSE, five repeated PROSEacquisitions were obtained from a healthy volunteer. Theacquisition procedure was identical to the previous in vivostudy, however the probe was removed and placed back ontothe volunteer between each acquisitions. Processing was keptconsistent with the previous study.
III. RESULTS
Fig. 7 shows the IMF decomposition and correspond-ing shear wave speed image obtained with PROSE for thehomogenous CIRS liver fibrosis phantom. Shear wave propa-gation is captured within the first three IMFs. The spatial varia-tion in the residual motion (Fig. 7e) was due to standing waveswithin the phantom and did not contribute to propagating shearwave signal. The mean and standard deviation of the shear wasspeed measured with PROSE was 2.49 ± 0.25 m/s comparedto a value of 2.46 ± 0.06 m/s reported by the Logiq E9.
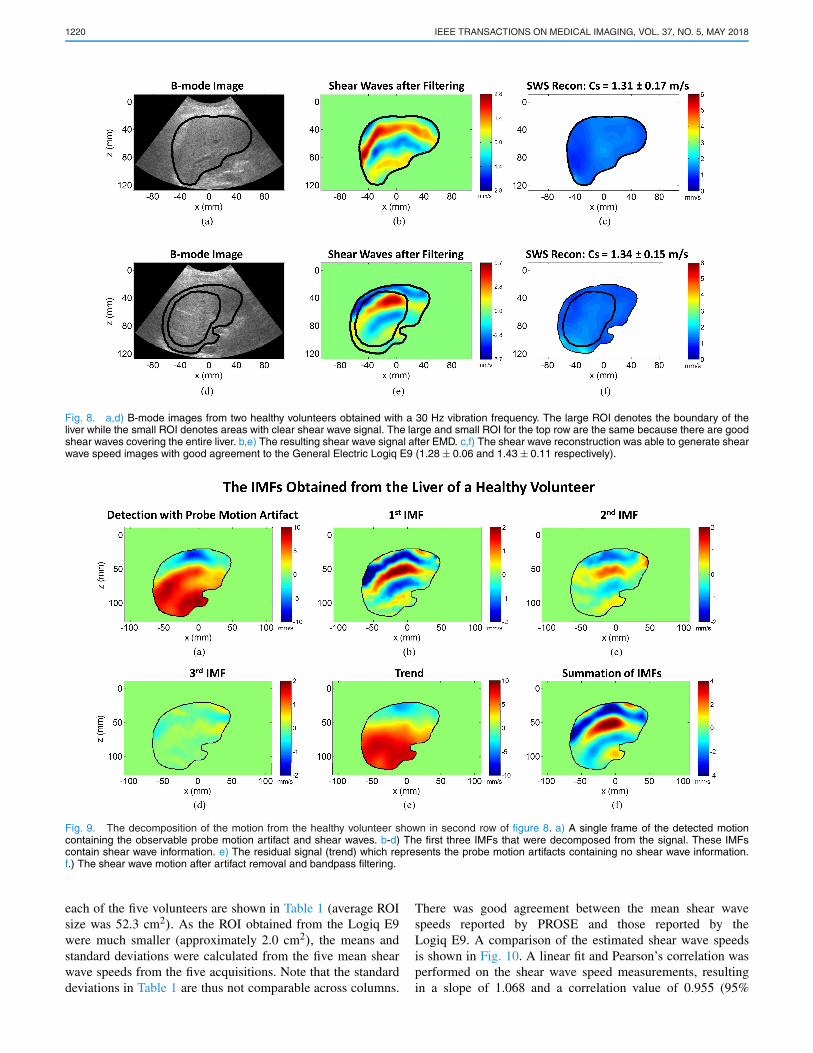
The B-mode image, the shear wave field after artifactremoval, and the LFE reconstructions from two of the five vol-unteers are shown in Fig. 8. Fig. 9 shows the detected motionand the IMF decomposition for one of the volunteers. Themean and standard deviation of shear wave speeds within themanually selected ROI from a single PROSE acquisition from
1220 IEEE TRANSACTIONS ON MEDICAL IMAGING, VOL. 37, NO. 5, MAY 2018
Fig. 8. a,d) B-mode images from two healthy volunteers obtained with a 30 Hz vibration frequency. The large ROI denotes the boundary of theliver while the small ROI denotes areas with clear shear wave signal. The large and small ROI for the top row are the same because there are goodshear waves covering the entire liver. b,e) The resulting shear wave signal after EMD. c,f) The shear wave reconstruction was able to generate shearwave speed images with good agreement to the General Electric Logiq E9 (1.28 ± 0.06 and 1.43 ± 0.11 respectively).
Fig. 9. The decomposition of the motion from the healthy volunteer shown in second row of figure 8. a) A single frame of the detected motioncontaining the observable probe motion artifact and shear waves. b-d) The first three IMFs that were decomposed from the signal. These IMFscontain shear wave information. e) The residual signal (trend) which represents the probe motion artifacts containing no shear wave information.f.) The shear wave motion after artifact removal and bandpass filtering.
each of the five volunteers are shown in Table 1 (average ROIsize was 52.3 cm2). As the ROI obtained from the Logiq E9were much smaller (approximately 2.0 cm2), the means andstandard deviations were calculated from the five mean shearwave speeds from the five acquisitions. Note that the standarddeviations in Table 1 are thus not comparable across columns.
There was good agreement between the mean shear wavespeeds reported by PROSE and those reported by theLogiq E9. A comparison of the estimated shear wave speedsis shown in Fig. 10. A linear fit and Pearson’s correlation wasperformed on the shear wave speed measurements, resultingin a slope of 1.068 and a correlation value of 0.955 (95%
MELLEMA et al.: PROSE: INITIAL IN VIVO RESULTS IN LIVER 1221
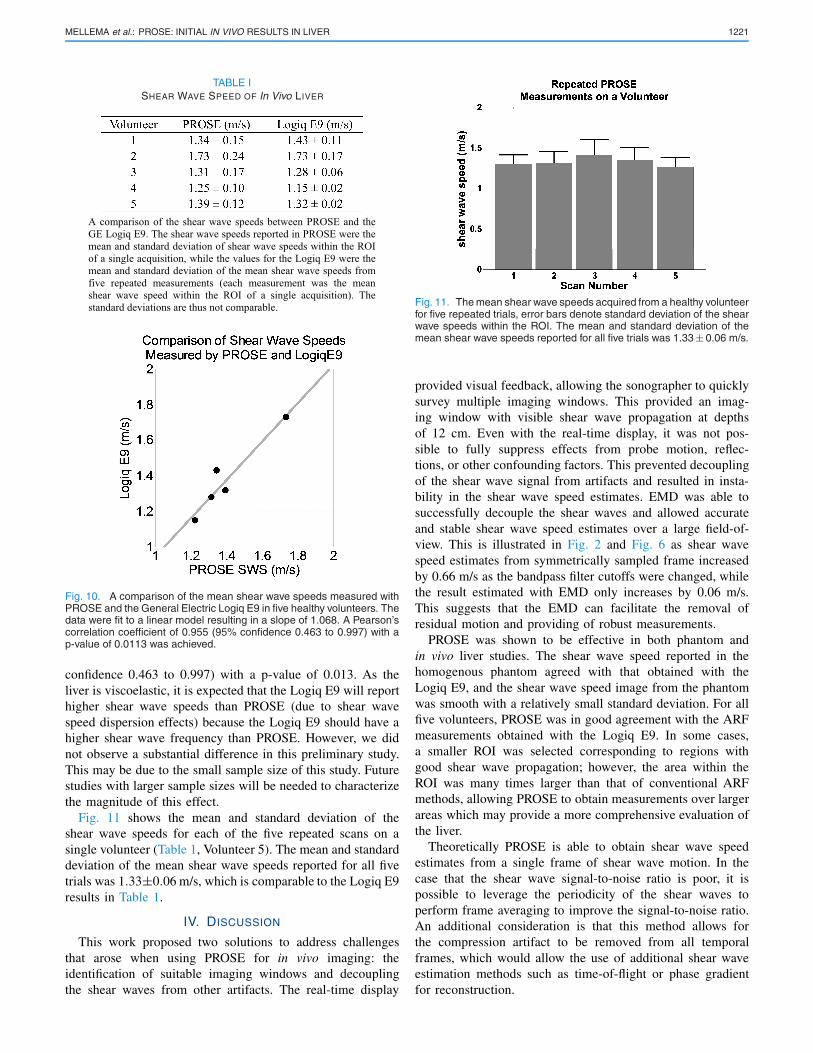
TABLE ISHEAR WAVE SPEED OF In Vivo LIVER
Fig. 10. A comparison of the mean shear wave speeds measured withPROSE and the General Electric Logiq E9 in five healthy volunteers. Thedata were fit to a linear model resulting in a slope of 1.068. A Pearson’scorrelation coefficient of 0.955 (95% confidence 0.463 to 0.997) with ap-value of 0.0113 was achieved.
confidence 0.463 to 0.997) with a p-value of 0.013. As theliver is viscoelastic, it is expected that the Logiq E9 will reporthigher shear wave speeds than PROSE (due to shear wavespeed dispersion effects) because the Logiq E9 should have ahigher shear wave frequency than PROSE. However, we didnot observe a substantial difference in this preliminary study.This may be due to the small sample size of this study. Futurestudies with larger sample sizes will be needed to characterizethe magnitude of this effect.
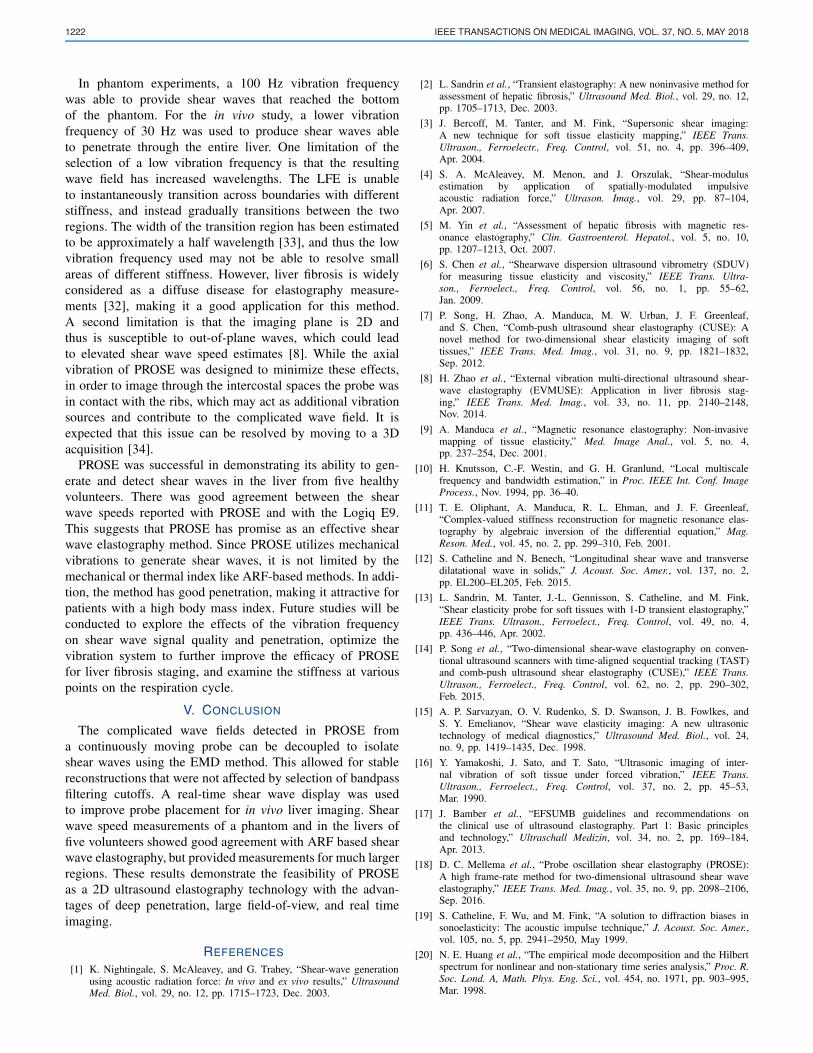
Fig. 11 shows the mean and standard deviation of theshear wave speeds for each of the five repeated scans on asingle volunteer (Table 1, Volunteer 5). The mean and standarddeviation of the mean shear wave speeds reported for all fivetrials was 1.33±0.06 m/s, which is comparable to the Logiq E9results in Table 1.
IV. DISCUSSION
This work proposed two solutions to address challengesthat arose when using PROSE for in vivo imaging: theidentification of suitable imaging windows and decouplingthe shear waves from other artifacts. The real-time display
Fig. 11. The mean shear wave speeds acquired from a healthy volunteerfor five repeated trials, error bars denote standard deviation of the shearwave speeds within the ROI. The mean and standard deviation of themean shear wave speeds reported for all five trials was 1.33 ± 0.06 m/s.
provided visual feedback, allowing the sonographer to quicklysurvey multiple imaging windows. This provided an imag-ing window with visible shear wave propagation at depthsof 12 cm. Even with the real-time display, it was not pos-sible to fully suppress effects from probe motion, reflec-tions, or other confounding factors. This prevented decouplingof the shear wave signal from artifacts and resulted in insta-bility in the shear wave speed estimates. EMD was able tosuccessfully decouple the shear waves and allowed accurateand stable shear wave speed estimates over a large field-of-view. This is illustrated in Fig. 2 and Fig. 6 as shear wavespeed estimates from symmetrically sampled frame increasedby 0.66 m/s as the bandpass filter cutoffs were changed, whilethe result estimated with EMD only increases by 0.06 m/s.This suggests that the EMD can facilitate the removal ofresidual motion and providing of robust measurements.
PROSE was shown to be effective in both phantom andin vivo liver studies. The shear wave speed reported in thehomogenous phantom agreed with that obtained with theLogiq E9, and the shear wave speed image from the phantomwas smooth with a relatively small standard deviation. For allfive volunteers, PROSE was in good agreement with the ARFmeasurements obtained with the Logiq E9. In some cases,a smaller ROI was selected corresponding to regions withgood shear wave propagation; however, the area within theROI was many times larger than that of conventional ARFmethods, allowing PROSE to obtain measurements over largerareas which may provide a more comprehensive evaluation ofthe liver.
Theoretically PROSE is able to obtain shear wave speedestimates from a single frame of shear wave motion. In thecase that the shear wave signal-to-noise ratio is poor, it ispossible to leverage the periodicity of the shear waves toperform frame averaging to improve the signal-to-noise ratio.An additional consideration is that this method allows forthe compression artifact to be removed from all temporalframes, which would allow the use of additional shear waveestimation methods such as time-of-flight or phase gradientfor reconstruction.
1222 IEEE TRANSACTIONS ON MEDICAL IMAGING, VOL. 37, NO. 5, MAY 2018
In phantom experiments, a 100 Hz vibration frequencywas able to provide shear waves that reached the bottomof the phantom. For the in vivo study, a lower vibrationfrequency of 30 Hz was used to produce shear waves ableto penetrate through the entire liver. One limitation of theselection of a low vibration frequency is that the resultingwave field has increased wavelengths. The LFE is unableto instantaneously transition across boundaries with differentstiffness, and instead gradually transitions between the tworegions. The width of the transition region has been estimatedto be approximately a half wavelength [33], and thus the lowvibration frequency used may not be able to resolve smallareas of different stiffness. However, liver fibrosis is widelyconsidered as a diffuse disease for elastography measure-ments [32], making it a good application for this method.A second limitation is that the imaging plane is 2D andthus is susceptible to out-of-plane waves, which could leadto elevated shear wave speed estimates [8]. While the axialvibration of PROSE was designed to minimize these effects,in order to image through the intercostal spaces the probe wasin contact with the ribs, which may act as additional vibrationsources and contribute to the complicated wave field. It isexpected that this issue can be resolved by moving to a 3Dacquisition [34].
PROSE was successful in demonstrating its ability to gen-erate and detect shear waves in the liver from five healthyvolunteers. There was good agreement between the shearwave speeds reported with PROSE and with the Logiq E9.This suggests that PROSE has promise as an effective shearwave elastography method. Since PROSE utilizes mechanicalvibrations to generate shear waves, it is not limited by themechanical or thermal index like ARF-based methods. In addi-tion, the method has good penetration, making it attractive forpatients with a high body mass index. Future studies will beconducted to explore the effects of the vibration frequencyon shear wave signal quality and penetration, optimize thevibration system to further improve the efficacy of PROSEfor liver fibrosis staging, and examine the stiffness at variouspoints on the respiration cycle.
V. CONCLUSION
The complicated wave fields detected in PROSE froma continuously moving probe can be decoupled to isolateshear waves using the EMD method. This allowed for stablereconstructions that were not affected by selection of bandpassfiltering cutoffs. A real-time shear wave display was usedto improve probe placement for in vivo liver imaging. Shearwave speed measurements of a phantom and in the livers offive volunteers showed good agreement with ARF based shearwave elastography, but provided measurements for much largerregions. These results demonstrate the feasibility of PROSEas a 2D ultrasound elastography technology with the advan-tages of deep penetration, large field-of-view, and real timeimaging.
REFERENCES
[1] K. Nightingale, S. McAleavey, and G. Trahey, “Shear-wave generationusing acoustic radiation force: In vivo and ex vivo results,” UltrasoundMed. Biol., vol. 29, no. 12, pp. 1715–1723, Dec. 2003.
[2] L. Sandrin et al., “Transient elastography: A new noninvasive method forassessment of hepatic fibrosis,” Ultrasound Med. Biol., vol. 29, no. 12,pp. 1705–1713, Dec. 2003.
[3] J. Bercoff, M. Tanter, and M. Fink, “Supersonic shear imaging:A new technique for soft tissue elasticity mapping,” IEEE Trans.Ultrason., Ferroelectr., Freq. Control, vol. 51, no. 4, pp. 396–409,Apr. 2004.
[4] S. A. McAleavey, M. Menon, and J. Orszulak, “Shear-modulusestimation by application of spatially-modulated impulsiveacoustic radiation force,” Ultrason. Imag., vol. 29, pp. 87–104,Apr. 2007.
[5] M. Yin et al., “Assessment of hepatic fibrosis with magnetic res-onance elastography,” Clin. Gastroenterol. Hepatol., vol. 5, no. 10,pp. 1207–1213, Oct. 2007.
[6] S. Chen et al., “Shearwave dispersion ultrasound vibrometry (SDUV)for measuring tissue elasticity and viscosity,” IEEE Trans. Ultra-son., Ferroelect., Freq. Control, vol. 56, no. 1, pp. 55–62,Jan. 2009.
[7] P. Song, H. Zhao, A. Manduca, M. W. Urban, J. F. Greenleaf,and S. Chen, “Comb-push ultrasound shear elastography (CUSE): Anovel method for two-dimensional shear elasticity imaging of softtissues,” IEEE Trans. Med. Imag., vol. 31, no. 9, pp. 1821–1832,Sep. 2012.
[8] H. Zhao et al., “External vibration multi-directional ultrasound shear-wave elastography (EVMUSE): Application in liver fibrosis stag-ing,” IEEE Trans. Med. Imag., vol. 33, no. 11, pp. 2140–2148,Nov. 2014.
[9] A. Manduca et al., “Magnetic resonance elastography: Non-invasivemapping of tissue elasticity,” Med. Image Anal., vol. 5, no. 4,pp. 237–254, Dec. 2001.
[10] H. Knutsson, C.-F. Westin, and G. H. Granlund, “Local multiscalefrequency and bandwidth estimation,” in Proc. IEEE Int. Conf. ImageProcess., Nov. 1994, pp. 36–40.
[11] T. E. Oliphant, A. Manduca, R. L. Ehman, and J. F. Greenleaf,“Complex-valued stiffness reconstruction for magnetic resonance elas-tography by algebraic inversion of the differential equation,” Mag.Reson. Med., vol. 45, no. 2, pp. 299–310, Feb. 2001.
[12] S. Catheline and N. Benech, “Longitudinal shear wave and transversedilatational wave in solids,” J. Acoust. Soc. Amer., vol. 137, no. 2,pp. EL200–EL205, Feb. 2015.
[13] L. Sandrin, M. Tanter, J.-L. Gennisson, S. Catheline, and M. Fink,“Shear elasticity probe for soft tissues with 1-D transient elastography,”IEEE Trans. Ultrason., Ferroelect., Freq. Control, vol. 49, no. 4,pp. 436–446, Apr. 2002.
[14] P. Song et al., “Two-dimensional shear-wave elastography on conven-tional ultrasound scanners with time-aligned sequential tracking (TAST)and comb-push ultrasound shear elastography (CUSE),” IEEE Trans.Ultrason., Ferroelect., Freq. Control, vol. 62, no. 2, pp. 290–302,Feb. 2015.
[15] A. P. Sarvazyan, O. V. Rudenko, S. D. Swanson, J. B. Fowlkes, andS. Y. Emelianov, “Shear wave elasticity imaging: A new ultrasonictechnology of medical diagnostics,” Ultrasound Med. Biol., vol. 24,no. 9, pp. 1419–1435, Dec. 1998.
[16] Y. Yamakoshi, J. Sato, and T. Sato, “Ultrasonic imaging of inter-nal vibration of soft tissue under forced vibration,” IEEE Trans.Ultrason., Ferroelect., Freq. Control, vol. 37, no. 2, pp. 45–53,Mar. 1990.
[17] J. Bamber et al., “EFSUMB guidelines and recommendations onthe clinical use of ultrasound elastography. Part 1: Basic principlesand technology,” Ultraschall Medizin, vol. 34, no. 2, pp. 169–184,Apr. 2013.
[18] D. C. Mellema et al., “Probe oscillation shear elastography (PROSE):A high frame-rate method for two-dimensional ultrasound shear waveelastography,” IEEE Trans. Med. Imag., vol. 35, no. 9, pp. 2098–2106,Sep. 2016.
[19] S. Catheline, F. Wu, and M. Fink, “A solution to diffraction biases insonoelasticity: The acoustic impulse technique,” J. Acoust. Soc. Amer.,vol. 105, no. 5, pp. 2941–2950, May 1999.
[20] N. E. Huang et al., “The empirical mode decomposition and the Hilbertspectrum for nonlinear and non-stationary time series analysis,” Proc. R.Soc. Lond. A, Math. Phys. Eng. Sci., vol. 454, no. 1971, pp. 903–995,Mar. 1998.
MELLEMA et al.: PROSE: INITIAL IN VIVO RESULTS IN LIVER 1223
[21] G. Montaldo, M. Tanter, J. Bercoff, N. Benech, and M. Fink, “Coherentplane-wave compounding for very high frame rate ultrasonography andtransient elastography,” IEEE Trans. Ultrason., Ferroelect., Freq. Con-trol, vol. 56, no. 3, pp. 489–506, Mar. 2009.
[22] C. Kasai, K. Namekawa, A. Koyano, and R. Omoto, “Real-timetwo-dimensional blood flow imaging using an autocorrelation tech-nique,” IEEE Trans. Sonics Ultrason., vol. SU-32, no. 3, pp. 458–464,May 1985.
[23] J. I. Salisbury and M. Wimbush, “Using modern time series analysistechniques to predict ENSO events from the SOI time series,” NonlinearProcess. Geophys., vol. 9, pp. 341–345, May/Jul. 2002.
[24] X. J. Wang, “Neurophysiological and computational principles of corti-cal rhythms in cognition,” Physiol. Rev., vol. 90, no. 3, pp. 1195–1268,Jul. 2010.
[25] Z. K. Peng, P. W. Tse, and F. L. Chu, “A comparison study of improvedHilbert–Huang transform and wavelet transform: Application to faultdiagnosis for rolling bearing,” Mech. Syst. Signal Process., vol. 19, no. 5,pp. 974–988, Sep. 2005.
[26] N. E. Huang, M. L. Wu, W. Qu, S. R. Long, and S. S. P. Shen,“Applications of Hilbert–Huang transform to non-stationary financialtime series analysis,” Appl. Stochastic Models Bus. Ind., vol. 19, no. 3,pp. 245–268, Jul./Sep. 2003.
[27] A. Linderhed, “Image compression based on empirical mode decompo-sition,” in Proc. SSAB Symp. Image Anal., 2004, pp. 110–113.
[28] G. Rilling, P. Flandrin, P. Gonçalves, and J. M. Lilly, “Bivariate empiricalmode decomposition,” IEEE Signal Process. Lett., vol. 14, no. 12,pp. 936–939, Dec. 2007.
[29] D. Looney and D. P. Mandic, “Multiscale image fusion using complexextensions of EMD,” IEEE Trans. Signal Process., vol. 57, no. 4,pp. 1626–1630, Apr. 2009.
[30] R. H. Bamberger and M. J. T. Smith, “A filter bank forthe directional decomposition of images: Theory and design,”IEEE Trans. Signal Process., vol. 40, no. 4, pp. 882–893,Apr. 1992.
[31] Y. M. Lu and M. N. Do, “Multidimensional directional filter banks andsurfacelets,” IEEE Trans. Image Process., vol. 16, no. 4, pp. 918–931,Apr. 2007.
[32] R. G. Barr et al., “Elastography assessment of liver fibrosis: Society ofradiologists in ultrasound consensus conference statement,” Radiology,vol. 276, no. 3, pp. 845–861, Sep. 2015.
[33] A. Manduca, R. Muthupillai, P. J. Rossman, J. F. Greenleaf, andR. L. Ehman, “Image processing for magnetic-resonance elastography,”Proc. SPIE, vol. 2710, pp. 616–623, Apr. 1996.
[34] M. Wang, B. Byram, M. Palmeri, N. Rouze, and K. Nightingale,“Imaging transverse isotropic properties of muscle by monitoringacoustic radiation force induced shear waves using a 2-D matrix ultra-sound array,” IEEE Trans. Med. Imag., vol. 32, no. 9, pp. 1671–1684,Sep. 2013.


![Ultrasound elastography in neuromuscular and movement ......acoustic radiation force imaging (ARFI), and transient elastography (TE) [33]. 2.1. Ultrasound strain elastography Ultrasound](https://img.pdfslide.net/doc/110x75/5f02150f7e708231d4027b6b/ultrasound-elastography-in-neuromuscular-and-movement-acoustic-radiation.jpg)