Embed Size (px)
Citation preview
Process Control
Measurements
Pressure, Flow, and Level
86005- 0
Order no.: 86005-10 First Edition Revision level: 10/2016
By the staff of Festo Didactic
© Festo Didactic Ltée/Ltd, Quebec, Canada 2010 Internet: www.festo-didactic.com e-mail: [email protected]
Printed in Canada All rights reserved ISBN 978-2-89640-329-5 (Printed version) ISBN 978-2-89747-822-3 (CD-ROM) Legal Deposit – Bibliothèque et Archives nationales du Québec, 2010 Legal Deposit – Library and Archives Canada, 2010
The purchaser shall receive a single right of use which is non-exclusive, non-time-limited and limited geographically to use at the purchaser's site/location as follows.
The purchaser shall be entitled to use the work to train his/her staff at the purchaser's site/location and shall also be entitled to use parts of the copyright material as the basis for the production of his/her own training documentation for the training of his/her staff at the purchaser's site/location with acknowledgement of source and to make copies for this purpose. In the case of schools/technical colleges, training centers, and universities, the right of use shall also include use by school and college students and trainees at the purchaser's site/location for teaching purposes.
The right of use shall in all cases exclude the right to publish the copyright material or to make this available for use on intranet, Internet and LMS platforms and databases such as Moodle, which allow access by a wide variety of users, including those outside of the purchaser's site/location.
Entitlement to other rights relating to reproductions, copies, adaptations, translations, microfilming and transfer to and storage and processing in electronic systems, no matter whether in whole or in part, shall require the prior consent of Festo Didactic GmbH & Co. KG.
Information in this document is subject to change without notice and does not represent a commitment on the part of Festo Didactic. The Festo materials described in this document are furnished under a license agreement or a nondisclosure agreement.
Festo Didactic recognizes product names as trademarks or registered trademarks of their respective holders.
All other trademarks are the property of their respective owners. Other trademarks and trade names may be used in this document to refer to either the entity claiming the marks and names or their products. Festo Didactic disclaims any proprietary interest in trademarks and trade names other than its own.
© Festo Didactic 86005-10 III
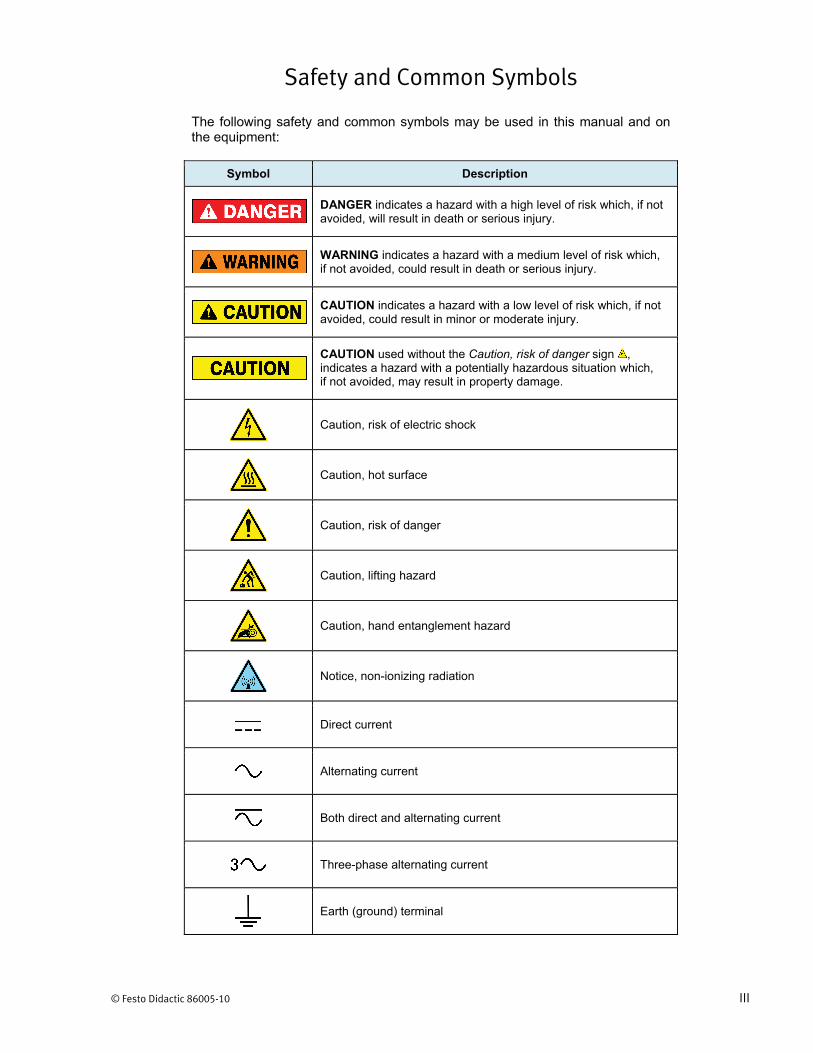
Safety and Common Symbols
The following safety and common symbols may be used in this manual and on the equipment:
Symbol Description
DANGER indicates a hazard with a high level of risk which, if not avoided, will result in death or serious injury.
WARNING indicates a hazard with a medium level of risk which, if not avoided, could result in death or serious injury.
CAUTION indicates a hazard with a low level of risk which, if not avoided, could result in minor or moderate injury.
CAUTION used without the Caution, risk of danger sign , indicates a hazard with a potentially hazardous situation which, if not avoided, may result in property damage.
Caution, risk of electric shock
Caution, hot surface
Caution, risk of danger
Caution, lifting hazard
Caution, hand entanglement hazard
Notice, non-ionizing radiation
Direct current
Alternating current
Both direct and alternating current
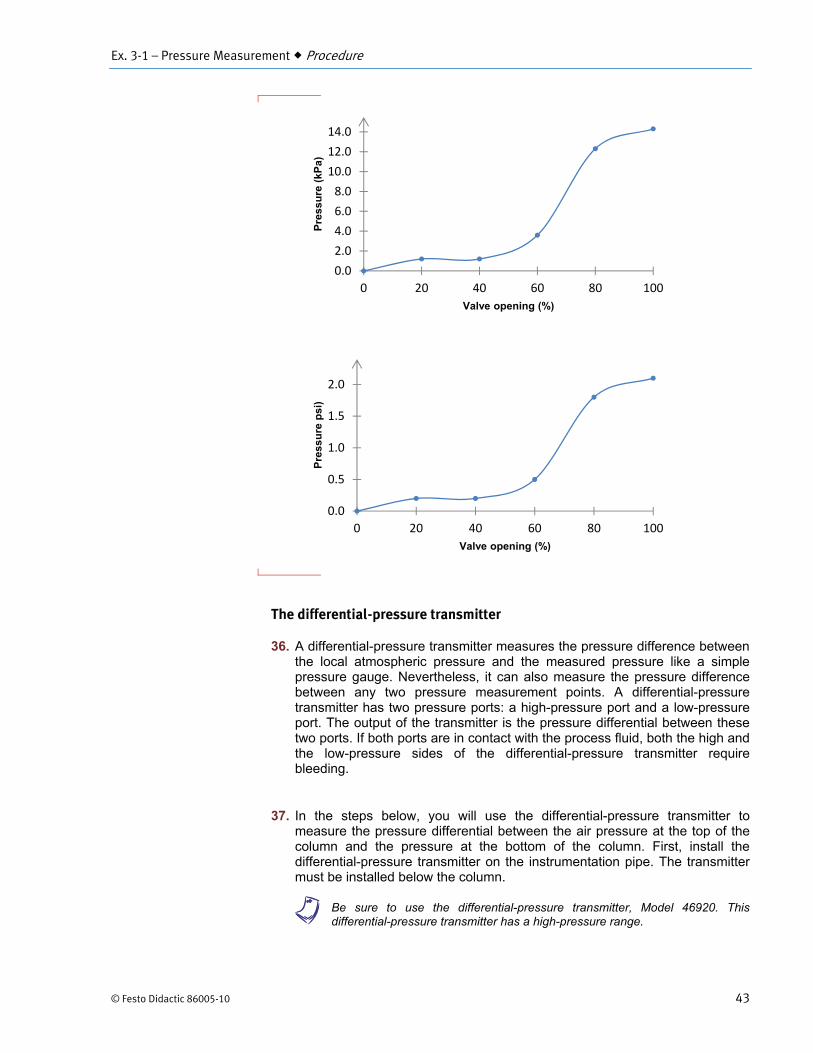
Three-phase alternating current
Earth (ground) terminal
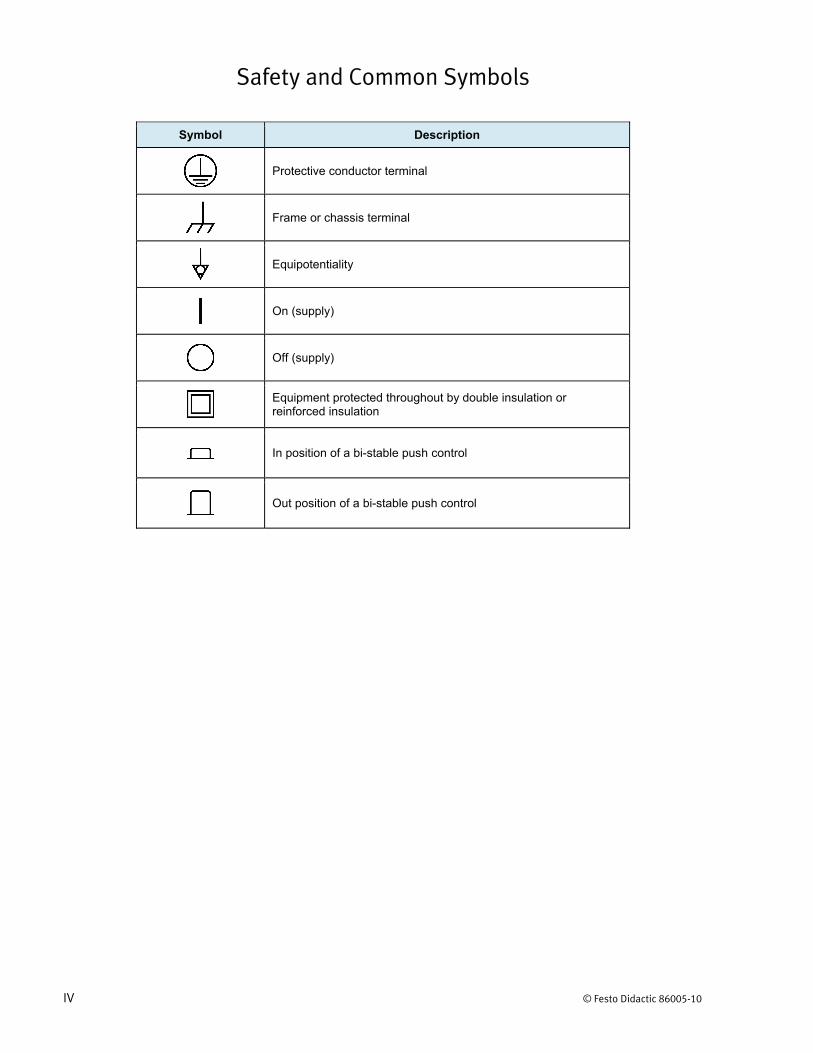
Safety and Common Symbols
IV © Festo Didactic 86005-10
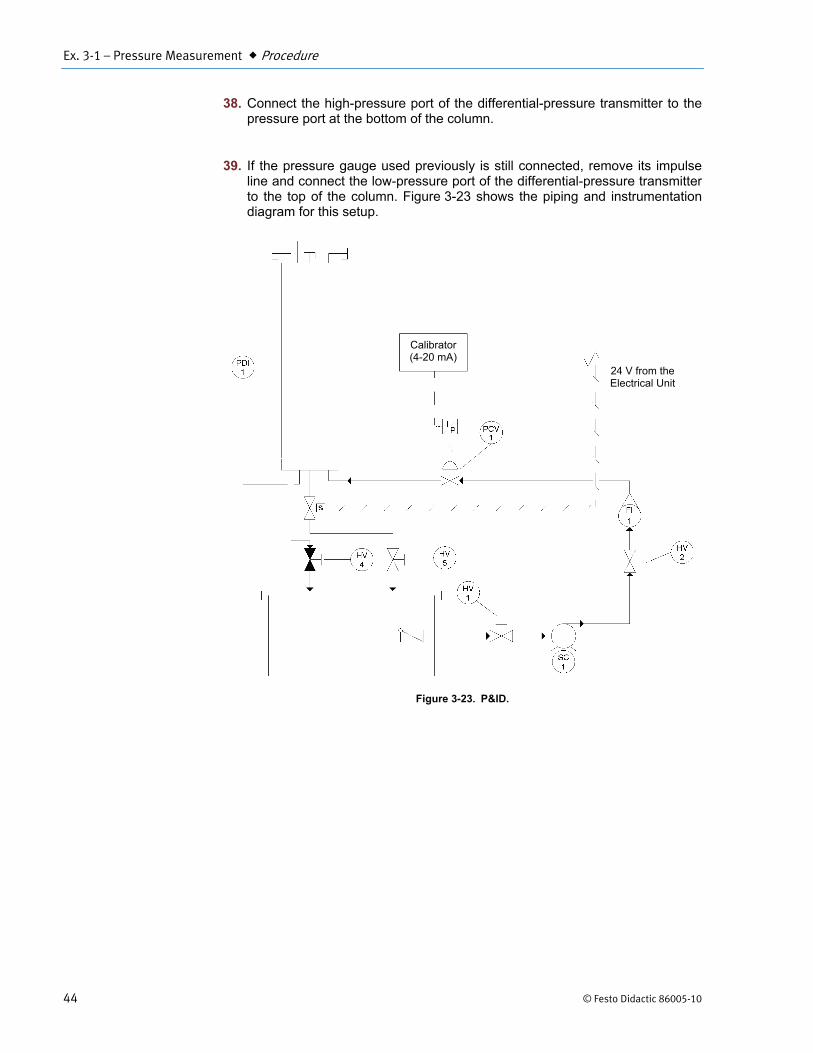
Symbol Description
Protective conductor terminal
Frame or chassis terminal
Equipotentiality
On (supply)
Off (supply)
Equipment protected throughout by double insulation or reinforced insulation
In position of a bi-stable push control
Out position of a bi-stable push control
© Festo Didactic 86005-10 V
Table of Contents
Preface .................................................................................................................. XI
To the Instructor .................................................................................................. XV
Unit 1 Introduction to Measurement ....................................................... 3
DISCUSSION OF FUNDAMENTALS ......................................................... 3Measurement ............................................................................ 3
What is measurement? ................................................................ 3Observable variable ..................................................................... 3Measuring instrument .................................................................. 4
Units .......................................................................................... 4Pressure, flow, and level measurement units .............................. 4
Dimensions and units ................................................................ 5
Unit 2 Measuring Instruments ................................................................. 9
DISCUSSION OF FUNDAMENTALS ......................................................... 9General Characteristics............................................................. 9
Range .......................................................................................... 9Span ............................................................................................ 9Rangeability ................................................................................. 9Sensitivity .................................................................................. 10
Errors ...................................................................................... 10Accuracy of the instrument ..................................................... 11
Precision .................................................................................... 11Accuracy .................................................................................... 11A good measuring instrument .................................................... 11Expressing the maximum error of an instrument ....................... 12
Dynamic characteristics of an instrument ............................... 13
Unit 3 Pressure Measurement ............................................................... 19
DISCUSSION OF FUNDAMENTALS ....................................................... 19What is a fluid? ........................................................................ 19The continuum hypothesis ...................................................... 20What are the main characteristics of fluids? ........................... 20
Density ....................................................................................... 20Specific gravity .......................................................................... 21Dynamic viscosity ...................................................................... 21Vapor pressure .......................................................................... 21Compressibility .......................................................................... 21
Hydrostatic pressure ............................................................... 22Pascal’s Law ........................................................................... 23Pressure measurement ........................................................... 23
Units of measurement of pressure ............................................. 23Pressure head ........................................................................... 24
Table of Contents
VI © Festo Didactic 86005-10
Types of pressure measurements .......................................... 24Absolute pressure ...................................................................... 24Gauge pressure ......................................................................... 25Differential pressure ................................................................... 25
Classic pressure measurement devices ................................. 25U-tube manometers ................................................................... 26Bourdon-tube pressure gauges .................................................. 27
Ex. 3-1 Pressure Measurement ............................................................... 29
DISCUSSION .................................................................................... 29Strain-gauge pressure sensing devices .................................. 29Pressure in a water system ..................................................... 30How to install a pressure-sensing device to measure a pressure .................................................................................. 31What is bleeding? .................................................................... 31
PROCEDURE .................................................................................... 33Setup and connections ............................................................ 33Bleeding the pressure gauge .................................................. 37Measuring pressure with a pressure gauge ............................ 37Measuring the air pressure in a pressurized column .............. 39The differential-pressure transmitter ....................................... 43Bleeding a differential-pressure transmitter ............................ 45Measuring differential pressure using a differential-pressure transmitter ................................................................ 46
Ex. 3-2 Pressure Loss .............................................................................. 51
DISCUSSION .................................................................................... 51Pressure loss .......................................................................... 51
Major losses ............................................................................... 52Minor losses ............................................................................... 52
PROCEDURE .................................................................................... 53Setup and connections ............................................................ 53Pressure loss .......................................................................... 57
Unit 4 Flow Measurement ...................................................................... 67
DISCUSSION OF FUNDAMENTALS ....................................................... 67Types of pressure ................................................................... 67Bernoulli equation ................................................................... 68
Bernoulli equation applications .................................................. 69Laminar and turbulent flows .................................................... 71Reynolds number .................................................................... 72
EXAMPLE .................................................................................. 73Solution ...................................................................................... 73
Table of Contents
© Festo Didactic 86005-10 VII
Ex. 4-1 Flowmeters ................................................................................... 75
DISCUSSION .................................................................................... 75Rotameters .............................................................................. 75
How do rotameter tubes work? .................................................. 75Correct installation of rotameters ............................................... 76Advantages and limitations of rotameters .................................. 76
Venturi tubes ........................................................................... 77How do Venturi tubes work? ...................................................... 78Permanent pressure loss ........................................................... 79Correct installation of Venturi tubes ........................................... 80Advantages and limitations of Venturi tubes .............................. 80
Three-valve manifold ............................................................... 80How to connect a differential-pressure transmitter to a flowmeter ................................................................................... 81How to disconnect a differential-pressure transmitter from a flowmeter ................................................................................... 82
PROCEDURE .................................................................................... 83Setup and connections............................................................ 83Permanent pressure loss across the Venturi tube .................. 86Pressure differential between the high and low pressure taps of the Venturi tube ........................................................... 89Measuring flow rates using a Venturi tube .............................. 94
Ex. 4-2 Centrifugal Pumps ....................................................................... 97
DISCUSSION .................................................................................... 97Pumps ..................................................................................... 97Basic operation of a liquid pump ............................................. 98Types of liquid pumps ............................................................. 98The centrifugal pump .............................................................. 99
Velocity head ........................................................................... 100Performance chart ................................................................... 101Cavitation ................................................................................. 103NPSHR and NPSHA ................................................................ 105
PROCEDURE .................................................................................. 107Setup and connections.......................................................... 107Pressure versus flow ............................................................. 110
Unit 5 Level Measurement ................................................................... 123
DISCUSSION OF FUNDAMENTALS ..................................................... 123Level measurement ............................................................... 123
Table of Contents
VIII © Festo Didactic 86005-10
Ex. 5-1 Differential Pressure Level Meters ........................................... 125
DISCUSSION .................................................................................. 125Level measurement using hydrostatic pressure ................... 125
Measuring the level in an open vessel ..................................... 126Range with an elevated or suppressed zero ............................ 128Suppressed-zero range ........................................................... 128Elevated-zero range ................................................................. 130Advantages and limitations ...................................................... 131
PROCEDURE .................................................................................. 131Setup and connections .......................................................... 131Using the level measurement mode of the differential-pressure transmitter. ............................................................. 138Suppressed-zero range and elevated-zero range ................ 140
Ex. 5-2 Bubblers ..................................................................................... 145
DISCUSSION .................................................................................. 145Bubblers ................................................................................ 145
How to measure liquid level using a bubbler ............................ 146Advantages and limitations ...................................................... 146
PROCEDURE .................................................................................. 147Setup and connections .......................................................... 147Using the level measurement mode of the differential-pressure transmitter. ............................................................. 154
Ex. 5-3 Wet Reference Leg .................................................................... 157
DISCUSSION .................................................................................. 157Measuring level in a closed tank ........................................... 157Dry reference leg ................................................................... 158
Measurement errors ................................................................. 159Wet reference leg .................................................................. 160
Measurement errors ................................................................. 160
PROCEDURE .................................................................................. 160Setup and connections .......................................................... 160
Appendix A Conversion Table ....................................................................... 173
Appendix B List of Variables ......................................................................... 175
Appendix C Simplifying Equations for US Customary Units ..................... 177
Table of Contents
© Festo Didactic 86005-10 IX
Appendix D Selecting a Sensing Element .................................................... 179
Index .................................................................................................................. 181
Bibliography ....................................................................................................... 183

© Festo Didactic 86005-10 XI
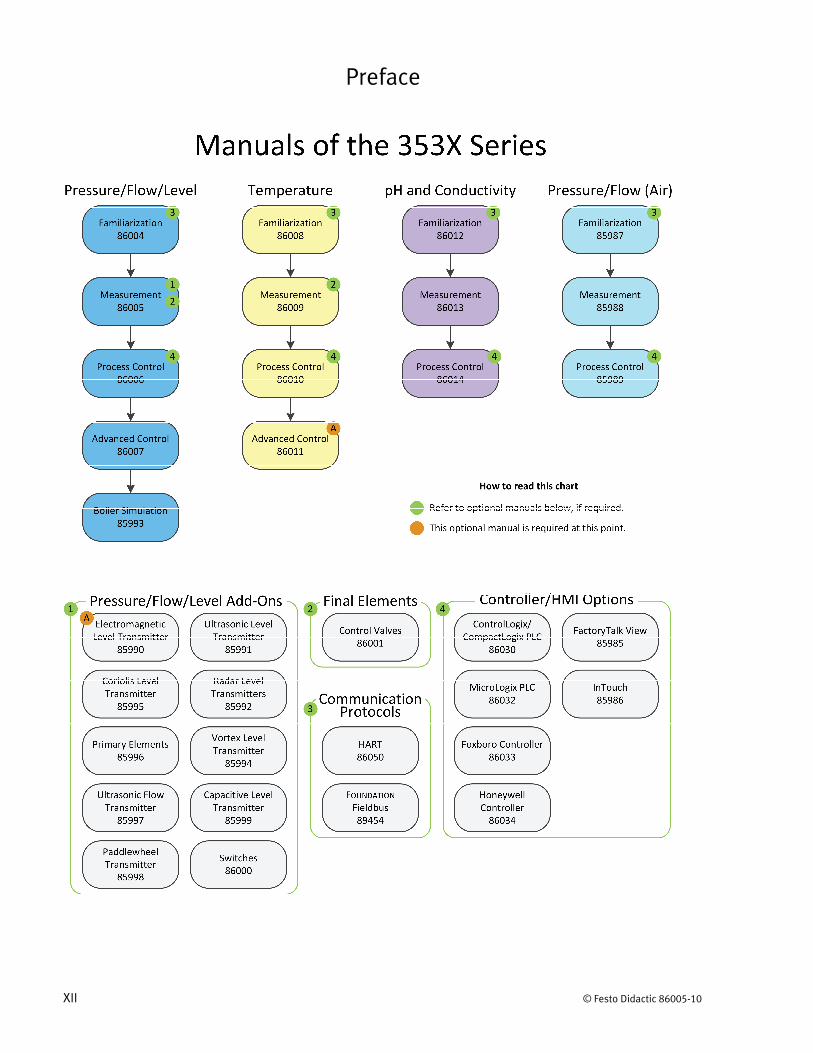
Preface
Automated process control offers so many advantages over manual control that the majority of today’s industrial processes use it to some extent. Breweries, wastewater treatment plants, mining facilities, and the automotive industry are just a few industries that benefit from automated process control systems.
Maintaining process variables such as pressure, flow, level, temperature, and pH within a desired operating range is of the utmost importance when manufacturing products with a predictable composition and quality.
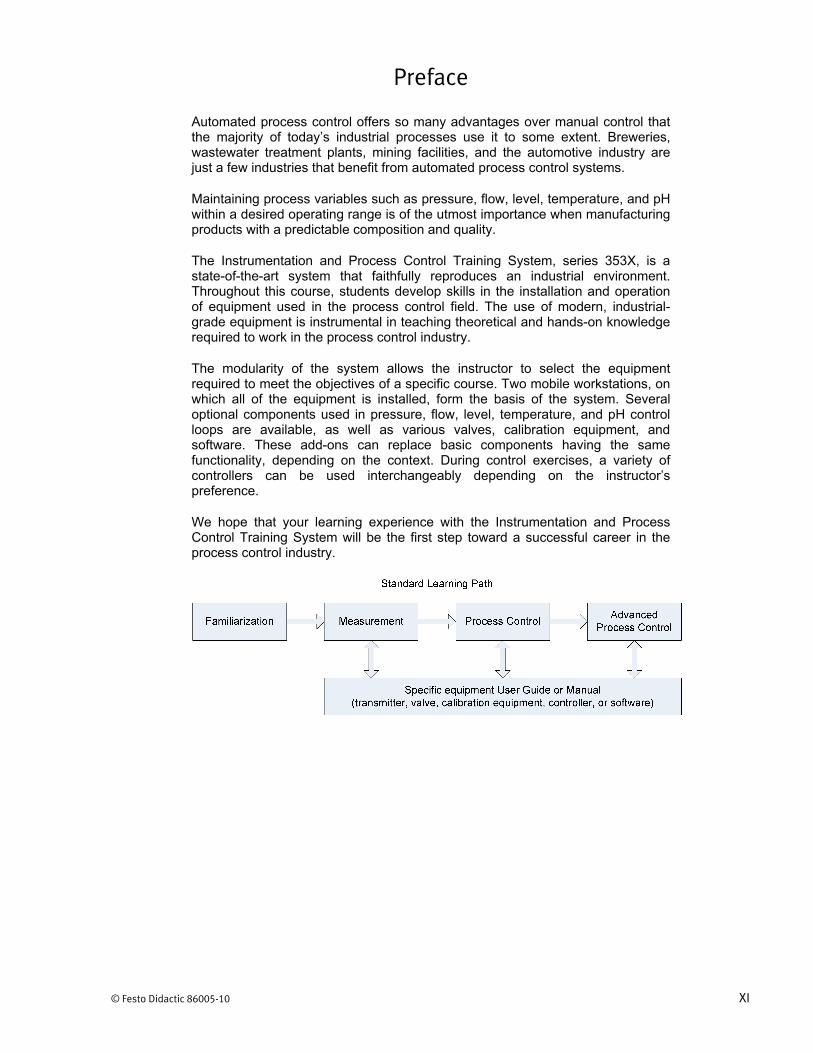
The Instrumentation and Process Control Training System, series 353X, is a state-of-the-art system that faithfully reproduces an industrial environment. Throughout this course, students develop skills in the installation and operation of equipment used in the process control field. The use of modern, industrial-grade equipment is instrumental in teaching theoretical and hands-on knowledge required to work in the process control industry.
The modularity of the system allows the instructor to select the equipment required to meet the objectives of a specific course. Two mobile workstations, on which all of the equipment is installed, form the basis of the system. Several optional components used in pressure, flow, level, temperature, and pH control loops are available, as well as various valves, calibration equipment, and software. These add-ons can replace basic components having the same functionality, depending on the context. During control exercises, a variety of controllers can be used interchangeably depending on the instructor’s preference.
We hope that your learning experience with the Instrumentation and Process Control Training System will be the first step toward a successful career in the process control industry.
Preface
XII © Festo Didactic 86005-10
Preface
© Festo Didactic 86005-10 XIII
Do you have suggestions or criticism regarding this manual?
If so, send us an e-mail at [email protected].
The authors and Festo Didactic look forward to your comments.

© Festo Didactic 86005-10 XV
To the Instructor
You will find in this Instructor Guide all the elements included in the Student Manual together with the answers to all questions, results of measurements, graphs, explanations, suggestions, and, in some cases, instructions to help you guide the students through their learning process. All the information that applies to you is placed between markers and appears in red.
Accuracy of measurements
The numerical results of the hands-on exercises may differ from one student to another. For this reason, the results and answers given in this manual should be considered as a guide. Students who correctly performed the exercises should expect to demonstrate the principles involved and make observations and measurements similar to those given as answers.
Equipment installation
In order for students to be able to perform the exercises in the Student Manual, the Process Control Training Equipment – Pressure, Flow, and Level must have been properly installed, according to the instructions given in the user guide Familiarization with the Instrumentation and Process Control System – Pressure, Flow, and Level, part number 86004-E.


Sample Exercise
Extracted from
the Student Manual
and the Instructor Guide

© Festo Didactic 86005-10 19
Learn the basics of fluid mechanics related to the measurement of pressure.
The Discussion of Fundamentals covers the following points:
What is a fluid? The continuum hypothesis What are the main characteristics of fluids?
Density. Specific gravity. Dynamic viscosity. Vapor pressure. Compressibility.
Hydrostatic pressure Pascal’s Law Pressure measurement
Units of measurement of pressure. Pressure head. Types of pressure measurements
Absolute pressure. Gauge pressure. Differential pressure. Classic pressure measurement devices
U-tube manometers. Bourdon-tube pressure gauges.
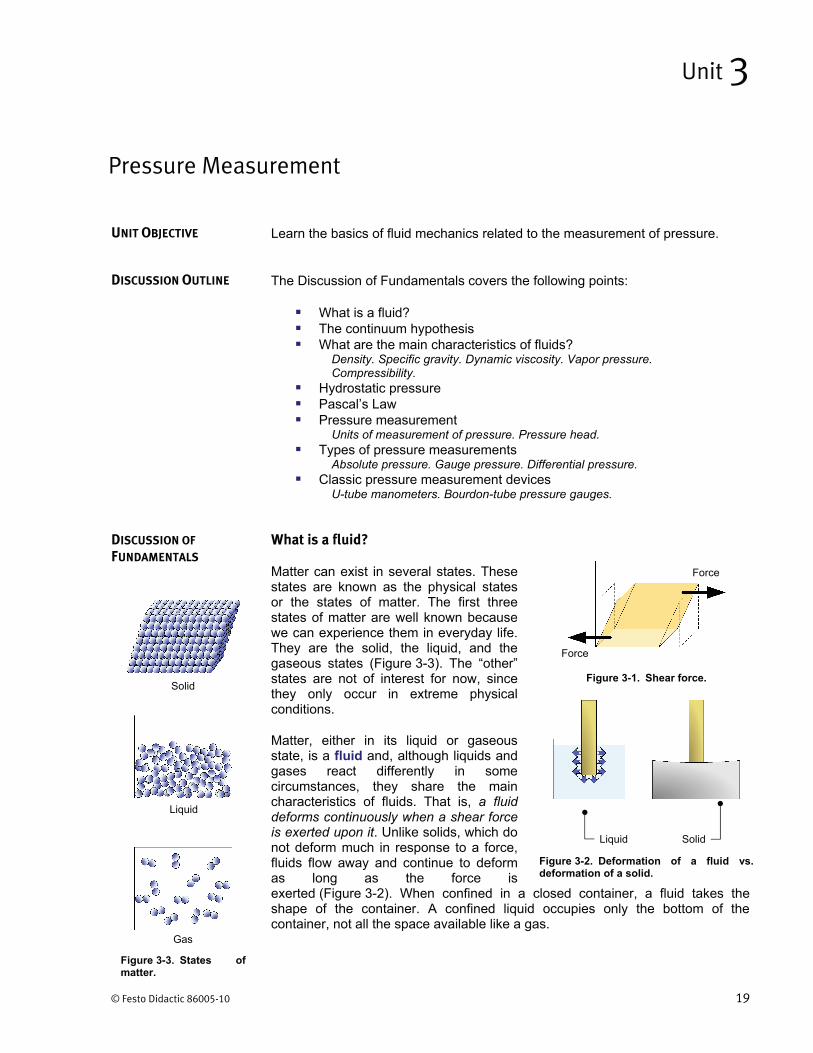
What is a fluid?
Matter can exist in several states. These states are known as the physical states or the states of matter. The first three states of matter are well known because we can experience them in everyday life. They are the solid, the liquid, and the gaseous states (Figure 3-3). The “other” states are not of interest for now, since they only occur in extreme physical conditions.
Matter, either in its liquid or gaseous state, is a fluid and, although liquids and gases react differently in some circumstances, they share the main characteristics of fluids. That is, a fluid deforms continuously when a shear force is exerted upon it. Unlike solids, which do not deform much in response to a force, fluids flow away and continue to deform as long as the force is exerted (Figure 3-2). When confined in a closed container, a fluid takes the shape of the container. A confined liquid occupies only the bottom of the container, not all the space available like a gas.
Pressure Measurement
Unit 3
UNIT OBJECTIVE
DISCUSSION OUTLINE
DISCUSSION OF FUNDAMENTALS
Figure 3-3. States of matter.
Figure 3-1. Shear force.
Figure 3-2. Deformation of a fluid vs. deformation of a solid.
Solid
Liquid
Gas
Force
Force
Liquid Solid
Unit 3 – Pressure Measurement Discussion of Fundamentals
20 © Festo Didactic 86005-10
The continuum hypothesis
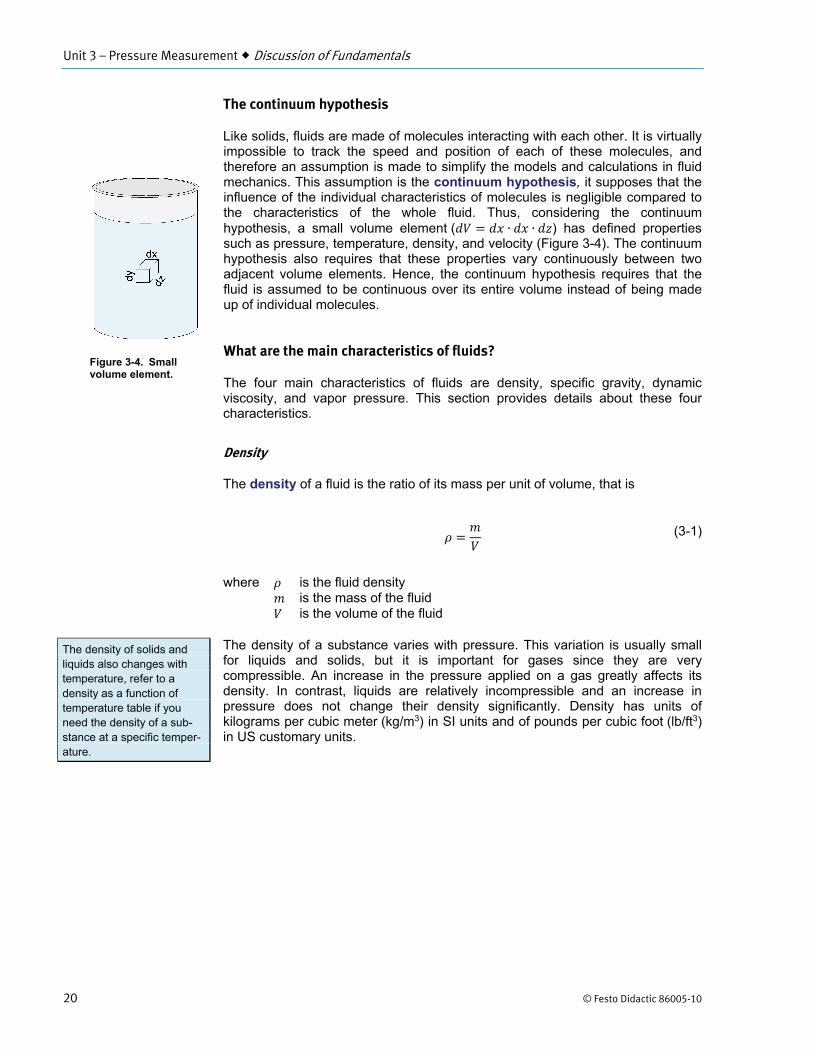
Like solids, fluids are made of molecules interacting with each other. It is virtually impossible to track the speed and position of each of these molecules, and therefore an assumption is made to simplify the models and calculations in fluid mechanics. This assumption is the continuum hypothesis, it supposes that the influence of the individual characteristics of molecules is negligible compared to the characteristics of the whole fluid. Thus, considering the continuum hypothesis, a small volume element ( ) has defined properties such as pressure, temperature, density, and velocity (Figure 3-4). The continuum hypothesis also requires that these properties vary continuously between two adjacent volume elements. Hence, the continuum hypothesis requires that the fluid is assumed to be continuous over its entire volume instead of being made up of individual molecules.
What are the main characteristics of fluids?
The four main characteristics of fluids are density, specific gravity, dynamic viscosity, and vapor pressure. This section provides details about these four characteristics.
Density
The density of a fluid is the ratio of its mass per unit of volume, that is
(3-1)
where is the fluid density is the mass of the fluid is the volume of the fluid
The density of a substance varies with pressure. This variation is usually small for liquids and solids, but it is important for gases since they are very compressible. An increase in the pressure applied on a gas greatly affects its density. In contrast, liquids are relatively incompressible and an increase in pressure does not change their density significantly. Density has units of kilograms per cubic meter (kg/m3) in SI units and of pounds per cubic foot (lb/ft3) in US customary units.
The density of solids and liquids also changes with temperature, refer to a density as a function of temperature table if you need the density of a sub-stance at a specific temper-ature.
Figure 3-4. Small volume element.
Unit 3 – Pressure Measurement Discussion of Fundamentals
© Festo Didactic 86005-10 21
Specific gravity
Specific gravity, or relative density, is the ratio of the density of a substance to the density of an equal volume of water:
(3-2)
where is the specific gravity of the substance is the density of the substance is the density of water
Since density varies with temperature and pressure, specific gravity is usually measured at 4°C (39.4°F) and at normal atmospheric pressure. At these conditions, the density of water is 1000 kg/m3 (62.4 lb/ft3). Since a ratio is a dimensionless number, specific gravity has no units.
Dynamic viscosity
The viscosity of a fluid is its capacity to resist deformation. Incidentally, viscosity gives a measure of how easily a liquid flows. Dynamic viscosity has units of pascal-second (Pa s) in SI units and of pound-force per foot second (lbf/ft s) in US customary units. Dynamic viscosity is sometimes measured in the C.G.S. units of poises (P), where 1 P is equal to 0.1 Pa s or 0.067 lbf/ft s. Temperature has a significant effect on viscosity. The viscosity of liquids decreases when their temperature increases, unlike the viscosity of gases, which increases with temperature.
Vapor pressure
Vapor pressure is the pressure developed by the vapor of a fluid or a solid. Vapor pressure is measured for a given temperature when the vapor is at equilibrium with the solid or liquid phase of the substance. Vapor pressure is a pressure, thus it has units of kilopascals (kPa) in SI units and pounds per square inch (psi) in US customary units.
Compressibility
Another difference between liquids and gases is their compressibility. Compressibility is the capacity of a fluid to decrease in volume when subjected to pressure. Liquids are relatively incompressible while gases can be compressed. The near-incompressibility of liquids implies that their pressure increases rapidly when they are confined and pushed on. Hydraulic systems use this property of liquids to develop very high pressure and transmit tremendous amounts of power to other elements.
Unit 3 – Pressure Measurement Discussion of Fundamentals
22 © Festo Didactic 86005-10
Hydrostatic pressure
Pressure is the amount of force exerted per unit of area:
(3-3)
where is the pressure is the force exerted on the area is the area
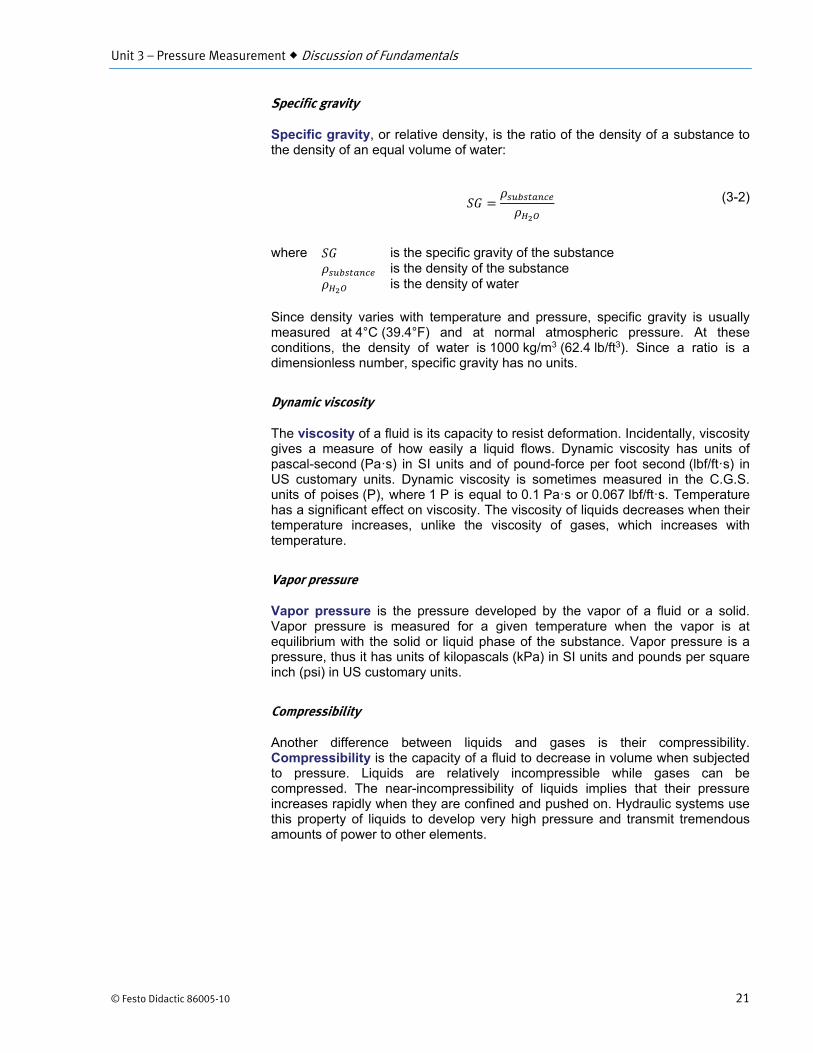
An ideal fluid cannot exert a shear force; thus, the forces on a small volume element are equal normal forces only, as Figure 3-5 shows. At rest, the pressure that a fluid exerts on a small volume element depends only on the weight of the fluid above this element. The pressure due to the weight of liquid is proportional to the depth at which the pressure is measured, and only to this depth. The shape of the vessel has no influence on the hydrostatic pressure. For example, if two tanks are full of water but have a different diameter, the hydrostatic pressure due to the weight of water is the same at the bottom of both tanks (Figure 3-6).
The absolute pressure at the bottom of a column of liquid is the sum of the atmospheric pressure and the hydrostatic pressure due to the weight of liquid. The mathematical expression used to calculate the pressure at the bottom of a vessel is
(3-4)
where is the pressure is the atmospheric pressure is the fluid density is the acceleration due to gravity is the height of the column of liquid
Figure 3-6. The pressure is the same at the bottom of both tanks, even if the diameters of the tanks are not the same.
A normal force is a force perpendicular to a surface.
Figure 3-5. Pressure on a small volume element.
Unit 3 – Pressure Measurement Discussion of Fundamentals
© Festo Didactic 86005-10 23
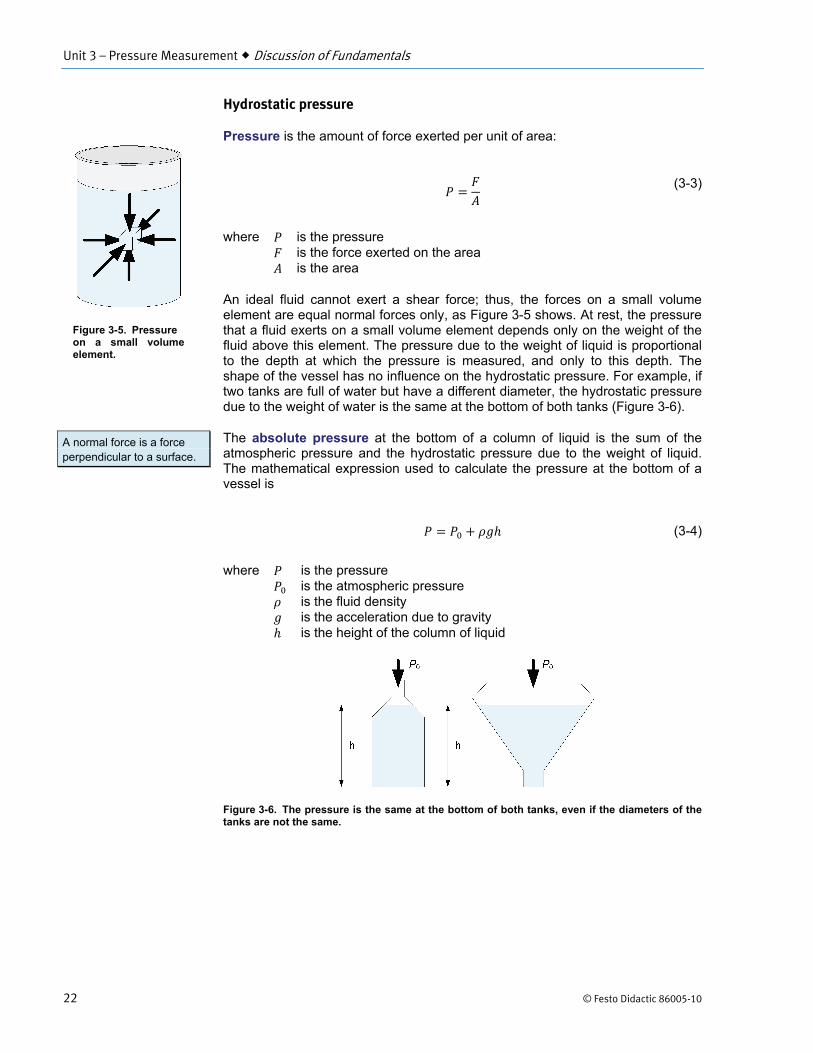
Pascal’s Law
Blaise Pascal (1623-1662) the French mathematician, physicist, and philosopher, deduced from the fact that a column of fluid exerts a pressure that varies only with the height of the column of fluid, that
An external pressure applied to a confined fluid is conveyed undiminished to every part of the fluid.
Figure 3-7 illustrates Pascal’s law, also known as Pascal’s principle. An application of this principle is the hydraulic lift (Figure 3-8). Using two pistons of different areas (A1 and A2), the force on the first piston (F1) is multiplied by the ratio of the area of the two pistons to produce a larger output force (F2). Thus, the output force is
(3-5)
Figure 3-8. Hydraulic lift.
Pressure measurement
Units of measurement of pressure
The equipment provided with the Instrumentation and Process Control Training System provides pressure readings in SI units and US customary units. The SI unit of pressure is the pascal (Pa). One pascal (1 Pa) is one newton (1 N) of force applied to an area of one square meter (1 m2). Therefore, 1 Pa is equal to 1 N/m2. Since most measurements are of the order of magnitude of 1x10³ Pa, most instruments give readings with units of kilopascal (kPa) instead of pascal, where one kilopascal (1 kPa) is equal to 1000 Pa. In US customary units, pressure has units of pounds-force per square inch (psi). One pound-force per square inch (1 psi) is one pound of force (1 lbf) applied to an area of one square inch (1 in2). Some instruments also give readings using other units such as bar (bar). One bar (1 bar) is equal to 100 kPa or 14.5 psi.
Figure 3-7. Pascal’s principle.
Force
Unit 3 – Pressure Measurement Discussion of Fundamentals
24 © Festo Didactic 86005-10
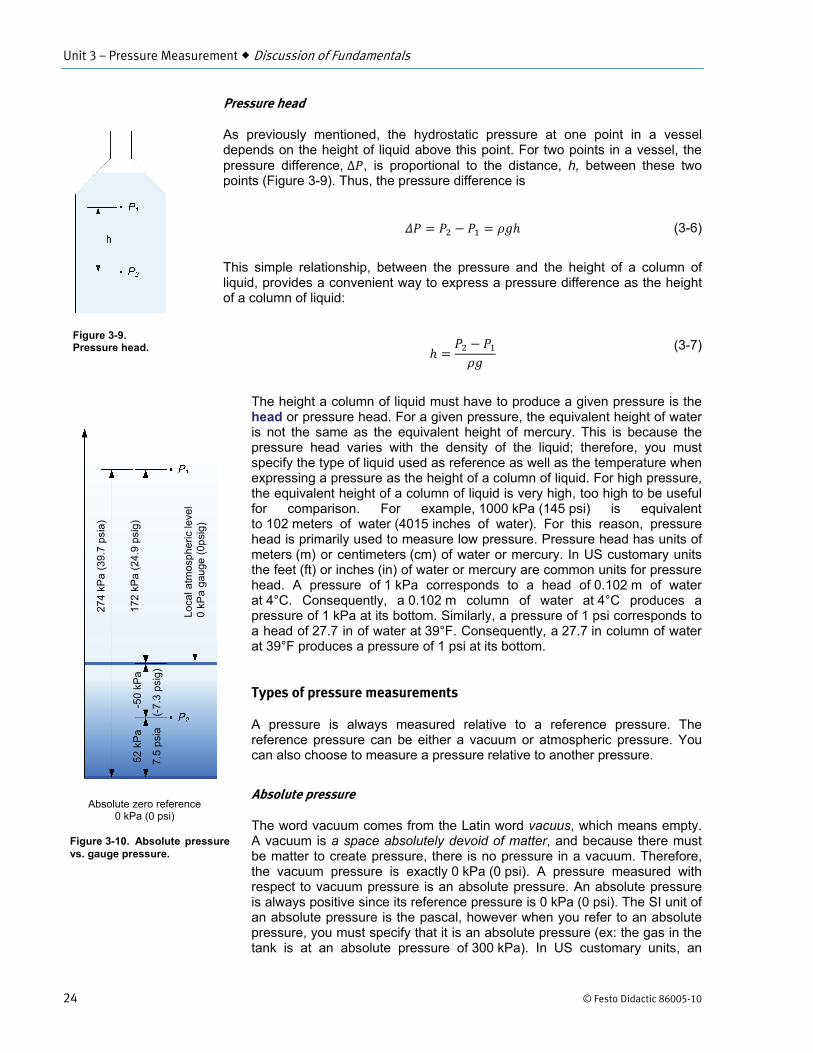
Pressure head
As previously mentioned, the hydrostatic pressure at one point in a vessel depends on the height of liquid above this point. For two points in a vessel, the pressure difference, , is proportional to the distance, h, between these two points (Figure 3-9). Thus, the pressure difference is
(3-6)
This simple relationship, between the pressure and the height of a column of liquid, provides a convenient way to express a pressure difference as the height of a column of liquid:
(3-7)
The height a column of liquid must have to produce a given pressure is the head or pressure head. For a given pressure, the equivalent height of water is not the same as the equivalent height of mercury. This is because the pressure head varies with the density of the liquid; therefore, you must specify the type of liquid used as reference as well as the temperature when expressing a pressure as the height of a column of liquid. For high pressure, the equivalent height of a column of liquid is very high, too high to be useful for comparison. For example, 1000 kPa (145 psi) is equivalent to 102 meters of water (4015 inches of water). For this reason, pressure head is primarily used to measure low pressure. Pressure head has units of meters (m) or centimeters (cm) of water or mercury. In US customary units the feet (ft) or inches (in) of water or mercury are common units for pressure head. A pressure of 1 kPa corresponds to a head of 0.102 m of water at 4°C. Consequently, a 0.102 m column of water at 4°C produces a pressure of 1 kPa at its bottom. Similarly, a pressure of 1 psi corresponds to a head of 27.7 in of water at 39°F. Consequently, a 27.7 in column of water at 39°F produces a pressure of 1 psi at its bottom.
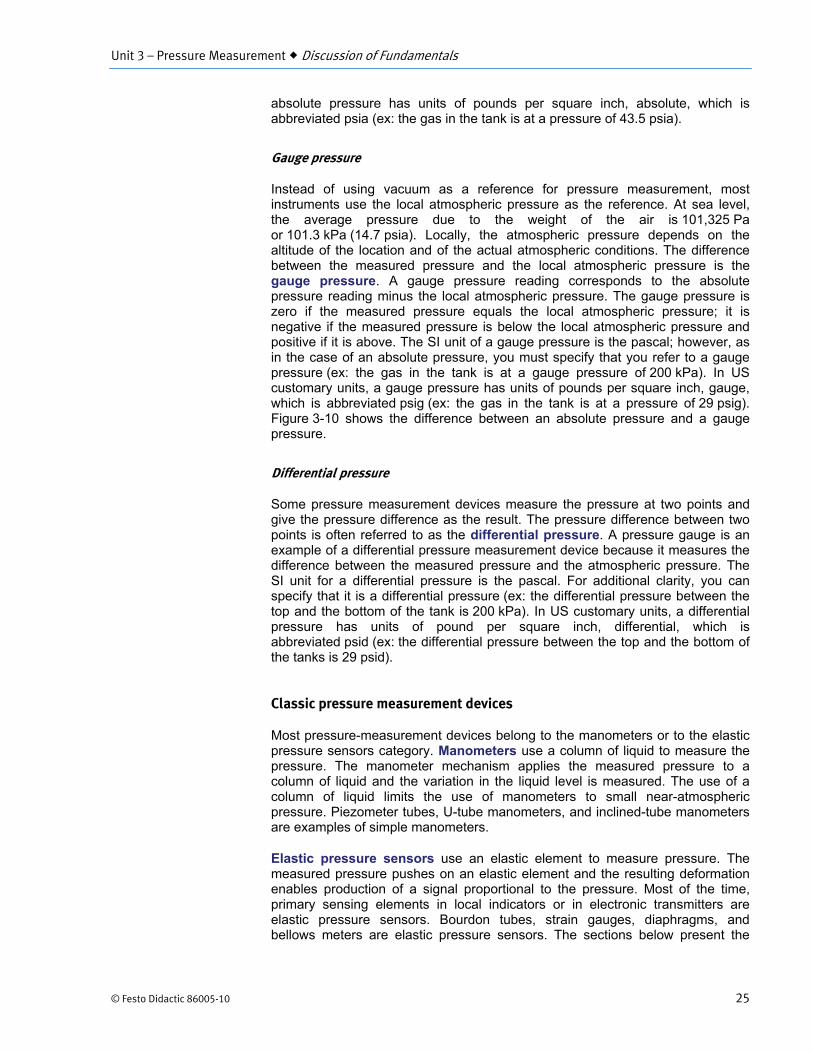
Types of pressure measurements
A pressure is always measured relative to a reference pressure. The reference pressure can be either a vacuum or atmospheric pressure. You can also choose to measure a pressure relative to another pressure.
Absolute pressure
The word vacuum comes from the Latin word vacuus, which means empty. A vacuum is a space absolutely devoid of matter, and because there must be matter to create pressure, there is no pressure in a vacuum. Therefore, the vacuum pressure is exactly 0 kPa (0 psi). A pressure measured with respect to vacuum pressure is an absolute pressure. An absolute pressure is always positive since its reference pressure is 0 kPa (0 psi). The SI unit of an absolute pressure is the pascal, however when you refer to an absolute pressure, you must specify that it is an absolute pressure (ex: the gas in the tank is at an absolute pressure of 300 kPa). In US customary units, an
Figure 3-9.Pressure head.
Figure 3-10. Absolute pressure vs. gauge pressure.
274
kPa
(39.
7 ps
ia)
172
kPa
(24.
9 ps
ig)
Loca
l atm
osph
eric
leve
l 0
kPa
gaug
e (0
psig
)
52 k
Pa
7.5
psia
(-
7.3
psig
)
-50
kPa
Absolute zero reference 0 kPa (0 psi)
Unit 3 – Pressure Measurement Discussion of Fundamentals
© Festo Didactic 86005-10 25
absolute pressure has units of pounds per square inch, absolute, which is abbreviated psia (ex: the gas in the tank is at a pressure of 43.5 psia).
Gauge pressure
Instead of using vacuum as a reference for pressure measurement, most instruments use the local atmospheric pressure as the reference. At sea level, the average pressure due to the weight of the air is 101,325 Pa or 101.3 kPa (14.7 psia). Locally, the atmospheric pressure depends on the altitude of the location and of the actual atmospheric conditions. The difference between the measured pressure and the local atmospheric pressure is the gauge pressure. A gauge pressure reading corresponds to the absolute pressure reading minus the local atmospheric pressure. The gauge pressure is zero if the measured pressure equals the local atmospheric pressure; it is negative if the measured pressure is below the local atmospheric pressure and positive if it is above. The SI unit of a gauge pressure is the pascal; however, as in the case of an absolute pressure, you must specify that you refer to a gauge pressure (ex: the gas in the tank is at a gauge pressure of 200 kPa). In US customary units, a gauge pressure has units of pounds per square inch, gauge, which is abbreviated psig (ex: the gas in the tank is at a pressure of 29 psig). Figure 3-10 shows the difference between an absolute pressure and a gauge pressure.
Differential pressure
Some pressure measurement devices measure the pressure at two points and give the pressure difference as the result. The pressure difference between two points is often referred to as the differential pressure. A pressure gauge is an example of a differential pressure measurement device because it measures the difference between the measured pressure and the atmospheric pressure. The SI unit for a differential pressure is the pascal. For additional clarity, you can specify that it is a differential pressure (ex: the differential pressure between the top and the bottom of the tank is 200 kPa). In US customary units, a differential pressure has units of pound per square inch, differential, which is abbreviated psid (ex: the differential pressure between the top and the bottom of the tanks is 29 psid).
Classic pressure measurement devices
Most pressure-measurement devices belong to the manometers or to the elastic pressure sensors category. Manometers use a column of liquid to measure the pressure. The manometer mechanism applies the measured pressure to a column of liquid and the variation in the liquid level is measured. The use of a column of liquid limits the use of manometers to small near-atmospheric pressure. Piezometer tubes, U-tube manometers, and inclined-tube manometers are examples of simple manometers.
Elastic pressure sensors use an elastic element to measure pressure. The measured pressure pushes on an elastic element and the resulting deformation enables production of a signal proportional to the pressure. Most of the time, primary sensing elements in local indicators or in electronic transmitters are elastic pressure sensors. Bourdon tubes, strain gauges, diaphragms, and bellows meters are elastic pressure sensors. The sections below present the
Unit 3 – Pressure Measurement Discussion of Fundamentals
26 © Festo Didactic 86005-10
working principles of liquid manometers and Bourdon-tube pressure gauges. These devices are classic pressure measurement devices and understanding how they work will help your comprehension of the physics behind pressure measurement devices. The Discussion section of Ex. 3-1 thoroughly describes strain gauges, which are a type of elastic pressure sensor.
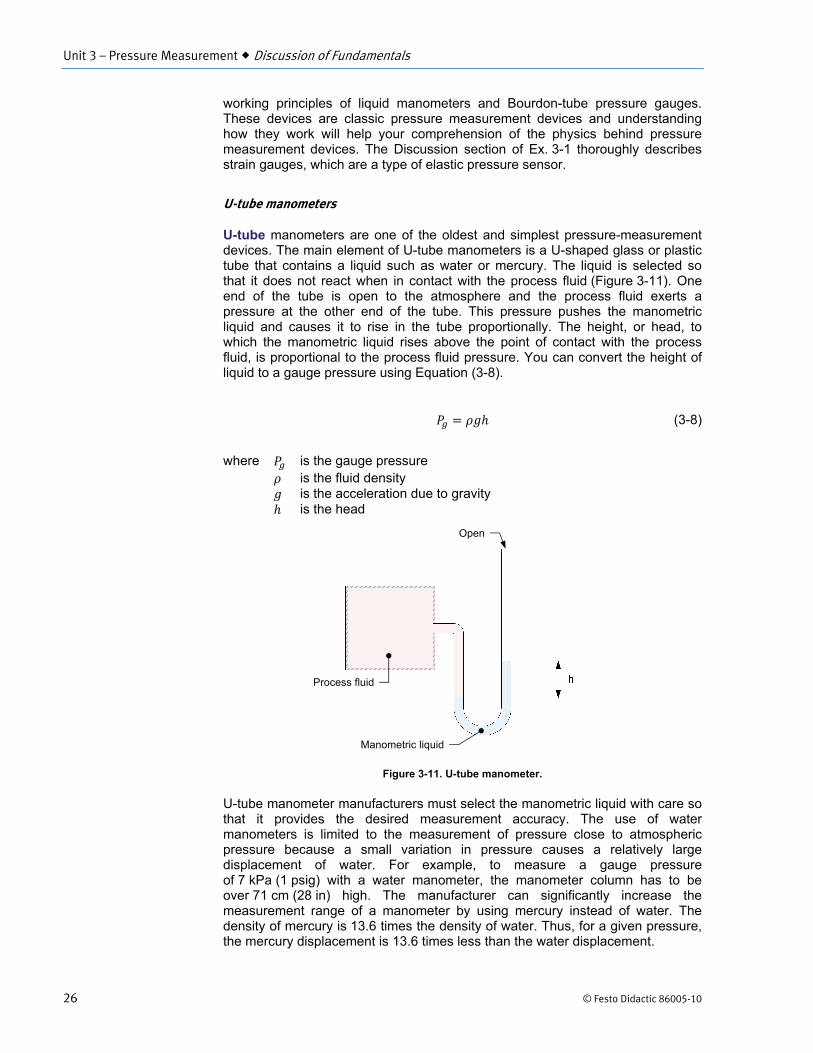
U-tube manometers
U-tube manometers are one of the oldest and simplest pressure-measurement devices. The main element of U-tube manometers is a U-shaped glass or plastic tube that contains a liquid such as water or mercury. The liquid is selected so that it does not react when in contact with the process fluid (Figure 3-11). One end of the tube is open to the atmosphere and the process fluid exerts a pressure at the other end of the tube. This pressure pushes the manometric liquid and causes it to rise in the tube proportionally. The height, or head, to which the manometric liquid rises above the point of contact with the process fluid, is proportional to the process fluid pressure. You can convert the height of liquid to a gauge pressure using Equation (3-8).
(3-8)
where is the gauge pressure is the fluid density is the acceleration due to gravity is the head
Figure 3-11. U-tube manometer.
U-tube manometer manufacturers must select the manometric liquid with care so that it provides the desired measurement accuracy. The use of water manometers is limited to the measurement of pressure close to atmospheric pressure because a small variation in pressure causes a relatively large displacement of water. For example, to measure a gauge pressure of 7 kPa (1 psig) with a water manometer, the manometer column has to be over 71 cm (28 in) high. The manufacturer can significantly increase the measurement range of a manometer by using mercury instead of water. The density of mercury is 13.6 times the density of water. Thus, for a given pressure, the mercury displacement is 13.6 times less than the water displacement.
Open
Process fluid
Manometric liquid
Unit 3 – Pressure Measurement Discussion of Fundamentals
© Festo Didactic 86005-10 27
Liquid manometers are sufficiently accurate to serve as standards for checking the calibration of other pressure measurement devices. However, liquid manometers are fragile and bulky, which restricts their use to laboratories or as local indicators.
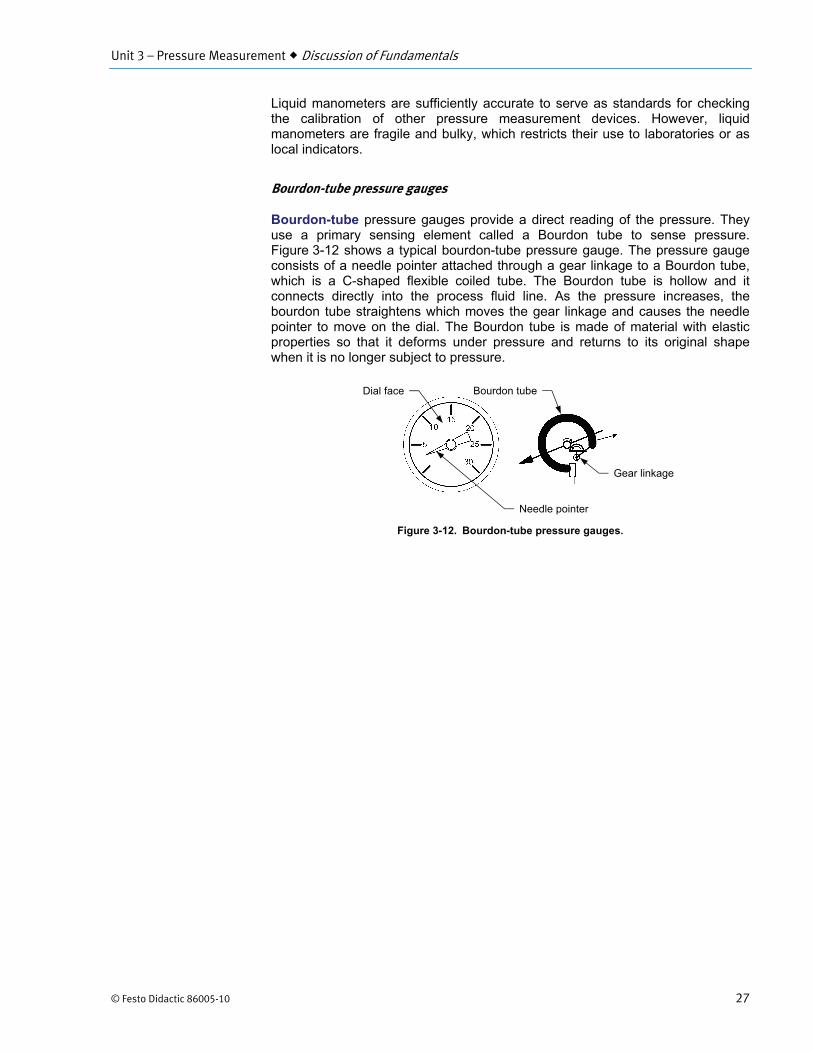
Bourdon-tube pressure gauges
Bourdon-tube pressure gauges provide a direct reading of the pressure. They use a primary sensing element called a Bourdon tube to sense pressure. Figure 3-12 shows a typical bourdon-tube pressure gauge. The pressure gauge consists of a needle pointer attached through a gear linkage to a Bourdon tube, which is a C-shaped flexible coiled tube. The Bourdon tube is hollow and it connects directly into the process fluid line. As the pressure increases, the bourdon tube straightens which moves the gear linkage and causes the needle pointer to move on the dial. The Bourdon tube is made of material with elastic properties so that it deforms under pressure and returns to its original shape when it is no longer subject to pressure.
Figure 3-12. Bourdon-tube pressure gauges.
Dial face Bourdon tube
Needle pointer
Gear linkage

© Festo Didactic 86005-10 29
Familiarize yourself with pressure measurement using different pressure measurement devices.
The Discussion of this exercise covers the following points:
Strain-gauge pressure sensing devices Pressure in a water system How to install a pressure-sensing device to measure a pressure What is bleeding?
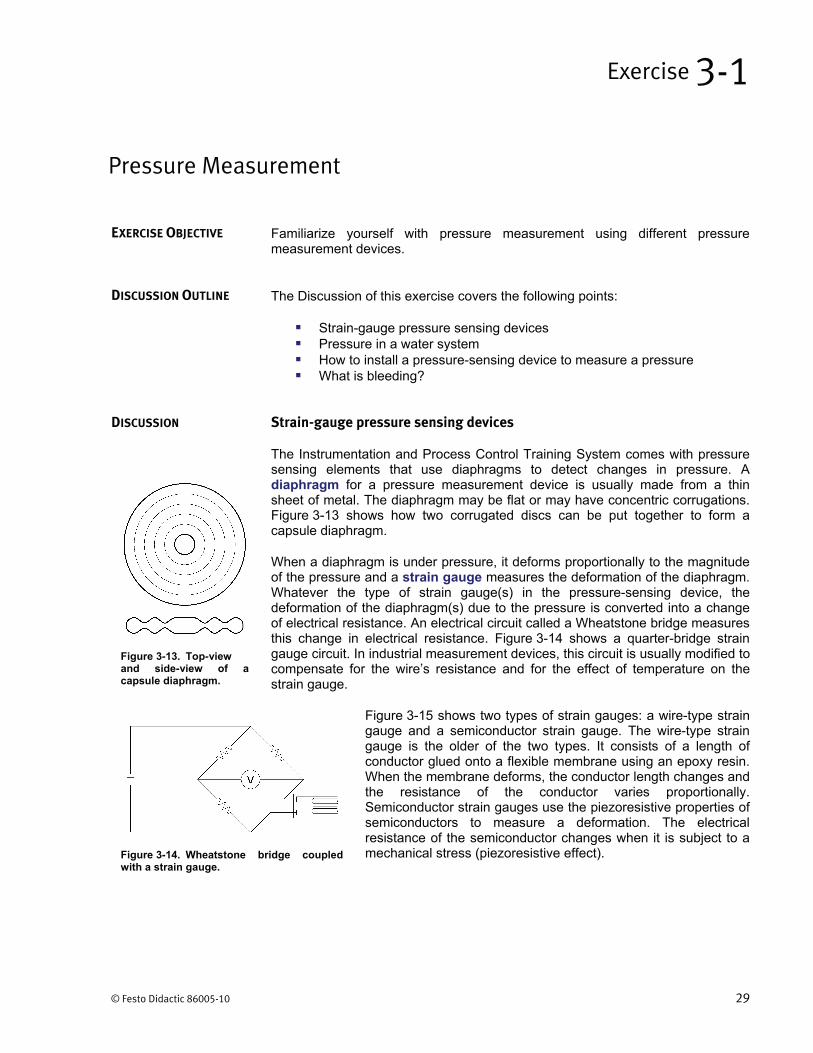
Strain-gauge pressure sensing devices
The Instrumentation and Process Control Training System comes with pressure sensing elements that use diaphragms to detect changes in pressure. A diaphragm for a pressure measurement device is usually made from a thin sheet of metal. The diaphragm may be flat or may have concentric corrugations. Figure 3-13 shows how two corrugated discs can be put together to form a capsule diaphragm.
When a diaphragm is under pressure, it deforms proportionally to the magnitude of the pressure and a strain gauge measures the deformation of the diaphragm. Whatever the type of strain gauge(s) in the pressure-sensing device, the deformation of the diaphragm(s) due to the pressure is converted into a change of electrical resistance. An electrical circuit called a Wheatstone bridge measures this change in electrical resistance. Figure 3-14 shows a quarter-bridge strain gauge circuit. In industrial measurement devices, this circuit is usually modified to compensate for the wire’s resistance and for the effect of temperature on the strain gauge.
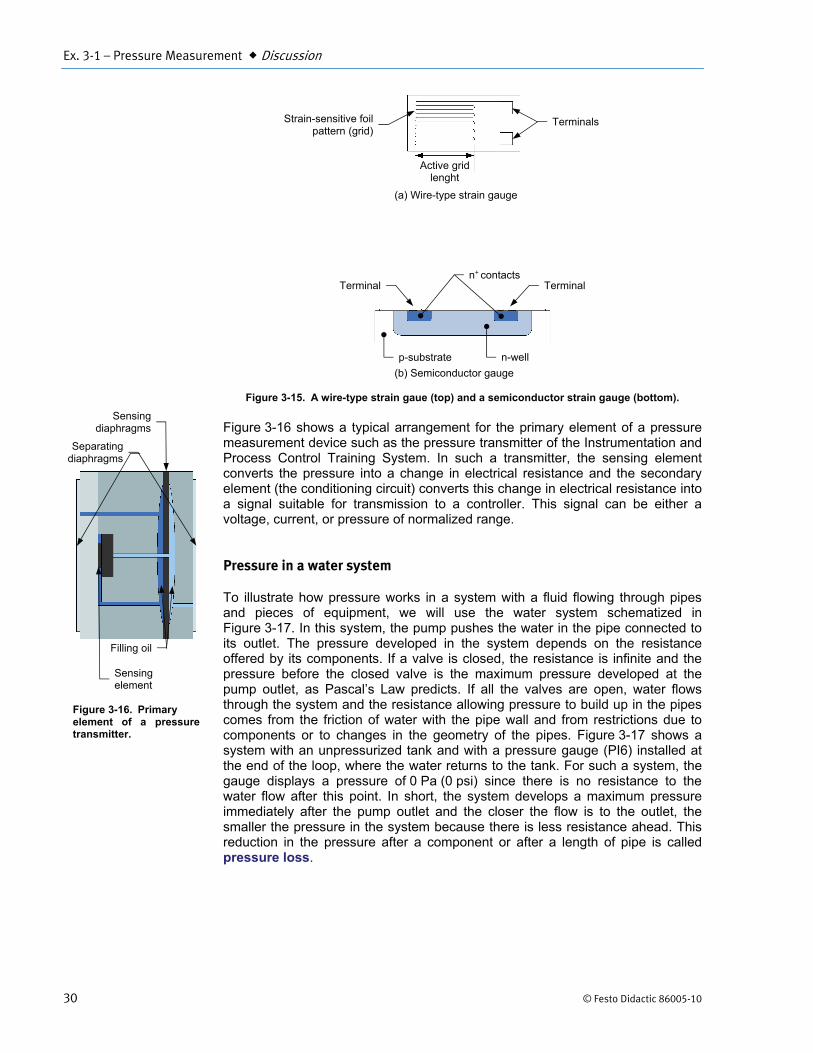
Figure 3-15 shows two types of strain gauges: a wire-type strain gauge and a semiconductor strain gauge. The wire-type strain gauge is the older of the two types. It consists of a length of conductor glued onto a flexible membrane using an epoxy resin. When the membrane deforms, the conductor length changes and the resistance of the conductor varies proportionally. Semiconductor strain gauges use the piezoresistive properties of semiconductors to measure a deformation. The electrical resistance of the semiconductor changes when it is subject to a mechanical stress (piezoresistive effect).
Pressure Measurement
Exercise 3-1
EXERCISE OBJECTIVE
DISCUSSION OUTLINE
DISCUSSION
Figure 3-13. Top-view and side-view of a capsule diaphragm.
Figure 3-14. Wheatstone bridge coupled with a strain gauge.
Ex. 3-1 – Pressure Measurement Discussion
30 © Festo Didactic 86005-10
Figure 3-15. A wire-type strain gaue (top) and a semiconductor strain gauge (bottom).
Figure 3-16 shows a typical arrangement for the primary element of a pressure measurement device such as the pressure transmitter of the Instrumentation and Process Control Training System. In such a transmitter, the sensing element converts the pressure into a change in electrical resistance and the secondary element (the conditioning circuit) converts this change in electrical resistance into a signal suitable for transmission to a controller. This signal can be either a voltage, current, or pressure of normalized range.
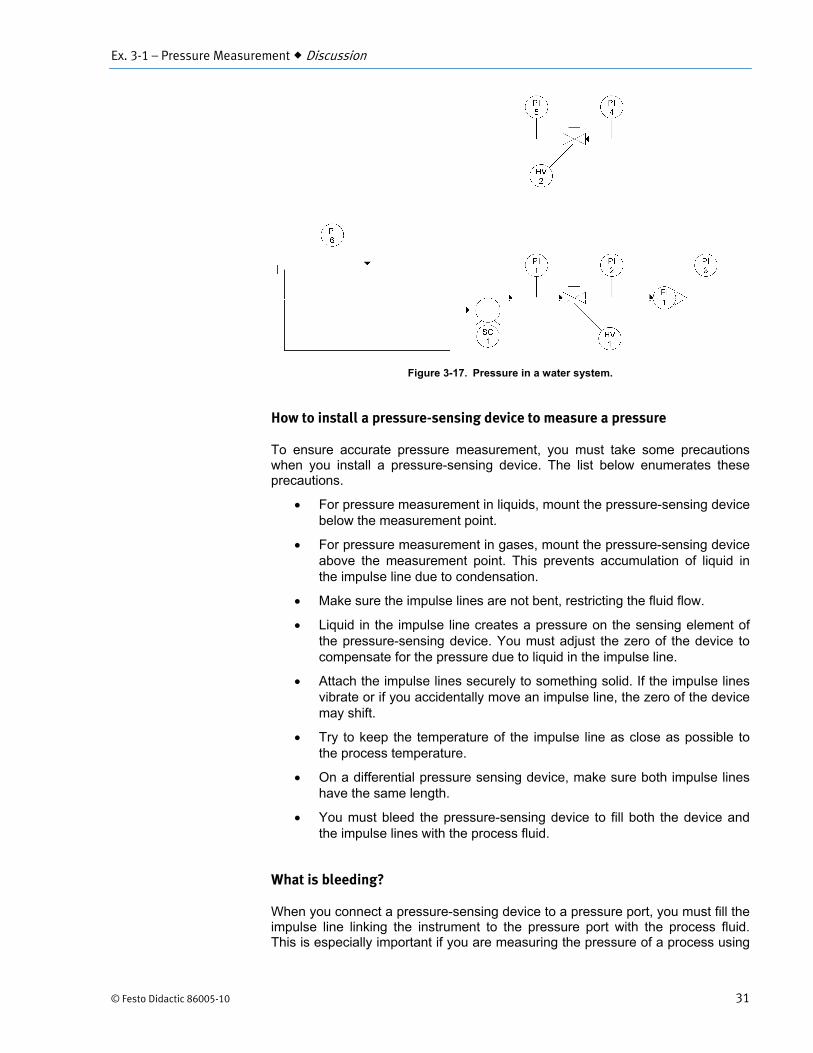
Pressure in a water system
To illustrate how pressure works in a system with a fluid flowing through pipes and pieces of equipment, we will use the water system schematized in Figure 3-17. In this system, the pump pushes the water in the pipe connected to its outlet. The pressure developed in the system depends on the resistance offered by its components. If a valve is closed, the resistance is infinite and the pressure before the closed valve is the maximum pressure developed at the pump outlet, as Pascal’s Law predicts. If all the valves are open, water flows through the system and the resistance allowing pressure to build up in the pipes comes from the friction of water with the pipe wall and from restrictions due to components or to changes in the geometry of the pipes. Figure 3-17 shows a system with an unpressurized tank and with a pressure gauge (PI6) installed at the end of the loop, where the water returns to the tank. For such a system, the gauge displays a pressure of 0 Pa (0 psi) since there is no resistance to the water flow after this point. In short, the system develops a maximum pressure immediately after the pump outlet and the closer the flow is to the outlet, the smaller the pressure in the system because there is less resistance ahead. This reduction in the pressure after a component or after a length of pipe is called pressure loss.
Figure 3-16. Primary element of a pressure transmitter.
Strain-sensitive foilpattern (grid)
Active gridlenght
(a) Wire-type strain gauge
(b) Semiconductor gauge
Terminal Terminal
Terminals
p-substrate n-well
n+ contacts
Separating diaphragms
Sensingdiaphragms
Filling oil
Sensing element
Ex. 3-1 – Pressure Measurement Discussion
© Festo Didactic 86005-10 31
Figure 3-17. Pressure in a water system.
How to install a pressure-sensing device to measure a pressure
To ensure accurate pressure measurement, you must take some precautions when you install a pressure-sensing device. The list below enumerates these precautions.
For pressure measurement in liquids, mount the pressure-sensing device below the measurement point.
For pressure measurement in gases, mount the pressure-sensing device above the measurement point. This prevents accumulation of liquid in the impulse line due to condensation.
Make sure the impulse lines are not bent, restricting the fluid flow.
Liquid in the impulse line creates a pressure on the sensing element of the pressure-sensing device. You must adjust the zero of the device to compensate for the pressure due to liquid in the impulse line.
Attach the impulse lines securely to something solid. If the impulse lines vibrate or if you accidentally move an impulse line, the zero of the device may shift.
Try to keep the temperature of the impulse line as close as possible to the process temperature.
On a differential pressure sensing device, make sure both impulse lines have the same length.
You must bleed the pressure-sensing device to fill both the device and the impulse lines with the process fluid.
What is bleeding?
When you connect a pressure-sensing device to a pressure port, you must fill the impulse line linking the instrument to the pressure port with the process fluid. This is especially important if you are measuring the pressure of a process using
Ex. 3-1 – Pressure Measurement Discussion
32 © Festo Didactic 86005-10
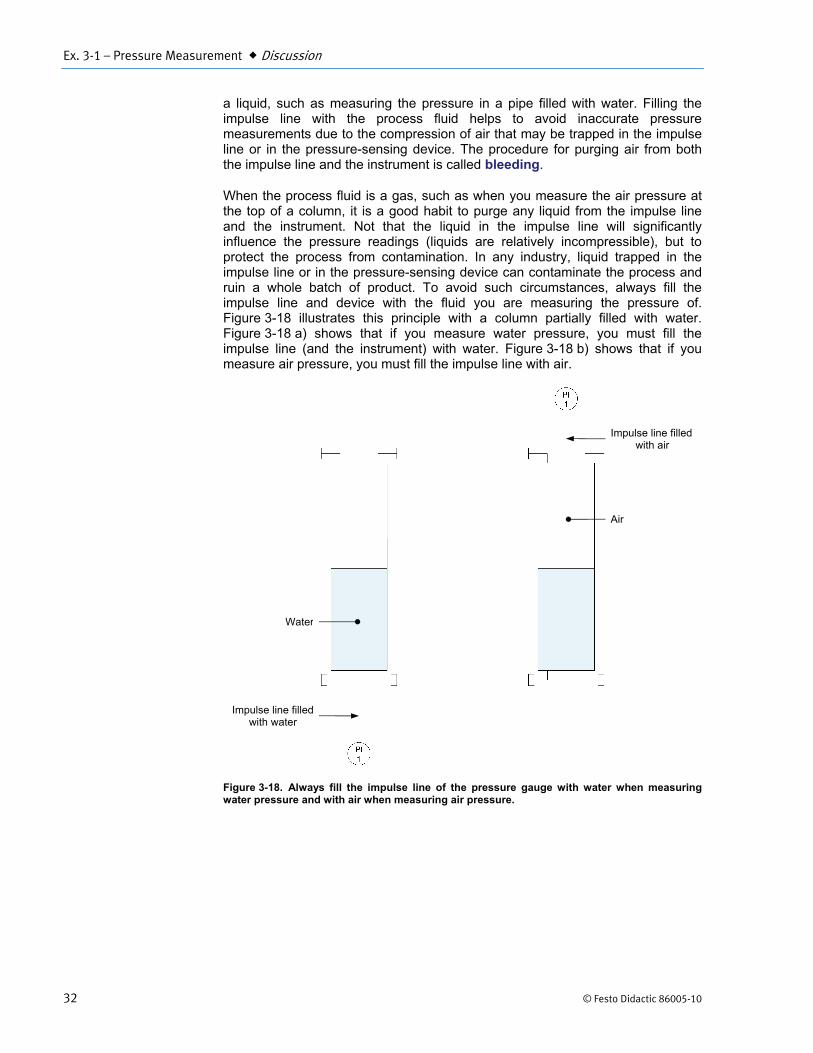
a liquid, such as measuring the pressure in a pipe filled with water. Filling the impulse line with the process fluid helps to avoid inaccurate pressure measurements due to the compression of air that may be trapped in the impulse line or in the pressure-sensing device. The procedure for purging air from both the impulse line and the instrument is called bleeding.
When the process fluid is a gas, such as when you measure the air pressure at the top of a column, it is a good habit to purge any liquid from the impulse line and the instrument. Not that the liquid in the impulse line will significantly influence the pressure readings (liquids are relatively incompressible), but to protect the process from contamination. In any industry, liquid trapped in the impulse line or in the pressure-sensing device can contaminate the process and ruin a whole batch of product. To avoid such circumstances, always fill the impulse line and device with the fluid you are measuring the pressure of. Figure 3-18 illustrates this principle with a column partially filled with water. Figure 3-18 a) shows that if you measure water pressure, you must fill the impulse line (and the instrument) with water. Figure 3-18 b) shows that if you measure air pressure, you must fill the impulse line with air.
Figure 3-18. Always fill the impulse line of the pressure gauge with water when measuring water pressure and with air when measuring air pressure.
Impulse line filled with water
Impulse line filledwith air
Air
Water

Ex. 3-1 – Pressure Measurement Procedure Outline
© Festo Didactic 86005-10 33
The Procedure is divided into the following sections:
Setup and connections Bleeding the pressure gauge Measuring pressure with a pressure gauge Measuring the air pressure in a pressurized column The differential-pressure transmitter Bleeding a differential-pressure transmitter Measuring differential pressure using a differential-pressure transmitter
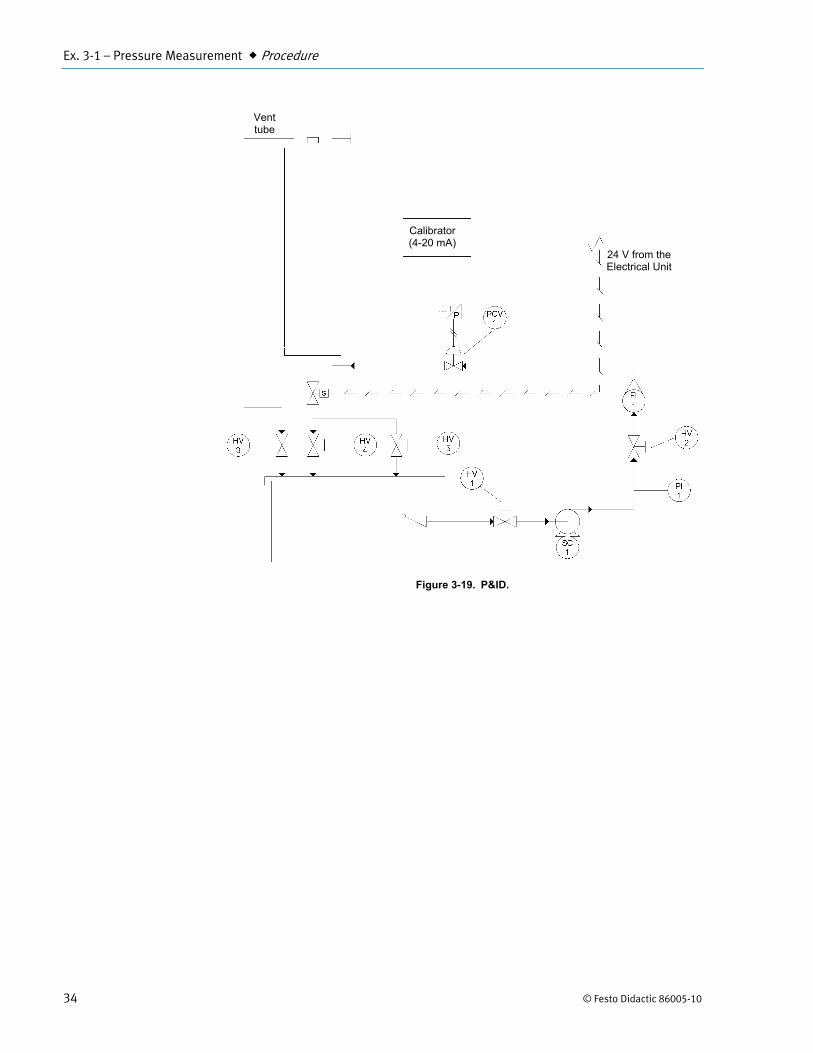
Setup and connections
1. Connect the equipment as the piping and instrumentation diagram (P&ID) in Figure 3-19 shows and use Figure 3-20 to position the equipment correctly on the frame of the training system. Use the basic setup presented in the Familiarization with the Training System manual. Table 3-1 lists the equipment you must add to the basic setup in order to set up your system for this exercise.
Table 3-1. Devices required for this exercise.
Name Model Identification
Digital pressure gauge 46761-B PI 1
Differential-pressure transmitter (high-pressure range)1 46920 PDI 1
Solenoid valve 46951 S
Electrical unit 46970
Pneumatic unit 46971
Accessories 46993
Calibrator ----
1 Required for the second half of this exercise only.
PROCEDURE OUTLINE
PROCEDURE
Ex. 3-1 – Pressure Measurement Procedure
34 © Festo Didactic 86005-10
Figure 3-19. P&ID.
Vent tube
Calibrator (4-20 mA)
24 V from theElectrical Unit
Ex. 3-1 – Pressure Measurement Procedure
© Festo Didactic 86005-10 35
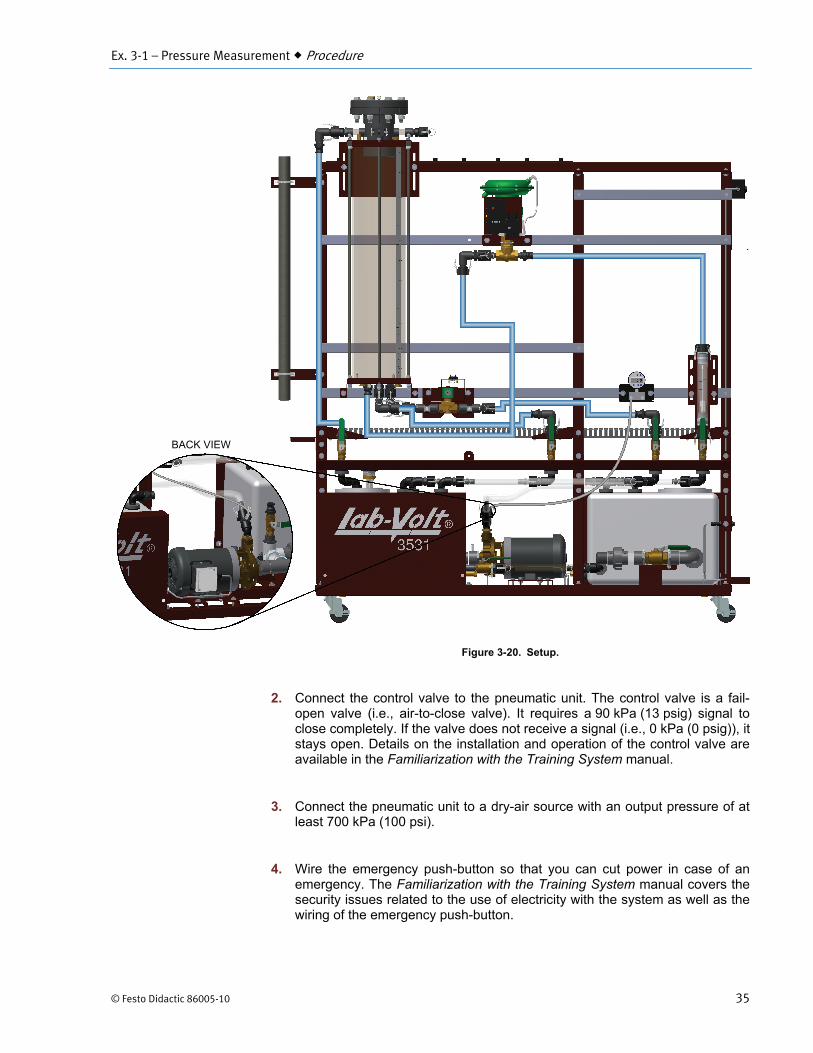
Figure 3-20. Setup.
2. Connect the control valve to the pneumatic unit. The control valve is a fail-open valve (i.e., air-to-close valve). It requires a 90 kPa (13 psig) signal to close completely. If the valve does not receive a signal (i.e., 0 kPa (0 psig)), it stays open. Details on the installation and operation of the control valve are available in the Familiarization with the Training System manual.
3. Connect the pneumatic unit to a dry-air source with an output pressure of at least 700 kPa (100 psi).
4. Wire the emergency push-button so that you can cut power in case of an emergency. The Familiarization with the Training System manual covers the security issues related to the use of electricity with the system as well as the wiring of the emergency push-button.
BACK VIEW
Ex. 3-1 – Pressure Measurement Procedure
36 © Festo Didactic 86005-10
5. Do not power up the instrumentation workstation yet. Do not turn the electrical panel on before your instructor has validated your setup—that is not before step 10.
6. Connect the solenoid valve so that a voltage of 24 V dc actuates the solenoid when you turn the power on at step 10. The solenoid valve does not play an important role in the present exercise. However, it will be used in the characterization and control exercises. Therefore, it is important that you become familiar with its operation.
7. Connect the calibrator to the current to pressure converter of the control valve.
8. Before proceeding further, complete the following checklist to make sure you have set up the system properly. The points on this checklist are crucial elements for the proper completion of this exercise. This checklist is not exhaustive. Be sure to follow the instructions in the Familiarization with the Training System manual as well.
f
All unused male adapters on the column are capped and the flange is properly tightened.
The solenoid valve under the column is wired so that the valve opens when the system is turned on.
The hand valves are in the positions shown in the P&ID.
The control valve is fully open.
The current to pressure converter is properly configured.
The pneumatic connections are correct.
The vent tube is properly installed.
9. Ask your instructor to check and approve your setup.
10. Power up the electrical unit. This starts all electrical devices as well as the pneumatic devices.
11. Use the calibrator to send a 4 mA signal to the current to pressure converter of the control valve. When the converter receives a 4 mA signal it sends a 20 kPa (3 psig) signal to the control valve. At such a pressure signal, the valve is fully open. To close the control valve, a 20 mA signal must be sent to the current to pressure converter. When the converter receives a 20 mA signal, it sends a 90 kPa (13 psig) signal to close the valve.
12. Test your system for leaks. Use the drive to make the pump run at low speed in order to produce a small flow rate. Gradually increase the flow rate, up

Ex. 3-1 – Pressure Measurement Procedure
© Festo Didactic 86005-10 37
to 50% of the maximum flow rate the pumping unit can deliver (i.e., set the drive speed to 30 Hz). Repair all leaks.
13. Fill the pipes completely with water. Air is compressible and partially filled pipes or instruments may lead to inaccurate measurements.
Bleeding the pressure gauge
14. Before bleeding the pressure gauge, be sure to tighten it correctly on a strut.
15. Make sure the pressure gauge is connected with a length of flexible tubing to the port, on the system, where you want to measure the pressure. This length of tubing is the impulse line.
16. To purge air from the impulse line and from the gauge, connect a small length of flexible tubing to the other port of the gauge; leave the other end of this tubing in a container. When the pump is running, the pressure in the pipe should be sufficient to allow water to flow into the impulse line and exit into the container. The water flow should expel air from the impulse line and the gauge.
Measuring pressure with a pressure gauge
17. Once the bleeding is done, remove the tubing open to atmosphere (the one going into the container). The impulse line and the pressure gauge should both be completely filled with water.
18. Make sure there is no water flow in the system either by turning the pump off or by closing the control valve.
19. Adjust the zero of the pressure gauge and set the desired units. Do not move the pressure gauge, or the impulse line, once the zero is adjusted. Moving the pressure gauge vertically influences the zero.
20. The pressure gauge should read 0 kPa (0 psi) when there is no water flow in the system pipes.
21. Set the pump to 50% of its maximum speed and wait for the pressure reading to stabilize. Record the pressure reading below.
About 45 kPa (6.5 psi).
22. Stop the pump.
Ex. 3-1 – Pressure Measurement Procedure
38 © Festo Didactic 86005-10
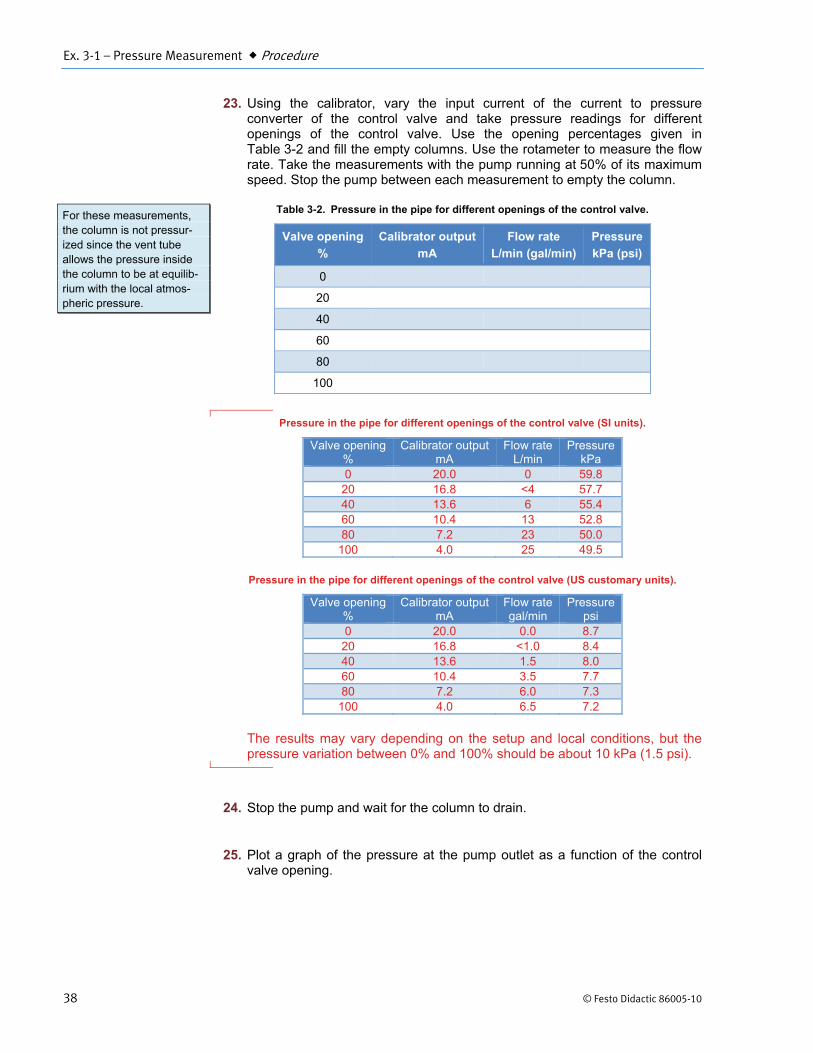
23. Using the calibrator, vary the input current of the current to pressure converter of the control valve and take pressure readings for different openings of the control valve. Use the opening percentages given in Table 3-2 and fill the empty columns. Use the rotameter to measure the flow rate. Take the measurements with the pump running at 50% of its maximum speed. Stop the pump between each measurement to empty the column.
Table 3-2. Pressure in the pipe for different openings of the control valve.
Valve opening %
Calibrator output mA
Flow rate L/min (gal/min)
Pressure kPa (psi)
0
20
40
60
80
100
Pressure in the pipe for different openings of the control valve (SI units).
Valve opening %
Calibrator output mA
Flow rate L/min
Pressure kPa
0 20.0 0 59.8 20 16.8 <4 57.7 40 13.6 6 55.4 60 10.4 13 52.8 80 7.2 23 50.0
100 4.0 25 49.5
Pressure in the pipe for different openings of the control valve (US customary units).
Valve opening %
Calibrator output mA
Flow rate gal/min
Pressure psi
0 20.0 0.0 8.7 20 16.8 <1.0 8.4 40 13.6 1.5 8.0 60 10.4 3.5 7.7 80 7.2 6.0 7.3
100 4.0 6.5 7.2
The results may vary depending on the setup and local conditions, but the pressure variation between 0% and 100% should be about 10 kPa (1.5 psi).
24. Stop the pump and wait for the column to drain.
25. Plot a graph of the pressure at the pump outlet as a function of the control valve opening.
For these measurements, the column is not pressur-ized since the vent tube allows the pressure inside the column to be at equilib-rium with the local atmos-pheric pressure.
Ex. 3-1 – Pressure Measurement Procedure
© Festo Didactic 86005-10 39
Measuring the air pressure in a pressurized column
26. To measure the air pressure at the top of the column, you must purge water out of the impulse line and the pressure gauge. To do so, connect a small length of flexible tubing to one of the gauge pressure ports; leave the other end of this tubing in a container.
27. Adjust the air pressure at the 0-200 kPa (0-30 psi) outlet of the pneumatic unit to 0 kPa (0 psi) and disconnect the control valve.
28. Connect the other pressure port of the gauge to the 0-200 kPa (0-30 psi) outlet of the pneumatic unit and gradually increase the air pressure to expel water from the impulse line.
29. Once the pressure gauge impulse line is free of water, connect the pressure gauge to the pressure port at the top of the column and adjust the zero of the pressure gauge. The column is at atmospheric pressure because of the vent tube.
40
45
50
55
60
0 20 40 60 80 100
Pres
sure
(kPa
)Valve opening (%)
7.0
7.5
8.0
8.5
9.0
0 20 40 60 80 100
Pres
sure
(psi
)
Valve opening (%)
Ex. 3-1 – Pressure Measurement Procedure
40 © Festo Didactic 86005-10
30. Reconnect the control valve to the 0-200 kPa (0-30 psi) outlet of the pneumatic unit. Make sure the air pressure to the control valve is about 170 kPa (25 psi).
31. Remove the vent tube and put a cap on the column connector (this will allow pressure to build in the column when you turn the pump on).
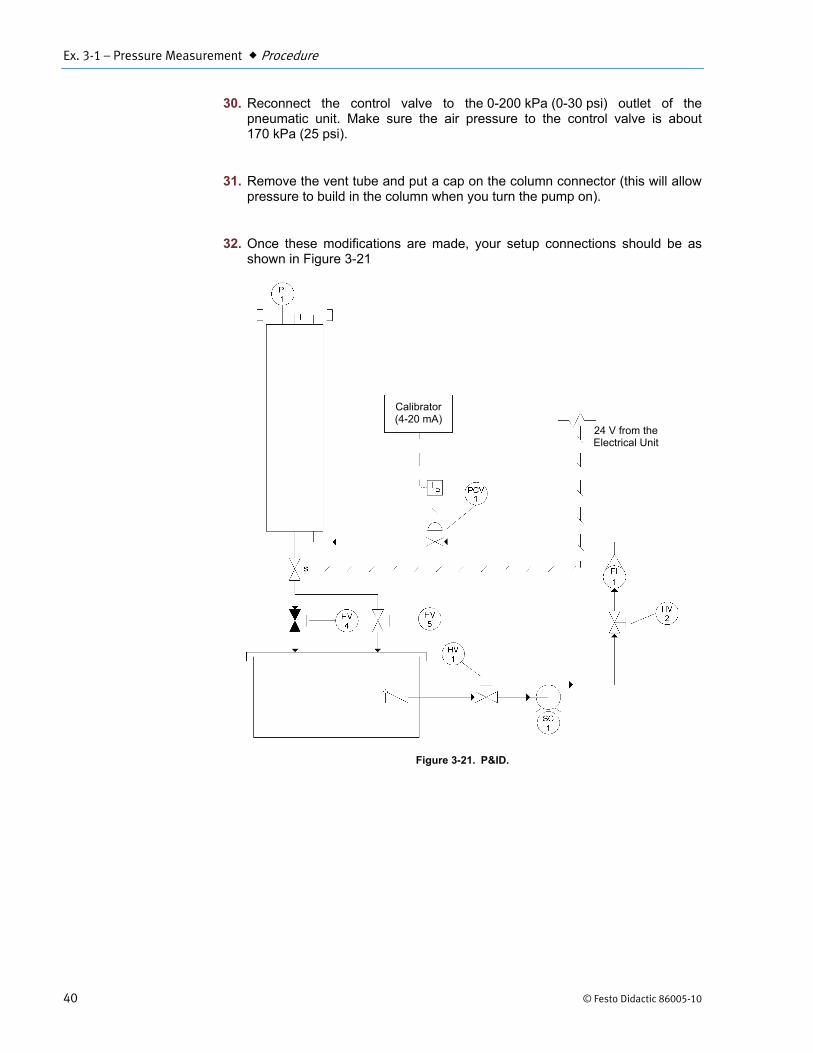
32. Once these modifications are made, your setup connections should be as shown in Figure 3-21
Figure 3-21. P&ID.
Calibrator (4-20 mA)
24 V from theElectrical Unit
Ex. 3-1 – Pressure Measurement Procedure
© Festo Didactic 86005-10 41
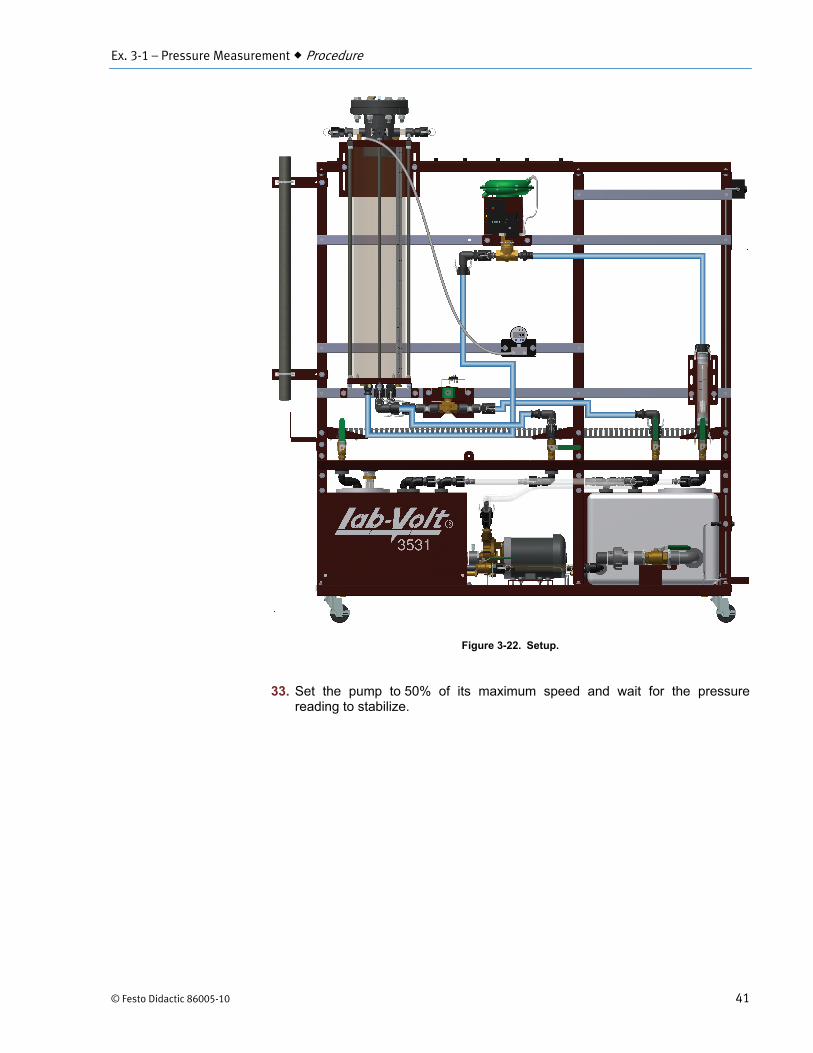
Figure 3-22. Setup.
33. Set the pump to 50% of its maximum speed and wait for the pressure reading to stabilize.
Ex. 3-1 – Pressure Measurement Procedure
42 © Festo Didactic 86005-10
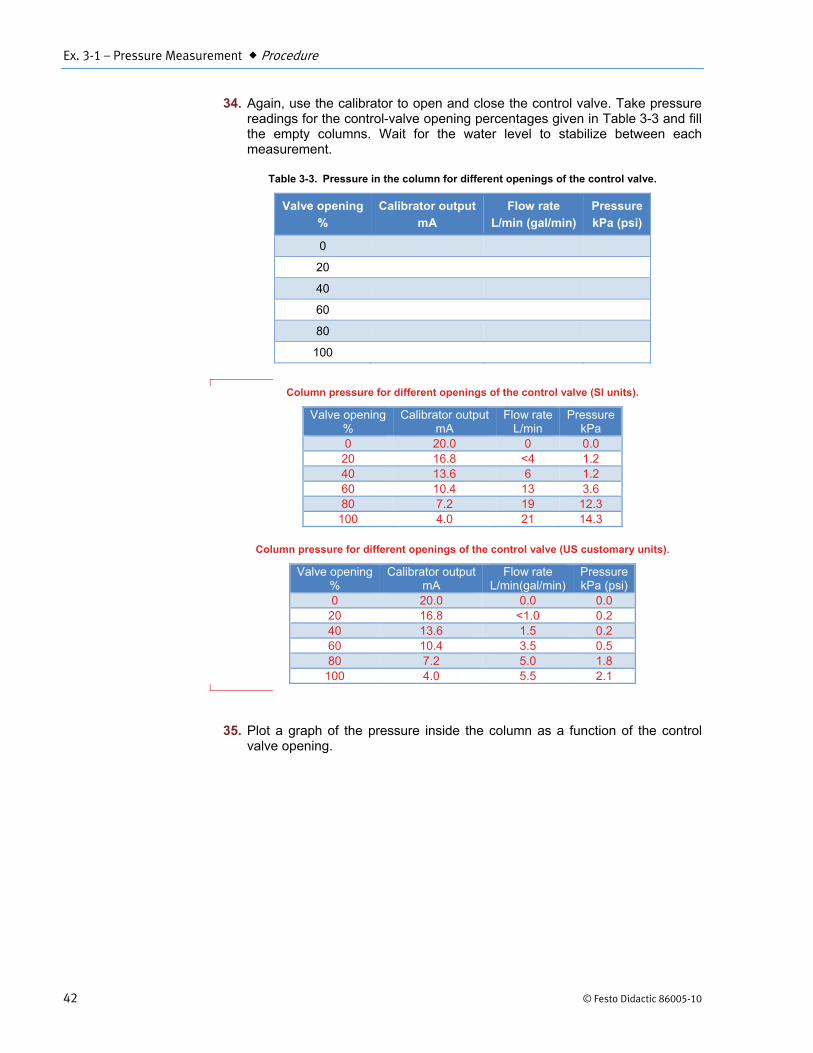
34. Again, use the calibrator to open and close the control valve. Take pressure readings for the control-valve opening percentages given in Table 3-3 and fill the empty columns. Wait for the water level to stabilize between each measurement.
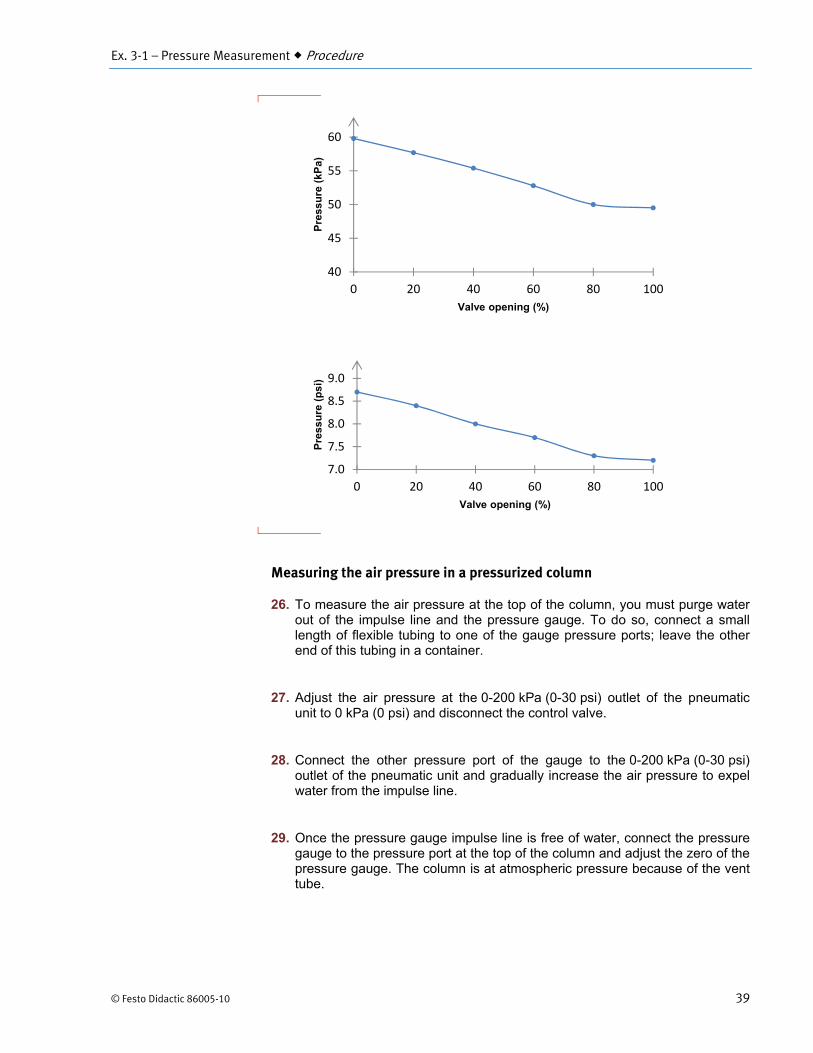
Table 3-3. Pressure in the column for different openings of the control valve.
Valve opening %
Calibrator output mA
Flow rate L/min (gal/min)
Pressure kPa (psi)
0
20
40
60
80
100
Column pressure for different openings of the control valve (SI units).
Valve opening %
Calibrator output mA
Flow rate L/min
Pressure kPa
0 20.0 0 0.0 20 16.8 <4 1.2 40 13.6 6 1.2 60 10.4 13 3.6 80 7.2 19 12.3
100 4.0 21 14.3
Column pressure for different openings of the control valve (US customary units).
Valve opening %
Calibrator output mA
Flow rate L/min(gal/min)
Pressure kPa (psi)
0 20.0 0.0 0.0 20 16.8 <1.0 0.2 40 13.6 1.5 0.2 60 10.4 3.5 0.5 80 7.2 5.0 1.8
100 4.0 5.5 2.1
35. Plot a graph of the pressure inside the column as a function of the control valve opening.
Ex. 3-1 – Pressure Measurement Procedure
© Festo Didactic 86005-10 43
The differential-pressure transmitter
36. A differential-pressure transmitter measures the pressure difference between the local atmospheric pressure and the measured pressure like a simple pressure gauge. Nevertheless, it can also measure the pressure difference between any two pressure measurement points. A differential-pressure transmitter has two pressure ports: a high-pressure port and a low-pressure port. The output of the transmitter is the pressure differential between these two ports. If both ports are in contact with the process fluid, both the high and the low-pressure sides of the differential-pressure transmitter require bleeding.
37. In the steps below, you will use the differential-pressure transmitter to measure the pressure differential between the air pressure at the top of the column and the pressure at the bottom of the column. First, install the differential-pressure transmitter on the instrumentation pipe. The transmitter must be installed below the column.
a Be sure to use the differential-pressure transmitter, Model 46920. This differential-pressure transmitter has a high-pressure range.
0.02.04.06.08.0
10.012.014.0
0 20 40 60 80 100
Pres
sure
(kPa
)Valve opening (%)
0.0
0.5
1.0
1.5
2.0
0 20 40 60 80 100
Pres
sure
psi
)
Valve opening (%)
Ex. 3-1 – Pressure Measurement Procedure
44 © Festo Didactic 86005-10
38. Connect the high-pressure port of the differential-pressure transmitter to the pressure port at the bottom of the column.
39. If the pressure gauge used previously is still connected, remove its impulse line and connect the low-pressure port of the differential-pressure transmitter to the top of the column. Figure 3-23 shows the piping and instrumentation diagram for this setup.
Figure 3-23. P&ID.
Calibrator (4-20 mA)
24 V from the Electrical Unit
Ex. 3-1 – Pressure Measurement Procedure
© Festo Didactic 86005-10 45
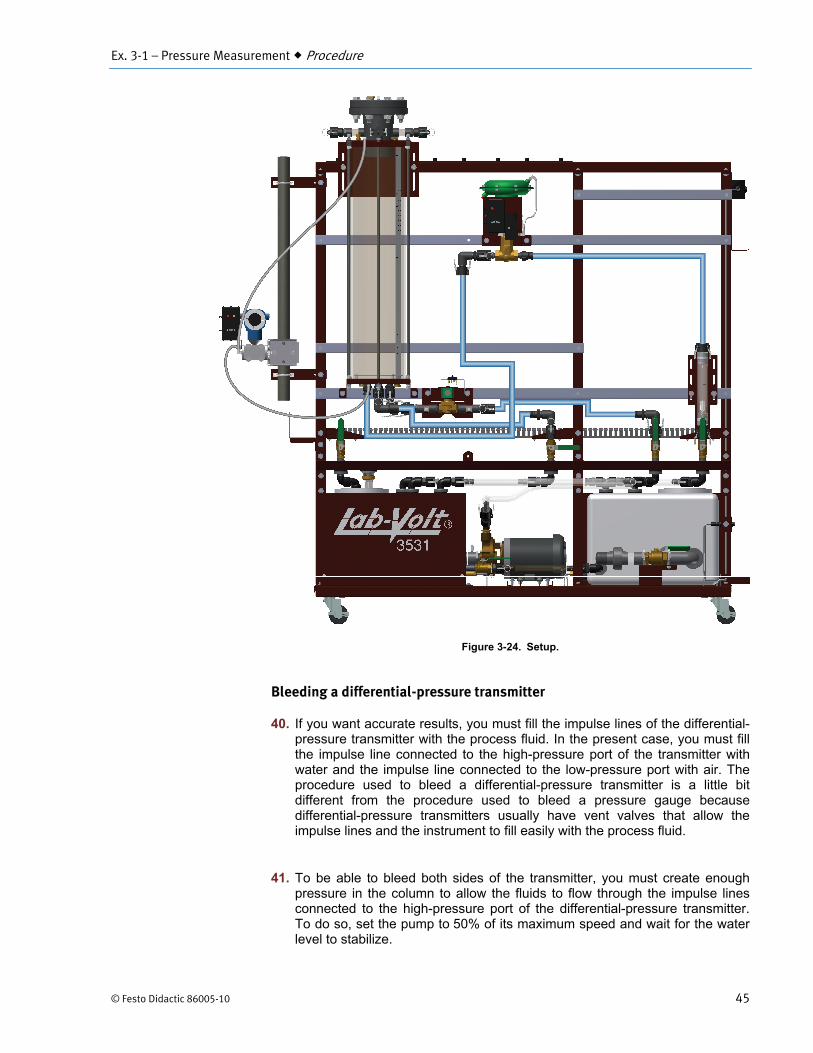
Figure 3-24. Setup.
Bleeding a differential-pressure transmitter
40. If you want accurate results, you must fill the impulse lines of the differential-pressure transmitter with the process fluid. In the present case, you must fill the impulse line connected to the high-pressure port of the transmitter with water and the impulse line connected to the low-pressure port with air. The procedure used to bleed a differential-pressure transmitter is a little bit different from the procedure used to bleed a pressure gauge because differential-pressure transmitters usually have vent valves that allow the impulse lines and the instrument to fill easily with the process fluid.
41. To be able to bleed both sides of the transmitter, you must create enough pressure in the column to allow the fluids to flow through the impulse lines connected to the high-pressure port of the differential-pressure transmitter. To do so, set the pump to 50% of its maximum speed and wait for the water level to stabilize.
Ex. 3-1 – Pressure Measurement Procedure
46 © Festo Didactic 86005-10
42. Use a wrench to loosen the vent valves of the differential-pressure transmitter. The pressure in the column allows water to flow through the impulse line and into the high-pressure side of the differential-pressure transmitter. Be careful: water will exit the differential-pressure transmitter via the vent valve. The air pressure in the column allows any water remaining in the impulse line or in the low-pressure side of the transmitter to be expelled.
43. Once the high-pressure and low-pressure sides of the transmitter are filled with water and air respectively, tighten both vent valves.
44. Stop the pump and let the column drain. Open HV4 if required.
45. Remove the cap from one connector at the top of the column to allow the pressure inside the column to be at equilibrium with the local atmospheric pressure. You are now ready to configure the differential-pressure transmitter.
Measuring differential pressure using a differential-pressure transmitter
46. Configure the differential-pressure transmitter so that it gives readings in the desired units. Refer to the Familiarization with the Training System manual for details on the configuration of the differential-pressure transmitter.
47. Adjust the zero of the differential-pressure transmitter so that it gives a differential pressure of 0 kPa (0 psi) when the column is empty.
48. Put the cap removed at step 45 back on the connector.
49. Set the pump to 75% of its maximum speed.
50. Use the calibrator to open and close the control valve. Take pressure readings for the control valve opening percentages given in Table 3-3 and fill the empty columns. Wait for the water level to stabilize between each reading.
Table 3-4. Pressure at the bottom of the column for different openings of the control valve.
Valve opening %
Calibrator output mA
Flow rate L/min (gal/min)
Pressure kPa (psi)
0
20
40
60
80
100

Ex. 3-1 – Pressure Measurement Procedure
© Festo Didactic 86005-10 47
Pressure at the bottom of the column (SI units).
Valve opening %
Calibrator output mA
Flow rate L/min
Pressure kPa
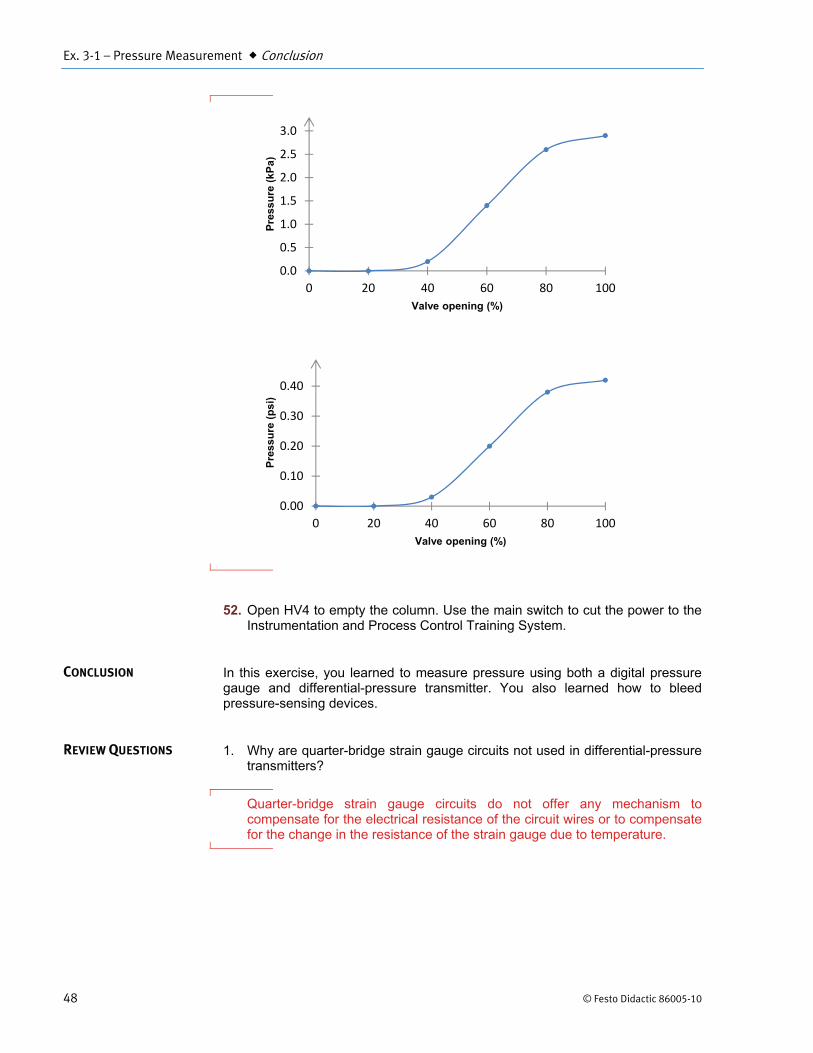
0 20.0 0 0.0 20 16.8 0 0.0 40 13.6 10 0.2 60 10.4 21 1.4 80 7.2 30 2.6
100 4.0 32 2.9
Pressure at the bottom of the column (US customary units).
Valve opening %
Calibrator output mA
Flow rate L/min(gal/min)
Pressure kPa (psi)
0 20.0 0.0 0.00 20 16.8 0.0 0.00 40 13.6 2.5 0.03 60 10.4 5.5 0.20 80 7.2 8.0 0.38
100 4.0 8.5 0.42
51. Plot a graph of the pressure differential as a function of the control valve opening.
Ex. 3-1 – Pressure Measurement Conclusion
48 © Festo Didactic 86005-10
52. Open HV4 to empty the column. Use the main switch to cut the power to the Instrumentation and Process Control Training System.
In this exercise, you learned to measure pressure using both a digital pressure gauge and differential-pressure transmitter. You also learned how to bleed pressure-sensing devices.
1. Why are quarter-bridge strain gauge circuits not used in differential-pressure transmitters?
Quarter-bridge strain gauge circuits do not offer any mechanism to compensate for the electrical resistance of the circuit wires or to compensate for the change in the resistance of the strain gauge due to temperature.
0.0
0.5
1.0
1.5
2.0
2.5
3.0
0 20 40 60 80 100Pr
essu
re (k
Pa)
Valve opening (%)
0.00
0.10
0.20
0.30
0.40
0 20 40 60 80 100
Pres
sure
(psi
)
Valve opening (%)
CONCLUSION
REVIEW QUESTIONS
Ex. 3-1 – Pressure Measurement Review Questions
© Festo Didactic 86005-10 49
2. Why does moving the impulse line of a pressure-sensing device influence the pressure reading?
The fluid in the impulse line exerts a pressure on the diaphragm of the device. If the impulse line is elevated or lowered, the pressure due to the weight of the fluid changes and this causes a shift of the zero of the device.
3. Why do you need to bleed pressure-sensing devices?
If air is trapped in the impulse line or in the pressure-sensing device, it will compress under pressure and small variations of pressure may become undetectable. This may also cause signal dampening.
4. What is a pressure loss?
It is a reduction in the pressure after a component or after a length of pipe.
5. What type of device is a rotameter?
A flow measurement device.

© Festo Didactic 86005-10 183
Bibliography
Bird, R. Byron, Stewart, W.E, and Lightfoot, E.N. Transport Phenomena, New York: John Wiley & Sons, 1960, ISBN 0-471-07392-X.
Chau, P. C. Process Control: A First Course with MATLAB, Cambridge University Press, 2002, ISBN 0-521-00255-9.
Coughanowr, D.R. Process Systems Analysis and Control, Second Edition, New York: McGraw-Hill Inc., 1991, ISBN 0-07-013212-7.
Liptak, B.G. Instrument Engineers' Handbook: Process Control, Third Edition, Pennsylvania, Chilton Book Company, 1995, ISBN 0-8019-8542-1.
Liptak, B.G. Instrument Engineers' Handbook: Process Measurement and Analysis, Third Edition, Pennsylvania, Chilton Book Company, 1995, ISBN 0-8019-8197-2.
Luyben, M. L., and Luyben, W. L. Essentials of Process Control, McGraw-Hill Inc., 1997, ISBN 0-07-039172-6.
Luyben, W.L. Process Modeling, Simulation and Control for Chemical Engineers, Second Edition, New York: McGraw-Hill Inc., 1990, ISBN 0-07-100793-8.
McMillan, G.K. and Cameron, R.A. Advanced pH Measurement and Control, Third Edition, NC: ISA, 2005, ISBN 0-07-100793-8.
McMillan, G. K. Good Tuning: A Pocket Guide, ISA - The Instrumentation, Systems, and Automation Society, 2000, ISBN 1-55617-726-7.
McMillan, G. K. Process/Industrial Instruments and Controls Handbook, Fifth Edition, New York: McGraw-Hill Inc., 1999, ISBN 0-07-012582-1.
Perry, R.H. and Green, D. Perry's Chemical Engineers' Handbook, Sixth Edition, New York: McGraw-Hill Inc., 1984, ISBN 0-07-049479-7.
Raman, R. Chemical Process Computation, New-York: Elsevier applied science ltd, 1985, ISBN 0-85334-341-1.
Ranade, V. V. Computational Flow Modeling for Chemical Reactor Engineering, California: Academic Press, 2002, ISBN 0-12-576960-1.
Shinskey, G.F. Process Control Systems, Third Edition, New York: McGraw-Hill Inc., 1988, ISBN 978-0070569034.
Smith, Carlos A. Automated Continuous Process Control, John Wiley & Sons, Inc., New York 2002, ISBN 0-471-21578-3.
Soares, C. Process Engineering Equipment Handbook, McGraw-Hill Inc., 2002, ISBN 0-07-059614-X.
Weast, R.C. CRC Handbook of Chemistry and Physics, 1st Student Edition, Florida: CRC Press, 1988, ISBN 0-4893-0740-6.