Embed Size (px)
Citation preview
DOCUMENT RESUME
ED 138 466 SE 022 433
AUTHOR Torrence, David It:°TITLE The Television Test of Science Processes.PUB DATE Aug 76 .
NOTE 242p.;.Ed.D. Dissertation, Pennsylvania StateUniversity; Not-available in hard copy due.tomarginal legibility of original document
EDRS PRICE .MP-$0.83 Plus.Postage. HC Not,Available:from ELRS.DESCRIPTORS Doctoral,Theses; Educational Research;-*Educational
Television; *Evaluation; Measurement:Instrumentsr*Process Educat;.*Science_EducatiOn4-*Secondar/Education; Secondiry:School'Science; Television.Curriculus; *Test Construction; Tests
IDENTIFIERS .2esearch Reports
..RDSTRACT. . The objeCiives of this study were:to.modify the Tsist-
of ScienCe Processes (Tannenbaum, 1968) for use:by intermediate levelstudents, and to adapt-this test'Ior use:thrOugh the.:medium.oftelevision. The reSultant instruMent, thelTelevision Test.of Science:ProceSses, was developed and tested for content.validity,Appropriate-/readability, internal.reliability, criterion related validity throughcorrelation with similar instruments, And porming.,t1tensive.appendices illUst.rating draft instriments, statistical.resuIts, andevaluation materials are provided. my
).
************it*********************************************************** Documents acquired by ERIC indlude many informal unpublished *-
* materials not available from other sources. ERIC makes every effort *--*-to-obtain -the best copy available. Nevertheless, items of earginal *
* 'reproducibility are often encountered and this affects the quality ** of lAma microfiche and hardcopy reproductions-ERIC sakes available -*---* via the ERIC Docment Reproduction Service (EDRS)..EDRS is not *.
* responsible for the quality of the original document. Reproductions ** supplied by EMS are the best that can be made from the original. *************************************************#**********************
U S DEPA^TMENT OF HEALTHEDUCATION IL WELFARENATIONAI:INSTITUTE OF
EDUCATION
THIS DOCUMENT HAS BEEN REPRO-DUCED EXACTLY AS RECEIVED FROMTHE PERSON OR ORGANIZATION ORIGINATING IT POINTS OF VIEW OR OPINIONSSTA.TED DO NOT NECESSARILY REPRE-SENT OFFICIAL NATIONAL INSTITUTE OFEDUCATION POSITION OR POLICY
1.1
The Television Test of Science Processes
by David R. Torrence
0.
The Pennsylvania State University
The Graduate School
Division of Academic Curriculum apd Instruction
The Television Test of Science Processes
Date Approved:
ci ct 7 I,
Academic Curriculum and Instruction
by
David R. Torrence
Submitted in Partial Fulfillment'of :the Requirements -7
.for the.Degree.of
Doctor of Education
August 1976
SigriatorieS:
ecL4.i .
PaUl W. Welliver, Professor ofEducationThesis Advisor
Az? /,794 ea-tzL &l_te_en..e.e-0Q4-Carol A. Cartwright 4%IA Charge of Graduate Programs .
Diviskon of Academic Curriculumand Instruction
AMOWLEDGEMENTS
.1
.Grateful appreciation is extended' to Dr, Paul W. Welliver,..
pro, gram directorand the members of the_Sciente.for:the Seventies
committeewho fostered my inclusion and participation in this
exciting and worthwhile educational resource. Inclusive of the
SFTS recognition is Dr. Dorothy-Alfke, M. Gary Perdue and the
,participating staff of television station WPSX-TV, and the
ii
participating sPecialista of.the PennsylVania Department of EduCation..
Special thanks is'Aue to the members of my doctoral committee:
1
Dt, Dr.Robert L. ShrigleY, Dr: Michael Szabo. Partitular
appreciation is given to Dr. Dennis Roberts, my minor advisor, whose4
statistical knowledge and able guidance facilitated my completing
this study.. Each membei contributed gignificantly to my personal
and professiOnaf growth.
Special thanks is also due t9tDr. Douglas MazBeth, Science,
Coordinator foi the Lewisburg Area Public Schools, whose help in
gathering validity data was of paramount importance.
,
xy greatest thanks is given My dear wife whose contributiOn
. consisted of tolerance, encouragement, and help. Her experienceand.
training as a reading speCialist and an elementary school teacher
.gave an added dimension to her valuable input'.
A note of thanks°is given the many unnaMed people who contributed
toward the succesa of this.study. Over 3500.students and over 100
teachers and administrators throughout.the Commonwealth,of Pennsylvania
have helped to bring thIs project to fruition.
a
5
;
iv
TABLE op CONTENTS
:Page.
CKNOWLEDGEMENTS ......... .0. .... . .. Ai-
LIST:OF TiBLES
LIST OF FIGURES
vi
vii
CHAPTER-I:. INTRODUCTIONBackgroundStatement of the Problem '4
:AAiumPtiOns, 5
Importance of the Project 6
Definition of Terms,
6.
CHAPTER II: REVIEW OF.RELATED LITERATUREIntroduction 8
The Valueof Teadhing Science Process 9
Degining Science Process 13
Tests of Science Processes -16
Television Testing 28-
Summary 34
')
CHAPTER PROCEDURE-OF THE STUDYIntroduction 36
Establishing Face ValiditY 36
jteadabilitY Cons.iderations . 37
TeleVision Preductipn.of th0 Test.IUstrument 40
°Item-Response-Time,.-
Item AnalYsis42
44Norming- 45
Reliability- 47Validity 47
CHAPTER IV: RESULTSIntroduction 50Establishing Content Validity 50Readability'Corisiderations 51
Television Production of the Test Instrument , 52-Item-Response-Time 53Item Analysis. 53Norming7 55Reliability . - 58
Validity 59
--
TER V: SUMMARY AND CONCLUSIONSIntroductionSummaryConclusionsLimitations of the StudyRecommendations.for Further Research
BIBLIOGRAPHY
PENDIX A LETTER.OF RELEASE
Pa e
'63:
68:69
70
73
79
APPENDIX B: AgRIDGED SUMMARY OF THE' PROCESSES AND 10EIRRESPECTIVE BEHAVIORS 81
APPENDIX C: SCORING KEY FOR THE TEST OF SCIENCE PROCESSES 87
APPENDIX D: CREDENTIALS OF PANEL OF JUDGES 92
APPENDIX E: COMPUTER PRINTOUT ip SYNTACTIC DENSITY SCORE 95.
'APPENDIX F: DISPLAY OF VfSUALS USED IN THE TELEVISION TEST 0FSCIENOE PROCESSES, N)RM
'APPENDIX G: SCRIPT FOR INTRODUCTION AND SIGN-OFF.. .. .115
s,
. APPENDIX H: TELEVISION TEST OF SCIENCE PROCESSES, FORM A AND B. 119
APPENDIX,I: TELEVISION TEST OF SCIENCE PROCESSES, FORM C 135
APPENDIX J: COMPUTER PRINTOUT OF ITEM ANALYSIS OF PILOT TEST. 150
102'
APPENDIX K COMPUTERTRINTOUT OF ITEM.-ANALYSIS, TABLE OF',EQUIVALENTS, AND FREOUFNCY DISTRIBUTION OF'THE NCRMING:;
, SAMPLE
APPENDIX L: COUPUTER PRINTOUT OF THE ITEM ANALYSIS, TABLE-OFEQUIVALENTS, AND FREQUENCY DISTRIBUTION OF THE VALIDITYSAMPLE... ... 163............ ....... OOO OOOOOOOOOOOOOO . OOOOO
155
PENDIX M: COMPUTER PRINTOUT OF THE STATISTICAL PACKAGEPROGRAM OF THE VALIDITY SAMPLE ON FIFTEEN SELECTEDVARIABLES 168
PENDIX N: DISCUSSION OF ADDITIONAL FINDINGS' 181
PENDIX 0: COMPUTER PRINTOUT OF iHE STATISTICAL PACKAGEPROGRAM OF THE VALIDITY SAMPLE ON TEN SELECTEDVARIABLES
7189
-
-7Table
LIST OF TABLEE
Page
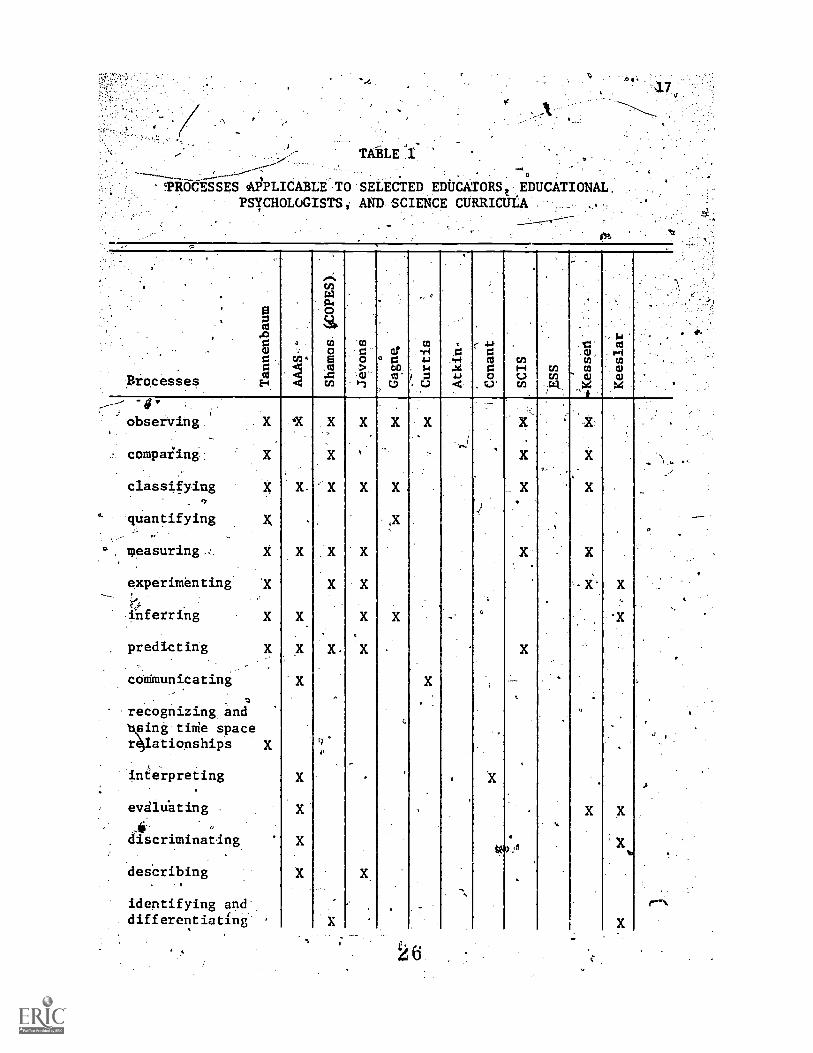
1 Processes Applicable to Selected Educators,-Educational Psychologists, and Science Curricula 17
Test of Science Processes°Total Score ReliabilityCoefficients 27
-
Science Process Tests ;Atli Associated Grade Level,Reliability and Numbei. in Norming Population 28
Summary Information of School Districts Participating-fl inNorming Sample 46'
5 ..Test.of Science Processes' Questions Identified asApplicable for'Inclusion in the TTSP 51
Summary of Time in Seconds Allocated-for Eacb Itemi
SUmMary of Item Analysis 56
Table of Equivalents and Frequency DiStiribution ofthe Norming Sample .' 57
Statistics for the Norming Sample on the TTSP,Form C % 59
, _v
lo Statistics for the'Validity Sample on the.TTSP,-Form C
I.
11 Summary of PPMC of Fifteen Variables ,.. 61
12 Principle Components Factor Analysis for'Factor One.... -
184
60
-13 . The Rotated Matrix of Factor Loadings of TenVariables 187
a
4
LIST OF FI-GURES
vii
Page.
1 Geoiraphicai Distribution of'Participating-SchoolDistricts and Sdhools in the Norming Population ... . . 48
.
4Z)
- C.
A
gitaria 'I
ilurinuthe past-several'yearsocientists:and sCience eduqators:
ve:expressed-a hegd tO'dmphasize..the priicesses Of icience.a.S unique
'coequalwith-the prOduct Or content of science: ;.
.. .
'1.6*e-curricula have incorporated.science PrOcesses
oritY.
In,1968, the PennsYlvania Department Of,Educat
teaChing
_(PDE),.embarked
-...oh a êtatewide thru§t.to assist elementariteahers in a.trandition:
iato Some of the newer methods of teaching scienCe. This effort waa
:called Sciende for the, Seventies (PDE, 197.1).. In 1972, The
Pennsylvania State University and PDE_devided-a system for using
instructional television as a.major resource in the dissemination
and implementation of Science-for the Seventies (SFTS)'
loeelementary.
'school.clissroops throughout Pennsylvania. (Shrigleg, Alfke, Szabo,
:and Welliver, 1975) .
It-encompaiSes a teacher's guide.which deals with.the,pedagogy-,%
of contemporary elementary science education, a growing set of primary-.
and intermediate grade science lessons, ten fifteen-minute televised
1
PrograMS for usevith primary grade stuflents,": ten -twentY,rminute
-
.
..-ieleviSed'Programs for use withintermediate:level students, rve.
.
-.1.n.77service televised..programs to'bel0.teachers Use Handboo 0-
:
or Teachers which provides an orientation and instructidhs'in the use
1 0
:Ji.f de reSouree (PDE, 1975). The ftirictiqn Of-SFTS,in :the science.
. .
curriculum is emmpariied as having aft fcllowing,rOle:. .
NTS, including both'the TVcotnponentè and'the printed .
materials, is not-a K-6 sciencecurriculurather, itip a resource.forteaChers. -The philOsoM of-SFTS is 4P. .
compalible with such.inquiry'pro-grems,as SCIS, tSS,and. S-APA. Therefore, SFTScould serve as either a .
bridge o%&supplement to,arly of the three.programs-mentiOnecM'' , . . *
Secondly, SFTS.could-be the model.around which.adchool district could-build,sover ihe yeaiST,inquiry-type science curr4culum.. .This.would meanadding many lessda comgonente to the 25 published-by 'PDE.
Thirdly, SFTS could be ihe inquiry component to a.conceptually oriented sctence curriculum. Teacherscould pick and choose those lessons that reinforcean already established curricaum..
24
Fourthly, the SFTS tapes and the accompanying less'ons,plus SFT5 lessons published but not placed on .tape,
,comprise,enough materials to provide_a four-month '
springbbard to science foi ftew primary grade teeZhersin a school district.- Or a'school district having noongoinggscience curriclym might introduce all of-it&primary teachers (and perhaps intermediate teachets)
I(
and pupils to investigate science teadbing through tfiefour-montbSFTS resource. (Shrigley, et al., 1975, p. )501)
One of.the stated objectives Of this.statewide ITV resource
empbasizes science processes:-/
Following-the,btoadcasting of grlfs oriented tele-vised lessons; children in-participating%.class-,
,
_rooms will exhibit a meagurably significanc increasein their fafility in the use of science processes.(SFTS Phase I Project Report, 1974, p. 21)
Relative to the.above tdrminal performance objective, tentative
projected perforthance-measure was drafted:
r
00
'.
le!: televised test will Yeveal increased studentcompetency 4.n the use of science processes andattainment of aips and objectives 2.f SFTS.(SFTS Phase I Project Report., 1974v p. 24)
-
Several tests have been developed to assgs the acquisition of
7
-those.skillS andabiliiies oollectiVely desCribed as science protess..r '
_Some of the tests are the, S-APA (Science A Process Approach),. 4
_Science,Process instrument (SRI), American7-AssötiatiOn.fOr the
-
Advancement of Science, 1970; the Processes of Science Test,
. Biological Science Curriculum Study, 19.62\; The-Sciente Process Test. \
.CTOT),Iudeman; 1974; the Science'Observationand Comparison Test
(SOCT), Hungerford and Miles, 1969; the Sciente Test lorbialuation of
.4" '
Process Skills (STEPS), Morgan, 1971; the-Test of ScienCe Processes (TSP ).,7 1 a.
J....jannepbaum 1968; and'theScieuce test Of the Comprehgnsive Tests of-
Basit-S ills (CTBS), McGraW-Hill 1973.C . 4 .
0.
()nee the decision to use a test of science processes to gathe'r data. :-.
, ke ' . ..
.about intermediate grade school children in Pennsylvadia was made' by. ,
-members of the Science.for-tha'sevetties C
,
Ommittee, several tests were.-..
,investigated for possible uSt. No test'reviewea iossessed the
..
. . Q. ..
,
combined requirements-of being valid for use by inteimediate level,%
. ,
student's and for use via the television medium. Howeveri the availgble
testi purporting to measure science procegses, the Test of Science
\ProcegseS(Tannenbaum-, 1968) was jagedto be adaptable for intermediate7,.. -
grade uSe,becauSe it waS an instrument at leaseposSessing contentq 7
validity. (See Appendix A kor letter of release.) Also the processes
categorized as subtests by the author encompassed most of the ,processes
1;2
listed by science.educators. Most applicable to the SFTS objectives
was its visual presentation mode which had implication for the
televisiorr format. A television format has ,the advantage of .
providing repetition, clarification, atd motion cues to the
qUestioning procedure. There were two xeasons why the Test of-Science
ProCesses in its original form.was not approPriate for.use as th'e assess- .
ment instruMent for the SFTS: (1).the teat was designed for junio high
school level, and (2) it was designed for 2x2 35mm slide presentation\'
,,-
StateMent of the Problem
(lc-4ecause television is. a.major 'component of the.SFTS res urce, it
was logical for a test to be produced in the came medium. A 71evisioqc
test would compliment the total SFTS television packa.ge, would`provide. \
a free testing resource to teachers and administratorg and would
provide uniformity in test admin!.stration. Television provides theI
- least expensive delivery system for.the presentation of the visuals
required in the testing situatiOn.
There are two aspects to the problem investigated in this study.
, (
First, could the Test of Science,Processes 'be modified for use by
intermediate level students; and second, could the TSP be adapted
for use through the medium of television? The adaptation of an
ftkisting instrument involved a replication of the steps used to create
the initial'instrument as well aa the,addition of several new steps
unique'to the eroductfon of the second instrument. These.steps were
. .to cerive coqtent validity, to produce the print and non-print
r
components, to establish the reliability through item analysis, to
empirically validate and to establish'norms.
Assumptions
. Certain assumption must be stated in order to justify the
modifications and adaptation of the Test of Science Processes.
Selection of item content as content valid process questions rests
on the assumptiOn that the TSP is' a reasonably reliable andyalid
. instrument for assessing achievemeni inrthe use of science processes
for Students in grades seven, eight and nine..*
Validation of the modified instrument, the Television Test of
Science Processes (TTSP), requires correlation with other instruments
purported to measure science processes. The tests used for this study
were The Science Process Test (Ludeman, 1974)nand the Comprehensive
Tests of Basic Skills, Test 9 (McGraw-Hill, 1973). A statement of
coneurrent valicity Js built on the assumption that The Science
Process Test is a reasonably reliable and valid instrument which
assesses students' ability to use the integrated processes of inter-
preting data, controlling variables, formulating hypotheses and
defining operationally as defined by S-APA. A third assumption is
that.the science test of the Comprehensive Tests of Basic Skills is
a reliable and valid instrument which assesses student's ability to
investigate problems in science and, to a lesser degree, to recall4.
scientific facts or concepts.
1 4
ImPortance of
,
The TeleN
Science for tt
benefits: (l;
measure the ei
normative peri
(3) offer an
science proce!
In a mori
provides a us4
processes ava:
televised mo/
science teacb
education,
in elementary
for continuin;
-
television te
Definition of
EDP card
IBM' cards.
Syntacti
through the u
sentence cons
Process
scientlfic in
f the ProjectP
evision Test of Scieneerrocesses (TTSP), relative to the
the Seventies ITV resource, has several potential
1) rovide pretest entry data in an empirical studY to
effeciivenessof SFTS exposure, (2),,sUrvey general Student
rformance on science. processes On a statewide scale, and .
additional evaluative Instrument to assess mastery of
°
esses.
re general sense, production and validation of the TTSP
seful addition to the small number of tests of science
ailable to educators. The instrument is unique in its
Ciality. It should be a valuable resource for elemeniary
hers and administrators, researchers in elementary science,
nstructional developers working with television projects
y science, and should' provide a valuable source of data-
mg research in elementary science, process testing, and
.esting.
If Terms
ds -- Electronic Data Processing cards, commonly called
0
:ic Density -- a/method of generating a readability measure
use of a computer program that synthesizes phrase and
;struction.
-- the skill and cOmpetency required for systematic
Lnvestigation. 15
Lk
Product -- the content or body of cognitive knowledge of a
discipline.
Multiplexer system -- the hardware' used to enable a television
camera to receive images from several ,projeciion sources.
Cross-channel redundancy -- the presentation of identical'
information through the auditory and visual channels.
ft
16
7
CHAPTERII
REVIEW OF RELATED LITERAiURE
Introduction
This review of literature surveys those topics deemed most
relevant to the central elements of the profect. No attempt wAs'
thade,to review the literature relative to aspeets of the methodology
of teit construCtion. Tannenbaum's format for test development is
the "blueprint" or two dimentiorial matrix suggested by Travers (1950).
This aspect of the project is replicative in nature.
The present review is subdivided into five sections:* the.value
of teaching science processes, defining science processese tests of-
science.processes, the Test of Science Processes, And television
'testing. The first area of review explores the pedagogy relevant to
science processes. If the process is to be tested, a case must be'
built supportive of the process as a variable worthy of assessment.
The value of the testing instrument rests wholly on its ability to
contribute to the needs'of relevant educational problems. 'Ennis (1963)
suggests that process abilities require new approaches to testing.
A second area of review deals with the meaning of science,
processes. In order to test these processes, there must be general
agreement as to what constitutes these processes in total or in
discrete components. Certainly, content Validity can'be acceptable
to the academic community only to the extent that there is agreement
on what constitutes science processCs.
17
o'
A.third area iS a'review of tests of'science procesSes. The
rojetHgrewfromla need'fOr an intermediate.level science process'
.:test. 'A review of the eicisting instruments foUnd no-test instrument-..
4SpeCialiy suited-to the needs of SFTS.
A'fourth area is' a'review of the Test of Science Processes (TO).
ereasthiS instrument is central to thOTSPArLboth theory and
practice, an in-depth understanding of the rationale and methodolOp
of the TSP contributes to the data base underWing the entire projt.
The fifth area of review is television testing. A survey of
'television testing to date provides valuable ihput for presenting a
testing situation via. television.
The Value of Teaching Science Process
In rdcent years, science process as a discrete ,entity or as a
collection of unique and identifiable variables has become a subject
of mucNeducatIonal interest. Some scientists and educators have used
such terms as p blem solving, discovery learning, or inquiry to
characterize the science processes (NSEE, 1960; Kessen, 1964;
Blackwood, 1964). Regardless of Ole terminology used, an attempt tor-differentiate the two kinds of learning has been made; that of
"product" and "process." The distinction between the product and"the
process of_a discipline is stated as:
'The traditional aim of instructiOn has been know-ledge. -Psychological research into learning,however, has found the need to consciously developa system in the .learner whereby he can learn.This 'process' of learning, the skills and attitudes of
18
0
.0 .
fearning, has.cOme,to the forefront in modernedatational regearch.as a goal equally as impor-tant as the attainment of the desired knowledge "--the 'produr:t'. (Torrence, 1969, p. 12)
PIt is generally agreed that the introduction of science process
into the modern science curriculum is an innovation which has occurred
o
recently. Contrary to this belief, however, is an assertion made by
Harvey (1902) which expressed the belief that the procedure Of
investigation was the most significant contribution to education made
by science and that these procedures had additional value in being
able to be applied to other areas.of human activity.
Raskin (1956) and Rutherford (1964) have emphasized the under-
standing of the nature of science by stating that critical thinking,
problem Solving, discovery, inquiry, and other science processes
should be foremost in the teaching of science. Gruber (1962) states
that educators should allow the student m experience the science
processeS' in order to learn how sciencelnowledge is obtained. In
Gruber's view, instruction in the accumulation of facts would limit
intellectual develdpment and impair a, student's ability to solve
problems.
ivans (1953) advocated the teaching of science process as it is
related to science technique and knowledge. Separation of knowledge
and process would not only dilute the functional value of scientific
knowledge already established, but would inhibit the dissemination
of the science processes. Blackwood (1959) believed that students
ski4ed in the processes of science could become more scientific in
problem solving.
19
(1959). addresses the question o -what sCience educators':
lave.to:be theA)riMary objeCtives in-the:science
he objectiliea of science teaching Should logically
eminite from.- our operational 'def.init4.0Y0f.::s.cien0.
-If Science meana ptimarily organizedknOwledgej
the. learning :Of facts, concepts;',.and,:.ptinCiPlas
would...be- the majo'r..activity:with:14hich-:scietice
t eachers .and ' Student S, ought tO be: cOrieerned:..:If
.scienceinvolvea. the. acqUiSition:ofineelleCtual,',
-abilities' and _skills then teaching :and :learning
Situations .conducive- to :the attainient:
abilities and skills ' ought to éonstitutea maloTaspect of science teaching. ANelson,,p..20)..
--It,--can be argued that if emphasis is placed on the how and why in an
-1
.atmosphere-bf-iniluiry and' investigation; the-Studenta:Will then-be.
encouraged to develop idsoutcefulness In the solution of new ptoblems'.
confronting them outside the classroom.
'Tiaget has had a substantial impact on educators.T'PollOwing
.some of Piaget's comments in respect to the aims of education and
are
the importance.of teaching "process":.
The' goal in education is.not.to increase the-amountof knowledge,'but to.create the possibilities for a
.child to invent and isCover...__..:.the principal:goal
of education ia to create.men Who..are Capable ofdoing new things, not simply repeatint-what other-generations have done -- men who are creators,inventors, and discoverers. need pupils-who are active, who.learn early to find out bythemselves, partly by their own spontaneousactivity and prtly through materials we set up nrthem;.who learn early what is verifiable and what is /
simply the.first idea to come to.them.(Duckworth, 1964, pp. 174-175)
Tyler (1962) advocates the importance of the mastety and Use of
the science processes as tools which the individual uses thrOughoUt
his lifetime.in-order to "make sense" out of the universe:
20
If studentS are to understand science and contri-bute to its:intellectual development, they needto understand it aS a process of cOntinuing. dew
inquiry and reconstruCtion of knowledge. -..asciencecourse'becomes an intrbduction in 'teaminghow to learnt science, an effortto start thestudent on e.lifelong,endeavor to,,make sente out ofhis expeLence with the material'worla,.and theobservaions made of natural.phenbmena,'as well asenvironment. (Tyler, 1962.,..p. 24)
Bruner-(1961) also advocates the importance of teaching science
12
prOcess, but questions what shOul4 be taught in order.to gain the
best effecxs:
It is my hunch that it is only through theexercise of problem solving and the effort ofdiscovery that one learns the heuristics ofdiscovery, and the more one has practice, the'more one is likely to generalize what one haslearned into a style of problem solving orinquiry tl!at serves for any kind of.task one mayencounter -- or almbst any kind of task, ...whatis unclear is-whaf-kindS of training and teaching -'
produce the best effects. (Bruner, 1961, p. 31)
Bruner feels that learning specific skills of science.process is..0
not enough. There are certain attitudes whickone must posiess in
order to gain use of the science processes for application to other
problems that may be encountered:
...an understanding oi the formal aspects of inquiryis nbt sufficient. There appears to be, rather, aseri
seNNthi.
s of activities, some direbtly related to apartic ar subject and some of them fairly generalized,
ithat go 1-,1 inquiry and research. These have to dowith theprocess of trying tp find out something.(Ibid. p.'31) N.
NNN.
There is general agreemenc%aat_an emphasis on process should..:. .
i
be implemented in modern.curricufa-, 'This emphasis l's expressed by new\ \
1
N
Curricular Programs both in science and also in social stUdies.
:.14hile educators and learning theoristS areinagreement.on the
:Penefit of including process in the curriculum-either as coequal
'with content or to the exclusion of,tontent at the elementary level,
there appears to be basic differences in their perception of the
terM "processe
Defining Science Process
Many individuals have attempted to define science propesses. As
early as 1892, Jevons (1892) stated:
In every act of inference or scientific methodwe are engaged about a certain identity, same-ness, similarity, likeness, resemblance, analogy,equivalence or equality'apparent between twoobjects. (p. 1)
0Jevons characterized science processes as identity and diffe;ence,
..1
inference, inductive and deduqive reasoning, Me4surement,-observation,
experimentation, hypothesis, prediction, ana,classification.
Gagne (1968) defined science process as a highly complex set of
intellectual activities which Are analyzable into simpler activities
and which then may be learned. Processes are forms of information
processing; activities which are carried out in a quest for scientific
knowledge. Gagne believes,that in'oider to attain the capability of
enquiry, an individual needs to learn how to observe, how to figure,
how to measure, how to orient things in space, how to describe, how
to classify objects and events, how to infer, and how to make
14
-.:C'Onceptual models. If these Skills.are masteued, the individual-will
:)-Use them all his life.
tis (1966) described science processes as'tools'whiCh enable
man's:abilities of,observation, reasoning and bommunicatiOn to-be used.
emOhasized the applicability of these ProCesses to othernareas-of
endeavor. Atkin (1968) believed prdcess to be the same as problem
solving, scientific method, and inquiry. Conant (1953) defined the
, -'processes of science as activities, skills and tools ofPresearch whith
an individual may use in his investigations.
The American Association-for the Advancement of,Science (AAAS)
(1964) listed eight skills'and abilities as constituting the.stience
processes: (1) recognizing and ustng iime/space relatiOnships,
(2) recognizing and using number and number relationships,
(3) observing, (4) classifying; (5) measuring, (6) communicating,
(7) inferring, and (8) predicting. Shamoi (1966) characterizdd
science processes as including: (1) observation,,(2) classification, .
(3) measurement, (4) description, (5) comparison, (6) discrimination,
(7)-experimentation, (8) evaluation, (9) .interpretation, and
(10) prediction.
Keeslar (1945) compiled a list of ten major elements of the
''scientific method" from lists submitted by twenty-two scientists at
the University of Michigan. Tne.elements were: ,(1) sensing a problem,
(2) defining a problem, (3) determining-the facts and clues bearing
*upon the problem, (4) making tentative hypOtheses, (5) selecting \the
2 3
hYpOtheSiC1(6) planning an experiment td-test,the hytoo
Ytesting the.hypothesis, .(8) replicatinuthe,experiMetit for
etifiCatidni (9) making a Conclusion, and ,(10) making inferences:
oea,*1 conclusion.
JAkigan':-.(1969) defines processes of scienCe:aa "those. . ,... -
.:,.i.,cnipetencies necessary for deliberate and
inquiry (Hogan, 1969, p. 6).." MgLeod; Berkheimer, Fyffe
Bblinson (1975) say
...an Ability to°.use theprocessesteqUireadneto:'assimilate:information, Process-,thatjnfornAtion.and make an intellectual stevt;Ayond-theinformationgiven. (McLeod,.et 1975; P. 416)
William Kessen (1964) lista Ule. processes of.i-dientific enquiry
as: (1) stating the problem, (2) observing, (3) comparing,
(4) classifying, (5) meakuring, (.6) experimenOng, (7) hypothesizing,
(8)-Avaluating,and (9) drawing conclusions lie'belie'Vet ihat in order
to attain the'capability of,: enquiry, an individualmeeds-to learn how
ea observe, how to figure, how to measure, how to orient.things
space, how to describe, how,to classify objects and events, low to
infer; and how to make conceptual models. If these.skills are
nastered, the.individual'will'use them all his life.
The questions of the TSP reflect the processes enumerated by4
Tannenbaum in his "blueprint." They are essentially parallel to those;
-of the AAAS and are: (1) observing, (2) comparing, (3) claspifying, .
(4) quaritifying, (5) Measuring, (6) experimenting, '(7) inferring, *and
(8) predicting.
2 4
1
HWhile there is much emphasis-on the need to provide learning
:
ex&riences inthe use of science processes, it can be inferre&from the:.
nteView Of.'the literature that there seems to be little:agreement On
which skills and abilities comprise scienee proCesa. A mUltiplitity,
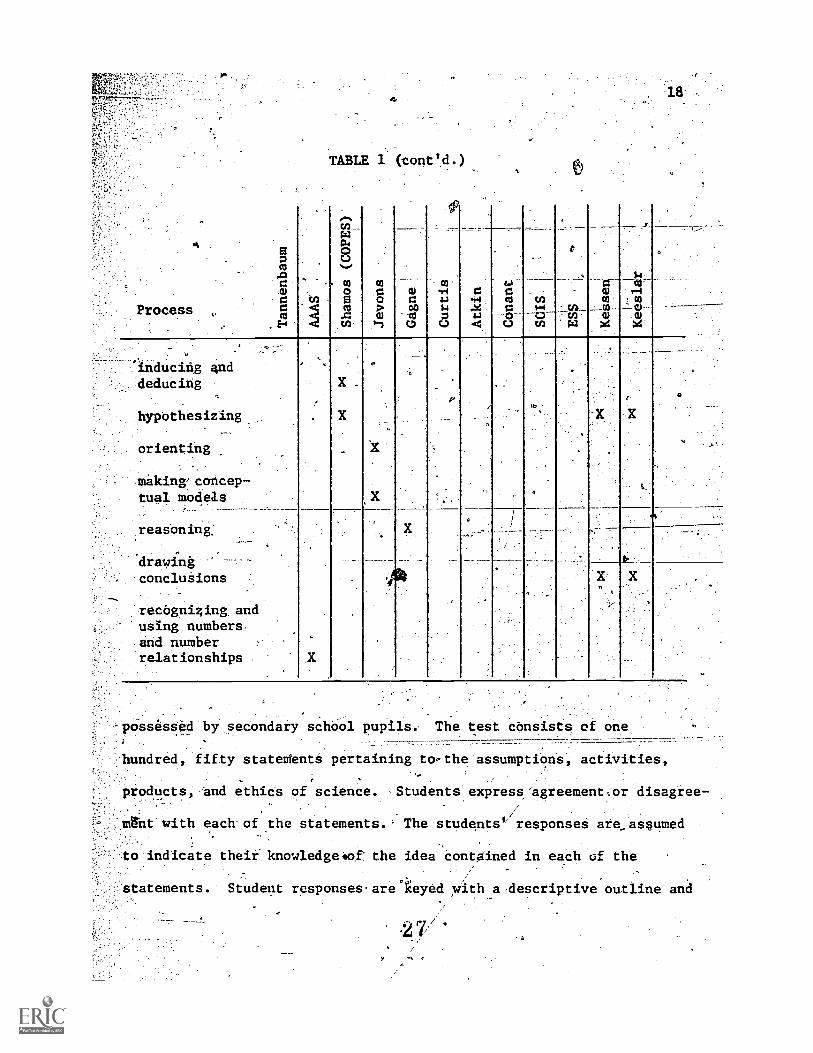
of.deflnitions for.process.are in use. Table'l 'suminarizes-7
* and abilitiwr processes described:or enumerated.bY educalors Or'.
.
. .
curricula which form the basis Of their respective .definitions 14hile
several of theprocesses are not mutually exclusive, they hav"ebeen
listed as somewhattunique within-the Aescription.of its author.
.
This Imprecision of. definition Creates a question as to which ?'
skills an&abilitfes cbnstitute scl..ence prOcess; are these .skillsand-'
abilities unique in an,empirical sense; and, wh'e't performance should be
.. .
assessed in a Science process test.
Tests of Science Processes
Although there are several"packaged science programs and texts
emphasizing the acquisition of science process skills such as Science --v
A Process Approach (AAAS, 1967),-Séience Curriculum Improvement Study
(SCIS, 1970), the Elementary Science Study (Duckworth, 1164), and the
Conceptually Oriented Program in Elementary Science (COPES, 1966)
jamong-the more notable, few tests of science proCess have been
developed. The existing tests of bcience prOcesses and a brief
Aescriptión of each are reviewed.
The Science ProCess Inventory (SPI) by.Welsh and Pella (1967)
is designed,to invantoiy the knowledge of the processes of science
2 5
-
TABLE r
littktgSESAPPLICABLE.TO.SEtECTED EDUCATORS,-EDUCATIONAL..PSTCHOLOGISTSi AND scIENcg cu4RnutA
7.
Biocesses
,
"G'obserVing
compaiingl
claasifying
quantifying
* measuring.;.
experimenting
inferring
predicting
cotmunicating
recognizing andUing tiMe spacer.441ationships X
interpreting
evglu'ating .
discriminating
deicribing
identifying anddifferentiating
-1(
X. X
t?
a.
x.
X
X
X
X.
26
'X
.
Erocess
TABLE 1 (cont'd.)
...'indticing 4nd
, deduCing
hypothesizing
orienting
making,concep-tual models
reasoning,
draWing..conclusions
'recognizing andusing numbers.and numberrelationships .
_-pOssess.ed by,secondaiy schOol pupils.. The test cOnsists of one
,_. _________.
'Alundred, fifty statedent6 pertaining to,-the assumptiOns, actiVities,
products, and ethics of science. Students express 'agreement,or disagree--
ant with each of the statements.. The students' responses are_assumed
,
to indicate their knowledgeoof the idea contained in each of the
statements. Student responsesarelieyed with a descriptive outline and
.27
n' the opinions of.fourteen research scientists. Total scores are
'calculated by adding.the number of agreements with the standard key.
e test was normed on one thousand, two hundred,-eighty-three ,
students in grades ten, eleven, and twelve. A reliability
-Coefficient of .79 was found.. The authors reported Oat the SPI
:4iscriminates in the expected dire6tions wheh"groUP-s with suspected'
iratYing competency'in:knOWledgeof scientific Processea aretested.
This information lends support to the validiiy of-the instrument.
Thepractical considerations of economy; convenience, and
interpretability-are of imporance in the selection of appropriate test_
instruments. The SPI Can be administered within a typical class'cperiod
with the students completing the test in forty-five-minutes. The test
19
can easily be scored by hand or by machine scoring. It is also easy to
,administer'in that administration directions are simple. Several
limitations of the test were listed by the authors: (1) there is a
posaibility that removing a statement_from the context of the descriptive
outline. may change its meaning or cause ambiguity; (2) expressing a
topic as complex as science processni'm a language appropriate to high
school students may change the original meaning; (3) the SPI is based
on the authority of a samile of scientists. As such it may be valid
for the opinion for this_anthority, but not valid for the opinion of
all scientists. The controversial nature of the subject imposes
restriction on the validity of the_instrument. (Welsh and Pella,
1967, p. 67)
-28
The Science.Observation and Comparison'Test (SOCS) by Hungerford
and Miles (1969) is an Instrument designed to measure the science
process skills of ob-Servation and comparison. Although cOnstructed for
junior high school use, the authors believe it to be4appropriate for
intermediate grades aS well. Students are required to make observations
and comparisons on real scientific objects and to communicate their
findings either orally, in writing, visually or a combination of these
modes: Onthe observation portion.of the teSt, students are asked to.-4
make an accurate visual reproduction of a particular specimen,.noting
structural details and labeling their drawings. Scoring on this.
portion is in three dimensions: (1) the excellence of the drawings,
(2) the communication of morphologic features, and, (3) the labeling of
structural parts. On the comparison portion of the test, only the
ability to discriminate differences is required. A raw score of three
, is given for each,reasonable and accurate comparison given by the
-
student. ,The comparison part of the test can be used either indepen-
dently or it can be added to the observation total for a grind total.
The test was piloted on eight heteiogeneous seventh grade science
classes. 1nterscorer reliabilities ranged from .83 to .94. Test-,
retest reliabilities, with a fotr-week delay, ranged from .39 to .68.
Alternate form reliabilities ranged from .25 to .59. While this writer
questions the value of these correlations, the test autholr's concluded.
that the SOCS Test can be scored reliably. They further state:
The test-retest reliabilities, both with andwithout training, appear high enough to warrant
2 9
v.1)
s. use of the test for research and clasgroom purposes.The Eilternate form reliabilities_for the most part'seem-high enough to warrant use tI the.two forms16r-pre-póst type designs, (Hungerford and Miles,
,
.::.... -
The,validity estimate comparithe SOCS Test scores with teacher
ratings yielded\r's of .65, .43, .34, and :61he anthchrs cOncluded, . .
:
I--__
--
that the teacher i___correlation and the increase n scores with,
21
training lend support to the validity of the test.
The authors give no'information as to the ptacticaLcOnsiderations.
in using the,test.\It would appear that the tesiing.time wtuld.vary
\
considerably'accOrding tO how quickly students draw the particular
specimen. CertainlY\, scoring the test would take a large portion of
time 2iven the format of the test. Difficulty.in scoring May be a
problem in that thereappears to be little .in the way of a Clear
criterion reference4.
The Science Pr cess Instrument -(SrI) by the American Association
for the Adancement f Scienee was'construCted to accompany the.science
.curriculum, Science -- A\Process A. roch (S-APA). it attempts'to
ascertain the abilit es of the learner in the following processes:-
observing, classifyi g, measuring, using numbers, using space/time
\
relationships, inferring, 'ommunicating, and predicting.
The learner is p esented with specified materials and is asked
\
to perform a task reflecting one of the sequential behaviors cited.
The learner s respons is sLred either as acceptable or non-acceptable1
by the examiner. The manual\lists all acceptable responses. The_
,
administration of the test requires some special training. Extensive
3 0
:preparation is necessary in that the tester "must be ihoroughly
jamiliar with the format'of the test with the materials used, and
with the method of scoring." (AAAS, 1968, p.. 25)
This instrument was_used as a tesearch tool for phase I o
S-ARA and was terminated with the end of Phase I. Statistical data
for the test were not published.
Test 9 of the Comprehensive Tests of Basic Skills, Expanded0
Edition, published by McGraw-Hill (1973). is a science.test Comprising
thirty-six ittms dealgned to "assess a students ability .tO'inVesti7:-
gate problems in science and, to>a lesser degree, to recall scientific
facts or-concepts (Examiner's Manual, 1973, p. 5)." The skills
enumerated are the abilities to classify objects, to measure or to
--quantify, to recognize a trend in data, to recognize a valid hypothesis
drawn from piesented data, and to analyze an experimental design.
ievel 2 is designed for grades 4.5 to 6.9. The emphasis in the.
.dimension is on the measurement of comprehension and application o
process.
concepts and'principles rather than on the measurement of content.
-DevelopMent of.the CTBS was through generation of testAteMs by'I
teachers of appropriate gtade levels, Curriculum Specialists an
McGraw-Hill staff members. Reliability and norming data were amassed
from'eight thousand, six hundred students in 1972 and revised with
additional samples to reduce racial and ethnic bias. Norms for a
nationwide population are expressed as raw scores to grade equivalents,
percentile ranks, and stanines in a CTBS Examiner's Manual. The
Kuder-Richardson reliability for the test for grades 4, 5, and 6 are
.79, .83, and .86 respectively.
31
23
Tge Science Process Test (TSFT) by Ludeman (1974). is designed
1
to test-students.in grades six or. seven on their abilityte perform the..
h
four integrated science processes.defined by the AmeriCan:Association
for the AdvanneMent of Science: formulating .hypotheses, defining.
. operationally, controlling variables., and interpreting data. The TSPT
was developed-by Ludeman, Fyffe, Robison, McLeod,:and Berkheimer at the
.SCience and Mathematics Teaching.Center of Michigan State University.
..CopYright date for.ihe test'is 1974 And negotiations for comMercial.
publication-were not completed as of June,
The TSPT is a paper and pencil power testcomposed,of thirty-six
items inclusive of a test.booklet and-machine scoreable answer sheet.
Ludemahlound that:studenta became restless and lost their concentration
when the number of items.exceeded forty. Content or face validity was
replaced by a procedure known as external criterion references valida-
tion. Ludeman, et al. (1974) states:
Using this procedure, items.are included in the test-on the basis of the requitement that children'sperformance on each item be highly correlated\withtheir performance on the external criterion. 'tp. 2)
The external criterion for the TSPT is-the Individual Competency Measures
of Science -- A Process Approach. A major.element in this design is the
assumption that the Individual Competency Measures do, in fact,
measure those prOcesses. The correlation between the TSPT and the
S-APA-ICM was .83 with an N of 52. The criterion for item selection
for inclusion in TSPT was the requirement that-: (1) all alternatives
have been chosen by some students; (2) the context of the item allows
3 2
9
its use, in some,cases, since more than one item was based on a given,
:context, the group Of items had.to be included or eXcluded in tato;
77-(3Filie difficulty of each item.(proportion of students missing:the',. .
.
Jtem) Was required to be between .2.and .7;'.(4). using the Individual'
Competency Measures scores to define the "upper twenty=seven percent"
And the "lower twenty-seven percent groups each item was required
to have a minimum aiscrimination of .2; (5) the correlation of students'4
a
scores on eaehAtem with their scores on the Individual CompetencT
Measures was required to be .2 or greater. (Ibid.
Norming was conducted in the Spring of 1974.:slybne:OoUSind
three hundred; one .students from a random seleetiOn cl twenty sthools
In Michigan and Indiana. There wat a broad spectrum Of seience.rograms
represented in the seleCtion. Readability is cited:at lOwer sixth
4rade.level. The Ruder-Richardson reliability was given.Yat-.84'.. These .
tests-represent the first attempts by the academiccommunitY toaSSess
the processes of science.
-
:HThe Test of Sélence Processes'
The Test.of Science.Processes (TSP)'by Tannenbaum (1968) *s an
'instrument to assess achievement And-diagnose weaknesses:in. the Use.c-
sciente processes by students An grades seven, eight; and:nineci
, (Tannenbaum, 1968, p. 2). It consists of ninety-eight multiple choice,
fIve option questions requiring a maximum.testing time Of seventy7three
'Minutes, a test booklet which is printed in black and white 35mm
--colOt slides for the visual cues, and an answer sheet. See the complete
4
Test of Science Processes in the pocket of the thesis binding.)
33
jannenbaum enUmerated the 4ftique science processes And the
behaviors'that seventh, eighth, and'nineth grade students Were expected
o perform from a variety Of grade level textbooks then currently in
25.
Curricular validity for the statement of processes was
_
.'.ascertained through twehty-tWo question's submitted.to thirty science
7 educators meeting any of several requiremedts of teaching experience,.
.publications,,,recommendation by Columbia University faCu4y, and job
:.description. This Produced-a final statement of fifty-three behaViors
under eight processes and Was used in his "blueprint" for the Test
. of Science Proceeses.
---The "blueprint" for the TSP ,ig,a statement ofphilosophy supported.
by relevant.literature arid a lietihg of the processes and their assigned
p
behaviors. A general philosophic sumiary of Tannenbaum'e position
is stated by the AAAS: (1) the scientists' behaviors in pursuing
science constitute a highly complex eee of intellectual activities which
.are, however, analyzable into simpler activities; (2) these intellectual
activities (processes) are, as most scientists would agree, highly
generalizable across scientific disciplines...; (3) these intellectual
activities of scientists may be learned, 'and it is reasonable to begin
with the simplest ones and build the more complex activities out of
them, since this seems to be in fact the way they are organized
(AAAS, 1965, p.,4). An abridged summary of the processes and their
respective behaviors are shown in Appendix B.
On the basis of the "blueprint," Form I of the TSP was written
Comprised of ninety-eight multiple choice items; each item consisting of
3 4
26
a '35m Color sl4d031sua1 stitulus,a,mimeographed'Atem, and five
choices. It waAadministered to 156 seventh, eighth; And ninth grade
students in a Bronx, New York public intermediate school in. January,
1968.. Ari item analysis was performed and Form II was drafted:
The ninety-six.items and printed instructions weretype rritten 64ith right-hand justified mArgins):.Andthe color slides (except for thoge for queations onethrough twelve on Form:II) were converted to.tablesor black And white prints.'The correctAnswers te.the
, items were randomized using,a table of random numbeiSand the questions were arranged in a ''sawtoothed"order ofincreasing difficulty within each.abbscore(based,on the difficulty of.ihe item when includedon Form I). (Tannenbaum, 1968, pp. 57-58)
/Form II.was administered to three thousand, six/hundred, seventy-
three seventh, eighth, and ninth grade students from Rockland County
and Bronx, New York in February, 1968. For each student, there were
nine raw scores reported -- one for each subscore and one for total_
score. Storing keys can be found in the pocket of'the thesis binding.
The complete resultawere used to determine the norms, iteM,statistics,
reliabilities, and validities and are described and reported in
Tannenbaum'adissertation.
Reliabilities reported are the results of internal analyses of a
;single administration_of the test using the-Kuder-Richardson Formula 20.
Test-retest correlations and alternate forms correlations were not
obtained. Total score reliabilities are shown in Table 2. Procesa
subscore reliabilities vary from a high of .82 to a low, of .26.
Tannenbaum recommends.caution in the use of_pubscbre reliabilities:
It should be carefully noted by the user thatwhile the total test and the longer subscoreshave adequate reliabilities, some of the shortersubscores have quite low reliabilities. Thia is
3 3
27
. .
almost surely due to thelx short length- because iptheir item-itemand item-subscore correlationa.are high....However, due to the low reliabilities,
...oOlytautious use.by trained Personnel shoUldbe.made of the.shorter subsedres. Of,course, if. in .
. a ParticUlar administration,.lagher reliabilities
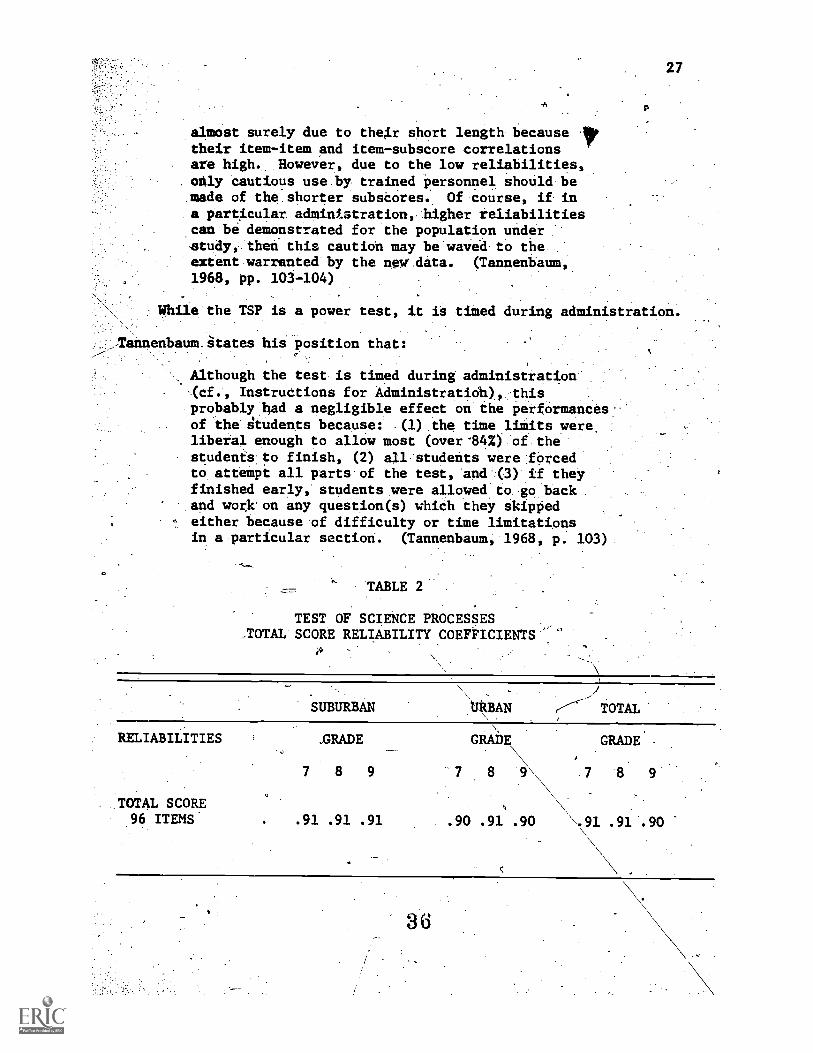
.canbe demonstrated for the population under8o4n.then this caution may he'weved- to.thmextent,warranied-by the new.data. (Tannenbaum,.1968, pp. 103-104)
While the TSP is a power test, it is timed during administration.
-annenbaumitates his' position that:
Although the teat is timed during administration-.
H(Imf.', Instructions for Administratidhthisprobablylhad a negligible effect on the Performancesof the gtudents because: -(1)..the time liiits wereliberal enough to allow most (over*84%):of.thestudenit:to finish, (2) all:students were .fOrcedto atteMpi all parts.of the test, and.:(3) if theyfinished early, students were allOwed:to zo_backand work'on any question(s) whiCh they Skipped
- either because of difficulty or time limitationsin a particular section. (Tannenbaum, 1968, p: 103)
= TABLE 2
TEST OF SCIENCE PROCESSESTOTAL SCORE RELIABILITY COEFFICIENTS','
SUBURBAN URBAN\ r/"" TOTAL
RELIABILITIES
.TOTAL SCORE96 ITEMS.
MADE
8 9
.91 .91 .91
\.
GRADE GRADE.
-7 8 9\\\ -8
.90 '.91 .90 \.91 .91 '.90
36
28
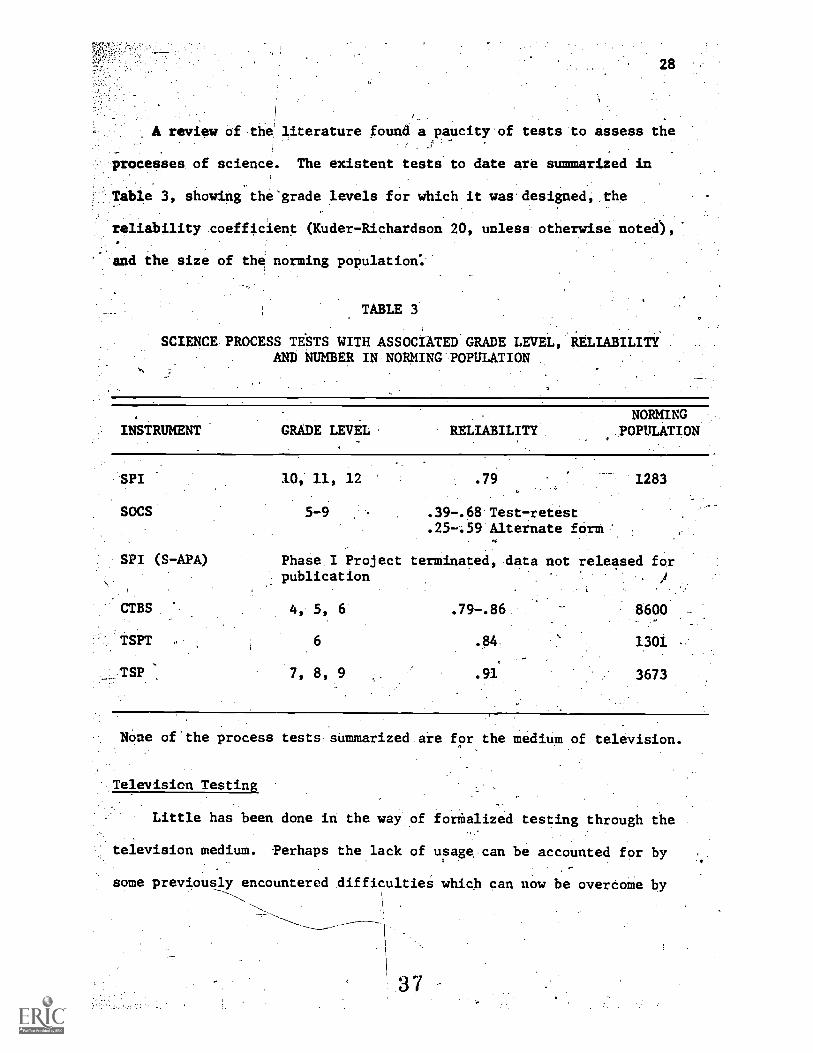
A review of the literature found a paucity of tests to assess the
processes of science. The existent tests to date are summarized in
.Table. 3, showing the'grade levels for which it was.designed,:the
reliability coefficient (Kuder-Richardson 20, unless otherwise noted),
'and the size of the norming population:
TABLE 3
SCIENCE-PROCESS TESTS WITH ASSOCIATED GRADE LEVEL, RELIABILITYAND NUMBER IN NORMING:TOPULATION
NC:MINGINSTRUMENT GRADE LEVEL ' RELIABILITY. ,..POPULATION
SPI 10, 11, 12 .79 1283
SOCS 5-9 .39-.68.Test7retest.25-.:59 Alternate form:
SPI (S-APA) PhaserI Project terminated, data not released forpublication -.
CTBS 4 5, 6 .79-.86 8600
TSPT 6 .84, 1301
8, .91 3673
None of the process tests summarized are for the medium of television.
Television Testing
Little has been done in the way of fordialized testing through the
television medium. Perhaps the lack of usage-can be accounted for by
some previously encountered difficulties which can now be overcome by
otter understanding of classroomeducaiional television and bY
- ,
better:technological innovations within eduCitional televiSion. In. .
the-past, teachers have reported that television redeivers are.
Huirefiable, time Schedules do norallOw for television. ueage, Programs
fit.into the curriculum or aie not suitedrOtheir students,.
29
,.ichedules of-television progrado notArrive in tiMe or dO not.
Airrive-at-ill the influx.of "maChines" may replace theteacher, and
,ail insecurity may-develoOfin.the'classioOm teacher-becaUdeof competing'
with'the highly skilled television teacher. Administrator's reSpondin
jo a questionnaire which included the question: - "Why do you not use the
school's television service?" gave the following answers,: (1) my staff
are (i ) not lazy; (2) my staff would become.lazy; (3) mY Students would
. become lity; (4) too much like entertainment; (5) there is nO time to
spate from teaching; (6) if you, could cut out the filmS.and photographs,
and just shoW a.teacher with a blackboardl (7) if you could just-'send
the script, we could do much more with the material than seeing it ol:
television; (8) there is nothing you can give the students.that I cannot
(Combes ind Tiffin, 1970, p. 71).
Thisiopposition to teleivision-usage within the classroom has been//
overcome by equipment which is reliable and easy to use, teacher.
/
training which emphasizes a better-understanding of educational television,
/and theAevelopment of video tape whicballows the teacher to select
appropriate lessons and time schedules..
Col's and Tiffin (1970) adllOcate the utilization,of television for
testingsuggesting the advantage of sUch a procedure of preVenting,the_
38
tendency of ieachers to teach stock answers to stock questions. In
listing the advantages of testing via television, Pessinger (1969),
states:-
-Close-ups showed important sections of _the forms; and:critical instructions received graphic eMphasis.(p..19)'
Videitape has improved San Jose'S televised testingprocedure.because close-ups, such.as those illus.-trated can be precisely composed and positionedin the program /-'7.something.not always poseible inlive proddction. Further; taped instruction bere-uted as often as necessary until theie aresignificant changes in the-instructions or the testforms.
0-Over the Years, televised testing procedu'res havebeen quite successful. Errors,invariabIy made by
- students in marking answer sheets have been reduced.Use Of Vddeo tape has incieased these advantages --facilities requirements-and set-up.time for theteleiiiiion, staff have been materiz Lly reduced;itindaidiiation of instruction has.been expandedfrom'a InionCto room' basis to a 'testing date totesting date' basis, and testsupervision has beenimproved by allowingthe tesi.officer to be in .
diredt contact slith testing roods. (Pessinger,.1969,p. 20)
.
30
A
Gross (1969) ja.Aessa stiong case for visual testing by pointing .6.1t;
that the student_becomes visually oriented and learns the matetial by
visual rather than verbal association by watching television. 'Thus, when
the student is tested verbally on visually presented material, heAt I
betomes frustrated and his scoie On:the test is not a true measure of'
,.what he actually knows. With the influx of more television t, eaching and
the resultant-new teacbtng concepts, Gross (1969) states:
...it appears obvious that the Dark Ages of testingshould be abandoned in favor of techniques adaptedto the new methods of learnisg. (p. 35)
9
31
Afterca television course in health education and an acCompanying
-tebt via television, students were asked to comment on their reactions
to visual testing. The following are typical reactions:
% I learned from the test, also, because of the,,pictures.
I whole7heartedlir hope,that tests In.schools:willchange.to the type presented today. I usually'hate tests, but I enjoyed this'one. I.get so ,.
.tenge that I forget what I'haVe been taught:- One.'of.the benefits thatcan,be derived from thiS.kind..of presentation-is free time for the professor-or_time put to'better use. '
L...4...,
. , .. .
. ..
..
, I Want you to know how much I-enjoyed iiking the,' midterm test Saturday, the 13th.. The test was. -.--
motivating. (Gross, 1969, p. 36)
tGross (1969) comments on the. advaniages and adaptability of
television testing:
( Biology television courses could,take full advantageof.-television's close-up properties for tetting,byprojecting. microscope slides and asking studenti toidentify them. Thls would be far superior to paperand pencil questions such as' 'describe-an amoeba'.'(p. 36)
, .
,The sciences, including.chemistry. sad physics, canalso utilize television's viival properties by'showing actual experiments and allowing studentSto' analyze or hypothesize about them... (Gross, p. 38).4
cc
...visual testing need not be exclusively fortelevised courses. Any.teacher who employs various
, visual aids to adcomplish his teaching would bewell advised to consider visual testing. (p. 38)
-In a project reported by Thomas (1975),,third,. sixth', ninth; and
eleventh grade students in American Samoa werd tested via televisiOn
on iheir.listening comprehension of the English. tangtage. Television--;, .. . ... . ______
. was chosen as ihe.mode.of testing because it saVed time, reduced..the., .
40
nnat er/rif testing personnel required,*allowed foeconsistant pronun7
cia#0, and:eliminated the problem of teachers helping students':
amas (1975) states:
le People involved in the experiMent'Concludect,that thevideotape-approachAnd-the7pictorial..
fbooklets prOvided a malt satisfactory solution.to:the problem of group.testing for pupii.si_understanding of a spoken second language.(Thomas, 1975, 1) 27)
32
Hopkins, Lefever, and Hopkins (1967)'compared scores of.teacher- :
administered testS and television-adtinistered tests:- All the fifth,e2
andi,sixth graderS in eleven eiperimental schools Were given'a
standardized test (Metropolitan Science Test);via closed-circuit tele-%
vision while all other fifth and sixth gTaders of nine control schools
were administered,the same standardized test by an on-the7scene
tester. The test was given the same day at the same hour. All of the
.. students had received identical instruction in science via televisiT
sinCe the beginning of the school year. Resulting scores indicate
no significant differenceain means for television versus teacher
administration.
Project Nunx is a program developed to administer the Nat onal
Teacher Examinations vi'a television (Landis, et al., 1971). thisb
endeavor was prompted by recent but consistent criticisms concerning
the heavy reading load imposed by the original test and the'possible
:acial, regional, and class bias inherent in some of .the test items.
Videotape presentatiqn allowed for'stimulus control and elnvironmental
simulation which promised, to be an improvement over the abstractions
41
:Jr 33
of the pure paper and pencil test. It was felt by the project parti-
Cipants that the use of classroom simulation scenes would do more
equalizing for prospective teachers from disadvantaged or minority
backgrounds: "The .verbal portion of the test was presented with
white-on-black lettering appearing on the screen with voice-ove1
reading of the item for,dual- emphasis. The second part of the test
consisted of a series of classroom situations taken from actual class-
rooms, With questions suited to the situation. ,The authors of Project
NuTEx comment about their development of television-based testing:
One can project many fascinating possibilities,bmt the contribution that television will maketoward improving our current evaluation procedures(the classroom behavior) rests.on the degree towhieh'long-time testing professionals, whosetraining and interest are now almost entirelycentered on paper and pencil measures, becomeconvinced that this new medium has merit.(Landis, et al., 1971, p. 20)
Test administration mode was investigated by administering a
standardized achievement.test (Gates Readihg Survey) to eiibt hundr,ed, .
eighty-two seventh grade students in four junior high schools \
r I
(MUnger, 1972). Half of the randomly selected students were given
the test "live" and the other.hal'f were given the test by way'of
television. It was found that the mode of test administration had a
significant differential effect on standardized reading test scores.
The findings of the study concluded that students can be expected to,
earn higher reading scores when tested by an on-the-scene test
administrator than when tested by video ape.
4 2
-
CBS-TV has produced a number of teleVision tests such as The0
National Citizenship Test and The National Driving TeSt. The foridat
of the programs basically consisted of short icenes demonstrating
various activities. The narrator asks a question and then pauses
.for the home audience to respond. The:correct answer is then given
with an explanation as to why it is correct.
.Studies have indicated that testing via television has several
advantages over traditional modes of testing. Standardization of
test directions is a major advantage. Also, for some content areas,
television can show close-ups which emphasize critical visual infor-
mation thus reducing errors in marking answer sheets. It adds the
34
, dimension of motion which traditional test modes cannot accomplish.
Television tests can be administered to large groups at a minimal cost
and the test can be used over and over.
Summary
A review of the literature found considerable support for the need
to teach those skills and abilities employed by scientists and identified
by psychologists and educators as science processes. However, no
general agreement in the list of those,skills and abilities was found.
This imprecision was canoted in the Dictionary of Education which lists
this open-ended definition:
Process approach, an apProach to science instruc-tion in which children learn generalizable processskills that are behaviorally specific but whichcarry the promise of broad transferability across
4 3
AO" lany .niatters ; i..".;adepts the ide-a:Ithat:n0*I tbOught..'can'. be enCoUraged in relatien. to'each t:of the proCesseb of science, Such 'as obs.er-.,*Affenii:'",inferience,: cciniati41.6:10.9*, Measurement ;ta ..(GoOcr.1971., p. 439)'.1
asol4BuitYof irminologY Pgrte.ndS difficulty'tO the-te4:4e;,:reloPer
o attempts to measure science proCesses. If no unifOrMity exists, the
estAeyeloper mustdefinethoSecharacteriStici_tO,be ie:sese 4is
. -.-
niqUe:instruMent. This could result:1n a prOliferatiOnYorifietrUments;,
collectively labelled science process tests.
A survey of the literature found few tess of sOience4iOcess.
. /Those reported on are: the Science Process Inventory'(SPI), the Science
measure unique factors wholly different'from other instruments:lnii
are
Ajbservation and Comparison_Test ,(SOCS), the ScieneePtecesi,InstruMent,
the science subtest of the ZomprehensiyeTests of Basic-Skills (OTBS),/
abe Science Process Test (TSPT), and the Test of Science-Processes '(TSP).
Each of tttse tests is designed for varying grade levels, 4nging from
fourth to tweith grade. None of"the tests iifor television
.presentation.
The literature revealed a scarcity of testing via televiSion.\ Of
the studies reporting ori television testing, most have concluded tha'e\
'television presentation of tests has several advantages over
traditional modee of testing. The literature suggests that testing
can be effectively conducted throUghthe medium of television.
4 4
roduction
.CHAPTER III.
PROCEDURE OP THE STUDY
Tho procedure for modifying the TSP for the intermediate:level
adapting it for television required the following steps:
,.(1) present 'the queptiOncontent of the Test'ef SCience Precessee to, .
.a panel of jUdges'on elementaryecience curriculuM:and4agtruction
toAlscertainpthe content validity Of.the test as applicOle
intermediate level.students, (2) rewrite thoseAuestions retognize
appropriate by the experts to conform.to the readability:adequate.
,for upper elementary students, (3) produce a,piloi teSt Composed o,
the-adaPted questions on quadraplex video tape and producethe :
associated print materials, (4) provide A pilot expOsureAnd teChniqUes
)to ascertain appropriate test.item exposure time, (5) edit.the,video
production to conform to the time.data, (6) provide a pilot run of
the.televised test to a large number of students to amais.dati for
item analysis, (7) establish statistical parameters by. which the item.
analysis would provide a- refineMent of those questions whiCh would
comprise the final form of the test and edit the video production
accordingly, (8) provide for broad exposure of the test to ascertain
norms for target populations; and (9) provide an experimental study to
amass concurrent and predictive validity data.
Establishing COntent Validity
Content validity was established by subjectift the ninety-six
questions of the TSP to a critical andlysis by a.panel of judges ins.
45.
.//7 .
ementary science at The:PennSylvania State University. (See
Appendix D for panel of judges.) The questions were reviewed:
11:to identify content APplicability'for measuring process skills
:at theAniermectiate level with minór-,ievision and (2) to iimple the_
eight'precesses identified by Tannenbaum-- observing, comparing,
claSsifying, quantifying, measuring, experimenting, inferring, and .
:Predicting. 'Whereas the questions laere identical or similar; cOntent
validity coUld be partially inferredothrough the "blueprint" data Of.
: Tannenbaum. On the basiS of the initial selection, the'questions for
Form A of The Television Test of Science Procesdes were identified.
Readability Considerations
Once the applicable questions were identified as having content
validity for the proposed target audience, a revision of vocabulary and
syntax of the verbal messagi- was necessary to effect content validity
for'the intermediate level. Three one-hundred word randomly selected
samples of the Test of Science Processes were subjected to the-Graph,
for Estimating Readability (Fry, 1968) in order to ascertain the
difficulty level of the original questions. Since the Test of Science
Processes was constructed for use with junior high school students, it
was necessary to revise the selected questiOns in order to reduce the
reading difficulty of the test. This was accomplished by shortening
sentence lengths and by altering the vocabulary. A certified reading
specialist modified the vocabulary by replacing the difficult words
with easier to read synonyms judged by her io be appropriate for
elementary school aged students. The verbal message was evaluated
4 6
through the use of the Graph for Estimating Readability and throUgh
the use of the SYntactic Density Score by Golub (1973). tO asdertain
the reading difficulty of the revised questions. These two,
readabilicy instruments were selected to ensure a comprehensive
evaluation of the verbal domponent.of the test. The "Fry Foriula"
measures readability in terms of sentence length and difficulty of
words.. The Syntactic Density Score reflects the relative complexity
of the sentence structure.
All, written material in sentence form which the students were
required,to read waS analyzed. Twenty-six one-hundred word samples'
were counted-out and the number of sentences and syllables were
f
computed fOr each.sample. Averages for sentence length and numberOf
syllables was determined and then plotted on the Graph for Estimating
Readability to find the reading level.
Research has upheld the "Fry Formula" to be a useful tool in
estimating readabilit);. Fry developed his formula by assigning grade
level designations by plotting a great number of books which
publishers had said were .9f--a certain grade level. Fry then looked
for clusters and "smoothed the curve." After the formula was applied
and correctional studies made, the grade levels were adjusted. The 1
--formula judges difficulty on the basis of sentence length and word ,t
length in terms of syllables. A comparison'is made of sentences per
one-hundred words. Validity of using sentence length and number of
syllables to determine readability has been investigated by Stolurow
and Newman (1959). They found a high correlation (.90) between easy
47
Vordp,and'uonosyllabic words and, reading ease'. Average sentence
lengthcorrelated .86 with difficulty. -Their conclusion was that
anY Yardstick which gave primary.weight"to.the sentence factor woUld,
account for-a good deal-of the.variance in readability.
, Rink order correlations between the Fry readability graph and
:the Spathe (1953) formula for seven primarybooks was iound.to'be.
.90. Correlation5lor .the upper range of the Graph for:Estimating
Readability and other readability measures are as follows:
39
Dale-Chall Formula .94Flesch Formula .96.SRA Reading Ease Calculator .98Botel Formula .78
The Syntactic Density Score was obtained by subjecting all answer
choices in sentence form to computer analysis using the Syntactic
Density Program at the Computer Center of The Pennsylvania State
University.
Golub's Syntactic Density Score is a measure of readabiliti which
reflects the quantitative and qualitative grammatical structures of a
given selection of written material. Golub and Kidder (1973) state:
The syntactic density'of a child's or student'sspoken or written language, when compared to otherchildren his age, should indicate normativesyntactic language development. (Golub and Kidder,1973, p. 1)
The Syntactic Density Score was developed by sampling children's
syntactic structures in oral and written discourse. Teather ratings
of high, medium, and low were then made on the samples. Twelve
variables of syntactic structures were identified which correlated
4 8.
TIV:1
tigaifidantly with teachers' judgment's o the. written language
t:taMplegi. "Through a process Of .canonical correlatiOn analyais,
relative weights were assigned.to each.variable according to its
contribution to a factor. named 'syntactic density'." (Ibid. p..2
The Syntactic Density Score reflects the measure of:
(1) T-unit. length (one main clause and its related words, phrases
.and. clauses), (2-)_suboidinate clause-length, (3) use ofcomplex.verb
phrase expansions, (4) use of some advanced stnictures of tithe, and
(5) reductions or embeddings that take the form of prepositional
-phrases. It does not account for vocabulary intensity. The'tabulation
'of Golub's Syntactic Density Score has been programmed for the computer.
.Television Production of the Test Instrument
After selection of the test questions and the modification of the
verbal message for readability considerations, the next-step was to
adapt this visual and verbal information for television production.
The first phase of the TV production-involved the development of a TV
script,that best presented the verbal and visual information. It wab
decided not to use t14 existing 2x2 slides through the TV multiplexer
system. Direct video tape recording (VTR) of the visuals was"chosen
because of several advantages: (1) the advantage of superior lighting,
(2) it was less expensive in that the cost of the slide processing was
eliminated, (3) the dimension of motion could:be added, and (4) graphics
could be managed electronically-. Most important is that direct
recording provides a-better quality visualrthan does slide transfer.
49.
seI required the drafting of a TV format script, design'and.
:AleVelopment of the graphic visuals-, ihe Procedures for the logistics
assembling the visual materials, and thescheduling.of the TV
-StUdio And personnel for the videotaping sequence. .Items employe4
foi)r the visual presentation of the questions were Selected roi the
-Sciende Education store of materials of The Pennsylvania State
-IUniversity and assembled in the studios ofWPSX-TV, the,public
television station of The Pennsylvania Staie University. .Graphic
art was produced in the graphics service unit of the Division of
Broadcasting of WPSX. Form A of the TTSP was recorded on two-inch
quadraplex. tape of broadcast quality on an RCA TR70 unit with Norelco
color cameras. Efforts were made to control all visuals for
effectiveness and for contrast in color 'and in the gray scale.
Question numbers with a special-effects0"wipe" introduced each
question visual: The decision was made to verbally state each
question and leave the question on the screen for ninetyrieconds.
This was to allow completion of every question for the item-response-
time study cited next. Completion of Phase I formed Form A of the TTSP.
The television crew for all phases of the production consisted
of the professional staff of WPSX-TV comprised of Gary Perdue,
produCer-director; Steve Hubicsak, editdrial assistant and narraior;
and this writer serving as associate producer and production,assistant.
Also.included was a switcher, two engineers, three cameramen (one each
for graphics, live action and superimpositioh), and several,
production asSistants.
60
Phase I/ required an'edit of the Phase Iitape to conform to the
imes established in the item-response-time study. Completion of
Thase.II formed Form B of.the TTSP. An introduction to prepare
- Students to take the test vp television was developed for A two-part',
,
1
presentation.
...Phase III followed the item analysis of the test results of the
B exposure. This included a final edit and the summary graphics..
Thete were several technical considerations involved: Total test
\time was to be two one-half hour .programs to conform to.broadcast
schedules,. This was to be short enough to maintain student attention,,
yet long encligh to Cover the material. Narration had to be held to the
reading_of the questions. Narration of the answer choices Was dismissed
because of the time involved.and the confusion it created mdth verbal.
discrimination. Sufficient time to react to the question controlled
the, narration time. The total verbal information utilized was the
necessary introductory comments and directions for test taking.and the
narration of the test questions which provided for cross channel\\
redundancy (Hsia, 1968; Hsia,\1969) to reduce equivocation. This
forthed Form C of the TTSP final'product.,
Item-Response-Time
Because the TTSP is a power test and because the television
modality via the broadcast channel is uncontrolled by the test
administrators once the vidao taped package was completed, it was
necessary to administer a pilot test and gather information on the
appropriate amount of time necessary to maximize the exposure time of
5 1.
OliSualt to the students while minimizingthe teleVision time..
e ninety-second constant exposure was wasteful in both student time,
and broadcast costs. Olitimum test response time
Thetraditional way.t6'measUre.speediAesS Ad to Set a fixed time
limitlor the total'test and.then.seeThowomany questions (out of'the.
total). were responded-Ito hy, for exaMitie; ninety perentof*the
examinee. Based on this:either time limits are adjuSted or the
n4mber of items is altered.
In the preient study, however, since television broadcast time
was involved, it seemed more appropriate to empirically determine
how much tim0t took,. i.e., the ninetieth percentile, for examinees
to respond to test items.
The entire fifth grade class of the Centre Hall School,
comprising'sixty-eight students; f the Penns Valley School District,
Pennsylvania of predominantly_rural background were administered
-Form A of the TTSP via closed-circuit TV. Four graduate students of
the Department of Academic Curriculum and Instruction of The
Pennsylvania State University observed the test administration, each
observing a defined group. Using a stop watch, they noted the time
in seconds from the.end-of the verbal message on the test to the final
nark on the answei sheet required for each student in their defined
groups to answer the qUestion. \This included the time for some changes
of.answers and erasures. The item-response7time data wab tabulated.
The mean and,standard deviatiom for _each item was computed.
5 2
tadter (1964) :mates: -
...where practical consj.derations'do not limitAphetime,-the test lengthmill be.determined by thenumber of items required to adhie4e as high a degree-of.validity aS possible withoUt eimeeding the.pointwhere costs in ;erns of time? effort,-money; andpatience of the exaMinee outweigh the additionalgain. Time-limits of such a test are usually takenso that approximately ninety percent will be able,to finish. (p. 173)
It is clear that setting the number of items on the test based
4
.1"
on how many ninety percent respond to is not an equivalent procedure
'to setting time limits per item based on the-ninetieth percentile f r
times taken on that item. However, using the ninetieth percentile of
the times for each item was thought to be a reasonable way to best
approach the-traditional speediness measure far applications to
television testing. The video tape of Form A of the TTSP was then
edited to conform to the recommended timea to form Form B.
Item Analysis
.,.
lo derive a pool of questions that'were applicable_for use at
the intermediatelevel, Formil-Of the TTSP Was adminiatereclas a pilot
test to a largesaMOleof fifth and sixth grade students. A contact
was made through the Department of Education for a pilot testto be
administered in a).arge suburban Philadelphia school system. The
Harple-Newtown School District was utilized as a test group. one
_hundred and sixteen fifth and sixth grade students were exposed to
lhe tet t instrument via closed-circuit television under controlled
conditioni-at the Brown and Culbertson Schools. in December, 1074.
g3
The criterion for time inclusion was: (1) adifficulty index
ater than, .35 ind less than .85 and (2) a point biserial corre-d
ion greater than .20. These criteria ae suggested by Kelly (1939).
the dub-processes idehtified by Tannenbaum were to be sampledi
m this pool,'40 items were to be identifii and incorporatid into.,
m C of the TTSP.
ming.
To collect norming information, it wasrnecesiary to"expose-thes
evision Test of Science Piocesses, Form C to a.large sample of'
dents. DUring Octobeof 1975, the TTSP, Form C Wile broadcast over
X-TV, Channel 3 of the Pennsylvania Public TelevisiorfNerwOrk.
perationtylth the Allegheny Educational Broadcast-CouncilT nineteen.
.0
Dol systlems'cooperated in the collection of norming data in a
mmentedleffort during this time sequence. The TTSP wad scheduleds
, - . I 4
part of the total SFTS public presentetion on teleVision station,
..,. / IP
1,-TV. TAn alternating schedule/to allow'for ease in public school.;,, \
Leduling/iS the rule:for ell tFTS programming. A.total. of 3480 fifth'
Ae students were given the test instrument under normal classroom
Aitions df television viewing and test taking. ,Table 4 lists the,
Lool districts in 'alphabetical,order with-the num1;er of.participating .
rdents; information relative to their rural, urban,'or suburban
Issification; grouping; and a statement of their present science
mhing methods. The descriptive information of the district in
Ile 4 is quoted from correspondence from officials of the various
tems and do not represent an objective statement by this writer.
,5 4
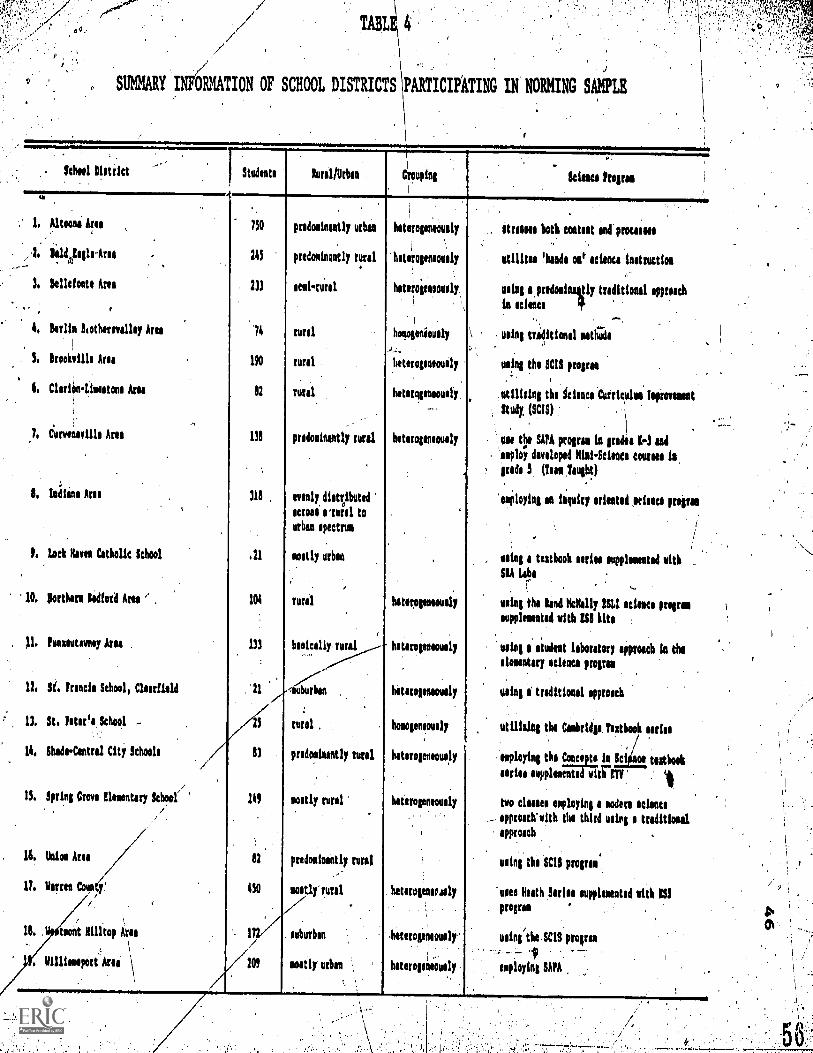
,/TABL
SUMMARY INFORMATION OF SCHOOL DISTRICTS PARTICIPATING IN NORMING SAMPLE
School Dietrict 1 Students lursl/Urben CroupinlI
1
kisses Program,
1. Altoona Ares
/2, kld ZglrArss, al
3. kliefonte Arts
4, Bedill lotherevalley Ares
!
, S. Brookville Am
4, ClariOn-Limstons Ares;
.,.7, C'enweneville Arta
8. Indiana Ares
I. Lock Alves Cotholle School
10, porthera Inford Ares 1 ,
11. honssutaney Axes .
12. Si. Trends School, Clearfield
13. St. ?sterile School -
14, Shads-Central Citi Schools
/13, Spring Crone Elemntery School'
/
18, Union Area
17, herrn Conti
le. tmost Hilltop Ate%
, \. Hillisespirt'Ares \
.,//
730
243
233
'74
170
82
138
318 ,
.21
101
133
'21 z'''
83
149
82
450
111;/
205
pridominantly urban
predominantly turd.
scskural
rural
rural
rural.
predoeinsntly rural
evenly diettibutedacme coral tourbin spectna
mostly urban
tuna
basically rursl
,
guburbsn
rural ,
prodoshantly turs1
mostly turd
predominantly turai
mostly runl
suburban .
mostly urbn
hetarogsnensly
\hsteropnsously
1 .
hotemneourly,
!
1,
hnogeniously
heteragsnouely
hotemensonly.
hsterogintoutly
heterogeneously
heterogeneously
.
betatogenansly
homogeneously
heterogeneously
heterogeneously
I
hetarogeneenly
,
letterosensously.
heterogeneOusly .
(
,
,
strosus both coatent int procosus
utilities 'bands Dal science intrados
using alredosilly itsdltiotal pproachin echoes
. using triditioaal astads
using the SCIS orogen:
,atilising ths Science Currioulum IsprovsnatStudy, (SCIS) ,
.I .
' use ths SAVA program is paiss 1.3 ad@Nolo; developed Hini-Scince courses he,grid§ 5 (Teas ;aught)
'employing ell inquiry orinted scions program
/
*sing a textbook series supplemented withSPA ltbs
using ths land Hclislly ISLI science programsupplemented with HSI kits
using s student Isborstory approach in theslematery science props§
using i traditionsl spprosch
utilizing the Cambridge Textbook 'utile
employing the in tiks men*,Conceepts
ferns supplemented witrETV: . itwo classes employing a soden science
.,. epproach-with ths third using a tuditindopined .
sling ths SCIS program',.
'uses Heath Sarin supplemented with ISOprotrai
usi,,
ng tha,SCIS progrsm
employing SAM
,
shOws a mapof the,location of the:participating School
districts. Complete ocumentation Of the broadcasting'procedural
1 '
experience inclusive the initial public relations contaCts
through.final correspondence is cited in Hill (1976).
.7Reliability- .
In cooperation. With the Elementary Supervisor'of the LeWisburg
Area Public School District, PennsylVania, an effort tO collect
47
reliability and validity data for the TTSP was undertaken. Forwe of.
the TTSP was administered to.the fifth and Sixth grade students.in
:fOur schools of the Lewisburg Area Public School Systemduring March
of 1975. In October of 1975,,-an item analysis of the norming.study
data yielded reliability information for the 3480 fifth grade Students
involved. Reliability is ttie result of internal analysis using the
Ruder-Richardson Formula 20,
Validity
Empirical validity is inferred through the relationship that
exists between scores on the,TTSP and other tests of science rocesses.
...empirical validity-provides th& evidence that atest score can'be interpreted In a particulaby showing that a relationship exis ween thetest performance on the on , and on the other,behaVior in some s (criterion) activity.(Helmstad 64, p. 112)
.In Ma-y of 1975, all'of'the fifth grade students at the tewisburg
Area Scho,oL.,District were adMinistered the McGraw-Hill Comprehensive
Tests of Basic'Skills inclusive of Test 9, the Science Test. This was
5 7
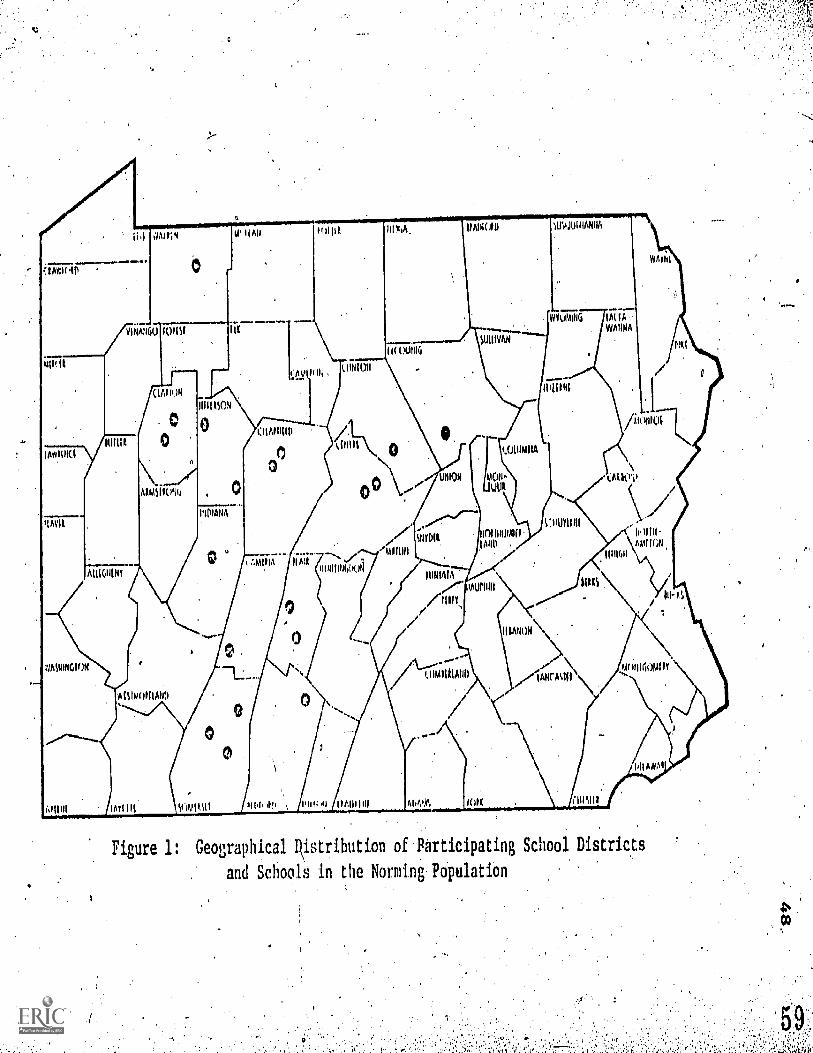
illiM00
1;4 0/0;4 1,1' I All PI OM 1104/1 PANON 'M
/V-IIIM160
0
10r1S1 IIC
1IAVVOik
OUWO
WiuMill4 1A1-1A
WAINWHIM "----
AN
011111t.
IJANIM
-,_
, ,..tiiii ii-Ali''-.." 1,Ilmtogdoi
ONWMKUAMMON
OCSWOMMID
011M MO4 Yadltt 11144!, IIic l 11411104 AIWA%I U
MIt Niqu
Figure 1: Geographical Djstribtion of Participating School Districts
and Schools in the Norming.PdpulatiOn
49
are of a total achievement testingprogram. During February, 1976,
.0.1-of the sixth grade students (the former fifth grade,students
:142-entioned above), numbering 207, were administered The Science Process .
Test (TSPT). Data.from all three,tests with additional pertinent data'
(Summarized in Appendix N) was compiled, -The information was placed
on computer data cards and a Pearson product-moment correlation'data
Matrix was generated to assess inter-correlations.
'Whereas the CTBS score§ were within a short time frame with the
'scores of the TTSP, nearly one year elapsed between the scores of the
TTSP and TSPT. During this time, the fifth-grade students were
.moved to the "Middle School" environment. Ary, et al..(1972). states:
lExcepe for the time dimension, condurrent validity'and predictive validity are very mUch-aMe. In
predictive validity, the relationship between thescores of individuals in a test of performance in afuture task is determined: whereas in concurrentvalidity, the relationship between the test scoresand a present criterion is sought. (p. 195)
On this basis a statement of. concurrent validity was inferred
from the correlation betWeen the TTSP and the'CTBS Science Score and
a statement of predictive validity was inferred from the correlation
between the TTSP and TSPT. These data. are summarized in Chapter 4.
Additional.correlational data and their implications are discussed
in Appendix N.
60
CHAPTER IV
RESULTS
Introduction
This chapter summarizes the results of this study for the various
steps involved in the modification of the TSP for the intermediate
level and adapting it for television. The procedures for the various
steps involved are'described in Chapter III. For convenience;
information Shown on computer printouts is summarized md
Abbreviated in this chapter. Photo reductions of Complete computer
printouts are cited And shoWn as.Appendices.
Establishing Content Validity
After critical analysis bk the ninety-six questions of the TSP b
the panel of judges in elementary science at.The Pennsylvania State
University, sixty-eight'questions of the original ninety-six were
identified as applicable to the intermediate level curriculum and;
eligible for revision and inclusion in a pilotitest to provide further
data. The questions recommended are shown in Table 5. See the pocket
of the theSis binding for the Test of Science Processes test booklet.
This selection,included six questions in Tannenbaum's process I
(observing), five in process II (comparing), eleven in process III
(classifying), eleven in process IV (quantifying), fourteen in process
V (measuring), eight in process VI (experimenting), seven in process
VII (inferring), and six_in process VIII (predicting).
6 1
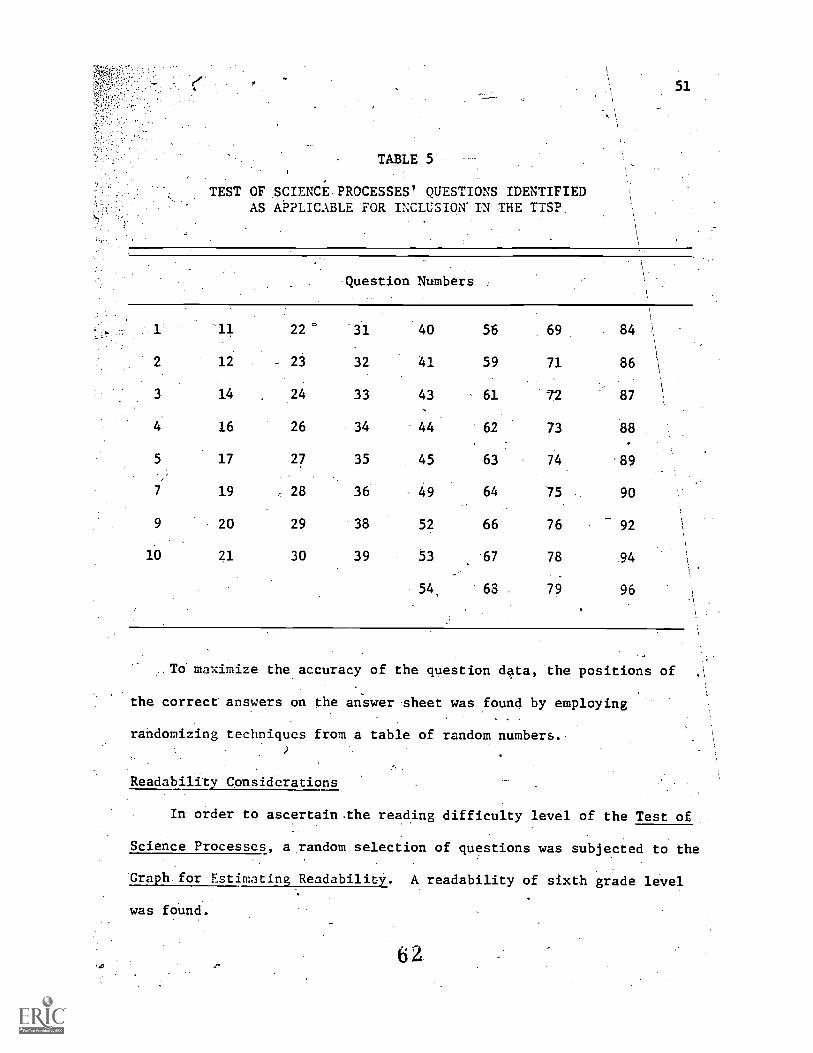
TABLES
TEST OF .SCIENCEPROCESSES' QUESTIONS IDENTIFIEDAS APPLICABLE 'TOR INCLusIoN'IN THE TTSP.
51
Question Numbers ,
\
-11 22° -31 40 56 69 84 \\
12 - 23 32 41 59 71 86
14 . 24 33 43 ' 61 72 87
4 16. 26 34 44 62 73 88
5 17 27 35 45 63 74 .89
19 , 28 36 49 64 75 90
9 20 29 38 52 66 76_.
92
10 21 30 39 53 67 78 94
54, 68 . 79 96
To maximize the accuracy of the question d4ta, the positions of
the correct' answers on the answer sheet was found by employing
randomizing techniques from a table of random numbers.
Readability Considerations
In order to ascertain.the reading difficulty level of the Test of
Science Processes, a random selection of questions was subjected to the
Graph.for Estimating Readability. A readability of sixth grade level
was found.
6 2
After selection of questioni-identified for inclusion in the ,
pilot Television Test of Science Processes, the_ verbal information of
those questions was modified in an effort to reduce their reading.
difficulty. These modified qdestions were subjected to two
52
readability measures in March df 1975. The Fry Graph for istimating
Readability was utilized to compute reading difficulty. A
..Dreadatality-of third grade was found.0 . .
A readability level was interpolated for tne data at high
second-low grade level using the Syntactic Density Score. The
complete computer printout is shown in Appendix E.
Television Production of the Test instrument
Following the identification of applicable questions and the
modification of the verbal message, the visual and verbal information
f the selected questions was adapted for television presentation.
Phase I of the television production was executed on August 6, 9 and
14, 1974. See Appendix F for a complete display of the visuals which
forM the TTSP, ForM C.
Phase II of the television production took place on October 14,
1974. 'This involved editing the TTSP, Form A tape to conform to the
time requirement of each question found in the item-response-time study
cited in Table 6. The script for this introduction was developed and
is shown in Appendix G. The complete test booklet for the sixty-eight
questions comprising Form A and B is shown in Appendix H.
63
53 -
After an item analysis of the test results of the Form B
xposure, Phase III of the television production took place on March
'27 and 29, 1975. This consisted of reVaMping_the_entire ForM B taPe
to eliminate and modify the questions in response to the data found.
in the item analySis, to renumber the selected questions,.and to add
the summary graphics. The final edit formed Form C of the TTSP.
.?
See Appendix I.for the complete test booklet.
Item-Response-Time
A pilot test of the TTSP was administered in September, 1974 to--
gather information on the hppropriate amount of time necessary to'
-maximize the exposure time of the visuals to students while minimizing
the television time. Graduatd students of The Pennsylvania State
University, Department of Curriculum and Instruction 'recorded the
time in seconds required for each student to respond to each'question.
Following the pilot exposure, the findings were tabulated and the
total question item-response-time was calculated. Table'6 is a summary
of the item-response-timè'of the ninetieth percentile of the total
time required for each question. This data formed the editing time
for production'a the TTSP, FormB.
Item Analysis
Form B of -the TTSP was administered as a pilet test to collect
statistical data for item analysis. 'The data was processed by computer
using the Item Analysis Data Progrm of the Examination Services of the
6 4
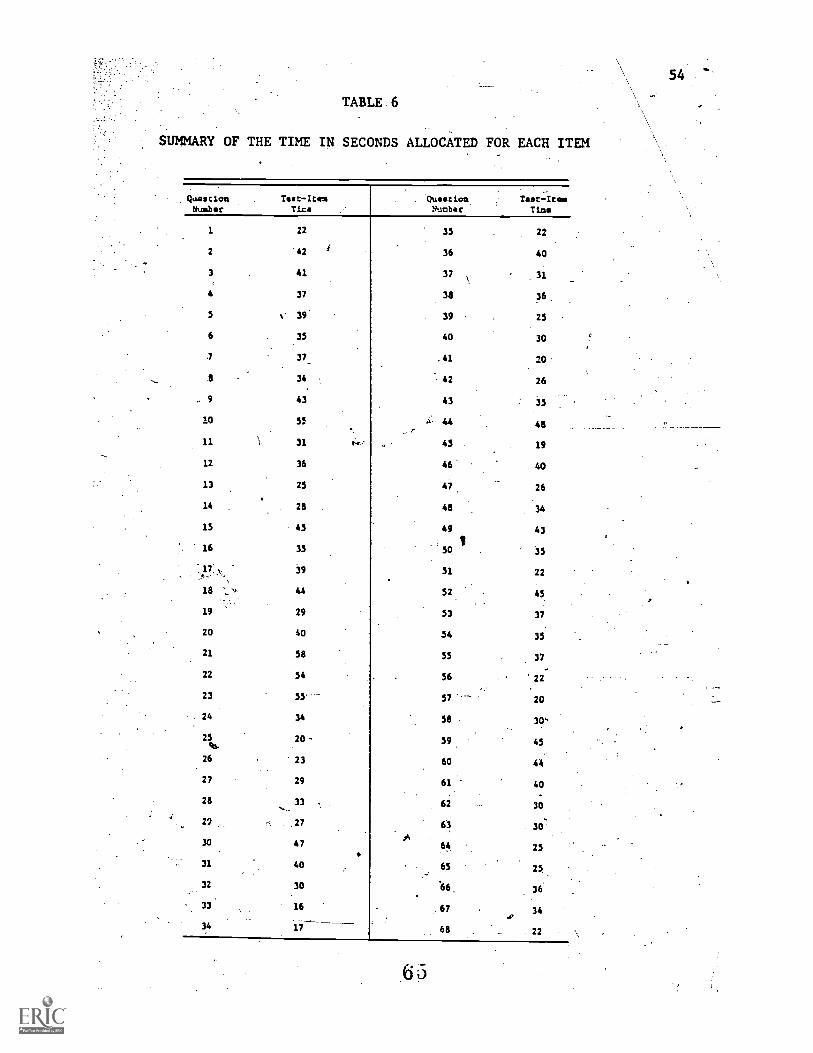
TABLE 6
54
SUMMARY OF THE TIME IN SECONDS ALLOCATED FOR EACH ITEM
QuestionNumber
Test-ItemTim.
QuetionNumber
Taat.:ites
Time
22
'42
35
36
22
40
3 41 37 31
4 37 38 36,
5 39 39 25
6 35 40 30
1 37_ .41 20.
a 34 42 26
9 43 43 55.
10 55 44 48
11 31 45 19
12 36 46 40
13 25 47. 26
14 28 48 34
15 45 49 43
16 35 501
35
117'.N
18
'39
44
51
52
22
45
19 29 53 37
20 40 54 35
21 58 55 37
22 54 56 22
23 20
24 34 58 30N
25ttS.
20 59 45
26 23 60 44
27 29 61 40
28 33 62 30
..V 65 30
47 64.
25
31 40 65 25.
32 30
33 16 67
.36
34
34 17 68 22
6 5
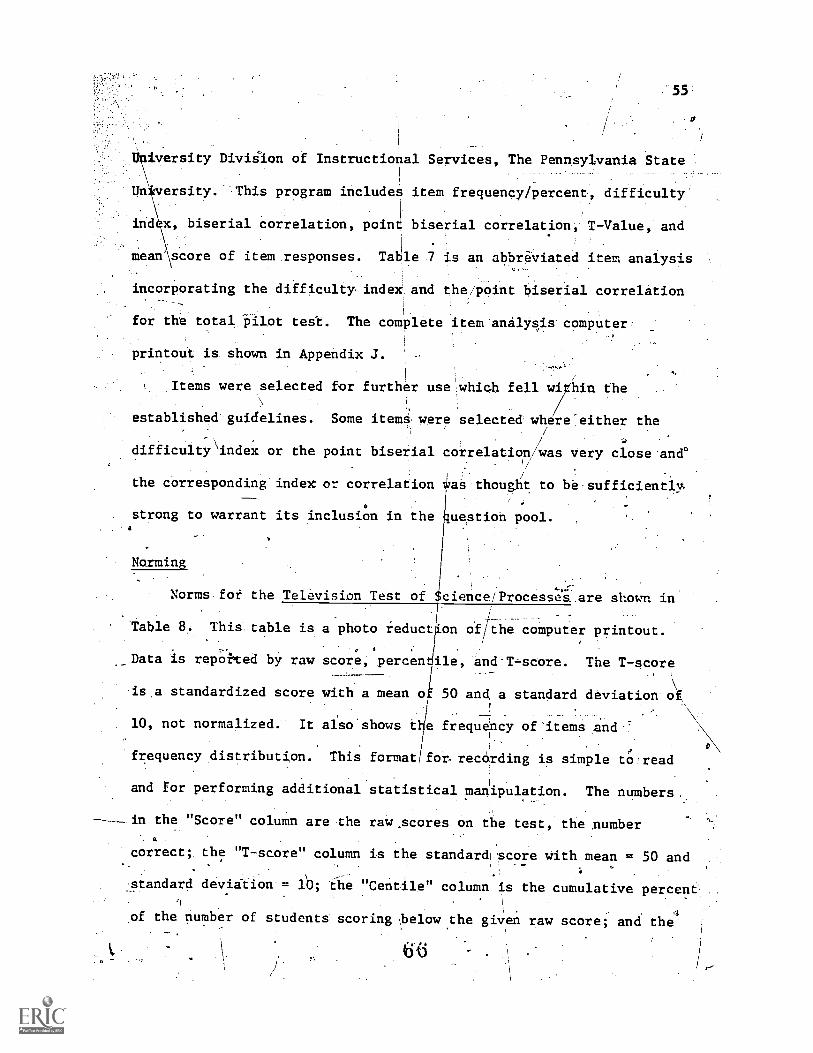
, .
I
....._
U iversity DiviSion of Instructional Services, The Pennsylvania State
,
University. This program includes item frequency/percent, difficulty..
.
55
x, biserial correlation, point biserial correlation, T-Value, and
mean score of item responses. Table 7 is an abbreviated item analysis
incorporating the difficulty index and the/Point biserial correlation; .
for the total 151lot test. The complete item:analysis computer;
printout is shown in Appendix J.
Items were selected for further usewhioh fell wi hin the\
i
establishe&guidelines. Some itemS were selected where-either the
difficulty'index or the point biserial correlation/was Very close.and°
/
the Corresponding index or correlation TilaS thought to be-sufficiently;;
. strong to warrant its inclusion in the uestion pool.
Norming
Norms for the Television Test o cience/Processes. are shown in
Table 8. This'_table is a photo ieduct on offthe computer printout.
Data is reported by raw score, percen ile, and-T..score. The T-score
.is,a standardized score with a mean o 50 and a standard deviation (if
10., not normalized.- It also'shows the frequency of'items And-'
frequency distribution. This format for- recOrding is simple to!read
and for performing additional statistical manipulation. The numbers.
--____ in the "Score" column are the raW_scores on the test, the number4
correct; the "T-score" column is the standar& Score With mean = 50 and;
standard deviitiOn-= lb; 'the "Centile" column is the cumulative percent..
of the number of students- scoring .below the giVen raw score; and thel:
6
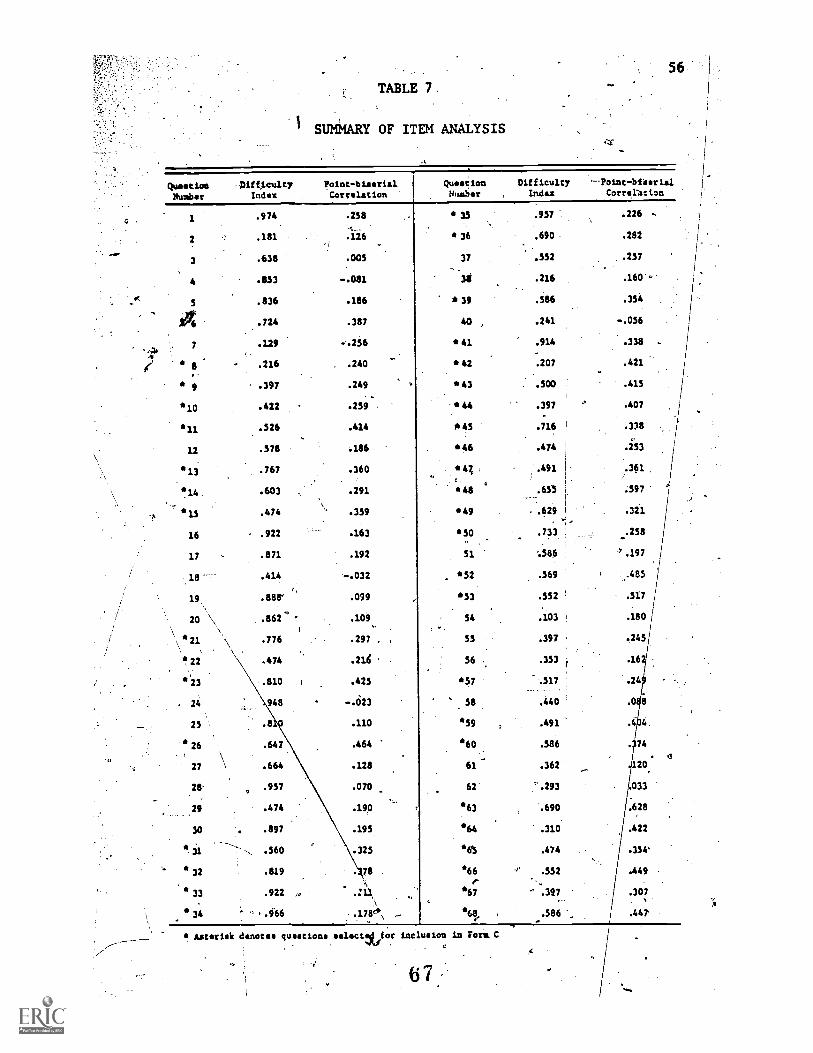
u
56TABLE 7.
1 SUMMARY OF ITEM ANALYSIS
QuestionNumber
1
2
3
4
5
7
9
*10
*11
12
*13
*14
16
17
19,
20 \\,
.\\*21
*12
*13
26
25 .
'*I6
flifOcultyIndex
Point-biaerialCorrelation
.974. .258
.181 .126
.636 .005
.853 -.081
.836 .186
.724 .367
.119 ..256
.216 .240
.397 .249
.422 .259
.526 .414
.578 .186
.767 .360
.603 .291
.474 .359
.922 .163
.871 .192
.414
.888- .099
.862.
.100.,
.776 .297 .
.474 .21i
.810 .425
948 -.623
.8
.647
27 \ .664
28 .957
29 .474
30 .897
*11 .560
32 .819
* 33 .922
* 34
.110
.464
.128
.070
.19p
.195
.325
QuearionNumber
35
* 36
37
36
* 39
40
*46
.
*48
*49
50
51
. 52
54
*53
55
*57
56
58
59
60
61
62
*63
*64
*63
66
*67
Asterisk &motes questions seloctlifOr inclusion in fora C.
67.
Difficulty
Index
--Point-bflerialCorrerarion
.957 .226 .
.690 .282
..552 .257
.216 .160 .
.586 .354
.241 -.056
'.914 .338
.207 .421
: .500 1 .415
I
.397 .407
.716 I .338
0
.474 I .253
.491 .361/
.653 .597 '
.629 .321
.733 .258
:586 / .197
.569 ..485
.517
.150: .180
.397 .245
..353 .16
.517. . .
.24
.440 .0
.491 .4. 4.
.586 74
.362 120
'.293 033
".690 :628
.310 .422
.474 .354'
4' .552 .449
.397 .107
.586 ', .447
A
-
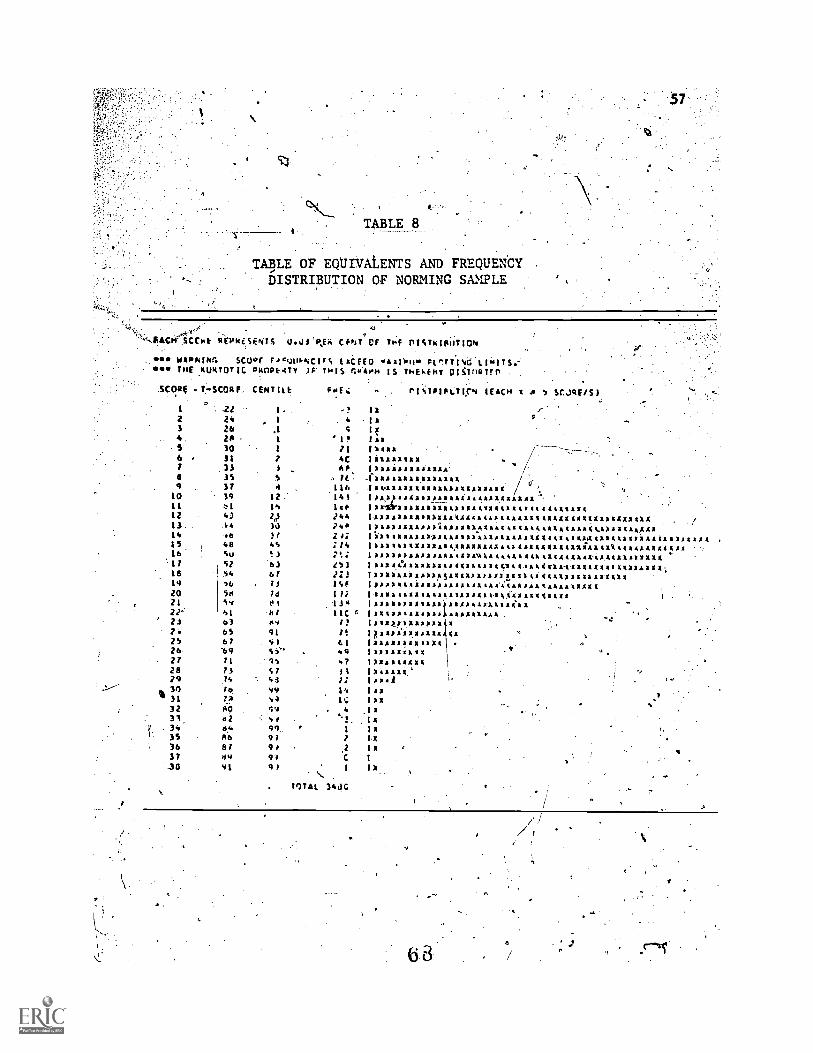
TABLE 8
TA13LE OF EQUIVALENTS AND FREQUENtY .
DISTRIBUTION OF NORMING SAMPLE
1/..)! CF141 OF 714 11511:111117109
1c,
-21 l - - ?2 24 . 1 43 26 .1 94 2$ 1 ' 1?S 30 I 116 31 1 4C7 33 f AFa 3S S9 37 of 116
10 39 12 : 141II ,,I 14 lc.,12 4:1 2r3 24413 44 3,) 2.014 .6 3/ 242IS cob 45 ;14
. I
16 5A1 ¶ 3 7'.2' 17 52 63 L43
18 .54 Id 2 2319 ,6 73 19F20 5.1 76 17;21 54 t, 4214 61 1, 1 11C ,23 63 Plo 7?7. 65 9i 2!25 67 9 I C I26 69 46' 4927 71 594 4728 73 97 1129 .74 Si 22
& 311 16 99 14' 31 7..A si IC
32 AO 99 431 62 st34 6.4. 99 I35 R6 9) 2
36 87 9 . .237 N4 94 C
-30 91 9 ) 1\1,17.31. 348C
*se wapkiNr, suer crctatf-INCitS LCfED '111.11111 LI*ITS-flEE KURTOT IC oNOPkiTY IF THIS Cu 4r4 IS THE.4,41, 01 iitA1 Till
TPIAt1-.7114 lEACHatm f-stoa F CENT ILI 4mE,4 r ,,
AX54XX
41.1X4XX XXXXXXXXXXXX AA1X/
/
1114XXXXXXXXXX JUL XXXXXX 4.44444 X A XXXXXXXXX AX441X4KAIXAAX4AX.
4414441. XX XX 4114444$4XXXX A XXXXX XX AA XX AXAAX4414.44444XXICAZ 54444AAAA(A44
AA4A4AAAk4 XXXXXX XXXX4AIXAe 144444445.41
XX X XX AX451444)X> XXXXXX X X141 AXEXAC
)4511) XXXX ) XX A
XXXXX 44
XXXXX 4(P XXXXX AA%
AP.A1XXX
A
A0
A..
SCJIE/S)
63
jrequency of each raw score. A complete item analysis is shown In
t--7.---:.:--Appendix K. A summary of the statisticil data obtained from the.
administration of Form C of the TTSP is shown'in Table 9.
Reliability
.58
Reliability was ascertained through internal analysis using the
Kuder-Richardson Formula 20 (KR-20). Data for the reliability inves-
tigation was collected and transposed to EDP cards and processed at
_
the ComOuter Center.of The Pennsylvania State University using the
IteM Analysis (ITAN1) Program of the University Examination Services.
The KR-20 reliability coefficient for the fifth grade Students.
which comprised the norming study was .736. Table 9 shows the summary
of the statistics for the norming sample of the TTSP. Form C, A
complete computer printout of the item analysis is shown in
Appendix K.
The KR-20 reliability coefficient for the fifth grade students
which comprised the validi6r study was .816. Tannenbaum cites
average KR-20 reliabilities for the TSF at.gr:des 7, 8, and 9 at .91.
Using the Spearman-Brown Prophecy Formula (Nunnally, 1967; Helmstadter,
1964) to adjust for test length, the estimate for the reliability of
the TTSP for ninety-six questions is .91. Table 10 shows the summary
of the statistics for the validity sample on the TTSP, Form,C. A-
. complete computer printout of the item analysis, table of equivalents
, and irequency distribution is shown in Appendix L.
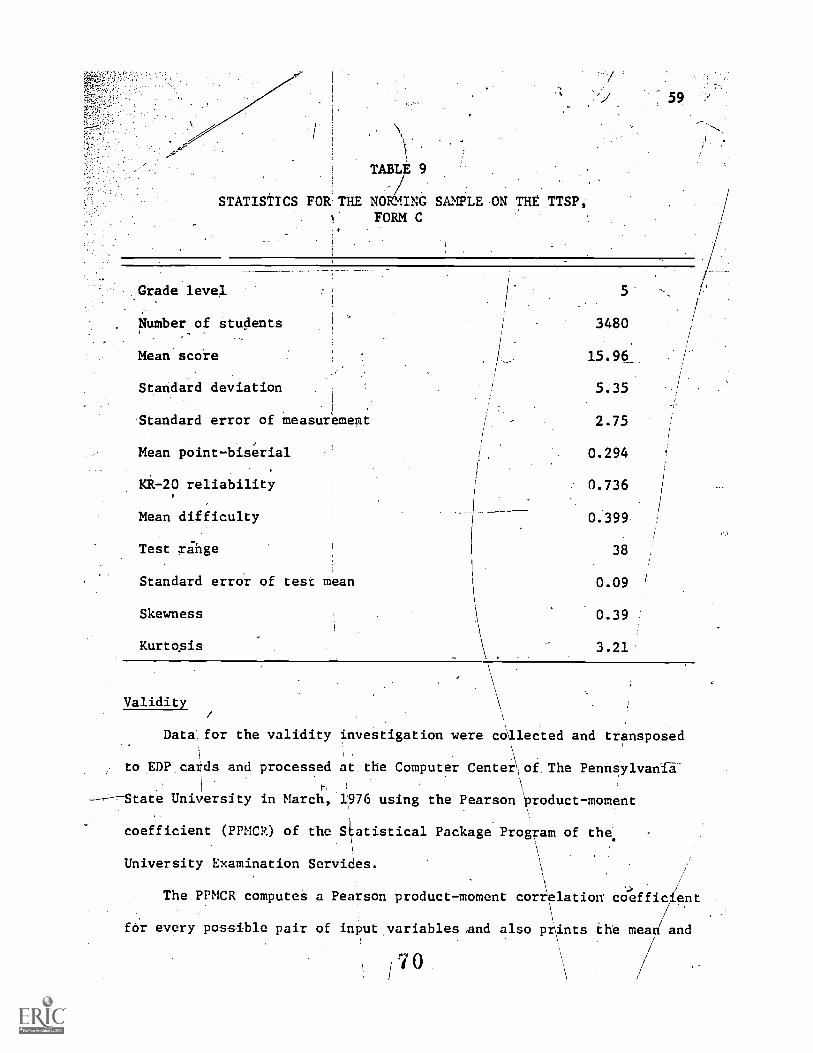
-59
TABLE 9
STATISTICS FOR. THE NOR!?;ING SAMPLE-ON THE TTSP1. FORM C
Grade level. 5
Number of students 3480
Mean score 15.96_
Standard deviation 5.35
Standard error of measurement 2.75
Mean point-biserial I. 0.294
KR-20 reliability 0.736
Mean difficulty 0.399
Test ringe 38
Standard error of test mean 0.09
Skewness 0.39
Kurtosis 3.21
Validity
Data for the validity investigation were collected and transposed
to EDP cards and processed at the Computer Center,of, The Pennsylvani-d.
----State University in March, 1976 using the Pearson \product-moment
coefficient (PPMCR) of the S6tistical Package Progtam of the.
University Examination ServiCes.
The PPMCR computes a Pearson product-moment correlation cOeffic ent
for every possible pair of input variables and also pr\ints the meat and
170.
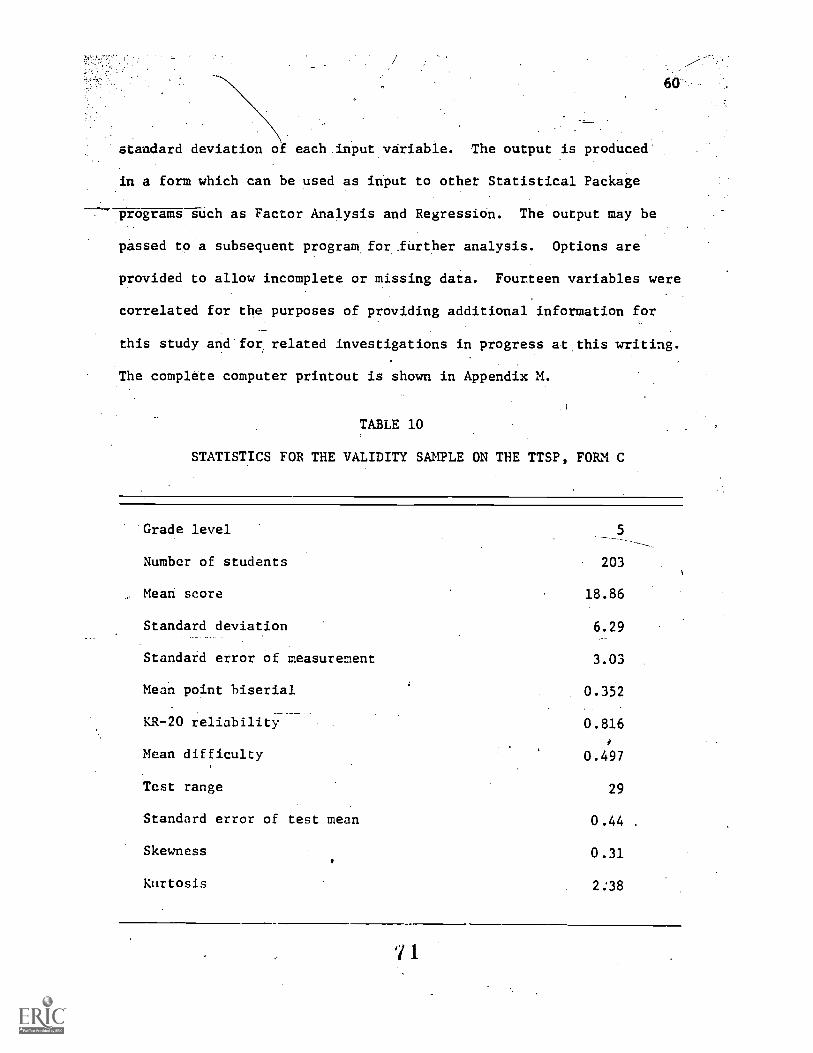
60
standard deviation of each input variable. The output is produced
in a form which can be used as input to othet Statistical Package
programsslch as Factor Analysis and Regression. The output may be
passed to a subsequent program for further analysis. Options are
provided to allow incomplete or missing data. Fourteen variables were
correlated for the purposes of providing additional information for
this study and for, related investigations in progress at this writing.
The complete computer printout is shown in Appendix M.
TABLE 10
'STATISTICS FOR THE VALIDITY SAMPLE ON THE TTSP, FORM C
Grade level 5
Number of students 203
, Mean score 18.86
Standard deviation 6.29
Standard error of measurement 3.03
Mean point biserial 0.352
KR-20 reliability 0.816
Mean difficulty 0.497
Test range 29
Standard error of test mean 0.44 .
Skewness 0.31
Kurtosis 2:38
7 1
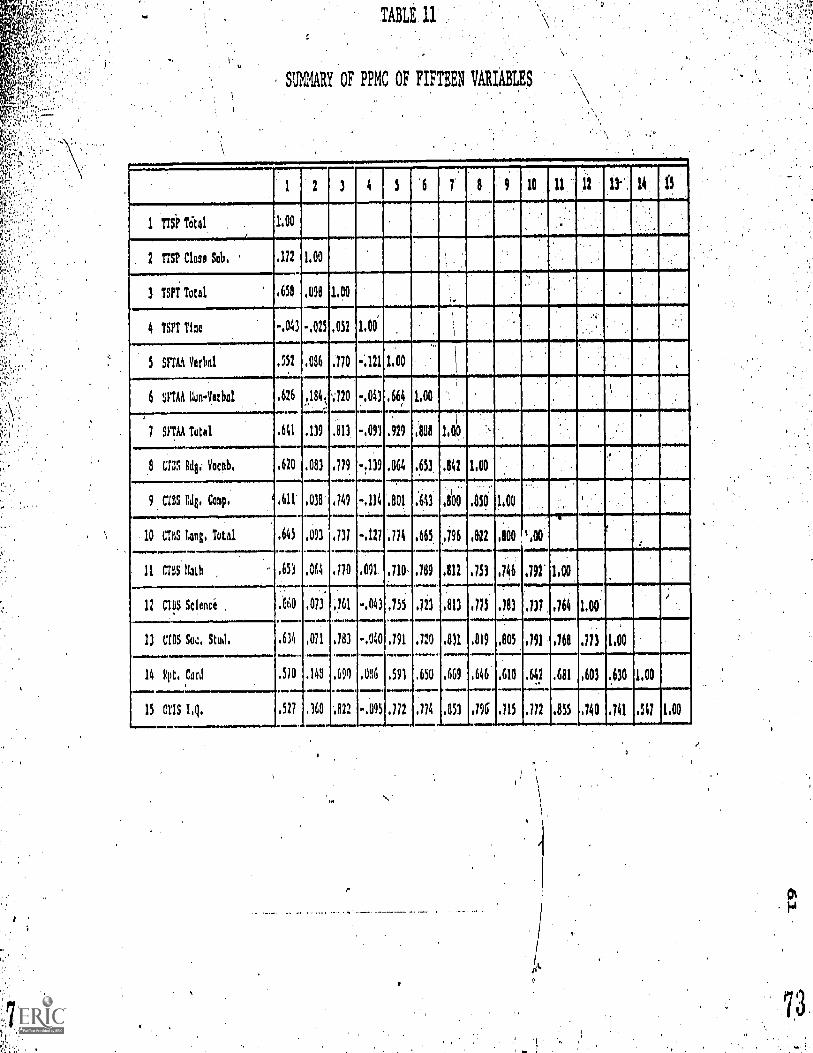
TABLE 11
, SUMMARY OF IOC OF FIFTEEN VARIABLES
10 11 12 1Y 14 ,
1 77SP T1 .
i
1.00
-;----...,.....-..,....--............------..
2 17SP Clnoo Sob. ' .172 1.00
3 7SPi Total .658 AB 140
4 1SPT Time -.041 -.025 .052 1.00
.....................................
5 SFTAA Verbal .552 .086 ;170 ;121 1.00
4.--,--........-.
,
_,,.........
6 SFIAA llon-Verba1 .626 2,184; A20 3 .666 1.00
......-.......---.....,-,.......'--.,1--
7 STA Totol .641 .139 .813, -.091 .929 .808
1
.8 MS Rdlli Vocal), .620 .083 .779 -.139 .864 .653 .042 1.00
9 CaIS Rdg. Comp. ' .611 .018 .149 .114 '.801 :643 .800 Asp' 1.00
.....-.--,-........,
10 CO 1,aq, Total As ,O13 'NI -AV Mi .665 j96.1....1.1.1.00.
812 1100 ,',00.014011.M 4.010..........IMMION.W.M.P11.1.
1.0011 CTIIS Ilaih .651 064 .170 .091
111Im+MMII0.
.710' .789 .812 .753 .746
WOIMM
.792
12 CTIIS Science ..660 .073 .161 -.043 .755, .723 .813 .775 .783 .737 , .764 1.00'
i
13 UNIS Soc. Stud. .634 .071 .783 -.040 .791 .720 .811 .019 .805 .791 .768 in 1.00
14 Rpc. Card .510 .140 .690 .006 .591 .650 .669 .646 .610 341 .681 .603 .,630 1.00
15 OTIS Lg. .527 .168 .,822 -.095 .772 , .774 .851 .796 .715 .772 .855 ,740' .741 447 1.00
ot.(
62
The correlation between the TTSP and the TSPT in this atudy was -
.66. The correlation between the TTSP and the Science Test of the
CTBS was .66. Both correlation coefficients are significantly
different from zero at the .01 level. The summary of the Pearson
product-moment correlation of fifteen variables is shown in Table 11.
74.
Introduction
.CRAPTER V
SUMMARY AND CONCLUSIONS
Therd were two objectives in this study: (1) to modify the
Test of Science Processes by Tannenbaum (1968) for use by inte mediate
level students, and (2) to adapt the test for use through the medium
of television. Information generated in this endeavor inclu ed that
which was necessary for the modification and adaptation of he
Tannenbaum instrument as well as spurious information recoi siending
further inquiry.
Summary
This was a developmental study in which a normative test-to assess
performance in the use of certain of those skills and abilities
identified as science processes by intermedite level students through
the medium of television was created through the modification and
adaptation of an existing normative testing instrument. The steps
involved were to develop an item pool consisting of those questions
from the Test of Science Processes which were representative orthe
science processes and were applicable for intermediate level students;
to rewrfte the selected quesLions so as to make them more easily read
-by intermediate level students; to produce a pilot,test; to providr
a pilot exposure to ascertain test item exposure time; to edit the
video tape for appropriate timing;- to pilot the test on a large
popujation.to amass data foy item analysis; to develop the final form
of the test by selecting questions appropriate through statistical-
64
parameter4 set by performing an item analysis; to'provide a broad
exposure of.the test to ascertain norms for target populations; and
to provide an empirical study to.gather concurrent and predictive
validity data. The steps have taken into account or considered the
standards of the American Psychological Association (1974) for test
developers of educational and psychological tests. The following is a
summary of those activities that were necessary td complete this study.
An item pool was generated from the ninety-six items of the
Test of Science Processes which were a representative sample of.the
eight science processes identified and,defined Ln Appendix B and
applicable for the intermediate level with minor revision. These
questions were chosen on the basis of their requiring the skills and
abilities recognized'as process skills and on the basis of their
applicability to intermediate level students. The question selection0
was performed by a panel of elementary science educators of The
Pennsylvania State University whose credentials reflect a high degree
f experience in research and teaching and are recognized both
nationally and internationally as possessing a high degree of expertise
by the academic community.
After the item pool was identified, an implementation procedure
was pursued to produce the print and non-print, components to form a
prototype Television Test oF Science Processes. The print component
consisted'of a television test booklet and teacher's manual. IC
involved a careful review of the verbal component, the visual digital
65
inforMation (Knowlton, 1964; ConWay, 1968), modification of the test
-items' vocabulary, and syntax to conforth to a readability level
applicable to.the intermediate level. The modified verbal
was subjected to two readability measures to ascertain its appropriate-
'ness for-the target population'. This was.performed and the resultant
study found both vocabulary and syntax to be appropriate. The results
are cited in Chapter 4 under "Readability considerations." Question
answers and distractors were scrambled in a random manner using a
table of random numbers for answer placement. Upon completion of the
total print message, it was organized_and printed in the format of the
Test of Science Proceases.
The non-print component was reviewed and organized in a television
script into the .audio and,visual modes. It was decided that the
narration of the questions and the answers were too time consuming and
were distracting. The visual information was reviewed for optimal
television presentation. For clarity of visuals, implementation of
motion where appropriate, cost considerations, and production
techniques, it was decided to record all visual information on'two-inch
video tape of broadcast quality. Using the production studio of VIPSX,
the entire verbal and visual information was produced. After an
introduction and directions for taking the test, the question visuals
and question narration preceded by the appropriate number were
recorded for each of the sixty-eight questions of the identified item
pool. From the end of.the narration to the next item, visuals were shown
'17
66
. for. ninety seconds. This vt -a tape package combined with the print'
component Iormed_Form A of the Television Test of Science Prdcesses,
the prototype or research instrument for further study.
'To ascertain the appropriate timing for each of the visuals,
Form A of ihe TTSP was subjected to an iteril response time study'. A
population of central Pennsylvania fifth grade students were identified
nnd given_Form A of the instrument. Graduate students of The
-
Pennsylvania State University recorded the times for each stlident to
ref:pond to each question inclusive of corrections. Using the rule of
the 90th percentile, a cutting time was identified for each question.
The video tape was edited to conform to the apuopriate times. Resultse7
of the item-response-time study are cited in Chapter 4. The edited
tape became Form B of the test instrument.
Plan for a pilot exposure of Form B to a large population of
dntermediate level students to derive item analysis data was
facilitated through contacts made with the Pennsylvania Department of
Education. The instrument was pilOted in a large subUrban Philadelphia
school system using closed-circuit television. Data was amassed on a
olarge population and, using established guidelines for accepting or
rejecting items on the basis of point biserial correlatJpns and
difficulty, forty items were identified for inclusion int:, Form C
of'the Television Test of Science Processes. Results of the item
analysis arc cited in Chapter'4. Revision of the entire print and non-
print component was effected to conform to the item analysis data. The
print material was revised and new booklets printed. A major edit of
78,
the video'taPe was conducted to renumber all appropriateremaining
questions, to include appropriate credits, and t6 conform to the
time li+ts of tWo thirty-minu e programs requiied for publics
broadcasting.
Public broadcasting over t e service area of the Allegheny
Educational Broadcast Council Provided massive exposute and the .
'44
gathering of a large data fund for a norming study. . Test results
from three thousand, four hundred, eighty xlifth grade students from
ninetpen school systems of varying profiles were processed and
tabulated into percentiles and T-scores and plotted into a frequency_ _
distribution. The results are cited in Chaptet .4 under ."Norming."
A study to determine validity was Initiated. In conjunction with
a large central Pennsylvania school'system, data were gathered from a
large population of.students on a variety of variables: The students
were given the TTSP, TSPT, the Science Test of the CTBS over a span of
one year. This and other data were collected within safeguards of
confidentiality and recorded on EDP cards. Information pn fifteen
ariab1es were processed usiug the Pearson pr'oduct-moment correlation
and factor analysis.proeams. Within the.guidelines established for
a statement of criterionrelated validity, it was found that the
Television Test of Science Processes, Farm C vas moderately to highly
correlated with The Science Process Test and the Science Test of the
Courehensive Test of Basic Skills.. The results are cdted in
Chapter 4 under "Validity."
usions
-e data suggests.dantent validity, appropriate readability,
- .... - _.
_
°intern 1 reliability ooefficients approximating comparable reliability
. , \
-coefiic ens of tests of Science processes,, related yalidity
through oderate-to high correlation with similar instruments, and a
norming d stribution with a moderate unimodal-skew apProximating a
normal cur e. Ihe TTSP iS a test WhiChmeasures therelative'
achievement of those cognitive skills and abilities that we term
science proc s ./This study has presented information about the-,
relative ord ring of individuals with respect;to their IISP-test
performance ( laser, 1963). A concluSion can be-inferred that the
successful forMulation of the TTSP implies thal the Test of Science
;
Processes hq's been modified for use for intermediare level students and\
has been adapnd\for use through the medium of television.
- What consti4utes, the structure of the skills 'and abilities of
science is important to identify and quantify. 17 an,effort to
ascertain the valiaity of the assumptiohs that: '(1) The Science0
Process Test is a statisitcally reliable .and vall.d instrument in
assossing Students' zbility to use tilt integrat4 prOcesSes, '(2) the
'Test oi Science Processes iS a statistically. reliable and. valid,-
instr ment in assessing achievement in the use Cf science processes,I
_ .__.
1 ,
,and 4) the.Comvrehensive Tests of Basic Skills is a 'Ireriable.and valid
111
1
instppment to assess students' ability to inves igate problems in science,
addzjtionai data was amassed. Data on fifteen Variables for the 215. ,
stu etas within the validity study were examined. These data provide
"A
:4
Information beyond the icope of this developmental .%studi,;,
69
. A ,
,,proyided sufficiently important insights,to be included as//
Mentary findings and is.discussed in Appendix N.
Limitations of the Study
supple-
Caution is Urged in the use of the lis,ted, norms. A significant,1
.
1 difference in means existS between the'norming,samOe and the reliability,
\ and validity sample. Also, a significant difference in means exists
4between the fifth grade and theqsixth grade of-the Lewisburg Areá,,schoolc
..
, ..
,population. The norming sample.was exposed to the TTSP in September of,I . -
I
their fifth grade year, while the Lewisburg students 4.1ere exposed to the,
instrument in March,of their respecLve grade years. These data suggest
\
.
,
the continuous improvement in raw scores \throughout the intermediate.,
\
grades. \Use of norming data, therefore, should be relativg to approp-\. .
\
riate time periods...
A 1.mitation on the norming data was identified through a questiOn-,1
naire cit a in the study by Hill (1976). While the test exposure for.1
the item-response-time study, item analysis pilot *exposurg, reliabilit
and validity studies i/ere under controlled conditIons, the norming stud,
exposure v.41s under normal clLssroom conditions. This included thea
"normal" telcyision viewing conditions. In a small number of situations,
.the elassroom teachers expressed concern over viewing clarity and size
of.the television image, distortion,, and vignetting! (Che truncating of
the,vi.suals).: While all items were engineered tomaximize the video
- signal; that is, the tapes used for the production were of broadcast
quallty and designed for optimum viewing transmission, some classrooms
experienced less thri optimal viewing conditions.
8 1
\.
. .. .
.RecOmmendations for Further:Research
A developmental st;ddy.of thfS hature generates needs for further/ /
.StUdy both through the findings.as'well as t& procedures. -The
findings suggest that ItTis important to defiiie t'he/tdrm science/
. ,. .,
,. ; ,.
processes. Thitdefinition must incorporate;a clear and completeH
4/
enumeration or listing,of 6heskills and:abilities eMploNed in the
sciences as w%-!11 as he further refi*ng.ofthe/skills_ana abilities.
into a possible hierarchical arrangement and;develoPmental sequence.
1 N. . % $ ,;
In!an effort to enumerate and list the.tkills common to practicing
,
I.
' scientists and to-obtain their .judgment about fhe nature of science,.
.
.1
Hogan (1969) questioned 131 scientists relative to' their.use of fifty\
. ..- .,
.,
strategies assOciated.with nine identified process s. He found tqat.
,
tht. scientists held dibfferent views about the\nature of science..' Also,I
, i: I .
he found both significant agreementand.
significant disagreemEnt in
.their regard, for the strategies: Thi tugges'tthe need to.identify
operatin paraTigms within the science community and to enumerate the
common processes in ord.er to.ascertain.ecommon definition...
A hierarchical listing of the common proceSses may bea necessary
approach to investigate the processes of science.4 To list a series of
unique, parallel skills, as do some:philosophers, may be a faulty
conceptual framework. They may,, in fact, be hie:archical Skills.
Cagra!(1970), in a discussion of the events in learning and remembering,
states:
ost scholars would agree 'that an initial event Mustbe that of attending to the .stimulus, althoughwhether sueh!attendiw is a process itself containing
2
one, two, or &Maps three stages is_a matter stillactively debated. For presentfpurposes, though, it
will be convenient simply to acknowledge.attendingas an initial event in learning, which may bethought of as a state that can be often detected byobserving what the learner isilooking at orlistening to. (Gagne,.1970, p. 72)
This passage alludes to the process of observing as a basic skill which
71
underlies other processes. Such a relationship may exist among several'
-of the process_esJt is recommended that research be undertaken to
fully define the processes of science.
An important factor in measuring process'skills at the intermediate
level is the developmentAl factor. Piaget (1969) suggests that
cognition is an invariant-develOpmentsaljprocess wit1.1 qualitatively .
distinct diff2rences betWeen the stages of thoucht as the child moves_
to more:mattit intellectual reasoning. It is during the intermediate
grade levels that the student moves from the pre-operational to the
concrete operational stage of development; These stages of development
Jiave been identified in-several studies (Johnson, 1975). Tests-Of
science, processes given in these gradeS.may tend to reflect
differentiation in_stages of development. It is recommended 'that
researeh be conducted to identify the developmental variable and its
influenee on science process tes,ting.
Questions relative to the procedure used were identified. The
TTSP was designed to be used on either black and white or color
televisioa,zeceivers. Test content was choseh so that no benefit would
acrue Ito those students who view the test in color. Several studies
83
suggest that there is insufficient evilence to suggest that coler
.W111 improve learhing from television (Chu,and Schramm, 1967).
\
Irca study to measure tt.e relative effectiveness of two types\
\
of cueing (color and black/white), Lamberski (1975) feudd;that black
and white viewing/was significantly more favorable in an immediate
72
-,
testing situation, but found no significant difference attributable tor
._cueing technIqUe at a two-week delayed test analysis. It is
recommended that an experimental study be undertaken to substantiate
or challenge this design vafiable.
It became_evident in the early stages of the study that the
development of a test instrument involved the combined expertise
froM several sources. Identifiable areas of specialization were:
educational testing and measurement, statistics, elementary science
.instrumtiim, television production al.d direction, and instructional
media research, to name a few. The complexity of the creation of a
modern test instrument requires a structure or system to access and
.organize the necessary resources and personnel to produce a reliable
and vallid testing instrument. It is recommended that a study be
4.-uniertalcen to analyze and create a model for test development to
opimize aPpropriate input and to stand.a.s. a checklist for_procedure.
84
73
BIBLIOGRAPHY
Alper-, S. William and Thomas R. Leidy. "The Impact of IrformationTransmission Through Television," Public Opinion Quarterly,
33:556-562, Winter, 1969-70.
American Association for the. Advancement of Science, Commission on'Science Education, Science Process Instrument ExperimentalEdition, 1-11, 1970.
American Association for the Advancement of Science, Commission onScience Education, Scince -- A Process Approach, An ElialuationModel and.Its Application.-- Second Report, 5,-25,- 1968.
American Association for the Advancement of science, Science.-- AProcess Approach; Descriotien of the Pro!"ram, Xerox
-.Education Division,- 10, .1967.
American'Association for the Advancement of Science, Science -- AProcess Approach; Commentary for Teachers, MiscellaneousPublications, 16-64, 1964.
American Association for the Advancement of Science, Science AProcess Approach; Commentary for Teachers,. MiscellaneousPublicationS 22-65, 1965.
Arkin, Herbert and Raymond R. Colton. Tables for Statisticians,New York:. Barnes and Noble, Inc.,1968.
Ary', Donald, Lucy Cheser Jacobs and Asghar Razavieh. Introduction tOReseardh in FdlIcation, New York: Holt, Rinehart and Winston,lnc., 1972.
Atkin,.J. J. Process in Science Education, Paper read at theNational Science Teacher AsSociation, Washington, D.'C.,
, March, 1968.
Blackwood, P. E. "Implications,of. the Findings of Recent Researchin Elementary Science Education," School Science and Math,629-634, November, 1959.
Blackwood, P. E. "Science Teaching in the Elementary School,". Science and Children, 2:21-25, September, 1964.,
Blough, Glunn 0. "Some Observations and Reflections About Science. . Teaching inthe.,Elementary School," Science and Children,
. 9:191-193, December, 1971.
8 3
Biuner, Jerome S. "The Act of Discovery," Harvard Educational. .
'Review, 31:2132,.-Winter, 1961.
BuroS,'Oscar K. The Seventh Mental Measurements-Yearbook,Highland.Park, New Jersey; Ihe Gryphon Press, 1972.
Butzow, John W. and Leyton E.-Sewell. "An Investigation ofIntroductory Physical Science Using the Test of ScienceProcesses;" Journal of Research in Science Teaching, 9:267-270,1972.
Chu, Godwin C. and Wilbur Schramm, Learning From Television: Whatthe'Research Says, WaShington, 1). C., National Associationof'Educational Broadcasters, 1967.
74
Combes, Peter and John Tiffin.' "Problems in Educational Television,"Educational TeleviSion International, 4:70-73, March, 1970. .
Conant, J. B. Modern Science and Modern Man, New York: Doubleday andCompany, Inc., 1953.
Conway, Jerome K. "Information Presentation, InformationProcessing, and the Sign Vehicle," AVCR, 16:4, 403-414, Winter,1968.
C.O.P.E.S. Conceptually.Oriented Program in Elementary Science,-New.York:.NeW York University,. 1966.
Curtis, W. C. "New Perspectives in Science,Teaching," School Scienceand Math, 66:655-660, 1966.
.Duckworth, Eleanor. "Pinget Rediscoveted," Educational ServiceSIncorporated, 2:172-175, November, 1984.
ElementaryScience Study of Educational Services, Attribute Gamesand Problems, Bones, Geo Blocks and Rocks and Charts,Manchester, Missouri: Webster Division, McGraw-HilI, 1970.
Ennis, Robert H. "Needed: Research in Critical Thinking,"Educational Leadership, 21:17-20, 39, October, 1963:
Evans, H. M. "Some Significant Trends in Science Education,"Teacher College Record, 424-429, May, 1953.
Fry, E. "A Readabilit'Y Formula that Saves Time," Journal of Re:Aiina,
513-516,, April, 1968.
Fry-, E. "The Readability Graph Validated at Primary Levels," TheReadim, Teachur., 22:534-538, March, 1969.
75
Gigue, R. M. "Process in Science for the Elementary Grades,"' Paperpresented at the National Science Teachers Association,
.Wadhington, D. C.,.:March, 1968.
-0.:'Gagne, R. M: Science.-- A Process Approaeh, in AAAS The Psychological
Basis of Science -- A Process r7-.ch, Commission of ScienceEducation. MisLL,L.Ious Pubons, 65-68, 1965.
Gagne, R. M. The Conditions of Learning, 2nd Ed., New York: Holt,Rinehart and Winston, Inc., 1970.
Glaser, Robert. "Instructional.TechnolOgy and the Measurement o-Learning Outcomes: Some Questions," American PSvchologist18:519-521, August, 1963.
Good, Carter V. Dictionary of Education, 3rd Ed., New York: McGraw-, Hill, 1973.
Gross, Lynne S. "A Case for Visucl Testing," EdUcational Instrueti-cnal'Broadcasting, 2:35-38,7April, 1969.
,
Gruber, H. E. "The Process of Science Education," Teacher College'Record, 63:367-372, Februa6', 1962."
Harvey, N. A. "Classification as an Element of Education," SchoolScience, 1:1,january, 1901.
Helmstradt-er, G. C. Princlyles of P.sycholoaical Xeasurementc'New York:Appleton-Century-Crofts, 1964.
Pill, ReLert "no. Pcveloont' Ln..4 17-..'.1en'entacion-of a Y.cd.alfor Iusc ot i:chie7.1.2nt Over 1:roadcasr.
..'lastrs Thesis, Ihe Pennsylvania StateUniversity, Xay, 1976.
Ho!;,,:in, J. ....1ements of Process in the-Research Strategiesof,.American Scientists," Un:-.)0.,1ished di.s.sertation, ThePein';ivariia State UniverF,icy, 1-37, 196'4.
Hopkins, Scmneth D., D. Werty Lefever and B. R. "Brown.. -"TV VersusTeacher Ad::linf.trat-ion of Stardized Tests: ComParability ofScores," Journa.1 of hthical.:ional Measurertient, 4:35-40, Sprint,.,1967.
-Hungerfor0., and P,nvfd T. s . "A Test to MeasureObservzItion ;,;:J Gon:)Jrisen Skill!: in S-cience," ScienceEdueation, FH)ruary, 1969.
InheJdcr, B. and J. Piac:or. The Early Crowth of LooLc 'in the Child,Londc,n: 1:ou!:1::The-and Y.ean, Paul 1964. ;
ts 7
76
Johnson, Theodore M. "An Experimental Study of the Placement ofClassification Skills in the Science -- A Process ApproachCurriculum Empaoying Piaget's Theory of Cognitive Development,".Unpublished Dissertation, The Pennsylvania State University,
. May, 1975.
Jevons, W. S. The Principles of'Science, London and New York:Macmillan and Company, 1892.
Karplus, Robert and Herbert Their. A New Look at Elementary SchoolScience, ChiCago: Rand M.cNally and_Company, 1967.
'Keeslar, 0. "A Survey of Research Studies Dealing. -with .the Elementof Scientificjlethod as Objectives.of nstruction in Science,"Science Education, 212-216, October, 1945:
Kelly, Trumean L. 'The Selection of Upper and lower. Groups for theValidation of Test Ite::.s," Journal of Educational Psycholozy,
Janbary, 1939..
Keesen, Willarn. "Statement-of Purposes and Objectives-Of ScienceEducation in the Elepentary Sc. ol," Journal of Research in-Science. Teachin, 2:3-6, 1964.
Knowlton, J. Q. "A Conceptual Scheme for the Audiovisual,Field,"Bulletin of the School of Education, Indiana University, 60:3,1964.
Lamberski, aicLir J. ."An F.Y.plorotgry Szufly in Maxlmizing.Retentinby UtIlizing-Black/Waite and Color Codig.in ViEualiedinstruction," Paper delivered to 'the Research and Theory-Division, Associntion for Educational Communications' and'1:oehr.ol Convic:n, A:ril 16, 1')75;
Landis, In, Edward X.::sonis and David Loye. "Television as-aTesting.nediu Educationnl Television, 17-20, June, 1971.
Ludeman, Robert R.; Darrell W. Fyffe, Richard W. Robinson; Glenn D.Berkheimee and Richard J. McLeod. The Science Process Test,Test !-Innunl rorm D. 1974.
MaginniS, G. H.- "Th$ Readability Grh nnd Informal RendingInventories," The R6adin,-, 'iencher, 22:516-518; March, 1969
McLeod, A., .C.D: :erkhc.imer, D. W. Tyffe, and R. W. 1:obinson.'!The Devf,1,,v.nt pf Criterion-ValiOnt-ed Test Items f.or Four.Tritt..rn_ti!d Proce5ic..-1,' .1,-,nrnal of Research in ScienceTenchiny Octor,(1..475.
8 8
Munger, Arle4e. 'The- Comparability of,Two Moees of Group TeStAdministration: Live.Versus CCTV," Educational Psychology\13:3963-3964, February, 1973.
National Society:for the Study,of Education.- -"Science Education',
for Changing Times," Rethinking Science Education,'Fifty-ninth Yearbook of the National Society-for the Study ofEducation, Part I, Chicago: University of thicago Press,33-37, 1960.
Nelson, C. H. "Evaluation Of Objectives of Science Teaching,"Science Education, 20-,27, February, 1959.
Nunnally, Jum C. Psychometric Tjleory, New York: MC;raw-Hill Book
Company, 1967.
Pennsylvania Department of Education. Science for the.Seventies:Pennsylvania's Guide for-Elementary Science; Clarion,.Pennsylvania: Clarion Foundation) 1971.
Pensinger, "Test Administration by Video Tape," EducationalTelevisiOn, September,.1969.
Piaget, Jean and Barbel Inhelder. The Rsychology of the_Child,
Ne;4 York:*Basic Books, 1969.
Piaget,.Jean. "Development ar.',?. Learning, Jo,:rna1 of.Research jnScience Te.P.Ching, 2:176-15,
Raskin, A. "Exploations in the Sciences,", Science Education,120-123, !.!nrch, 1956;
Roberts, Dennis M. '.:Th2 Relationship Becween.Certain Struetnreof Intellect FaCtors and Vocnbularv,LeaTnin at Ddfferent.Stages of Practice," Unpublished Dissertation, Florida:State University, August, 1967.
:
Rutherford, F. J. "The Role of inquiry in Science Teaching,"Journnl of Research.in Scienco Teachino, 21; 80, 1964.
Science CI:rriculum InTrovont Study, Mntcrinl Obicts, lnt.c.xaCtionsand F.y!itc:.:. to Sy:ero-; and Life CyCls, .
chicaFr.: ;!Ind Co.:idany, 1970.
Science ror the Seventies, Ph2.slir. ProjecL_Report, Prepared forthe of i'duc:iti:In by tile. Collee of Education and
--Diviqion of !re!d.c....a!,:tin of The PennsylvJnia State 'University,March, 1974..
, !Th; t '7.11 .- Scic,nc,.
!..1- 27-30, 1:1:1,:lrv: 19(,6
8 9
78
Shrigley, Robert L., Dorothy Alfke, Michael Szabo and Paul W. Welliver.".SFTS-,ITV: A Model for Implementing Statewide Curritulum Change,"
. ScienC.: Education, 59:499-503, October-December, 1975.
Spathe, George. "New Readability Formula for Primary Grade Materials,"Elementary School Journal, 53:410-413, March, 1953.
Tannenbaum, R. S. "The Development of the Test of Science Processes,"Unpublished Dissertation, 1968, Columbia University.
Thomas, R. Murray. "Testing Second Language. Listening Skills ViaTelevisioni" Audiovisual InstruZ:tion 24-.27, nay, 1975.
TOrrence,- David.R. An Evaluation of a Course of SI:tidy Compiledby the. Experienced Teacher 'le.11ows in Geography, 1967-19.63,
Unpublished Thesis, The Pennsylvania State. University, 1969..
Travers, Robert:M. nan's Information System: A Primer for MediaSpecialists and Educational Technologists, Scranton; Pennsylvania:Chandler Publishing,Company, 1909.'
. Travers, ,Robert M. W. How to Make Achievement Tests, New York:Odyssey PresS, 25, 1950.
Tyler; .Ralph W. "Forces Redirecting Science Teaching," The ScienceTeacher, 2922-25, October, 1962.
Vie'tor;'Ed-,:ard and Mariorie.S. Lerner. .Readinc.:s in Science Educionfor the Elez.ntarv School, New York: Macmillan -Company, 1975.
Welsh, W. 101 and M. O. Pella. "The Development of an Instrument.for\. Inventoryin:-, Knowle of th,-, P.:7:!!;;23 i1 c1E-1c2,"
presented at the Fol:rteenth Annual Meeting of the National.Association of Research in Science Teaching," Chicago,
b
\Illinois, Februdry, 1967.
Comprehensive Tosts of Basic Skilfs, Lcvel 2, Form S,Manual, Monterey: CTB/McGraw-Hill, 1973.
APPENDIX A
LETTER OF RELEASE
91
.0%
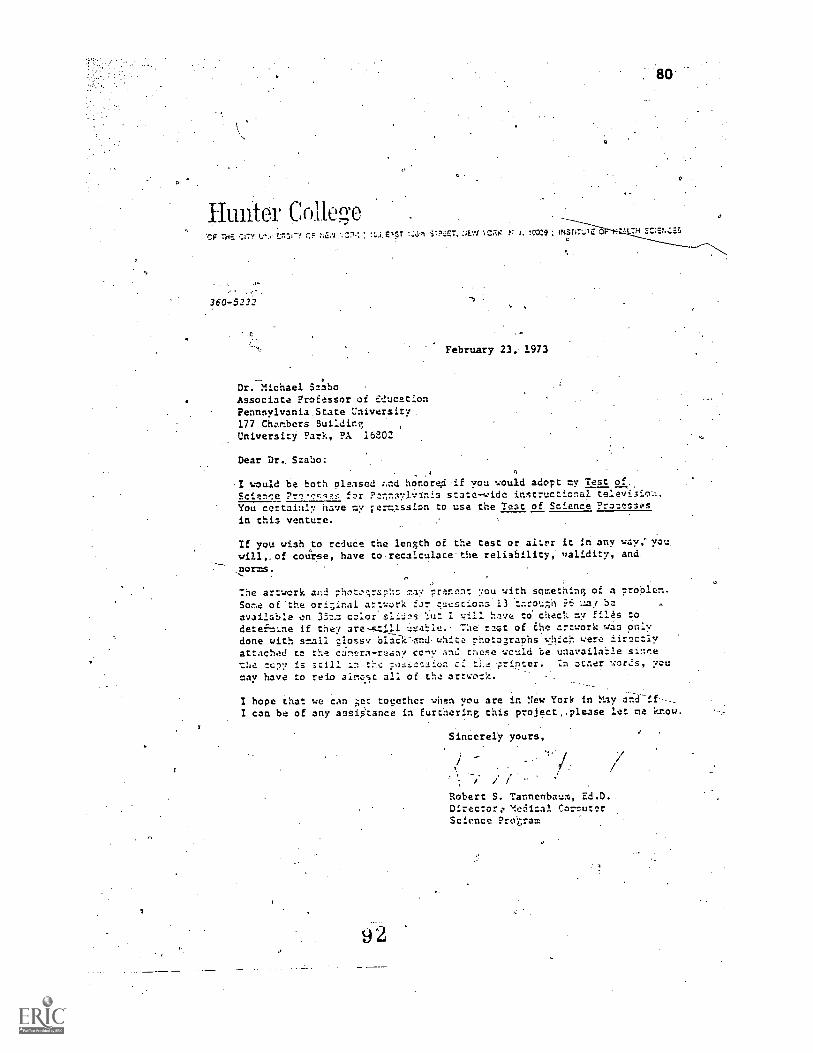
fl
Hunter Collegerriol r.F I %C.71;: ; E T o i!PaCT. :veil ..CAR r. ?C0:9 114STITF-14-4
360-5232
February 23, 1973
Dr. Michael SzaboAssociate Professor of EducationPennsylvania.State University .
177 Chambers BuildingUniversity Park, ?A 16E02.
Dear Dr, Szabo:
: .80-
.1 would be both pleased ....ad honored -if you would adopt my Test of,.Sete for Ponnsylvanis state-wide instructional teleViaio..:.You certainly nave my ;-ermission to use the Test of Science Proteast.s
in this venture.
If you wish to roduCe the length of the test or aiLer it In any way,'you:wi/l,.of course, have torecalculace-the reliability, validity, and.,norms.
The artwork and rhotographs ma! #encnr you with something of a oroblem.Some of ..the ori;inal artwork for cuestions 13 .taro,47,h ua! Sa
available on 357.= color sliZ2s / will have ta chee; my .fila to .
deteimine if they are-r.1 uebiu. The :cat of Ehe artwork was onlydone with small ....:lossy blaCk-.aad-uhitc:. phota;raphs which were aircatlyatrach.ld to the canera-raa! cony ant: c:kose wculd be unarailahle since
co??.is >till tn. rho :.2.ocsaica a: :1;:e. ;ripter. Ia atzer ?oumay have to redo ainc.sc ail of tho artwork.
I hope that we can i;or to5other when you are in New York In May aad-if--I can be of any assii'tance in furthering this..project,.please let me know.
Sincerely yours,
92
; / / /-
Robert S. Tannenbaum, Ed.D..Director: %edizal CorouterScience Program
.c
APPENDIX-i- ;
ABRIDGED.SUMMARY OF THE rROCESSESAND'THEIR RESP2CTIVE BEHATLORS
9 3
-37
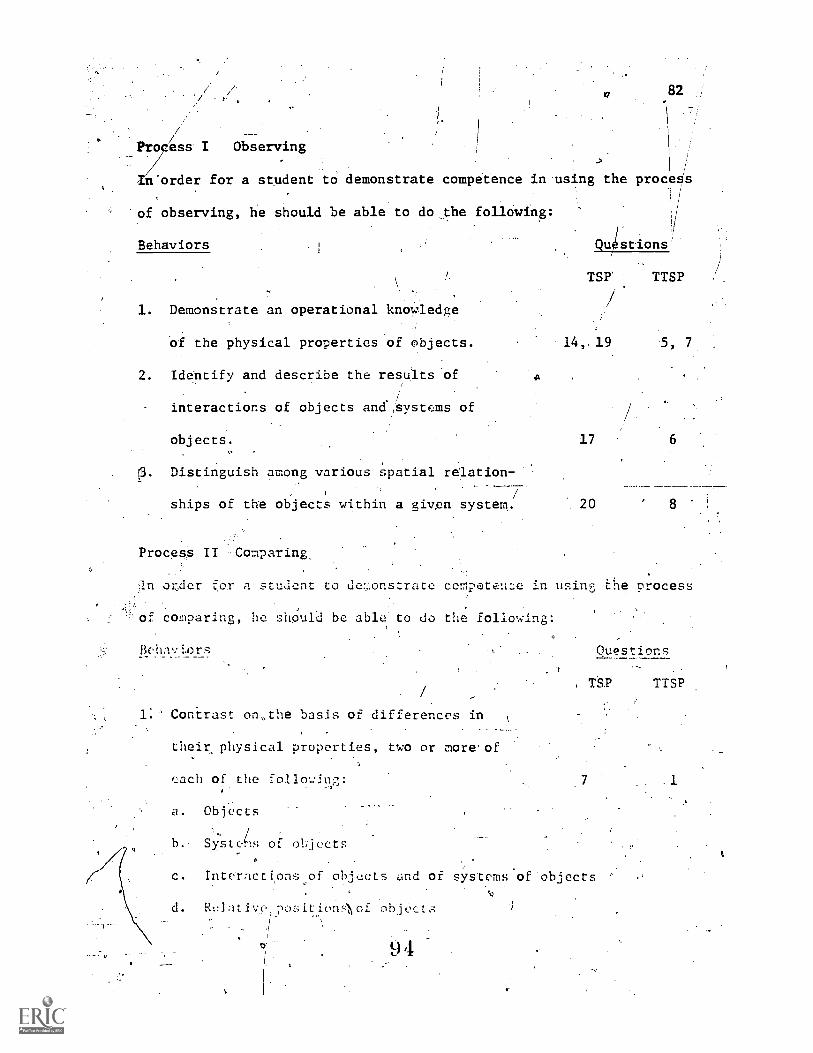
82
Process I Observing-
n'order for a student td demonstrate competence in using the process
'of observing, he should be able to do the following:
Behaviors
1. Demonstrate an operational knowledge
of the physical properties of Objects.
2. Identify and describe the results of
interactions of objects and,Systems of
r.B
QustIons'
TTSP
14, 19 5, 7
objects. 17 ' 6
Distinguish among various spatial relation-. -
ships of the objects within a given system. . 20 8
Process. II -Comparing,
.1n order for a student co de:;ionstrate competehze in using the process
of comparing, he should be abli2 to do the following:
BehavLors
)
1: Conirast on,the basis of differences in
thei. r physical properties, two or more.of
each of the followin;.::
a. Objects
b. Systes of objectr,
Ouestions,
TSP TTSP
c. Interacti,ons of objects and of systems of objectsv
d. Rclntivp.;lositionAof objects 1
9 4
1

Process III Classi ying;
_I
I order to demonStrate competence in using the process of classifying,'
the:student shoUld be able to do the following:
Behaviors. QueStiond
TSP TTSP
\
1. Group objectsor systems of objects acordng
to a.given property, 10 2-
83
. Select and justify anlappropriate property
and group objects orsystems of.objeCts
/ ,according to that'prLperty.
I . !
. Select and justify t o or more appropriate
I
simultaneous properties and.group bjects
f
or systeMs of objects according to these
.properties. 4 -
-4, Oiven a groui) of oblJects, identify the
property or'ipi-operties on which they are
-,27 9
28, 29 10, 11
grouped. 1l
Process IV ..Quantifyirve
In order.for a student to demonstrate competence in using the process
of quantifying,: he Shou
Behaviors
d be able to do the following:
1. Dpmonstrate an operationalAcnowledge of
ordindl and cardinal numbers up to one:
million and c,f negatlive nupbers.
QUesti ns,
1
TSP TTSP

Be able to arrange and to iead data in6
various graphic and tabular formats.
Process V Measuring
6
-64
38; 39 -13, 14.
40; 41
In order for a student to demonstrate competence in using the process
of measuring, he should be able to dote EollowIng:
ileitaviors
Dmonstrate.a4 operational knowledge of
units of measre, the function of wid"ely,
accepted units, the names and appropriate
siZes of the most common units such as inch,
.oot, centirzer, Tanner, pouhd, quart, gram,
kilogram, liter, second, degree, Qelsius, et
2. pemonstrate,an operational knowl/edge of area
'and volume in terms of one-, two-, and three-
dimensional measurements (e. a=1 2 and'
a=lxw; v=13, v=h a-hx12; aid v=h x 1 x 56 ,
Be able to measue time.r
4. Be able to measdr the rate of change of a
property ofn bje'ct or a,srstemlof objects. 22
5. Represent and ecognIzethe spatial relation-
ships among twp 'or mere objects by A scale/
diagram (mapping).I 63, . .25, 26
Recognize the'apptopriat n s and limitatioils
,
a
!of mezysuring ',devices in a given situatiOn'. 43 117 '
I
9
Questions
TSP TTSP
I../52,/ 54 p,.,20.s.
. -124,.27
144 18

L
.

one, two, or &Maps three stages is_a matter stillactively debated. For presentfpurposes, though, it
will: be convenient simply to acknowledge.attendingas an initial event in learning, which may bethought of as a state that can be often detected byobserving what the learner isilooking at orlistening to. (Gagne,.1970, p. 72)
This passage alludes to the process of observing as a basic skill which
underlies other processes. Such a relationship may exist among several'
-of the processs-_Jt is recommended that research be undertaken to
fully define the processes of science.
An important factor in measuring process-skills at the intermediate
level is the developmental factor. Piaget (1969) suggests that
cognition is an invariant-develOpmentaljprocess witIA qualitatively .
distinct diff2rences between the stages of thoucht as the child moves
to more:mattit intellectual reasoning. It is during the intermediate
grade levels that the student moves from the pre-operational to the
concrete operational stage of development. These stages of development
Jiave been identified in-several studies (Johnson, 1975). Tests-Of
science, processes given in these gradeS.may tend to reflect
differentiation in_stages of development. It is recommended 'that
researCh be conducted to identify the developmental variable and its
-influenee on science process tesxing.
Questions relative to the procedure used were identified. The
TTSP was designed to be used on either black and white or color
television<eceivers. Test content was choseh so that no benefit would
acrue Ito those students who view the test in color. Several studies
83
suggest that there is insufficient evilence to suggest that color
\
will improve learning from television (Chu and Schramm, 1967). '
\
In' a study to measure tt.e relative effectiveness of two types\
of cueing (color and black/white), Lamberski (1975) founa!that black
and white viewing/was significantly more favorable in an immediate
testing situation but found no significant difference attributable to
_cueing technique at a two-week delayed test analysis. It is
recommended that an experimental study be undertaken to substantiate
or challenge this design variable.
It became_evident in the early stages of the study that the
development of a test instrument involved the combined expertise
froM several sources. Identifiable areas of specialization were:
educational testing and measurement, statistics, elementary science
,instrucltiim, television production al.d direction, and instructional
media resparch, to name a few. The complexity of the creation of a
modern test instrument requires a structure or system to access and
.organize'the necessary resources and personnel to produce a reliable
aril vallid testing instrument. It is recommended that a study be
4.
-un ertalcen to analyze and create a model for test development to,.
4I
op imize appropriate input and to stand.as a checklist for _procedure.
!
84
BIBLIOGRAPHY
Alper-, S. William and Thomas R. Leidy. "The Impact of IrformationTransmission Through Television," Public Opinion Quarterly,
33:556-562, Winter, 1969-70.
American Association for the. Advancement of Science, Commission on'Science Education, Science Process Instrument ExperimentalEdition, 1-11, 1970. ,4
American Association for the Advancement of Science, Commission onScience Education, Scince -- A Process Approach, 2,n EaluationModel and.Its Application.-- Second Report, 5,-25,- 1968.
American Association for the Advancement of Science Science -- AProcess Approach; Desctiotien of the Pro!"ram, Xerox
-.Education Division,- 10, .1967.
American'Association for the Advancement of Science, Science -- AProcess Approach; Commentary for Teachers, MiscellaneousPublications, 16-64, 1964.
American Association for the Advancement of Science, Science AProcess Approach; Commentary for Teachers,. MiscellaneousPublicationS 22-65, 1965.
Arkin, Herbert and Raymond R. Colton. Tables for Statisticians,New York:. Barnes and Noble, Inc.,1968.
Ary., Donald, Lucy Cheser Jacobs and Asghar Razavieh. Introduction to.Researdh in FdlIcation, New York: Holt, Rinehart and Winston,lnc., 1972.
Atkin,.J. J. Process in Science Education, Paper read at theNational Science Teacher AsSociation, Washington, D.'C.,
, March, 1968.
Blackwood, P. E. "Implications,of. the Findings of Recent Researchin Elementary Science Education," School Science and Math,629-634, November, 1959.
Blackwood, P. E. "Science Teaching in the Elementary School,". Science and Children, 2:21-25, September, 1964.,
Blough, Glunn 0. "Some Observations and Reflections About Science. . Teaching inthe.,Elementary School," Science and Children,
. 9:191-193, December, 1971.
8 3
.74
Bruner, Jerome S. "The Act of Discovery," Harvard Educational.. .
/eview, 31:2132,.-Winter, 1961.
Buro,.Oscar K. The Seventh Mental Measurements.Yearbook,. Highland. Park, New Jersey; .The Gryphon Press, 1972.
. .
Butzow, John W. and Leyton E.-Sewell. "An Investigation ofIntroductory Physical SCience Using the Test of ScienceProcesses;" Journal of Research in Science Teaching, 9:267-270,1972.
Chu, Godwin C. and Wilbur Schramm, Learning From Television: Whatthe'Research Says, Wahington, 1). C., National Associationof'Educational Broadcasters, 1967.
.Combes, Peter and John .Tiffin.' "Problems in EducatiOnal Television"Educational Televi.sion International, 4:70-73, March, 1970. .
Conant, J., B. Modern Science and Modern Man, New 'York: Doubleday and.Company, Inc., 1953.
Conway, Jerome K. "Information Presentation, InformationProcessing, and the Sign Vehicle," AVCR, 16:4, 403-414, Winter,1968.
C.O.P.E.S. Conceptually.Oriented Program in Elementary Science,-New.York:NeW York University,. 1966.
Curtis, W. C. "New Perspectives in Science,Teaching," School Scienceand Math, 66:655-660, 1966.
.Duckworth, Eleanor. "Piaget Rediscovered," Educational ServiceSIncorporated, 2:172-175, November, 1984.
ElementaryScience Study of Educational Services, Attribute Gamesand Problems, Bones, Geo Blocks and Rocks and Charts,Manchester, Missouri: Webster Division, McGraw-Hill, 1970.
Ennis, Robert H. "Needed: Research in Critical Thinking,"Educational Leadership., 21:17-20, 39, October, 1963:
Evans, H. M. "Some Significant Trends in Science Education,"Teacher College Record, 424-429, May, 1953.
Fry, E. "A Readabilit'y Formula that Saves Time," Journal of Re:Aina,
513 -516,. April, 1968.
Fry-, E. "The Readability Graph Validated at Primary Levels," TheReadim, Teachur, 22:534-538, March, 1969.
C
Gigne, R. M. "Process in Science for the Elementary Grades," Paperpresented at the National Science Teachers Association,.Wadhington, D. C.Ifarch, 1968.
:Gagne, R. M: Science.-- A Process Approaeh, in AAAS The PsychologicalBasis of Science -- A Process 7,r-r3c1.1, Commission of ScienceEducation. us Pubions, 65-68, 1965.
Gagne, R. M. The Conditions of Learning, 2nd Ed., New York: Holt,Rinehart and Winston, Ine., 1970.
Glaser, Robert. "Instructional.TechnolOgy and the Measurement o--Learning Outcomes: Some Questions," American PSychologist18:519-521, August, 1963.
Good, Carter V. Dictionary of Education, 3rd Ed., New York: McGraw-, Hill, 1973.
Gross, Lynne S. "A Case for Visucl Testing," Educational Instructitnql'Broadcasting, 2:35-38,7April, 1969.
Gruber, H. E. "The Process of Science Education," Teacher CollegeRecord, 63:367-372, Februa6', 1962;
Harvey, N. A. "Classification as an Element of Education," .School :
Science, 1:1,january, 1901.
Helmstradt-or, G. C. Prinelples of Rsvcho1ozica1 MeasuremenC,'New York:Appleton-Century-Crofts, 1964.
Pill, Robert "Tlie Ticvelcnt. Im.'.1em'entacion-of a Y.cd21for :ust 1.,chient Over 1:readcnsr.
.;:n7td-)1.ishiA ..-Insters Thesis, Ihe Pennsylvania StateUniversity, !ty, 1976.
Ho:yin, J. 'nit:me:Its of Froccss in the-Research Strategiesof American Scientists," Un:)0.,1ished dis.sertation, ThePe;-'Insylvani Stte University, 1-37, 196'4.
Hopkins,. Vcmn,nth D., D. Welty Lefever and B. R. "Brown.. -"TV VersusTeacher Ad::linitration of Stan,iardized Tests: ComParability of ,
Scores," Journaj of Hucationl Nonsureraent, 4:35-40, Sprin7.,
-Hungorford, and Pnvid "A Tst to MeasureObservotion Con:rlsen Skill:. in S-cience," ScienceEdueation, 53:61,66; Filruary, 1969.
InheJder, B. nnd J. Piac:or. The Early Cro:...th of Lo7jc 'in the Child,Londc,n:. 1iut1::.The-and Pau1 Lt;.;%, 1964. ;
76
Johnson, Theodore M. "An Experimental Study of the Placement ofClassification Skills in the Science -- A Process ApproachCurriculum Empaoying Piaget's Theory of Cognitive Development,".Unpublished Dissertation, The Pennsylvania State University,
. May, 1975.
Jevons, W. S. The Principles of'Science, London and New York:Macmillan and Company, 1892.
Karplus, Robert and Herbert Their. A New Look at Elementary School'Science, ChiCago: Rand McNally and_Company, 1967.
'Keeslar, 0. "A Survey of Research Studies Dealing. -with .the Elementof Scientificjlethod as Objectives.of nstruction in Science,"Science Education, 212-216, October, 1945:
Kelly, Trurfan L. 'The Selection of Upper and lower. Groups for theValidation of Test IteLls," Journal of Educational Psychelocy,30:17-24, Janbary, 1939.
Keesen, Willarn. "Statement-of Purposes and Objectives- Of ScienceEducation in the Elerpentary So: ol," Journal of Research inScience. Teachin, 2:3-6, 1964.
Knowlton, J. Q. "A Conceptual Scheme fot the Audiovisual,Field,"Bulletin of the School of Education, Indiana University, 60:3,1964.
Lamherski, aicEnrd J. ."An F.Y.plorotgry SzudY in Maxlmizing.Retentiahby UtIlizin Black/White and Color Coding.in ViEualied
- Instruction," Paper delivered to the Research and Theory-Division, Associntion for Educational Communications and'
Convent:i.,7;n, Paila7;, A:ril 16, 1975; '
Landis, I'an, Edward X.::sonis and David Loye. "Television as aTesting Mediu:7'1 Educational Television, 17-20, June, 1971.
Ludeman, Robert R.; Darrell W. Fyffe, Richard W. Robinson; Glenn D.Berkheimee and Richard J. McLeod. The Science Process Test,Test ?-lanunl rorm D. 1974.
MaginniS, G. H.- "Th$ Readability Grh nnd Informal RendingInventories," The R6adin,-, 'leacher, 22:516-518; March, 1969
McLeod, A., .C.Ir: :erkhelmer, D. W. Fyffe, end R. W. Lobinson.'!The Devf,l,,y.rent of Criterion-Vhlida-ed Test Items f.or Four.
Tritvrated Sc!ohce Procc5ic..-1," .1,-,nrnal of Research in ScienceTenchiny Octor,(1'.475.
: 7
Munger, Arle4e. 'The- Comparability of,Two Moees of Group TeStAdministration: Live.Versus CCTV,-" Educational PsychologY\13:3963-3964, February, 1973.
National Society:for the Study:of Education.- -"Science Education',for Changing Times," Rethinking Science Education,'Fifty-ninth Yearbook of the National Society-for the Study of )Education, Part I, Chicago: University of hicago Press,33-37, 1960.
Nelson, C. H. "Evaluation Ef Objectives of Science Teaching,"Science Education, 20-,27, February, 1959.
Nunnally, Jum C. , Psychometric Theory, New York: MC;raw-Hill BookCompany, 1967.
Pennsylvania Department of Education. Science for the.Seventies:Pennsylvania's Guide for-Elementary Science; Clarion,.Pennsylvania: Clarion Foundatica) 1971.
Pensinger, "Test Administration by Video Tape," EducttionalTelevisiOn, September,,1969.
Piaget, Jean and Barbel Inhelder. The P.sychology of the_Child,
Ne;4 York:'Basic Books, 1969.
Piaget,.Jean. "Development ai Learning,P Journal ofResearch inScience TcP.Ching, 2:176-15,
Raskin, A. "Exploations in the Sciences,". Science Education,120-123, l!nrch, 1956;
Robev..s, DenAs M. '.:Thn Reiationship BecweenCertain Structuire-of Intellect FaCtors and Vocabulary,Learnin at Ddfferent.Stages of Practice," Unpublishcd Dissertation, Florida-State University, August, 1967.
. ,Rutherford, F. J. "The Role of inquiry in Science Teaching,"
Journnl of Rt?search.in Science Teachin.c. 21; SO, 1964.
Science CI:rriculum 1-7.:pruvont Study, !:ntcrin1 Obicts, 111,...c.,raCtions
and 1-..y!itc. Lo and Life CyCls, .
chicaFr:: 1. Co.:idany, 1970.
Science ror Lbe Seventies, PIProjEcRport, Pre.pared forthe Dr.L:7.ent. of l'(luc:ition by Lhe. Collee of Education and
---Diviqi(rn of 1',re:d.ca!,:tin of ne PennsylvJnia State Thliversity,March, 1974..
. -
c.,:.; 1.1!.11 SCi(11(. ,
r 27 -3() , ,-- 1 eP",6..
8 9
78
Shrigley, Robert L.,YDorothy Alfke, Michael Szabo arid Paul W. Welliver.".SFTS-,ITV: A Model for Implementing Statewide Curritulum Change,"
. ScienC.J Education, 59:499-503, October-December, 1975.
Spache, George. "New Readability Formula for Primary.Grade Material's,"Elementary School Journal, 53:410-413, March, 1953.
Tannenbaum, R. S. "The Development of the Test of Science ProcesseS,".".Unpublished Dissertation, 1968, Columbia University.
Thomas, R. Murray. "Testing Second Language. Listening Skills ViaTelevisioni" Audiovisual Instru'Ltic,n;24-727, nay, 1975.
TOrrence,- David.R. .An Evaluation of a Course of SI:tidy Compiledby the. Experienced Teacher 'le.11ows in Geography, 1967-19.63,
Unpublished Thesis, The Pennsylvania State. University, 1969..
Travers, Robert:M. Man's Information system: A Primer for MediaSpecialists and Educational Technologists, Scranton; Pennsylvania:Chandler Publishing Company, 1909.'
Travers, ,Robert M. W. How to Make Achievement Tests, New York:Odyssey PresS, 25, 1950.
Tyler; .Ralph W. "Forces Redirecting Science Teaching," The ScienceTeacher, 29:22-25, October, 1962.
Victor, Ed-,:ard and !,!ariorie S. Lerner. P.-..adinc:s in Science Edneionfor the Elentarv School, New York: Macmillan Company, 1975.
Welsh, W. W. and M. O. Pella. "The Development of an Instrument *forKnowlee or th,-, Prz_.(.23 of (.'ienc2,"
presented at the Fol:rteenth Annual Meeting of the NationalAssociation of Research in Science Teaching," Chicago,\Illinois, Februdry, 1967.
\
Comprehensive Tosts of Basic Skills, Level 2, Form S, ExaMiner'sManual, Monterey: CTB/McGraw-Hill, 1973.
APPENDIX A
LETTER OF RELEASE
91
.0%

Hunter College7i1=1 c:F :;EYI EA:UT :.;6'21 i7PacT. :veil N :con
360-523.2
February 23, 1973
Dr. Xlchael SzaboAssociate Professor of EducationPennsylvania.State University .177 Chambers BuildingUniversitY Park, FA 16802
Dear Dr, Szabo:
. 80
,3 0
.1 would be both pleased :,nd honored -if you would adopt my Test of..
Science Pro!.:-.1, for Ponasylvania state-wide instructional teleV13ion.You certainly have my ;-ermission to use the Test of Science ?rotesst.s
in this venture.
If you wish to roduCe the length of the test or alter it In any way,'you:will,.of course, have to.recalculace.the reliaSIlity, 'validity, and
,norms.
The artwork and rhntogrz:ps prtfInt you with something of a oroblem.
Some of :he artwork :or buestioas 13 .tarough a, ba
available on 35:= color slid2s ':.ut I will hav to thee!: my fls to
detene if they are-szl.L.I. Usable. T'ae rest of Ehe artwork was only
done with =all 0.ossy blaCk-A-nd-whita photop-aphs which were airtatlyattached to the camern-raa! cony and c:-kese would be unavailable sincethe cc7; is still ;.:1' t :o6scsaio r. c: t!:,1 -printer. :n otaer words, you
=ay have to reio almo.sc ail of the artwork.
I hope that we can i;c: to5ether when you are in New York in MayI can be of any assis'tance in furthering this..project,.please let me know.
Sincerely yours,
. 4/ / /
-
Robert S. Tannenbaum, Ed.D..Director; %edizal CorouterScience Program
92
APPENDIX-i-
ABRIMED.SUMMARY OF THE rROCESSESAND'THEIR RESP2CTIVE BEHATIORS
9 3
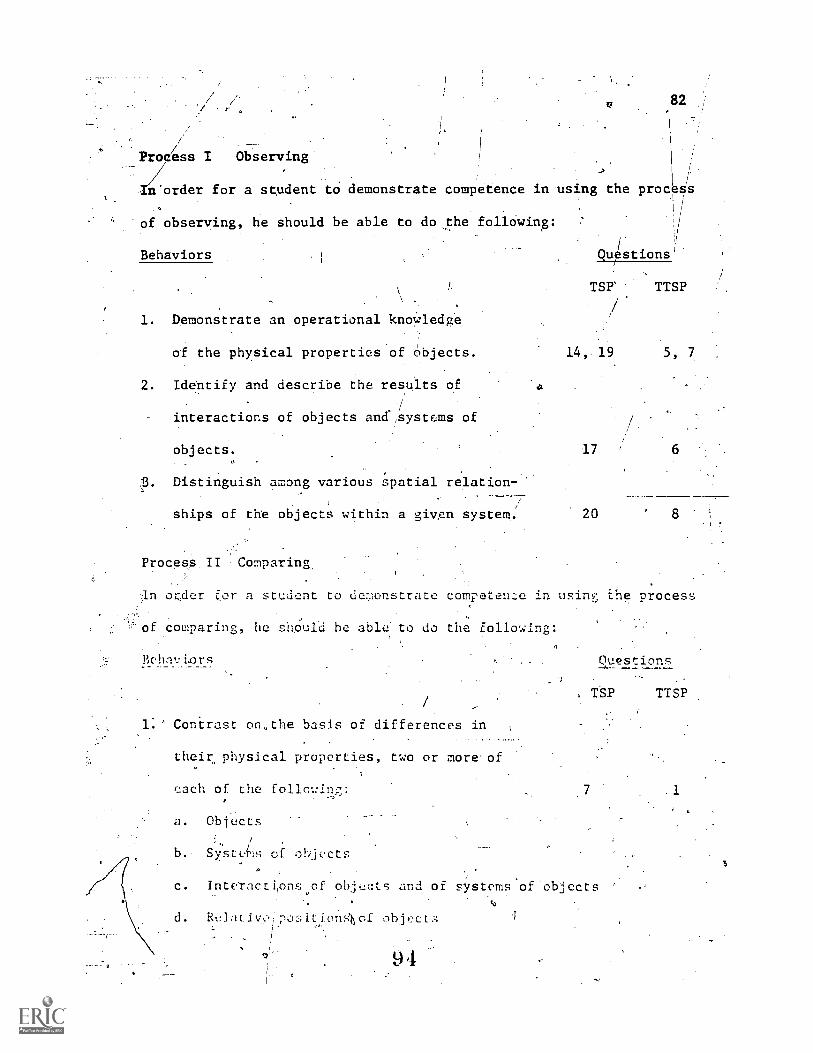
, o ,82/
1\r`
Process I Observing\
/,
/
.>
n order for a student td demonstrate competence in using the process
of observing, he should be able to do the following:
Behaviors
\
1. Demonstrate an operational knowledge
of the physical properties of Objects.
2. Identify and describe the resuits of
interactions of objects andSystems of
objects. 17 ' 6
3. Distinguish among various spatial relation-1
Qustions'
TTSP
14, 19 , 7
ships of the objects within a given system. 20 8 !
-
Process II -Comparing,
Jn order for a student co de:;ionstrate competenze in using the process
of comparing, he she'uld be abli2 to do the following:
Behnvi.ors
1: Conirast on,the basis of differences in
thei. r physical properties, two or more.of
each of the followin:
a. Objects
b. Systes of oljectr,
Ouestions
TSP TTSP
c. Interacti,onsof objects and of systems'of objectsv
d. Rt:litivp,;lositionAof objf'2cts 1
9 4
1
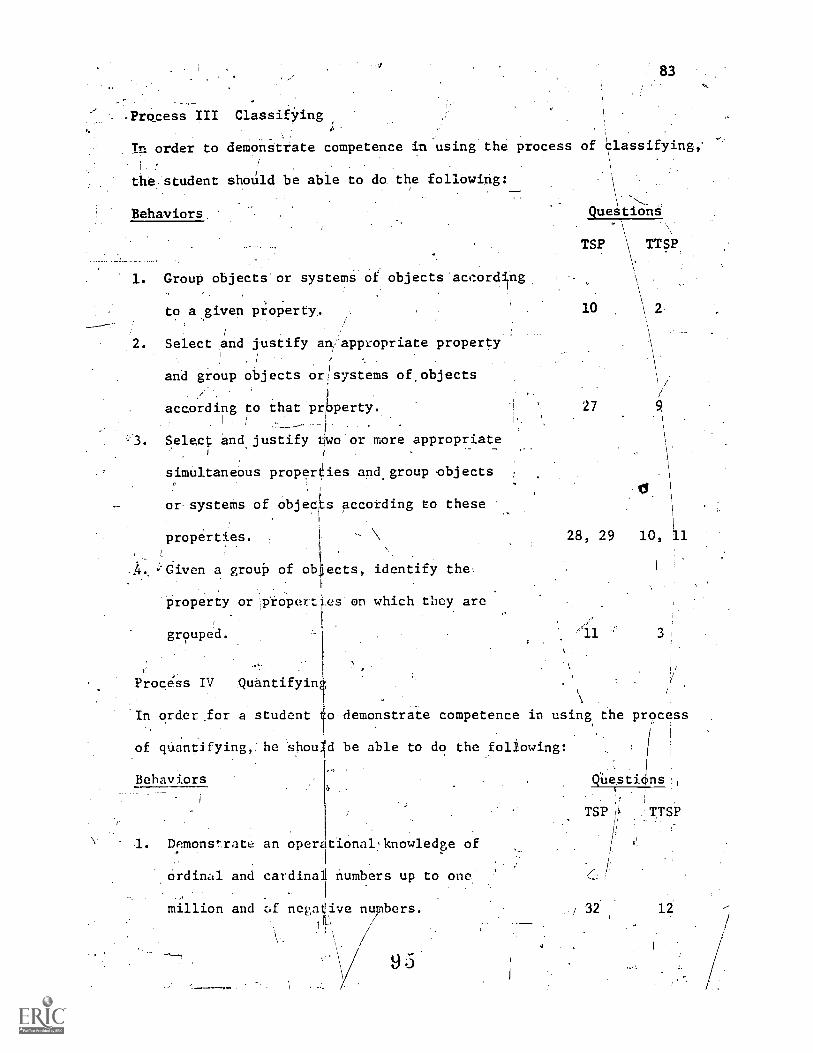
83
Process III ClassifYinga
I
In order to demonStrate competence in using the process of classifying,',
\.
the:student shoUld be able to do. the following:\
Behaviors. QueStiond
TSP \ TTSP,
\
1. Group objects or systems of objects accordipg
to a given property. 10 2
Select and justify an,appropriate property
and group objects or.systems of.objects
according to that priverty.1 I .
and,justify t o or more appropriate
simultaneous properties and.group objects
or systems of objects according to these
properties. - \
..Given a grout') of obiJects, identify the
Property or Tiro:Turtles on which they are
grouped.
. Select
27 9
28, 29 10, 11
?
7I/I
Process IV :Quantifyirve1
In order,for a student to demonstrate competence in using, the process
of qUantifying,. he Shouid be able to do the .foliowing:
Behaviors
1. Demonstrate an operationalknowledge of
,Ordinal and cardinai numbers up to one'
million and c,f negatlive nupbers.
H. /9 0
QUesti ns H
TSP TTSP
/ 32 12
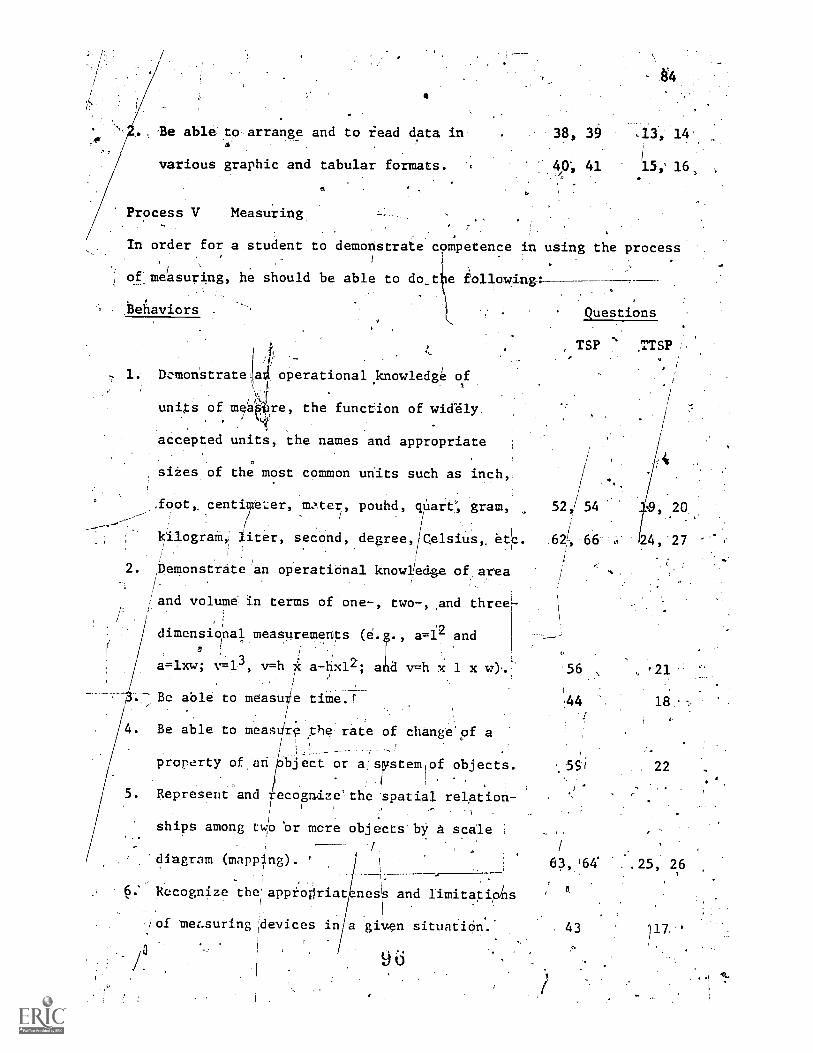
, Be able to arrange and to iead data in6
various graphic and tabular formats.
6
Process V Measuring
-44
38, 39 -13, 14..
40; 41
In order for a student to demonstrate competence in using the process
of_me/asuring, he should be able to dot4e following:
Beilaviors
t
1. Dcmonstrate a4 operational knowledge
units of meaar , the function of widely,, I
accepted units, the names and appropriate
of
.
siZes of the most common units such as inch,
:foot, centiTezer, .m.-..ter, pouhd, quart:, gram,/
.
; .
;
kilograM,', liter, secOnd, degree, Cglsius, etz.; .
2. pemonstrate:an operational knowl/edge of area/-
/and volume in terms of one-, two-, and three-
.
dimensional.measuremenIts (e. ., a=12 and
a=lxw; V=1.3, v=h * a-hx12; aid v=h x 1 x w).., '56 ,/
;
...____Be able to measure time.r 144 18
/,
,
4 Be able to measdre therate of change,pf a
property of.nn bject or aisrstemlof objects.. ...51 22.
, . .________
5. Represent and ecogad.zethe spatial relation- ,
Ii
iI
i
ships among two 'or mcre objects'bY A scale
. /
'Aiagram (mappng). '----- 63, '64 25, 26
Questions
TSP ,TTSP
/
./
52,/ 54
621, 66 :6- 124, 27
I
Recognize theapptoilriat n and limitatiohs
,;of mez.suringevices in a given situatidn. 43 117 '
9

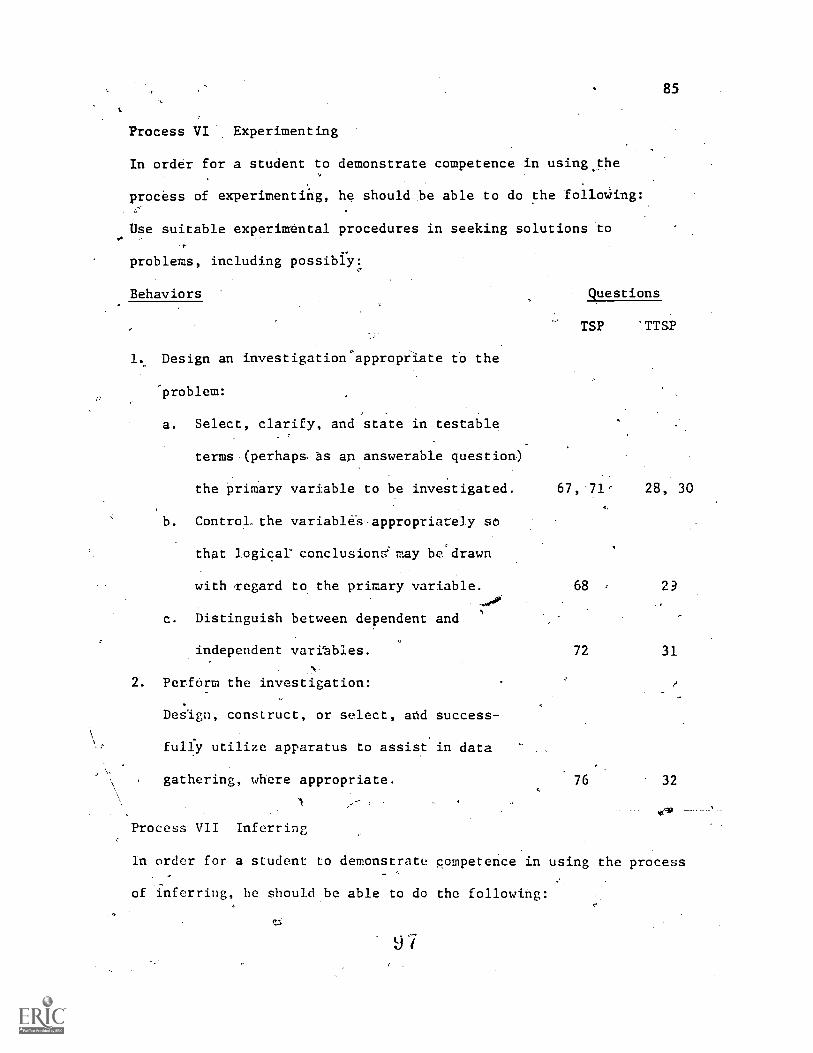
Process VI Experimenting
In order for a student to demonstrate competence in using.the
process of experimentihg, he should be able to do the folloWing:
Use suitable experimbntal procedures in seeking solutions to
problems, including possibry:
Behaviors Questions
1.. Design an investigation'appropriate to the
problem:
a. Select, clarify, and state in testable
terms-(perhaps. as an answerable question)
the Primary variable to be investigated.
b. Control-the variable-s.appropriately so
that logicar conclusions: may be'drawn
with xegard to the primary variable.
c. Distinguish between dependent and
.independent varitbles.
2. Perform the investigation:
DesIgn, construct, or select, and success-
fulry utilize apparatus to assist in data
, gathering, where appropriate.
85
TSP 'TTSP
67,.
68
72
1
,
28,
29
31
30
.76 32
.0'59
Process VII Inferring
ln order for a student to demonstrate competence in using the process
of inferring, he should be able to do the following:
9 7
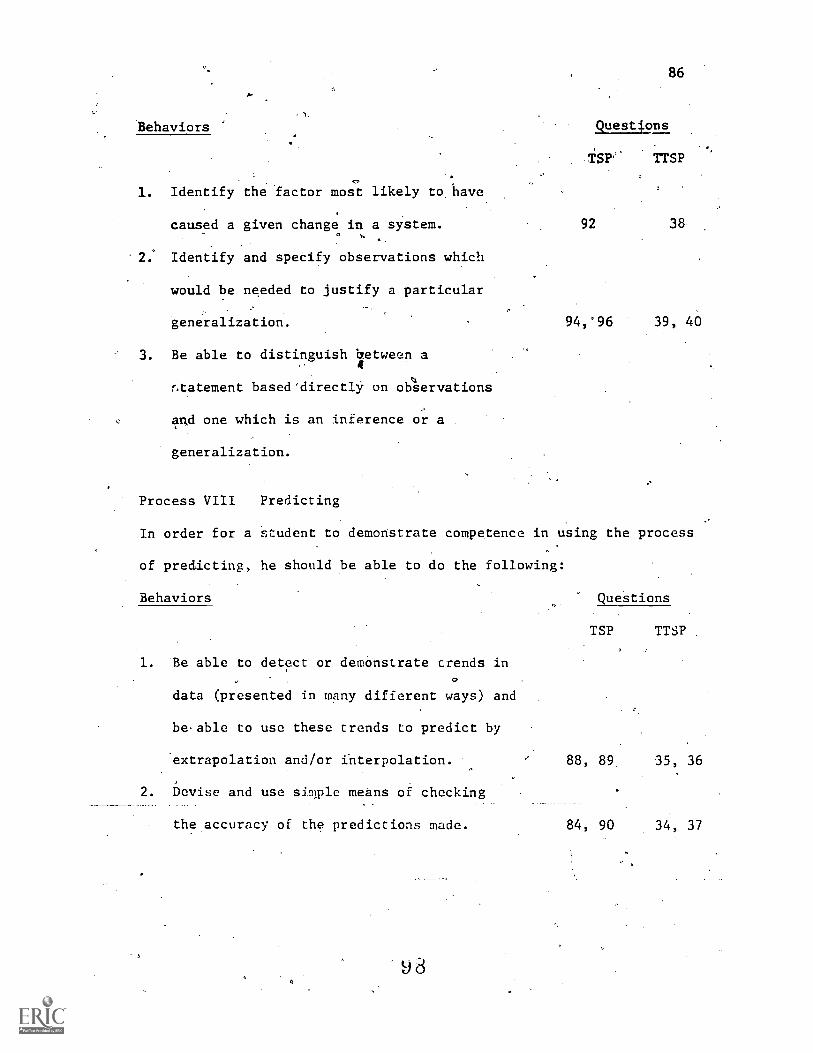
86
'Behaviors Quest4.ons
TSP. TTSP
1. Identify the factor most likely to have
caused a given change in a system. 92 38"
2. Identify and specify observations which
would be needed to justify a particular
generalization.
3. Be able to distinguish hetween a4
r.tatement based'direct1Y on oftervations
and one which is an inference or a
generalization.
94,°96 39, 40
Process VIII Predicting
In order for a student to demonstrate competence in using the process
of predicting, he should be able to do the following:
Behaviors Questions
TSP TTSP
1. Be able to detect or demonstrate trends in
data (presented in many different ways) and
be.able to use these trends to predict by
'extrapolation and/or interpolation.
2. Devise and use simple means of checking
_the accuracy of the predictions made.
88, 89 35, 36
84, 90 34, 37
870,
APPENDIX0
SCORING KEY FOR THETEST OF SCIENCE PROCESSES
9 9
c
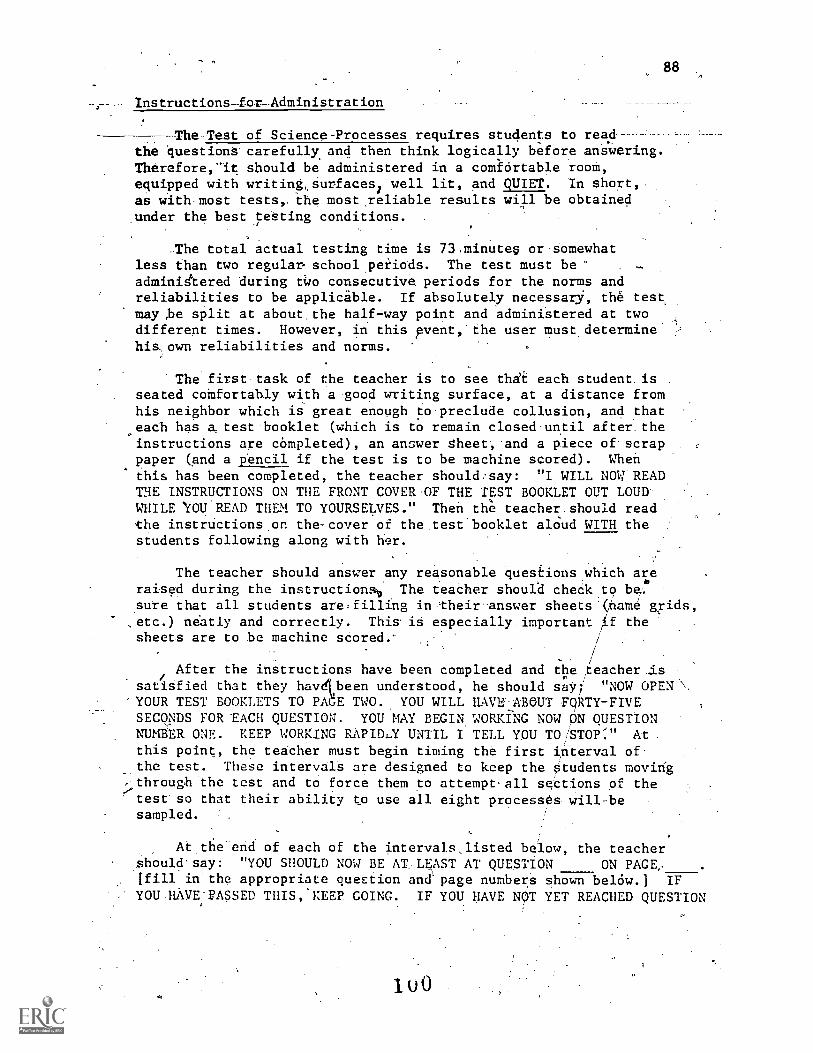
88
Instructions-for-Administration
The-Test of Science-Processes requires students to readthe questions carefully and then think logically before answering.Therefore,-it should be administered in a comkortable room,equipped with writing,surfaces, well lit, and QUIET. In short,as with most tests, the most,reliable results will be obtainedunder the best testing conditions.
The total actual testing time is 73.minute§ or somewhatless than two regular- school periods. The test must beadminietered during tigo consecutive periods for the norms andreliabilities to be applicible. If absolutely necessarj, the test.may ,be split at about the half-way point and administered at twodifferent times. However, in this pvent, the user must.determinehis own reliabilities and norms.
The first-task of the teacher is to see thit each student. is .
seated coMfortably with a good writing surface, at a distance fromhis neighbor which is great enough to.preclude collusion, and thateach has a test booklet (which is to remain closed-until after.theinstructions are completed), an answer Sheet..,'and a piece of'scrappaper (and a pencil if the test is to be machine scored). Whenthis has been completed, the teacher should:say: "I WILL NOW READTHE INSTRUCTIONS ON THE FRONT COVER.OF THE TEST BOOKLET OUT LOUD'WHILE YOU'READ THEM TO YOURSELVES." Then the teacher.should readthe instrUctions.on the-cover of the.test.booklet aldud WITH thestudents following along with her.
The teacher should answer any reasonable quesiions which are6
raised during the instructionst The teacher should cheek.to be;sure that all students are,filling in their.answer sheets'(nate grids,etc.) neatly and correctly. This iS especially important Af the .
sheets are to be machine sCored.°
- /
After the instructions have been completed and the teacher _issatiSfied that they havdtbeen understood, he should say?' "NOW OPEN \.
'YOUR TEST BOOKLETS TO PAdE TWO. YOU WILL HAVE.ABOUT FORTY-FIVESECONDS FOR EACH QUESTION. YOU MAY BEGIN. WORKiNG NOW ON QUESTIONNUMBER ONE. KEEP WORKING RAPIDa UNTIL I TELL YOU TO/STOP" At .
this point, the teacher must begin timing the first interval ofthe test. These intervals are designed to keep the Students moving
>throughthe test and to force them to attempt.all sections of thetest so that their' ability t_o use ail eight processes. will-besampled.
At,the end of each of the intervals,listed below, the teachershould'say: "YOU SHOULD NOW BE AT-LEAST AT QUESTION.. ON PAGE,[fill in the appropriate queEtion and'page numbers shown belOw.] IFYOU-HAVEFASSED THIS,'KEEP GOING. IF YOU HAVE NOT YET REACHED QUESTION
iuOCI
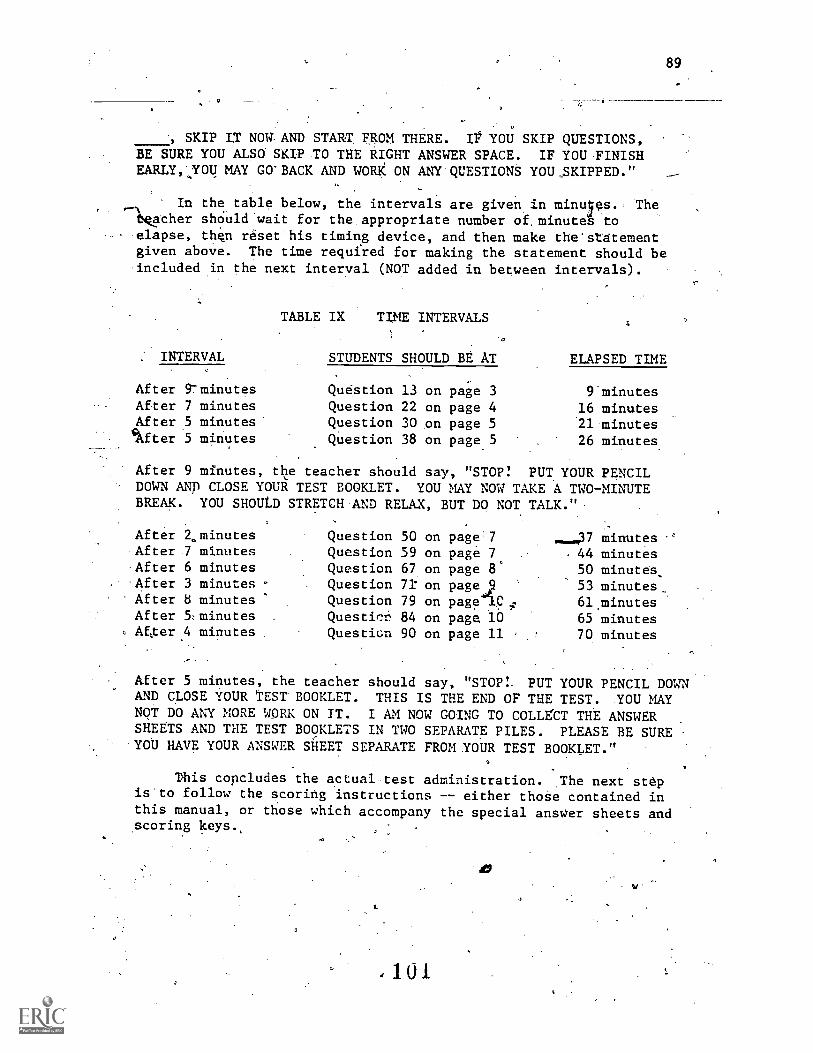
89
, SKIP IT NOW AND START FROM THERE. IF YOU SKIP QUESTIONS,BE SURE YOU ALSO SKIP TO THE RIGHT ANSWER SPACE. IF YOU FINISHEARLY,yOU MAY GO-BACK AND WORK ON ANY QUESTIONS YOU,SKIPPED." --
In the table below, the intervals are given in minuyes. The"kacher should wait for the appropriate number of, minutes toelapse, then reset his timing device, and then make the'statementgiven above. The time required for making the statement should beincluded in the next interval (NOT added in between intervals).
TABLE IX TIME INTERVALS
a
. INTERVAL STUDENTS SHOULD BE AT ELAPSED TIME
After g-minutes Question 13 on page 3 9 minutesAfter 7 minutes Question 22 on page 4 16 minutesAfter 5 minutes Question 30 on page 5 21 minutes4After 5 minutes Question 38 on page 5 26 minutes.
After 9 minutes, the teacher should say, "STOP! PUT YOUR PENCILDOWN Ap CLOSE YOUR TEST BOOKLET. YOU MAY NOW TAKE A TWO-MINUTEBREAK. YOU SHOULD STRETCH AND RELAX, BUT DO NOT TALK."
After 2minutesAfter 7 minutesAfter 6 minutes
. After 3 minutes -After 8 minutesAfter 5:minutesAfxer.4 minutes
Question 50 on page:7Question 59 on page 7Question 67 on page 8'
. Question 71: on page_2Question 79 on pagen..C,zQuesticn 84 on page ioQuestion 90 on page 11 ,
minutes- 44 minutes50 minutes_53 minutes,,
61.minutes65 minutes70 minutes
After 5 minutes, the teacher should say, "STOP:, PUT YOUR PENCIL DOWNAND CLOSE YOUR TEST BOOKLET. THIS IS THE END OF THE TEST. YOU MAYNOT DO ANY MORE WORK ON IT. I AM NOW GOING TO COLLEtT THE ANSWERSHEETS AND THE TEST BOOKLETS IN TWO SEPARATE PILES. PLEASE BE SUREYOU HAVE YOUR ANSWER SfiEET SEPARATE FROM YOUR TEST BOOKLET."
This concludes the actual test administration. The next stepis to follow the scoring instructions -- either thoSe contained inthis manual, or those which accompany the special answer sheets andscoring keys.,
4
4101
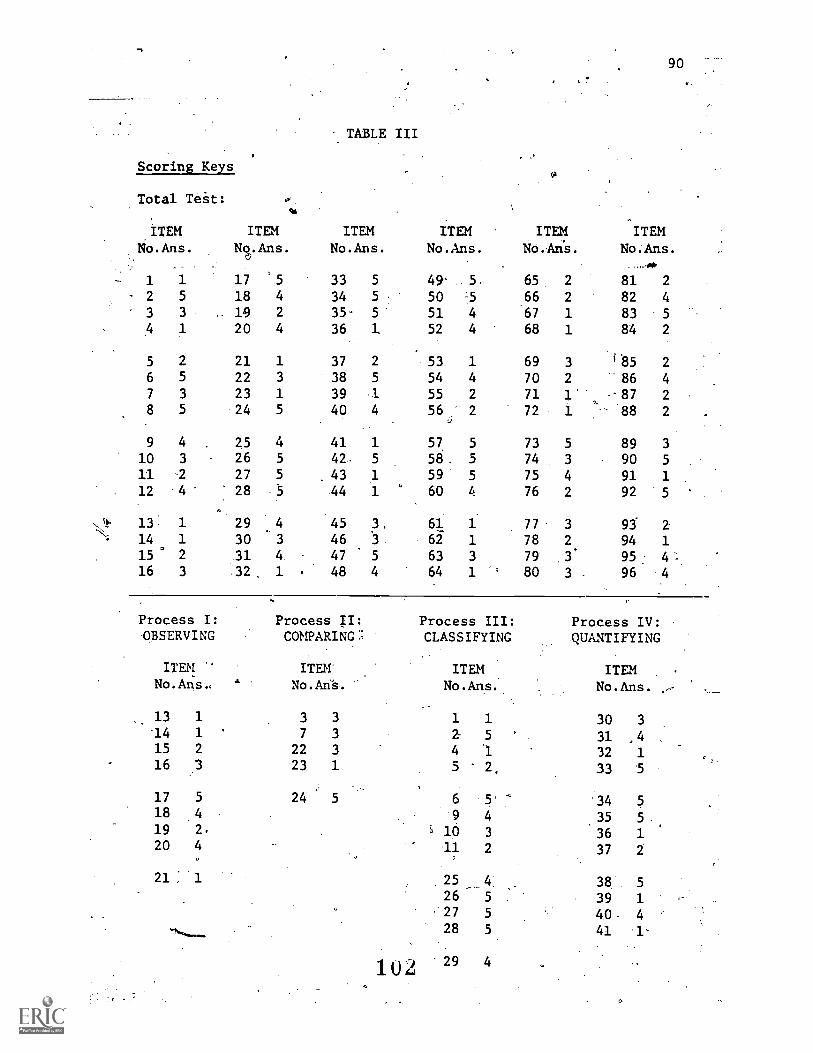
-
N
Scoring Keys
Total Tet:
ITEM ITEM
No.Ans. No.Ans.
90
. TABLE III
ITEM ITEM ITEM ITEMNo.Ans. No.Ans. No.Ails. No.Ans.
1 1 17 '5 33 5 49- 5. 65 2 81 2
- 2 5 18 4 34 5 50 =5 66 2 82 4
3 3 19 2 35- 5 51 4 67 1 83 5
4 1 20 4 36 1 52 4 68 1 84 2
5 2 21 1 37 2 53 1 69 3 f 85 2
6 5 22 3 38 5 54 4 70 2 86 4
7 3 23 1 . 39 1 55 2 71 1. -- 87 2
8 5 -24 5 40 4 56 2 72 1 88 2
9 4 25 4 41 1 . 57. 5 73 5 89 3
10 3 26 5 42- 5 58 . 5 74 3 90 5
11 -2 27 5 43 1 59 5 75 4 91 1
12 4 28 5 .44 1 60 4 76 2 92 5
13 1 29 4 45 3. 61 1 77 3 93 214 1 30 3 46 3 62 1 78 2 94 1
15 2 31 4 47 5 63 3 79 .3 95 416 3 32 1 48 4 64 1 80 3 , 96 4
Process I:OBSERVING
ITEMNo.Ans,
13 1
*14 1
15 2
16 3
17 5
18 4
19 2
20 4
21 1
Process II: Process III:COMPARING '; CLASSIFYING
ITEM'
No.An§.
3 3
7 3
22 3
23 1
24 5
ITEMNo.Ans..
6 5 ' 7
.9 4
s 10 3
11 2
25 426 5
27 5
28 5
1.0229 4
Process IV:QUANTIFYING
ITEMNo.Ans.
30 3
31
32 1
33 5
'34 5
.35 5
36 1
37 2
38 5
39 1
40 4
41 1'
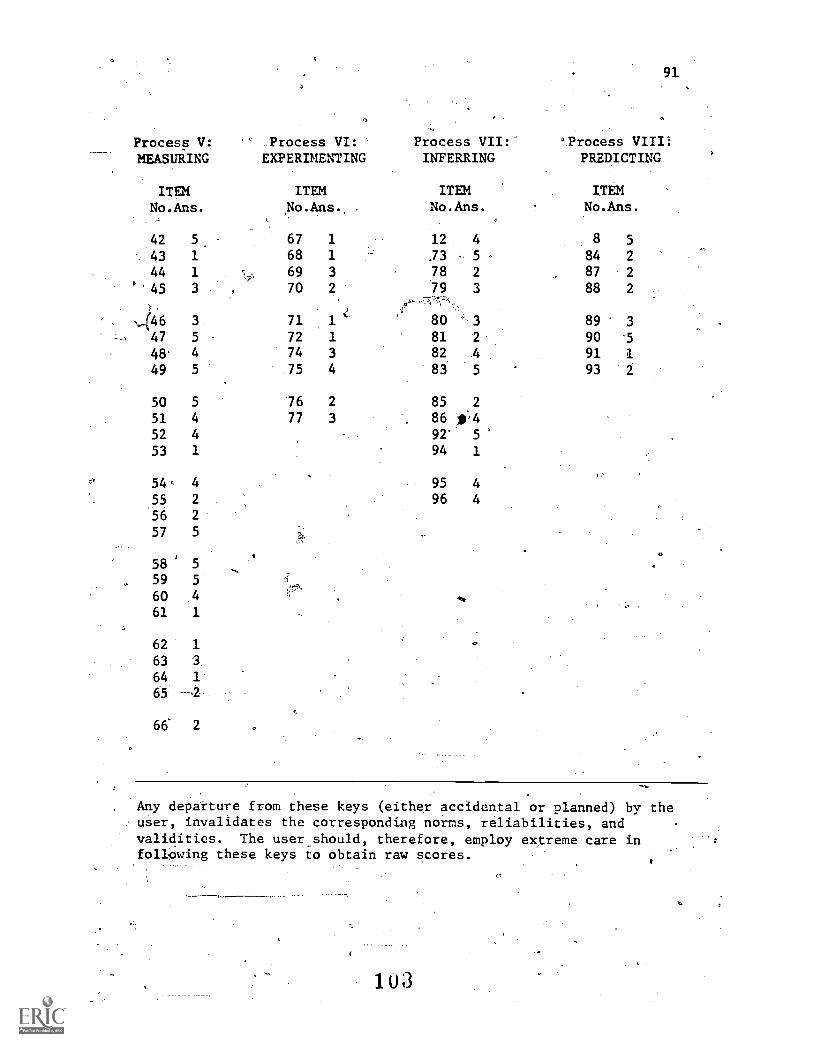
91
Process V:MEASUiING
ITgmNo.Ans.
.
42 5
43 1
44 1
' 45 3 ,
Process VI:EXPERIMENTING
ITEM
,
No.Ans..
67 1
68 1
69 3
70 2
Process VII:INFERRING
ITEMNo.Ans.
12 . 4
.73 - 578 2
79 3
'Process VIII:PREDICTING
ITEMNo.Ans.
8 5
84 2
87 2
88 2
446 3 71 1 `- 80 3 89 3
47 5 72 1 81 2 90 '5
48' 4 74 3 82 A 91 1
49 5 .75 4 83 5 93 2
50 5 76 2 85 2
51 4 77 3 . 86 11.4e
52 4 92 5
53 1 94 1
54. 4 95 4
55 2 96 4
56 2
57 5
58 5
59 5
60 4
61 1
62 1
63 '3.
64 1
65 -2
66 2
Any departure from these keys (either accidental or planned) by theuSer, invalidates the corresponding norms, reliabilities, andvalidities. The user should, therefore, employ extreme care infollowing these keys io obtain raw scores.
103
CI
APPENDIX D
CREDENTIALS OF PANEL OF JUDGES.
92
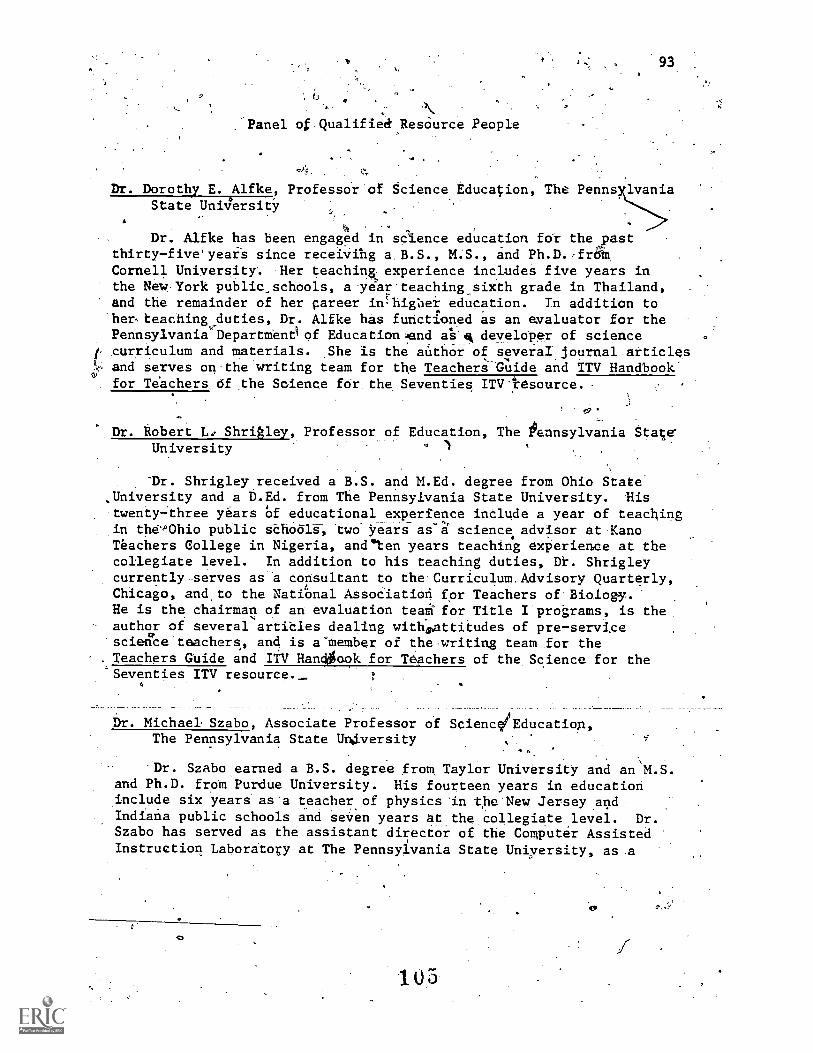
4
s
Panel of Qualified ResOurce People
93
Dr. Dorothy E. Alfke, Professor of Science Educ4ion, The Penns lvaniaState Uni4ersitY
-Pt
Dr. Alfke has been engaged in sCience education fot the pastthirty-five'yeais since receiVing a. B.S., M:S., and Ph.D.,frei,Cornell Univerpity. Her teaching, experience includet five years inthe New.York publicschools, a year.teaching,.sixth grade in Thailand,and the remainder of her career inhighei education. In addition to'her,teaching_duties, Dr. Alfke has functioned as an evaluator for thePennsy1vania-Departmen0 of Education end at'iik develeper of sciencecurriculum and.materials. She is the aiithor of severaI.journal artiClesand serves on.the writing team for the Teachers-Guide and ITV Handbook'for Teachers of the Science fer the Seventies ITV'tesoerce.
Dr. Robert L. Shrigley, Professor of Education, The Pennsylvania State'University
-Dr. Shrigley received a B.S. and M.Ed. degree from Ohio State,University and a D.Ed. from The Penntyivania State University. Histwenty=three years Of educational experience inClude a year of teachingin the.AOhio public tChOtilt-, two years as d science advisor at KanoTeachers College in Nigeria, aneten years teaching experience at thecollegiate level. In addition to his teaching duties, Dt. Shrigleycurrently-serves as consultant to the Curriculum.Advisory Quarterly,Chicago, and.to the Nati6al AssoCiatiori for Teachers of.Biology.He is the chairman of aft evaluation teaiffor Title I'programs, is the,
- author of several artiCles dealing withmattitudes of pre-servicescieriCe.teachert, and is a"member of the.writing team for theTeachers Guide and ITV Hancillcok for Teachers of the Science for theSeventies ITV resource._
Dr. Michael Szabo, Associate Professor of ScienctiEducation,The Pennsylvania State Uniiversity
"'.
Dr. Szabo earned a B.S. degree from_ Taylor University and an M.S.and Ph.D. from Purdue University. His fourteen years in educationinclude six years as a teachetof physics in -Ole New Jersey andIndiana public schools and seven years at the collegiate level. Dr.Szabo has served as the assistant director of the Computer AssistedInstruction Laboratory at The Pennsylvania State University, as a
CD
105
'4
94
. -
.merliber of the Title III PropoSal Evaluation Team for the Pennsylvaiiia.Department of Education,.an& as a consultant tm metric edusation'and
' evaluation., He has published several articles dealing with scienceprocesses and metric educettion.
c
Dr. Paul W. Welliver, Prof-e-ssor of Education, The Pennsylvania State4' University
:
Dr. Welliver'earned a B.A. degree froM Western Maryland Collegeand an M.Ed. and Ph.D. from' The.Pennsylvania State University. His23 years.of educational exiltrience include fives years of teachingsc,ience in public schools, a year as a science lecturer at the OakRidge InStituee of Nuclear Studies, five years as a television studioteacher, one year as a consultant in.science education, one'yearasdirector ok-the Mississippi Instructional Television Curriculum"Labccratoryf, two years as Director of Education for.the Mississippi-Authority for Educational Television, and six years teaching dt thecollegiate level'. Dr. Welliver is the project director for the ,
"Science for the Seventies" program and as such is responsible for
I
the supervision and preparation*of instructio
P
al lessons, teicher..orientation programs and testing. Dr. Welli'er is the auellor ofnumerous articles dealing with inseructional development, instructionaltelevision arid science education. He has'also written several sourcebooks in science for teachers.
4
106
a..
,.
APPENDIX E
<5
COMPUTER PRINTOUT OF SYNTACTIC DENSITY.SCORE
1 7
P.
'04110110205 Jail on1343.T.s0,N=250o4.!antnn TESTER'."iPOULS10,11117 EXEC. 5FTTAK,TPATK.TN,E6R4s=16
0 ',0",1,TPPr KIW12.11
TFP14.21 - sTr.is NAS.RX1T4TED -,cnNu cone oloo' .1Fr379.STFI"/ / sTANT 76127.2025
-TrFA14T STEP,/, / STOP /46121.2025.CP4 OMIN'00.06SRC MAIN AK LCS OK 0
i/fxrr '444,PPOC.NTLOR,PANm=)SYNTACTICADiNsITY4-irrio:7: sTrr wks KXEcDTED - C0412 CODE coon1rF3131 57rp /DATA / START 76127.2025 ,TEE:17411 ST1:11 /DATA / ST9P 16127.2025 (AIN O(IN 00.065EC MAIO. 12K LCS OK. 0 // rxrr PLIn .
7/S1SL7R DD 44IT(2400DEPSP)VOL.SEN,KTPR2iIAPTL*1,:
// ls,r1MIPP.PISP..(CLD,PAsS).TCom(NECF1=FO,LPFCC=60.11LKSIZE.72P0)/./TIATA.INPEX vp kiwKINDEE:44TTrSYSDA.DTSP.(114,PASS).' .// .SPA1.7.(PtL.125,1010rtsE1ITCPPrtFFP,LRECL=.12411LKMF.7200)
.*\//0ATA.14T0T nn P.
'TEP142T -°TV.P0oNS PfPCOTED - Co40.c3PF m131 f
TEF370T STEP /DATA ,/ STANT 7612.7.202'1FP1741 S'TKP /DA7A / STOP 76127.202'. C10 4MIN 00.5GSEC KATO 140K LCS OK
,.la // 6:IC P1.14;5.
//sYS1TO 1)p.ONIT=(2400,0SrE0),VoL.S:N1042.LAKEL=2; ,
00000101'./rnsti=sTNDEN,DT5,17=(0LD.OAss).Pcp.(PEcrmr411,LNFCL=NO,DLKS12r=7200)/DATP./NREC MOVN.01KINDEWINTT,nsYSIA,OISP4(CIO.DFLETE1.
.-//sppxy,..(et1.,(25;10),PLSE),0c8=CoECF0=FW,LPECL=12.01.KSI7J7=7200i
bIEF14/: '-. sTE6 WAS rxrrnrru - coNin CODE 00001.17171T STEP i'DAth. / !;Tant.lh127.2025 .
.ITP374I.STEP /0474'- / nr1r 76127.2026 CPD CDT'S C1.565EC 1ATN 140K ICS( OKIEF3751 .108 /X0110205/ START 76121.202c 4 .ITX)761 ans /A0110205/ STOP' 761.,7.2026 CP4 AMU 02.24SEC
St
.10
108

.:`
A
4 ISA InFrtanil CCITT 2 15 SMALLEr 2 IS SMALLER THAN ALL TRE
OT4EfN ANn 4, IS A TIFFEpENT,COLOP,, 1:, 3,1 4 , AND 5 ARE THE SAME SUE. ,
4 AN9 2 ARr TIFTFPIT FROM EACH PTHFR , SAMPLE 1 FADFD-MOPE THAN
Swirl! 2 :'10,1 PAPWAIIL COOTINHE TO FADF foRfVER THE LONGER. THEY APEI. .
LEFT PI TUP,m . tAY PAPEPLIFT IN ThE'SUN WILL FADE BOTH.SAMPLE1
rpko;Mar BY .CAY 6 'MN TT.HAD NY Dq. 2 PAPER,WILL FARE IN THE SUN ,
ufrLcon WILL,IC1 THE wATER TS POILING THE GAS' 1S011 IN
-?PT R 1HE .WAIFT GFTS NOT WPEN Ur nu 15 OH TOE WATER IS NOT POIL. .
IN ytylr TPE WATEP. Is PoILING IN POT B., DOT IT 15 ROT POILTAMN
POT A THRITTIFH INF PATER YOO.STAFT WITH ,'TPE FASTER 7T WILL FREEZE
INTO IC! ChrFS POT WA.TEM rNEEZES INTWICT CORES FAITrP HOT 10(Trn
TREE7mATAI1t1tu T1719FfATORES THAN COLD WATER HOT.WATEk'FPERZES T.NTO
ICCOPZ5 FASTER DECAHSE IT TOM OW THE REFRIGERATOR , 'HOT WATER-MAKES
STEAM STEPAI EMS THE REFRICiPATOR GPIS SCPEWS 2 AND ) HAIIF HIG
HEADS 5CPW 2 NNE rgArF 5TICKINI TO THEIR MAGNETS ,roir SCREWS'ARE
MOE FPO! A M7lAt WHICH IS NIT'DAdNETTC ALL THE SCREWS WITH BIG HEARS
IN THI41 PICTNFEAPE 5TIcKING TP THEIf1 MAGNETS SCREWS'l AND 4.AR! NCI
STMAIN1- TO METH MAGNFTS Orolo 4WEICHT OF 75 POUNDS ON THE. STRING
AND Err', ADDING 1 POUR WrICHIS UNTIL IT DRAMS HANG A 100.- AUND.
WETGHT ON THE 5TFTPC AND 5SE TF IT PrEAKS LET,THE TWO 100 -:001IND
noy5 PHU CN fAcIl 'END 0. A PIECE OF THE STNIAC AND SEE IF IT PIERS
HANG 101 PCUNDS CN 1HF STPING ANn SCF IF IT MAKS DOMILE TPE STRING
AND NANG 60 P^4111:5 FPOM IT AN:,'SER IT MANS . MEASURE Tor PAR A?
110 C AN'D TPEN chAP9 ALL THyN11411F115 T CriCN YOUR ANSWERS- MEASURE
.THE PAP-AT 120 C ANR THEN EAKF. h 0P00 ''ALL THE Nonotrls TO CHECK
YORP ANIVEP5 PDT ALL 70011 WOES ON CHART AND.SEE rr THEY LOnK
CONRFCT rFASIRE THr PAP, AT:LEAST 5 TWA AT TEMRATNPES AND
COMPARE wOT WUEIVII wITO. y010/ANSWERS ASO! THE MAR AT AO AND
'AT IOU c gl coMpAREWHATI(IM FIND WITH rnult ANSWERS THE PULD WAS
REPLAcrD roR -TOE VINES WERE T1CHT I= FOP PICTORE,2
INF vilrii WA5 50/FPFP-/N.,E0 PICTDPE 2 THF:PATTERY WAS ELECTRTCALLY
PECHARG",b FGP PICTIPE 2 . LLFq1prITY IS FLOWIMG\THROUCH Tim tan IN .
PICTURE 2 TINN 1;14F ,THING THAT POEN NOT CET PICGEO WHEN IT IS HEATED'.
,
rT1411. ALL THE 'WNW; THAT DC NPT PlcCfR WOEN THPV ANE HEATrD
FTND IN TNIN6 Tfihr,,crT5 PICCIO WHEN IT IS MATED .:FIRD ALL THF
TEINGI TOT C.F7 li!GraftWNIN THEY APE HEATED FIND 'ALL, THE THINC5 THAT
0DO NIT 1:11A9CF 5!7F wIIIII'THEY APE HEATED
NORMAL ExECUTroNior DATA riDEX DECWAN CPIPLETED
5\,
ioi
S.
Cs
03/360 LOMAX
IIPTIOPS (MD - PP NTO.OMA 1), MUTAT, C ALL, RF3,4nTERM,S1Z r71147$14, PIE=4,,,G0
1REDDnn111EDNCADIEVSDAIttE11:5FA
1HEys.r111,10AA11! r.I1PA
11101P1,11
InSVIR nic A
III Fm9111Itt Etin1C
IfirTER A
TUritrAFlub nA
In EVOVA
TeTt LENTFY A 1.DIESS
3RiSF0370
/ gy 10 et WAVNING - UNFEq0LYED g XTER t t REF Eriwcr (NOC ALT SPECIPIED)
0s/140 LOADER -
OPTIONS grED PRINT,NoMNP,N1LET,CAIL,RFS,NOTEPN,SI7.P=IiniO4,NANP=4,i0G0
itil1001
Irwi001IFv1OPI
ICV100/
IEW1r01
Irwi001lEw1PPITrw1C01IEWpi117141001-irwlecl
IFvlrel7,11110v
IrgVIC1rrit1001
Ini1001
IF41001Tr.14100t
14.141101
IFW1001irwiert
IIIrP9nDINFWAAINEYPCAVIEVNIA!IICVPFATur.VPrA!nrI/PIA
iNr$,Pah
INFvFNAlortgotA
rurvKFAIREVVGATHEWAIPEV::DA!wrilnFA
iNrilsrA
INFWAllrm91AIl!Frig1O
IDFmR1CVIETFIAIVE'IPAA
IDVMPSATHF904BInilpApINrvonA
TOTAL - MAOENTFY Anorifs r616R
TEV1POI WARNINn - NM:SOLVED EXTFRNAL PhFUVICE (NOCALL SPECIFIED)
-wpm. nett VIP*11t; TiOVNSITTONS CCMFLETFD
!:,
fa
1 2
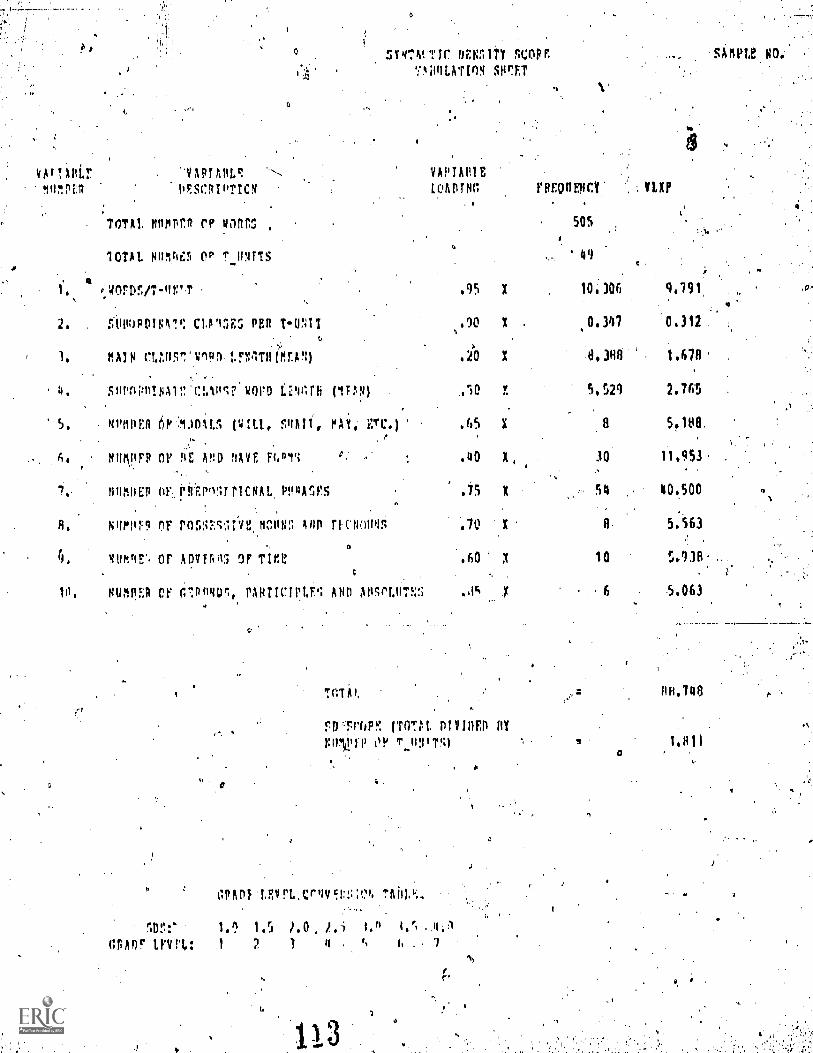
SPCA! TIC 835111 SCOPE SAISPL! NO.
7,44I1LATInN sorET
TOTA!,
1
liAwri.r. -vapnot.r. VAP1An1E
!IIIMP1;11 OF:SCRIPT/VI LeADING FREgnEocy' :111,XP
TOTAI, rorpro rp lints
ZOTAL Hunylo
505
49
1. ,WoroFIT-Itr.r .95 ; 10.306 9,191,
2. r,-1100P0101,: CLAq5E5 PER T-UNII 00 1,
.0.397 0.112
1, MAIN CWIS17.141ND LFriTncrEAN) .20 X 41,3HO 1.678.
. 4. -50PAPMNA1'.', .C1.1111? wOVO ipolrb (1F1) ,le f. 5,529 2.765
04111En Olouniv, (tim, SqAli, e.Ai MO .65 1 ..8 5.188.0,
Or 9'1: Amu 11AVE Fc,P11:, .40 x, 30 11.953.
,
7.. nWillEP OF, Pil'EPnII MCNA L. PPNASFS .75 X 54 40.500
A. N4POT,9 PF POSS7,,c',1IVI: NOIINS Ann riqlumwi .70 x 8, 5:563
4, NUm4E% or ADVTA03 OF Tire ..60 X 10 5,93R:4
10. NUMpER CF fi.:DINUI, PARTICIPLN AND APSPLIIM; 01; 11 , 6 5.063
Nrrr4V. (TOT:,1 DIVIDED 11Y
1A,740
F.111A1211) OF T.11NITS1a
I.
e.
t;PAnf'1,EVr1.,CrqV4.1:::n TAW.
Inr:* hi') 1,5 1,0, 1.i 1.n .,4,
a5Aor uvrt: 1 2 1 7
,0-
APPtNDIX
DISpLAY OF IfISUALS,USEbTELEVISION:TEST OF SCIENCE 'PROCESSES-, FORM C
0.
1
,...
103
0
(Part of Introdyetory Credits of SFTS Programs)
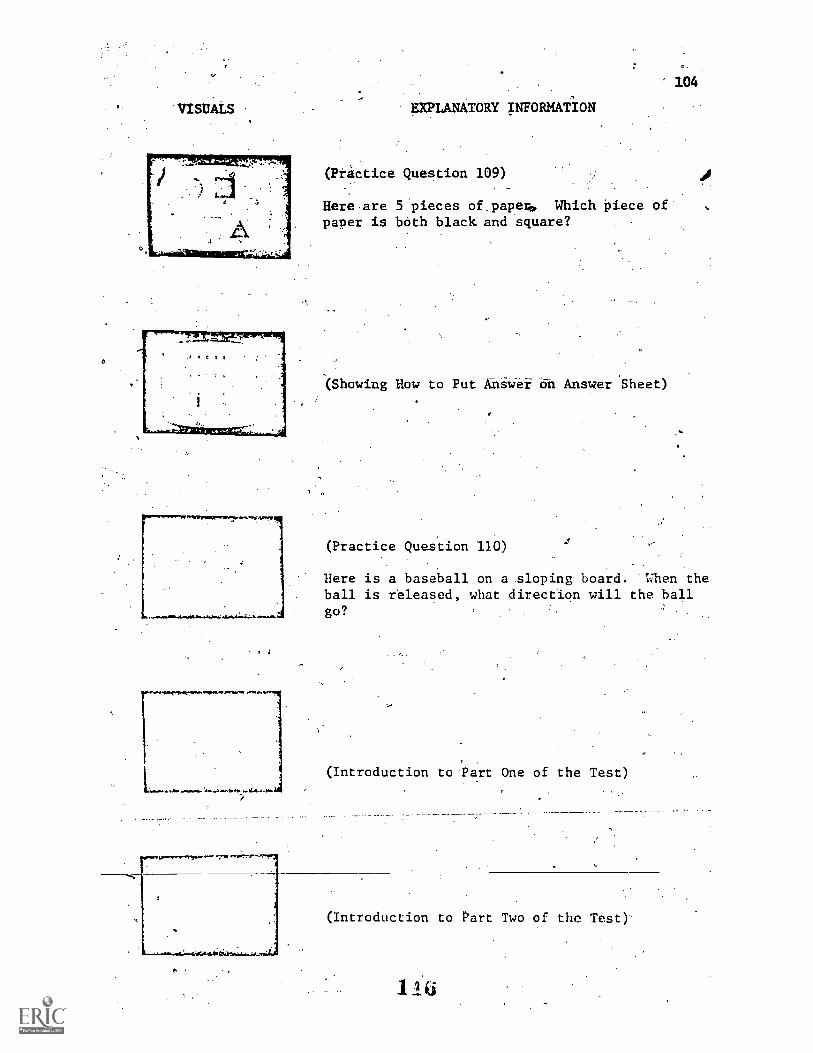
'VISUALS
,
'104
EXPLANATORY INFORMATION
(Practice Question 109)
Here.are 5 pieces of.papep, Which Piece ofpaper is b6th black and square?
(Showing How to Put Anitief an Answer Sheet)
(Practice Question 110)J
Here is a baseball on a sloping board. When theball is released, wthat direction will the ballgo?
t
(Introduction to .Part One of the Test)
(Introduction to Part Two of the Test)
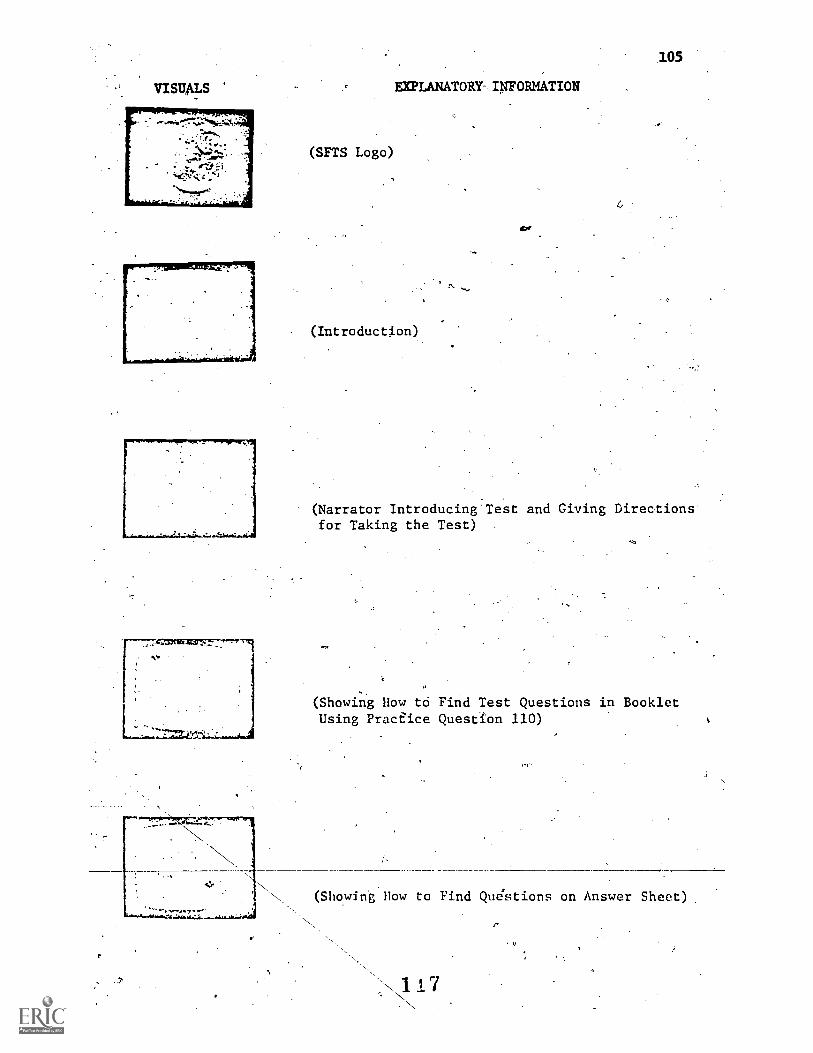
VISUALS
.,.:473,rss-zrzb-1;7177.:"'"FT19
EXPLANATORY- INFORMATION
(SFTS Logo)
CO'
(Introduction)
105
(Narrator Introducing Test and Giving Directionsfor Taking the Test)
(Showing How tá Find Test Questions in BookletUsing PracEice Question 110)
(Showing How to Find Questions on Answer Sheet)
17
I.
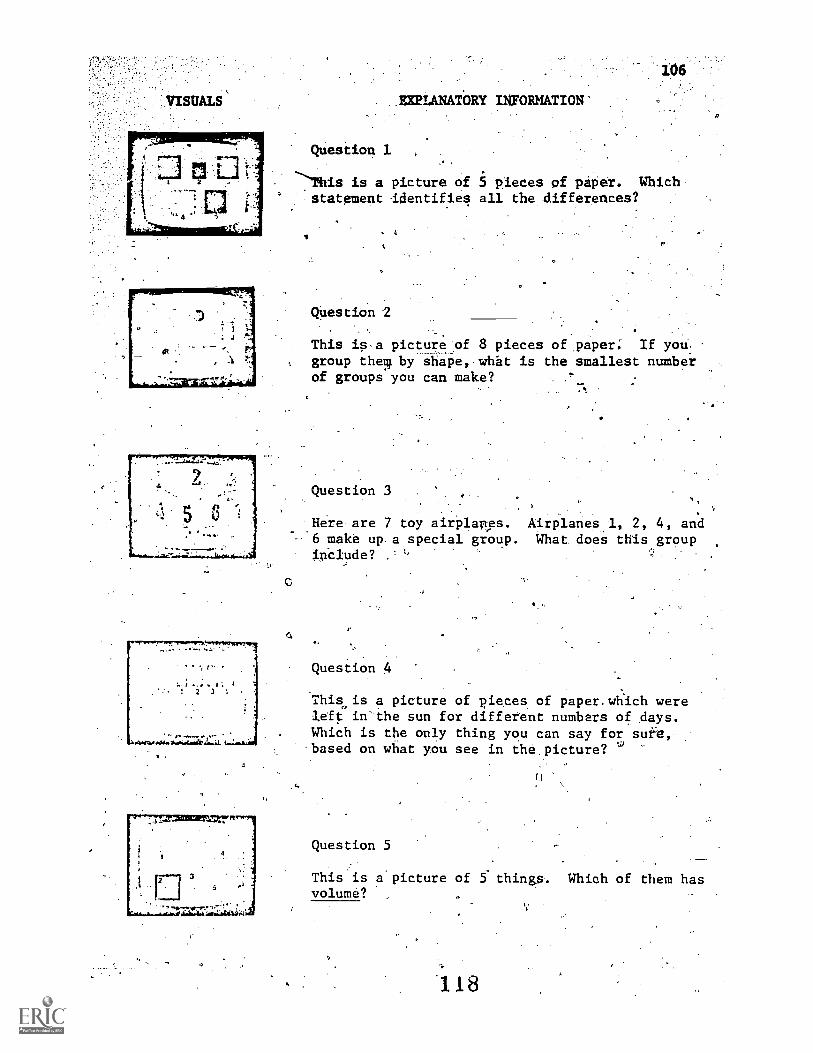
. _AMPLANATORY IN:FORMATION'
Question 1
is a picture of 5 pieces pf piper. Which° statement Identifies all the differences?
QUes tion 2
This isa picture:of 8 pieces of.paper: If yoU:
group therq by shape,.what iS the smallest numberof groups you can make?
Ts,
Question 3 .
.
'
Here are 7 toy airplaus. Airplanes_1, 2, 4, and6 make up.a special group. What does this groupinCIude?
Question 4
This,is a picture of pieces of paper.which wereleft in'the sun for different numbers of days.Which is the only thing you can say for sufe,based on what you see in the picture? w
Question 5
This is a picture of 5 things. Which of them hasvolume?
.>
118
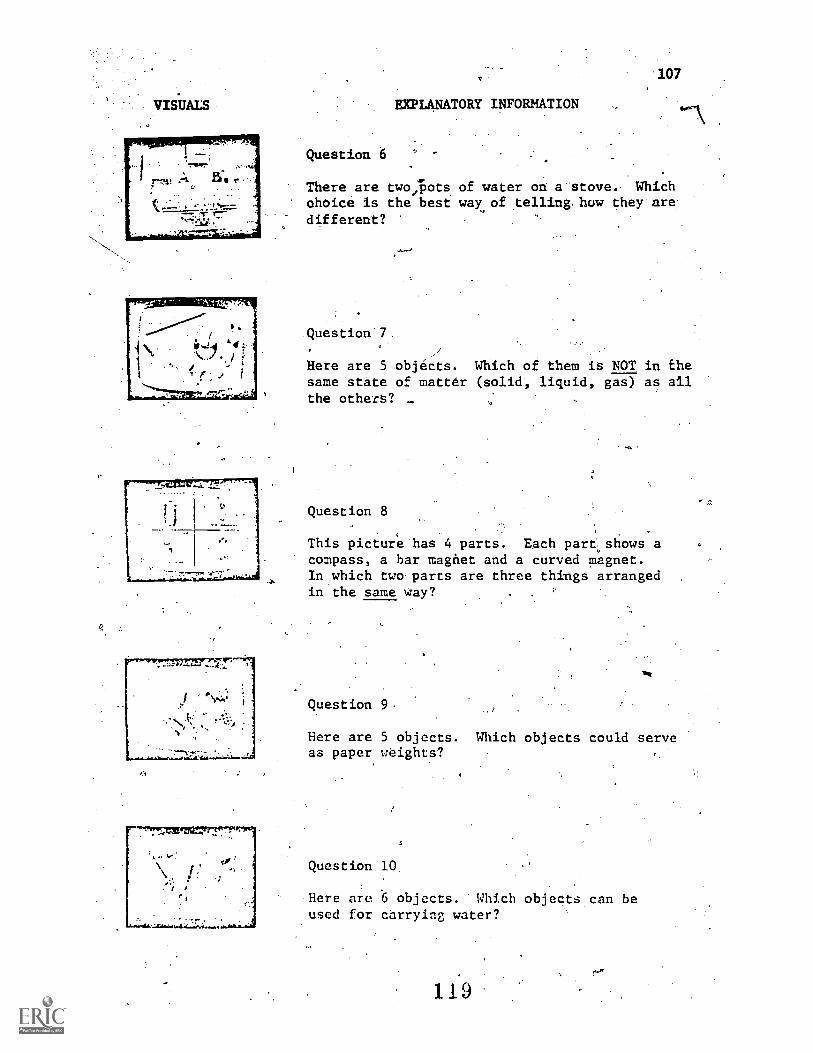
VISUALS EXPLANATORY INFORMATION
1
Question 6
107
There are two;Pots of water oft a-stove. Whichchoice is the best way of ,telling, how they are:
different?
Question 7
Here are 5 objects. Which of them is NOT in Ehesame state of mattdr (solid, liquid, gas) as ailthe otherS?
mt.
Question 8
\
This picture has 4 parts. Each partshows acompass, a bar magnet and a curved magnet.In.which twn parts are three things arrangedin the same Way?
Question 9,
Here are 5 objects. Which objects could serveas paper wtights?
Question 10
Here are .6 objects. Which objects can beused for cbrrying water?
119
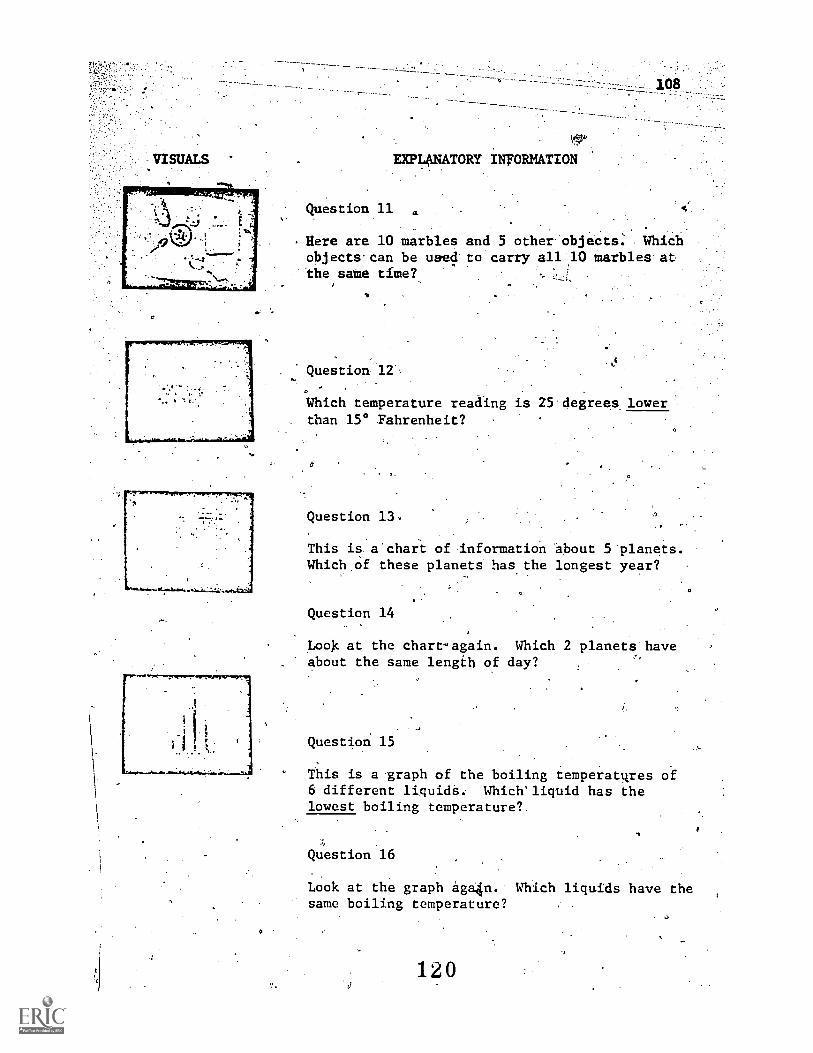
VISUALS
4.1
IP
EXPLANATORY INFORMATION
Question 11.
.
. Here are 10 marbles and 5 other'objeCts: Whichobjects-can be used to carry all 10 marbles-atthe saMe tithe?
_ Question 12',
Which temperature reading is 25-degrees lowerthan 15° Fahrenheit?
Question 13, .1)
This is a'chart of dnformation about 5-planets.Which of these planets has the longest year?
.0
Question 14
Look at the chart-again. Which 2 planets have. about the same lengfih of day?
,
Question 15
This is a.graph of the boiling temperatves of6 different liquids. Which'liquid has thelowest boiling temperature?
Question 16
Look at the graph aga4n. Which liquids have thesame boiling temperature?
120
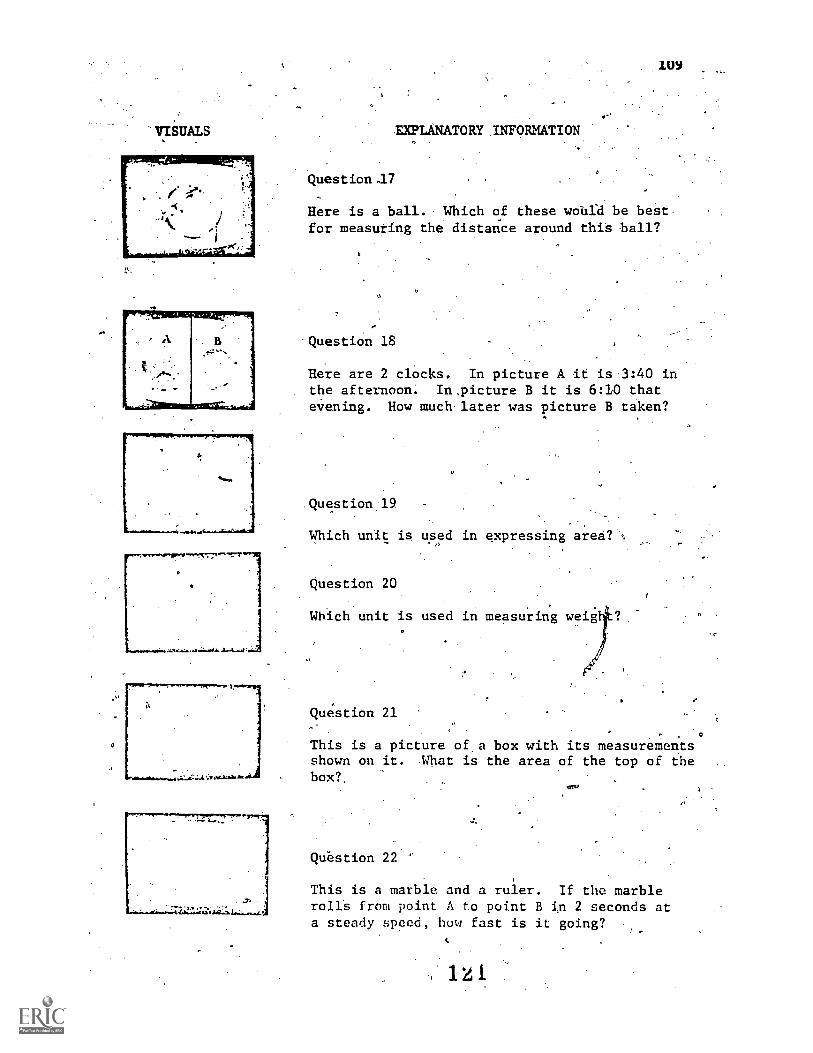
VISUALS
Q.
1re.ne,r,,ii7,0",,,,T77.'"!7"3.
4. ...e...c..........ta..1.-1.J
-SXPLANATORY INFORMATION
'Question.l7
Here is a ball. Which of these wobrd be bestfor measuring the distance around thiS ball?
1139
-Question 18
Here are 2 clocks. In picture A it is 3:40 inthe afternoon. In.picture B it is 6:10 thatevening. How much later was picture B taken?
Question 1
Which unit is used in expressing area?4,
Question 20
Which unit is used in measuring weig
Question 21
This is a picture of a box with its measurementsshown on it. What is the area of the top of thebox?,
era,
Qubstion 22 '
This.is a marble and a ruler. If the marbleroll's from point A. to point B in 2 seconds ata steady speed, how fast is it going?
c
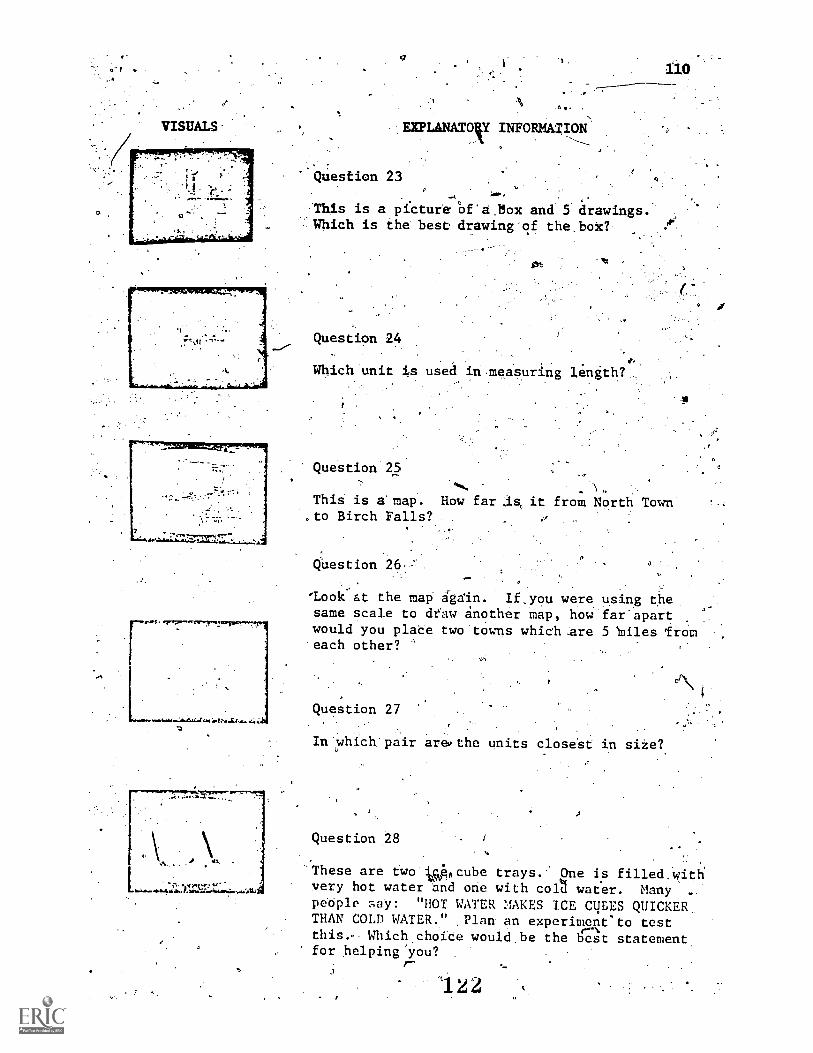
VISUALS.
7
110
EXPLANATOiy INFORMATION
Qxiestion 23:.,-,
:This is a picture Of'd.Box and 5drawings.Which is the best drawing'of the.b0c?
Question 24
. .
Which unit is used in..measuring length?.
Question 25-
This is a' map. How far it from North Townto Birch Falls?
Oilestion
'Look. at the map-e'gdin. If,you were using thesame scale to daw nothr Map, how far'apartwould you plate two towns which:are 5 biles from'each other?
el\-
Question 27
In which pair are, the units closest in size?
Question 28
These are two epcube trays. One is filled.withvery hot water and one with colt water. Manypeople ,say: "HOT WATER MAKES ICE CULES QUICKERTHAN COLD WATER. Plan an experimeRt"to testthis.- Which choice would be the gest statementfor helping'you?
r-
1.22
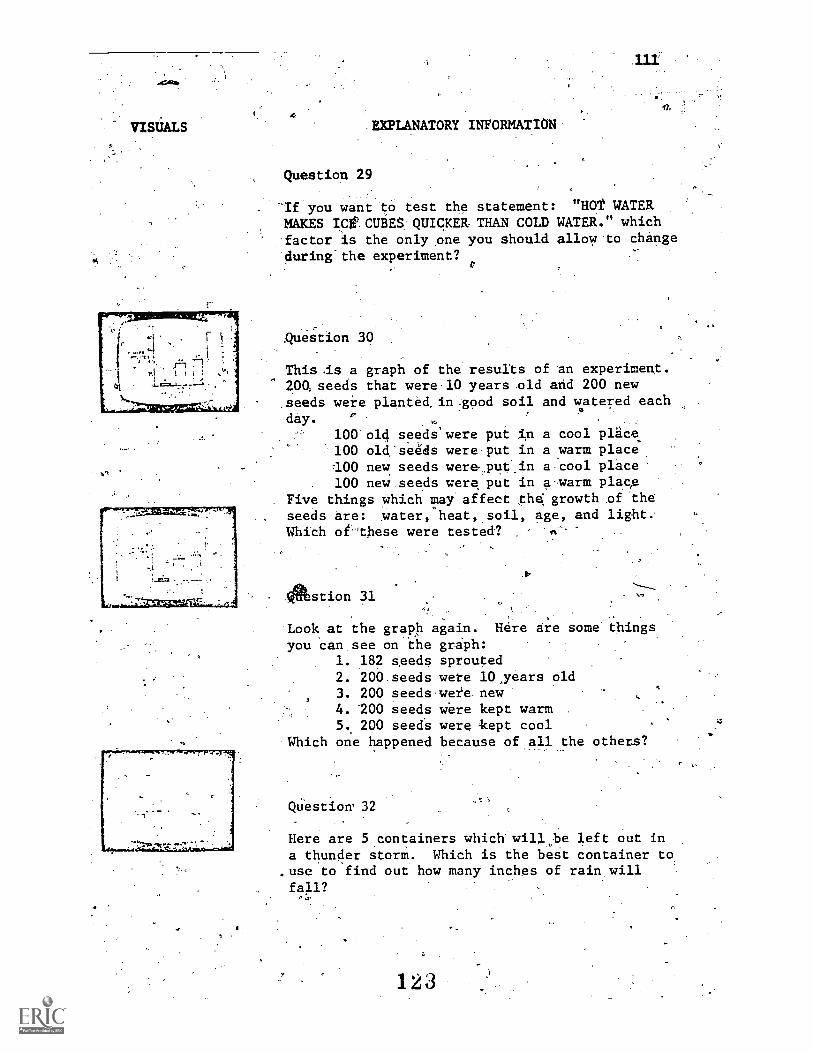
EXPLANATORY INFORMATION
Question 29
TIf you want-to test the statement: "HOT WATERMAKES ICtCUEES QUICKER THAN COLD WATER." whichfactor 'is the only .one you should allow.to change
during-the experiment?
-
guestion 30
This.is a graph of the results of an experiment.200. seeds that were.10 years old and 200 new.seeds were planted,in.,good soil and watered eachday. P ,
100'o14 seeds'were put in a cool place100 old-seeds were,put in a warm place100 new seeds were.put,in a cool place100 new seeds were put in a.warm place
Five things which may affect the; growth of theseeds are: water, heat, soil, age, and light.Which of 'tbese were tested?
I.
stion 31
Look at the graph again. Here are some thingsyou can see on the graph:
1. 182 seeds sprouted2. 200 seeds were lOyears old3. 200 seeds were new4. 200 seeds were kept warm5.. 200 seeds were -kept cool
Which one happened because of all,the others?
Qu'estioxr 32
- -.
Here are 5 containers which willobe left out ina thunder storm. Which is the best container to
.use to find out how many inches of rain willf4.1?
123

4.
..17ISUALS EXPLANATORY INFORM*TION
Question 33
o
112
Here are 4 screws and 4 magnets. Whicli statementCANNOT be made jqst from looking at the picture?
Question 34-
Here is some string. The manufacturer claimsit will hold at least 100 lbs. What is.thebest way to check this?
f.
Question 35
This is a chart of the change in length of ametal bar as it is heated. What is its lengthat 40° C.?
Question 36
Look at the chart again. What will the lengthof the bar probably be at 100° C.?
,s
Question 17
What is the best way to check the answers to'the last two qLestions?
12 4
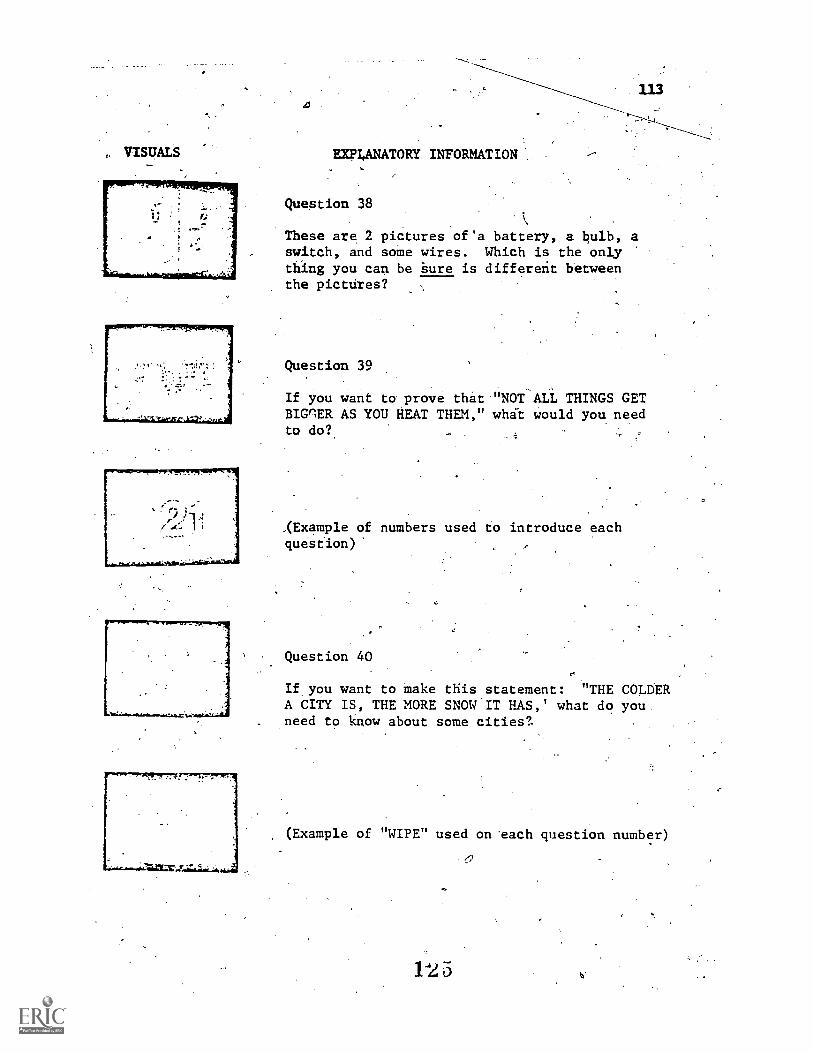
, nspas EXPLANATORY INFORMATION
Question 38
These are 2 pictures of'a battery, a bulb, a&witch, and some wires. Which is the onlything you can be -Sure is different betweenthe pictures?
Question 39
If you want to prove that '''NOT AtL THINGS GETBIGnER AS YOU HEAT THEM," whit would you needto do?,
-`
XExample of numbers used to introduce eachquestion)
Question 40
c
If you want to make this statement: "THE COLDFRA CITY IS, THE MORE SNOW IT HAS,' what do youneed to know about some cities?.
(Example of "WIPE" used on 'each question number)
1445 ta.
VISUALS EXPLANATORY INFORMATION
.>
(End credits to part 2 Of test)
114
.c"
APPENDIX G
SCRIPT FOR INTRODUCTION AND SIGN-OFF
127
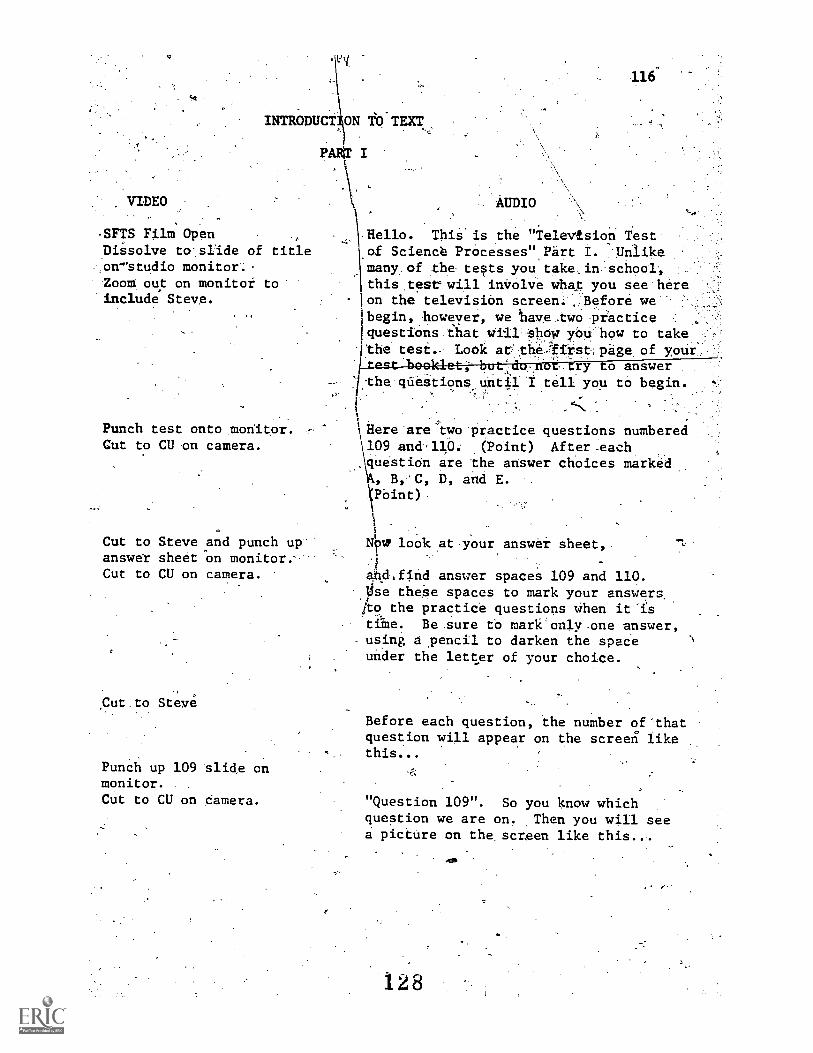
VIDEO
T1
')
INTRODUCT ON TQ'TEXT
PATO I
\
A'1
,SFTS Film OpenDissolve toislide of title
:,orr°studio monitor:.
Zoom out on monitor to'include Steve.
Punch test onto monitor.Cut to CU on camera.
Cut to Steve and punch up--answet sheet on monitor.--Cut to CU on camera.
,Cut.to Steve
Punch up 109 slide onmonitor.Cut to CU on damera.
116-
Hello. Tbis'is the "Televtsion Testof Science PrOcesses".Part I. :Unlikemanyof.the tests you take,in'schooL,this .test will inVOlVe what you seehere:oh the television screen.:Before we --
begin, 'however, we tavetWO practice,. -
questibns thatwiiI.004 ybw'how to take;:the tesi- Look aetne24rst;page Of your:
. .
te.qt booklet;- buCdu,abZ,try to answer
I
. A ,
the qdeitions until-I tell you tO begin._ . .
1
Here.are two practice questions numbered109 anth110: .(Point) After-eachquestiOn are the answer cnoices marked
, B, C, D, and E.Pbint)-
1
to look atyour answer sheet,.
44dJUld answer spaces 109 and 110.tfse theSe spaces to mark your answersito the practice questions When it'isti'ine. Be-sure tb mark'only.one answer,
- using a pencil to darken the spaceunder the letter of your choice.
Before each question, the number of thatquestion will appear on the screerl likethis...
"Question 109". So you know whichquestion we are on. Then you will seea picture on the screen like this...
128
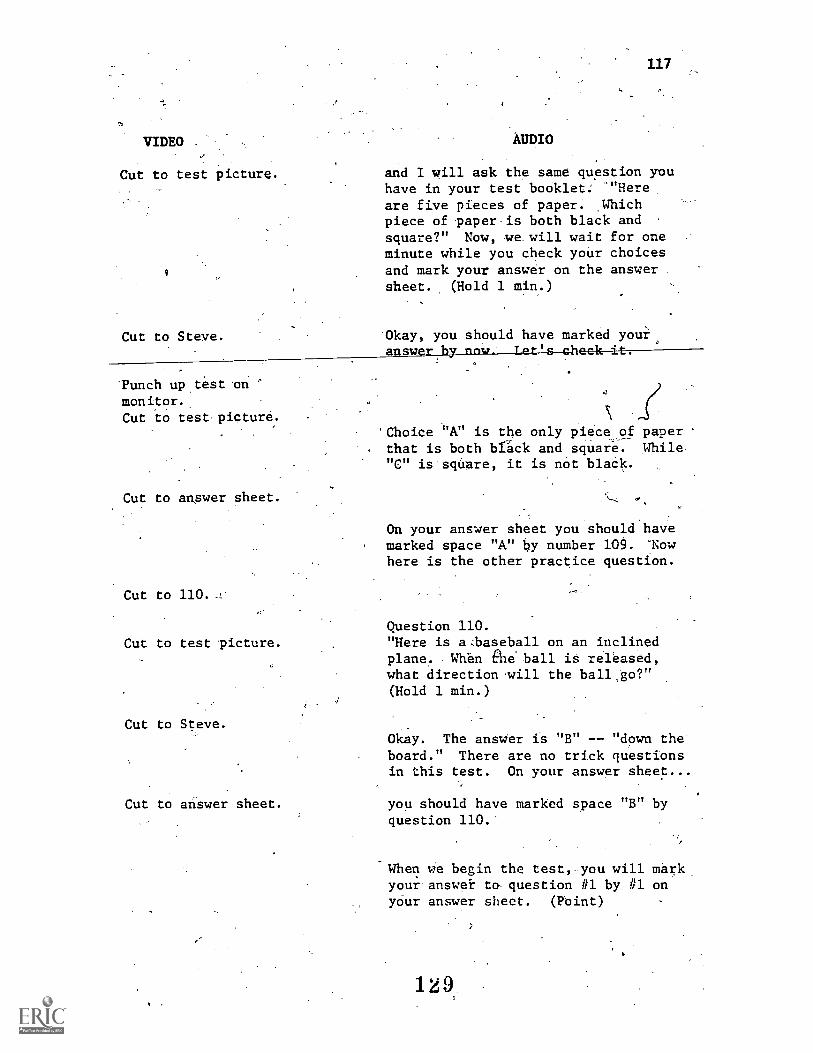
VIDEO
Cut to test picture. and I will ask the same question youhave in your test booklet: 'Hereare five pieces of paper. .Whichpiece of paper is both black andsquare?" Now, we will wait for oneminute while you check your choices
9 and mark your answer on the answersheet. (Hold 1 min.)
AUDIO
117
Cut to Steve.
-Punch up test on '
monitor..Cut to test-picture.
Cut to answer sheet.
Cut to 110._
Cut to test picture.
Cut to Steve.
Cut to answer sheet.
Okay, you should have marked youransw II II
'Choice "A" is the only piece_of paperthat is both brack and square. While-
"C" is square, it is not blaCk.
On your answer sheet you should havemarked space "A" by number 109. "Now
here is the other practice question.
Question 110."Here is a:baseball on an inclinedplane. When Eile. ball is released,what direction will the ball,go?"(Hold 1 min.)
Okay. The answer is "B" "down theboard." There are no trick questionsin this test. On your answer sheet...
you should have marked space "W! byquestion 110.'
-When we begin the test, you will markyour answe ta question #1 by #1 onyour answer sheet. (Point)
129
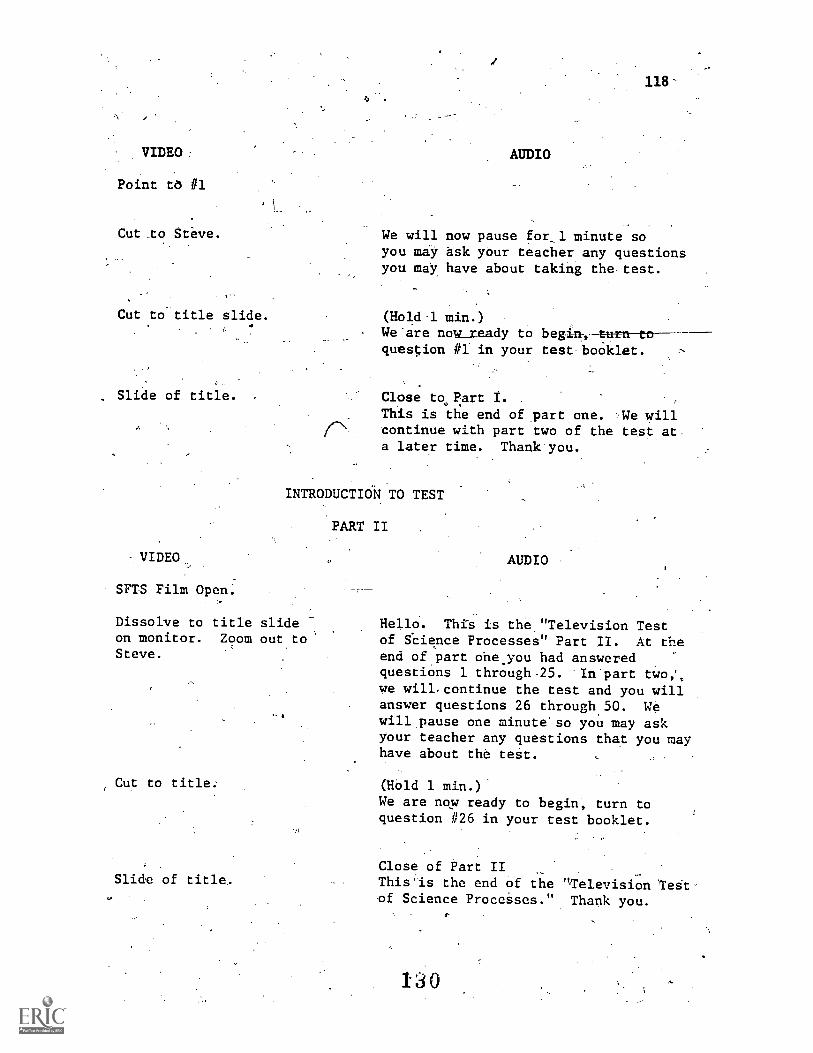
VIDEO AUDIO
Point tO #1
Cut _to Steve.
Cut to title slide.
Slide of title.
1.
118-
We will now pause for,1 minute soyou may ask your teacher any questionsyou may have about taking the test.
(Hold.1 min.)We'are now_ready to begin-, turn toquestion #1 in your test.booklet.
Close to.Part I.
This is the end ofipart one. -We willcontinue with part two of the test at.a later time. Thank.you.
INTRODUCTION TO TEST
PART II
-VIDEO, AUDIO
SFTS Film Open.
Dissolve to title slide Hello. Thrs is the "Television Teston monitor. Zoom out to 1 of SCience Processes" Part II. At theSteve. end of part oheyou had answered
questions 1 through.25. In part two,',
we will-continue the test and you willanswer questions 26 through,50. Wewill pause one minute'so you may askyour teacher any questions that you mayhave about the teet.
Cut to title.
Slide of title.
(Hold 1 min.)
We are nqw ready to begin, turn toquestion #26 in your test booklet.
Close of Part IIThis'is the end of the ItTelevision Testof Science ProceSses." Thank you.
130
119
mir
APPENDIX H
TELEVISION TEST pi' SCIENCE PROCESSES.,FORM A AND B
131
\
.o
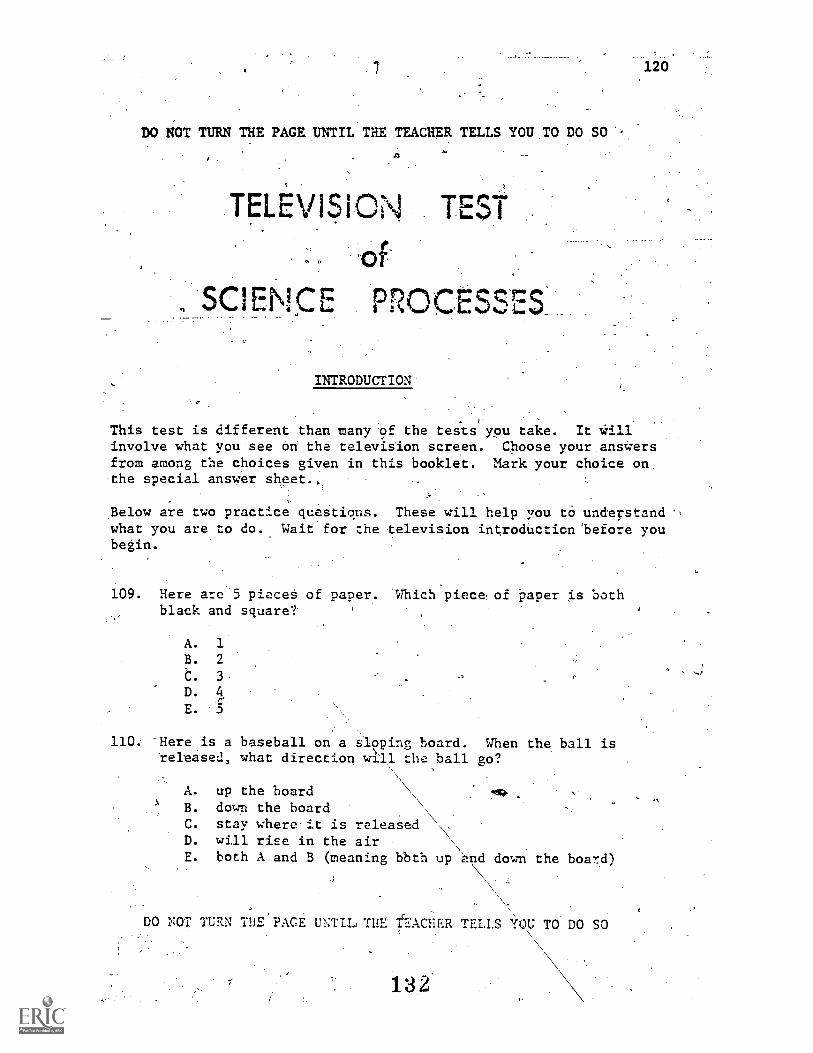
DO NOT TURN THE PAGE. UNTIL THE TEACHER TELLS YOU,TO DO SO
TELEVISION TEST
011
, SCIENCE PROCESSES
INTRODUCTION
120
-
This test is different than many of the tests you take. It Willinvolve what you see on the television screen. Choose your answersfrom among the choices given in this booklet. Mark your choice onthe special answer sheet..
;"'
Below are two practice questions. These will help you tO undeT-standwhat you are to do. Wait for the television introduction 'before youbegin.
109. Here are 5 pieces of paper. Which piece of paper is bothblack and square?
A. 1
B. 2
C. 3
D. 4
E. 5
110: -Here is a baseball on a sloping board. When the ball is'released, what direction will the ball go?
A. up the boardB. down the boardC. stay where-it is released
\
D. will rise in the air ,
E. both A -and B (meaning-bbth up and down the board)
DO NOT TURN THE :PAGE UNTIL, TH1: TEACHER TELLS YOU TO DO SO
\,
132
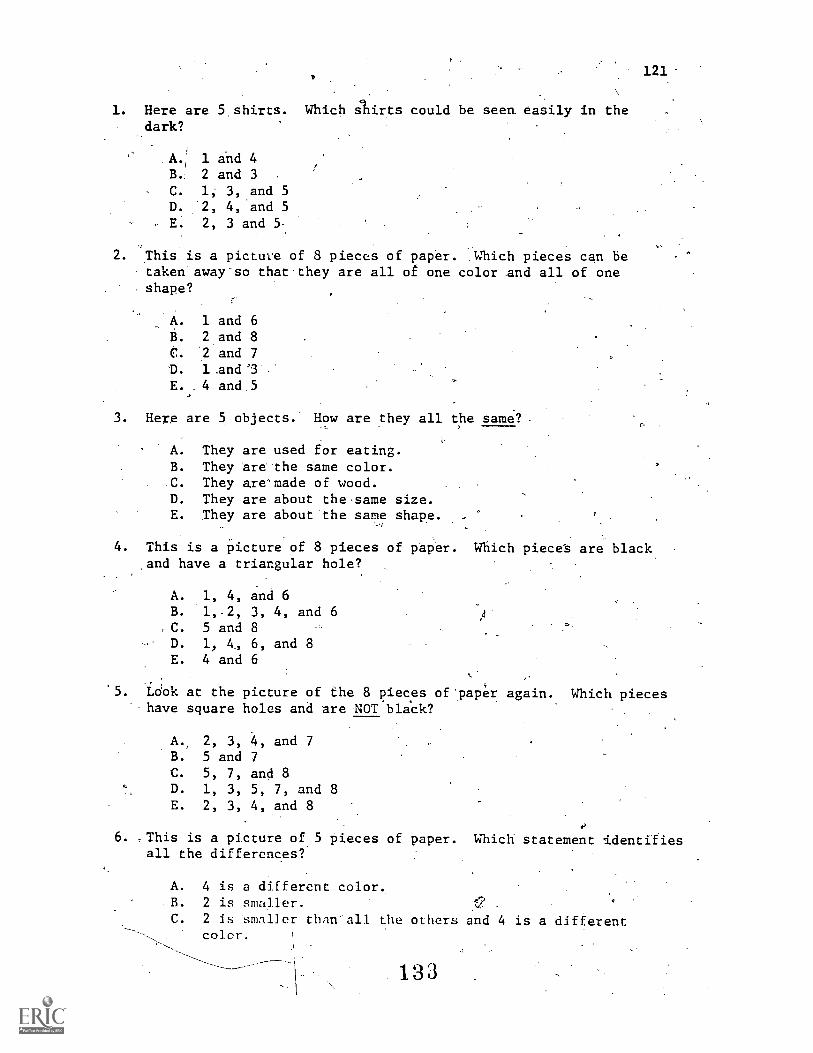
121
1. Here are 5.shirts. Which airts could be seen. easily in thedark?
A. 1 and 4B., 2 and 3C. 1; 3, and 5D. '2, 4, and 5
- E. 2, 3 and 5-
2. This is a pictuve of 8 pieces of paper. Which pieces can betaken away so that'they are all of one color and all of oneshape?
A. 1 and 6B. 2 and 8C. .2 and 7
D. 1
E. 4 and 5
3. Here are 5 objects. How are they all the same? .
A. They are used for eating.B. They are the Same color..C. They are-made of wood.D. They are about the.same size.E. They are about the same shape.1
4. This is a picture of 8 pieces of paper. Which piece's are blackand have a triangular hole?
A. 1, 4, and 6B. 1,-2, 3, 4, and 6
, C. 5 and 8- D. 1, 4, 6, and 8
E. 4 and 6
s-
'5. Ldok at the picture of the 8 pieces of paper again. Which pieceshave square holes and are NOT black?
A. 2, 3, 4, and 7B. 5 and 7C. 5, 7, and 8D. 1, 3, 5, 7, and 8 .
E. 2, 3, 4, and 8
6. This is a picture of 5 pieces of paper. Which statement identifiesall the differences?
A. 4 is a different color..B. 2 is 'smaller. -
C. 2 is 'smaller than'all the others and 4 is a differentcolor.
133
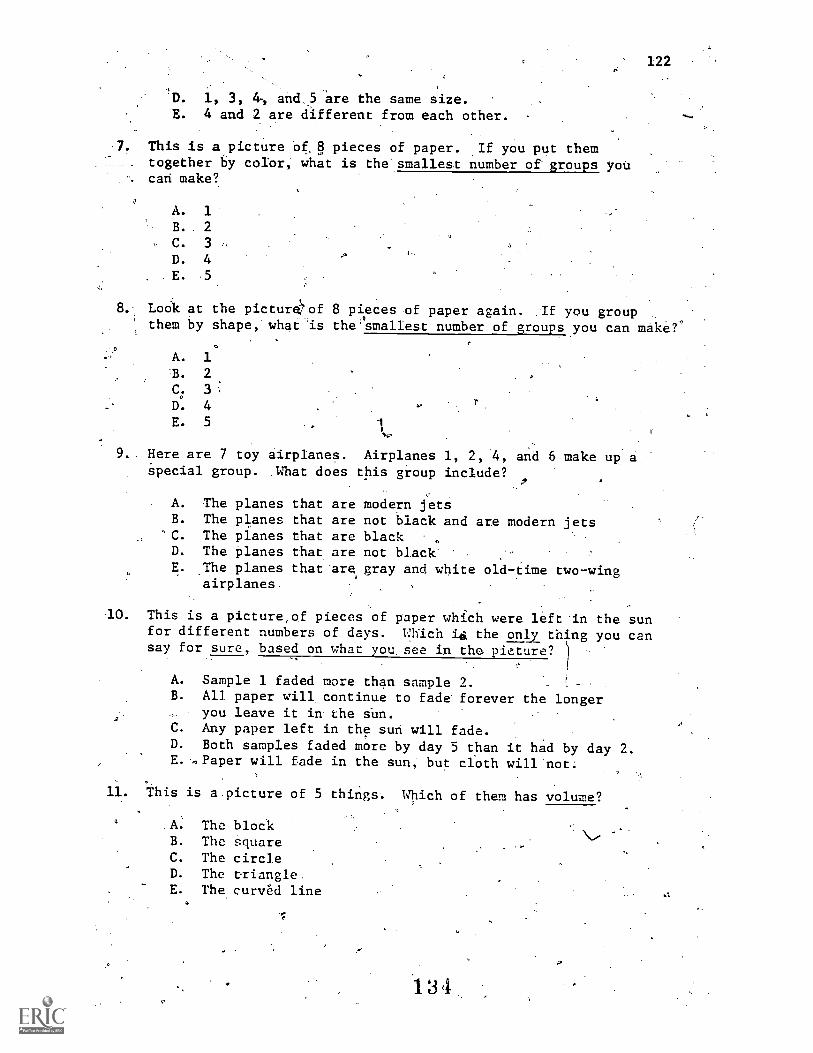
122
. 1, 3, 4-, and5 'are the same size.E. 4 and 2 are different from each other.
7. This is a.picture of 8 pieces of paper. If you put themtogether by coIor, what is the smallest number of groups youcan make?
A. 1
B. 2
C. 3
D. 4
E. 5
8. Lodi( at the pictureof 8 pieces of paper again. :If you group .
' them by shape, what is the'smalIest number of groups.you can make?'
A. 1B. 2
C. 3
D. 4
E. 5
9.. Here are 7 toy airplanes. Airplanes 1, 2,4, and 6 make up aspecial group. .What does this group include?
A. The planes that are modern jetsB. The planes that are not black and are modern jets
'C. The planes that are blackD. The Planes that are not black'E. ,The planes thatare gray and white old-iime two-wing
airplanes.
10. This is a picturerof pieces of paper which were left.in the sunfor different numbers of days. Wliich i the only_ thing you cansay for sure, based on what you see in the pieture? )-
A. SaMple 1 faded more than sample 2. _
B. All paper will, continue to fade forever the longeryou leave it in- the sUn.
C. Any paper left in the sun will fade.D. Both samples faded more by day 5 than it had by day 2.E.-,,Paper will ade in the sun; but cfoth will not;
11. This is a picture of 5 things. Which of them has volume?
A. The blockB. The squareC. The circleD. The triangleE. The curved line
134
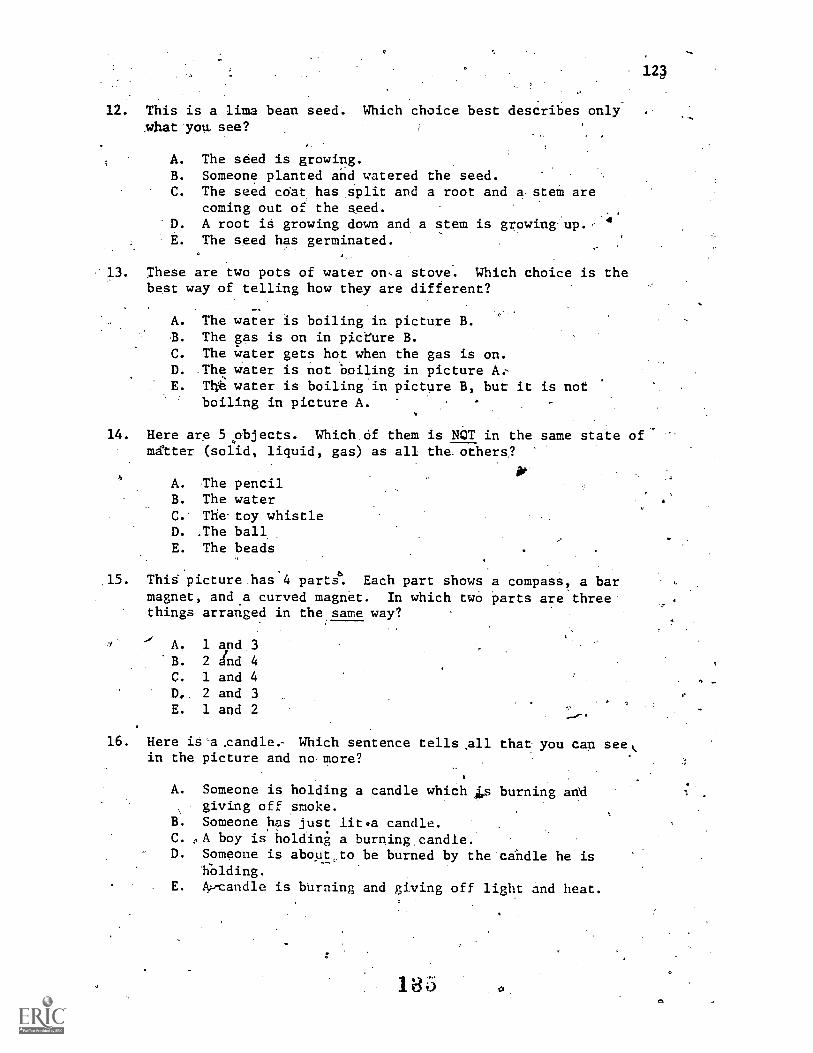
124
,
12. This is a lima bean seed. Which choice best describes onlywhat-yow see?
A. The seed.is growing.B. Someone planted and watered ihe seed.C. The seed cdat has split and a root and a.steM are
coming out of the s,eed.. 4 .
D. A root iS growing down and a stem is growing. up.,. The seed has germinated.
. 13. These are two pots of water on,a stove. Which choice is thebest way of telling how they are different?
...
A. The water is boiling in picture B.. The gas is on in 0.ceure B.C. The water gets hot when the gas is on.D. .The water is not boiling in picture A:E. T1-i water is boiling'in picture B, but it is not
boiling in picture A.
14. Here are 5 objects. Which Of them is NOT in the same state of'mgtter (solid, liquid, gas) as all the.others?
9A'
A. The pencilB. The waterC. The toy whistleD. .The ball,
E. The beads
15. ThiS picture has'4 parts°. Each part shows a compass, a barmagnet, and.a curved magnet. In which twO parts are threethings arranged in the same way?
A. 1 and 3B. 2 dnd 4C. 1 and 4D,_ 2 and 3E. 1 and 2
16. Here is'a .candle.- Which sentence tellsall that you can seein the picture and no more?
A. Someone is holding a candle which Is burning and, giving off .smoke.
B. Someone has just lit.a candle.C. ,A boy is holding a burning.candle.D. Someone is about,to be burned by the candle he is
hOlding.. E. Aw'candle is burning and giving off light and heat.
135
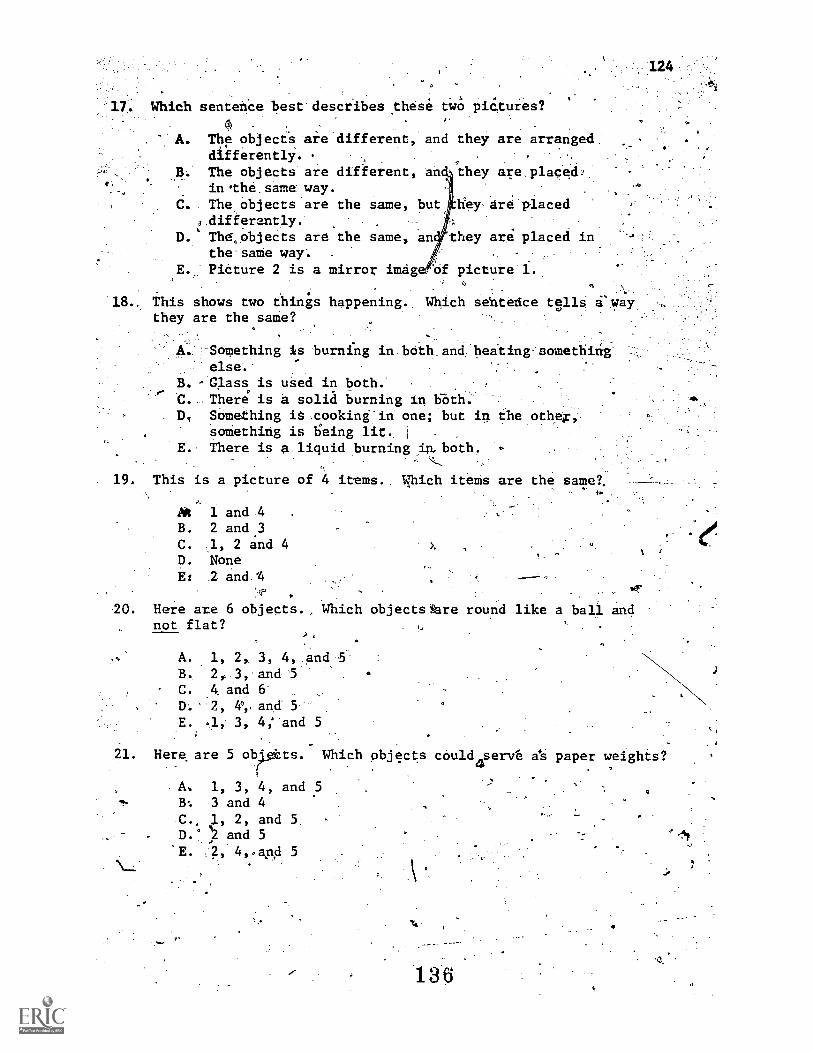
Which sentence besedescrIbes these tWo pictures?.
A. The objeces are'different, and they are arrange&differentlY.
B. The objects are different, an 'they are placed?.in .the, same way.
C. . TheObjects are the same, but hey, 'Lire pieced
6.differantly. --
D.',Theobjects are the same, an they are placed inthe-sate way: .
PiCture 2 is a mirror imág f picture 1.
18. This shows two things happening. Which sehtedce tglls i'waythey are the same?
:-Something is burnilg in bOth_en&beiting;somethigelse-
B. -Glass is uSed in both.' .
C. There is A solia burning in Foth.D, SOmething 1.,cookingin one; but in ehe
soiething is being lit..E. there is a.liquid burning in.both.
19. This is a picture of 4 items. Which items are
Ak 1 and 4B. 2 and.3C. 2 and 4D. NoneEs .2 and.4
:(T- ,
20. Here are 6 objects., Which objects$ere round like a ball andnot flat? .
the same?.ig
A. 1, 2, 3, 4,.and13.1 2,-3,-and 5C. _4_ and 6-
, D. ,-2, te,, and 5
E. .1,- 3, 4; and 5
21. Here are 5 obiskts. Which objects couldaserik a's paper weights?
A, 1, 3, 4, and 54. B: 3 and 4
C., 1, 2, and 5D. :!2 and 5
E. 2, 4,.apA 5
_
136
.;
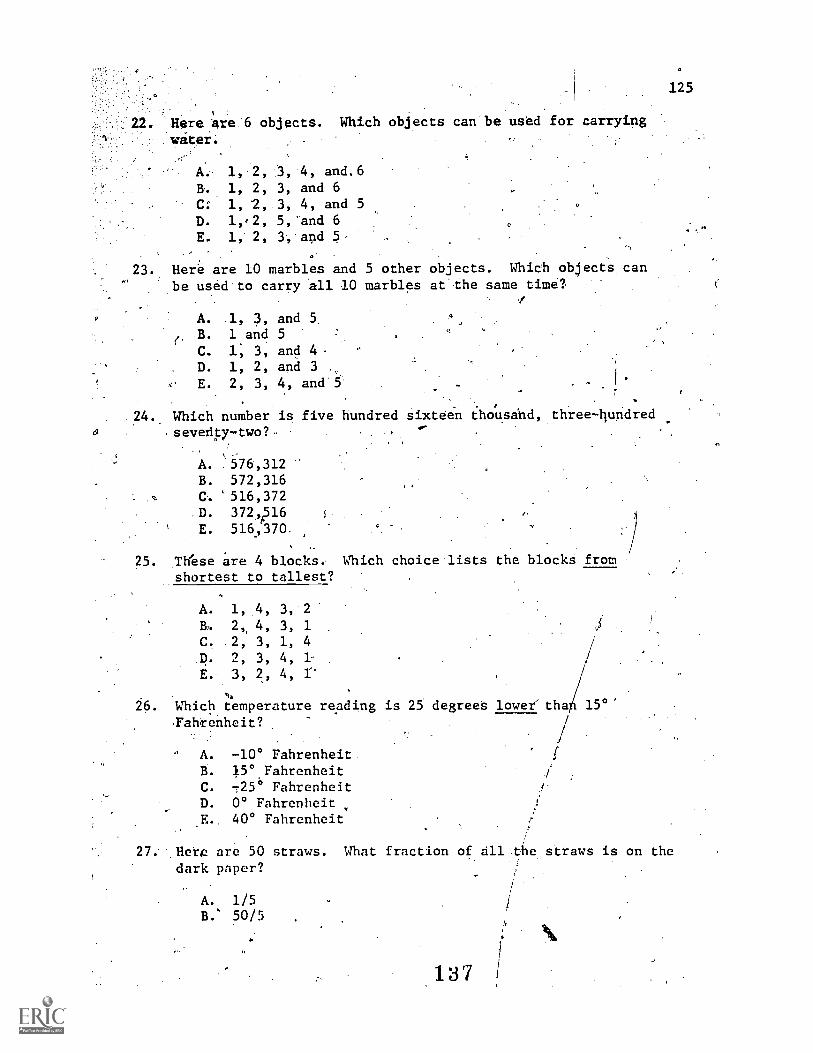
22. Here are 6 objects. Which ob ects can be us6d for carrying
witer.
23.
A.
B.
C:
D. 1,,2, 5,'and 6E. 1, 2, 3, apd 5.
1, 2, 3, 4, and.6
1, 2, 3, and 6
1, 2, 3, 4, and 5
Here are 10 marbles and 5 other objects. Which objects can
be used to carry all 10 marbles at he same time?
(.
A. .1, and 5,
11. 1 and 5
C. l', 3, and 4.D. 1, 2, and 3 .
E. 2, 3, 4, and.5'
.
24.. Which number is five hundred sixteen thousand, three-hundred.severity-two?-
A. 576,312B. 572,316C. '516,372D. 372 516E. 516,370.
25. These are 4 blocks,. Which choice.lists the blocks fromshortest to tallest?
26. Which temperature reading is 25 degrees lower' tha 15°'
A. 1, 4, 3, 2
R. 2,, 4, 3, 1
C. 2, 3, 1, 4
D. 2, 3, 4, 1-
E. 3, 2, 4,
abrePheit?
" A. -10° FahrenheitB. 15°.FahrenheitC. 725° FahrenheitD. 0° Fahrenheit.E. 40° Fahrenheit
27. Here are 50 straws. What fraction of all the straws is on thedark paper?
A. 1/5B. 50/5
137
125
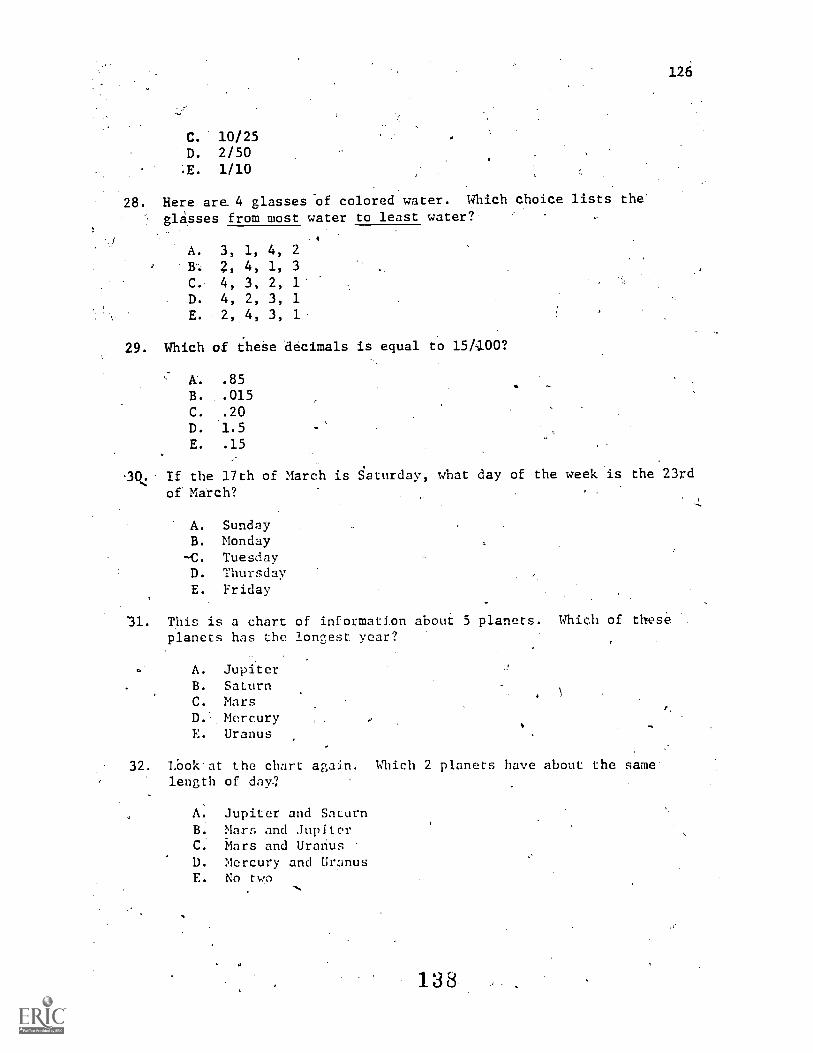
126
C. 10/25D. 2/50
E. 1/10
28. Here are 4 glasses-of colored water. Which choice lists the'
glasses from most water to least water?
A. 3, 1, 4, 2B. 2, 4, 1, 3C. 4, 3, 2, 1D. 4, 2, 3, 1E. 2, 4, 3, 1
29. Which of these decimals is equal to 15/100?
A. .85
B. .015
C. .20D. 1.5E. .15
-30,4 If the 17th of March is .eturday, what day of the week is the 23rd
of March?
A. SundayB. Monday
--C. TuesdayD. ThursdayE. Friday
31. This is a chart of information about 5 planets. Which of these .
planets has the lon^,est year?1.1
A. JupiterB. SaturnC. MarsD. MercuryE. Uranus
32. Lbok.at the chart again. Which 2 planets have about the samelength of day-?
A. Jupiter and SaturnB. Mars and JupiterC. Mars and UranusD. Mercury and UranusE. No tw.o
138
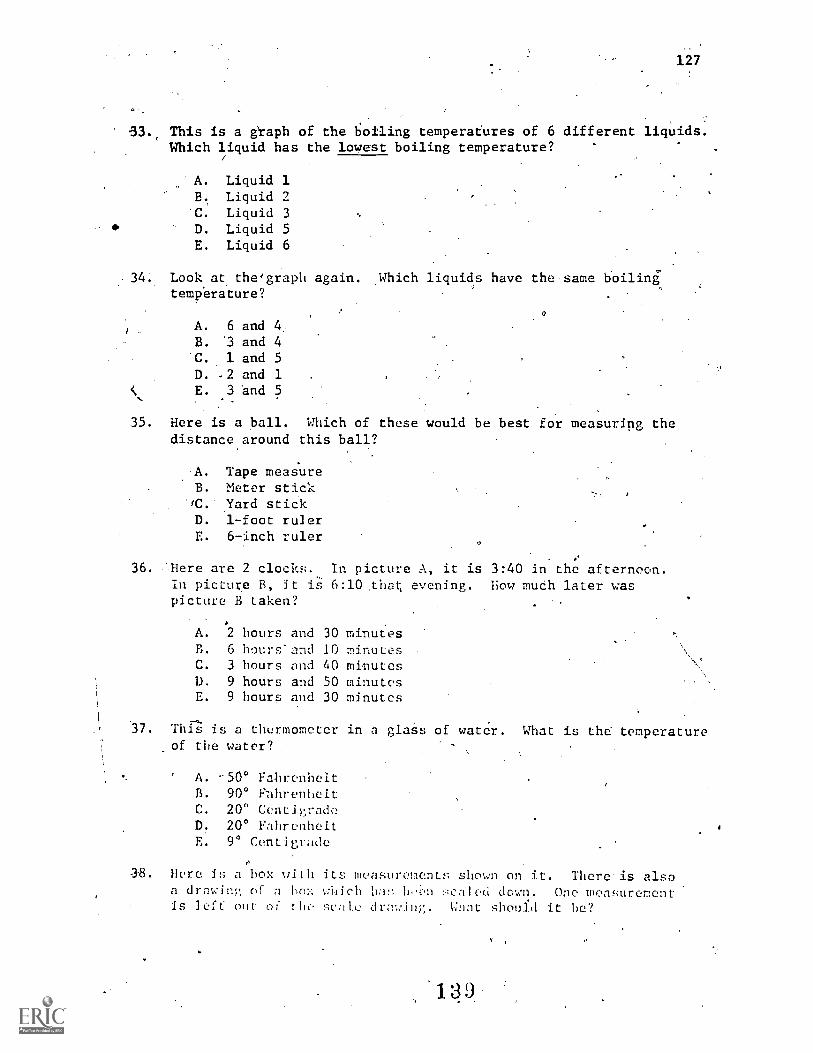
127
53., This is a graph of the b;oiling temperatUres of 6 different liquids.Which liquid has the lowest boiling temperature?
A. Liquid 1B. Liquid 2C. Liquid 3D. Liquid 5E. Liquid 6
34. Look at,. the'graph again. ,Which liquids have the same boilingtemperature?
A. 6 and 4B. '3 and 4
C. 1 and 5D. .2 and 1E. 3 and 5
35. Here is a ball. Which of these would be best for measuring thedistance around this ball?
A. Tape measureB. Meter stick
.fC. Yard stickD. 1-foot rulerE. 6-inch ruler
36. -jlere are 2 clocks. In picture A, it is 3:40 in the afternoon.In picture B, it i 6:10 ,that, evening. How mudh later waspicture, B taken? .
A. 2 hours and 30 minutesB. 6 hours-and 10 minutes .
C. 3 hours and 40 minutesD. 9 hoUrs and 50 minutesE. 9 hours and 30 minutes
,37. Thir s is a thermometer in a glass of water. What is the- temperature
of the water?
' A. 50° FahrenheitB. 90° PahrenheitC. 20 CentigradeD. 20° FahrenheitE. 90 Centigrade
as. flere is a box with its measurements shown on it. There is alsoa drawing of a be:-. which hi been scaled down. One measurementis left' out of the scale dra111. Whnt should it be?
1:39
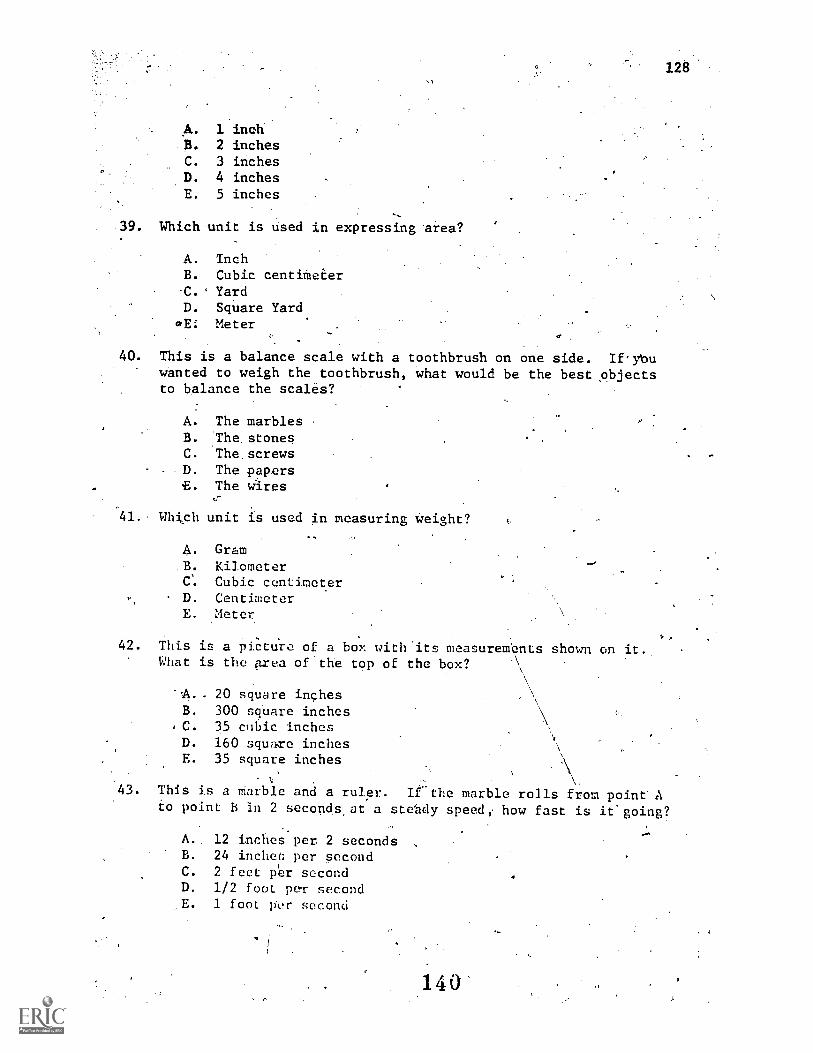
A. 1 inchB. 2 inchesC. 3 inchesD. 4 inchesE. 5 inches
39. Which unit is used in expressing area?
A. InchB. Cubic centiMeterC. ' Yard
D. Square YardGE: Meter
40. This is a balance scale with a toothbrush on one side. If'rouwanted to weigh the toothbrush, what would be the best objectsto balance the scales?
A. The marblesB. IhestonesC. 'The screws
-D. The papersE. The wires
41. Which unit is used in measuring Weight?
A. Gram. B. KilometerCs. Cubic centimeterD. CentimeterE. Meter
128
42. This is a picture of a box with'its measurements shown on it..What is the prea of the top of the box? .\
\.,
20 square inchesB. 300 square inchesC. 35 cubic inchesD. 160 square .inchesE. 35 square inches
. \.
43. This is a Marble and a ruler. Irthe marble rolls from point Ato point B In 2 seconds at a stelady speed; how fast is it.going?
A. 12 inches per 2 secondsB. 24 indict; per secondC. 2 feet pier secondD. 1/2 foot pe-r secondE. 1 foot per second
140
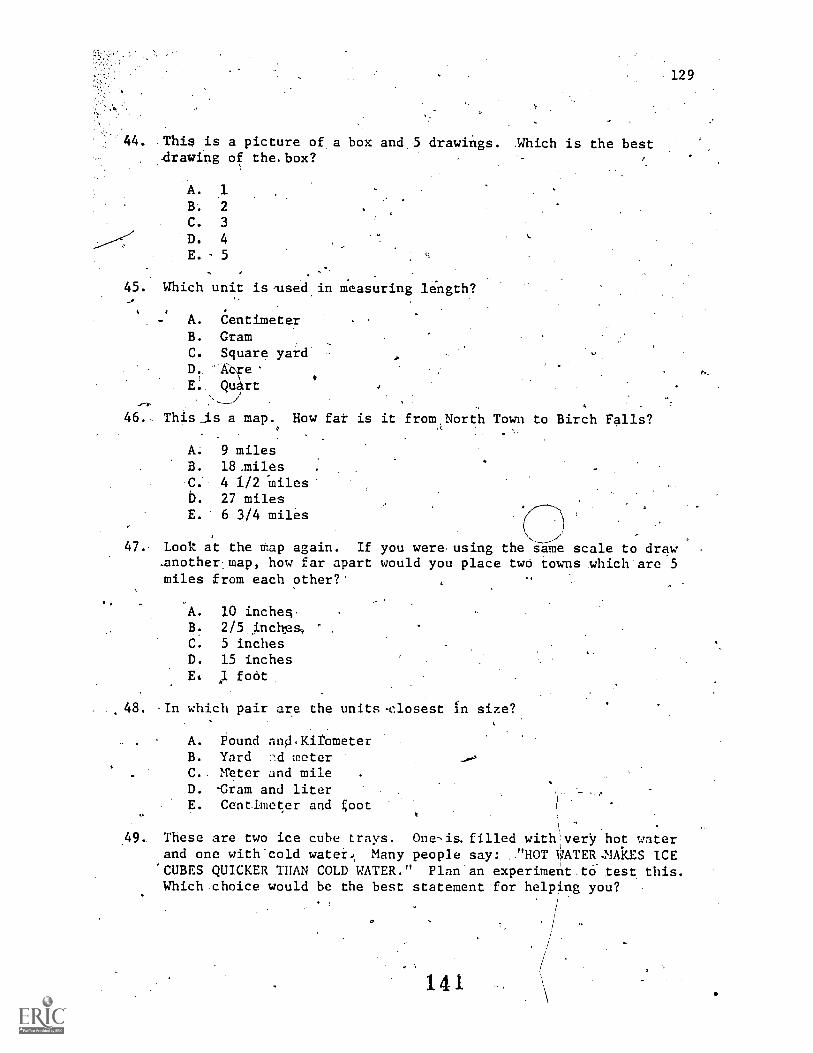
44. This is a picture of a box and 5 drawings. Which is the best.drawing of the.box?
A. 1
B. 2
C. 3
D. 4
E. - 5
45. Which unit is,used in measuring length?
- A. CentimeterB. Gram
.
C. Square yard'D7--Aere'E:, Quart
\--i46.. This_is a map. How fat is it from North Town to Birch Falls?
A. 9 milesB. 18,miles .
C. 4 1/2 "milesD. 27 milesE. 6 314 miles
129
47.. Look at the tap again. If you were using the Sime scale to draw,anothermap, how far apart would you place two towns which'are 5miles from each other?'
A. 10 inches.B. 2/5 nches,C. 5 inchesD. 15 inchesE 1foôt
48. .In which pair are the units-closest fn size?
A. Pound and.KirometerB. Yard -A meterC. neter and mileD. -Gram and literE. Centlmeter and goot
49. These are two ice cube trays. One-is.filled withverY hot waterand one with'cold watei.\ Many people say: -"HOT WATER.MAkES ICE'CUBES QUICKER THAN COLD WATER." Plan'an experimet.t6 test this.Which choice would be the best statement for helping you?
/
141
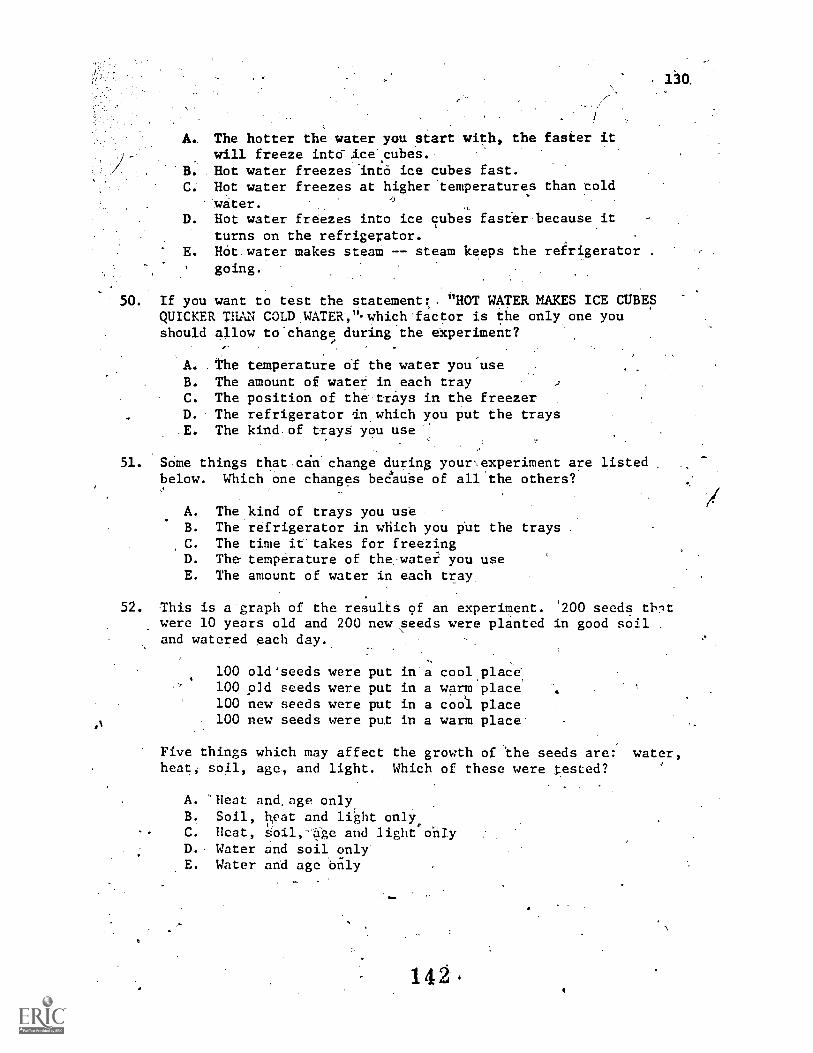
. The hotter the water you start with, the faster itwill freeze intd ice cubes.Hot water freezes into ice cubes fast.
C. Hot water freezes at higher temperatures than coldwater.
D. Hot water freezes into ice cubes faseer because itturns on the refrigerator.
E. Hot water makes steam -- steam keeps the refrigerator .
' going.
50. If you want to test the statement: , "HOT WATER MAKES ICE CUBESQUICKER THAN COLD WATER,"-which factor is the only one youshould allow to'change during the experiment?
A. The temperature 6f the water you'useB. The amount of water in each trayC. The position of the trays in the freezerD. The refrigerator in which you put the traysE. The kind of trayg you use
130.
51. Some things that can change durin yourmexperiment are listedbelow. Which one changes beeause of all the others?
A. The kind of trays you useB. The refrigerator in which you Put the traysC. The time it takes for freezingD. The temperature of the water you useE. The amount of water in each tray
52. This is a graph of the results 9f an experiment. 200 seeds thgtwere 10 years old and 200 new seeds were planted in good soiland watered each day.
,
100 old'seeds were put in a cool place'100 old seeds were put in a warm place100 new seeds were put in a cool. place100 new seeds were put in a warm place.
Five things which may affect the growth of the seeds are: water,heat, soil, age, and light. Which of these were tested?
A. 'Heat and,age only.B. Soil, twat and light onb%C. Heat, goil,-age and light onlyD. Water and soil onlyE. Water and age only
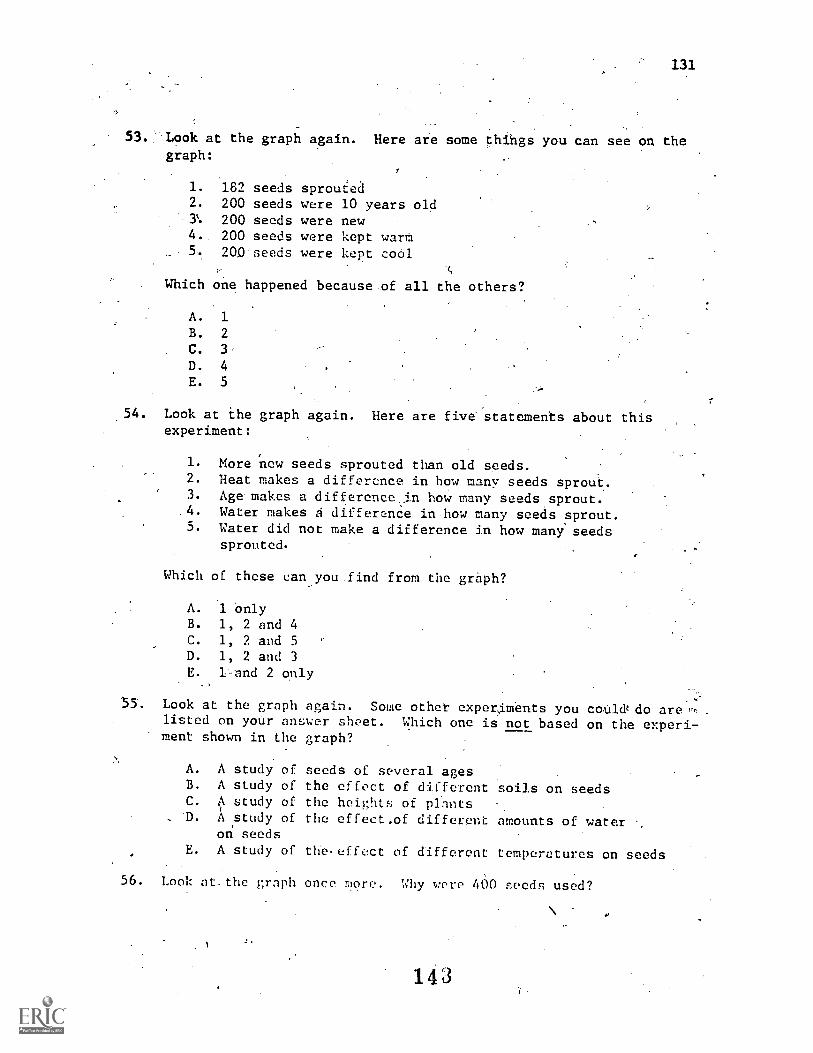
131
I>
53. .Look at the graph again. Here are some thihgs you can see on thegraph:
1. 182 seeds sprouted2. 200 seeds were 10 years old3% 200 seeds were new4. 200 seeds were kept wart5. 200 seeds were kept cool
Which one happened because of all the others?
A. 1
B. 2
C. 3
D. 4
E. 5
.54. Look at ihe graph again. Here are five statements about thisexperiment:
1. -More 'new seeds sprouted than old seeds.2. Heat makes a difference in how many seeds sprout.3. Age makes a differencevin how many seeds sprout.
.4. Water makes 6 difference in ,how many seeds sprout.5. Water did not make a difference in how mani seeds
sprouted.
Which of these can you .find from the graph?
A. I onlyB. 1, 2 and 4C. 1, 2 and 5D. 1, 2 and 3E. 1-and 2 only
55. Look at: the graph again. Some other experiments you couldtdo are v,listed on your answer sheet. Which one is not based on the experiment shown in the graph?
A. A study of seeds of several agesB. A study of the effect of dif.ferent soils on seedsC. A study of the heights of plants -.
, D. A .study of the effect.of different amounts of wateron seeds
E. A study of the-effect of different temperatures on seeds
56. Look at.the graph once more. Why were 460 seeds used?
4.
143
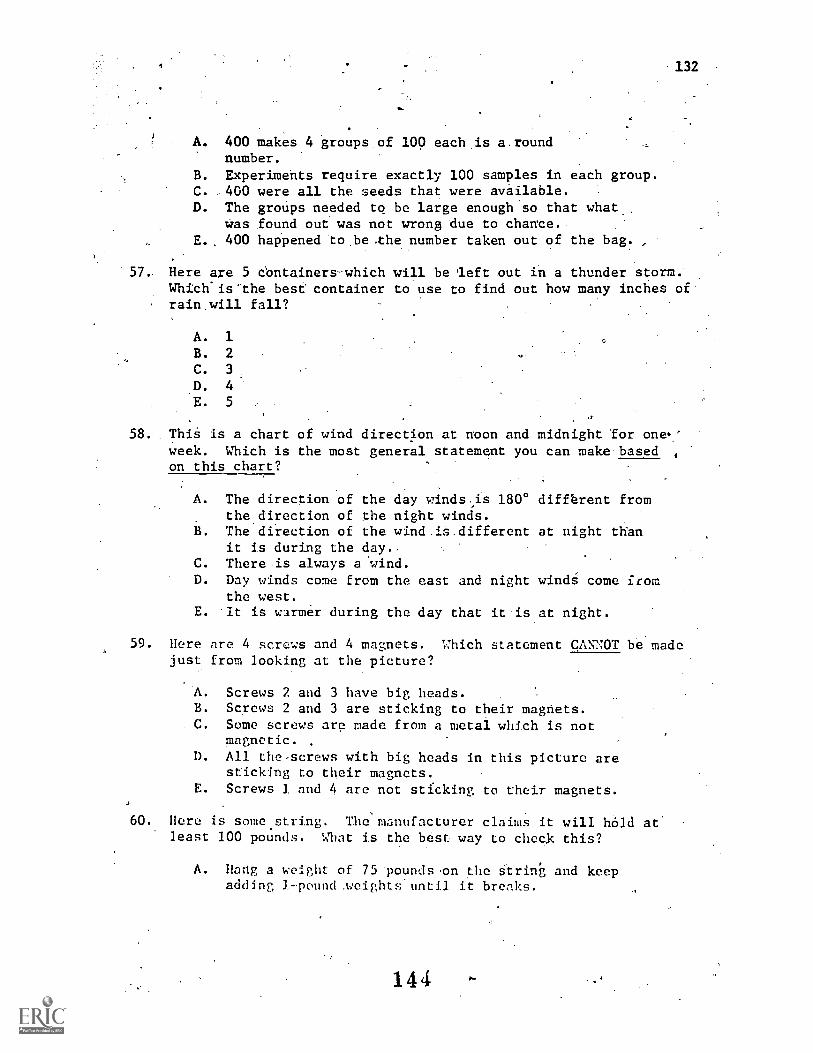
132
A. 400 makes 4 groups of lop each.is a.roundnumber.
B. Experimehts require exactly 100 samples in each group.C. ,400 were all the seeds that were available.'D. The groups needed to be large enough.so that what..
Was found out was not wrong Aue to chante..E. 400 happened to .be the number taken out of the bag. ,
57. Here are 5 dentainers-which will be left out in a thunder storm.Which'isthe best container to use to find out how many inches ofrain.will fall?
A. 1
B. 2
C. 3
D. 4
E. 5
58. Thie is a chart of wind direction at noon and midnight for one.'week. Which is the most general statement you can make based ,
on this chart?
A. The direction of the day winds,is 180° different fromthe direction of the night winds.
B. The direction of the wind is different at night th'anit is during the day..
C. There is always a wind.D. Day winds come from the east and night windi come from
the west.E. It is warmer during the day that it is at night.
59. Here are 4 screws and 4 magnets. Which statement CANNOT be madejust from looking at the picture?
A. Screws 2 and 3 have big heads.B. Screws 2 and 3 are sticking to their magfiets.C. Some screws are made from a metal which is not
magnetic.D. All the-screws with big heads in this picture are
sticking to their magnets.E. Screws 1 and 4 are not sticking to their magnets.
60. Here is some.string. The manufacturer claims it will hold at'least 100 pounds. What is the best way to check this?
A. Hang a weight of 75 .pounds.on the String and keepadding 1-pound meights'until it brenks.
144 -
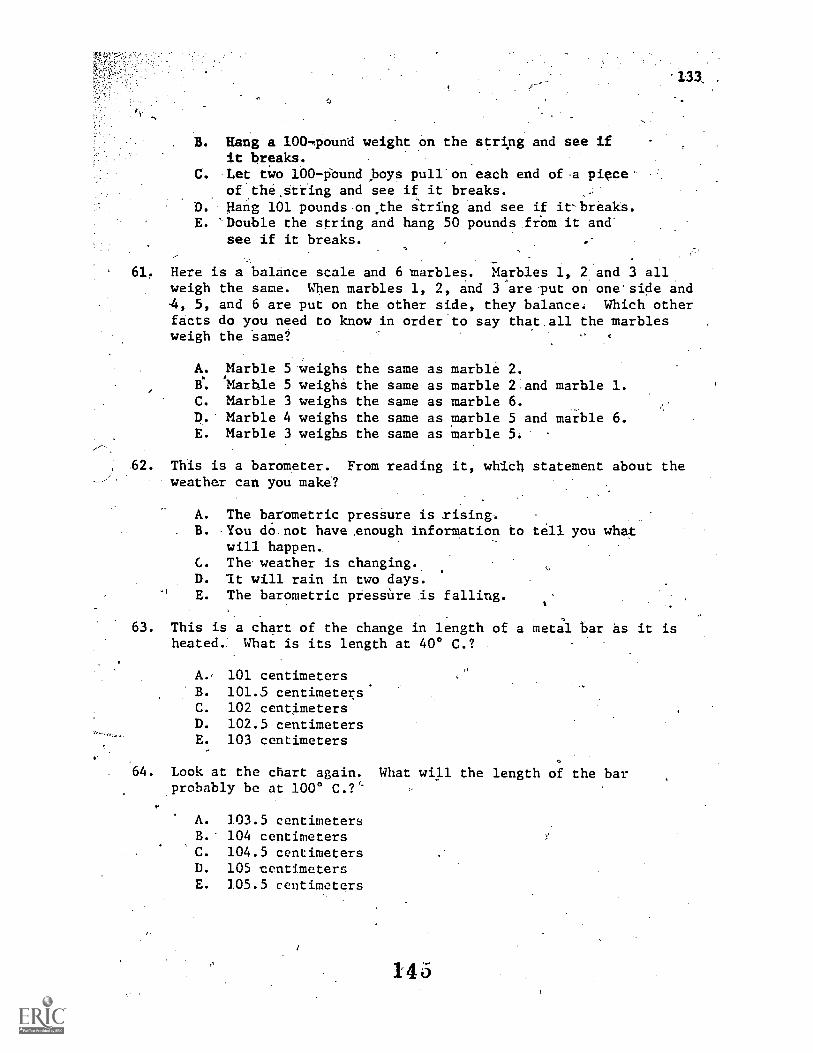
B. Hang a 100-Tound weight On the string and see ifit breaks.
C. .Let two 100-Pbund _boys pull-on each end of-a piece.-ofthe,String and see if it breaks.
D. Hang 101 pounds-onthe string and see if it-breaks.E. 'Double the string and hang 50 pounds fr.= it and'
see if it breaks.
61. Here is a balance scale and 6 marbles. Marbles 1, 2 and 3 allWeigh the same. When marbles 1, 2, and 3 are-put on one'side andA, 5, and 6 are put on the other side, they balance: Which otherfacts do you need to know in order to say that.all the marblesweigh the Same?
133,
A. Marble 5 weighs the same as marble 2.e. Marble 5 weighs the same as marble 2 and marble 1.C. Marble 3 weighs the same as marble 6.D. Marble 4 weighs the same as marble 5 and marble 6.E. Marble 3 weighs the same as marble 5.
62. This is a barometer. From reading it, which statement about theweather can you makel
A. The barometric presSure is rising,B. -You do not have ,enough information to tell you what
will happen,C. The weather is changing..D. It will rain in two days.E. The barometric pressUre is falling.
63. This is a chart of the change in length of a metal bar as it isheated. What is its length at 40° C.?
A., 101 centimetersB. 101.5 centimetersC. 102 cent,imetersD. 102.5 centimetersE. 103 centimeters
64. Look at the chart again. What will the length of the barprobably be at 100° C.?c
A. 303.5 centimetersB. 104 centimetersC. 104.5 centimetersD. 105 centimetersE. 105.5 centimeters
145
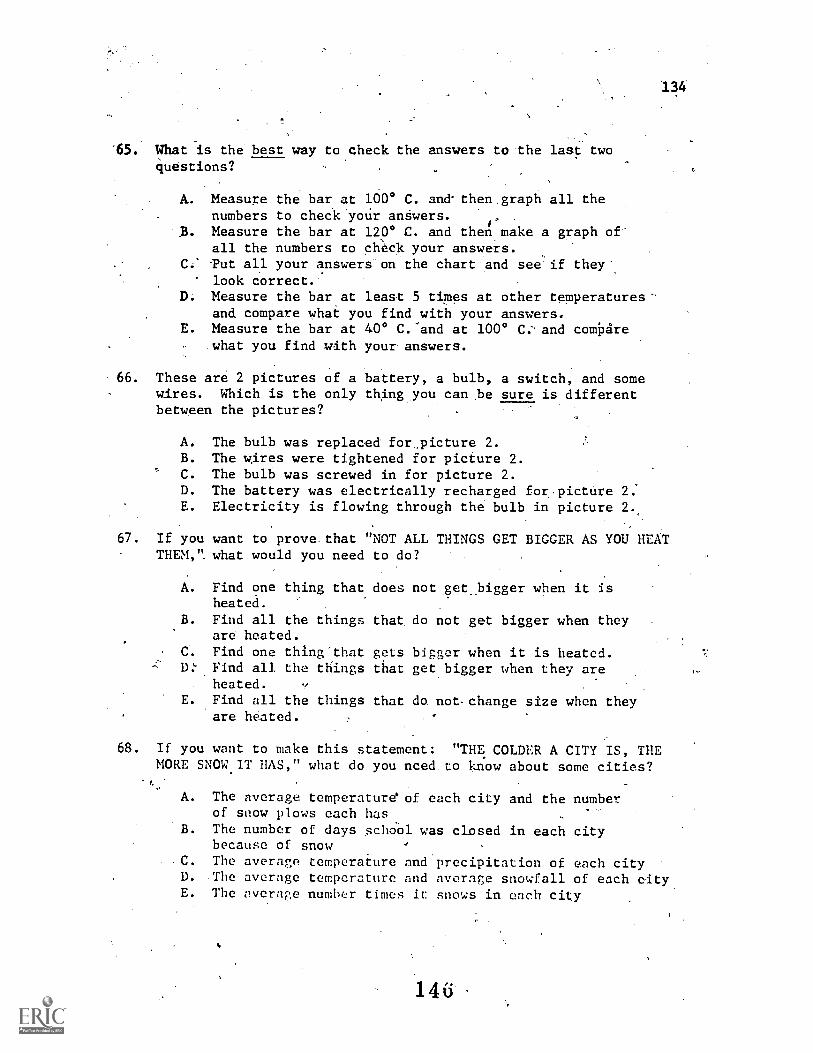
134
65. What is the best way to check the answers to the last twoquestions?
A. Measure the bar at 100° C. and* then graph all thenumbers to check'your anSwers.
B. Measure the bar at 120° C. and then make a graphall the numbers to check your answers.
C.' Tut all your answers on the chart and see if they',look correct.
D. Measure the bar at least 5 times at other temperatures -and compare whai you find with your answers.
E. Measure the bar at 40° C.Wand at 100° C. and combirewhat you find with your answers.
66. These are 2 pictures of a battery, a bulb, a switch, and somewires. Which is the only thing you can be sure is differentbetween the pictures?
A. The bulb was replaced for,picture 2.B. The wires were tightened for picture 2.
' C. The bulb was screwed in for picture 2.D. The battery was electrically recharged for picture 2:E. Electricity is flowing through the bulb in picture 2..
67. If you want to prove. that "NOT ALL THINGS GET BIGGER AS YOU HEATTHEM,". what would you need to do?
A. Find one thing that does not g t_bigger when it isheated.
B. Find all the things that do not get bigger when they .
are heated.C. Find one thing'that gets bigger when it is heated.1): Find all the things that get bigger when they are
heated.E. Find all the things that do not.change size when they
are heated.
.68. If you want to make this statement: "THE COLDER A CITY IS, THEMORE SNOW.IT HAS," what do you nced.to know about some cities?
A. The average temperature of each city and the numberof snow plows each has
B. The number of days school was cicsed in each citybecause Of snow
C. The average temperature and precipitation of each cityD. ,The average temperature and average snowfall of each city.E. The average number times it snows in each city
'135
APPENDIX I
TELEVISION TEST OF,SCIENCE PROCESSESFORM C
147
TV TEST OF SCIENCE PROCESSES .,4-
TEACHER'S TEST MANUAL
Introduction
136".
Thigotest is a modification of Dr. Robert Sher Tannenbaum'sTest of Science ProceS'ses. It has.been adapted for televisionpresentation-for the intermediate grades in:an:effort te asfess the..Scientifie.skills,and abilities that ard emphasized in many ef themodern science programs. Dr. Tannenbaum defines piocesses.and the''function of he test'as:.
,
'"Processes" are ways oi doing'things. For example,scientists have to be able to look at things very carefully and .
tell what they see. Scientists have to 'be able to measure and use .
numbers. And, scientists have to.be able to plan and understandexperiments. This is a test of how-welI students can do some ofthe Olings scientistS have to do: It is NOT.a test of hew many'lacts they know about science.
Preparation
'Allow sufficient time before the scheduled TV presentation toprepare the students for the TV test.' Following the introduction.toPart I of the test, there will be two practice questions to Showyour students the test format followed immediately by the testquestions. Be,sure your students have the necessary materials prior/to the TV presentation. They shoi;ld have a pencil, a piece efscratch paper for doing any compuEations, an answer sheet, arSd-atest bookletAddltional pencil§ and scratch piper shoUld be.accessible to the students.- Do not allow the stilderits to open thetest booklet prior to the TV.presentation, Do not "prime" thestudents in any way through your knoweldge of the test questionsas this will negate the test results, To help you regulate thetime and reduce the chance of a period of inactivity pribr.to theTV presentation, you can have students.fill in the necessary studentidentification information On the answer sheet until the presen-tation begins; and complete the information after thepresentation.
TV Presentation
Information regarding the time of the TV presentation ef theTelevision Tc,st of Science Pror:c,;ses will'be given to you by your
r.
148
- 137
schoo), district.> The TV presentation will consist nf two-1111minute programs gVen oneweek,apart. Part.I will include twopractice questions and*estions assessing the processes ofclassifying, observing, comparing, and quantiTying. Part IIwill not rePeat any of the practice:questions or directions,hut will: include question's assessing tha processes of measuring,inferring, experimentimrand predicting: Thelprograts willpresent all the information neeepsary for the questions, includingthe Visual presentation as well.as the audio presentation of the,narration given in the test booklet.
;
--Test Booklet
Inform students that they should not write in the testbooklets. The test booklets contain the test questions and answerchoices that.are contained in the narration of the TV presentation..While there,is no .Visual information on which to base answers, it '
is imperative that the students should not review any of the'testquestions prior to the formal presentation: This additional "cue"factor could invalidate thd test results by introducing a reactiveeffect of interaetion effect,
Answer Sheet
The answer sheet that is suppAed is a machine-snored type.Instruct the students in the correct way to mark answers. Thefollowing diagram shows the cOrrect way to fill out the name block.Answer Spaces 13, 14, 19 and 20 are done incorrectly as an exampleof common mistakes aften,encounterea with those not instructed inthe use of this type.of answer sheet.
Be Sure to tell.your students to choose only one answer foreach question and to:fill in the answer space with dark marks.If a student should change an answer, remind him to,erase his firstmark completely. If he breaks.a pencil he is to hoid up his handand the teacher will givle him a new one immediately.
.
,
Therewill be h single answer sheet for the two TV programs.Be sure to use-a student identification number.to identify thestudents. Collect the answer sheets and test booklets after eachpresentation and store in a safe place until they are requested. .
r
149
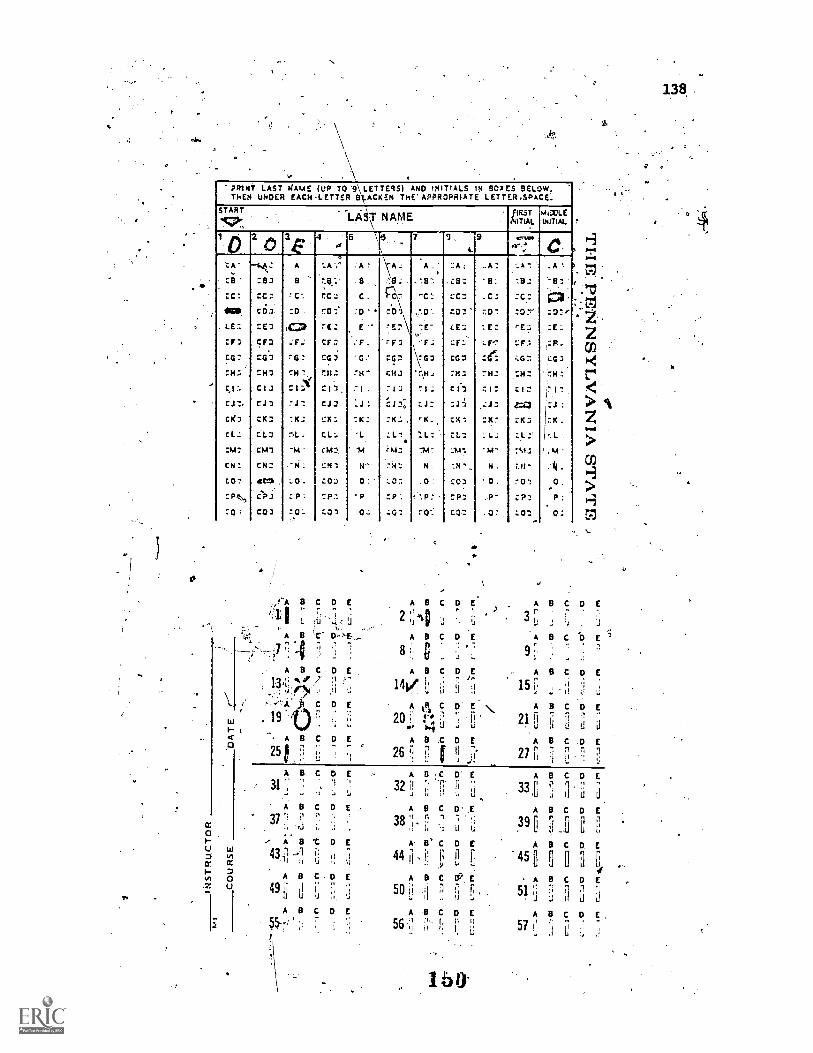
PRINT LAST NAME (UR TO 9\ LETTERS) AND Tt ALS IN SOKES BELOW.THEN UNDER EACH -LETTER BLACKEN THE' APPROPRIATE LETTER .SRACE.
START.LAIT NAME
138
11115T ASLEITaTIAL tjITIM. r
2
Ca
C a,
. LE: 'CC:
CF: LF3
CG: CG.3
:Hz CH:
CI: C 1 J
C.I1
LK: CK.:
CL3
ct-47
CH: CH:
c0 eels
cc
CG
C11::
C17
cJ 3
:
cM7.
.:N
cOD
CP:1
c0
rABCDE14. 1 L
!
.7?-1 A ''C;.
A B C DE- 134 ".
!I
.4,1)4" ,i1
. C D
. 19 .1)
251.
ABCDE31
-t ,. .1
ABCDE37 "
..... A B C D E
4311 !.1 Iicc7
A B C.Do0
49
ABCDE
13 .
\. A : A
rE7
:F. rF:
cH" cHa
:1 . 71 --
11 I C I 2:
:K: :Ka .
L. :Lc.
1.1 i NA:
7 :4::
0 : :. 0 7:
P c P :
0 4 ZQ '2
A .
-C:
c Cr.
10,31:0 pior 4
4 . . ,.. ' Nri0.0
::A ..A : '.. A .7 ' -A t ) 0.4
'CB: 8: ,.9.: -BT. .:',...c
r..-CC. . C: :C..: IC2 :17 -. :Dr. c0.:' :2.
CED .E: ,:.Ea :E:.
cra' .F-C ::Fa 1:P.. chCG3
:Hz CH: CH: CH: toci, ,.., !,,,,
.37, .--1: r...-..1 :.1 .. ALK: :1(7
.1 .
CL: : L.: CL :'. .L . >OA -. IA - ..1.4 a
:N7 N . ;.,1 - Al - ,,C)
03 0 . r 0 7: .0 . >CP: P : ,..3
0.,., .0: ;,.0, 0 :-
,A B C D E. ABCDEr 7
2 g,..; J
r 3 ;:,.2
ABCDE A 8 c 1..) c, ri
8 .. 0., 7
li :. 9 ....,
AA BCD( BCDE114 V il i .j lir '71 15 F.; li
.,
D ABCDE..
E N20 kii I!
i' 4 . !: r;21;jj u u 11 il
A 8 .0 D E ABCDE26 ;.] P. 1 II ji- 7, ,27 ii 1 u , 1
A D .0 0 E ABCDEr:I
33 ,E i; II u ti.132 ..,i! !I !! .. ...
A B C D .E A B C D E
38 '1,' ii '1139 [i ...5 LI ''.
1,
A B C D E ABCDE44 11- II P 45 E ii II 11 il
A B C 19 E AB ifCDE'50 ii 1 ! i n 51l 1.1 LI
A B C D E IjA' B :GI D E ,
5C! iT. 1: " "i; U57 i'
160.
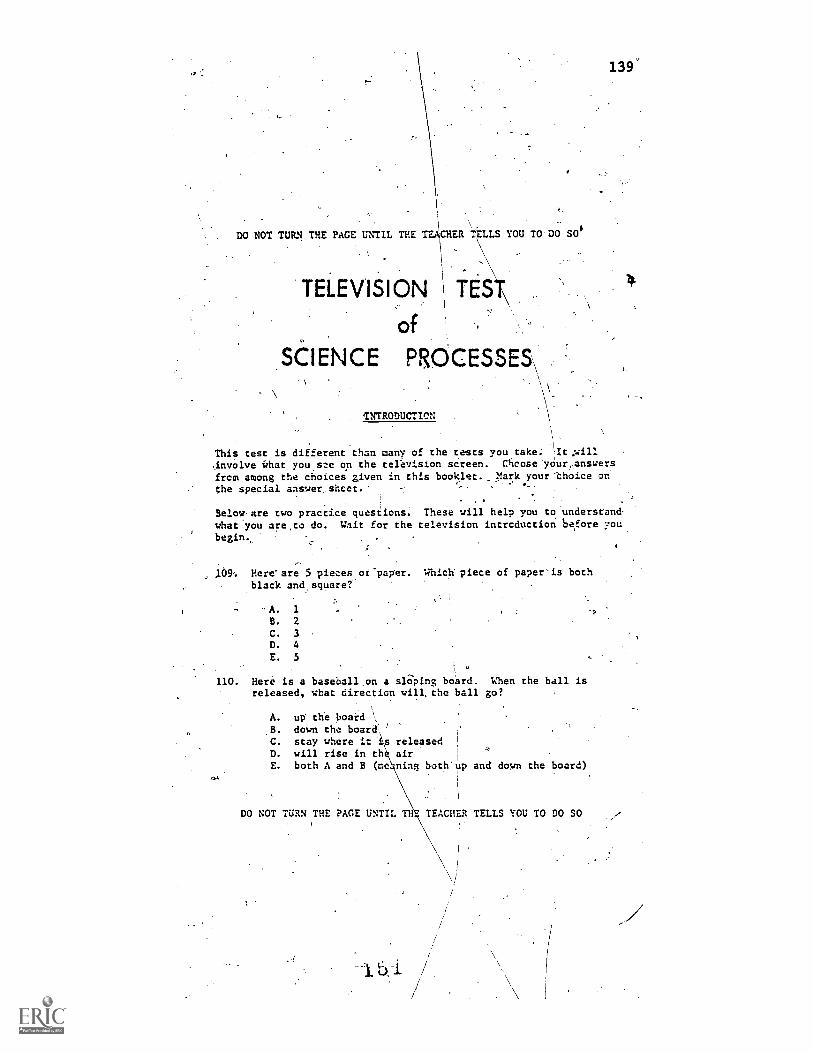
\
\
DO NOT TURN THE PACE UNTIL THE.TETHER T'ELLS YOU TO.D0 S06
. . .
. . . .
TELEVISION TEST\
ofSelENCE PROCESSES\
\
. INTRODUCTION
139"
1This test is different than many of the tests you take: ,It.will
4nvolve What you.see on the television screen. Choose 'youranswers
from among the choices given in this booklet. ,A.ark your 'thoice n
;he special answer.sheet.
Below-are two practice questions. These will help you to 'unZerstand-
what you are,to do. Wait for the television introduction before you
209. Hereare 5 pieces or-paper. Which piece of paper'is bothblack and square?
A. 1
B. 2
C. 3
D. 4
E. 5
\
110. Here,is a baseball:on a sliiping board. When the ball isreleased, chat direction will the ball go?
A. ug the hoard \S. down the board.'C. stay where it: s releasedD. will rise in thk airE. both A and B (me ning hoth'Ilp and down the board).
. 1
-
DO NOT TURN THE PACE UNTIL TH TEACHER TELLS YOU TO DO SO1
I
p
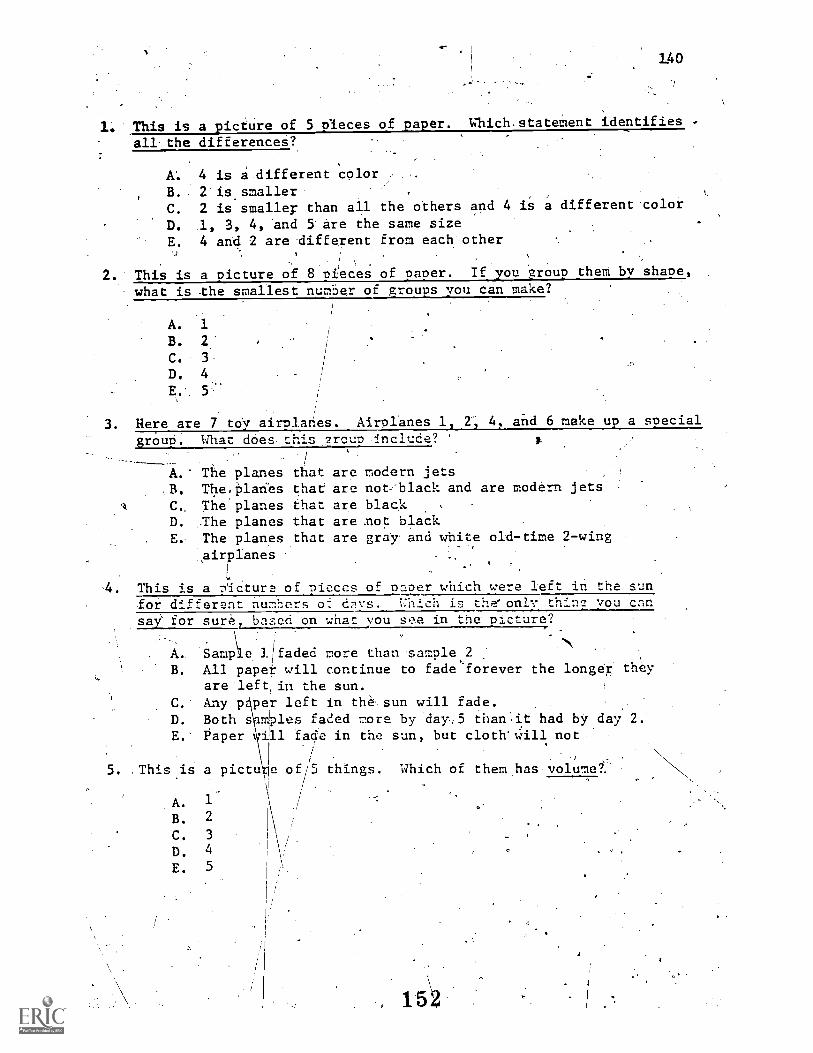
140
1: This is a picture of 5 pleces of paper. Which.statement identifies
allthe differenceS?
A. 4 is a.different colorB. 2-is.sma11erC. 2 is smalleT than ail the others and 4 is a different color
D. 1, 3, 4, and 5. Are the same size
E. 4 ahd 2 are diffetent from each other.
I .
2. This is a Picture of 8 pieces of paper. If you group them by shape,
what is the smallest number of groups you tan make?
A. 1
B. 2:
C. 3,
D. 4
E. 5
3. Here are 7 toy airplahes. Airplanes lj 2-; 4, and 6 make up a special
group. What does. this .zrcup inclt:Ce?
/A.- Tbe planes that are modern jets
B. Tbe,Planes that are not/black and are modern jets
C., The'planes that are blacic.D. iThe plahes that are slot blackE. The planes that are gray and white old-time 2-wing
airplanes .
L
-4. This is a paCture of nieces of Paper which were left in the sunfor different ilt1ors otdpvs. Which is the, only thin2 You chnsai for sure, based on what you see in the- picture?
\ :
A. Sampie I faded more than sample,2B. All pape will continue to fade'forever the longer they
are left in the sun.C. Any p per left in the, sun will fade.
D. Both s mples faded more by day,5 thanit had by day 2.E. Paper .iill fade in the sun, but cloth' Will not
5. This.is a pictu
A. 1
B. 2
C. 3
D. 4
E. 5
- of lc things. Which of them.has volume?:
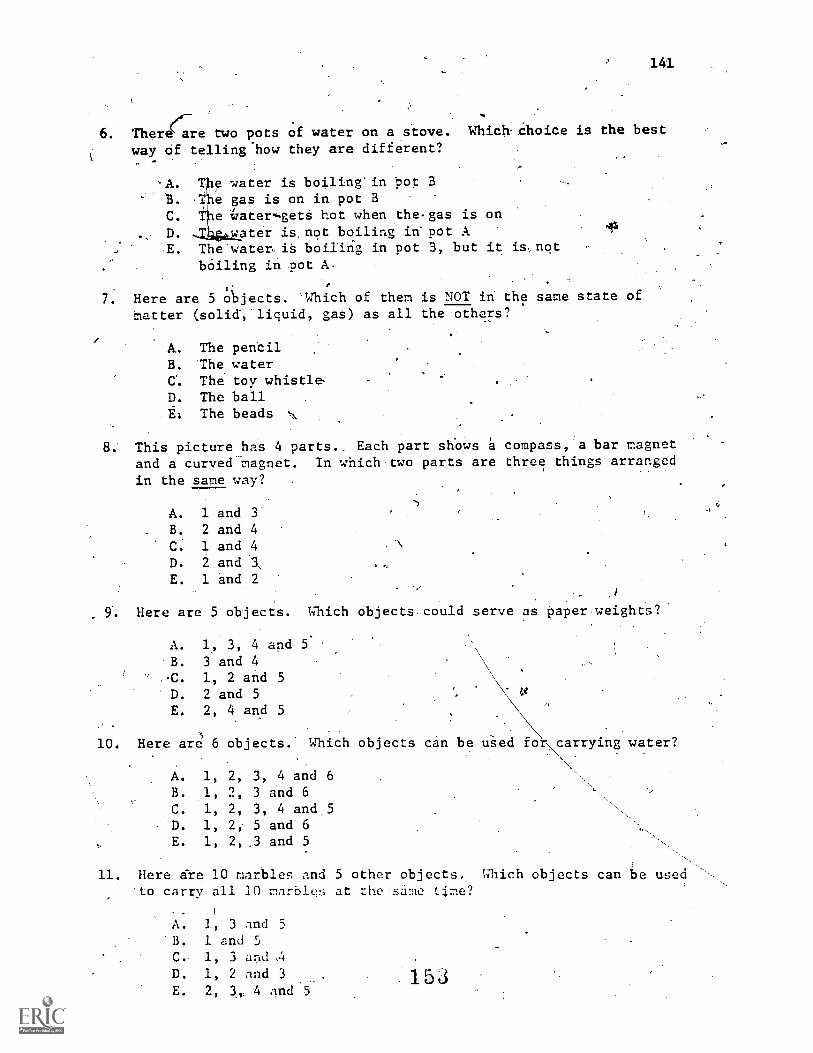
I.
141
6. Therece'two pots of water on a siove. Which- choice is the best
way Of telling-how they are different?
'A. Tbe water is boiling'in 'pot BB. the gas is on in pot BC. The Crater--getS hot when the.gas is on
... D. ..iLgt4pter is.not boiling tn. pot A 176
, .E. The'water, iS boillhg in pot B, but it is,not
. boiling in pot A-. . .
..
7. Here are 5 Ajects. 'Which of them is NOT in- the same state ofMatter (solid,.liquid, gas) as all the 'others?
A. The pencilB. The waterC. The toy whistleD. The ballEl The beads
8; This picture has 4 parts.. Each part shows a compass, a bar magnetand a curved-magnet. In which.two parts are three things arranged
in the same way? ,
A. 1 and 3B. 2 and 4C. 1 and 4D. 2 and '3,
E. 1 and 2
. \
9. Here are 5 objects. Which objects.could serve as paper.weights?
A. 1., 3, 4 and 5'
B. 3 and 4..C. 1, 2 and 5D. 2 and 5E, 2, 4 and 5
10. Here are 6 objects. Which objects can be lthed for\carrying water?
A. 1, 2, 3, 4 and 6B. 1, 2, 3 and 6C. 1, 2, 3, 4 and.5D. 1, 2, 5 and 6E. 1, 2, ,3 and 5
11. Here Sre 10 marbles and 5 other objects. Which objects canto carry all 10 marbles at the same time?
A. 1, 3 and 5'B. 1 and 5C. 1, 3 and A
D. 1, 2 nnd 3E. 2, 3, 4 4nd 5
5 3
e used
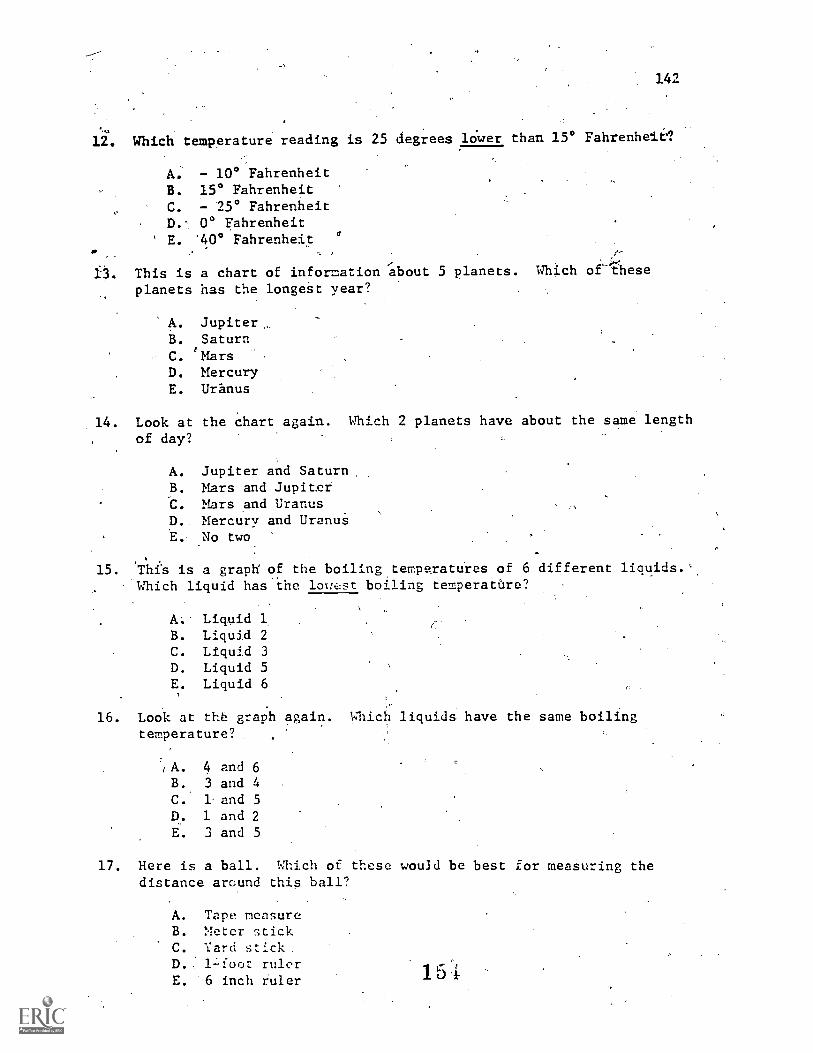
142
12. Which temperature reading is 25 degrees lower than 15° Fahrenheit1
A. - 10° FahrenheitB. 15° FahrenheitC. - 25° FahrenheitD. 0° FahrenheitE. "40° Fahrenheit
/-
i3. This is a chart of information 'about 5 planets. Which of-heseplanets has the longest year?
A. Jupiter,B. SaturnC. 'MarsD. MercuryE. Uranus
14. Look at the chart again. Which 2 planets have about the same length
of day?
A. Jupiter and Saturn.B. Mars and JupiterC. Mars and UranusD. Mercury and UranuSE. _No two
15. ThCs is a graph of the boiling.temperatdres of 6 different liquids.'Which liquid has the lowst boiling temperat6re?
A. Liquid 1B. Liquid 2C. Liquid 3D. Liquid 5E. Liquid 6
16. Look at the graph again. Which liquids have the same boilingtemperature?
A. 4 and 6B. 3 and 4C. 1 and 5D. 1 and 2E. 3 and 5
17. Here is a ball. Which of these would be best for measuring thedistance around this ball?
A. Tape measureB. Meter stickC. Yard stick..
D. 1=foot rulerE. 6 inch ruler
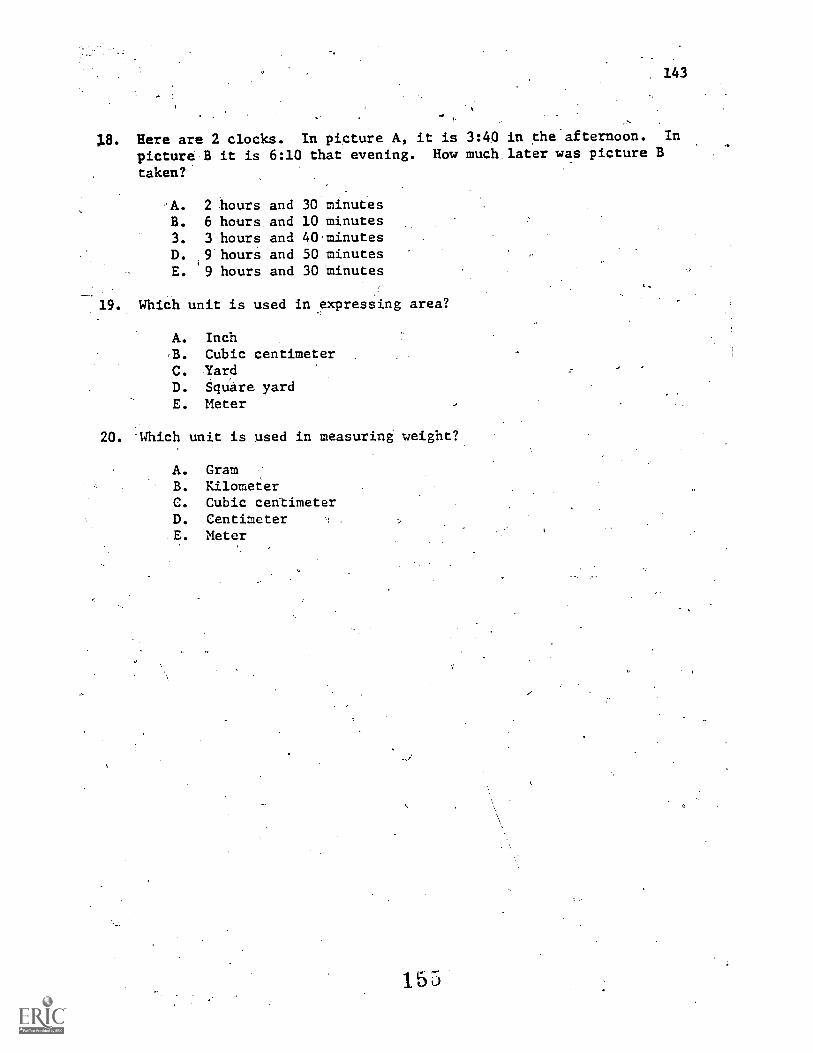
143
18. Here are 2 clocks. In picture A, it is 3:40 in the afternoon. In
picture B it is 6:10 that evening. How much.later was picture B
taken?
A.
B.
3.
D.
E.
2 hours and 30 minutes6 hours and 10 minutes3 hours and 40.minutes9 hours and 50 minutes9 hours and 30 minutes
1 . Which unit is used in expressing area?
A. InchB. Cubic centimeterC. YardD. Square yardE. Meter
20. Which unit is used in measuring weight?
A. GramB. KilometerC. Cubic centimeterD. CentimeterE. Meter
155
DO NOT TURN THE PAGE UNTIL THE TEACHER TELLS YOU TO DO SO.
/
TELEVISION TEST
ofSCIENCE PROCESSES
'Part n
DO NOT TURN THE,PACE UNTIL THE:TEACHER TELLS YOU TO-DO SO
156
144
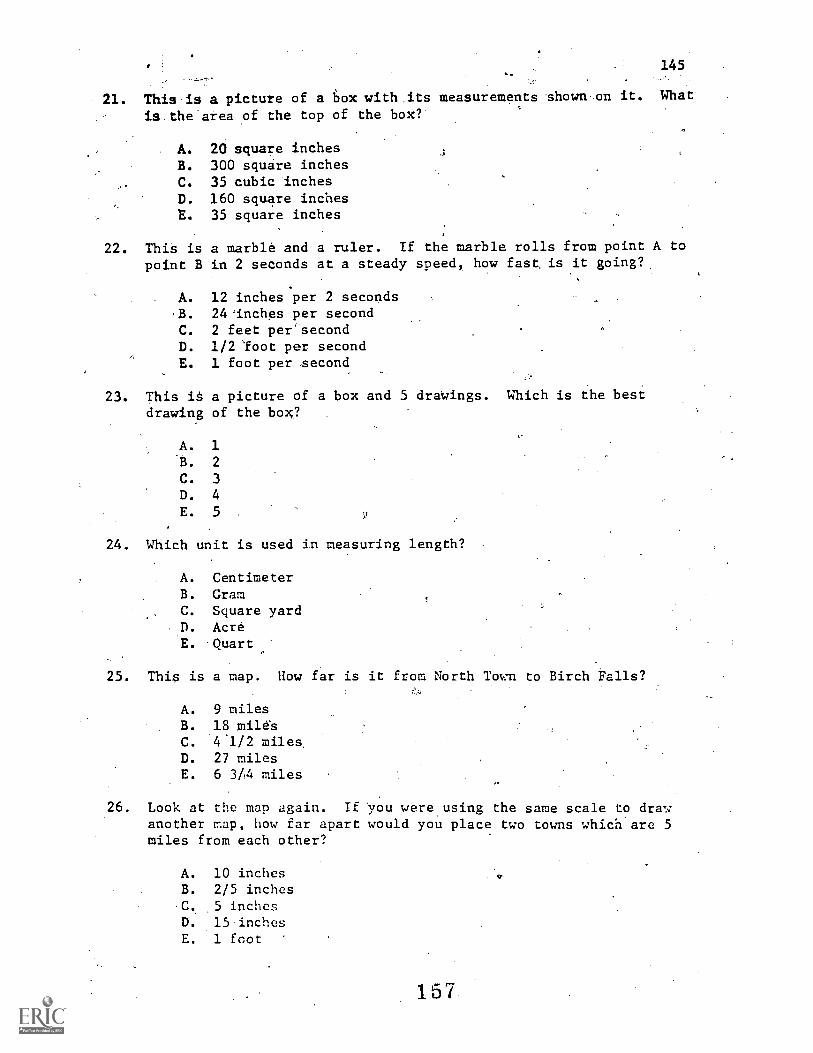
21. This is a picture of a box with.its measurements shown on it. What
is the area of the top of the box?
A. 20 square inchesB. 300 square inchesC. 35 cubic inchesD. 160 square inchesE. 35 square inches
22. ThiS is a marble and a ruler. If the marble rolls from point A topoint B in 2 seconds at a steady speed, how fast, is it going?
A. 12 inches per 2 secondsB. 24 'inches per second
C. 2 feet pet-1'second
D. 1/2 'foot per secondE. 1 foot per .second
23. This iS a picture of a box and 5 drataings. Which is the bestdrawing of the box?
A. 1
B. 2
C. 3
D. 4
E. 5
24. Which unit is used in measuring length?
A. CentimeterB. GramC. Square yardD. AcreE. Quart
25. This is a map. How far is it from North Town to Birch Falls?
A. 9 milesB. 18 mileSC. 41/2 miles.D. 27 milesE. 6 3/4 miles
26. Look at the map again. If You were.using the same scale to drawanother map, how far apart would you place two towns which.are 5miles from each other?
A. 10 inchesB. 2/5 inchesC. ,5 inchesD. 15 inchesE. 1 foot
157
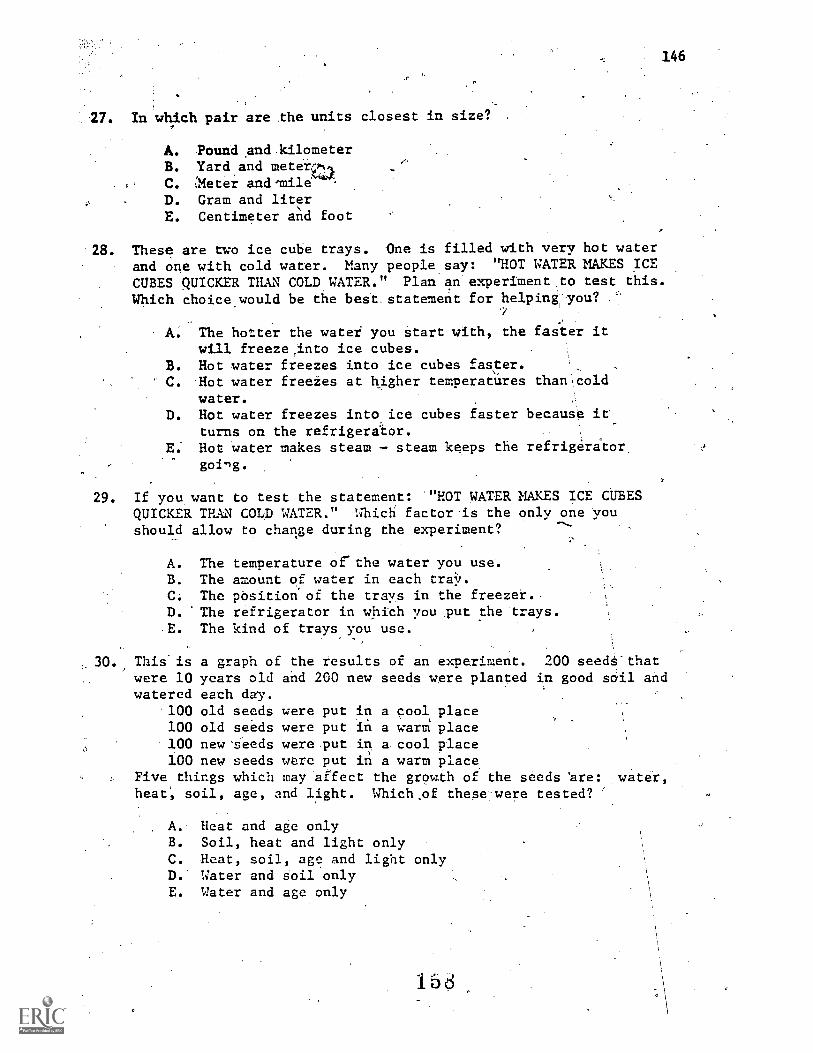
27. In which pair are the units closest in size? .
A. Poulid and .kilometer
B. Yard,and meter,1.%
C. Neter andquildD. Gram and liter
E. Centimeter and foot
s
146
28. These are two ice cube trays. One is filled with very hot water
and one with cold water. Many people say: "HOT WATER MAKES ICE
CUBES QUICKER THAN COLD WATER." Plan an experiment to test this.Which choice would be the best statement for helping you?
1
A. The hotter the water you start with, the faster itwill freeze,into ice cubes.
B. Hot water freezes into ice cubes faster.C. Hot water freeies at higher temperatUres than,cold
water.D. Hot water freezes into ice cubes faster because it
turns on the refrigerator.,
E. Hot water makes steam - steam keeps the refrigerator,going.
29. If you want to test the statement: "HOT WATER MAKES ICE CUBESQUICKER THAN COLD WATER." Which factor is the only one youshould allow to change during the experiment.
9
A. The temperature of'the water you use.B. The amount of water in each traY.C. The pbsition of the trays in the freezer.D. 'The refrigerator in which you put the trays.
-E. The kind of trays you use.
30. This-is a graph of the results of an experiment. 200 seedS-thatwere 10 years old and 200 new seeds were planted in good soil andwatered each day.
.100 old100 old100 new100 new
Five thingsheat; soil,
seeds were put in a cool, placeseeds were put in a warm place'seeds were put in a cool placeseeds were put in a warm placewhich may alfect the growth of the seeds 'are: water,age, and light. Which,of these were tested?
A. Heat and age onlyB. Soil, heat and light onlyC. Heat, soil, age and light onlyD. Water and soil onlyE. Water and age only
15d
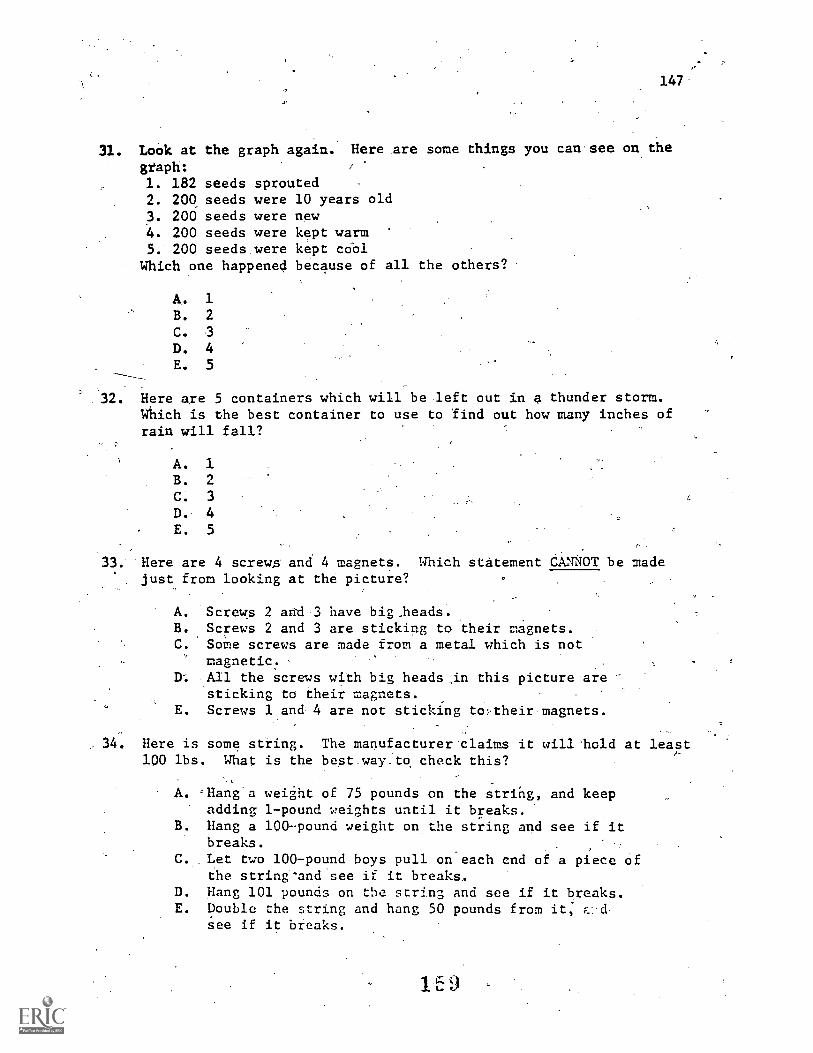
C.
147-
31. Look at the graph again. Here are some things you can.see on the
graph:1. 182 seeds sprouted2. 200 seeds were 10 years old3. 200 seeds were new4. 200 seeds were kept warm5. 200 seeds,were kept co-01Which one happened because of all the others?
A. 1
B. 2
C. 3
D. 4
E. 5
3 . Here are 5 containers which will be left out in a thunder storm.Which is the best container to use to find out how many inches ofrain will fall?
A. 1B. 2
C. 3
D. 4
E. 5
33. Here are 4 screws and 4 magnets. Which statement CANNOT be madejust from looking at the picture?
A. Screws 2 and 3 have big.heads.B. Screws 2 and 3 are sticking to their magnets.C. Some screws are made from a metal which is not
magnetic.D; 16a1 the screws with big heads,in this picture are
sticking to their magnets.E. Screws 1 and. 4 are not sticking totheir magnets.
, 34. Here is some string. The manufacturer claims it will hold at least100 lbs. What is the best way_to. check this?
A. 'Hang a wei2iht of 75 pounds on the string, and keepadding 1-pound weights until it breaks.
B. Hang a 100-pound weight onthe string and see if itbreaks.
C. Let two 100-pound boys pull on each cnd of a piece ofthe string-andsee if it breaks.
D. Hang 101 pounds on the string and see if it breaks.E. Double the string and hang 50 pounds from it,'
see if it breaks.
1 E 9
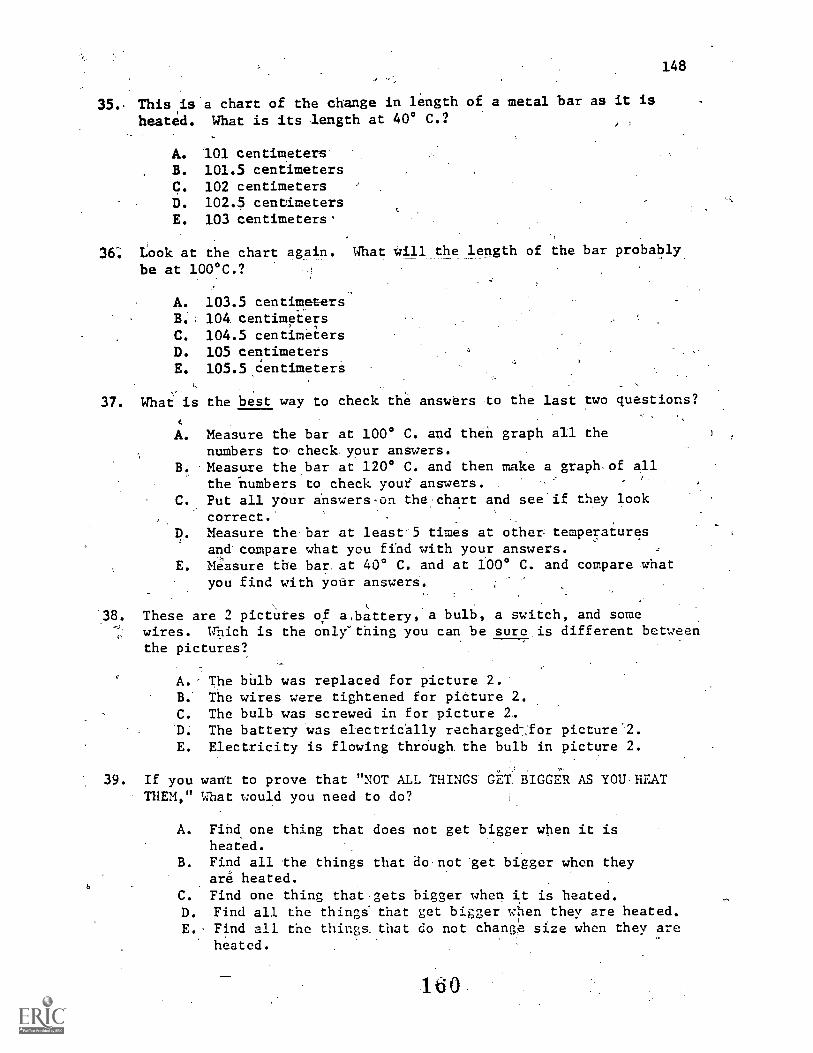
148
35.. Thistis a chart of the change in length of a metal bar as it is
heated. What is its length at 40° C.?-
A. 101 centimetersB. 101.5 centimetersC. 102 centimetersD. 102.5 centimetersE. 103 centimeters-
36: Look at the chart again. What will the length of the bar probably
be at 100°C.?
A. 103.5 centimetersB. 104 centimetersC. 104.5 centimetersD. 105 centimeters A
E. 105.5,Centimeters_
37. Whatis the best way to check the answtrs to the last two questions?
38.
A
A. Measure the bar at 100° C. and then graph all thenumbers to check your answers.
B. Measure the bar at 120° C. and then make a graph,of allthe-numbers to check youe answers.
C. Put all your answers-on the chart and see if they lookcorrect.
D. Measure the bar at least'5 times at other temperaturesand compare what you find with your answers.
E. Measure the bar. at 40° C. and at 100° C. and compare whatyou find with your answers.
These are 2 pictutes of a,battery, a bulb, a switch, and somewires. Which is the only"thing you can be sure is different betweenthe pictures?
A. The billb was replaced for picture 2.B. The wires were tightened for pidture 2.C. The bulb was screwed in for picture 2,'D. The battery was electrictlly recharged-jor picture'2.E. Electricity is flowing thrOugh the bulb in picture 2.
,
39. If you want to prove that "NOT ALL THINGS GET, BIGGER AS YOU.HEATTHEM," What would you need to do?
A. Find one thing that does not get bigger when it isheated.
B. Find all the things that do-not 'get bigger when theyare heated.
C. Find one thing that.gets bigger when it is heated.D. Find all the thing& that get bigger when they are heated.E. Find all the thing& that do not change size when they are
heated.
160
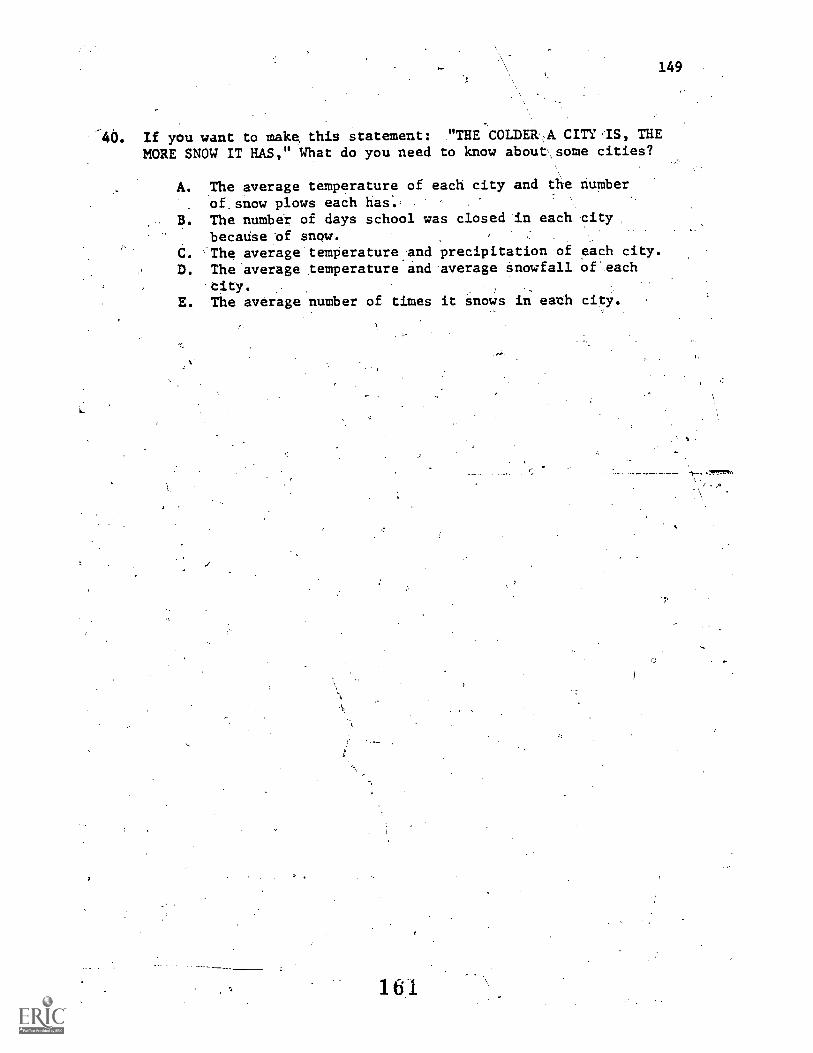
149
If you want to make this statement: "THE COLDEkA CITY-IS, THEMORE SNOW IT HAS," What do you need to know about,some cities?
\.
A. The average temperature of each city and the number
ofsnow plows each has:.B. The number of days school was closed 'in each city,
becaUse of snqw.C. 'The average'temperature:and precipitation of each city.
D. The"average ,temperature and.average Snowfall of'each
-City. ;
E. The average number of times it Snows in eath city.
161
\
J
,
APPENDIX J
COMPUTER PRINTOUT OF I1EM ANALYSISOF'PILOT 1EST
162
150
c
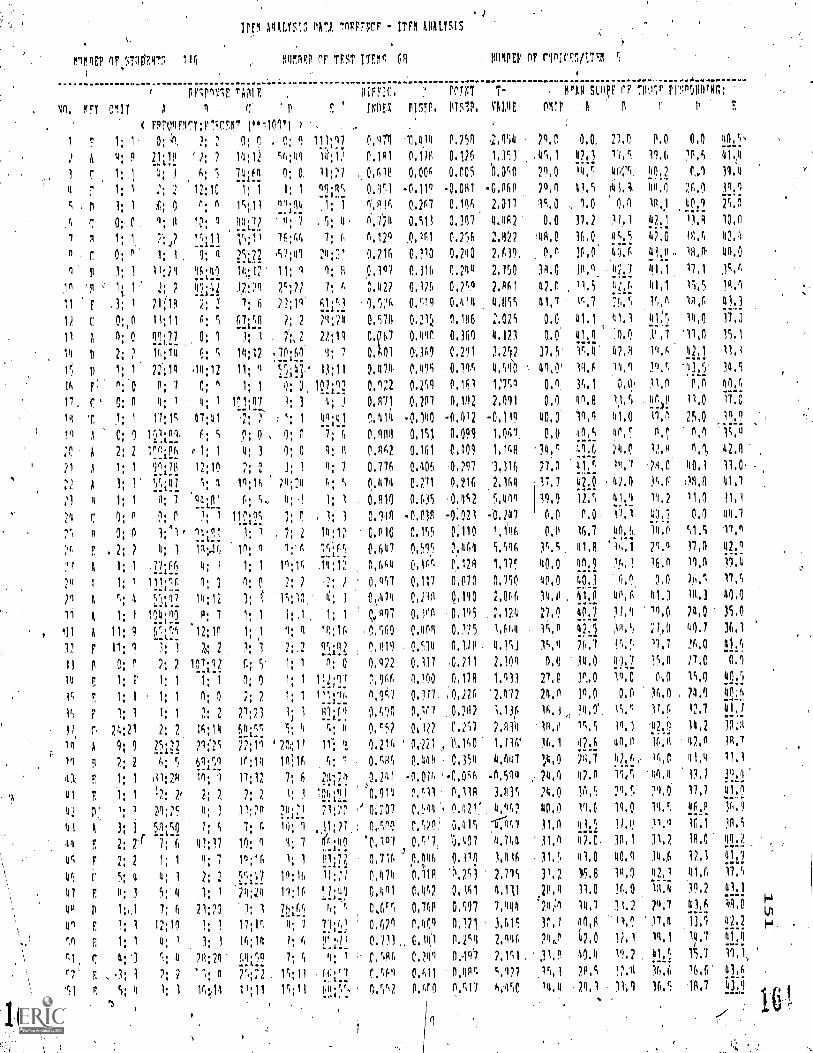
11.919E? 1F ST44TI 116
'
111FM AWYSTI tATA Tol:FFNcF. - ITFM 111411S1S
m9m1FP or TFST 1TEmS 60 oF rloIrFS/11Fm 5
( FFIP191F, TAME ,, ['MT T- . mrAN stopr (IF T0,,v1r Frno1:419(1:
40, 1M OMIC A 1 C 140g Pu,71,.. 111sEP. VAIN 04IF p r p
( F4N4F1(1:F14(1:9, (44,101/) )
F 1; 1. 0; 2 0; . C; 1 111.07 0,171 1,4,14 0.2v1
A 4;9 21114 14;12 56;49 lii%,12 M41 0.M 0.126.
3 1: 1 4: 3 4: ') 74.;1.4 0; 0, 11:27 0,611! 0,004 0,005
4 1: 1, 2; 2 12:1C 1: 1 1: 1 41'4c 0.051 -0,119 -0,001
0 3: I ...11; 0 11: 0 1511 92011 ,1: 1 1.416 1.267 0.196
.6 C 0; 0 1: 8 10: A 114.72 A: 7 , 5: 4 0.1'24 0.511 0,191
n 1;1 2;42 1c.11 V,;11 16:44 1; 0,124 0,1111 0.256
n.C 0: n 1: 1 9: R 2512.2 .C7:41 24;:11 0,716 0,310 0.240
p 1: 1 11:q 1).A..,110 11:4 12 11; 1; B 0,11 0.311; 0.249
1;, 1. 2; 2 4'1.41 12;29 2;172 1; 1. 0,422 0,116 0.2c9
11 F ,3; 1 2109 2; 2 7: 6 2219 61.53 0.52s 0.519 0.4111
12 C 0:,1 11:11 4: C (22,,?1 2; 2 29:71 0.579 0.21'4 0.146
A 9; 0 n2;11 0; 1 3; 1 7.'; 2 0.67 0.440 0.360
14. 2; 16:14
22:11
6: 5 14:12 9; 7 0..11 0...10 0.231
p 1' 22;14 ,14;11 11; 1 '1];';!/ 13;11 %CR 0.411 0,195
16 F ; 0 4; 7 0; 1 1; 1 q; 0 101122 0,122 0.254 0.161
17, 0; P 4; 1 4; 1 101.11 1. 3 14; .3 0.911 0,217 0.1,92
1; .1
C; 1
11:14
121121.
47:41
6: 5
2: 2 e 1; 1
1: 1 14.114 12:10
3: 3' ;: 4
1: 1 A: 7 9110,1
0; 9 0; C
0: 0 3:1, q9101
2; 2 4: )
1: 1 ,rlit6 4; I
1: 1: 111i1 r 1; 1
ro, 4 52117 VI; 12
1: I 12!1.;20 P: 7
11: 9 f2:1.c2:1. 12;10
11: 1 1; 1 2
0: 0 2: 2 107:,27
1: f 1 1: 1
1: 1 1: 1 1: 1
1; 1; 11. 1
.
24:21 2; 2, 16:14
9; 0 2502 21.:2c
2: 2 ,r, 6919
1; 1 131:21 10; 1
1: 1 !2; 2, 2; 7
1: 1 2'8;25 4: )
3; 21,.;12 r; 6
2: 21 7:6 41;17
2; 2 1: 1 9: 7
5:4 4:1 2;2
0: 3 5:' 4 1: 1
1'0:1 7; 6 21;21
1: 1 12;19 1; 1
1: 1 4: 1 1: 1
4: 1 r. 4 70:24
.1: I 2: 2 '1: 4
5; 4 1; 1 1604
.2: 2 : 1: 1 49.41 0.414 .0.940 4,012
0 0: 0 , 7; 6 0.909 0.151 0,099
1.154
1,151
b,pro
-0,969
2.1313
4.447
2,472
2.639,
2,150
2,061
4d655
2.025
4,121
3.2V
1:159
2.111
-0.1191.041
4: 3 0; 0 9: 0 0,462 0.161 0,109 1,169
2; 2 3; 1 4; 7 1.716 0.405 .0.297 3,116
14;16 24;24 Fl; 5 0.414 0.211 0,716 2.164
5,' 4: I 1: 1 0,110 P. ,0,452 5,494
111;25 7; 0 1; 1 0,140 -1,01P -0.021 -1247
1: 1 , 2; 2 14:12 0,410 0,155 0110 1,14
10; 4 1:-4 0,4o7 C.'5.546
1; 1 19;16 .14;12 0,664 c.16.5 1.120 1,17r,
1: 0 2: 2 2: 2 0.957 0.117 0.070 0.750
3; Q.190 2,01.6
1; 1 1; .1 1; 1 Q,9q7 0,..10 0,116 2.124
1; ,1 q: 19;16 ,0,,560 0,409 0.375 1,664
1; 1 2:.2 !0.414 0,614 .(MJH 4.153
6; 5' 1: 1 n: 0 0.922 0.111 0,711 2,109
1: 9 1; 1 112;21 1%466 0.100 0.170 1,911
2: 2 1: 1 9,90 0,111. i0,226 '2.412
1;23 1; 1 41'01 0,1140 P,,107 :MU 1,13,62
612ff 5; f'; 0,552. °,257 2,9111
22;11 '2%1? 1r; 0, 0.216 ' 0,221 , '101.:13101 111.,1176"
10;14 1416 6: .5 0,46 0.40 ;
2: 2 1: 1 101,121 ''Po:29411A
1:°1c16p 3.11c
17;12. 7; 6 2;1;211. .0,590
11:24 :TI:1 71:70 0'.207 0.421'. 4.462
7: 6 10: 1 : 0,0 (I)* 0.415 1CTIA/
10: 1 4: 7 6.40 '0.1°7 0.C17, 0.407 4,764
1,9;16 1: 1 1.1.79 1,716 ',0,446 0.)113 3046
5r.:141 11:11; 11::: M74 0:101 2.715
24:24 11:16. 11'41 0,491 ox2 0,161 4,111
1: 1 7tly, 6: 5 0,65 0,1611 0,497 7,499
17;1r, 4; 1 0,074 1.4(!;1 0.121 3,615
16;14 1; 6 0.111 , 0.141 0.250 2,146
6;j0 7; 6 41 1 c,546 0.249 0..91 2,141
?":7.2 15;11 (6,r7 f.ram 0.611
11;11 15:11 110:17,. ' 11,611 0,617
I
29.0 0.0, 27..0 0.0 0,0 40,c,
.45.1 42.1 11.5. 11,6 14,6 41.,4
20.0 0.,1 31.4
20,0 41.5 :41.4, 311,0 ;',6.9 311. 9
16.0 19.1!42:2
ro0.0 37.2 -11,1 117:1 11.4 10.0
,44,0 16.0 lic.S 1,2.0 38.6 117.4
0,0 36,1. 41,4 43 01 110 1134,0
34,0 0,11. ,112,1 111, 1 17,1_-47.0 11.5 42,6 41,1 15,5 11,1
41,1 1c.7 75.' 15 141.1; 1..43A
0.0 41.1 41,1 41', 14,1 17.0
. 4.10 :1.0 A' ,7 '11,0 15,1
31,5 15.4: 92,4 19,6 11,1
41,0' 11,4 :HO 31,5 '43 5. 34.5
0,1, 14.1 11,1 0.1 4016
0,1 49.9 1,1.5 40 1 11,0 17.0
40,0 11,1 41,0 11,0 25,0 .,10.0
0,0 40..5 40,r.- 0.0 0,1
34.6 4916 24.0 1.1,4 0.4., 42.0
11.11' 11,1 .21,0 40.1 134,
17,7 42 0 )4,6' 013,f1 41,7
19,0 11,5 41,4 111,2 11,1 11,1
(1,0 (!,0. 11,1 012. 0.1 44,1
0,0 16,7 40,.6, 14.0 51,5 19,1)
94,4 Iil,9 l, 1 29.4 37,3 1.12!?
40,0 41 9 1!.. 1 6,(1 11,9 1).4
40,01,19.!.2
0. 0,0 )6,', 11,6
34 .11 41,.0 40, 6 41, 3 11..3 110.0
27.13 4011 31,q 7q.0 211.0 35.0
3(3,5 7,)) 41,7 16.1
vo Ni iv 17.7 NO I,021
f1.0
27,0211, (1
111, 1
311.0
16,1
, 24,0
24,0
40,11
.11,0
33.2
.26,1*211,:n
30,1
P
.3 1.9
t,427 14,1
6,4150 14,4
14.0 41.1 15,8 17.0 0.1
311.0 1r).0 0,1 15.13 4015
30.0 0.0 16.0 , 24.0 4.(L1,
14.0' 15.c 11,6 11.7 41./
35.5 01, 1 g:12 14.2 11),II
41,4 if,4 42,4 1;1.7
7q,7 42 6, 16,(' 41,4 11.1
42.4 11,r, 110.4 11,1 331,13
10,5 21,5 21.0 17,7 .4171
19,6 11,0 31,r, 11 R 36.1
4 1l5 33.11 11.1 11.1
10,c, 39,1 31,2 19,0 111:2
47,0 40,1 14,6 12.1 41t2
13.5.8 10.0 42,, 111,6 17,5
MO 16,34 11.4 11,2
111,7 3 1.2 29.7 41 6 01,0
poi u,0 31,4 13,1 42t2 .
42.0 11.1 14,1 14:7 41 47
41,4 11.2 41,5 T5.1
79,4 12,71 36,6 16,6 4:1,!FI
211,1 11,1 16.5 113.9.
!
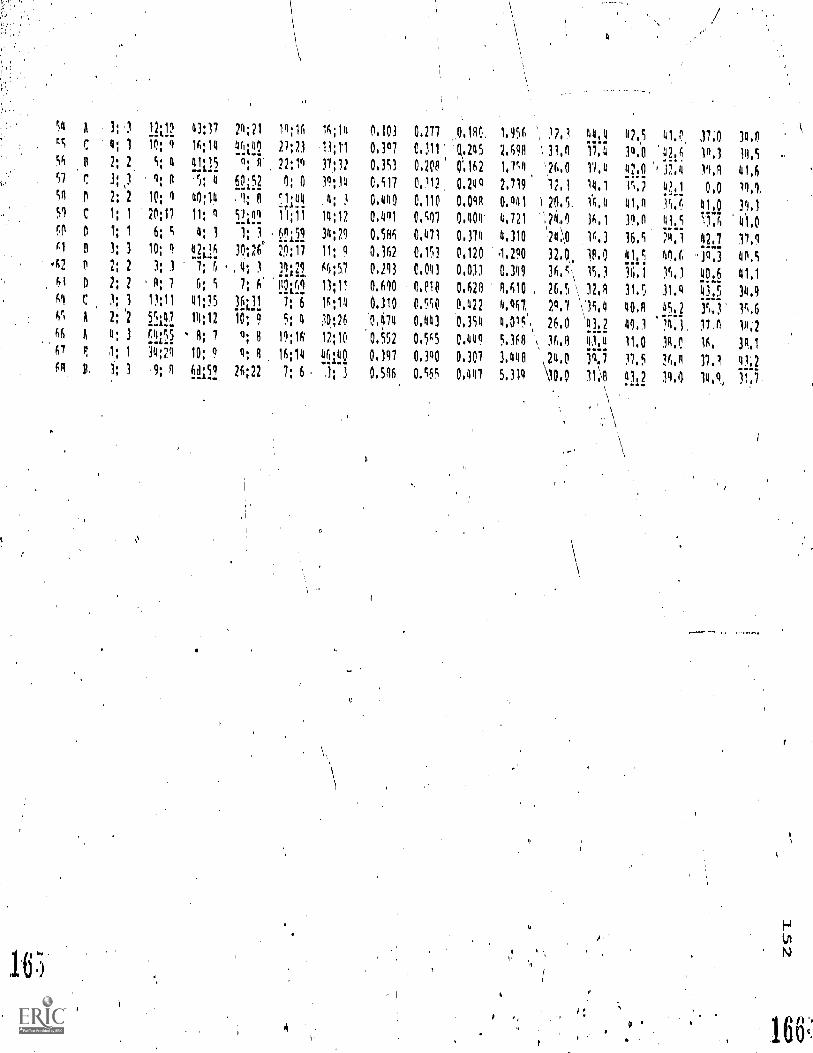
16
54
1..s
56
451
r,0
.c1
42
61
A4
65
66
67
64
A
C
P
D
c
ft
o
p
11
c
A
A
r,
P.
3; .3
41 1
2; 2.
2; 2
1; I
1'; 1
3: 3
,, 2
2; 23; 3
2; '2
II: 3
1; 1
3; 3
12.19...1..;
1., 1
5; 4
9; 8
10; 970;17
6; 5
10; 93; 3
' 0; 713;11
5'31117.
rAz55
34;29
,9; 0
43;31 124;216;14
..46.40.L...
1111,2 17; II'50 .6.9:152
40;34 , 9; It
It; 9 5!it.19
9: 3 1; 3
t.11:11. 30;26
7; 6 .. 4; 3
J;r r'l7; 6'
41;35 36i,11
14;12 10: 9
0; 7 9; 8
10: 1.. 4; 0
tth5.2. 26;22
14;16
21;21
2214
0; 0e,1;44
il;ii612154
20;17
2142,9_
11219.
1; 6
5; 419;16
16;14
7; 6
16;14
.1A;1.1
3732
39;144; 3
14;12
34;29
11; 9
q;5.113;11
1g;113
30;26
12;10
KI(..19
,1; 3
0.103
0.397
0.353
0.5170,410
0.491
0,586
0.362
0.113
0.610
0,310
0.474
0.552
0.191
0.506
0,277
0.311 '
0,200
0.312,0,110
OM0,471
0.153
0,043
0,010
0,540
0,443
0.565
0.390
0.565
0,1110.
0.244
0.162
0.299
0.098
0,404'
0,374
0.120
0,033
0.620
0,422
0,354
0.449
0.301
0,447
1.956
2,490
1,754
2.739
0,081
4,721
4,310
.1.290
0.349
0,410
4,967
4,015'\
5,360
3.440
5,319
'.,, 32,1
'., 31,0
\,26.0
12.1
1 79.5:
'AO)
.21A0
32.0,,
36.5\. 26.5
29,7
26,0
',, 36,9
24.0
10,0
litti11,4
17,4
311.1
l'A,4
36,1
.15.3
10.0
15.3
\,, 12,0
'05,4'131,3
fliti3%1
110
47,5 4U,11,0 'Int6
ti?..q ', 17,11
3C.2 11/I1
41,I1 3",.(!
11,0 4116
16,5 79,1
InIt; 90.t36.1 31,3
31.5 31.'1
403 125,2
40,3 :14,1,
11,0 34,0
31.5 36,n
4h? 3q,4
37;019,1
39,0
0.0
1.11.0
7r,
117.
-.0.3ligA
1.111.f!
35,3"
11.11
36,
37.1
14,4..,
34,0
10,S
111,6
3919..
39.1
41,0
17.1
90.5131,1
34.915.6
14;2
34,1
41.2
71
4
5
'
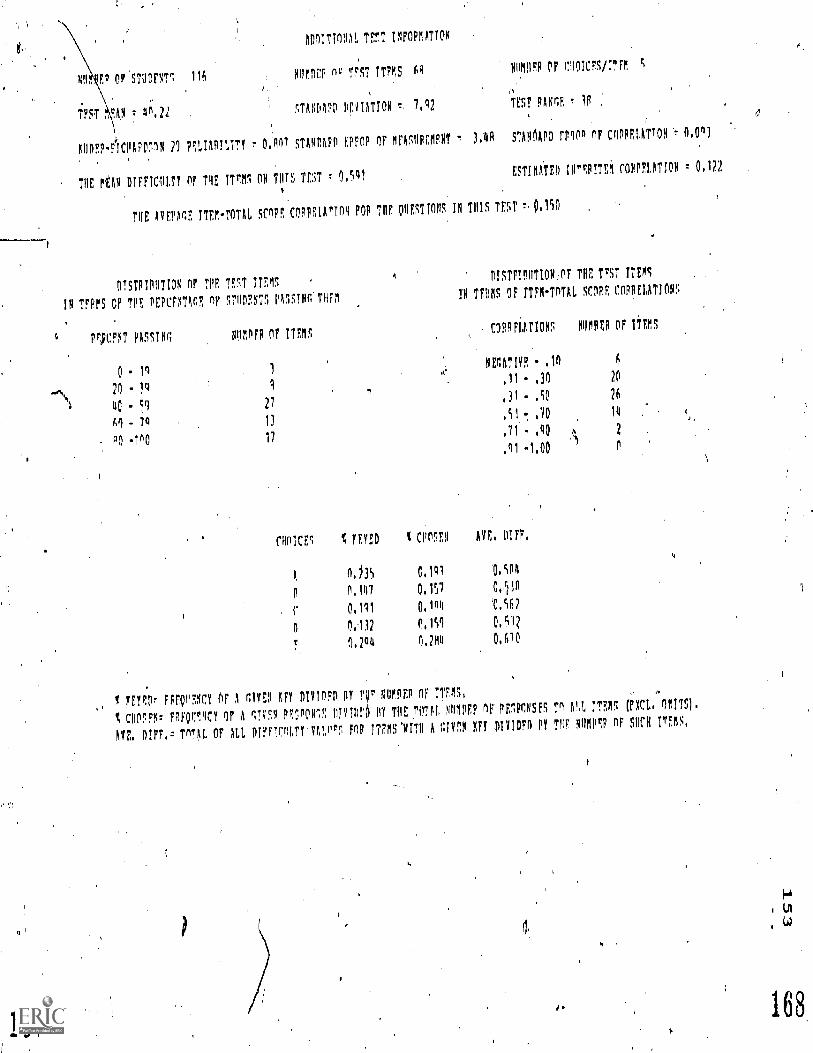
ADDITIONAL TrET INFOPMATION
NH, EP OP.STDDENTI 116WinFP 0, TEST ITEMS 64 NOI,INFP OF CHOICES/ITEM 5
TEST EAN r 40.2/ r,TA041111 PECATION 7.12 iEST PAM , 1P
AUDEPP'ICPAEDS1N 27 PELIARILTTY !0:417 STANDUP MOP OF MFASDPEMENT 3.4D STANOAPD FP001 oF COPPELATTON 0.013
THE PON DIFFICILTT OF THE ON MS TNT 0.511ESTIMATED INT,PITEM cOPPFLATION ! 0.122
THE AVM ITEMTOTAL SCOPE CORPEOTTON FOP THE OPESTIOUS IN THIS TEST
DISTPISUTION of THE TEST ,
IN ?EPPS OF TPE PEPCFNTAcF, fly STODENTS PASSING*THEN
MUST PASsING
0
DISTFIPPTION:PF THE T,ST ITEMS
IN TFPMS OF ITEM-T0TAL SCOPE CORRELATION5
NIIMPEP OF ITEMSC3P9FI,1TIONS
moprip OF 1j1115
11 3NEUTIVE .1n 6
20 - P A;11 - .30 20
m
40 59 27.31 - .50 26
69 - io 13.51 .,, .70 14
PO -110 17.71 -
O 2
.91 ..1.00 0
CPOIOEs YEvED % MIEN AVE. PIM
p. n.).3S C.141 '0.5(14
0 0,147 0.157 C..530
C 0.191 0,194 '0.562
D 0.132 P.1590,9'
r 0.2(19 (1,21111 0.670
FETED! FPFOOENCY OF A MEN KEY DIVIDED Di' TV NIRI0E0 OF TTFMS,A
CUN:FNr FRFPACY OP A 9TVEN PE5PONIE PIVT0t6 07 TOE TOM NON1EP oF PEIMNSES 111.L ITEM5 61(CL. OMITS).
TP7AL OF ALL DVOTATTIAL(tITEWVITD A NIVEN NE! ,DIVIDFD PY THE NIIMPU oF SUCH 117K
I.
/1
168
F124-1EVEL LINKAnE EDTTOI onrONS SPECIFIED LTSTPCNOLT OPTION(%) AlrD = ITZr,(11516,1824q76)
""LoADI Mir!: awr rxinT etr- HPO; vEru,AnDru Tn DATA sFr
155
APPENDIX K
COMPUTER PRINTOUT'OF ITEM At;ALYSIS,TABLE OF EQUIVALENTS, AND FREQUENCYDISTRIBUTION OF THE NORMING SAMPLE,
4d1J
1'040
,IfgdO
114V
- ilt=d0
rodidA1100,silMEIis
1044;1SIglifoli-d:4,14.
mil-61114A,11-4511k44
0$11.6i114,4011-4Lf1444
t!'
" 4417d hlWu 40 ittrbtlq /4)d7M/ El,' 191041
ilL110)1. /01151V11/ 1SJ 1,311.4L
1 340 tilZd'h; tadtg RI 111.1 SO 191. Jti
CAO Ao (go OAALO 'Z1 Ji1:7 4
10;144.
V IA wilailAill
4 01 X411 di ill 3'i.51N tit4 a 1 lft Sdi / 1,1:1 luLtd;
/ Liad dull; :q144,
- L441, 4Y4 JblAl;
.611dW14r4c//
Ow :4i1J //
30 531 3ti ga4 1:4(A0 NU') 44) lartilIN / / 140,4;
lifr4i0t / /
4(11.) 4.) 'AA 0.1:,
/1
Ij
14 ViA0 4M2d01,:'1,)W%'d9lifil U 00,1Wqf
D) 1 U 9L/Mv, ;:s1a4
d UVO L11,1460,: tiii' X6114
d Cad 1,Wid401 19LOY""))1 4V .41'4
d LI ;41(101 4o4
i WA(1 1:41hdOl''''''OKIllie""141 Is
d eXid40 L 1,11/1C'5)L
vicii.0166411.4.4m;i.11:44
r$4:i.41Ww11.4V114#.11-444 4.40i1.114,41:.4r0,441.1.4Ad
3
ILI
4
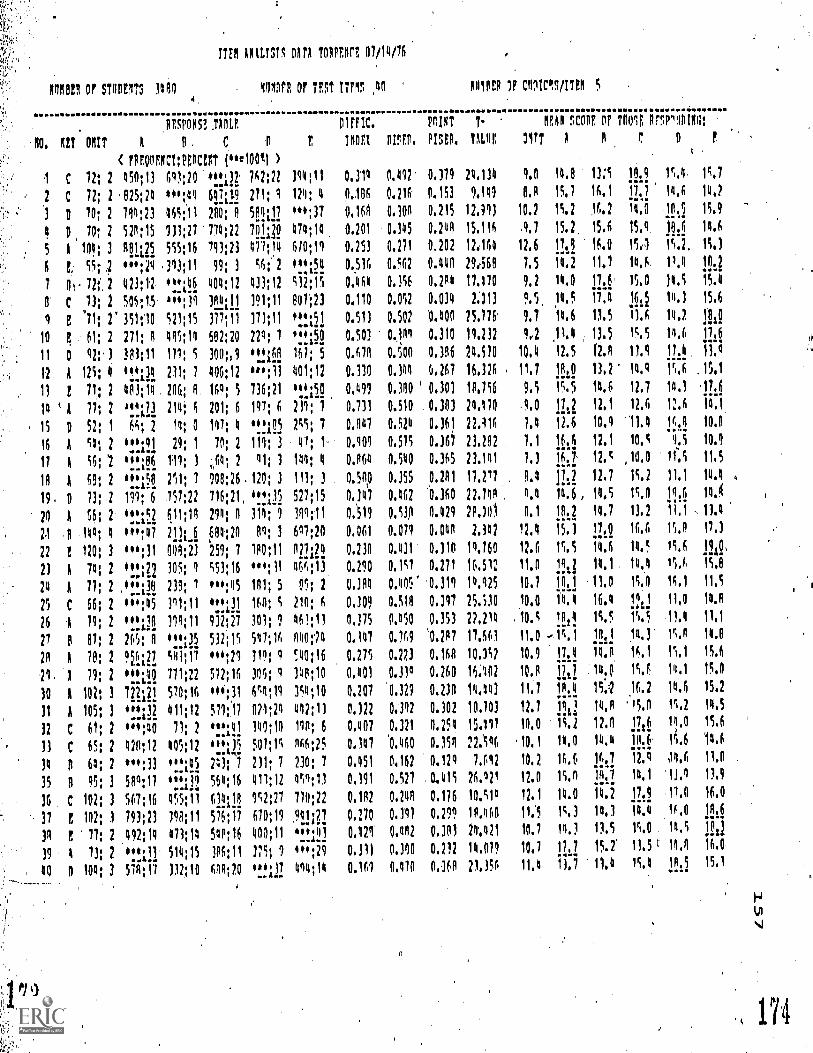
11911041 OF STUMM 3490
Trtn A1AL1315 DAFA TORPtVt, 07/14/16
41111FR OF TF,ST ITT111 ,40
111154012 nott
110. Kt! OMIT A 11 c tFPFOOF.c4;440c44T (fielooll )
1 C 2 450;13 6q1;20 ots 7c2;22 314:90
2 C 72; 2 825;24 *ri:41 647.11-2 271; 9 124; 4
3 0 70; 2 104;23 465;1 1 21-10; 0 50,007,,*9;37
D 10; 2 520;15 933;27 774;22 Iwo 414;145 A 104; 3 0112 555;16 793;23 477;14 61011
6 4, 55; 2 0;29 313;11 99; 3 56; 2 '1411
9 72; 2 423;12 ,11.,0A 404:12 431;12 132;11
8 c 13; 2 50615 A00,39 314.111 191;11 801;23
g '71; 2' 351;10 521;15 377;11 371;11 1.0.*.51
10 E 61: 2 271: 1 495;14 602;20 224; 7 ,44.50
11 0 92; 3 381;11 171; 5 300;09 00%2 161; 5
14 ' k 11; 2 49.41.01 214; 6 201; 5 197; 6 211; 7
12 125; 11 9n1111 231; 7 406;12 901;11 401;12
13 11; 2 483;14 206; 164; 5 736;21 99.,!;5,0
15 0 52; 1 66; 2 14; 0 147; 4 11.!95 2;5; 7
16 A 11; 2 ini2i 29; 1 70; 2 119; 3 41; 1
17A 55; 7 ith 1111 .1691 2 911 1 144; 4
18 A 69; 2 9o!,1,11 251; 7 906126 .120; 3 111; 3
19 0 13; 2 191; 6 757;22 716;21, 4.!1.1.5 527;15
29 A 55; 2 on52 61101 294; 8 314; 9 399;11
2,1 9 141; 4 0,0;47 2111.1 681;20 01; 3 647;20
22 G 120; 3 "*;31 009;23 259; 7 190;11 02112a
21 A 74; 2 01:;22 301; 1 ;53;16 *00;11 466;13
21 A 71; 2 ,101311 239; 7 to.:115 191; 5 91; 2
25 C 66; 2 090;45 311;11 ils0.111 168: 5 210; 6
26 79; 2 ot2I1! 390;11 912;27 301; 9 461;11
27 8 07; 2 265; 1 orA 532;15 511;16 040;74
20 11 701 2 9Fli27 591117 129 711); ¶40:16
21 1 79; 2 en110. 711;22 572;15 301; 9 3411:10
30 11 102: 3 722;21 570;16 $4,;31 5;4;19 354;10
31 A 105; 3 411;12 511;11 174;24 442;13
32 C 61; 2 fos:40 71; 2 140;10 140; 6
31 C 65: 2 420;12 405;12 507;11 466:25
14 9.64; 2 0.13 $!!142 293; 1 211; 7 230: 7
35 9 45; 3 589;11 **,!J19 56II;q
36 C 102; 3 567;16 455:11 614119 152;21 770:22
31 ! 102: 3 793;23 398;11 5i5;15 610;19 441.77
31 F, 17; 2 492114 113;14 540;16 400;11 *0.143
39 11 13; 2 9nI,11 514;15 386;11 375; 9 9.7;2(-1
40 0 104; 3 571;17 332;10 601i.,20 4,1,2117. 414;14
MIMI 1! COOICRS/TT4M 5
111FFIC.
1119E1
0,314
0.106
0,161
0.201
0.253
0.516
0.464
0.110
0.513
0.503
0.619
0.330
0,499
0.731
0,1(17
0.904
0.1164
0.5Op
0.341
0,519
0,061
0.239
0.290
0.384
0.309
9,325
0.141
0.275
0,401
0,207
0.322
0.407
0.147
0.451
0,191
0.182
0.270
0.129
0.111
0.161
11117.11,
0,442
0.216
0.300
0.345
0.271
0.562
0.356
0.052
0.507
0119
0.100
0.314
0,390
0.510
0.524
0.515
0.540
0,355
0.462
LW0.019
0.431
0.351
0.405'
0.510
0,450
0.169
0.223
0.319
0.329
0.312
0.321
0,460
0.162
0.527
0.240
0.397
0.902
0.390
0,470
POINT
?BEN
0.379
0.153
0.215
0.240
0.202
0.440
0.294
0.034
0.100
0.310
0.3116
6.267
0.303
0.303
0.361
0.)67
0.365
0.281
0.360
0.429
0.041
0.110
0,211
0.310
0.397
0,353
0.297
0.150
0,260
0.238
0.302
0.254
0.351
0.124
0.415
0.176
0.299
0,303
0.232
0.361
T.
911,11F
24.134
9.141
12.911
15.116
12.154
29:569
11,170
2.113
75.776
19.232
24.510
16.126
18.156
24.170
22.116
23.292
23.141
11.217
22.140
21,101
2.112
14.160
16,512
14,425
25.110
22,214
17,561
10.112
16.102
144143
10.103
15.117
22.546
1,692
26.121
10.514
11.461
24..421
14.011
21,356
11F,A11 fic0111' o? TOM grsrl019(;;
1911' n C 9
9,0 14.8 13:5 18,! 11,4
8,9 15,7 16.1 11t1 14,6
10.2 15.2 16.2 14.0 10.5
9.7 15.2, 15.6 15.9 i,612.6 10 16.0 15.1 15.2.
1.5 14.2 11.1 Ito 19.11
9.2 11.0 11,1 15.0 74.5
9.5, 14.5 17,4 16 14.3
9.7 14.6 11.5 13.6 14,2
1,2 11.4 13.5 15.5 14.6
10,11 12.5 12.1 11.9
. 11,7 1010 13,2 14.1
9.5 11.5 9.6 12.7
9,0 12 12,1 12,6
1,4 12.6 100 '11,4 1M.
1.1 16A 12.1 10.1 4.s
1.3 Ho, 12.; ,111.0 11,5
1.11 1112 12,7 15.2 11.1
4,4 14.6 , 14,5 11.0 1M11,1 1.111 14.7 13,2 11,1
12.4 15.1 u,2 16.6 15,8
12,6 15,5 14,6 14.5 11,6 .L2,11.0 13 14,1 14,4 15,6
10,2 Ih! ,19.0 15.0 14.1
10,0 14.4 15.4 illtj 11,0
10.; I!!! 15.5 15.5 11.4
11.0 -15.1 11.4,114,3 11.1
10.9 111.4 14,0 16,1 11,1
10.9 110. 144 15.6 14.1
11.1 10;4 15.1 ,16.2 14.6
12.7 19L,7 14,0 .15.0 11.2
11.0 11.2 12.1 Ed 14,0
.10.1 14.0 14,4 10;6 11.6 14.6
1i,i 14.610.2 16.6 11.4
12,11 15.0 11 111,1 13,4 13,9
12.1 14.0 14.2 11;9 17.0 16,0
11,5 1;,3 14,1 111.0 16,0 1316
10.7 14.1 13,5 11.0 14,5 .1,1111
10.1 1/.17., 15.2 11.5 14,1 16,0
11.4 11,7 11,11 11.4 10!,1 15.1
!
;.70,2
5.9
11.6
5.3
5.4
5.6
.ti5,1
.716
1.1..1
0.8
0,9
1.5
0,11
4,g
3,4
7,3
5,8
1,5
4.8
1.1
4.8
5,6
5.0
5.2
4.5
5.6
174
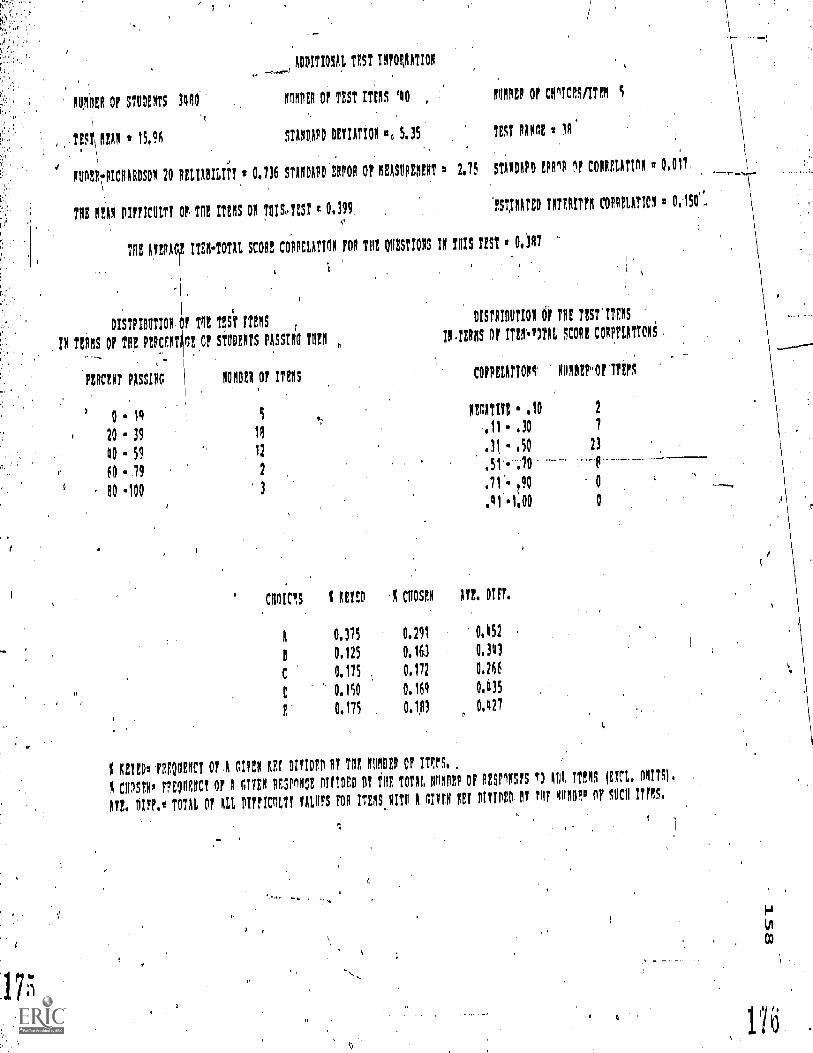
NUIDER OF STUDENTS 3060
ADDITIONAL TEST INFORNATION
ROT! Of TF,ST rms '40 POMP Of CHnICF,S/ITEN
, TEST, BEAN I 15.96 STANDARD DEVIATION sID 5,35 TEST RAM 111.
NUPERRICHARDSON 20 RELIARILIiT e 0.736 SWIM ERPOR 0? IMMINENT 2.75 STANDARD EPRIP OF COPULATION 0,017,
THE REIN DIFFICULT! OF, TO! ITEMS ON TIITSTEST 0,399 'F571E111E0 INTERttrfi COFHPLANCR
TB! ITEM-TOTAL SCORE CORRELATION ION THE MST= IN THIS TEST g,0,3R7
DISTRIBITION F TO! TES{T ITEMS r
IN TERNS OF TB! PERCENT OE C? STUDENTS PASSIM TIRO
DISTRIBUTION OF tiff TEST.TTENS
MEM OF ITEI,MAL SCORE CONTLATIONS
PERCENT PASSIM
0 19
NUMBER 0? 171115 CORRELATIONS. NIINDMOF ?FOS
!NATI!! .10 2
20 39 11 ,,11 .30
00 a 59 12 .50 23
60 79 2,51 ,70 --P
NO 100 3,90 0
.91 .1,00 0
CHUM ¶ REM 5 CPOSEN flu. DM.
A 0.375 0.291 0.152
B 0.125 0.10 0.343
C 0.175 0,172 0.266
0.150 0.169 0.435
0.175 0.1113 0,427
$ REM FREQUENCY 0? A CIVEN UI HMO IT TII! RUDDER OF ITEM ,
I CPOSEN, FRE011NRCT OF A (MEN IlEsmisz ram DV TOTAL NUMMI OF USIINSIS ¶3 II ITEMS (Im, OMITS),
DI??.0 TOTH, OF ALL DIFFICULT! curs FOR ITE19,11ITII A ITyrg sr! me By rqr qiIBBN4 OF SUCII urms,
Who
a
FI2R-LTTEL LINKAGE EDITOR OPrION5 SPECtrTED.LISTIDEPANLT OPTION(3) ITSED SIZE?-(13515n;24516)
****LOADI ROES nOT PAITST PtIT PAS nErx AaP1'.0 PATA
r
177
4
.1"
SF.T?
a
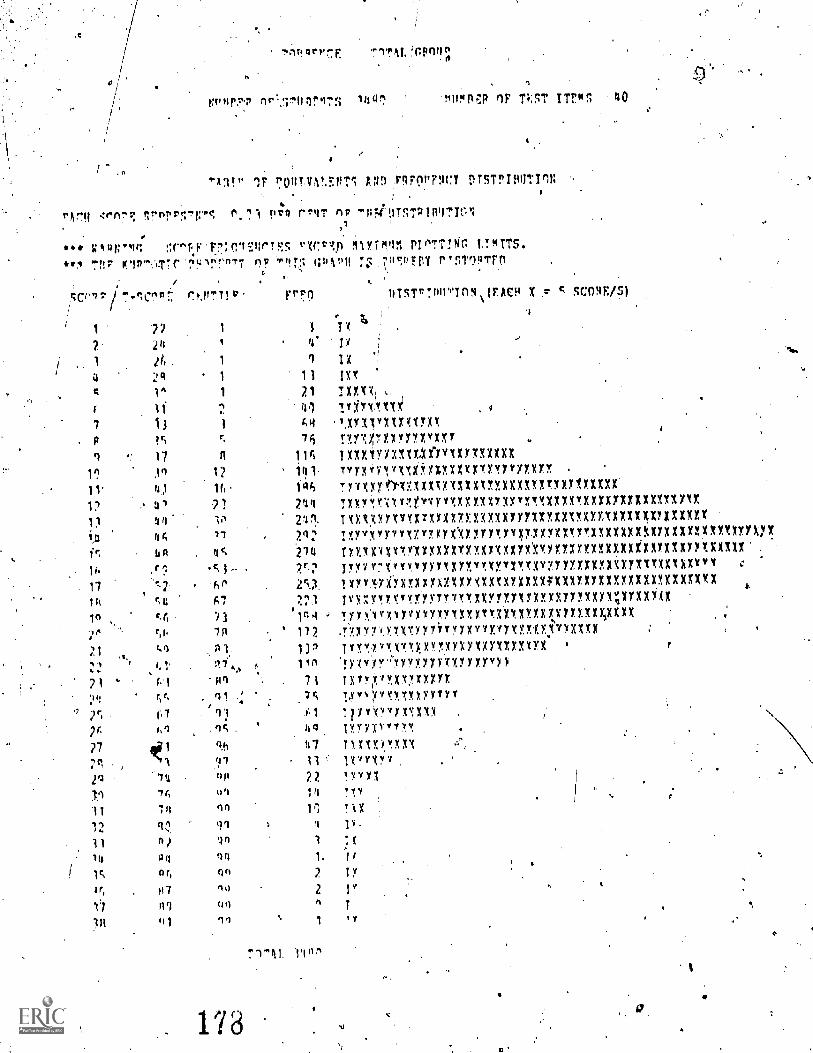
rAfli rr-
rnir.11n1,1
tmnr.7 nr,1141r1r4n !in"SU fIF TT ITrms 40
l!" 1F 1otm!:NT1 AND FRFO71C1
1rPrrn7r-r. P.71 pro rr4T -14DTSTP1n9TP,'.1
.
loog'mq g'7t.:1K7S rrt-I,J) Mly1?1,1", morrnin tTWTTS.
7n7 Klo-TTr'rmT7 n? oPoll 73 ""T"rFn6
Cr.P,TTIP Fr1,.1 lasTr7ourn,yFACH X.= g SCO9XM
1 '22 1
?' 24 1 4' 11,
1 A4 24 1 11 1XT '
21
r..i 1' 1
...ql Irgromt g
7 i3 1toi Ilvwxxxl.mir.
n n c 7i 11:17XXVIYIYYXXY .
1 17 n 116 ixxxir/xXxOfyvxxrcxxxxx
10 70 12 110- TvrxiYMIX71,3YXXxxIVI.717nrs: .
11. 41 'M. fah TrotyrOTI,XXXIXXXXXXXXXXXXXXrMIXXXXX
17 . 41 '21 2411 11.100"(XXXXIXTXX7:0.T.XXXIXIXXXXYXYXXXXXXYXX,
13 14 10 271, TialprriTITAYXXXYXXXXXIITXIXXXXY,XXXXXXXXWIXXXXr
i.JJ44 17 V2 Wrcirerumirxby.mroplrfxrruxxxxxx!(DIXXxx.MIXYYXYY
fr. bR 4C 274 14XYVVOrXXXXXXYAMAXXXYA'XY.Y1,7.XXXXXXXXXXXXXIXAYYXXXXXV'.
11. .rq .c1,.. . 1rirOvr01011:01YYJYYlv.rmYrnormxYymmxpryr c
17, '''7'
V 29. IX7r1gOITAXIAXAXMXTXXXXXXfXXXXXYXXXYXXXXXXXXXXXX e.
14 r111 A7 21 1YY,4Y!YY.T1JYYTI71:XXXYYMFXXXXIYMYX,IIIAX7.4X
10 eA 73 '1114 4 TY7WI0JYA100M111XYTY.XthXYAX,XYXXXX;XXXX
i riP 7F4 1 172 J''.3Arri.Y.I1V.YY17r!OlvirfrOYAYTOXXXX
2! to) ..rrl: 131 TUY.,Y."3Ve.Y.VYY.IYWYMAXY.XXXX f
4,11 11 1" .1)-(Y1r;"11(YYY/YTY,YYYrt)
21 ' ryi -110 71 1XIvilvAx/XXXXX(11 ..: .74 T.P9YMYXYYTYf
0 .i.1 :IXYPYYMDIN
2c hi .is 47 IXTYX .
27
1
qb 47 TMX7.,!XXX -.^.
, 111 ?7 31 ' 1.01-(Y1
1,1 '74 op 22 I
L
11 /A on 14 TY.Y e
11 III nn 11 1XX
12 n;.1 91 n i.
11 f) ) 'In 1 :X
1. 'It 1
1c,nA nn 2 TY
if, 07 no 2 l'.'
t,
,
11 RI to ,,I
111 '11nn 1 "If
71-AL llon
178 VU
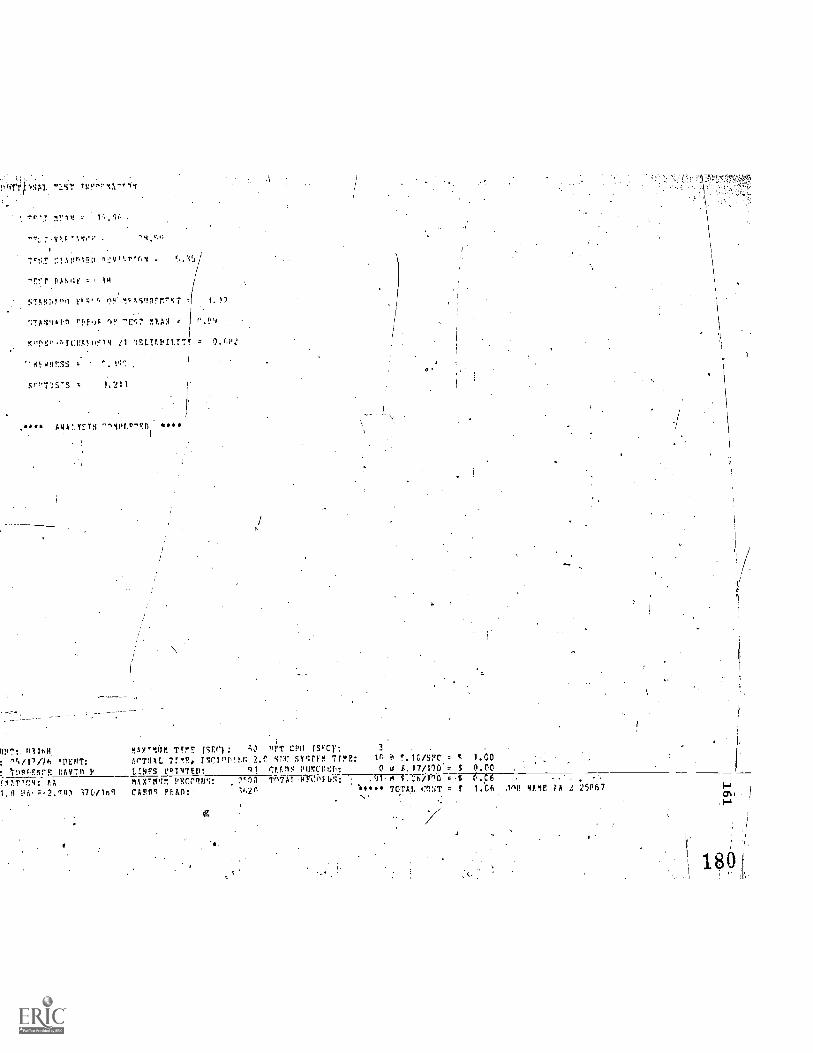
Plitt 7.3n 4sT 7Nt,r11,T.in
Tr'T
1:1.1rn%.7,11
tx!o:y 18
STAN101'1 1q11'1. 0F. 1v1,18RrIl'%7
.moo.ivp MEIO
1c,10::1-,,tclfA1il',11 21 IFLTAPV.T7T =
-e.wt[1:11i
10rinTS 1.211 I-
;
ANA!.Y1:T:1 7,101.PTV1
0'
;
11117:. "31" .,Ist'nitm Ttrt (ste): 7,zt 11FT CPU (0tC): 3 .
,
: ^C/I/Ph TUVIT: AMU T!".Fo. I11(.7!!/P11.11 2.r ,M7 W:TEM T092: 10 t.1;:,/Sn7 . t 1.00
: l'1,0PE91rF 0A1c70 P Lr.1iFS VqiNTEV: ql r:I.FIS 011nCr11: 0 o .A.17/100= ; 0.00
flATIC:t: AA MAX7MUM P?.CCRIN: ?rla TnTAI.PEC0PUS: ,71771-3,.:b/100 ....f--t.-06
1 8 0t,...2,"10 V10/10 CAPPS' PEA.D: IQ" TC14 en:)t . t 1.16
1
.." ,
Int! NAME: IA 2 2967
180
TRT
1:3;; V1VU (9LSta'N.W.,11)-a411; - Ut1 l416vilIJ
s
:Vi14:X.4:s 1.4,-14.23 coo:At:,
.163
APPENDIX L
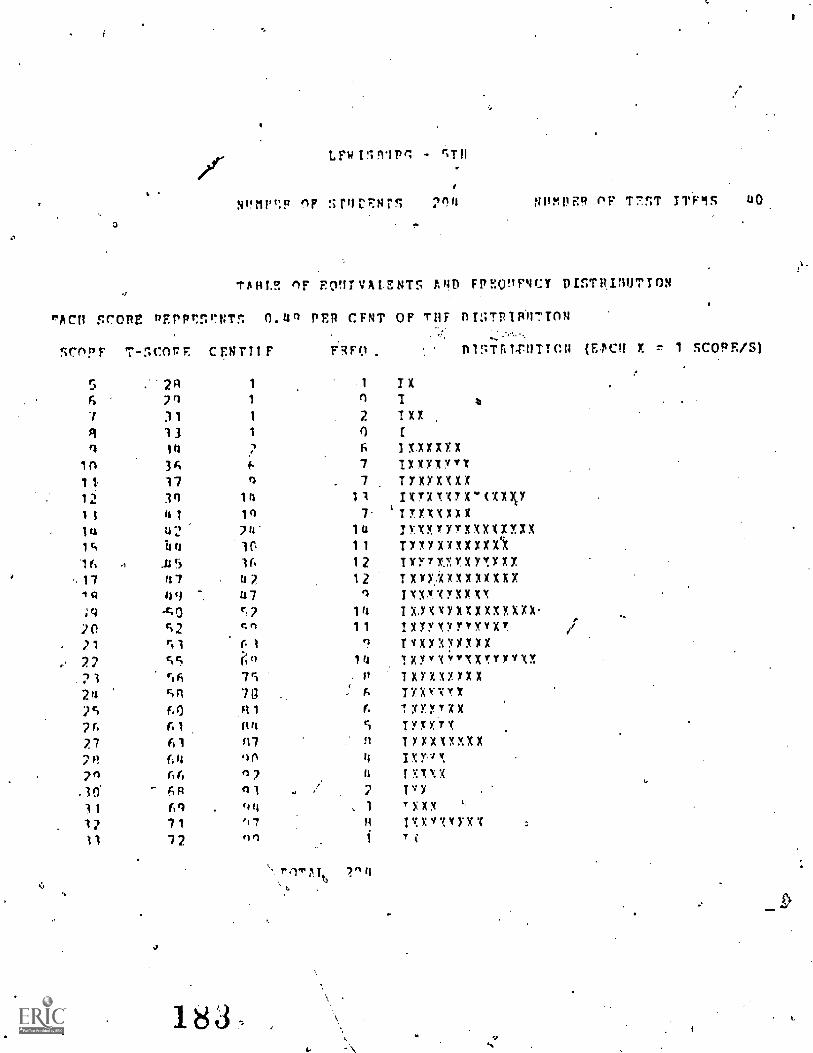
.1
NPtir:p sT11CFNIS trirmpER OF TT.ST TTO1S
TARLE ErnmI,ENTs Al1E1 FpEo!TENcy RTSTR.TRUTTOI41
^KR SCORE REPPT:SrNTs 0.10
scnpr T-ScorE CENT11F
r.1 2R 1
PER. CFNT OF THF RISTR1R4ITTr1m
1)1:v1'AT111r:et; (FC/I X r 1 COPE/S)
-1 TX6 29 1 n 7 AI
1 31 1 2 TXX
q '13 1 () tri Itl 1, 6 I x.XxXx X
ln 36 f. 7 IXErityTx11. 17- n 7 TyxXXIXX12 3r1 114 11 Txriv.Ux"(XX)cY13 li 1 1,1 7- try.Xxxxxxiu 4-2 74 1(4 IyNXY.YYXXXXXy.XX1; 144 if' 11 TylnrixxxCek
12 Txrrx.V.Y.XYT.1(xX17 N7 112 12 Txxyy-OXIXXXX71$1 4'1 117 q Pir:0*(YXXXX;1=4 AO C2 114 1x,yip0XXXXXXXXX.20 S2 cm 11 TUYY...erfr(xT.21 r, 1 r. 1 c.! TYWNXXXX22 cc, i't° 111 1 XYVV"XXV:YYVXY.
23 r16 7,- 11 1xYror.Y.XX24 c.n 711 : A Inyxyx2C f*C) .ni 6 -rxiyTXX2i, AI 114 S TrlY.TX27 61 '17 ft IrxxxxxXX7R2n
(0466
.0n7
il14
ly,r7v.Txxxx
.30 6R ni .. 2 Tvy
31 69 44 , 1 TYXX12 71 ri 7 H 0:xv(11yX1' _.
31 12 tin i ¶.(
7^4
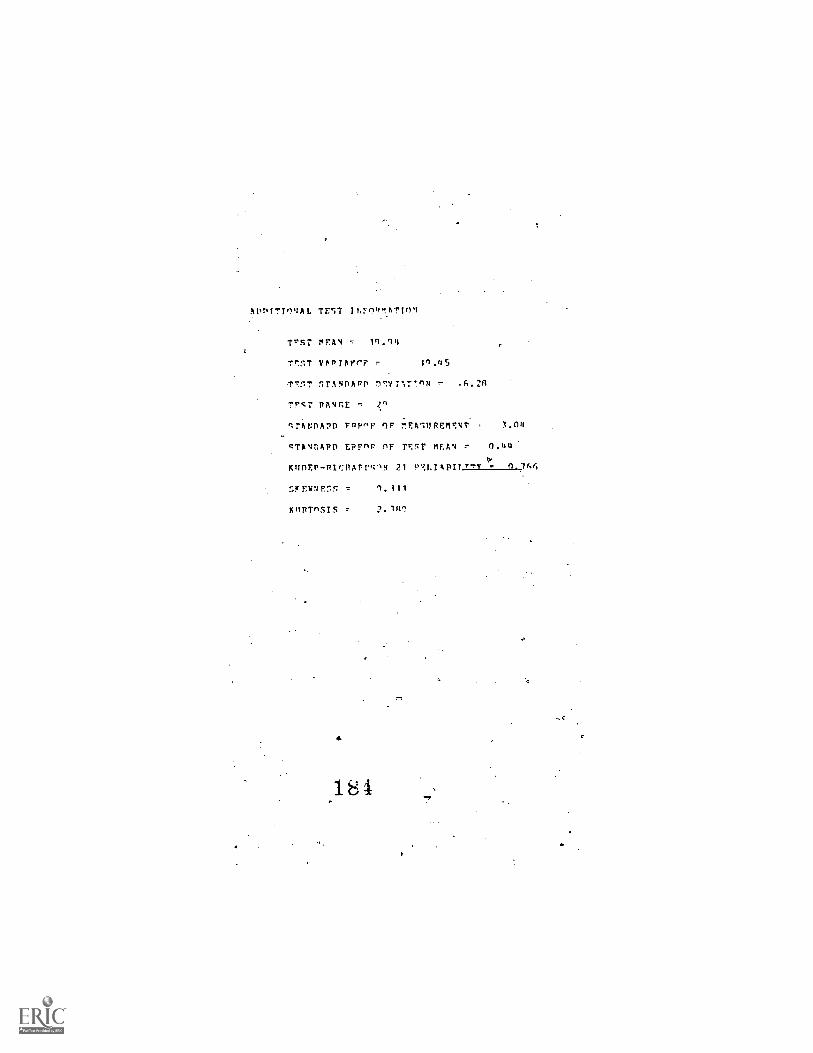
1111PfT7',NAL TFIT INF(17AT1ON
TrST MFAN 11.14
T7ST VANTArrF 11.45
T7ST 5TANDANI 07VT1T7nN
Trcr PANGE ,
qr-ANDAND f)F MEAIUREMFNT 3.04
cTANDAPP EpFnr rF TP.Sr MEAN , 0.4U
KnnEP-nIcnArr,;.,N 21 P,,J.74prTT.,y , n_7(.4
SFFNNFn5 1.111
KunTnSIS
,184
2.111'.?
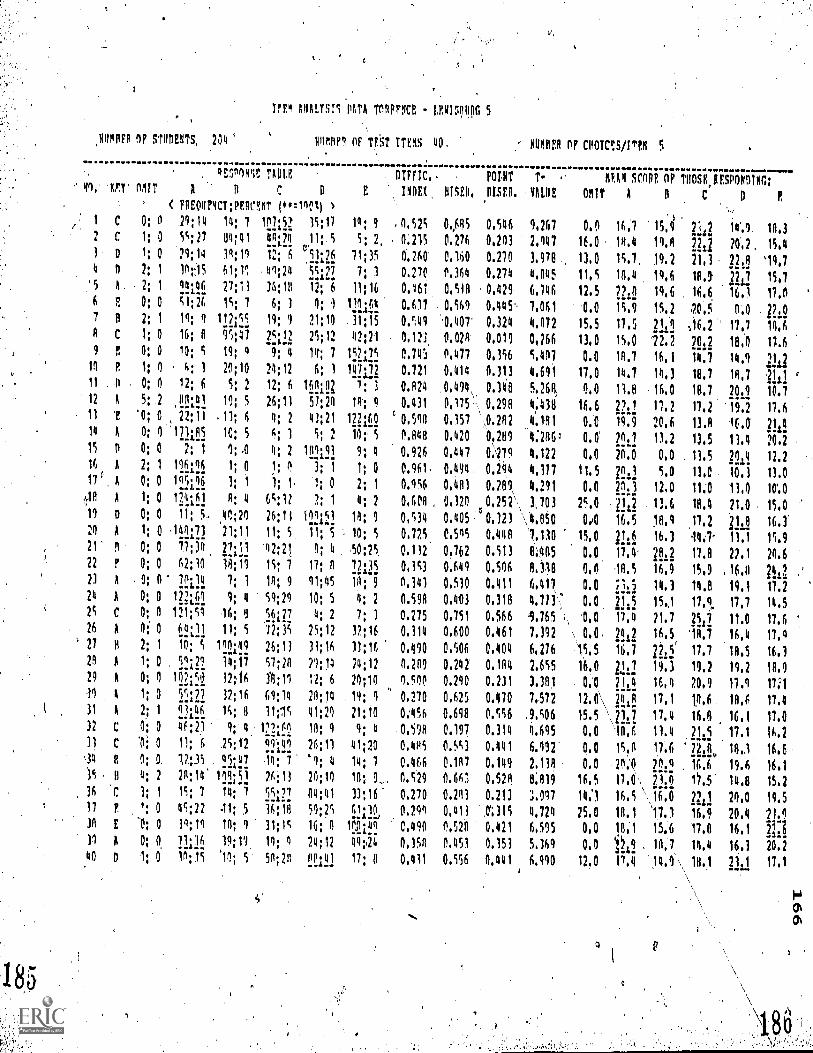
NUIPET nr STUDENTS, 214
Irr4 MUST; 'DATA Tplirmt - non:110C 5
NIINDE1 oF TFST I7E9S 40. NUADER OF C0010!0/1TeR 5
4.
TABLE DIFPTC.- POINT T flU4 SCoPE OP 1110SEJESPON91101:44, Ari MUT A C D E 11M11, [OPAL WOE 08111 A BCD
FRE01111CY;PEOCENT (*0:110%)
C 0: 0 21;14 14; 7 10202 35117 14: 9 rims 0405 0.546 9,267 0.9 16.7 15,9 2:142 14.9 18,32 C 1: 0 55;27 04;41 UM4 11; i 5; 2, 9.21c 0.276 0,203 2.947 16.0 18.4 19.8 12 20.2. 15,43 D 0 29;161 39;19 12; 6 11.26 71;35 0.260 0,160 0.270 3.978 13,0 15,7 19.2 21,3 nd 19,74 8 2; 1 1005 61;11 119;24 n127. 7; 1 0,270 0.364 0.274 4,(145 11,5 18,4 14,6 Ho 227 15,7
'5 h 2; 1 27:1) 36;18 12; 6 11;16 0.461 0.510 0,429 6.746 12.5 72.11 19,6 16,6 16.1 17,06 E 0; 0 C1:26 19; 7 6; 3 0; 1 111164 0.617 0.569 0.445.. 7.061 0.0 15.9 15.2 20.5 0.0 2?127 8 2; I 19: 9 1111!S. 19: 1 21;10 0,'.41 0.407 0.324 4.072 15.5 11.5 2111 06.1 12,7 19.6A c 1; 0 16; 0 95;47 2S.17. 25;12 42:21 0,123 0.028 0.019 0,266 13,0 15.0 '72.2 pla 10:0 11.69 11 0: 0 10; i 19; 9 9: 4 14; 7 1C2.12C 0,477 0,356 C,4D7 0.0 10.7 16.1 14.7 14.9 2113
10 1: 0 . h: 1 20;10 24:12 6: 1 142122 0.721 0.414 0.313 4.691 17,0 14.7 14,3 18,7 18,7 21411 D 0; 0 12: 6 5; 2 12: 6 16219 2 1; Ti 0,824 0.494, 0.340 5,268, 9,0 11.0 16.0 10.7 200 10.712 k 5: H91 19; S 26;11 131:20 18; 0 0,431 0,115 0.298 4;438 16,6 222 11.2 11,2 19.72 11.611 P '0; 0 22;11 .11; 6 4; 2 43;21 MAO 0,598 0.157 ,0.202 4.181 0.0 19.9 20.6 13,0 ic,0 fl14 4 0; 0 11lRS 10; 5 A; 1 5; 2 14; 3 0.0413 0,420 0,289 4:206 0,0 na 13.2 13.5 11.4 20.215 0 0; 0 2; 1 9; .0 4; 2 Tot 9; 4 0.926 0,447 0.279 4.122 0,0 20.0 0,0 11.5 2211 2.216 A 2; 1 12,6L'36 1; 0 1: 3; 1 1; 0 0.961, 0.494 0,294 4,117 11,5 2242 5.0 13,0 10.1 3.011 A 0; 0 1251h 3; 1 3; I. 1; 0 2; 1 0.956 0,481 0.2813 4.291 0.0 2.3 12,0 11.0 11.0 0.0111 A 0 1Lmi 8; 4 64;11 2; 1 4; 2 0,600 , 0.120 0.252 3 103 25,0 21L2 13.6 18.4 21.0 5.019 D 0; 0 11; 5. ,40;24 26;11 12212 111; 9 0,534 0.405 0.323 \ 4,050 OA 16.5 10.9 17,2 31d 6.320 A I; 0 1/12111 21:11 11; 5 11; 5 10; i 0.725 0.515 0.448 1.130 15,0 216 10.3 140' 11.121 4 0; 0 77;13 22122 42;21 9; 4 50:23 0.112 0.762 0,513 0.405 0.0 17.4. 3Ij2 17.0 22.1 20.622 !, 0; 0 42;10 14;19 15; 1 11; n 1211'1 0,153 0.649 0.516 0,318 0,0 10.5 16,9 150 . 16,0 241223 A . 0: 0 711(1 7: 1 IA; 9 91;45 0.341 0.510 0.411 6.417 0.0 14.3 14,8 19.1 17.224 A 0: 0 1222 9; 4 59;29 10; 5 4; 2 0.598 0.401 0.318 4.713 " 0.0 DA 15,1 17.9. 17.7 14.525 C 0; 0 121;11 16; 9 16.27 4; 2 2: 3 0,275 0.751 0.566 1,165 . 0,0 11,4 21.7 251 11.0 17.6
26AP.OL10.111;572:"S:1";1".3".""411617.392`o42.10." ".4 17.1' 27 n 2: 1 10; C 12202 26;13 31;16 11;16 0.490 0.506 0.404 6,276 15.5 16.1 22:c( 17.7 18.5 16.1
28 A 11 0 .2.11,2 14;17 5l;20 71;14 24:12 1.209 0,212 0,104 2.655 16,0 LW 19.3 19,2 19.2 10.929 8 0; 4 107'4 3206 91;11 12; 6 20;10 0.500 0.290 0.231 3.301 0.0 21:4 16,4 20,9 17.9 17131 A 1; 0 1.j.72. 37;16 49;14 20;14 19; 9 0,270 0,625 0.410 1.571 12.0\, 2iti 17,1 111,6 18,6 17.431 A 2; 1 226 14; i 11;11 41;21 21:11 0,456 0.698 0.556 .9,506 15.5 210 17,4 16,8 16.1 17.032 C 9; 0 16;21 9; 8 1160 101 9 9; 4 0.598 0.191 0.314 4.695 0.0 10.6 11.4 210 17.1 16.2) C '0; 0 11; 6 25:12
l'',222 26;11 41;10 0,405 0.553 0.441 6.112 0.0 15.0 17.6 724,A. 18,3 16.614 R 9; 0 1205 Th42 14: 7 '9: 4 14; 7 0.466 0.187 0.149 2,118 0,0 20:0 20:9 1.6 19.6 16.1)S 0 4; 2 211;14 12!;52 26;11 20;10 10; 9.. 0.529 0.661 0.528 0.819 16,5 17.0 2.-1J. 17,5 14.0 15.236 C 3; 1 13; 7 14; 7 1%27 114:41 33:16 0.270 0.203 0.213 L017 11;3 16.5 1.6.,0 2211 20,0 19.517 1; 0 43;22 41; 5 3606 51:2s cn 0,249 0,413 04,315 4,124 254 10,1 17.1 16,1 20.4 21,1
E '0; 0 34;19 18; 9 31;15 16; 0 1011119 0.490 0,520 0,421 6,595 0,0 1011 15.6 17,8 16,1 22,631 A 0; 0 21111.2 19;11 19; 9 24;12 40;'2ii 0.150 0.451 0.153 5,369 0,0 , 18,7 14,4 16.1 20.240 D 0 10;15 '11; 5 58;20 19011 17: 0 0.411 0.556 0.441 6.990 12,0 I1.4 14.9 ,\ 1811 11 17.1
4.,,,
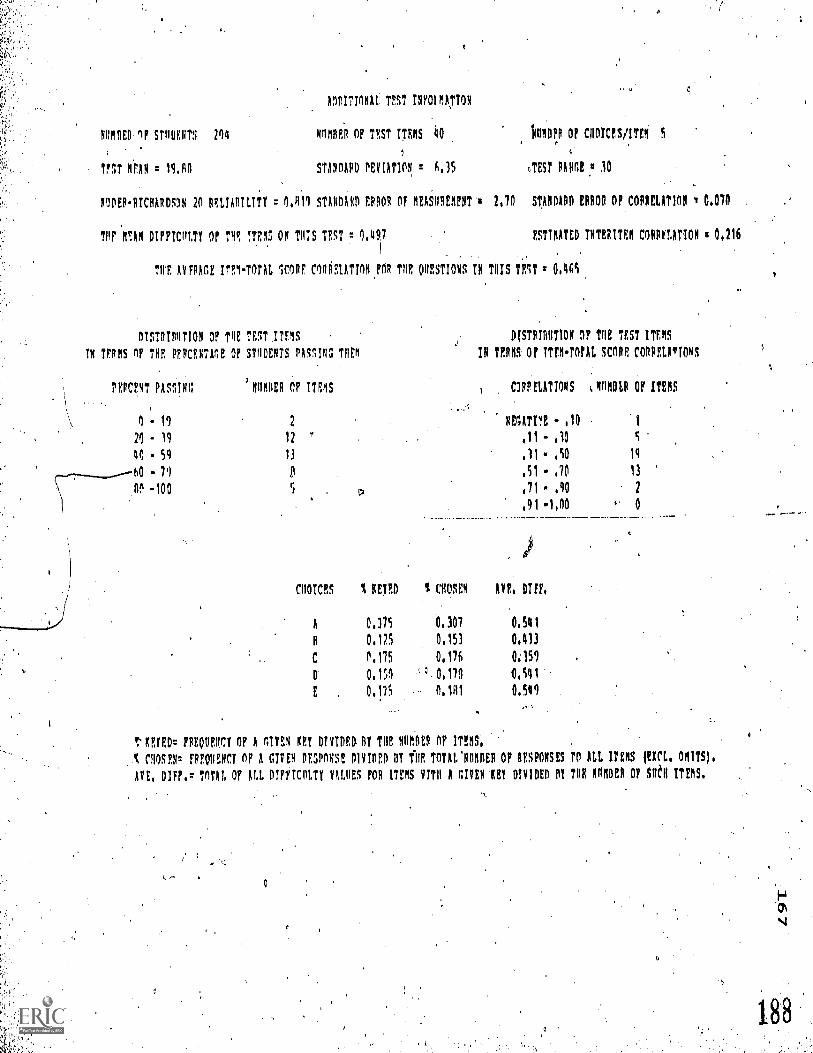
NOMDEWIF MOTS nu
TEST WEAN 19.110
AHDITIONAL TEST INFOIMAPON
MEER OF TEST ITEMS RO
STANOARO PEVIAT100
ilomor,r or coorctsTrm s
,Trsr PANG! ! 30
ADDEMICHARDS1N 20 RELIARILITY : 0,011 STANDARD ERROR OF MEASUREMENT m 2,10 STANDAPD EPPOP OF COPPELATION m 0,070
THF NEA4 DIFFICHLTY OF THE "JENS ON THIS TEST 9.991
TWE AvFRACE ITEI-TOTALISCORE CIOREIATION.FOR Tnr, ONESTIONS IN TOIS TE'IT 0,465
ESTIEATED 7NTERITEN COPPELATION m 0,216
DISTRIUNTION OF TOE TEST ITFIS
IN TEENS OF THE PERCENTAGE OF STNDENTS PASSING THEM
PERCENT PASSING EHMDF,H OF ITEMS
DISTRIBUTION IF TOE TEST ITEMS
IN TERNS. OF ITTNTOrAL SCOPE COPPELPIONS
ORFELATIONS AMU OF !TENS
- 19 2 NEGATI7E ,10 1
29 - 19 12 " ,1 1 - ,10
40 - 59 13 .11 - .50 19
- 7,1 .51 .70 13
PO -100 5 .71 .90 2
,9 1 -1,00 ' 0 --
,
CHOICES % HIED % CHOSEN AVE, DIFF,
A 0.315 O.307 MU 1
II 0,125 0,151 0,413
0,175 0.176 0.159
0.151 0,170 59 1
0,11:1 nom 0,919
!'KEYED: FREQUENCY OF A 4IVEN NEI DIVIDED. Of THE Notion OF ITEMS.,
CHOSEN: FPFSENCY OF A GIVEN PESPONSE DIVIDED HY fig! TOTACNONREP OF RESPONSES ro ALL ITEMS (EACL, OMITS).
AVE, DIFF.: TOTAL OF ALL DIFFICULTY VALUES FOR ITEMS VITO A GIVEN UV DIVIDED DI TPE MEP OF Sell ITEMS.
188
.168
07,
APPENDIX M
COMPUTER PRINTOUT OF THE STATISTICAL PACKAGE PROGRAMOF THE VALIDITt SAMPLE ON FIFTEEN SELECTED VARIABLES
189
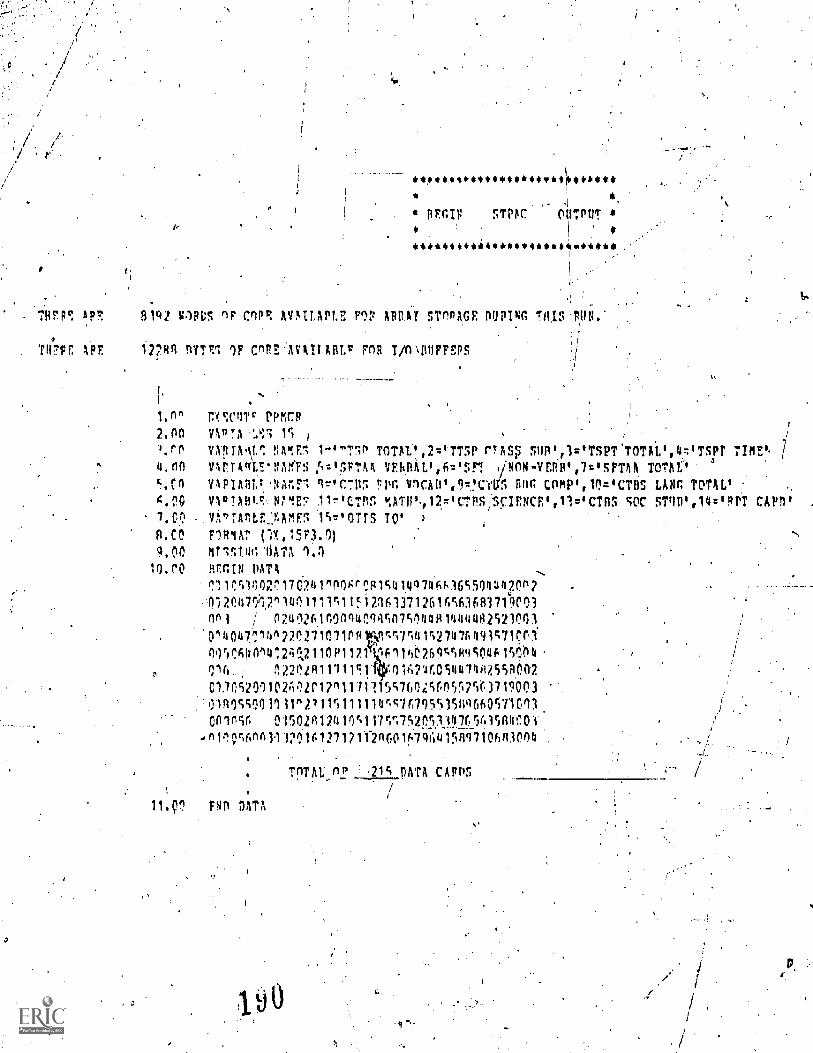
i
5 4,I -1
I I PFGIV STPliC OUTPUT*
: t
*******************,,,.,,,,is,"
Obfresql0,44,4,*****Ordit 110 044*#
8142 101115 nF CnPP. AMLAPLE MP ARRAY SITPAGE PURIM;
122Fin DTTE1 op crIDE:AVAILABLr FnR 11n4UFFFPS
1.nm W:CnTr PPMCR
2.nn VA97Ar%°,7 151.rn vAlivo\Lr. NMI 1-"mT1P TOTAL'121°175P r!As; SUF0,30TSWTOTAG',4.7°Tspr TIME'.4.nn VthArq,E*,!!AMTS r,-.05FTAA vr.h.RAL1,6=,Fi 00N-VEfiD,170SFTAhIOTA11r'..00 VARIA1V1WI Ir,C7D7. rpn VICA01.92.NTD(5 Rog comPotr=iCTlis LAM', TOTAL' :
400 VluTARTWE7 11r'CTnr. v.AW,12=,c7PS,13CIENCE1,110CTR5 sOC STDD1,140RPT CAW.- 7 tr! VV'TAnLEJAMES 1r)T'OTTS TO' ]
R.CO FlRIAT P.415F3.0)
9.00 MTV;11.11; '6AT4 1,1
lo.ro firniN DATA --..
0,110.S1q0r17641^POgr91c0110746F0V1500420n2
4,12e47reir1401111c11!)2163371261r0+6368371'9003nni / 02a1261r6nDuTiqqn751)44R144402S2r03
014047r4^2Pri1071nsliqcsymIc27476493;71Wf
015C00114",M2110P11dN116O26Wim950461564r,22N11111111i1 V)1(12:1(:05417740551,602 .
0,30S201102(02P12n1110. 5;76M6055250719003/
04')5C0031i1m21115111114r.cit795535g0660571C13. !
Onlriqr 01502g1241nC1FM75M11471,56)SAVOI. /
,
...wv,f061112r.i161271211-2D6019i1441589710fis.1004
/TnTAL:o
11. 1 FNO DATA
.21c DATA cApps
,
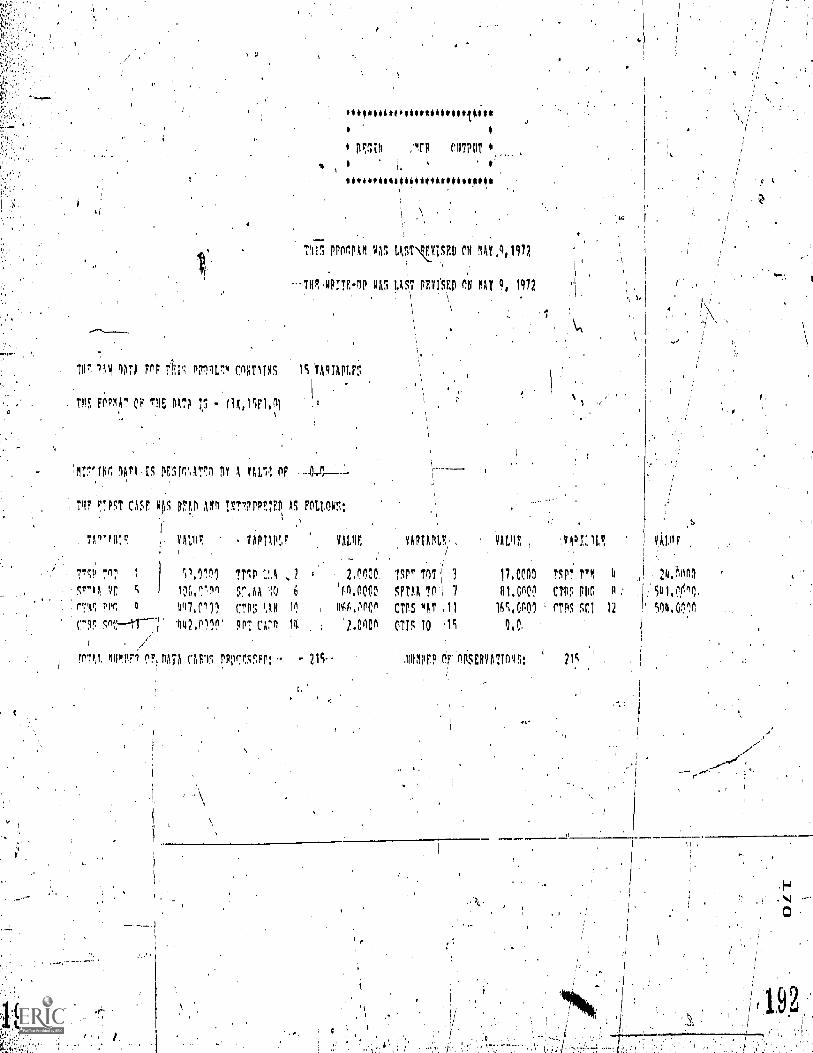
c
V
$$$$$$$$$$$$$$$$$$$$$$
* MTN ;Nrp eirPUT N. .
i*,440,6itiAtiowil04601,,104i0
Tifl PPKTI.141 LkST4EVISE0 ON 3hY,9,1912
--THPAPITR-3P VAS LAST FEVISED (1111 MAY.9, 1972\
I
\
Tpr. 9A4 1ATA FPF 6NT11N5 11 1A9IppL6,
I
T. FPP' CF THE DAT? 7,1 (3K,15F1.41
1ATA IS 3F,'51c!,AT71 3Y 4 YALS1 nF
IT 7psT Cm qg rp um Tmr..P.PFF,17 AS RUM:\
. vilTriv,r,
I
rAtit;, , VAP1411LF VARIAPV'YALU.
SrAA, 7r
TSP 1 ?TP A 2
; 'I 1:1L,^.11^ SA lo 6 `1,0,n00 SFTAA TP' 7
.... ,.
.
T TITVO.ARAA
7 ';!../ I :! .. 2 ,' N 300. TSPT T OT'I
0 4(17,(11) CTIIS LAN li1 , WMPCP CTPS NV
(7ir, snf---1171 $42.0(.1 Pr CiOn q 12.000A OT15 10 11
I . ,,,,
rrnt niirtrri ciF' nro, cur, rporr5r,Fr: - - 2ii.: JIMMIE? Op:MISERVATTONS:
1A91:11,P,41,11F
17.mo ?Sr TYM 11. 24.i11130
fil.pe^ C1V, WI :
16;.P01 PTP5 SC1 12 134,V1P,
21;
0

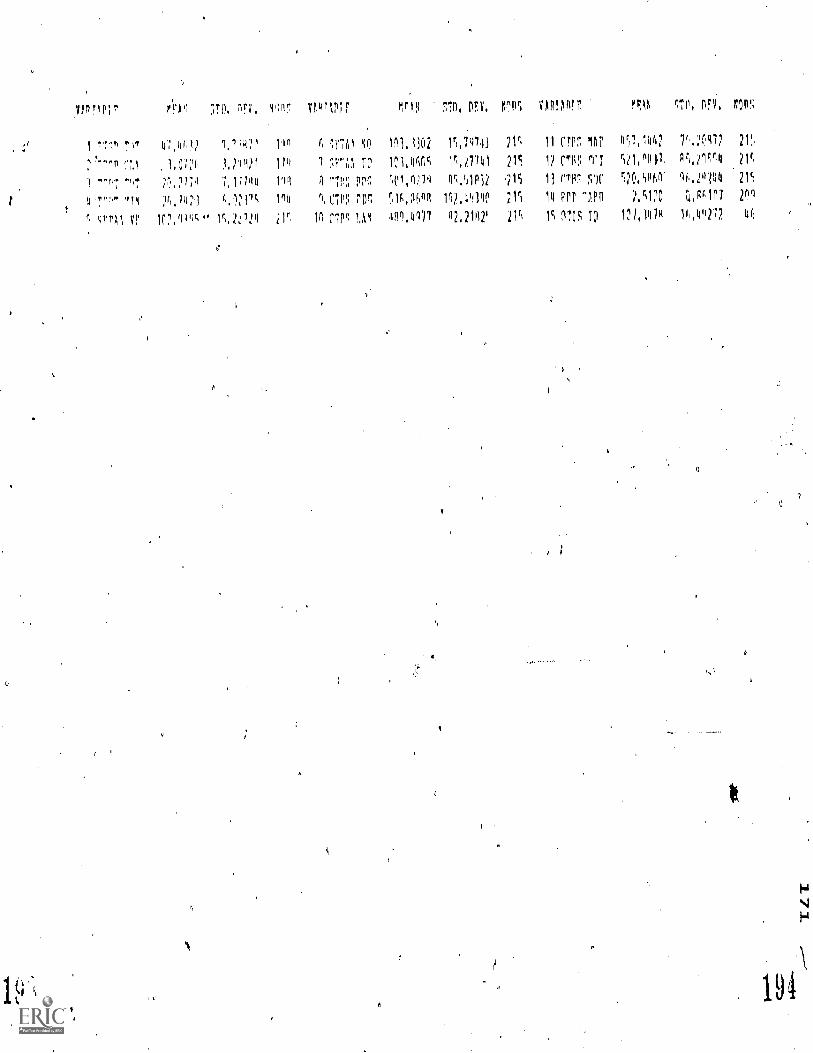
Pr!',P1 510, DF7, 411" WIT1F ?,114 STD. 171, NT. WHOP'. 114 C7P, PFV,
W 111 fr NO 111.1302 1'1.7041 115 11 Crr MAT 4,1442 7S412 21!,
1,Q1;[ 1d44/1 114 1 ',F"'n Tr," 111,44C,C 15,?7141 215 1? C/g 1'1 521.411, 4',.?1c,4 2r,
1 PT *n7 1,11;41! rill 1 50.1),14 4C.,1[112 '21S 11 C'r SIC T.2.541). 4.2°114 21'1
?(,.1421 114 1, Cir, Mr. 51,0f,i10 112.11W 215 14 PP!' TO 4.5011 211
lr.1"c" 15,22124 21r 10 c7pc 1Al 4P9,4477 A2,211121, 21r, lc ns ID 1:+1,1414 Visor? uf,
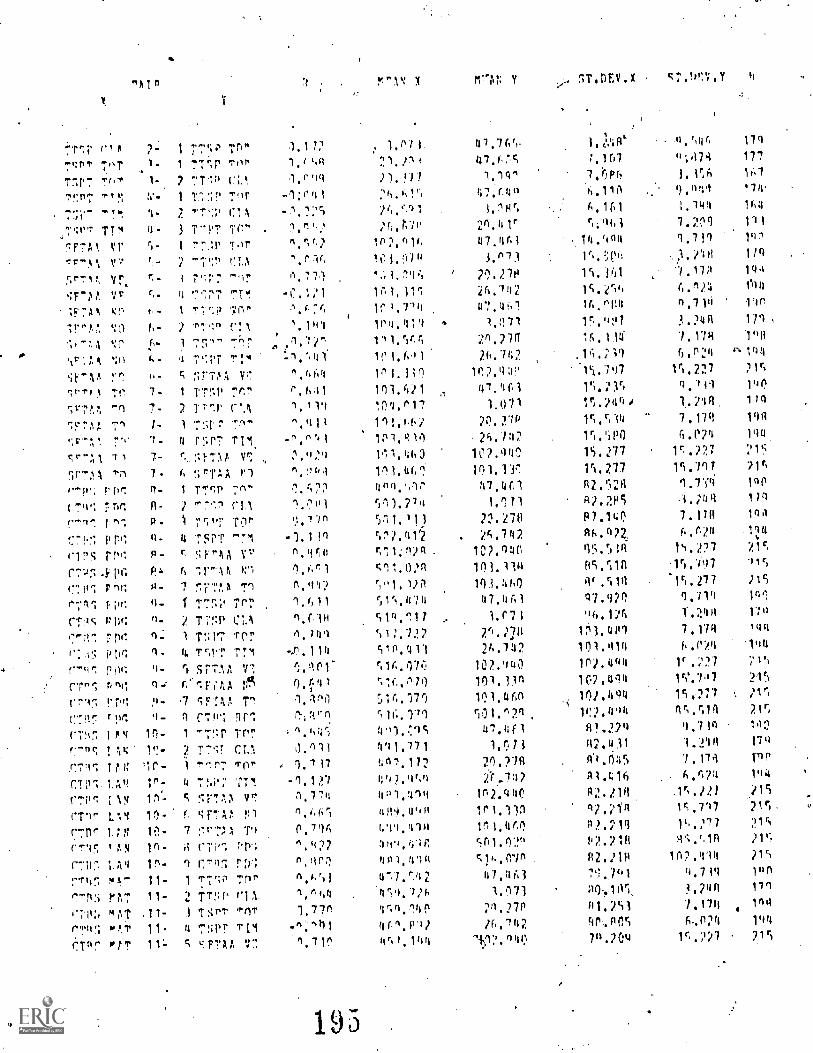
"AT" !1".1V X P177AN Y ST.DEY.X c7.W1.Y
'71":r c111 2- 1 77W 7"70' 7°T ,1- 1 TTW' Tor
Twr 1-, 2 ".11t'
7.!:n7 ."1.!1 !V- 1 T.:1!;r Tr9- 2 CIA
ITI4 4- 3 7"P7
7F7V1 vr 1 77,:p T.)r
2
S0"lf, Vf,, 5- 7-;r7
vr 4 7r7 TT".1
31.'r 2 '01'':P 11t
q A- 1 7:1" 7i17
!'". :;TAA 70
70 7- 1 T7SP 7"-9 - 2 T'":1: C!.1
T. 77 1 T:1'7 Tn*- 4 f,'.".07
qr7/,1 11 7- C..q.701 76.
Tr7A4 '0 7- A SrT4A1' 4r7 P. 1 17.qP 7^-
(Tv; !:r.r, A- / C1,1
r.-"". VT, P- r' V.1rTSPT
rips rT,c1 P- r, !.:FrhA
PI 6 ",r-All
ii g- 7 7FT,',A
1'701 q- f TTSP 70r
PDf: "- 2 CL't
17-it' re L 1 17 Torp:W. 1. I, TrO'r T71
("40 p 0- r) SPTIA
cTul ir r..
C7-47. rrg: p- cF'rAA 77
C7!il Rt1
IPV 1!)- / -77:p Trr
1r- CL1
!IT ; itn lr- 1 1-.07 'Mr
CT.01.1./i4 1°- 4 "Thr: TT1
rAN 5VT,I0 yr
c74" 1.01 11- 6 tir:AA ri
7111 L:n le- 7 :1"TAA
cTVI 11- CIF'''.
(71P:: LAq 10- 1 C711 Nr:rTv iv" 11- 1 T1-;i1 Tnr
t7TD:i rAT 11- 2 17;v- riA,
mAT 11- i TS0T
r-No.; 11. 4 TIWF TI1
l'.11'^ PAT 11.- 5 v,F7AA 77.
1.11?1.(u,c1
1.11,0
-1:041
77,)
c.
A.1g9
0
^,441
P,b411.119n.411
rI :1 fa 11
1.47P
1.,701
-1.1 0
11.4c11
1.071n.q4)
') .1./11
-0. 11N
04,411,111
'
1.TP1,1;9
0. 71A
1.427I.
(1 ,hrd
1.770
'"710
1,011
). 1,
2;..501
26.ti;0
102.'111.
1C1.27"
'04.'9;1
"1.11410 1.714
1P1.414
111.5r4
101.6'1
161.110
101.511
104.017
111.r( 1
1111,010
111.460
101.41.n
411,',7%
51).274
511,111F.P1,412
c11.n)cl
c11.1),)n
Wr,11)4
51".°17
51/.7.17
51g.411
11,^70
511",.i7ri
c16.1t1
491.9;
07.172C1.7.(lY1
Ip
41414.(1"
Vt.I.V1H
410,tilg
4P1,414
4;1,72hvo.ntie
41'1.113/
4r,1,144
1.1(11
47.1401.1}4r,
2n.41r
47.013.073
2r:.270
266,42
6 1,071
.%0.27A
2h.742
16,2,4V
47,461
1,071
20.27P
Pl./47
111.1r47.461
1,171
2'2.178
1C?.q:i0
10i.114
111.4h047.4(,1
1.(71
P.27826.742
102.940
*01.11"
11?1,41.n
r171.1:P1
47,4(1
70.?78
1112.046
101,111
101,4(6
561.":"
47,4A3
1.171
71.27PP.."42
"Yl?.(14
0.0,Fe"
?.1of
7.0PNh.lin
A.11;1
14.4011
1 1.
1C.161
1C.aro,
11Ar4
16,1I4
1,;.;19
1'1.7p7
/
15.544
15.')PA
15.277
15.277
R7.524R2.2145
P7.140Ah."2
15.5;
M.516g'.110
"7.42146,116
101.41")
101.414
161.0410.404101.494
161.4q4
81.220120/11
Al.015
n1,416
62.114
"2:11a
"1.21AP2.218
112.21g
'10.1 11;
g1.2C1
q0.0057".204
11.'016 179
"-,i174 177
3.156 109,nql I7W
4.184 1114
.1.21 111
9.719 lqn
J..118 111
7.179 114
4.^?,4 04n.7I6 1,01
3.2446 171 ,
1.178 148
S.r124 "1114
15.277 215
9, 7 CI PO1. ?VI 11(1
7,1711 1911
6.074 11144
15.22.7 :15
15.70.7 215
1.710. )qe
.i.;t0I 179
7.178 1"a
114
1S.277 21C
.15.717 1515.27.7 2,15
9.711 14°:
T.Z44 11°
7.174 114
6.0n 144
lr.)27215
21r,
4C.511 215
1.711 40'Q
1.244 174
7.17i PIP
1'14
Ic.121 :115
15.717 2161
1'..277 21CAc,,,in 21r,
167.'114 pr,
14.74,1 )on
111
7.474
6..624 144
15.227 215
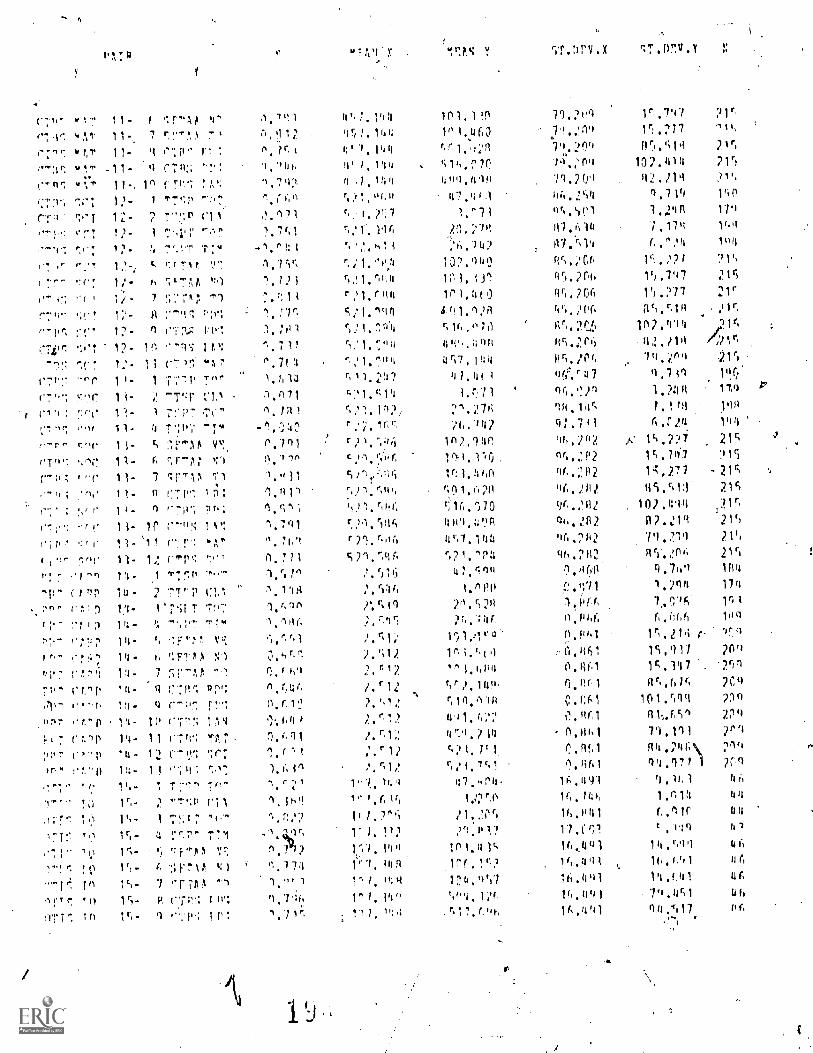
a 115:41)
4n
IhlLt
9,1
(J1.1. 3
it nu
P4 htt).1
Y4 1. 'It I,
b '1H lid
tju(
6a. tsCe. 111.11101.
ts')/
thE*31. otle 116St
NULA liT.1.9
40. W.I.
"Ile LIU:.
51Z wcalt
sce
011Thl
'AZ
hhl 11/J*9
110 1N1.1
a cat 11W1.
:Jot U11.
5t4'
UL huh.eta
Ae utYLIti
th:",1
jti 1.6cw,
.1('. auA hot hs''')
spit hLl't
u/.1
011. 1,1 Co
tAle huh"(.01
(4te
Lis....;.11
LuCJL
II
Ir
1Wvi I hu'iit
Iii fr' '
1.4441
1.1,)"Ll
NH
il
1.114'
HICU Oki
t 0
1%18'0
I.,91(10
I 9Pi 0 '111Ls 9jPi4t
ti4v.0
Zli4.411
ZUJ.kot)
74','UP v6 '96
61:"JU
e! *11,
L' Lb
,h1q46
Lh.s.v44
401.1.01
4.1.J'L ' 511
i'De",11
9111 '
e
qUe.,A
Of %At
'1!11
1,u,!*toi.
tL
Ot!'61_
.0111A'1,t, X'AJC11..
qt.')
h`t
Ili '1
'
r,n rIu:*1.11.5
,O4C1.P.1
JWI21 11(!la
lit.0.)Z T7
d ntl I L'31,
tlia 001 OLI'Jl!J
Oti 1 U t
S.OICut
U.:ft
tthS14 40'0.!
Nv.v1',1
P4'111,
't,,11
646.i:C1
tiu'ue
tif.40611
1,....;!'t
ff 't 611 't tfl
n
L
.1 v
11N '1, .4 'i.:,t
i
9'd
)
I U '1 i'
7 t '1 e.tu'e
61 fa 91:t) %
c.Cp.1.1*
(11!'J
5',
L
'..1.(2.'3 LI. 7
LL:).11.1
LC;11.,
I : 1111%, I
II 1, .1
t
..,t
I.:
tpht
ti Ip I 4. '14
11'; I I
1;1,1 1 'ill
X 111.isi
!:t1 11-
: U i h -1 t
L 4,1/
J , I
- I t A
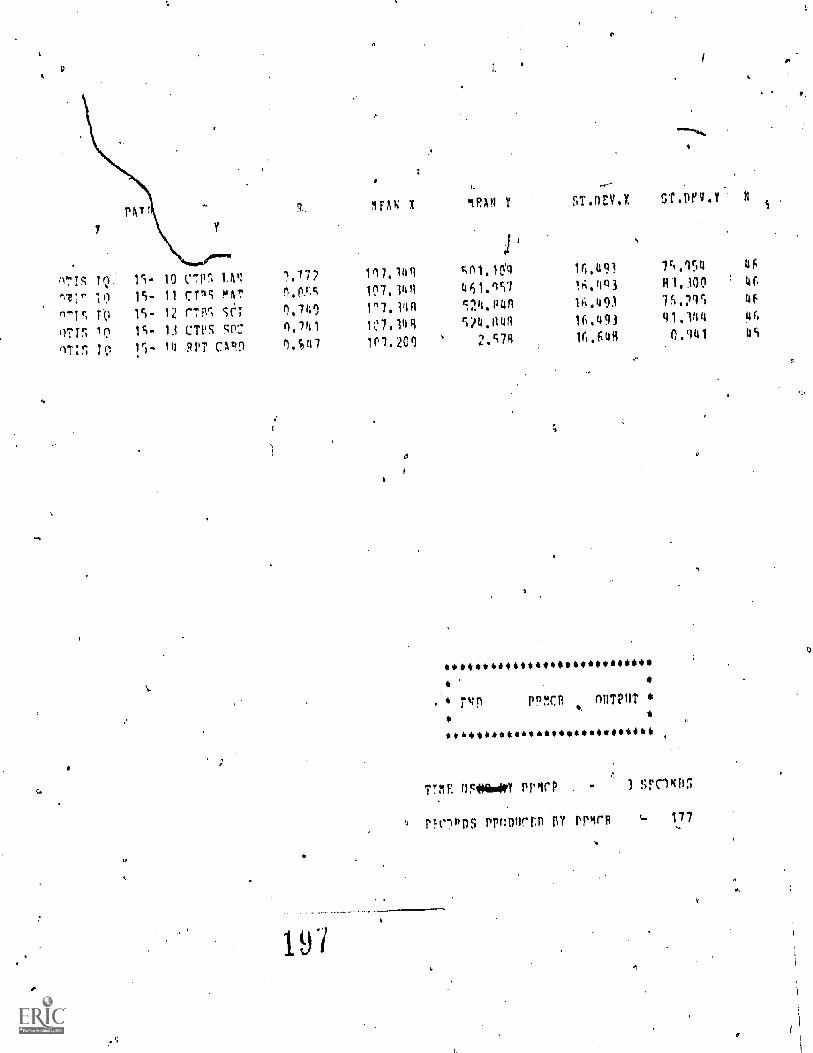
c.
7
pArr ITAN I ,iRA4 Y ST.DEVIY ST.Dry.Y
071's Tr,
nT:7 10
11- 10 c7p!', LAN
IS- 11 cl*Pc
7.772
n.RIA
1174140
1r, Pig
c01.10.g
451.nS7
16.491
1A.4q3
Y1.150
H1.309
46
4fc
mic TO IC- i ch. 0.740 117,1101 c,24.ptin 16.493 7S.29S
oiTn 10 Is- 1.1 CTPS 50: 0.741 107.149 r04.11101 16.493 91.144 4r.
1Trr1 TO 15- 14 RPT CAP.D 11'7.200 2.s7R 16.649 0.941 05
197
******t&o.stst,ott.**,$$$$$$
$
rvn PPMCP OUTPUT
**44110********61141,411k0.*#01106*
rnE 05#40110Y 17.4(1 3 SpC105
rIOPDS Pr(100Crti BY prmrp r- 177
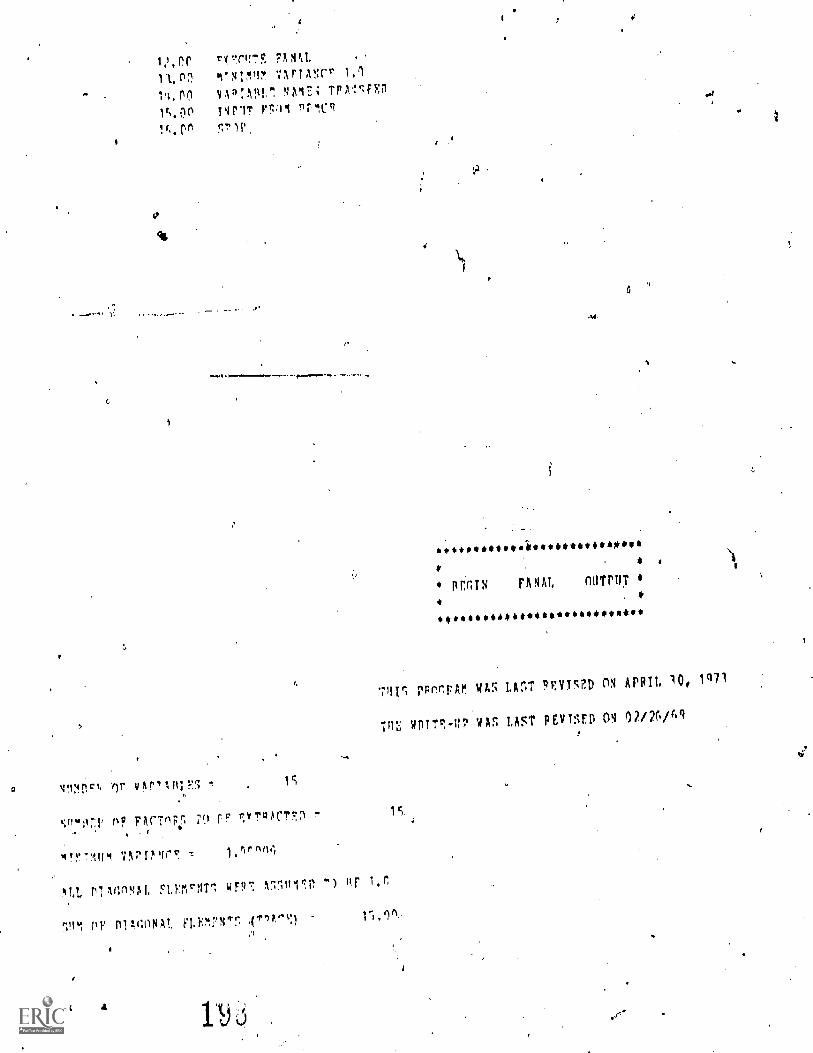
;
(0)/9//tO NO (131:1A3d 1A1 011
LLbi lIddlf NO ustAa6 101 0A Odliudd
10114,00$414*.**,410,41,*,,00lii,4**
111J1OU 'NNW XIDjd
. * .
41+444444.44.**41.10*****44.44
c
'
-
IVN011U AO
J't J11 (. 4:1!.11:;;A 1,11L3WA1
4.1Uu4Q't 14fiV.;ii,
.SL j 61 ..idu1J11,1 it)
!;:ildts.jVA ialii:11h
L.TJti ILJN1 0) '%4
eRh.:4di :2$4ti oltiV:(0di 00.w.
L'i aXa1JVit UO.11
Joael
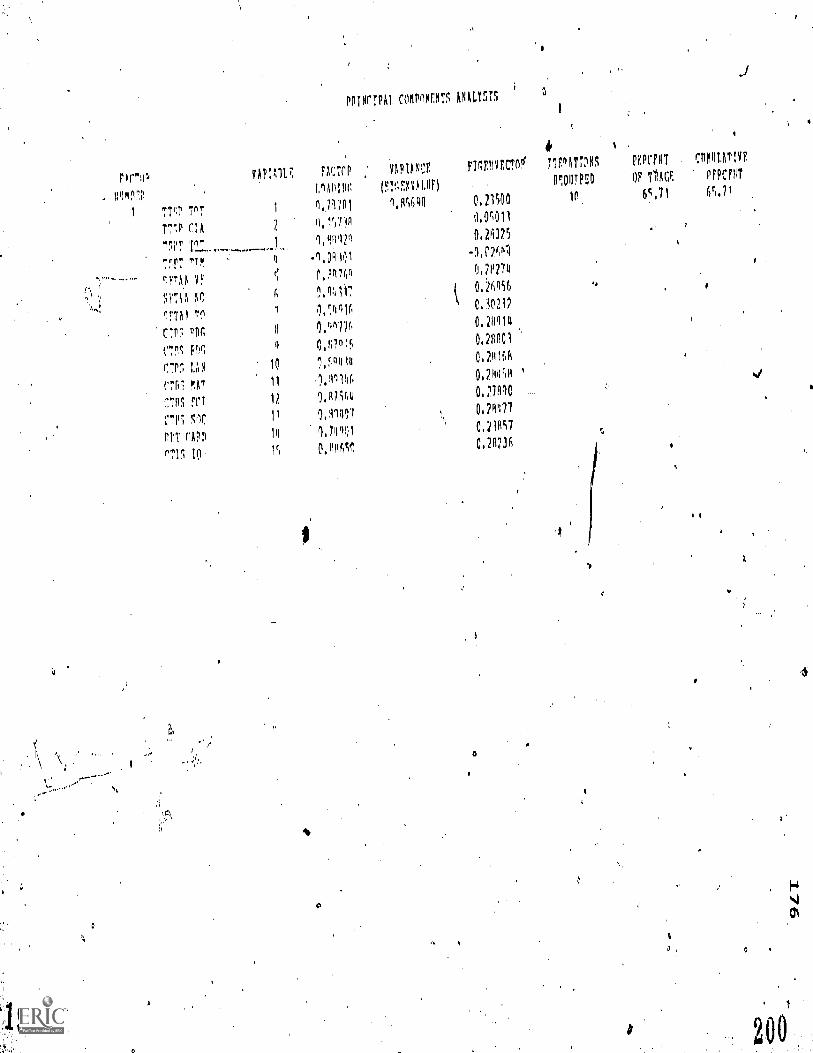
PPINCTPAI C1111(4E11'5 1.1(1,115r5
Pro VAPIAM FXTCP 1IRDNCE r7r,.7nr.CTfitc T1F^hT7N15 1T0MIT c0s111.101F
- Plmn!
1 71117 Tr'T
177,P CIA
1
2
LnADINC,
/411761
1).1'0'0
(Fif;F,N111,(1F.)
q,f1C64f1 0.219911,0411
Ar,p1119
10,
01, fto1C.F.
6c,11
prpcniT
'7rr.'0,211325
4 -1.k1 -(1,c20i1
"JTA,A VF0,2P7,14
S'r"l'IA NCA ..0,14117
0.20156
(:FTAA Tfl7 M4116 C.30212
CrI; PPC 1 0."17A0.21014
CTI1c WIq C,N711A 0,28001
C7PII LAN 10 IMO 0.2H1fifi
CTV: !A"11 .1,11146 D,2MCH
CTIIS Fr 11 1.R7;44 0,27r10
CIP1 51C 11 Iillr,7 0,71077
rrT cARN 14 1.7410 0,2111,17
MI 19C,2112.16
a
0
.4
.0
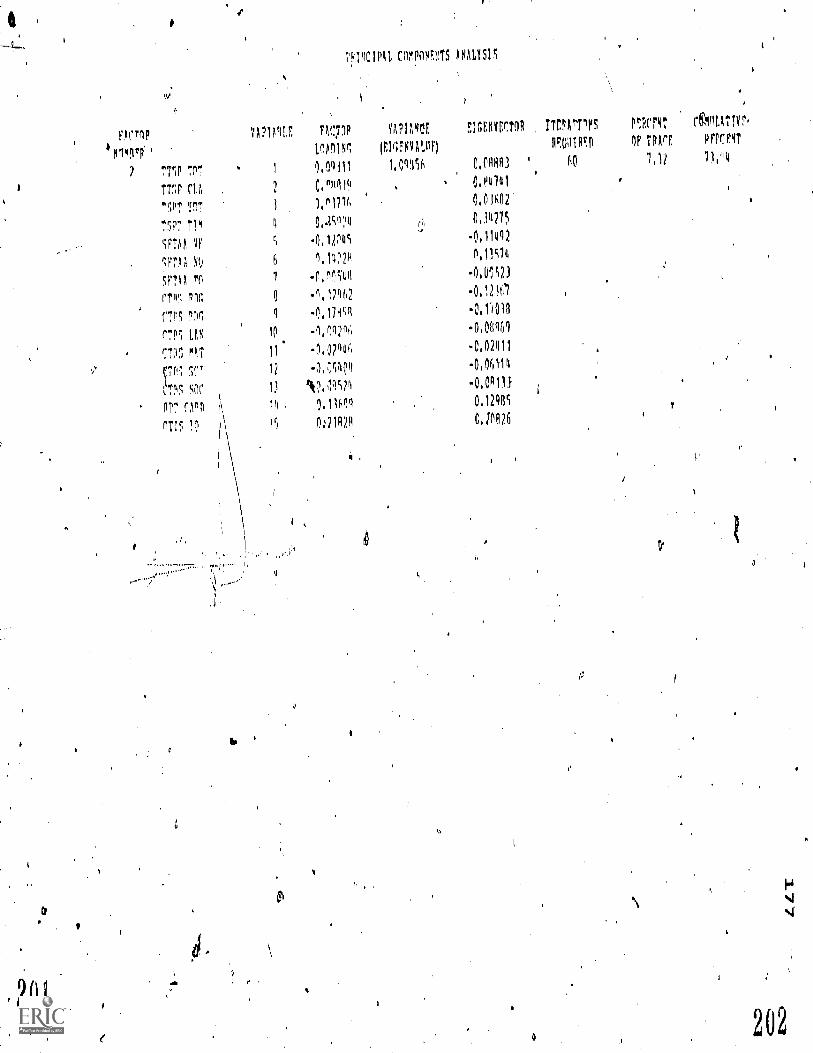
2
FlrnPrPorp' '
7 77131 70'
T711 1.1.H
7'01' TIm
SF1',1 lir
11.113t 4
SF1V l'n
rTiv; Pr.
c71.5 "F.
17PS LIN
".711,?
','P', 1r
T1+5 VIC
17-1 1,"P11
UPTV1I,F,
1
NTIC1111 MONF,11TS AN/ILYSIS
fl(377P Y(117111q/F, Ela311111C1IR ITr,31ATTIFS
1f4010,1 IF,11;FM1.113) P0;111191
1,1q111 1.0(1156 0.0/18/1.3 I 60
c,nw1111 , 0,114701
Ptwrr flouvvr,OF TRArr, PrPr PIT
'3,12 71,'Ili
,
r),^1776 0,01602 ,
110,dc0:111 0,31121,5
C .0,1)00S -0,11012
6 1.147211 0.1100
7 -0,1)^500 -0,0;S23e
0 -1.1742 -0,12 0
9-V11611 -0,141
10 -0,04)oti -0,0040
11. -0.074111. -0,071111
12 -IV:CT .0,06110
13
1ii
qt2.1;',CP1
9.11611
.0,0P1It
0,12905
.
I
15 0,,21Win cille/6?
P.
,
0
202
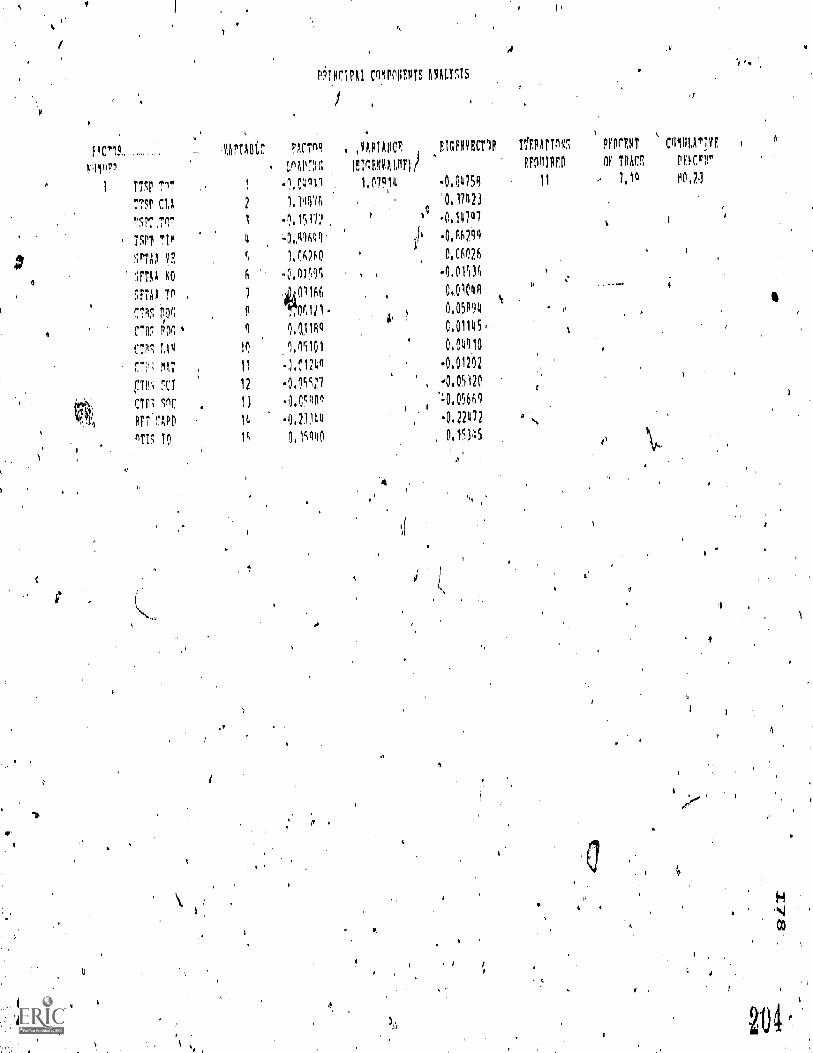
Pi+140,1PkI omr3F0T5 11141.TIS
I
a
f Irv?.WIlirP
1
4
'
..,
TTcp 711'
TT5I' OA
''',IFT.TIIT
TSPli TIP
IFIV VE
IFT NO
(ITIIS
CTIr, 19r,
CPc 1,0
r.ri, m1T
pll'4 70CT, In c
RFT CARD
OTIS TrI
tARTA01,7,
,
1
11
4
(I
7
n
9
M
11
11
13
4IC
F1cTn0
tnAlOr,
-9,0011
.r.1111,.411.11
-143f,4fr
1,r37141
i240.11611
IF,ariIil .
0,0,1 HO
.1 41'i101
-1,120-0,n9s;1
.0,05401
-0,21110
0,1'010
, ,VAP1A1CP,
lET(1,11VARF)
1,07914
,
,
1:
flIFIVECTIR
4,04759
740,123
1121 6
-0,0153f,
0,01001
0,01145,
0,04910
0,012'02
:0,0560-0.22472
, 0,15145
IfF,PqrnR1
RF011111E0
11
1,
PFPCF,NT
I TRACE
, 7,10
0,
/
CP1111,14TIVF.
1,11,Crr
00,21
1
II
s 1
203';
A
201"
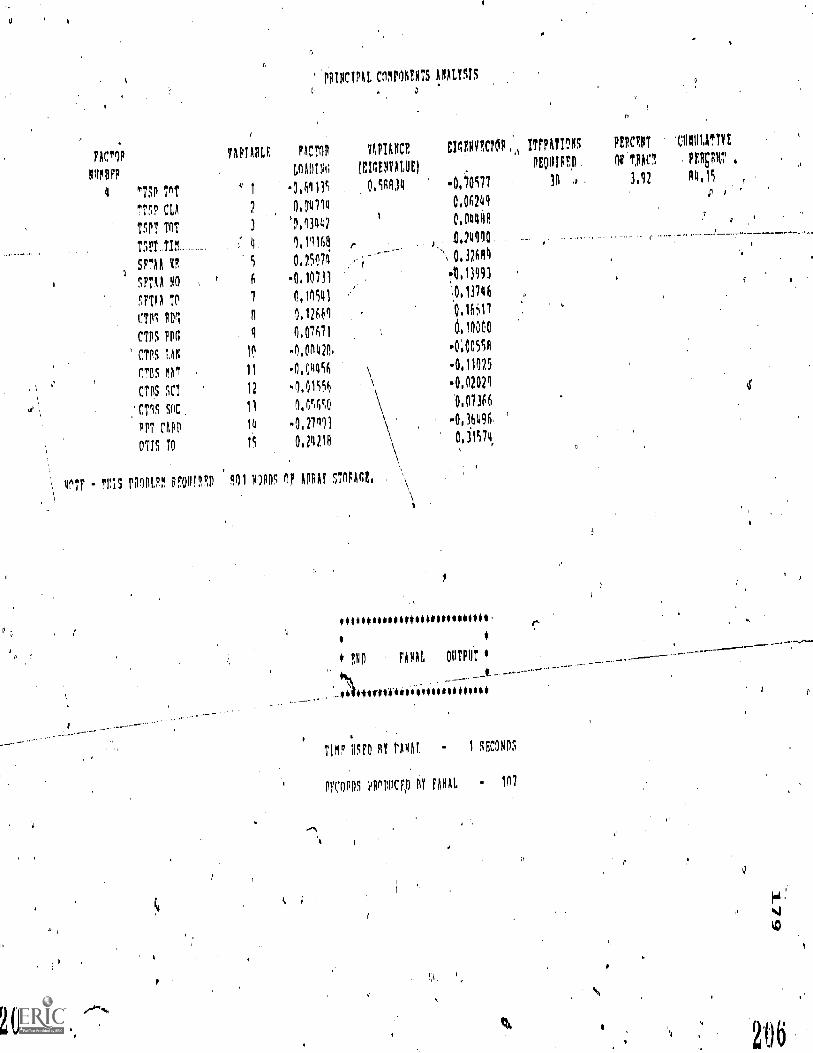
PRINCIPAL CO3PONTS RIMS
?AMP YAPIABIA nCTOR
111R0P?
viotA110E C1flSYn?611: TlitphTV.15 PERcr
ff:MENYALUCIREQuip!.0 Or r,11A1 PFRpr
'731 TT 1 -0,64115
TTSP CU 2 0.74214
TSPT TOT 3 0,13447
1,19160 rSFTU 5 0,25Mi
SPTig YO 6 .10231
Sry 7 0,10543
CTR1 POI 1,17661
CIS P1 q 0,07621
CTPS 1.48 16 -0,061128.
.CTBS. MIT 11 4,04456
CTRS SC! 12 -0.01556
:CTRS SoC, 11 1.656`.0
PPT COD 14 -0,22111
OTIS TO 15 0,74210
Trs pRopm inn1111 101 v7105 APF4f sTnPAnt,
n
205
0.5Rf134 -0,50577 31 3,12 14,15
0.062411) 0
00 24910,
.
\ .11604
71),13993
1,13246
0,16...112
0.10000
- 0;005511
- 0,11125
-0,0202q
0.07366
-0, 36496
0,3i5711,
***************************, f:*
* F.1111 F041, OUTPUT
..._:1*****fio**********
TIMP IMO BY PPM - 1 sgcups
ProRDS plIPRI1CF,0 117 ?PK - 102
1;4
.)
if
206
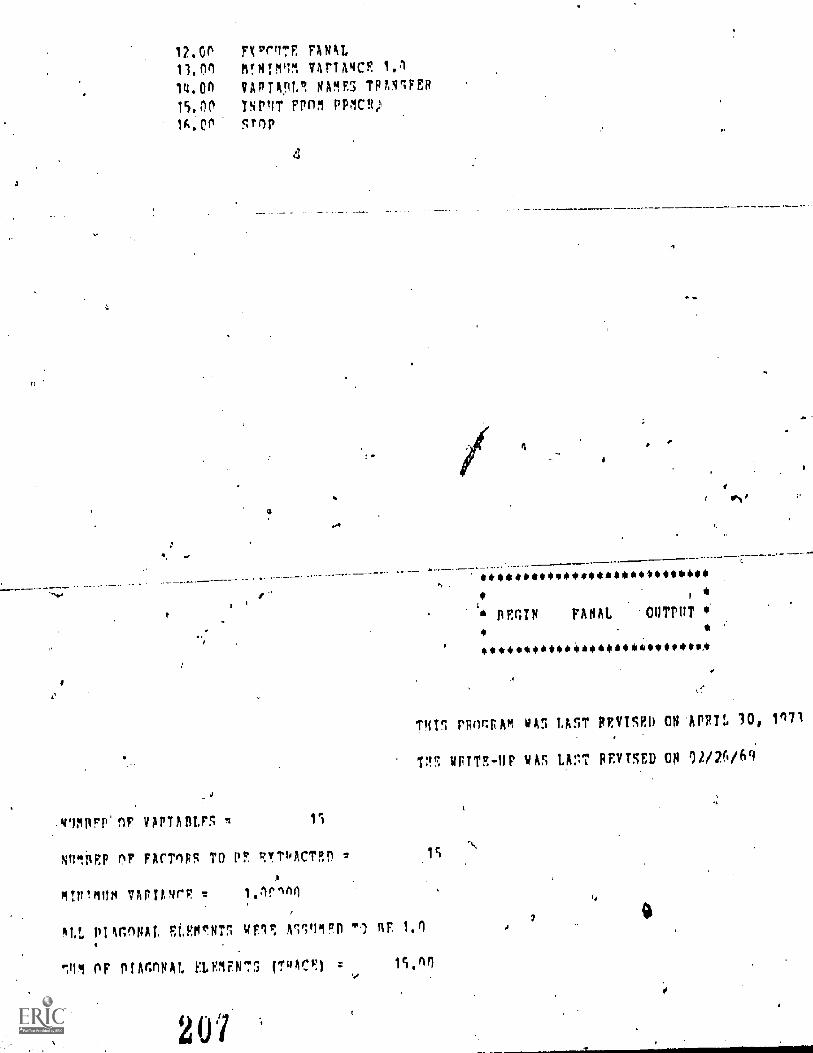
IMP FX7r4TE Fwt11.nl mrAi!mT1 vArtagcr 1,1
14.00 VARTIOL1 SA4ES TPAN1FER
15,00 INP4T !WM PP1M1A.00 srOP
Immtirp'nF VAPTARLFS n 15
N41PEP nr FACTOP5 TO P? YTlACTP 2
A
VAP!t4rF 1.1r140
4104111110001101.******4$4414****
*
MIN FINAL OUTPUT i
****************************
TIM PPor:FAM wArk LAST REVIIRD ON APRIL 30, 1171
WPTTR-UP VAS LAr.T REVISED ON 02/26/69'
'LL P11nnNAL ELEMrNTI n RE 1,(1
144 0F ritAnnNAL ELEIFN71 (1.4"C$1 15,11
lj
1
APPENDIX N
DISCUSSION OF ADDITIONAL FINDINGS
0
208
_
181
182
Discussion of Additional Findings
Tn conjunction with the science supervisor and adhering to strict
rules of confidentiality, two hundred, fifteen fifth grade students of
the Lewisburg Area School System were wided and scores of their_
perfqrmance on fi.fteen variables were recorded,on a data matrix. Data
were transferred to EDP cards and processed at.the Computer Center of
The Pennsylvania State University usingythe Pearson product-moment
correlation and the Factor Analysis of the Statistical Package Program.
Variables included: (1) the total score of the Television Test of
Science Processes, (2) scores of those questions within the TTSP
identified by Tannenbaum as classification questions,. (3) the total
score of The Science Process Test, (4) the:time in minutes required by
the students to, take The Science'Process Test,,(5) the verbal score of,
a
the Short Form Test of Academic Aptitude(SFTAA), (6) the non-verbal
score of the SFTAA, (7) the weighted tot4 score of the SFTAA,'
(8) .the readipg vocabulary acote of the COmprehensive Test of Basic
Skills (CTBS), (9) the reading comprehensiln score of the CTBS,
(10) the weighted language total score of the CTBS, (11) the math
score of the bTBS, (12) the science score of the CTBS, (13) the
social studies score of the CTBS, (14) the scienree grade on the mid-
year report card given on a continuum of 0 through 4, and (15) the
Otis-Lenon I.Q. score recorded for those of the validity population
who attended school in grade four in the Lewisburg Arca School
District.-
209
183
'A summary of the Pearaon product-moment correlation of the.
fifteen variables is sbown in Table. 11 in Chaptgr 4. %The-correl4tioni;
of the TTSP total-*Ore"With all'the variables, excepting variables
,
2 ind 4, were moderately to highly cOrrelated and were significant at
1,
, 1
the one percent level. The low cokkalltion between the TTSP and
variable 2, the identified classification questions on the TTSP,
could be explained by the small number of luestions (four) identified
as classification. The low correlation between the TTSP and
variable 4, the time in minutes required to take The Science Process
Test, waa-eic oes not correlate with any of :the
variables. A low negative correlation is the Oharacteristic pattern
4for performance time with measures of.achievement (Roberts, 1967).
A summary of the factor analysis shows that all variables except
1
2 and 4 have high factor lOadings on FaCtor 1. In additionc Factors.
/-2 and 4 are defined by one variable only and the variablea.that define
Factors 2 and 4 are different. 'TherefOre, it appears ttiat all the
variables assess one strong'general.factor. Table 12 ehows A summary
of tfie principle component analysis for Factor 1. The complete
computer printout for the PPMCR and the Final Program is shown in
Appendix M. Factor 1 accounts for 65.71 percent of the variance.
, This was similar to what was found in the work by Tannenbaum (1968) and
Ludeman (1974).
Tannenbaum, in searching for the uniqueness of his subscores,
subjected his data to a factor analysis'of the matrix of inter-
correlations of his suhscores. He states:
2 i 0
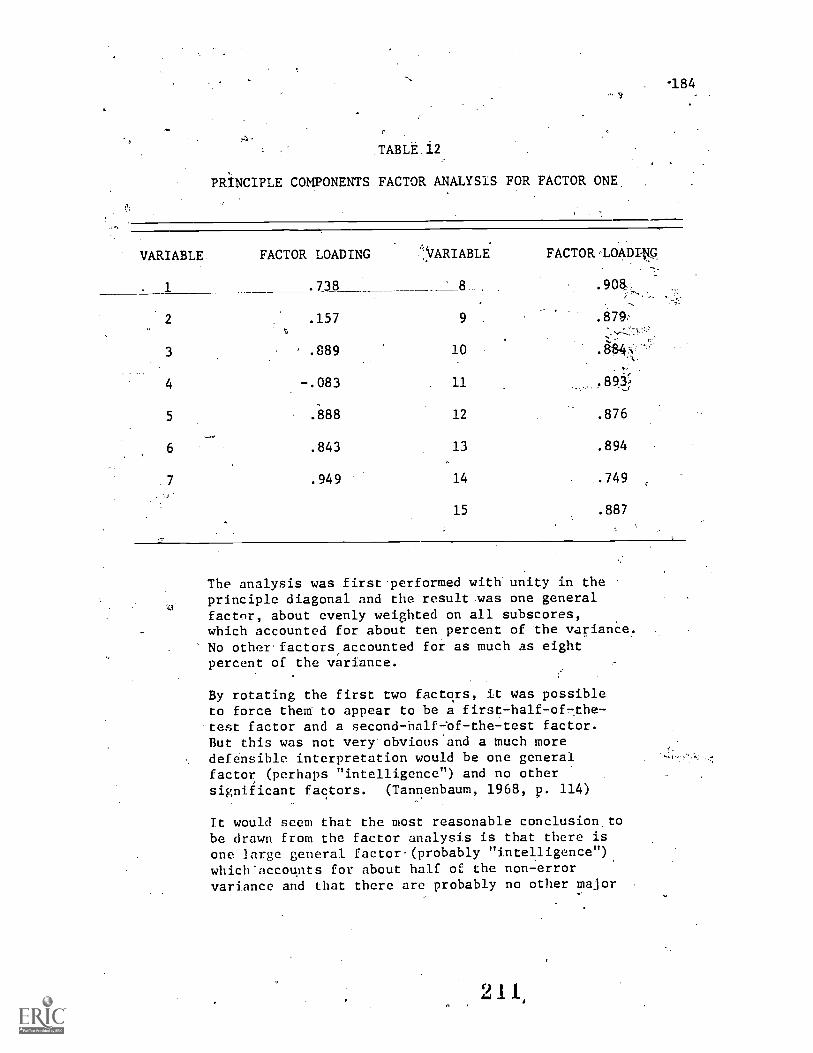
ss.
TABLE712
PRiNCIPLE COMPONENTS FACTOR ANALYSIS FOR FACTOR ONE
'184
VARIABLE
. 1
FACTOR LOADING
.738
ARIABLE
8.
FACTOR,LOADING
2 .157 9 .879.-
.,--,,.
3 ' .889 10 .tr.84,'..k.
., .
4 -.083 . 11
5 :888 12 .876
6 .843 13 .894
7 .949 14 .749
15 .887
The analysis was first.performed with unity in theprinciple diagonal and the result-was one generalfactor, about evenly weishted on all subscores,which accounted for about ten percent of the variance.No other.factors accounted for as much as eightpercent of the variance.
By rotating the first two factors, it was possibleto force them- to appear to be a first-half-of7the--test factor and a second-half=of-the-test factor.But this was not very'obvious'and a much moredefensible interpretation would be one generalfactor (perhaps "intelligence") and no othersignificant factors. (Tannenbaum, 1968, p. 114)
It would seem that the most reasonable conclusion_tobe drawn from the factor analysis is that there isone large general factor-(probably "intelligence"),which'accounts for about half of the non-errorvariance and that there are probably no other major
185
factors which involve more than one of the sub-
scores. This leaves about fifty percent of the
non-error variance to be accounted for by the
individual subscores. (Tannenbaum, 1968, p. 117)
Tannenbaum urges caution in the use of subscotes due to their low
reliabilities.
The date of Ludeman (1974) did not permit rejection of the null
.form of his hypothesis that the Integrated Process which a given test
item assesses will be indicated by the students' scores on the item
having a significantly higher correlation with their scores.on that
Integrated Process subtest than on any other subtest on the
Individual Competency Measures. In his discussion, Ludeman concluded:
To elucidate the absence of significant differences
among the TSPT item -- Individual Competency Measures
subscale correlations, the intercorrelation among the
Integrated Processes subscales of the IndividualCompetency Measures were calculated. A t test of
significance of differences indicated no significant
differences at the .01 level. Thus, it can be
argued that they are all measuring similar abilities
and so, it would be very hard to find a test item '
that would correlate significantly higher with one
subtest than with another. (Ludeman, 1974, pp. 60-61)
Factor 1 acceiunts for 65.71 percent of the trace on the Principle
Component Analysis. It could be inferred that approximately two-thirds
of the variance of the measures of science processes can be accounted
for by intelligence, reading ability, 'general achievement, etc.
Possibly the characteristic being assessed 'in science process tests
simply reflects general problem solving ability. Also, the unique
skills and abilities identified as the,processes 9f observing, com-
Aparing, measuring, etc. are not totally unique or mutually exclusive.
2 2
186.
While there is much agreement on the need for the benefit from
including within the teaching-learning process activities which utilize
those skills and abilities attributed to scientists and tIle scientific
method which collectively are called sciencedprocesses, a conclusion
can be drawn that there is no unified definition or enumeration of
those separate and semantically idedttfiable processes. Also, the
validity of a test instrument designed to measure a students
performance in his ability to use those processes must, in the absence
of-an empirically unique characteristic or cognitive function, rely
heavily on face or.content validity. A measure of the unique process
ability or characteristic rests to a large degree on inferences derived
empirically from data which suggests performance 6n characteristics
which are similar and generalizable within the perimeters of an
accepted definition..74
In an effort to isolate the unique ability or characteristic,
the data generated from the validity study was further examined. Of
-the fifteen variables summarized in Table 11, variables 2, 4,,7, 10,
and 15 were eliminated from. the data. Variables 2 (TTSP classificatiOn
scere) 4 (TSPT time), 7 (SFTAA total score), and 10.(CTBS language
total score) were dependent scores; that is, thege variables are the
weighted sum of Other variables, and eliminated from the data.
, Variable 15 (Otis-Lenon T.Q.) was eliminated because of the small
nuMber of data points in the'sample.
Pearson product-moment intercorrelations were computed, fonall
variables and'then factor analyzed using tile principal CompOnentS
213 u
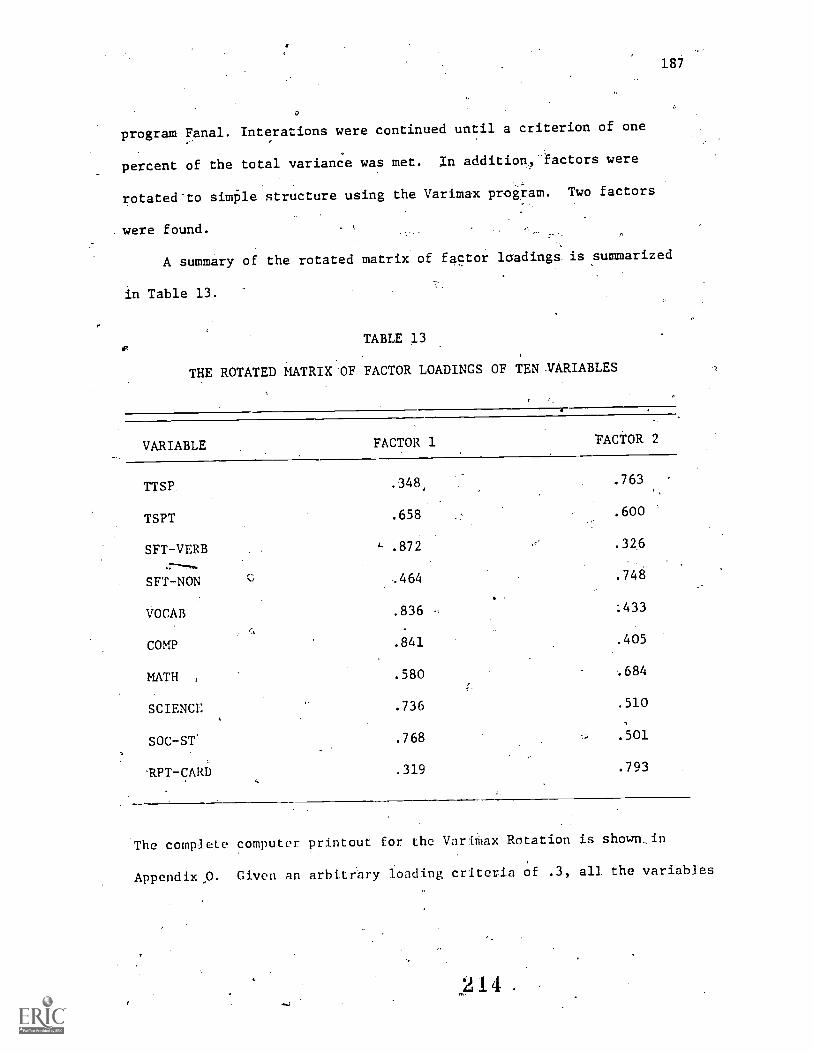
187
C
0
program Fanal. Interations were continued until a criterion of one
percent of the total variance was met. In addition, factors were
rotated-to simPle structure using the Varimax.program. Two factors
were found.
A summary of the rotated matrix of factor loadings is summarized
in Table 13.
TABLE 13
THE ROTATED MATRIX OF FACTOR LOADINGS OF TEN-VARIABLES
VARIABLE FACTOR 1 FACTOR 2
TTSP .348, .763
TSPT .658 .600
SFT-VERB 4- .872 .326
SFT-NON ,464 .748
VOCAB .836 - 433
COMP .841 .405
MATH ,.580 .684
SCIENCE .736 .510
SOC-ST. .768 :501
.RPT-CARD .319 .793
The complete computer printout for the VariMax Rotation is shown,in
Appendix,O. Given an arbitrary loading criteria of .3, all the variables
188
load significantly on both fattors. However,ehe data shows the
variables grouping more heavily on Factor 1 are ehe SFTAA verbal
score,' the CTBS reading vocabulaiy score, and the CTBS readingtj,
comprehension score. Those variables grouping more heavily on0
.Factor 2 are the TTSP and the science grade on the mid-year report.
card. The Television Test of Science Processes, while moderately to
highly correlated with all the independent variables; is most highly
4
°correlated on the factor rotation/v/1th report card grades. If those
characteristics identified, measured, and recorded on course gradeway
report cards reflect student proficiency in the science processes to
some deiee, it then must be inferred that the high correlation of
the TTSP to these report card grades is a strong statement of
criterion-related validity of the instrument. A conclusion can be
inferred'from the data that the Televjsion Test of Science Processes
is a statistically reliable and valid instrument to assess achievement"
is the science processes for students in grades five and six.
2 15
7,
p.
184
APPENDIX 0
COMPUTER PRINTOUT OF THE STATISTICAL PACKAGE
PROGRAM OF THE VALIDITY,SAMPLE ON TEN SELECTED VARIABLES
216
'0
0 'HIVII:edh03-VIPOUA=S'NON-LA:00dJA-wAs-'.,ILLACd1.4;4 t''.34v14 2.101LVF. (0.110410'W'tigke'fAzWu.1.4'Xi'ek4'XL) 1110JU
I
LIZ
V,id utIJ Unt
'AWL) V4111 'ILL IL
nuOtiOUGLLOJLEtin.LLL:040.41lvZlatoZUZZLO
IUJEWALLLILPM96L9LOMIMalliv'tiOLVSaCO.; 400W.119Livi.9I3.7Widty..10.1 Sr.a.u0
CO:ILCAIVJud..b6Lli.;hilltl'AO.EULtiaC44?IL,J
tit,LA311.191.1CY5090.1%)le L I OWiik,'ILLILOU'LauJ
kuUlL'AuNXIILZW.14113i.V1.1.4e4OILLor0thr.) kwoli.041.9:M.9ZULL15:L:11.1.,LLIA.6411evigula.63
j.1LiI \i.re
v"I
qa3-4.duziel.;-)0J6N,li T110/1411A
k I
1
:,:i%).114414.k
.4.411t1. 0/1 kiJi Ake :,/11.4u Uc 4Y .id.2111
;
1IiU 11.40...01S M.1311 434 ailiViliA% ::::1CD
AV I,klua Zulb dI
****************************
111 4
Lfld
***S*44***************
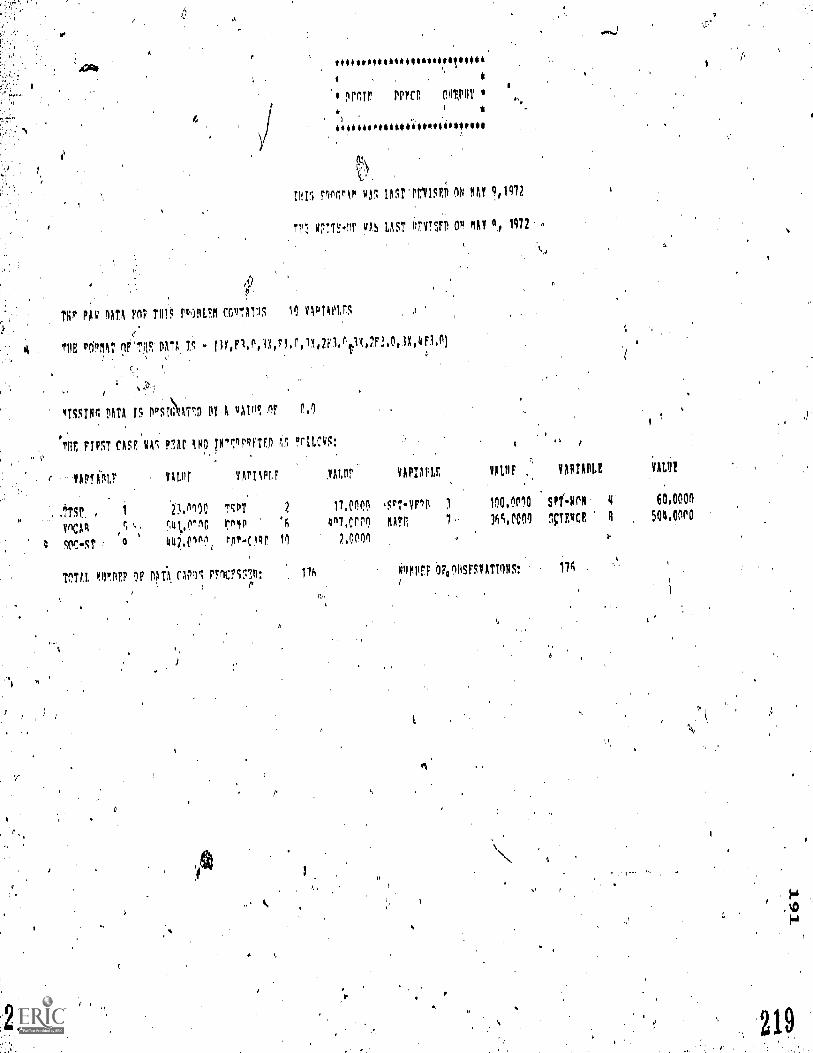
$1400411104i44044AiliiittillOilk
'9 mr POPO! 041PUT
4.0,4044,1%04440tosiulitur
T411 110(1,0 4A5 lorwils6 IN OM' 0,1472
111.7: 41TH-or 0AS LAST 011(TVT OP PAT 04 1972 ,
P.
THP Phu OATA Fri; ?HIS NOVO COITA115 10 VP1A11,171
TOE rOMAT Of'TOE DATA 1.1 11Y,F1.0,1X,r1,r,11,170,01,1X,2F2.0,3X,4F1.11),
4T5SIN0, DATA 15 110.STNE'71) DT A 0000, or 0 1
TOE F1P5T CASE 141 P7,Ar INTE0PRFTE1 !r1LC45: e 1
110!01.7 yam vArniv ynor VAPIAPLE VALIIF YAW)?
1 23.0100 T50T 2 17,t1 'TVF ni mom sPf.o. 4- moon
qt,r10 ?..rilp '6 407,0000 KATO 7 1454001 IcTE4CE R 504,00P0
50C-ST 0 447.0100, rot-c,01 11 7.0101
TOTAL MIT OF PAT.A. (11115 FlocF55!0: 176 4oMPEF 001O5FRYAT1ON5: 174 .
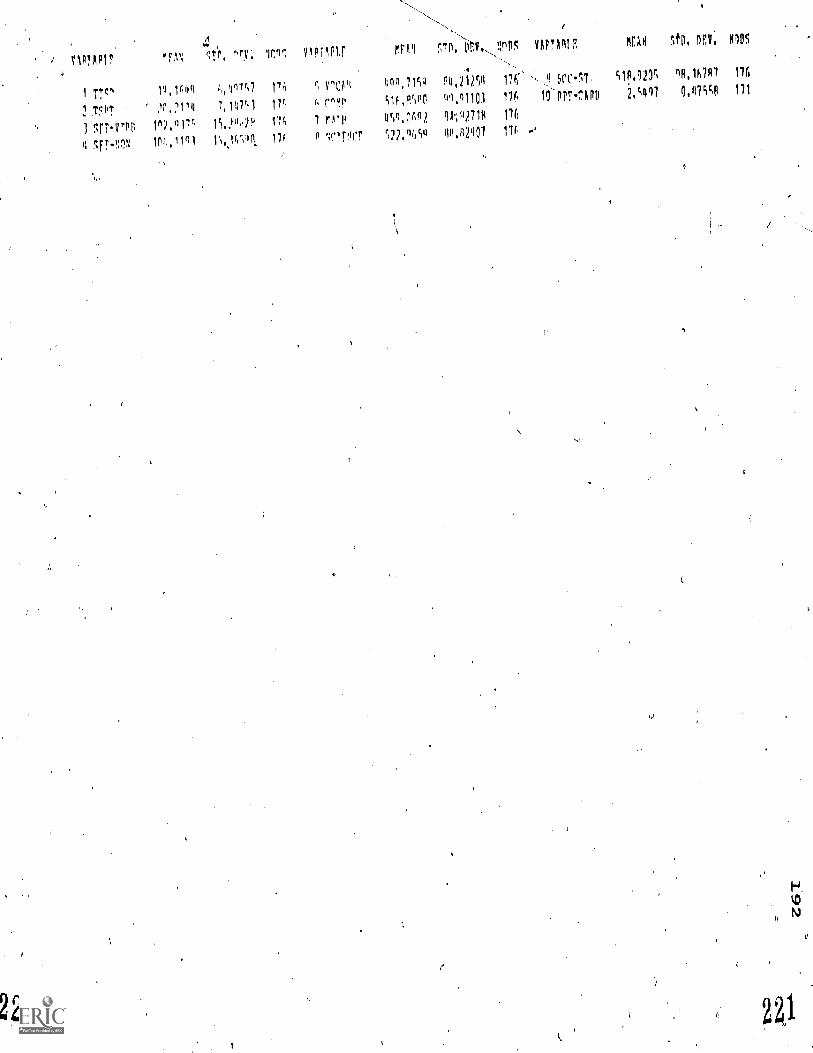
viPTAPIr
1 TT"
2 .170T
]'517-1/r0V
4 S,FT-V)N
",FAN 0:P. 011: VI ylpnpu rIV TD'',, gV., NnPS IVAN? , mNo sfp, nrv, ros
,
11,1m yinvo 11; c lipm 410,71cici q4,212y1 17F,''. M SVC-1T. 12c 41,16707 176
i
.10,?114 7,1411 17' ', c^,11.16,11')00. 01.'11103 176 10'110T-Cla 2,c107 0.0754 171
ift?.017c 15,)04P 17 1 rrv licn,(1012 (11.;1127114 176
1P4.11n1 lt,101 176 0 ':("Ticr ',22,'W 110.02907 176 ..''
241
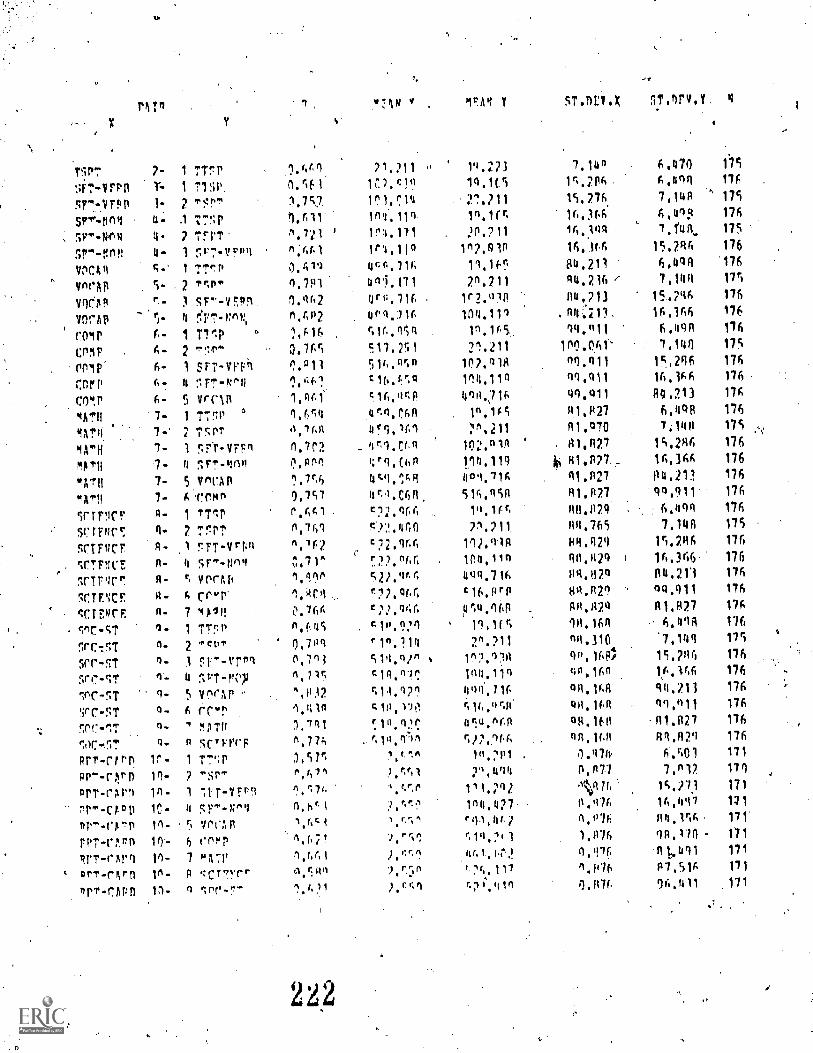
1
P4T1
7- 1 TT"P
,m!FIR
21, 211
Irv? V
CI 1q.7.71
ST.nrY.X
7.10
STOPV,Y.
A,470
4
175
47-VrP11 Y. 1 -1iP %If I ),"° 14.1(5 1,2116 6,490 17F.
Sr7.VTPDspr-Nnq
I-
1"
2
1 77cP
7.7c7.
1.r,11
IP 1. rlfl
104, 111
..21111.1(r.
15,276, 7,14/1
6,t14.!t
175
176
Ir"-V4 4- 7 TrIll 1.7p 11'1.171 20,211 7,ftia. 175
5r"-tfoN 4- 'I 5r7-VPP4 m;(4.1 Ir1.110 112,R1P 16.1tA 15,796 176
1/0CA4 c- 1 re to ).41q 414.716 11,1fol 84.211 6,4P0 '176
ynelip 5 2 TrJP" n.791 4ni.I71 21.211 $14.216 714P 175
3 Sf"-Ve4B 1.162 4();.7I(. 1r2.q1B 94.713 15,746 176
Ynr1111 4 ,*:1--n n.012 04./16 104,111 16.366 176
COMP F- 1 MI' °for.414 11,1(5 49.411 6,440 116
cnIP A. 2 0.711S c11.2+! 21.211 1n0461' 7.149 175
on1P. 6- 1 SFT-V11.1 1?.n11 i11,."01 107.118 49.411 15,296 176
CnrP A. 4 IFT-kNi 1.(4"! z1( .frol 114.11B 44.411 16.3(4 1/6
COMP 6- 5 VMS 1.44 c16.4cP 41B.:716 4%411 R0.213 174
4ATH 7- 1 T7qP ° 1.6r01 11"1.PAR 10,1f5 41.H27 6.114R 176
7. 7 TcPT 4r9.161 ".211 01.470 7:140 175
MA"H 1. 1 qrr-Vrp4 0.7C2. -4r1.Crq 102.nlg H1.A27' 15.246 176
WrA 7. 4 If.r.n (I.W? V9.001 !14.119 16.366 176
vATH 7. 5 vmrAll 4k9.1A9 4°4.11A 41.$127 94,211 176
op.!! 7. Avrmt, 0,,c7 514,115n 111.P27 q0,911' 176
IrtrICF P. 1 TT1P r.4A1 "2.'101 11.10; 94.1124 6004 176
sCrWr, 4. 7 Tqv7 n.761 1.4f10 21.211 44.765 7,140 175
SCTFITF 4. 1 r.FT-Vrtm 11F2 c22.96ri 111,'1111 H4.429 15.786 176
;c171ICE A- 4 1P4,1in 9A.H29 1 16.366. 176
ICTFW7 R. vorAi4 1.11P C2).41;6 4q4.7% 811.670 P4,211 176
5CTENC! g. crvp t16.prp 8$1,4211 n4.P11 176
cm4CE fl 7 4A/11 i\76r.c2).046 epg,169 111,R27 176
ciric-CT 1- 1 TTf:1` A.OIS c10.9,/11 18,161 6.41R 176
nrc-,5T 0. 2 -cy, 0,709 r1°.114 2%211 14.310 7.1411 175
50C-5Tscc-qT
4-
4-
1 F1--1T44
4 nrT-N,y
n,7n)
1.71C
Slq.q/n
c11.1)1
1".11A1114.11n
B11.1(41,
4;116015.2116
ir,6
176
176
InC-ST q- 5 VelcAP '0132 1;11.121 44(1,71F 411,1U1 44,211 176
VC-5T 0. A 1.414 ;1P,W c14.4"41 4A,IF4 419.n11 176
TC-1T 1. ' mATB 1,1111 4r..Q.A(11 411.160 111,1127 176
0. 0 sul4rF f%77; ClQ.1)1 no, R107q 176
1117-cfPn 1r- 3.57'1-f 6,c01 171
pr--cri) 11- 2 'sr"' p.01 ),r,ro 21004 n4(177 7,412 17r)
ITT-rArl 1n- I tr-VFP9107r, ic.27.1 171
71"-ctoti 1C- 4 cr-g^q n.ht1 )."1 in4.427 n.H7A M.W17 171
11- C MAP A.ALi 1.rro 84,11;6 111'
rPT-rrn 10- 6 cPmP 1.6;1 r."01.201 1,076 171
IWT-"Arl 10- 7 mA71'H41.1P,) 0.47f) nt,bql 171
prr-ckrn
orr-rlpn
11-
11.
P .:CT"vrr
4
o.roo
1,Y1
i.r5°
i."1(1.11/
r.;i.ton
%ICU,
;LBW.
117 ,51A
96411171
171

S.
rr r!tNAI
vvIlAntlIMITA91,7. MAIFS TPhNn!FP
MIr:111" VIETP1C". 1.0
FP1M trICT'
2
$4,064,0$$$$$Salotol'alaiko$64116.0
rrown OPTPUT *
a
4/ialattalliaaa.ccaawirtiak*14$0*
1TrY fl PY rrc 1 SPCONDS
axon's pprINCFP PY PPMtP - 102
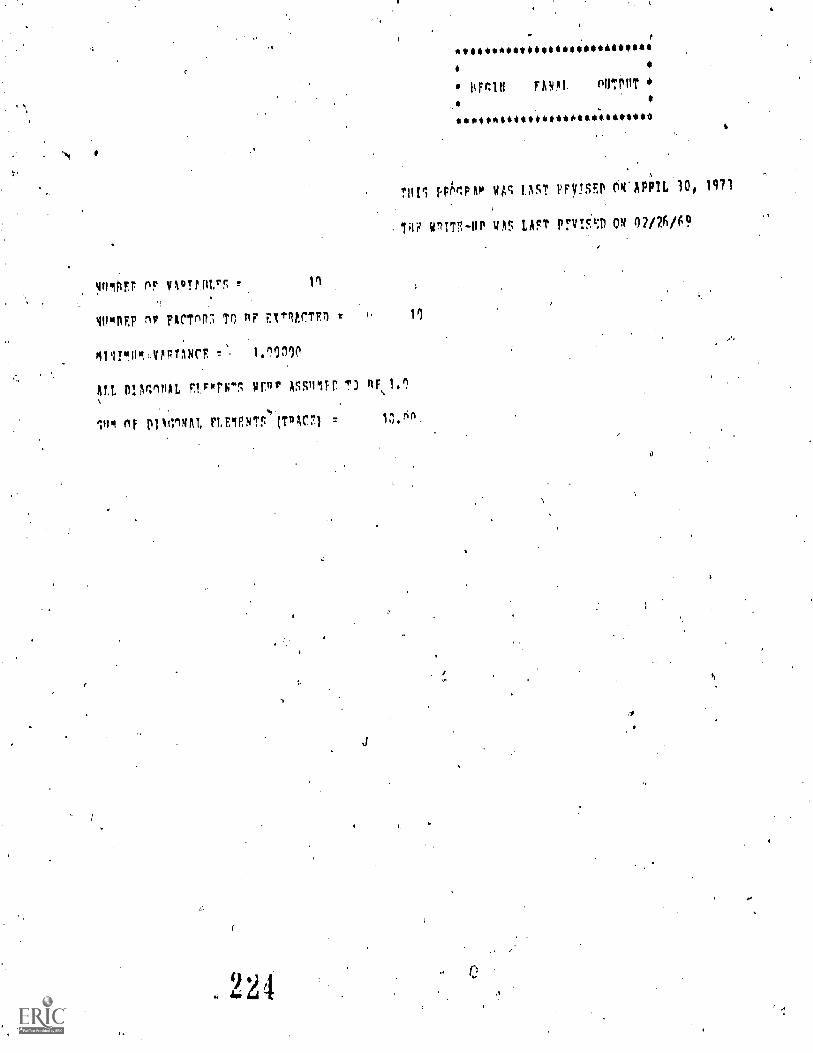
69/9M0 KO crell4;11 lal 1t tIIJ1 IL '
1.1.61 'OE lIddtN0 Jni4.441 ISV1 fit oWd:414
***********0************400*
*
ladau LY Uli
41,0491190001100WWW0100$4MS4*
LAGI) :;101,21.1 VINOAN 4U Iva
di141155Y 4din S.A1,1414 1Y114:Wal
OLUW1 SAViditowuldNIW
du pi IAVIJVA 4t1 aUwah
1;41U4icAA 1i4611A
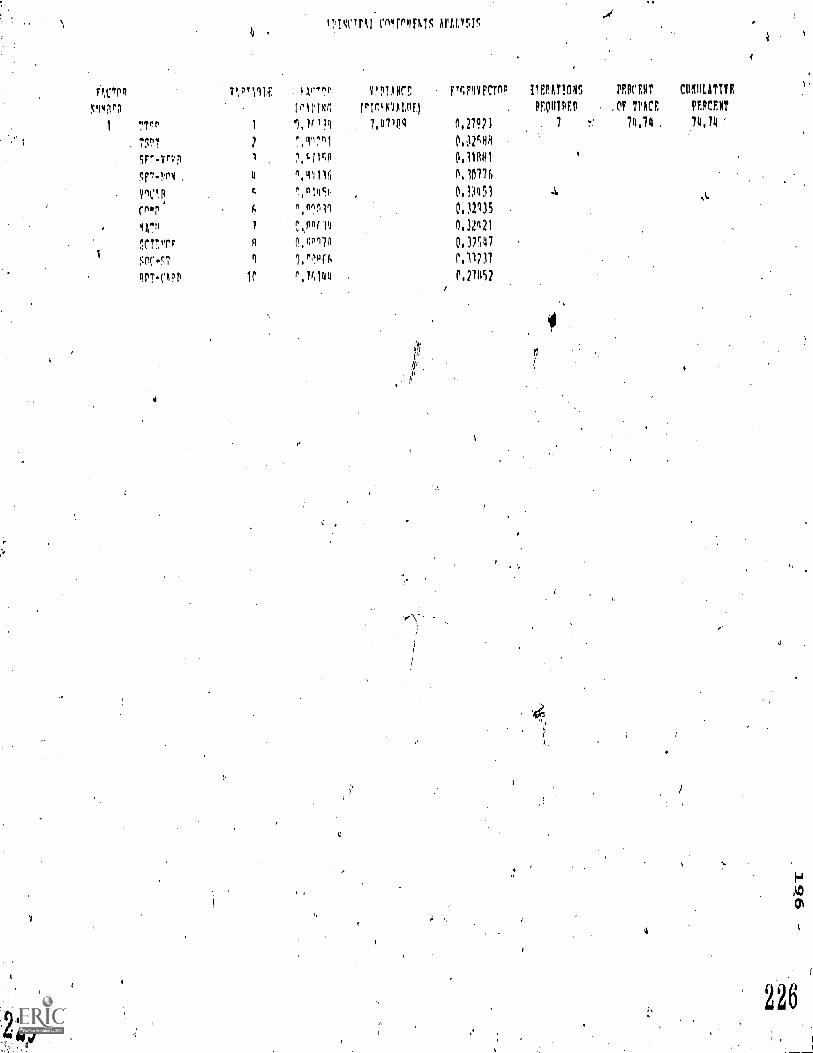
r.it04711'01rPHRIS AVALYSIf,
M'fr la
Nimrp
v;prilif '. !.:11-rno
Irviv,
vHli ANC!:
moNVALOE)
, FT,FINFC'TnF
,
IIPATIONS
IIQUIPED
PER('ENT
,OF TPACE
4
CONOUTTIE
PEPCENT
1 Trr1 1,1,1?0 7,47W 1,27923 . 7 74,74
. 7SPT 2 ",1q7n1 0c:124A
SFT.yr;:p 1 :,,Wro .0,11081
SFT-r4 , 4 1,0'1116 0,1017f,
VIC10 c P,,olticj, 0,1,1115) 4, .,,fn"r 6 n,04,!)11 0.32135
r.11n(14 0,3202i
1
rxT7,T7
SCC.f,T
li
')
n,(10170
1,44,0.32547
001231
PriCM 1(1 %MVO 0,21052
4
226
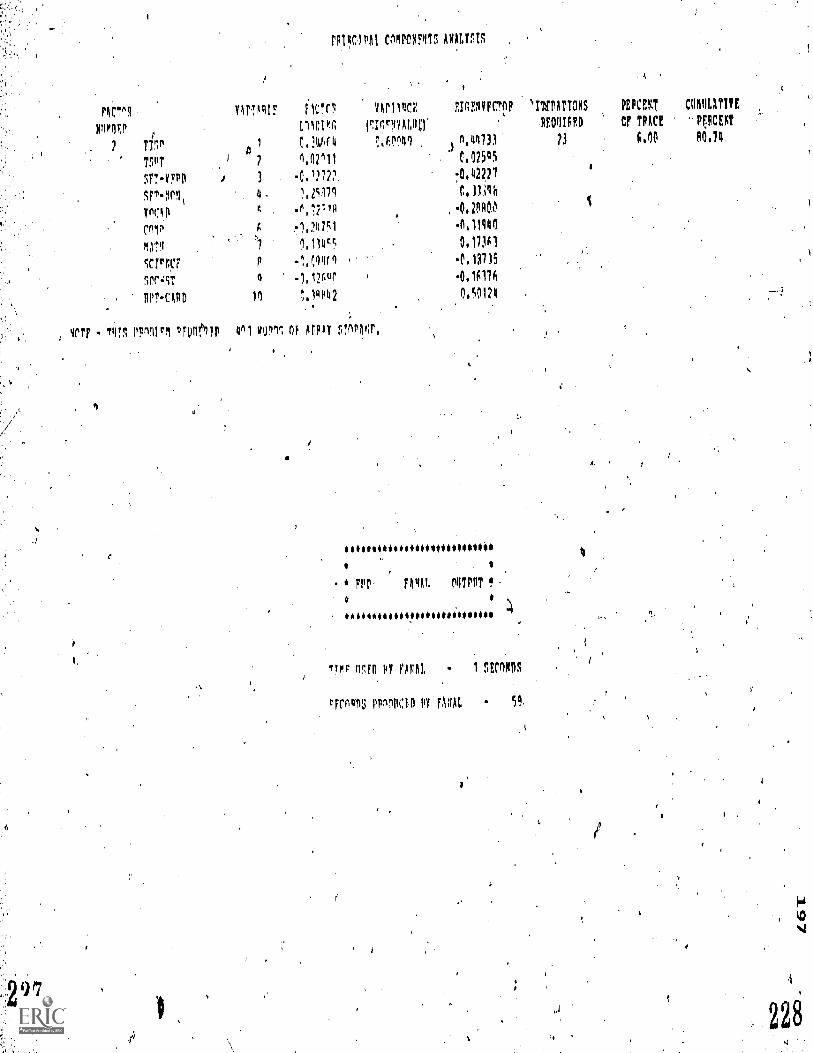
FFIrIPAI CPIPONPIT5 APAIMIS .
P4CT1 Y417Pqr nt,!".eS TANAIICE FinEoFFCT 'INPATIONS PEPM COMEAME
rmIN rt-rIfIVALINT113PDFP
MOUIPFD CF TPACE -PTENT
2 TTIP 1 I:, V;(4 MnnIll n,44731 n 6.00 POOP.
TPT 2 M2111.)
C,02545I
'.1'7-17Pp I 3 -CM.72:,', 70.422.21
5FT-Vcli 4 , %22,1
vocAPit .r,12.00
%
CnnA;;
1.24'61
, -0,2PACO
'2 1.114'5 0,1230
SC1rrp
SONST 0 0 Au
.9315
.0.1016P
:1:71"ir, 4
PPTcAPD In n.IAPP2 0.50124
4PTF * P'I ppnnirl DFunl."Tur 101 111.011 Of AAPAT sr0PAu,
6.
**111.14400040~$~14,
* PPP flINA OUTPPT
a I
totiOilti401~1141114i**04110 4
T!for lira PT OPAL - 1 SEMOS
rfTonOS PPOPCED PY 59,
;
228
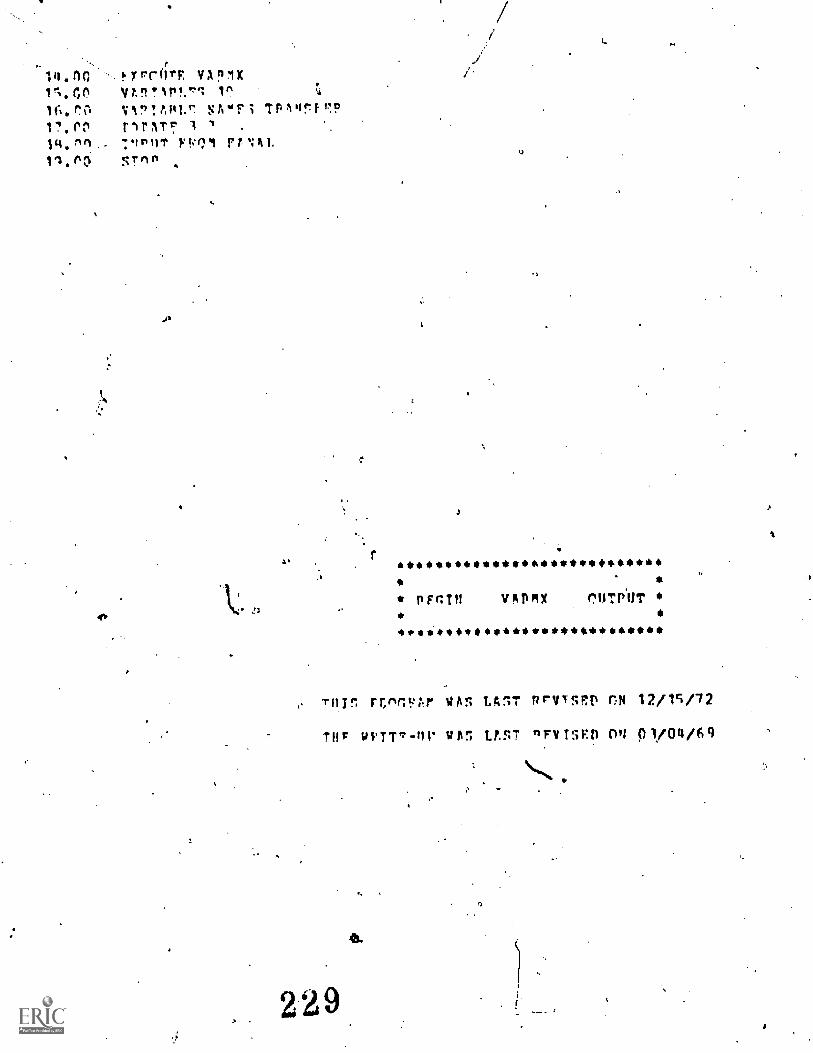
43,
?Yrrnrrlitn!Iti1VO!APL". NAwri TP'rlt1TA7 1 .
F!,q)1 Pr011,
STnn
4.
1'
3
iiiiolos*414,41***
* PPITH VAPMX PUTP.11T *i***Tun rcnr;!:Ar VAS LAST PrifTSM) oti 12/1s/72
THr wvITT-nr V7i 5 L7.S7 PrViSED on pVO4/69
\"%. ,
229
41.
a
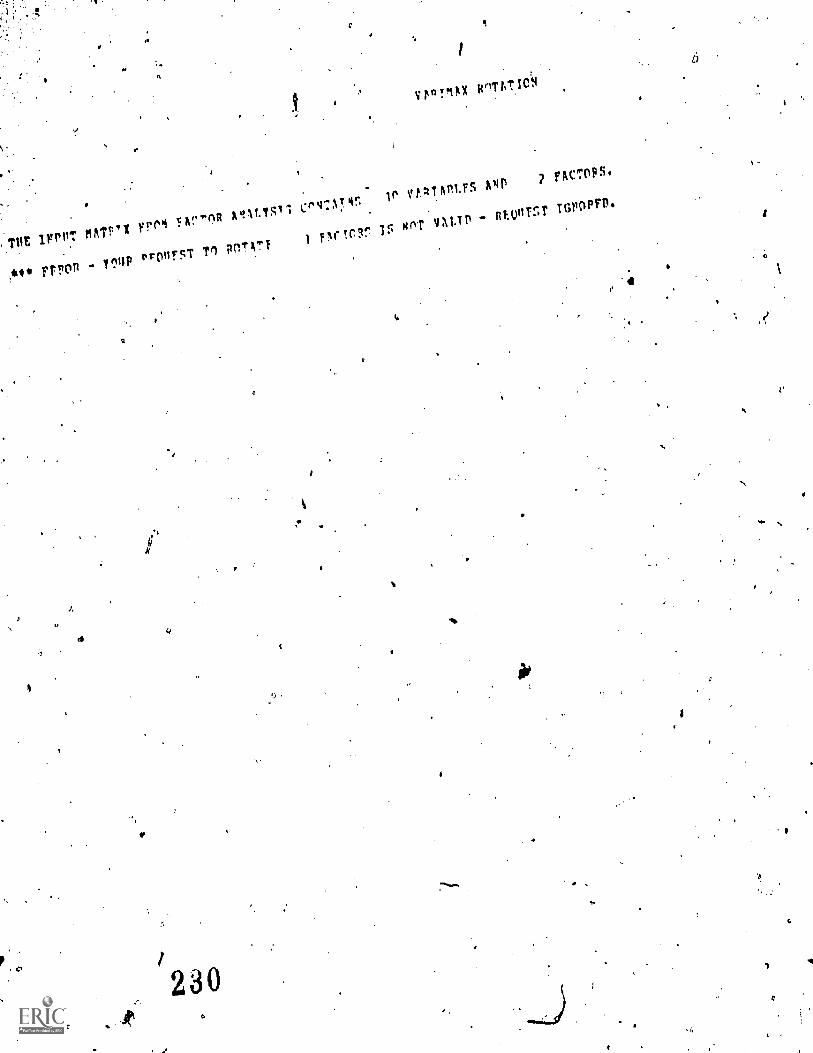
vtorox HnItT16
IFPPT Metri Yrol IFV71*ORlonLISI1
Crw:NTir.VtnThPlfs
lotri2 fhOops,
WW1rvoi$FsT
T1 FOT4TTI WTOr IS OT V,TP
TOOPFD.
1.
ea
a
230
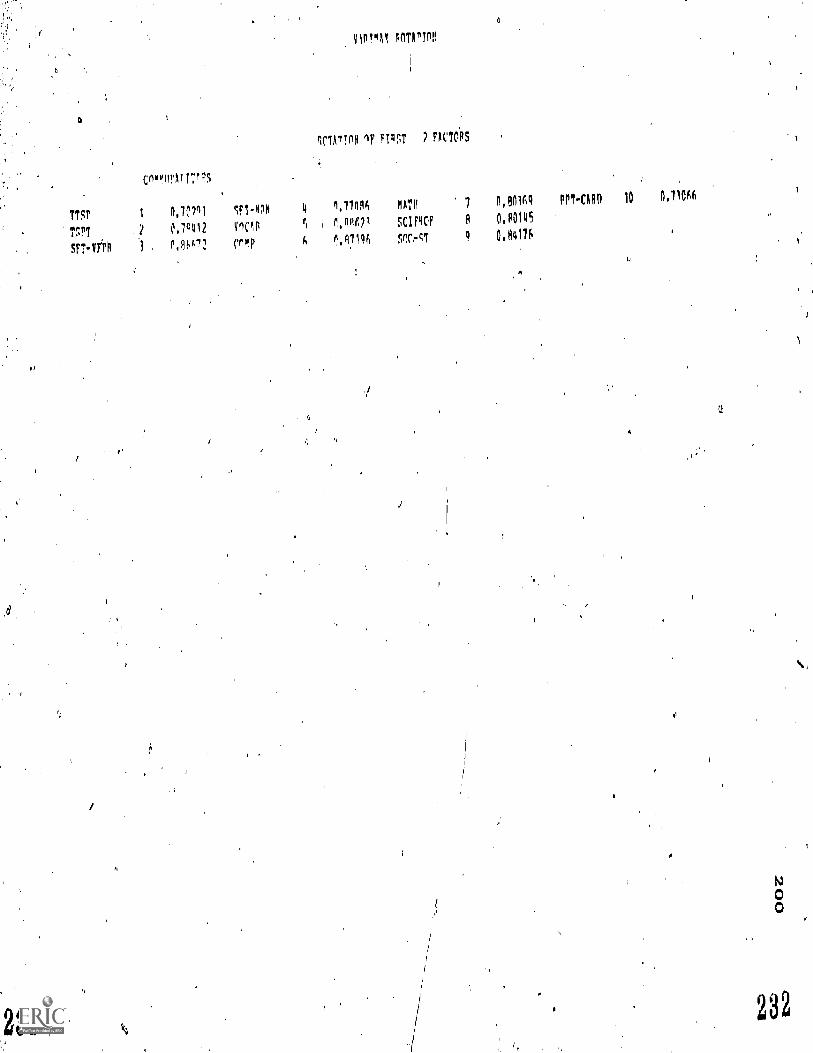
M101 FOTATVI
rIcTAITIN IA FWTOAS
Cno",111,1A1,17r''.5
TM' 1 1,707'31 1F1.111 t 1,7740 AATIf 7 A,80149 PAT-CARA 10 0,71066
Tf:AT .? 0,70412 ;mop r,,Por71 SCIF9CA R ,1;0145
sn'-vrr 3 1%91,02 rrm,i)4 1%07146 Sofmci 9 0,04116
0
231
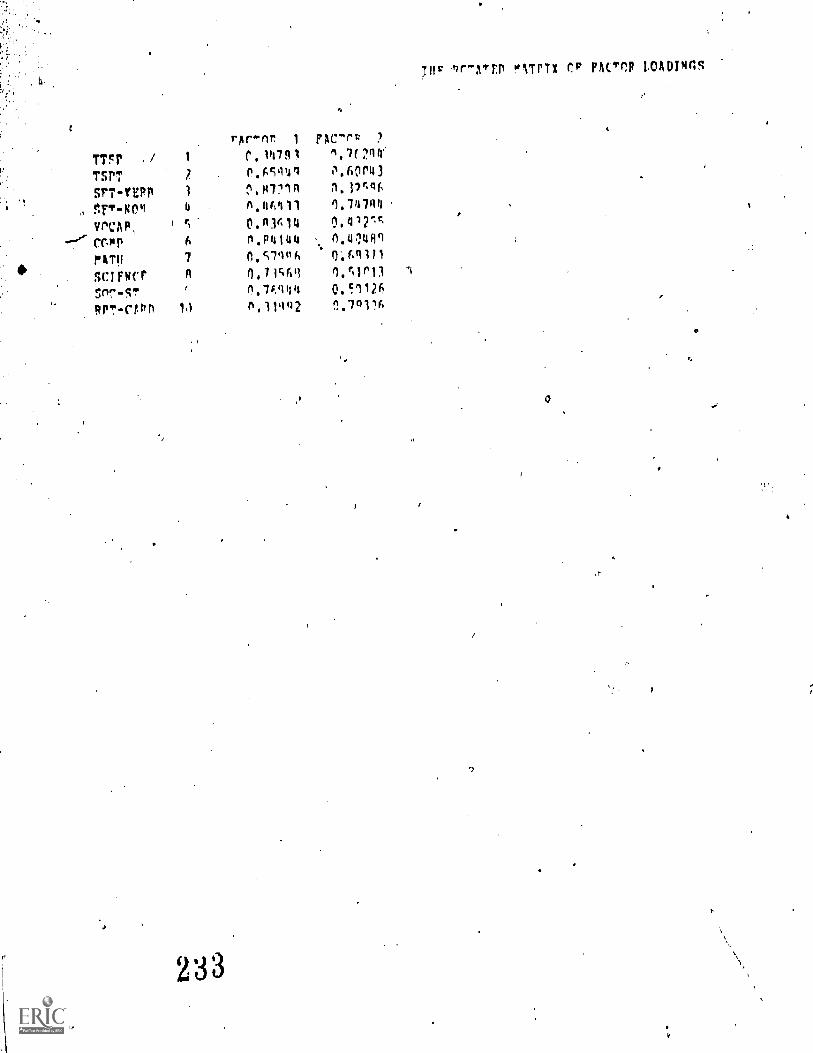
TTrr ./ 1
TarT 2
SrT-1EPP 3
VrCAn,
mop
1
6
PATO
smmur7
507-ST
PPT-CtPD 10
rAr.nr 1 PAC-Pt ?
.vos ^.7(
P.FM111 0.60(40
n':2; 11:=0.n3414 0.417.c
M.P4144 n 41489. I
0,s7qoh mnI/10,71;01 qc1r11
(%/Cq/140.1126
A.114Q2 1.7°116
r-ATEP "1TPTX FACTO LOADTwaq
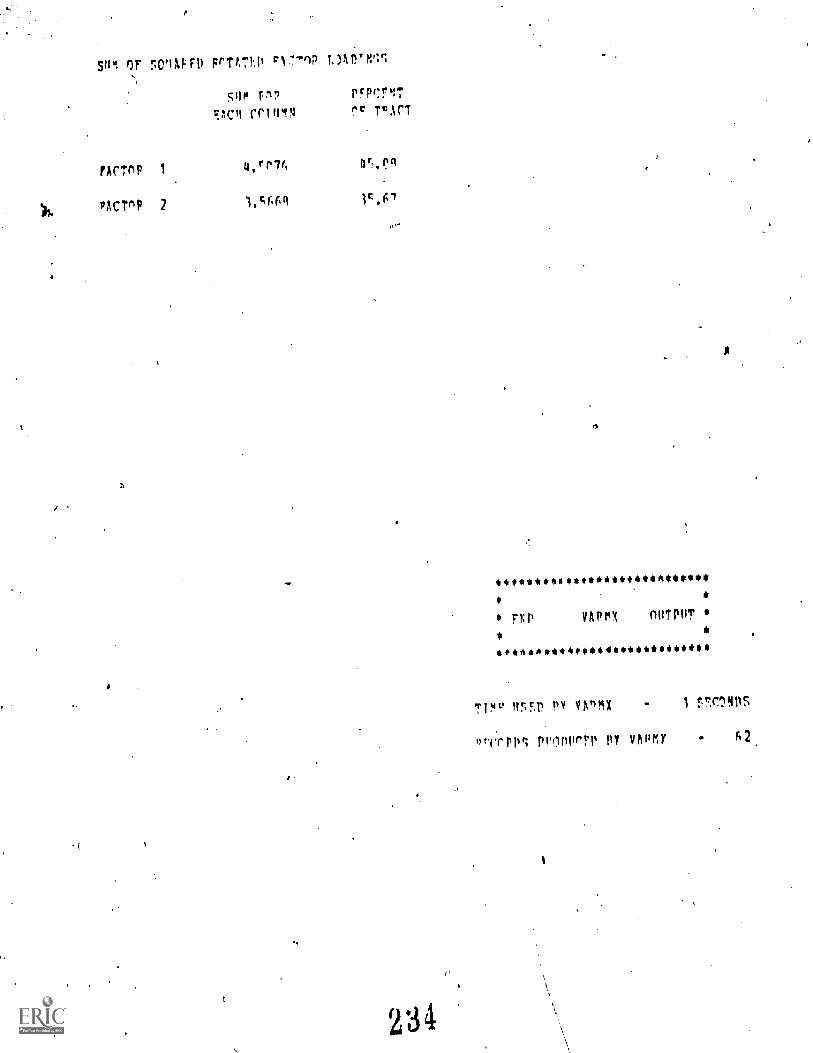
sfikt, OF WIWI) Frrt71,1! r1,!'"nr1 1.)finrgV1
?AMP 1
)1.PACTN7 2
SUP r? PFPCr'IT
FAC11 Crinll 1",ACT
4,rP7r,
1,c661
234
a
**0****014*******$**********
}IP VAPMX nuTPuT *
40,6******0*****************
71'41' 1,SED py VA1MX
,?,171,P; prInvrFP py MMY
.0411S
4Trqr:NCT. 1Y/01 TIVT:
TM: 7117!ill1F
1.11TI1'0111
15-71.11 IMP7111A
11,10$0404iO4$410$14$$$$$.$$$$$$
0
rc nPTIIPT 4
444i$4444444404404444*44401
): 1:PI! rnl:
krrrA, 7tmp, Ir"P ltn 11 t,IPOT P t 1.10
MPT!oi: n ;;t t,17/10° e f
vpir er:1)111.:: ri 1"el; rcrlf,;! ;V, 0 %PON I 0.111
nloo: POP: t cm 1 Idm IflIl OAOr AO i IROO4
The Television Test of Science Processes
by
David R. Torrence
An Abstract of a Thesis
in
Academic Curriculum and Instruction
Submitted in Partial Fulfillmentof the Requirementsfor the Degree.of
Doctor of Education,
August 1976
' The Pennsylvania State UniversityThe Graduate School
Department of Academic Curriculum and Instruction
237
The Television Test of Science Processes
In 1972, The Pennsylvania State University and the Pennsylvania
Department of Education (PDE) devised a system for using instructional
television as a major resource in the implementation of Science for
the Seventieti (SFTS), a statewide thrust to assist elementary teachers
in a transition into some of the newer methods of teaching science.
Qne of the objectives of this.ITV resource is to measure student
competency in the.use of science processef? via a televised fest.
A review of the literature found no test with the combined
requirements of being content valid for use.by intermediate level
studgnts and for administration via television. Of the available
tests, the Test of ScienceProcesses (TSP) was found adaptable for
revision because it possessed content validity. Most applicable to
the SFTS demands was its visual presentation mode which had implication
for the television format.
There were two aspects to the problem investigated in this study.
First, could the TSP be modified for use by intermediate level
students?- Second, could the TSP be adapted as a reliable and valid
test for use through the medium of television?
An item pool was generated from the ninety-sixitems of-the TSP
which were identified as representative of the process skills and
their aPplicability to intermediate level students.
288
2
A Prototype Television Test of Science Processes,(TTS0 was
.formulated. The print comPonent consisted of &television tet
booklet and teacher's manual. The verbal message was -modified and
subjected to-two readability measures. Vocabulary and syntax were
-computed to be at the third grade level.
The non-print component was.reviewed and, organized in a television
script into the audio and visual modes. The total information utilized
was the necessary introductory-comments and audio directions for test
takipg and the narration of the test questions. Using the production
studio of WPSX, Form A of the TTSP was produced on two-inch tape of
broadcast quality.
A study to ascertain the appropriate timing for .each ofthe
visuals was conducted. A cutting time was generated for each question
and the video tape was edited to become Form B of the test instrument.
A pilotexposure to derive item analysis data was conducted and, based
on their biserial coefficients and item difficulties, forty items were
identified for inclusion into Form C. Revision of the entire print
and non-print component was affected. An edit of the video tape was
Conducted to include appropriate credits and to conform to the time
limits of two.thirty-minute programs required for public broadcasting.
To determine' validity, two hundred, fifteen students of a large
central Pennsylvania school system were given the TTSP, the Science
Process Test (TSPT) and the Science'Test of the Comprehensive Tests of
Basic Skills (CTBS). These and other data were factor analyzed. The
TTSP,. Form C was found moderately to highly correlated with TSPT and
the Science Test of the CTBS.
239
-Test results from three thousand, four hundred eighty fifth
grade students from nineteen school systems were processed and used
for developing initial norms.
The data suggests content validity, appropriate readability,
internal reliability coefficients, approximating comparable reliability
-coefficients of tests of science prooesses, criterion related validity
through moderate to high correlation with similar,instruments, and a
norming; distribution With a moderate unimodal skew approximating a
normal curve. It can be inferred that the succesaful formulation of
the TTSP implies that the TSP has been modified for use for intermediate
level students and has been adapted for use through the medium of
television.
240
VITA
David R. Torrence.Hammersley ForkRenovo, Pennsylvania 17764
Date of Birth: 5/12/37
Telephone: (717) 923-2093
Marital Status: married 12 years, no children
Education: B.S. ,Social Science and Education, 1964
Towson State College, Maryland -
,M.S. CurriCulum and Instruction, 1969'
The PennsYlvania State University
D.Ea. Curriculum and InstrUction (Instructional Development)
1976The Peftnsylvania State University
ci
Professional Interests: Instructional technology, Instructiona'T'and
'Staff development ,
Special Interests: graphic arts, mediated learning experiences
Teaching Experience:\ t 3 years - Social Studies, Parkville Junior High School,
Baltimore, MD1 year -- Geography, Parkville Senior High School, Baltimore, MD
1 year -- Supervision .of Student Teachers, The Pennsylvania State
University (Supervision Internship Program)
3 years - Weather and Climate, Physiography, Earth Science,
Regional, World, wire Wisconsin Geography, University
of Wisconsin Center-Medford, Wisconsin
3 years - Instructional Development and Media (Teaching Assistantship)
The Pennsylvania State University
Teaching Certificates:Maryland -- Secondary Social Studies, Geography
Pennsylvania --Media Specialist
Awards, Fellowships, Gtants:N.D.E:A. Fellowship in Geography -- The Pennsylvania State
University, 1967Supervision Internship -- The Pennsylvanie,State University, 1968
N.S.F. Grant-Moisture and Energy Balance Climatology University .
of Delaware,'Summer, 1971
241
References include:Dr. Paul Welliver, The Pennsylvania State. University .
Dr. Russell Oliver;University of Wisconsin Center-Medford
Mrs. Sue Zoller, Baltimore County Public Schools
Credentials are,available from: Teacher Placement ServiceThe Pennsylvania State,University408 Boucki Building ,
University Park, pti. 168C2A
(7:
242