Embed Size (px)
Citation preview
I N T R O D U C T I O NDutch experience of using TBM tunnelling is relative-
ly recent. The first TBM tunnel was constructed in the
Netherlands between 1997 and 1999 (the Second
Heinenoord Tunnel). In the early 1990s, Dutch
engineers were uncertain whether the soft saturated
soil in the western parts of their country was suitable
for TBM tunnelling. The decision was therefore taken
to include a measurement programme in the first
tunnelling projects. An overview of this programme
and some results are presented by Bakker & Bezuijen
(2008). In the programme, results from the
measurements were predicted using existing
calculation models. The measurement results were
analysed at a later date, and discrepancies with the
predictions were explained where possible.
An important part of the measurement and analysis
programme was dictated by the processes that occur
around the TBM. This paper deals with some of these
processes. It does not cover all aspects of TBM tun-
nelling as this would not fit within the limits of this
paper (see Bezuijen & van Lottum, 2006, for more
information). The paper focuses on certain areas
where ideas concerning the mechanisms involved
have changed over the last decade, and where a
better understanding is now apparent.
In order to structure this paper, we ‘walk’ along the
TBM. We start with a process at the front of the TBM:
the creation and stability of the tunnel face under the
influence of excess pore pressures. The paper then
discusses what happens next to the TBM. The last
part of the paper deals with the tail void grout that is
injected at the end of the TBM. The paper describes
the current state of the art of these processes, and
discusses how knowledge gained about these
processes may influence the design of a TBM tunnel
in soft soil.
P O R E P R E S S U R E S I NF R O N T O F A T B M
F LOW I N COA R S E A N D F I N EG R A N U L A R M AT E R I A L
During TBM tunnelling, it is essential that the tunnel
face is stabilised by pressurised slurry (slurry shield)
or muck (EPB shield). The pressure must be adapted
to the ground pressure to stabilise the front. If
pressure is too low, this will lead to an instable tunnel
front resulting in collapse of the tunnel face. If
pressure is too high, a blow-out will occur. Various
calculation methods have been proposed to calculate
the stability of the tunnel face. Most of these
methods do not take the influence of pore water flow
into account. It is assumed that the bentonite slurry
or muck at the tunnel face creates a perfect seal that
prevents water flow from the face into the soil.
Experience with tunnels built in areas where the sub-
soil contains gravel has shown that the bentonite
slurry can penetrate into the subsoil over more than 7
m (Steiner, 1996). Steiner advises that the sand and
fines should be retained in the slurry (instead of
removing them in the separation plant), and that
sawdust should be used in the bentonite (Steiner,
2007). Anagnostou & Kovari (1994) propose a
calculation method for such a situation.
However, this method only takes the viscous
behaviour of the slurry into account, and not the
stiffening that occurs during standstill. The results of
this calculation method may therefore lead to the
prescription of bentonite with viscosity that is too
high (Steiner, 2007). The state of the art for such a
situation involving coarse granular material is still
trial and error, but the trial can be performed in the
laboratory to avoid errors in the field.
Usual tunnelling conditions in The Netherlands are a
saturated sandy soil in medium-fine sand. In such soil
conditions, the groundwater flow influences the
plastering. There will be virtually no plastering of the
tunnel face by the bentonite or the muck during
drilling, because the groundwater in front of the TBM
prevents water in the bentonite slurry or muck
flowing into the soil. Plastering will only occur
during standstill of the TBM process.
FIGURE 1 shows measured pore pressure in front of a
slurry shield as a function of the distance from the
TBM front. Plastering occurs during standstill,
resulting in a pressure of 120 kPa (the hydrostatic
pressure). Higher pore pressures were measured
during drilling, because the TBM’s cutter head
removes a cake before it can form at the tunnel face.
FIGURE 2 shows the same phenomenon measured in
front of an EPB shield. Here, only the pressure during
48 GEOinternational – July 2008
PROCESSES AROUND A TBMA . B E Z U I J E N & A . M . TA L M O N D E LTA R E S A N D D E L F T U N I V E R S I T Y O F T E C H N O LO GY
Processes that occur around a TBM during tunnelling have been investigated while tunnelling in saturated sand. The pore pressure in front of the
TBM increases due to a lack of plastering during drilling. This has consequences for the stability of the tunnel face, or the soil in front of the tunnel.
A bentonite flow is likely alongside the TBM from the tunnel face, and/or grout flow from the back. It seems that virtually no investigation has been
made of this part of the TBM, but it is important to understand the volume loss that occurs around a tunnel. The lining is constructed behind the
TBM and the tail void grout is applied. Pressures measured in the tail void grout will be discussed, as well as the consequences for loading on the
soil and the lining. Most of the results described are based on field measurements performed at various tunnels constructed in the Netherlands.
FIGURE 1MEASURED EXCESS
PORE PRESSURE
IN FRONT OF A
SLURRY SHIELD
AND APPROXIMATION.
drilling was recorded.
Bezuijen (2002) shows that the amount of excess pore
pressure measured in the soil in front of the TBM
(apart from pressure at the tunnel face) also depends
on soil permeability, the quality of the bentonite or
muck, and the drilling speed. Where EPB drilling
takes place in sand with a low permeability (k=10-5
m/s), the pore pressure measured in sand in front of
the TBM is virtually equal to pressure in the mixing
chamber. The pressure is lower in sand with higher
permeability (k=3.10-4 m/s), because some plastering
of the face occurs during drilling. Soil permeability
also influences the foam properties. Muck in the
mixing chamber will be dryer in sand with a higher
permeability. Where the permeability of the sand is
lower, the water content in the muck is nearly
entirely determined by water in the soil and much
less by the foam properties (also see Bezuijen, 2002).
FIGURE 1 and FIGURE 2 also show a theoretical curve
(Bezuijen, 2002):
(1)
Where φ 0 is the piezometric head at the tunnel face,
φ the piezometric head at a distance x in front of the
tunnel face, and R the radius of the tunnel. This
relationship is valid for situations where the permea-
bility of soil around the tunnel is constant. In the
Netherlands, the sandy layers used for tunnelling are
sometimes overlain with soft soil layers of peat and
clay with a low permeability. In such a situation, the
pressure distribution in the soil can be evaluated as
a semi-confined aquifer. This is described by Broere
(2001).
I N F LU E N C E O N S TA B I L I T YBezuijen et al (2001) and Broere (2001) have shown
that the groundwater flow in front of the TBM
implies that a larger face pressure is necessary to
achieve a stable front. According to Bezuijen et al
(2001), the difference is approximately 20 kPa for a
10-m-diameter tunnel constructed in sand, where the
top is situated 15 m below the ground surface.
Knowledge of this groundwater flow appeared
essential during the Groene Hart Tunnel (GHT)
project, not to prevent collapse of the tunnel face but
to prevent a form of blow-out (Bezuijen et al, 2001).
This tunnel enters a deep polder where the piezo-
metric head in the sand layers underneath the soft
soil layers is higher than the surface level (see FIGURE
3). As a result, the effective stresses beneath the soft
soil layers are extremely small. The calculated excess
pore pressure in the sand layer induced by the tunnel-
ling process could cause ‘floating’ of the soft layers.
The contractor made detailed numerical calculations
(Aime et al, 2004). As a result of these calculations, a
temporary sand dam was constructed at the point
where the tunnel entered the polder. This dam
delivered the necessary weight to prevent lifting
of the soft soil layers due to excess pore pressure
generated at the tunnel face during drilling.
FLOW AR O U N D T H E T B M
C A LC U L AT I O N M O D E LUntil recently, only limited attention has been given
to pressure distribution and flow around the TBM
shield. It was assumed that the soil was in contact
with the TBM shield across the shield. During drilling
of the Western Scheldt tunnel, however, it appeared
that the TBM deformed at large depths and high
water pressures (the tunnel is constructed up to 60 m
below the water line). This could not be explained by
the concept of a TBM shield in contact with the soil.
Furthermore, tunnelling technology has advanced to
a level where the ground loss due to tunnelling is less
than the volume difference caused by tapering of the
TBM. TBMs are usually tapered, with a slightly larger
diameter at the head compared with the tail. This
allows the TBM to manoeuvre and to drill with a cer-
tain curvature. Table 1 shows the volume difference
due to tapering for different TBMs.
________________TABLE 1 PERCENTAGE OF TAPERING OF
THE TBM IN 3 TUNNEL PROJECTS IN THE
NETHERLANDS.
TUNNEL PROJECT TAPERING (%)
SECOND HEINENOORD 0.95
BOTLEK 0.77
SOPHIA 0.79________________The volume losses measured during these projects
varied, but negative volume losses were sometimes
measured in all the projects (there was actually
PROCESSES AROUND A TBM
FIGURE 3GEOTECHNICAL
PROFILE GHT TUNNEL
IN POLDER. TUNNEL
IS DRILLED FROM RIGHT
TO LEFT IN THIS PICTURE.
FIGURE 2MEASURED EXCESS PORE
PRESSURE IN FRONT OF
AN EPB SHIELD (•)
AND APPROXIMATION
(BOTLEK RAIL
TUNNEL, MQ1 SOUTH).
RELATIVELY IMPE-
MEABLE SUBSOIL.
GEOinternational – July 2008 49
50 GEOinternational – July 2008
heave). It is clear that the measured volume loss can
be less than the volume loss due to tapering. This
leads to the idea (Bezuijen, 2007) that the soil is not
in contact with the TBM all over the TBM.
Overcutting at the tunnel face can lead to bentonite
flow over the TBM shield from the face towards the
tail. Grout pressure during grout injection is usually
higher at the tail than the soil pressure. The soil is
therefore pushed away from the TBM, and grout will
flow from the tail over the shield. It is possible to
describe flow on the shield, if it is assumed that both
the bentonite and the grout are Bingham liquids, that
the yield stress is dominant in the flow behaviour,
and that there is linear elastic soil behaviour. A more
or less conceptual model is developed, assuming a
cylindrical symmetrical situation around the tunnel
axis. Changes in the soil radius for such a situation can
be described as (Verruijt, 1993):
(2)
Where ∆ is the change in pressure, ∆r the change in
radius, r the radius of the tunnel and the grout, and G
the shear modulus of the soil around the tunnel.
The flow around the TBM shield can be described as:
(3)
Where ∆P is the change in pressure due to the flow,
∆x a length increment along the TBM, s the gap width
between the tunnel and the soil, and τγ the shear
stress of the grout around the TBM. α is a coefficient
indicating whether there is friction between the soil
or bentonite and the grout (α =1) only, or also
between the TBM and the grout or bentonite (α =2).
Viscous forces are neglected in this formula. This is
permissible due to the low flow velocities that can be
expected
With no grout or bentonite flow around the TBM,
tapering will lead to an effective stress reduction
proceeding from the TBM’s face to the tail according
to equation (2). The grout and bentonite flow will
change this pressure distribution. In order to
calculate the pressure distribution under flow, the
flow direction of both the bentonite and the grout
must be known. These flow directions can vary during
the tunnelling process (Bezuijen, 2007). On average,
however, the TBM advances and therefore the
bentonite and grout front must also advance in the
same direction to achieve a stable situation. This
means that grout and bentonite only move with
respect to the soil, and not with respect to the TBM.
Therefore α = 1 for both the bentonite and the grout.
The result of an example calculation using the
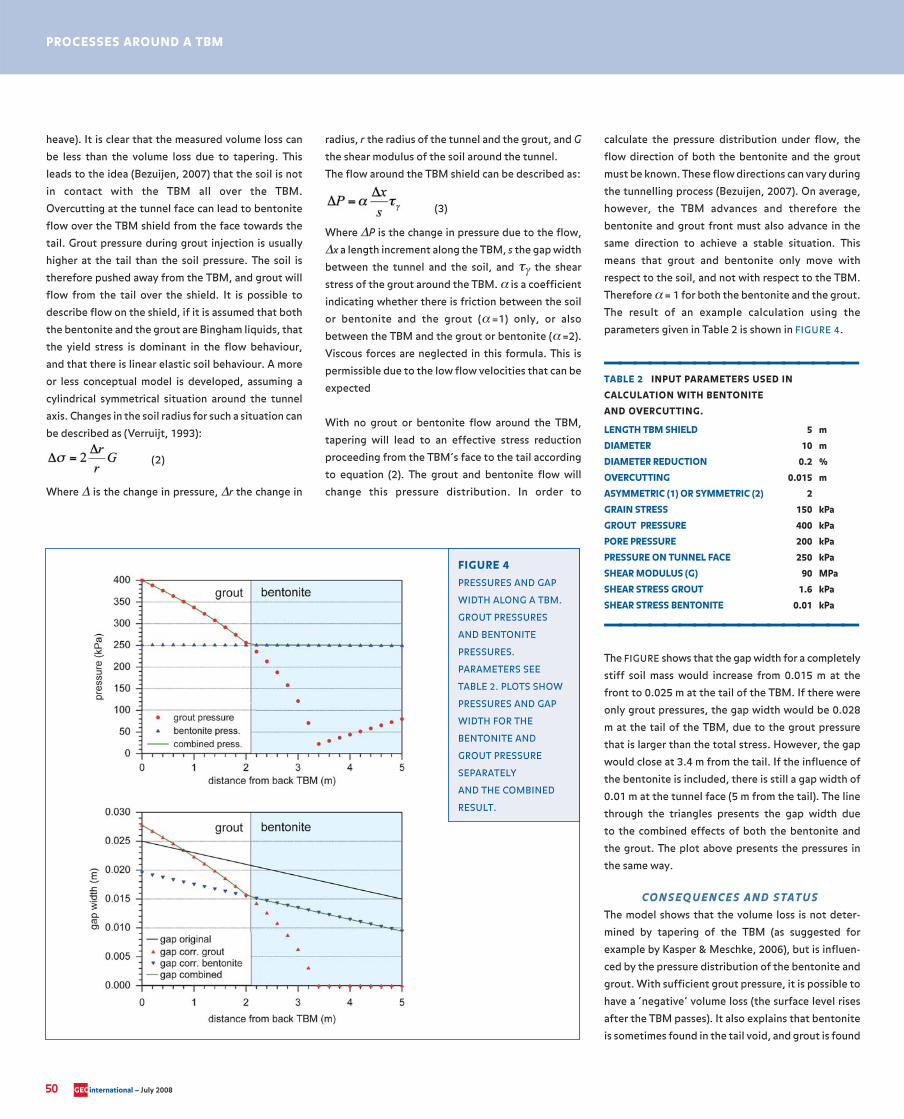
parameters given in Table 2 is shown in FIGURE 4.
_________________TABLE 2 INPUT PARAMETERS USED IN
CALCULATION WITH BENTONITE
AND OVERCUTTING.
LENGTH TBM SHIELD 5 m
DIAMETER 10 m
DIAMETER REDUCTION 0.2 %
OVERCUTTING 0.015 m
ASYMMETRIC (1) OR SYMMETRIC (2) 2
GRAIN STRESS 150 kPa
GROUT PRESSURE 400 kPa
PORE PRESSURE 200 kPa
PRESSURE ON TUNNEL FACE 250 kPa
SHEAR MODULUS (G) 90 MPa
SHEAR STRESS GROUT 1.6 kPa
SHEAR STRESS BENTONITE 0.01 kPa_________________
The FIGURE shows that the gap width for a completely
stiff soil mass would increase from 0.015 m at the
front to 0.025 m at the tail of the TBM. If there were
only grout pressures, the gap width would be 0.028
m at the tail of the TBM, due to the grout pressure
that is larger than the total stress. However, the gap
would close at 3.4 m from the tail. If the influence of
the bentonite is included, there is still a gap width of
0.01 m at the tunnel face (5 m from the tail). The line
through the triangles presents the gap width due
to the combined effects of both the bentonite and
the grout. The plot above presents the pressures in
the same way.
CO N S E Q U E N C E S A N D S TAT U SThe model shows that the volume loss is not deter-
mined by tapering of the TBM (as suggested for
example by Kasper & Meschke, 2006), but is influen-
ced by the pressure distribution of the bentonite and
grout. With sufficient grout pressure, it is possible to
have a ‘negative’ volume loss (the surface level rises
after the TBM passes). It also explains that bentonite
is sometimes found in the tail void, and grout is found
PROCESSES AROUND A TBM
FIGURE 4PRESSURES AND GAP
WIDTH ALONG A TBM.
GROUT PRESSURES
AND BENTONITE
PRESSURES.
PARAMETERS SEE
TABLE 2. PLOTS SHOW
PRESSURES AND GAP
WIDTH FOR THE
BENTONITE AND
GROUT PRESSURE
SEPARATELY
AND THE COMBINED
RESULT.
in the pressure chamber. The first situation occurs
when bentonite pressure is relatively high and grout
pressure is low (we will see that it is quite difficult to
control grout pressure, especially during ring
building). The second situation occurs when grout
pressures in the tail void are relatively high (which
may occur during drilling).
Contrary, however, to the model described for the
pore pressures in front of the TBM and the grout
pressure, to be described in the following sections,
the experimental evidence for this model is still
limited. To our knowledge, pressure distribution
around the TBM shield has never been measured. The
shield was perforated during construction of the
Western Scheldt tunnel but no grout was found
between the shield and the soil (Thewes, 2007). The
fact that no grout was found during this investigation
may be caused by the fact that, in reality, the TBM
will not be placed as symmetrically in the drilled hole
as suggested in this simple model. The TBM must be
in contact with the soil at some point to maintain
mechanical equilibrium. There will be no grout
around the shield at that location.
Guglielmetti (2007) rightfully argues that more
research is needed in this field, because: ‘The topic
(flow of bentonite and grout around the TBM) is
definitely one of the most important in the field of
mechanised tunnelling, being the management of the
void around the shield of a TBM as one of the major
sources of concern for both designers and
contractors involved in urban tunnelling projects’.
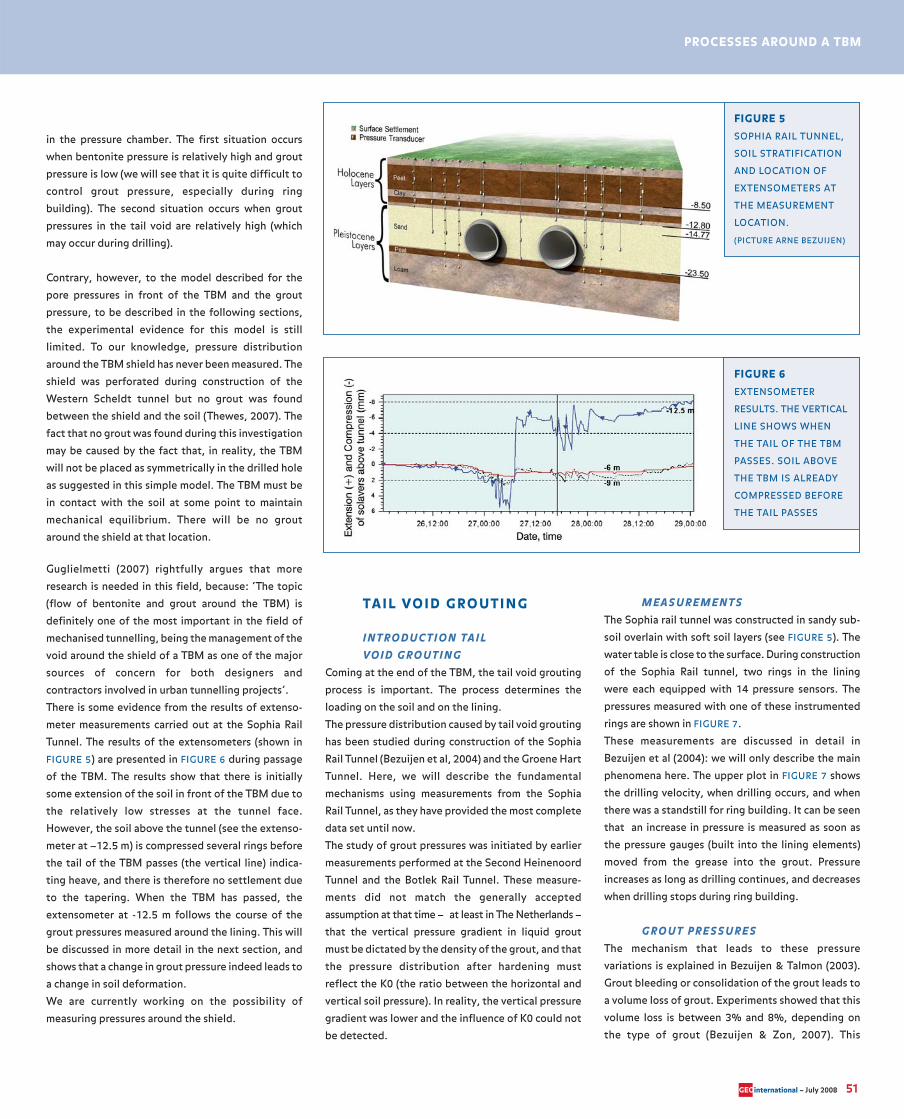
There is some evidence from the results of extenso-
meter measurements carried out at the Sophia Rail
Tunnel. The results of the extensometers (shown in
FIGURE 5) are presented in FIGURE 6 during passage
of the TBM. The results show that there is initially
some extension of the soil in front of the TBM due to
the relatively low stresses at the tunnel face.
However, the soil above the tunnel (see the extenso-
meter at –12.5 m) is compressed several rings before
the tail of the TBM passes (the vertical line) indica-
ting heave, and there is therefore no settlement due
to the tapering. When the TBM has passed, the
extensometer at -12.5 m follows the course of the
grout pressures measured around the lining. This will
be discussed in more detail in the next section, and
shows that a change in grout pressure indeed leads to
a change in soil deformation.
We are currently working on the possibility of
measuring pressures around the shield.
TA I L VO I D G R O U T I N G
I N T R O D U C T I O N TA I LVO I D G R O U T I N G
Coming at the end of the TBM, the tail void grouting
process is important. The process determines the
loading on the soil and on the lining.
The pressure distribution caused by tail void grouting
has been studied during construction of the Sophia
Rail Tunnel (Bezuijen et al, 2004) and the Groene Hart
Tunnel. Here, we will describe the fundamental
mechanisms using measurements from the Sophia
Rail Tunnel, as they have provided the most complete
data set until now.
The study of grout pressures was initiated by earlier
measurements performed at the Second Heinenoord
Tunnel and the Botlek Rail Tunnel. These measure-
ments did not match the generally accepted
assumption at that time – at least in The Netherlands –
that the vertical pressure gradient in liquid grout
must be dictated by the density of the grout, and that
the pressure distribution after hardening must
reflect the K0 (the ratio between the horizontal and
vertical soil pressure). In reality, the vertical pressure
gradient was lower and the influence of K0 could not
be detected.
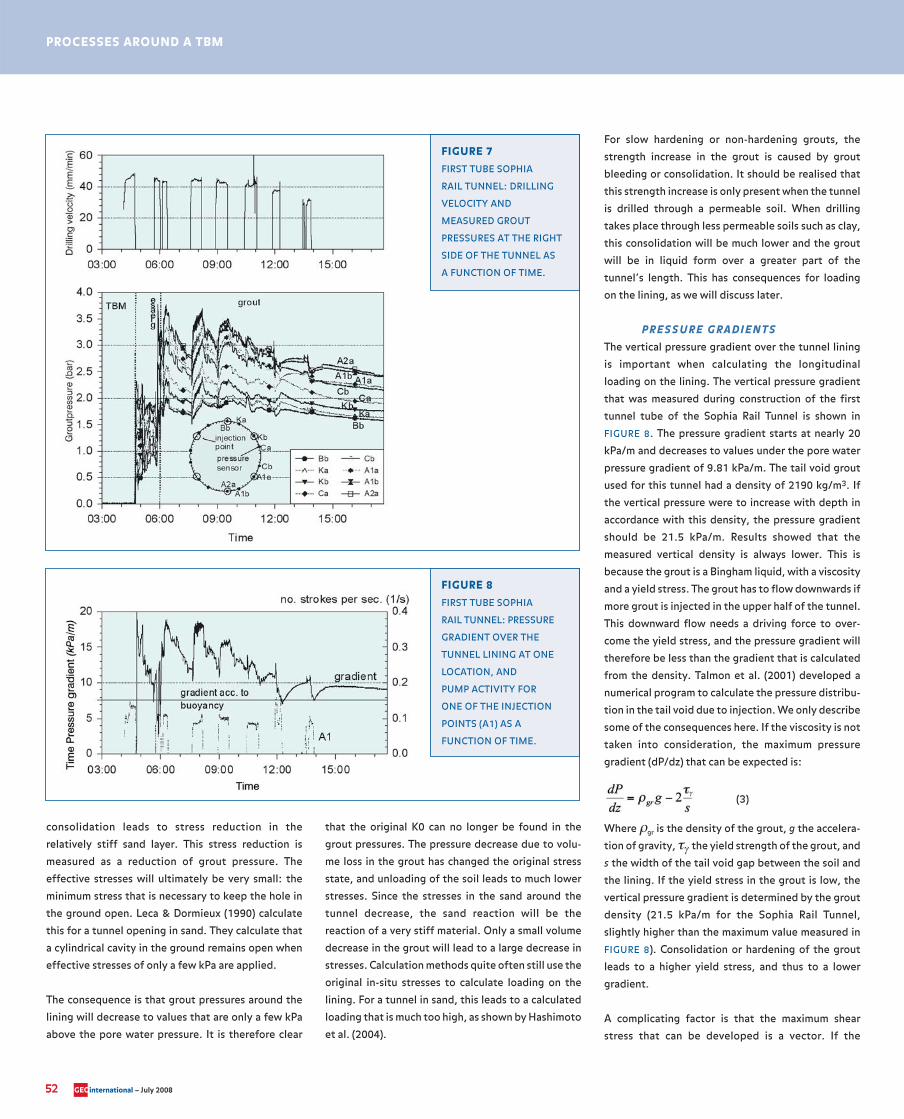
M E A S U R E M E N T SThe Sophia rail tunnel was constructed in sandy sub-
soil overlain with soft soil layers (see FIGURE 5). The
water table is close to the surface. During construction
of the Sophia Rail tunnel, two rings in the lining
were each equipped with 14 pressure sensors. The
pressures measured with one of these instrumented
rings are shown in FIGURE 7.
These measurements are discussed in detail in
Bezuijen et al (2004): we will only describe the main
phenomena here. The upper plot in FIGURE 7 shows
the drilling velocity, when drilling occurs, and when
there was a standstill for ring building. It can be seen
that an increase in pressure is measured as soon as
the pressure gauges (built into the lining elements)
moved from the grease into the grout. Pressure
increases as long as drilling continues, and decreases
when drilling stops during ring building.
G R O U T P R E S S U R E SThe mechanism that leads to these pressure
variations is explained in Bezuijen & Talmon (2003).
Grout bleeding or consolidation of the grout leads to
a volume loss of grout. Experiments showed that this
volume loss is between 3% and 8%, depending on
the type of grout (Bezuijen & Zon, 2007). This
PROCESSES AROUND A TBM
FIGURE 5SOPHIA RAIL TUNNEL,
SOIL STRATIFICATION
AND LOCATION OF
EXTENSOMETERS AT
THE MEASUREMENT
LOCATION.
(PICTURE ARNE BEZUIJEN)
FIGURE 6EXTENSOMETER
RESULTS. THE VERTICAL
LINE SHOWS WHEN
THE TAIL OF THE TBM
PASSES. SOIL ABOVE
THE TBM IS ALREADY
COMPRESSED BEFORE
THE TAIL PASSES
GEOinternational – July 2008 51
52 GEOinternational – July 2008
consolidation leads to stress reduction in the
relatively stiff sand layer. This stress reduction is
measured as a reduction of grout pressure. The
effective stresses will ultimately be very small: the
minimum stress that is necessary to keep the hole in
the ground open. Leca & Dormieux (1990) calculate
this for a tunnel opening in sand. They calculate that
a cylindrical cavity in the ground remains open when
effective stresses of only a few kPa are applied.
The consequence is that grout pressures around the
lining will decrease to values that are only a few kPa
above the pore water pressure. It is therefore clear
that the original K0 can no longer be found in the
grout pressures. The pressure decrease due to volu-
me loss in the grout has changed the original stress
state, and unloading of the soil leads to much lower
stresses. Since the stresses in the sand around the
tunnel decrease, the sand reaction will be the
reaction of a very stiff material. Only a small volume
decrease in the grout will lead to a large decrease in
stresses. Calculation methods quite often still use the
original in-situ stresses to calculate loading on the
lining. For a tunnel in sand, this leads to a calculated
loading that is much too high, as shown by Hashimoto
et al. (2004).
For slow hardening or non-hardening grouts, the
strength increase in the grout is caused by grout
bleeding or consolidation. It should be realised that
this strength increase is only present when the tunnel
is drilled through a permeable soil. When drilling
takes place through less permeable soils such as clay,
this consolidation will be much lower and the grout
will be in liquid form over a greater part of the
tunnel’s length. This has consequences for loading
on the lining, as we will discuss later.
P R E S S U R E G R A D I E N T S The vertical pressure gradient over the tunnel lining
is important when calculating the longitudinal
loading on the lining. The vertical pressure gradient
that was measured during construction of the first
tunnel tube of the Sophia Rail Tunnel is shown in
FIGURE 8. The pressure gradient starts at nearly 20
kPa/m and decreases to values under the pore water
pressure gradient of 9.81 kPa/m. The tail void grout
used for this tunnel had a density of 2190 kg/m3. If
the vertical pressure were to increase with depth in
accordance with this density, the pressure gradient
should be 21.5 kPa/m. Results showed that the
measured vertical density is always lower. This is
because the grout is a Bingham liquid, with a viscosity
and a yield stress. The grout has to flow downwards if
more grout is injected in the upper half of the tunnel.
This downward flow needs a driving force to over-
come the yield stress, and the pressure gradient will
therefore be less than the gradient that is calculated
from the density. Talmon et al. (2001) developed a
numerical program to calculate the pressure distribu-
tion in the tail void due to injection. We only describe
some of the consequences here. If the viscosity is not
taken into consideration, the maximum pressure
gradient (dP/dz) that can be expected is:
(3)
Where ρgr is the density of the grout, g the accelera-
tion of gravity, τγ the yield strength of the grout, and
s the width of the tail void gap between the soil and
the lining. If the yield stress in the grout is low, the
vertical pressure gradient is determined by the grout
density (21.5 kPa/m for the Sophia Rail Tunnel,
slightly higher than the maximum value measured in
FIGURE 8). Consolidation or hardening of the grout
leads to a higher yield stress, and thus to a lower
gradient.
A complicating factor is that the maximum shear
stress that can be developed is a vector. If the
PROCESSES AROUND A TBM
FIGURE 7FIRST TUBE SOPHIA
RAIL TUNNEL: DRILLING
VELOCITY AND
MEASURED GROUT
PRESSURES AT THE RIGHT
SIDE OF THE TUNNEL AS
A FUNCTION OF TIME.
FIGURE 8FIRST TUBE SOPHIA
RAIL TUNNEL: PRESSURE
GRADIENT OVER THE
TUNNEL LINING AT ONE
LOCATION, AND
PUMP ACTIVITY FOR
ONE OF THE INJECTION
POINTS (A1) AS A
FUNCTION OF TIME.
maximum shear stress is developed in one direction,
there will be no shear stress perpendicular to that
direction. When drilling starts for a new ring and the
grout pumps are activated, the elastic soil reaction
will lead to an increase of the tail void and grout will
therefore flow backwards from the TBM. Ring shear
stresses barely develop in this situation, and the
vertical gradients therefore increase during drilling.
They decrease again when drilling stops (FIGURE 8).
Further from the TBM, the vertical gradients decrease
and become equal to the gradient according to the
buoyancy forces. This has to be the case, because the
total force on the lining far away from the TBM must
be zero. The vertical pressure gradient therefore
compensates for the weight of the lining. As a result,
the gradient becomes lower than the gradient in the
pore water. This is because the average density of the
lining is lower than the density of pore water. One
remarkable result is that the vertical pressure
gradient at some distance from the TBM (at 12:00 in
FIGURE 8, 5 rings behind the TBM) decreases during
drilling. The flow no longer has any influence at this
point, but drilling and grout injection lead to higher
gradients in the first part of the lining and therefore
to higher buoyancy forces. The first rings have the
tendency to move upwards, which must be compen-
sated by the TBM and the rings further away. This
partly compensates for the weight of the rings further
from the TBM, so that the effective weight of these
rings and also the vertical gradient is less.
INFLUENCE ON PORE WATER PRESSURES
In the section on flow in coarse and fine granular
material it is described how no plastering occurs at
the front when drilling takes place in fine to medium-
fine saturated sand, because the bentonite filter cake
is destroyed by the cutting wheel before it is able to
form. As a result, water flows from the tunnel face
into the soil. The section on grout pressures
describes described how consolidation of the grout
also leads to a water flow from the tunnel lining into
the soil, because water expelled from the grout will
flow into the surrounding soil. A grout cake will form
however, because the consolidated grout is no longer
disturbed. It is therefore reasonable to assume that
examination of the variation in pore pressure in soil
next to a tunnel under construction will show pore
pressures that are dominated by pressures existing at
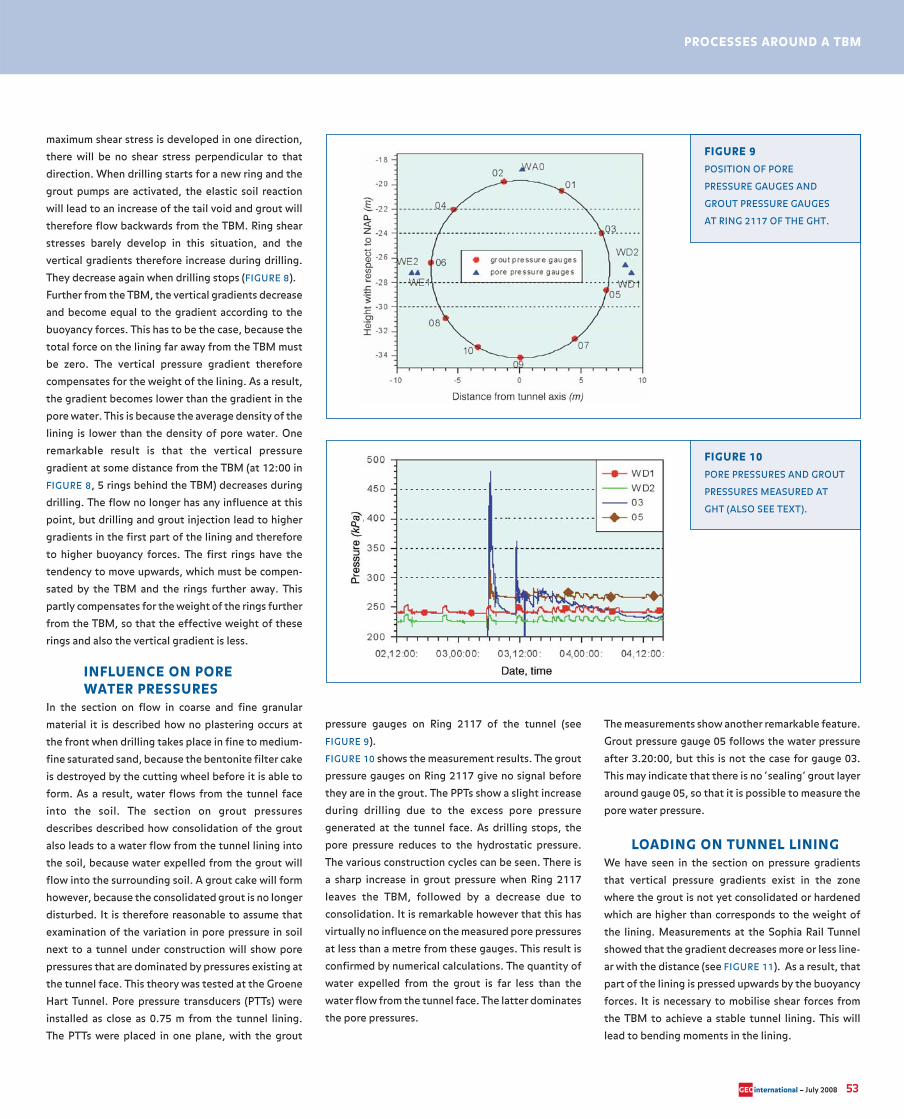
the tunnel face. This theory was tested at the Groene
Hart Tunnel. Pore pressure transducers (PTTs) were
installed as close as 0.75 m from the tunnel lining.
The PTTs were placed in one plane, with the grout
pressure gauges on Ring 2117 of the tunnel (see
FIGURE 9).
FIGURE 10 shows the measurement results. The grout
pressure gauges on Ring 2117 give no signal before
they are in the grout. The PPTs show a slight increase
during drilling due to the excess pore pressure
generated at the tunnel face. As drilling stops, the
pore pressure reduces to the hydrostatic pressure.
The various construction cycles can be seen. There is
a sharp increase in grout pressure when Ring 2117
leaves the TBM, followed by a decrease due to
consolidation. It is remarkable however that this has
virtually no influence on the measured pore pressures
at less than a metre from these gauges. This result is
confirmed by numerical calculations. The quantity of
water expelled from the grout is far less than the
water flow from the tunnel face. The latter dominates
the pore pressures.
The measurements show another remarkable feature.
Grout pressure gauge 05 follows the water pressure
after 3.20:00, but this is not the case for gauge 03.
This may indicate that there is no ‘sealing’ grout layer
around gauge 05, so that it is possible to measure the
pore water pressure.
LOADING ON TUNNEL LININGWe have seen in the section on pressure gradients
that vertical pressure gradients exist in the zone
where the grout is not yet consolidated or hardened
which are higher than corresponds to the weight of
the lining. Measurements at the Sophia Rail Tunnel
showed that the gradient decreases more or less line-
ar with the distance (see FIGURE 11). As a result, that
part of the lining is pressed upwards by the buoyancy
forces. It is necessary to mobilise shear forces from
the TBM to achieve a stable tunnel lining. This will
lead to bending moments in the lining.
PROCESSES AROUND A TBM
FIGURE 9POSITION OF PORE
PRESSURE GAUGES AND
GROUT PRESSURE GAUGES
AT RING 2117 OF THE GHT.
FIGURE 10PORE PRESSURES AND GROUT
PRESSURES MEASURED AT
GHT (ALSO SEE TEXT).
GEOinternational – July 2008 53
54 GEOinternational – July 2008
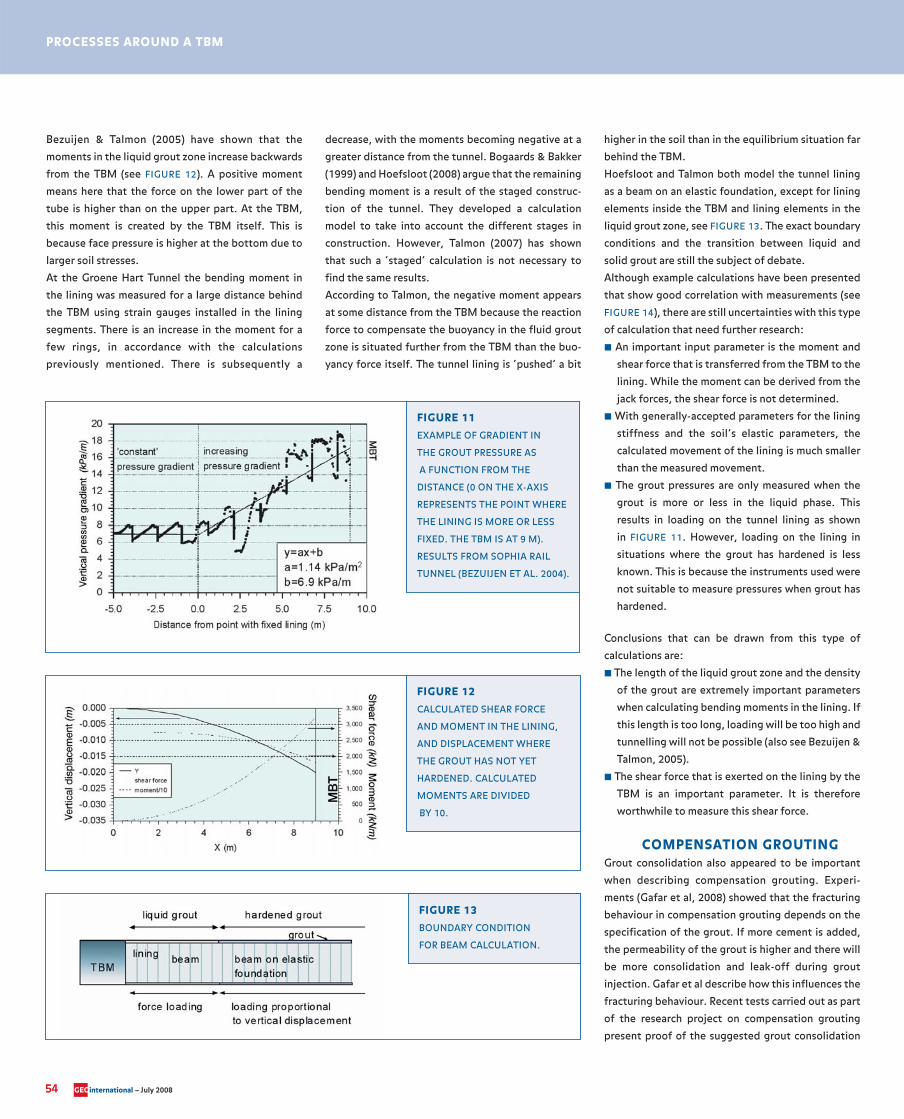
Bezuijen & Talmon (2005) have shown that the
moments in the liquid grout zone increase backwards
from the TBM (see FIGURE 12). A positive moment
means here that the force on the lower part of the
tube is higher than on the upper part. At the TBM,
this moment is created by the TBM itself. This is
because face pressure is higher at the bottom due to
larger soil stresses.
At the Groene Hart Tunnel the bending moment in
the lining was measured for a large distance behind
the TBM using strain gauges installed in the lining
segments. There is an increase in the moment for a
few rings, in accordance with the calculations
previously mentioned. There is subsequently a
decrease, with the moments becoming negative at a
greater distance from the tunnel. Bogaards & Bakker
(1999) and Hoefsloot (2008) argue that the remaining
bending moment is a result of the staged construc-
tion of the tunnel. They developed a calculation
model to take into account the different stages in
construction. However, Talmon (2007) has shown
that such a ‘staged’ calculation is not necessary to
find the same results.
According to Talmon, the negative moment appears
at some distance from the TBM because the reaction
force to compensate the buoyancy in the fluid grout
zone is situated further from the TBM than the buo-
yancy force itself. The tunnel lining is ‘pushed’ a bit
higher in the soil than in the equilibrium situation far
behind the TBM.
Hoefsloot and Talmon both model the tunnel lining
as a beam on an elastic foundation, except for lining
elements inside the TBM and lining elements in the
liquid grout zone, see FIGURE 13. The exact boundary
conditions and the transition between liquid and
solid grout are still the subject of debate.
Although example calculations have been presented
that show good correlation with measurements (see
FIGURE 14), there are still uncertainties with this type
of calculation that need further research:
� An important input parameter is the moment and
shear force that is transferred from the TBM to the
lining. While the moment can be derived from the
jack forces, the shear force is not determined.
� With generally-accepted parameters for the lining
stiffness and the soil’s elastic parameters, the
calculated movement of the lining is much smaller
than the measured movement.
� The grout pressures are only measured when the
grout is more or less in the liquid phase. This
results in loading on the tunnel lining as shown
in FIGURE 11. However, loading on the lining in
situations where the grout has hardened is less
known. This is because the instruments used were
not suitable to measure pressures when grout has
hardened.
Conclusions that can be drawn from this type of
calculations are:
� The length of the liquid grout zone and the density
of the grout are extremely important parameters
when calculating bending moments in the lining. If
this length is too long, loading will be too high and
tunnelling will not be possible (also see Bezuijen &
Talmon, 2005).
� The shear force that is exerted on the lining by the
TBM is an important parameter. It is therefore
worthwhile to measure this shear force.
COMPENSATION GROUTINGGrout consolidation also appeared to be important
when describing compensation grouting. Experi-
ments (Gafar et al, 2008) showed that the fracturing
behaviour in compensation grouting depends on the
specification of the grout. If more cement is added,
the permeability of the grout is higher and there will
be more consolidation and leak-off during grout
injection. Gafar et al describe how this influences the
fracturing behaviour. Recent tests carried out as part
of the research project on compensation grouting
present proof of the suggested grout consolidation
PROCESSES AROUND A TBM
FIGURE 11EXAMPLE OF GRADIENT IN
THE GROUT PRESSURE AS
A FUNCTION FROM THE
DISTANCE (0 ON THE X-AXIS
REPRESENTS THE POINT WHERE
THE LINING IS MORE OR LESS
FIXED. THE TBM IS AT 9 M).
RESULTS FROM SOPHIA RAIL
TUNNEL (BEZUIJEN ET AL. 2004).
FIGURE 12CALCULATED SHEAR FORCE
AND MOMENT IN THE LINING,
AND DISPLACEMENT WHERE
THE GROUT HAS NOT YET
HARDENED. CALCULATED
MOMENTS ARE DIVIDED
BY 10.
FIGURE 13BOUNDARY CONDITION
FOR BEAM CALCULATION.
mechanism. At Delft University, the density of
grout bodies made in two compensation grouting
experiments was analysed in a CT-scan. Such a
CT-scan can be used to determine the density of the
material tested. The grout mixtures used in the
experiments are shown in TABLE 3.
_________________TABLE 3 SPECIFICATION OF GROUT
MIXTURES USED IN FRACTURE TESTS
(WCR = WATER-CEMENT RATIO). COCLAY
D90 CA ACTIVATED BENTO-NITE IS USED.
MIX TURE WCR BENTONITE k% ( M / S )
1 1 7 5•10-8
2 10 7 6.10-10_________________
The results of the CT-scans are shown in FIGURE 15
and FIGURE 16. The results of the first grout mixture
clearly show an increase in density at the boundary of
the grout body. Grout at the boundary of the sample
is consolidated. The grout body made with the
second mixture has a more constant density across
the fracture (the middle section). In the second expe-
riment, the CT-scan was performed while the grout
body was still in the sand. The more homogeneous
density of the grout body in the second test is under-
standable if the permeabilities of the grout are consi-
dered. The lower permeability of the second grout
sample results in much less grout consolidation wit-
hin the limited injection time. The grout density in
the fracture therefore does not increase at the boun-
dary of the grout as is the case for mixture 1.
The permeabilities were determined using the proce-
dure suggested by McKinley and Bolton (1999), a
form of oedometer test with drainage on one side.
This procedure can also be used to test the consoli-
dation properties of tail void grout. However, the
thickness of the grout layer in the test should be
identical to that in the field. This is to avoid scaling
effects that occur because hardening of the grout is
independent of the sample size (Bezuijen & Zon,
2007).
DISCUSSIONThe research described above has increased under-
standing of the processes that occur around a TBM
during tunnelling. This has already had consequences
for practical aspects of tunnelling. Examples are the
excess pore pressures in front of the TBM: extra sand
was added locally above the planned tunnel trajec-
tory of the Groene Hart Tunnel to prevent a
blow-out, and the grout was changed in a tunnel
project in London where it appeared that the liquid
zone of traditional grout for a tunnel drilled in clay
with no possibility of consolidation was too long to
achieve the desired drilling speed.
However, the authors believe that the results can
make an even greater contribution to improving
shield tunnelling. Knowledge about the influence of
excess pore pressures on face stability can improve
definition of the pressure window at the tunnel face,
so preventing a blow-out due to excessively high
pressures and instability caused by pressures that
are too low. In combination with research on EPB
tunnelling in clay (Merrit & Mair, 2006), foam
research for EPB tunnelling in sand can lead to better
control of the EPB process. It has already been
discussed how flow around the TBM is important for
TBM design, and that more experimental evidence is
PROCESSES AROUND A TBM
FIGURE 14BENDING MOMENT RING 2117,
MEASUREMENT AND
CALCULATION. GROENE HART
TUNNEL (HOEFSLOOT, 2008).
FIGURE 15DENSITY MEASURED WITH
A CT-SCAN. RAW DATA (INSET)
AND DENSITY. CORRECTION
FOR BEAM HARDENING EFFECT
AND CALCULATED VALUE OF
THE DENSITY OF THE GROUT
ALONG THE LINE SHOWN IN
INSET. MIXTURE 1 IN TABLE 3.
FIGURE 16GROUT DENSITY IN A FRACTURE MEASURED
WITH A CT-SCAN. MIXTURE 2 IN TABLE 3
GEOinternational – July 2008 55
56 GEOinternational – July 2008
needed. Research into grouting can lead to smaller
settlement troughs and optimisation of loading on
the lining. This last aspect may lead to cheaper lining
construction.
The results must be discussed with tunnel builders
and contractors if improvements to the shield
tunnelling process are to be achieved. Discussion
about certain aspects has already started, but we
hope that this paper will stimulate the involvement of
more parties.
CONCLUSIONSTo understand the processes that are important when
tunnelling with a TBM, the flow processes around a
TBM must be considered: groundwater flow at the
tunnel face, bentonite and grout flow around the
TBM, and grout flow and grout consolidation around
the tunnel lining. The research described in this paper
has brought about progress with regard to these flow
processes during tunnelling in soft ground:
� The groundwater flow at the tunnel face is
described.
� The muck in the mixing chamber is described as a
function of drilling speed and permeability.
� A conceptual model for the flow of bentonite and
grout has been developed. Although this model
must still be verified using the results of measure-
ments, it shows some promising results.
� Considerable information has been obtained
about the grouting process and the resultant lining
loading.
Although not unusual, it is interesting to see that this
research also raises new questions: what is the exact
position of the TBM during the tunnelling process,
what is the interaction between the TBM and the
lining, are the predicted pressures around the TBM
correct, and what are the consequences for our
design methods? Even in a relatively simple beam
calculation for calculating loading on the lining in a
longitudinal direction it appears that uncertainties
in the boundary conditions determine the outcome
of the calculation. As long as these uncertainties
remain, more sophisticated numerical calculations
will present the same uncertainties.
ACKNOWLEDGEMENTSThe research described in this paper was sponsored
by COB, the Dutch Centre for Underground
Construction, and Delft Cluster. We would like to
thank these organisations for giving us the
opportunity to perform this research. We also wish
to thank the project organisations of the different
tunnels for giving permission to use tunnelling data in
our research. And last but not least, we would like to
thank our fellow members in the COB committees for
their stimulating discussions on the various subjects.
REFERENCES– Aime R, Aristaghes P, Autuori P. and S.Minec,
2004. 15 m Diameter Tunneling under Netherlands
Polders, Proc. Underground Space for Sustainable
Urban Development (ITA Singapore), Elsevier.
– Anagnostou G. & Kovári K., 1994. The face
stability of Slurry-shield-driven Tunnels. Tunnelling
and Underground Space Technology, Vol 9.
No.2. pp 165-174.
– Bakker K.J. & Bezuijen A., 2008. 10 years of bored
tunnels in the Netherlands. Proceeding 6th Int.
Symposium on Underground Construction
in soft Ground, Shanghai
– Bezuijen A. 2007. Bentonite and grout flow
around a TBM. Proc. ITA 2007, Prague.
– Bezuijen A. & Zon W. van der, 2007. Volume
changes in grout used to fill up the tail void.
Proc. ITA 2007, Prague.
– Bezuijen, A. & H. van Lottum (eds), 2006,
Tunnelling A
– Decade of Progress. GeoDelft 1995-2005, Taylor
and Francis/Balkema, Leiden, ISBN 0 415 39113 4
– Bezuijen A., Talmon A.M., Kaalberg F.J. and
Plugge R., 2004. Field measurements of grout pressu-
res during tunneling of the Sophia Rail tunnel. Soils
and Foundations vol, 44, No 1, 41-50, February
– Bezuijen A., Talmon A.M, 2003. Grout the foundati-
on of a bored tunnel, 2003, Proc ICOF 2003 Dundee.
– Bezuijen A., 2002. The influence of soil permeability
on the properties of a foam mixture in a TBM. 3rd. Int.
Symp. on Geotech. Aspects of Underground
Construction in Soft Ground, IS-Toulouse
– Bezuijen A., Pruiksma J.P., Meerten H.H. van 2001.
Pore pressures in front of tunnel, measurements,
calculations and consequences for stability of tunnel
face. Proc. Int. Symp. on Modern Tunneling
Science and Techn. Kyoto.
– Bogaards P.J., Bakker K.J. 1999, Longitudinal
bending moments in the tube of a bored tunnel.
Numerical Models in Geomechanics Proc.
NUMOG VII: p. 317-321
– Broere W. 2001. Tunnel Face Stability & New CPT
Applications. Ph.D. Thesis, Delft University of
Technology, Delft University Press.
– Gafar K., Soga K., Bezuijen A., Sanders M.P.M.
and A.F. van Tol, (2008) Fracturing of sand in
compensation grouting. Proceeding 6th Int.
Symposium on Underground Construction in soft
Ground, Shanghai. Guglielmetti V., 2007. Tunnels
and Tunnelling International, October, P32.
– Hashimoto T., Brinkman J., Konda T., Kano Y.
Feddema A.. 2004. Simultaneous backfill grouting,
pressure development in construction phase
and in the long term. Proc. ITA Singapore.
– Hoefsloot F.J.M. 2008, Analytical solution
longitudinal behaviour Tunnel lining, Proceeding
6th Int. Symposium on Underground Construction
in soft Ground, Shanghai
– Kasper T. & Meschke G., 2006. On the influence
of face pressure, grouting pressure and TBM
design in soft ground tunnelling. Tunn. and
Undergr. Space Techn.21 160–171
– Leca E. & Dormieux L., 1990. Upper and lower
bound solutions for the face stability of shallow
circular tunnels in frictional material.
Géotechnique 43, 5-19 (in French)
– Merritt, A.S & Mair R.J., 2006. Mechanics of
tunnelling machine screw conveyors: model tests.
Geotechnique 56, issue 9, November, 605-615.
– McKinley J.D. and Bolton M.D., 1999.
A geotechnical description of fresh cement grout –
Filtration and consolidation behaviour. Magazine of
Concrete Research 51, Vol. 5 October, 295-307
– Steiner W. (1996) Slurry penetration into coarse
grained soils and settlements from a large slurry shield
tunnel. Proc. Geotech. Aspects of Underground
Construction in Soft Ground, London, Mair
and Taylor (eds). Balkema, Rotterdam, ISBN
9054108568, pp 329-333.
– Steiner W. (2007) Private communication.
Talmon A.M., 2007. Notes on analytical beam
model, Delft Hydraulics report Z3934/Z4145
– Talmon A.M., Aanen L. Bezuijen A. Zon W.H.
van der, 2001. Grout pressures around a tunnel
lining Proc. Int. Symp. on Modern Tunneling
Science and Techn. Kyoto.
– Thewes, M., (2007), Private communication.
– Verruijt A., (1993), Soil Dynamics,
Delft University of Technology, b28.
REPRINTED FROM: Bezuijen, A. Talmon,
A.M. 2008. Processes around a TBM,
In: Charles Ng et al. (eds),Geotechnical Aspects
of Underground Construction in Soft Ground.
Proceedings of the 6th International Symposium
IS-Shanghai 2008 (Shanghai, China, 10-12 April
2008), forthcoming 2009.
© 2009 Taylor & Francis. Used with permission.
PROCESSES AROUND A TBM