Embed Size (px)
Citation preview
P R O D U C T P R O F I L E
SourcePoint™ for ARM®
ArchitecturesSourcePoint™ is Arium’s flagship software debugger forARM®, Xscale, and TI OMAP™ processors. The software,versatile, customizable, and reliable, offers excellent visi-bility to C and C++ code and its execution. It runs onMicrosoft® Windows® and Linux hosts, debugging plat-forms with various RTOSs, including Linux, or no RTOS atall.
Arium tools deliver feature-rich, real-time debug, from theway SourcePoint views are required to the way the com-
SourcePoint™ for ARM®
Architecturesmand language scriping works, to the speed with whichtasks execute. Run control is state of the art. Trace isintegrated. Performance analysis data match the realexecution time of the program being run. There’s multi-core debug, too, complete with individual processorcontrol.
SourcePoint offers a number of unique but highly intu-itive features, making it and exceptional debugger fortoday’s today’s ARM-Architecture projects.
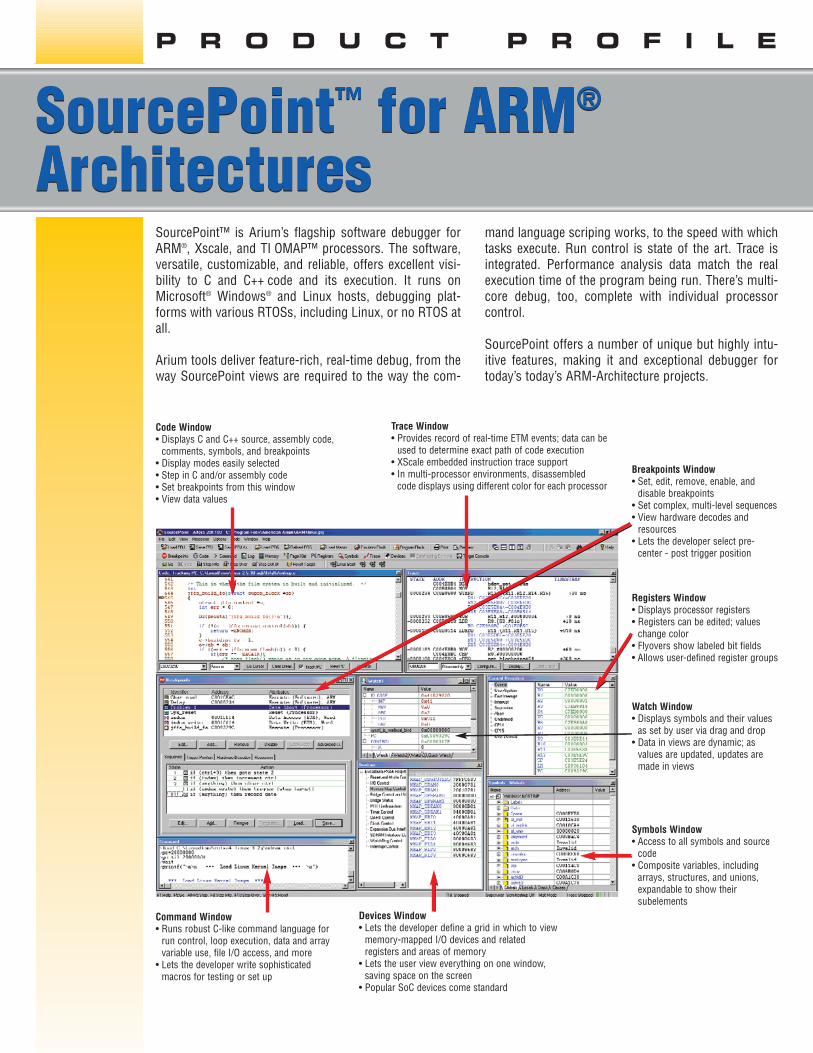
Code Window• Displays C and C++ source, assembly code,
comments, symbols, and breakpoints• Display modes easily selected• Step in C and/or assembly code• Set breakpoints from this window• View data values
Trace Window• Provides record of real-time ETM events; data can be
used to determine exact path of code execution• XScale embedded instruction trace support• In multi-processor environments, disassembled
code displays using different color for each processor
Breakpoints Window• Set, edit, remove, enable, and
disable breakpoints• Set complex, multi-level sequences• View hardware decodes and
resources• Lets the developer select pre-
center - post trigger position
Registers Window• Displays processor registers• Registers can be edited; values
change color• Flyovers show labeled bit fields• Allows user-defined register groups
Watch Window• Displays symbols and their values
as set by user via drag and drop• Data in views are dynamic; as
values are updated, updates are made in views
Symbols Window• Access to all symbols and source
code• Composite variables, including
arrays, structures, and unions,expandable to show their subelements
Devices Window• Lets the developer define a grid in which to view
memory-mapped I/O devices and related registers and areas of memory
• Lets the user view everything on one window, saving space on the screen
• Popular SoC devices come standard
Command Window• Runs robust C-like command language for
run control, loop execution, data and arrayvariable use, file I/O access, and more
• Lets the developer write sophisticatedmacros for testing or set up
SourcePoint™ for ARM® ArchitecturesA good debug solution offersthe programmer or developerlayers of debugging options -from the simple breakdown ofcode into ever smaller itera-tions to the ability to captureand analyze huge amounts ofexecution history in a singlerun. To meet developers’needs, American Arium offersseveral solutions, all of whichemploy the company’s flag-ship SourcePoint debugger.
Managing Run ControlThe key to a successful run control debug strategy liesin the ability to set accurate breakpoints and stepthrough code. SourcePoint offers processor and softbreaks via simple GUIs. Breaks can also be set fromthe Code window or a command line.
SourcePoint uses the usual stepping commands alongwith go and halt to step through source or assembly-level code. SourcePoint’s C-like command languageincludes not only industrystandard run control com-mands, but lets the developer execute loops, use dataand array variables, access file I/O, and more. Unlikesome command languages, SourcePoint is intuitive;developers do not need to know a twoletter code foreach command.
Intuitive windows can be opened to view the state ofthe processor and make modifications to values,including Symbols windows, Registers windows,Memory windows, and user-defined Watch windows.In multi-core environments, developers can maskprocessors together or individually and start, step,and stop those not masked.
Arium’s debug solutions aredesigned with time in mind.Whether downloading files orimages, stepping throughcode, or coming back afterhitting stop, the event exe-cutes with incredible speed.
SourcePoint™ for ARM® Architectures
Capturing, Filtering ANalyzing Execution HistoryFor developers who want more than run control,SourcePoint offers some of the best trace functionalityon the market today. The debugger handles trace via theEmbedded Trace Macrocell (ETM) in ARM processorsand produces solid execution history from XScaleprocessors. Several features make SourcePoint a true“solutions” debugger, including integrated trace, tracebuffer depth, easy multi-level triggering, and perform-ance analysis.
Integration. SourcePoint trace is integrated into the soft-ware package; it is not an “add on.” Advantages? There’sthe obvious - developers do not have to deal with (or payfor) a separate trace port analyzer. There is no new soft-ware to load. Users do not have the integration problemsthat plague add-on solutions. Apart from the obvious,the greatest advantage is being able to open a Code win-dow and scroll through the collected trace, examiningthe actual code and how the compiler compiled it, withcorrelated code and trace.
P R O D U C T P R O F I L E
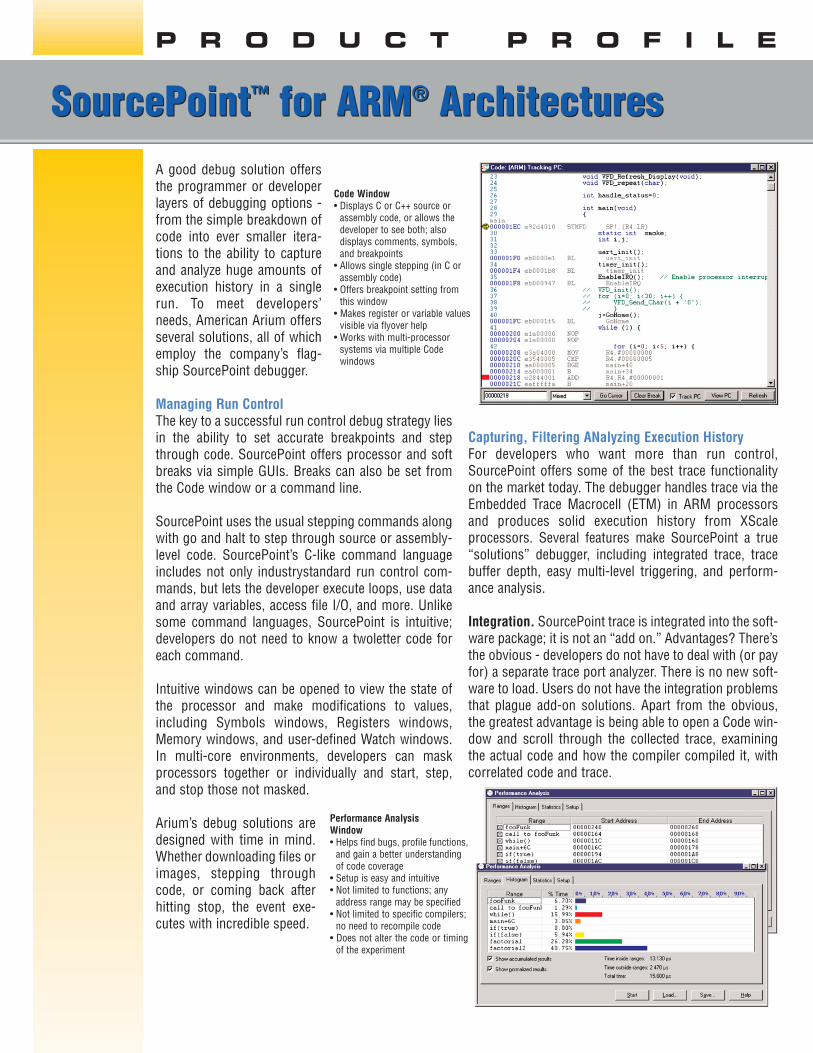
Code Window• Displays C or C++ source or
assembly code, or allows the developer to see both; also displays comments, symbols, and breakpoints
• Allows single stepping (in C or assembly code)
• Offers breakpoint setting from this window
• Makes register or variable valuesvisible via flyover help
• Works with multi-processor systems via multiple Code windows
Performance AnalysisWindow• Helps find bugs, profile functions,
and gain a better understanding of code coverage
• Setup is easy and intuitive• Not limited to functions; any
address range may be specified• Not limited to specific compilers;
no need to recompile code• Does not alter the code or timing
of the experiment
SourcePoint™ for ARM® Architectures
Deep/fast trace. With Arium’s GT-1000D emulator,SourcePoint delivers trace depth up to 1 GByte with acapture rate up to 640 MHz, depending on the applica-tion. For those who can get along with a smallerbuffer, there’s the HS-1000, which offers 256 MBytesof trace at a blazing 680 MHz.
Multi-level triggering. When used with the GT-1000Dor HS-1000 and a target with ETMv1 or ETMv3,SourcePoint offers superb complex sequencing via aseries of user-friendly GUIs. Based on breakpoints andother user-defined events, trigger parameters can bequalified or refined. For example, an event may occurthousands of times in a program. A developer can setup a breakpoint to trigger only after the first thousandtimes it occurs and only if it occurs after a particularaddress. Unlike other debuggers, SourcePoint doesnot require “rocket science” to set up the triggeringsequence.
Performance analysis. SourcePointincludes performance analysis for usewith ARM cores with ETM. While mostdevelopment tools rely on a compiler tohandle performance analysis, SourcePointuses the ARM ETM to mine data fromcode. The ETM has up to 16 address com-parators that can be programmed withfunction entry and exit points.
Trace qualification is used to record onlythose addresses in the trace buffer. Thisgives the developer approximately140,000 real-time entry and exit points in
SourcePoint™ for ARM® Architecturesa 1 MB trace buffer (each address gen-erating a 5-byte broadcast addressconsuming 7 cycles), resulting in a sin-gle trace capture that can contain thou-sands of instances of each addressrange. This solution requires nochanges to the user's program, andmeasured performance data match thereal execution time of the programbeing run.
Arium also offers code profiling for tar-gets with processors without ETM.
SourcePoint on a Linux PlatformSourcePoint delivers industry-leading functionality fordevelopers working on Linux-based embedded systems,including:• Full symbolic, source-level debugging of Linux
kernel code• Source-level debugging of Linux embedded
applications• Launch of or attachment to processes with seamless transitions to and from the kernel and each process• Code debug on initial target bringup immediately
from board reset• Dynamically loaded module debug (insmod)• Threaded application debug support• Linux shared libraries debug• Specialized breakpoints to stop the execution of a
process without stopping the processor or causingit to enter debug mode
• Flash programming for kernel and file-system download
P R O D U C T P R O F I L E
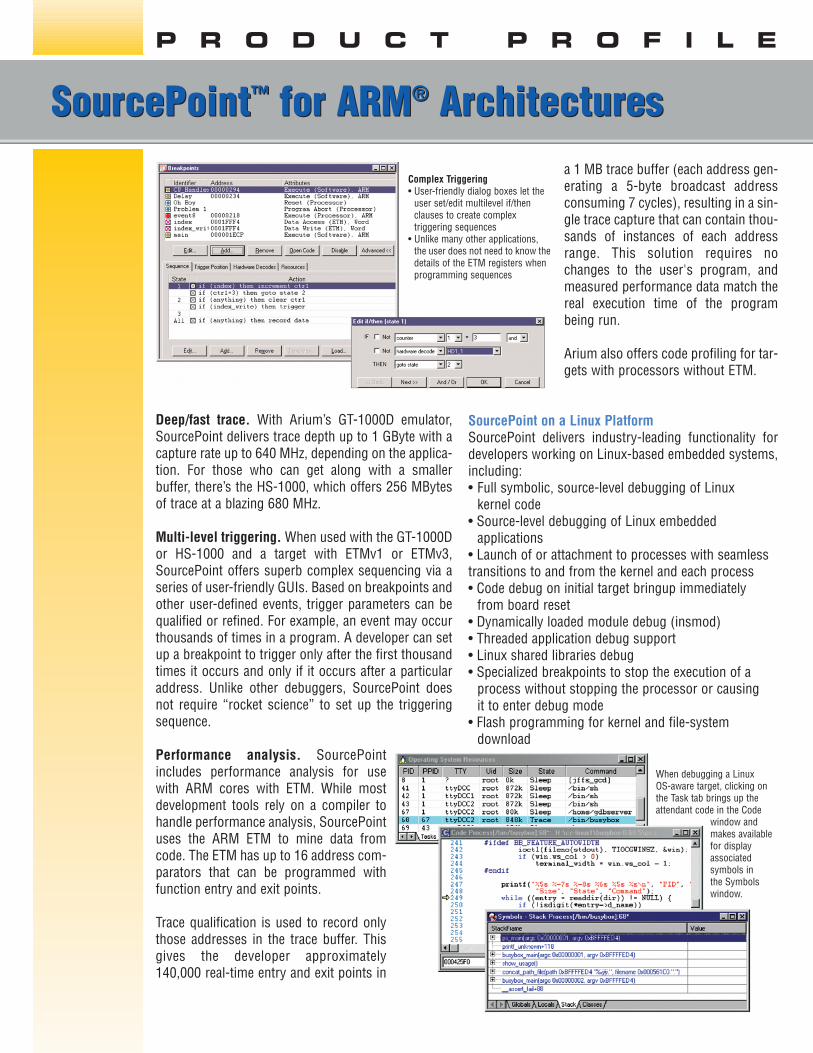
Complex Triggering• User-friendly dialog boxes let the
user set/edit multilevel if/then clauses to create complex triggering sequences
• Unlike many other applications,the user does not need to know thedetails of the ETM registers whenprogramming sequences
When debugging a Linux OS-aware target, clicking onthe Task tab brings up theattendant code in the Code
window andmakes availablefor displayassociated symbols in the Symbolswindow.
SourcePoint™ for ARM® Architectures• Linux console hosting devices from within
SourcePoint, eliminating the need for a serial port orvideo device on the target and simplifying the debugging of "headless systems"
• Intuitive, Windows-like debug environment
SourcePoint allows concurrent debugging of Linuxkernel code and Linux application processes. WithinSourcePoint, two views provide the interfaces toLinux-aware debugging features. The OperatingSystem window lists Linux processes and serves asthe primary interface for task debugging. The TargetConsole window emulates multiple terminals thatserve as the Linux system console and as the standardinput and output device for processes launched fordebugging.
Shortcuts within shortcutsSourcePoint incorporates hundreds of options, com-mands, and functionalities designed to spur the debugprocess forward. Windows are designed to be intu-itive. They can be docked, floated, or minimized. Com-mands are available from multiple locations - menubars, icon bars, context menus, a command line.Symbols and their values are easy to find and change.
Items are grouped logically in intuitive windows anddialog boxes. For example, target configurationoptions exist under a single view. From the dialog, thememory map of the target can be defined, the type andaddress range of flash memory devices declared, and
SourcePoint™ for ARM® Architecturestarget flash operations performed. Target configurationscan be loaded from a developer’s target database file andsaved to SourcePoint and/or the target database file.
SourcePoint offers a number of userdefined options.These include windows that allow definition of memo-rymapped I/O devices and related registers and areas ofmemory in one view. Developers can keep track of mul-tiple devices without having to keep multiple views ontheir screen.
Outstanding SupportAmerican Arium offers exceptional service and supportfor all of its debug solutions. Highly qualified technicalsupport staff are available during regular working hours,and delays getting to them are minimal. Often they canpinpoint a problem immediately or on review of a dumpof the log and project files. Support staff can also trou-bleshoot particularly difficult problems via WebEx™, anonline, interactive solution that allows them to see adeveloper’s code but lets the developer control the ses-sion. Additionally, there are downloads and technicaldocumentation available on the Arium Web site.
SourcePoint ships with Arium hardware or separately asupgrades to previously purchased hardware-assistedsolutions. For more information, contact your sales rep-resentative or Arium tools distributor or visit our Website at www.arium.com.
P R O D U C T P R O F I L E
14811 Myford Road, Tustin, CA 92780 Voice: 877-508-3970 toll free in the US, 714-731-1661 outside the US Fax: 714-731-6344 E-mail: [email protected] Web: www.arium.comSourcePoint is a trademark of American Arium. ARM, ARM7/9/11/Cortex and Thumb are trademarks or registered trademarks of ARM Ltd. OMAP is a trademark of Texas Instruments Inc.WebEx is a trademark of WebEx Communications Inc. Microsoft and Windows are registered trademarks of Microsoft Corp. Copyright © 2007 American Arium D0130L
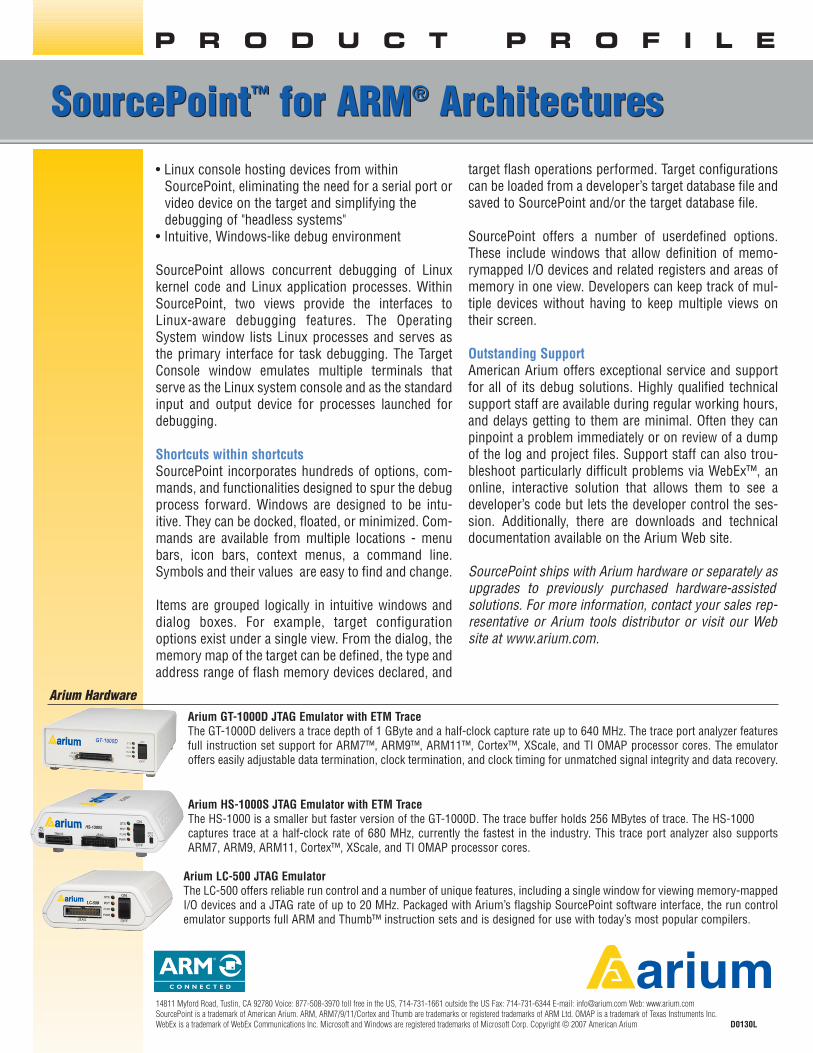
Arium GT-1000D JTAG Emulator with ETM TraceThe GT-1000D delivers a trace depth of 1 GByte and a half-clock capture rate up to 640 MHz. The trace port analyzer featuresfull instruction set support for ARM7™, ARM9™, ARM11™, Cortex™, XScale, and TI OMAP processor cores. The emulatoroffers easily adjustable data termination, clock termination, and clock timing for unmatched signal integrity and data recovery.
Arium HS-1000S JTAG Emulator with ETM TraceThe HS-1000 is a smaller but faster version of the GT-1000D. The trace buffer holds 256 MBytes of trace. The HS-1000 captures trace at a half-clock rate of 680 MHz, currently the fastest in the industry. This trace port analyzer also supportsARM7, ARM9, ARM11, Cortex™, XScale, and TI OMAP processor cores.
Arium LC-500 JTAG EmulatorThe LC-500 offers reliable run control and a number of unique features, including a single window for viewing memory-mappedI/O devices and a JTAG rate of up to 20 MHz. Packaged with Arium’s flagship SourcePoint software interface, the run controlemulator supports full ARM and Thumb™ instruction sets and is designed for use with today’s most popular compilers.
Arium Hardware