Embed Size (px)
Citation preview
This paper is competing to the Young Economist Award.
Productivity, Growth, and Internationalisation: The Case of German and British High Techs *
by
Helmut Fryges **
this version: March 2005
Abstract: International engagement is often expected to improve firm performance. Especially for small technology-oriented firms, export activities may be important, being regarded as one way to amortise these firms’ high product research and development costs. This paper examines the relationship between international business activities and firm performance using a sample of about 200 young high-tech firms in Germany and the UK that were contacted by two surveys in 1997 and 2003. I find out that the performance enhancing effects of internationalisation that were still observed in 1997 are in fact restricted to an early stage of the firms’ life cycles and disappear when technology-oriented firms become mature. The results are in line with many other studies: Firms exhibiting superior performance are or will become exporters.
Keywords: High technology industries, internationalisation, firm growth, productivity, switching regression.
JEL Classification: F23, L25, L60, L86
* I gratefully acknowledge financial support from the HSBC Innovation and Technology Group and the Anglo-German Foundation for the Study of Industrial Society. Helpful suggestions by Joachim Wagner, Dirk Czarnitzki, and Ulrich Kaiser are also gratefully acknowledged. I thank Marc Rennert, Martin Becker, Natalie Gaier, Stefan Hoffmann, and Thea Platz for their competent research assistance and Ty-ler Schaffner for proofreading. Special thanks go to Marc Cowling and Gordon Murray for carrying out the survey this study is based on in the UK. All remaining errors are my own.
** Centre for European Economic Research, Department of Industrial Economics and International Management, P.O. Box 103443, D-68034 Mannheim, Germany, e-mail: [email protected]
1
1 Introduction
Today, the overwhelming majority of economists and politicians is convinced that an outward-
looking export-oriented policy positively affects a country’s welfare – for example by increasing
GDP growth rate or improving productivity. Aggregate cross-country data sets have been used in
the past to explore the relationship between trade and macroeconomic indicators.1 More recently,
however, a growing literature investigates at the microeconomic (read: firm) level how interna-
tional trade is related to various measures of firm performance. If there are positive effects of trade
on macroeconomic indicators, they should be reflected by microeconomic data such as improved
firm performance.
International engagement may be especially important for small technology-oriented firms, since
export activities are often regarded as one way to amortise these firms’ high product research and
development costs.2 If international business activities really increase the performance of young
high-tech firms, internationalisation will help firms fulfil the hopes often placed upon them with
respect to structural change, innovation, and job creation. In order to investigate the relationship
between export behaviour and firm performance, a joint research team of the London Business
School and the Centre for European Economic Research (ZEW) contacted a stratified random
sample of German and UK technology-based firms founded between 1987 and 1996 via a written
questionnaire (see Bürgel et al. 2004). It turned out that about two-thirds of the 600 responding
firms had international business activities at the time of the survey 1997/1998, which is already an
impressive number. Furthermore, the researchers found out that internationalisation did indeed
improve the firms’ labour productivity and increased their annualised sales growth rates between
the firms’ start-up and 1997, but did not affect employment growth.
However, these results contradict many other studies examining the causal relationship between
exports and firm performance. All of these studies confirmed the stylised facts that exporters are
larger, more productive, and exhibit higher growth rates, but most including those by Clerides et
1 See Baldwin (2000) for a discussion of theoretical and empirical studies analysing the relationship between trade
and macroeconomic growth. Baldwin emphasizes that there is still considerable controversy among economists as to how trade and economic growth interact. Particularly, there is disagreement on the precise effects of various trade policies (e.g., trade taxes, subsidies, quotas) on growth.
2 In this paper, only firms that export their products or services are regarded as internationally active. This means that only internationalisation on the sales market is considered. Of course, firms may import investment goods or components, i.e., internationalise on the procurement market. Although the latter way of internationalisation may also be important for small high-tech firms, it is neglected in this paper.
2
al. (1998), Bernard and Wagner (1997), and Bernard and Jensen (1999), found a reverse causality,
i.e., the superior performance of internationally active firms is a result of self-selection of “good”
firms into the international market. Conversely, there is little evidence that internationalisation has
a causal effect on firm performance.
One can quite reasonably assume that young high-tech firms behave differently from the firms
studied by the papers cited above. Firstly, most other studies examine mature firms, in contrast to
the sample of newly founded firms that were observed by Bürgel et al. (2004). Secondly, there
may be structural differences in firms operating in high-technology sectors, as analysed by Bürgel
et al., compared with firms in low-tech sectors. For example, technology-oriented firms might
improve their labour productivity because they can better profit form learning effects by exporting
(see the “learning by exporting” hypothesis in the next section) than low-tech firms.
In order to find out whether the observed causal effects remain valid as high-tech firms age be-
cause the causalities are a result of structural differences particular to them, or whether the positive
effects are restricted to the start-up period, this paper re-examines the relationship between export
behaviour and firm performance. For this, data from a second survey conducted in summer 2003
by the ZEW and the University of Exeter are used. All surviving firms from the original sample,
which are now 12 years old on average, were contacted again. In order to ascertain a high response
rate, a computer-assisted telephone interview (CATI) was used. A response rate of 55 % was
obtained, and, after performing several consistency checks, 217 companies were retained for the
analyses.
Estimating a labour productivity model and a growth model (for employment and sales growth)
that both consider a possible simultaneity between the status of internationalisation and the respec-
tive measure of firm performance, the results are quite clear-cut: Good firms are or will become
exporters. Both the productivity-enhancing effect of internationalisation and the (sales) growth-
increasing effect are restricted to early stages of high-tech firms’ development in Germany and the
UK and do not appear when the firms are analysed during later stages of their life cycles. As in
most other studies, firms exhibiting superior performance are or will become exporters.
This paper proceeds as follows: Section 2 reviews theoretical arguments and empirical studies that
deal with the relationship between performance and internationalisation. Section 3 describes the
data set, and section 4 derives the models the econometric analysis is based on. The econometric
methodology is explained in section 5. Section 6 contains the descriptive analyses. The economet-
ric results are discussed in section 7, and section 8 concludes.
3
2 Performance and Internationalisation
Depending on the performance indicator regarded, different theoretical arguments have been
derived on how firm performance and international business activities might be related. The
direction of causality, however, is not clear a priori: On the one hand, exporting might improve
firm performance, and on the other, firms with superior performance might become exporters. In
the following, I will summarize arguments that relate internationalisation and the two performance
indicators analysed in this paper: productivity and growth. In related literature, the relationship
between survival and internationalisation is also discussed (see, e.g., Sapienza et al. [2003] for
theoretical arguments and Yli-Renko et al. [2004] or Bernard and Jensen [1999] for empirical
results). Since the econometric analysis of this paper is based on survey data and only the
representatives of still living firms have been contacted, the influence of being an exporter on the
probability of survival cannot be examined empirically. I will neglect the latter relationship
hereafter. It should be emphasized that productivity, growth, and survival are neither exclusive nor
independent from one another. At least in the long run, these three performance indicators can be
expected to be positively correlated. For example, growing firms might profit from economies of
scale so that a given number of employees can produce more output, which, taking the product
price as given, results in higher sales per employee – our measure of labour productivity.
Similarly, economic theory predicts that in any industry, the least productive firms exit from the
market first, thus showing a smaller survival probability.3
One of the most frequently heard arguments on how productivity and internationalisation might be
related is the “learning by exporting” hypothesis. Exporting firms are supposed to learn from
internationally leading customers, suppliers, or competitors with respect to best practice technol-
ogy or even product designs (see, e.g., Evenson and Westphal 1995). Thus, exporters may profit
from technological or knowledge spillovers. In other words, the productivity-increasing effect of
international sales results from knowledge and expertise on the foreign market that non-exporters
do not have (Aw et al. 2000).
Another argument is mainly associated with McKinsey (1993). Firms that have international sales
are assumed to be exposed to greater competition than firms with only domestic sales. They are
forced to exploit their resources more efficiently, reduce costs and increase their productivity in
order to remain exporters. However, one might object that in open economies like Germany or the
3 In some cases, however, the correlation between different performance indicators might be negative. Reid (1995),
for example, finds a trade-off between profitability and growth for young, small firms in Scotland.
4
UK, domestic firms also face the competition from foreign companies because of imports to the
domestic market (“imported” competition; see Bernard and Wagner 1997).4
Labour productivity, however, is not necessarily the main interest of policy makers, employees,
investors, or owners. The two former groups are primarily concerned with the employment-
generating effect of internationalisation, whereas investors and owners focus on sales or a firm’s
market value. Since the foreign market could be regarded as an expansion of the domestic market,
firms can realise economies of scale and an ensuing increase in sales and employment by carrying
out international business activities. This mechanism is known in related literature as export-led
growth (see Feder 1982). Moreover, international sales can compensate for variations in domestic
demand (Bernard and Wagner 1997) so that firm’s growth processes are less dependent on the
domestic market.
The argument of export-led growth seems to be especially important for young technology-
oriented firms. These firms often produce highly specialised products or services (niche strategy)
in limited domestic markets, making international business activities the only way to ensure long-
term company growth. Moreover, young high-tech firms are often faced with high costs of re-
search and development. If exports lead to higher growth rates, this can facilitate the amortisation
of high product R&D costs (Bürgel et al. 2004).
International engagement is associated with significant entry costs, such as marketing campaign
expenses or the costs of setting up foreign sales channels, which may be regarded as sunk costs.
Small and less productive firms might not be able to bear these costs of foreign market entry.
Therefore, we should observe that only firms that have achieved a certain size or a certain level of
labour productivity enter the international market. This leads us to anticipate a self-selection of
firms with superior performance into the international market. This argument describes the reverse
causation: Firms with “good” performance become exporters (cf., e.g., Bernard and Wagner 1997
or Bernard and Jensen 1999).
Based on the Ricardian theory of comparative advantage, Bernard et al. (2000) derived a theoreti-
cal trade model that traces back the self-selection of firms with higher productivity into the export
market to firm-specific differences in efficiency.5 International business activities constitute a
4 In fact, the latter argument is often stated by the literature concerning development economics. In developing
countries, firms are often confronted with barriers to entry into the domestic market, implying less fierce competi-tion (see Aw and Hwang 1995 for further details).
5 Firm efficiency is defined as the inverse number of input bundles necessary to produce one unit of output. Thus, a firm is more efficient when it needs fewer input bundles to produce one unit of output. In contrast, productivity is
5
higher “efficiency hurdle” (Bernard et al. 2000, p. 15) than domestic sales.6 Thus, firms with
higher efficiency are more likely both to export and to have higher measured productivity, which
corresponds to the usually observed stylised fact that exporting firms are more productive on
average. The model is also able to explain the stylised fact that firms with international business
activities tend to be larger: more efficient firms are not only more likely to export, they are also
more likely to charge lower prices, which, in the case of an elastic demand, will lead to higher
sales (see Bernard et al. 2000, p. 16, for more details).
The amount of empirical literature examining the relationship between firm performance and
internationalisation has grown considerably in recent years. Clerides et al. (1998) tested empiri-
cally a theoretical model of export participation and learning effects using a data set of manufac-
turing plants of Colombia, Mexico, and Morocco observed in the 1980s. Descriptive analyses
confirmed that exporting plants were more productive than their non-exporting rivals. The ques-
tion of causality, however, remains. Based on their model, Clerides et al. derived two conflicting
hypotheses: If learning effects are prevalent, the trajectories of average costs must reveal a cost
reduction after the plant has entered the foreign market. If, however, plants with superior produc-
tivity become exporters, cost reductions must be present before the plants start exporting. Apply-
ing simulation techniques and simultaneously estimating an autoregressive cost function and a
dynamic export market participation equation, Clerides et al. found evidence for the latter sce-
nario, i.e., the positive relationship between status of internationalisation and labour productivity is
a result of a self-selection of more productive plants into foreign markets.
Bernard and Jensen (1999) and Bernard and Wagner (1997) produced similar results when analys-
ing panel data of US and German manufacturing firms respectively. Most importantly, both studies
confirmed that firms with superior performance self-select into the international market. Bernard
and Jensen found that exporting firms benefit from their international engagement, enjoying higher
employment growth rates after foreign market entry and a higher probability of survival compared
with non-exporting firms. However, the study of Bernard and Wagner revealed that the higher
survival rates of exporting German firms can be explained by their superior performance charac-
teristics before foreign market entry.
defined as the value of output (i.e., sales) per bundle of input, or per an input factor like number of employees. Un-der perfect competition, measured productivity is equal to the price of the input bundle regardless of a firm’s rela-tive efficiency. Under imperfect competition, productivity is the price of the input bundle times a firm-specific markup. Bernard et al. (2000) prove that, in their model, more efficient firms charge, on average, a higher markup. Therefore, differences in productivity reflect differences both in efficiency and in a firm’s monopoly power.
6 In the model, among all potential producers of any good only the most efficient ones serve the (domestic) market.
6
Using the same data set as Bernard and Wagner (1997), Wagner (2002) introduced the application
of matching techniques in order to re-examine the export-performance relationship. In contrast to
the earlier results, he then obtained significantly positive effects that starting to export has on
employment growth and wages, but no statistically significant causal effect on labour productivity.
Also using a matching approach, De Loecker (2004) proved that exports generate higher total
factor productivity of Slovenian manufacturing firms. Analysing a panel data set of UK firms,
Girma et al. (2002) applied matching techniques and found a feedback relationship between the
firms’ export activities and productivity (labour productivity as well as total factor productivity):
Highly productive firms become exporters, but exporting also increases productivity. Apparently,
using matching techniques leads to results that are more in favour of a causal effect of interna-
tional business activities on firm performance. However, the results are still mixed. Arnold and
Hussinger (2004) examined German manufacturing firms from the Mannheim Innovation Panel.
The results of their matching analysis are in line with most of the studies cited above: Causality
runs from productivity to exporting, and not vice versa. Therefore, it remains questionable to what
extent the conflicting findings are a consequence of varying empirical methodologies or structural
differences of the analysed firms.
This paper examines a data set of German and UK technology-oriented firms founded between
1987 and 1996. The firms in the sample were contacted by two surveys, one in 1997 and the other
in 2003 (see the following section for more details). Bürgel et al. (2004) investigated the relation-
ship between firm performance and internationalisation behaviour for the period from the firms’
start-up until 1997, using data from the first survey. They found that an international engagement
improves labour productivity and increases sales growth rate, but does not affect employment
growth rate. The foreign market may be particularly important for young, small, technology-
oriented firms, especially for those operating in a narrow market niche. Similarly, productivity-
increasing learning effects might be more relevant for newly founded firms than for mature firms
investigated by the papers quoted above (compare the theoretical models of “active” and “passive”
learning developed by Ericson and Pakes [1995] and Jovanovic [1982], respectively). Moreover,
young high-tech firms can be expected to be able to absorb the information gained on the interna-
tional market and transform this information into increased productivity. Hence, there are argu-
ments as to why there might be structural peculiarities of the firms in our sample that lead to
causal effects of exporting on firm performance contradictory to most of the other studies cited
above, especially with respect to labour productivity. This paper addresses the question of whether
these causal relationships remain valid as firms age and reach a more “mature” stage of their life
cycles or whether the positive role of exports is restricted to high-tech firms’ start-up periods.
7
3 The Data
This paper examines the relationship between internationalisation and performance of technology-
oriented firms in Germany and the UK. Technology-oriented firms are identified using the defini-
tion of high-technology manufacturing sectors in the UK established by Butchart (1987). He
provided a definition based on, firstly, the ratio of R&D expenditures to sales and, secondly, the
share of employees working in R&D. A sector is defined as “high-tech” if it is characterized by a
“substantially above-average” value in at least one of the two criteria and an “above-average”
value in the other. Using this definition, Butchart identified nineteen UK 1987 SIC codes, which
were translated into the NACE Rev. 1 code and are listed in detail in Table 7 of this paper’s ap-
pendix. Table 7 defines four aggregated manufacturing sectors and augments Butchart’s list with a
number of selected service sectors (cf. Bürgel et al. 2004).
The data for this paper’s empirical analysis result from two surveys simultaneously carried out in
Germany and the UK. The source data set originates from Dun & Bradstreet in the UK and
Creditreform7 in Germany. Using these databases, all firms with at least three employees in 1997
that were operating in one or more high-tech sectors as defined by Butchart (1987) and having
been founded as legally independent companies8 between 1987 and 1996 were selected. This
resulted in a population of 3,562 firms from the UK and 5,045 from Germany. The sample compo-
sition of the 1997 population is given in Table 8 in the appendix. A random sample of 2,000 firms
was drawn from each country’s population, stratified by size, sector (manufacturing versus ser-
vices), and, for Germany, by region (West and East Germany).
The firms were first contacted in winter 1997/1998 via a written questionnaire. The first survey
was carried out by the London Business School in the UK and the Centre for European Economic
Research (ZEW) in Germany. The written questionnaire contained questions regarding the profile
of the firms’ founder(s), product characteristics, international business activities, entry modes into
foreign markets, and perceived opportunities and risks of international activities. 362 completed
questionnaires returned from the UK, 232 questionnaires from Germany, resulting in a combined
net sample of nearly 600 NTBFs from the two countries. The net sample showed no bias with
7 As Germany’s largest credit rating agency, Creditreform has the most comprehensive database of German firms at
its disposal. Creditreform provides data on German firms to the Centre for European Economic Research (ZEW) for research purposes.
8 Subsidiaries, de-mergers or firms that were founded as a management buy-out (MBO) or buy-in (MBI) were excluded from the analysis.
8
respect to age, size, or sector when compared with the random sample. A bias with respect to
internationalisation behaviour could, however, not be ruled out.9
In order to determine the development and status of internationalisation of this sample of 600
NTBFs, a joint research team from the University of Exeter and the ZEW prepared a new survey
in which all previously responding firms were to be contacted a second time. In 2003, the compa-
nies from the original sample were on average of 12 years old. Thus, some of them were no longer
definable as new technology-based firms.10 Considering this notion, we shifted our interest from
analysing newly founded firms to a more longitudinal perspective of firm development.
To determine the target sample of the second survey, at first all formerly responding firms that
turned out to be mismatches (e.g., non-high-tech firms, non-independent foundations) were ex-
cluded. We then eliminated each German firm labelled in the database of Creditreform as “dead”
(due to bankruptcy as well as voluntary firm closure) at the beginning of 2003.11 In the UK, firms
that could be identified as dead by the researchers themselves were also excluded from the target
sample.12 As a result, we produced and subsequently contacted a final target sample of 188 Ger-
man and 250 UK-based formerly responding firms.
The second survey was conducted in 2003 via computer-aided telephone interviews (CATI). The
research team decided on a telephone survey because, due to the limited number of formerly
responding firms in the target sample, the assurance of a relatively high response rate and thereby
a sufficiently high number of observations was necessary to obtaining reliable econometric results.
Fortunately, in both the UK and Germany, the response rate exceeded 50 %, giving us a pool of
244 completed interviews. After performing several consistency checks, 217 companies were
retained in the data set for econometric analyses.
9 The first survey is described in detail in Bürgel et al. (2004). This report also includes numerous descriptive and
econometric analyses of this unique data set. 10 In his influential study, Little (1977) used a definition of NTBFs which includes firms as old as 25 years. In
contrast, the first survey this paper is based on considered only firms that were ten years of age or younger at the time it was taken, which is in line with more recent studies of NTBFs (see, e.g., Storey and Tether 1996).
11 According to the analysis of Prantl (2002), those firms indicated as “dead” by Creditreform have almost certainly left the market. The reverse, however, is not true: Voluntary firm closures are often recorded by Creditreform after a considerable delay, causing the number of closed firms to be underestimated.
12 Table 8 in the appendix also shows the number of still-living firms in 2003. Since the number of mismatches in the population is indeterminable, possible mismatches are not considered in Table 8.
9
4 The Model
Productivity Equation
It is assumed that firm i produces according to a Cobb-Douglas production technology. Output Yi
is a function of the production factors physical capital (Ki), R&D employees (Ri), and non-R&D
employees (Li):13
(1) iui i i iY A K R L eα β γ= ⋅ ⋅ ⋅ ⋅ .
The scalar A is a parameter of production efficiency that shifts the isoquants of the Cobb-Douglas
production function in parallel to the origin. The exponents α, β, and γ denote the partial produc-
tion elasticities of output with respect to capital, R&D, and labour, respectively, and u is a nor-
mally distributed error term. Taking logarithms and subtracting labour from both sides results in an
equation for labour productivity, i.e., output per non-R&D employee:
(2) ( )ln ln ln ln 1 lni i ii i
i i i
Y K RA L uL L L
α β µ⎛ ⎞ ⎛ ⎞ ⎛ ⎞
= + ⋅ + ⋅ + − ⋅ +⎜ ⎟ ⎜ ⎟ ⎜ ⎟⎝ ⎠ ⎝ ⎠ ⎝ ⎠
.
The sum of production elasticities µ = α + β + γ will be unity if the production function has con-
stant returns to scale. Thus, the coefficient of the logarithm of labour (µ − 1) measures departure
from constant returns so that equation (2) already includes a test for constant returns. This implies
that the input factors capital and R&D employees enter the labour productivity equation as intensi-
ties with respect to non-R&D employees.14
To implement the labour productivity equation econometrically, output is measured as sales per
1,000 euro in 2002. Thus, labour productivity is measured as sales per non-R&D employee. In
order to determine R&D employment, firms were asked how many of their employees spent at
least 50 % of their time on research and development of new and existing products or services.
Taking this number, I apply the most conservative estimate of R&D employment by assuming that
all R&D employees only devote 50 % of their time to R&D. The number of R&D employees
13 Research and development often enters the production function as R&D capital (cf. Hall and Mairesse 1995).
However, due to data restrictions R&D capital is sometimes approximated by R&D employees. In order to avoid double-counting, labour input is then measured by number of non-R&D employees. I decided to include R&D em-ployees directly as an input factor, not least because, for the service firms in our sample, the knowledge-based pro-duction process can better be described by labour input than by R&D capital.
14 This transformation of the Cobb-Douglas production function was also used by Hall and Mairesse (1995).
10
given by the firms is therefore halved to produce an estimate of R&D employment that will be
used in the econometric model.15
The most severe specification problem lies in finding an approximation of firm-specific stocks of
physical capital. It is generally not possible to collect information on capital stock by survey,
especially not when carrying out telephone interviews. A panel data set containing information on
investment in physical capital over a longer time period – a decade for instance – would allow
calculation of capital stock using the perpetual inventory method.16 Unfortunately, we only have
information on investment in physical capital for the year preceding the second survey, i.e.,
2002.17 Therefore, I decided to use this value of gross investment in physical capital in 2002 to
approximate physical capital.18
Finally, two industry dummy variables and a dummy variable indicating whether a firm is located
in Eastern Germany are added to the productivity equation. The first industry dummy variable
characterizes firms that belong to an engineering industry, the second indicates firms from other
manufacturing sectors including ICT-hardware and health and life sciences. Thus, service firms
are used as the base category. More disaggregated industry dummies might be desirable, but the
number of firms from the sectors ICT-hardware and health and life sciences is very small (cf.
section 6), prompting my decision to consider only two industry dummy variables. The dummy
variable for Eastern German firms is intended to cover the well-known fact that firms in the east-
ern part of Germany exhibit a lower productivity compared with their competitors from the estab-
lished Western European market economies.19
15 My results are not sensitive to this assumption. Using alternative approximations of number of R&D employees,
the estimated coefficients are almost identical to the results shown in section 7. 16 This method is described, among others., by Griliches (1979). 17 Information on investment was not collected by the first survey in 1997/1998. 18 This approximation of capital stock was already applied by Bertschek and Kaiser (2004) and Bertschek et al.
(2004). As an alternative, Bürgel et al. (2004) used data from the Mannheim Innovation Panel (MIP) to calculate an industry-specific approximation of capital stock when analysing the labour productivity of the firms that answered the first survey in 1997. The main advantage of the latter approach is that the absolute value that enters the labour productivity equation is likely to be a good approximation of unobserved capital stock. On the other hand, firm-specific variation is neglected when using industry-specific estimates. The main problem with the ap-proach used in this paper is that gross investment in physical capital often varies significantly from one year to the next. Hence, the results might be different had we merely used the value of gross investment in 2001 instead of that of 2002. However, the econometric results of this paper, as well as the results of Bertschek and Kaiser (2004) and Bertschek et al. (2004), give plausible estimations of the partial production elasticity of capital, i.e., the pa-rameter we are interested in.
19 DIW et al. (2003) state that in Eastern Germany in 2002, GDP per employee only amounts to 71 % of the corre-sponding Western German value. Descriptive analyses of the firms in our sample also show that the labour produc-tivity of Western German firms is significantly higher than that of UK-based firms. However, the dummy variable
11
Growth Equations
From a policy point of view, technology-oriented firms are expected to create new jobs. Politicians
and employees are thus primarily interested in (long-term) employment growth. Similarly, sales
growth could be regarded as the main goal by owners and investors. Therefore, firm growth is
examined as the surveyed firms’ second performance indicator. Although the relationships be-
tween internationalisation and employment and sales growth are estimated separately, the two
growth equations are broadly identical, allowing the following combined discussion of both the
employment growth equation and the sales growth equation.
Firm growth is observed over the period between the two surveys described in section 3, i.e.,
between 1997 and 2002. The logarithm of the annualised growth rate G is given by (see, for exam-
ple, Evans 1987a, 1987b)
(3) 2 1, ,
2 1
ln lnln i t i t
i
E EG
t t−
=−
,
where E is either number of employees or the respective firm’s (discounted) sales, t1 is 1997 and t2
is 2002. The growth equation is specified as a simple heuristic equation
(4) ln i i iG X uδ= + ,
where Xi is a vector of independent variables and ui is a normally distributed error term. In keeping
with related literature on firm growth, a set of exogenous variables is identified that is intended to
affect the firms’ growth rates.
Based on Gibrat’s Law (Gibrat 1931), there are numerous theoretical and empirical studies that
examine the relationship between firm size and growth. Whereas Gibrat’s Law postulates that
growth is independent of firm size (Simon and Bonini 1958, Lucas 1978), empirical studies have
proved that at least for young and small firms like those in our sample, (employment) growth
decreases with firm size (see Sutton 1997 for a survey). The main theoretical argument as to why
growth and size are negatively correlated is as follows20: Firms are often founded with a sub-
for Western German firms is not significant in the productivity equation. An obvious explanation for this is that Western German firms are better equipped with firm-specific resources than UK-based firms. Therefore, a dummy variable for West Germany was not added in the final econometric specification.
20 An evolutionary theory that explains the negative correlation between size and growth was formulated by Cabral (1995). Nelson and Winter (1982), on the other hand, describe a positive relationship between size and growth: firms develop successful routines, allowing firms that have grown faster in the past to continue growing (“persistence of chance”, Wagner 1992).
12
optimal size, i.e., smaller then the minimum efficient scale (MES). By collecting information on its
own productivity and competitors, a young firm approaches the MES in the early years after firm
formation (see Ericson and Pakes 1995 or Jovanovic 1982). This theoretical concept assumes a
neo-classical U-shaped average cost curve and implies that a firm will not grow larger than its
MES in order to avoid increasing average costs. This concept is, however, inconsistent with long-
term growth, this paper’s actual intended focus. To explain long-term growth beyond the MES, we
must assume imperfect competition, making the cost curve L-shaped. In this case, firm growth will
only be restricted by the demand for the respective firm’s product (see Hart 2000).
In the empirical model firm size is measured by the logarithm of number of employees (sales) at
the beginning of the growth period, i.e., 1997. Empirical studies (for example, by Evans 1987a or
Almus et al. 1999) have shown a non-linear relationship between size and growth: The negative
effect of size on firm growth decreases as firms approach their MES. Therefore, I also include the
square of the logarithm of employees (sales) in the growth equation.
Similar to the arguments that relate size and growth, a negative correlation between firm age and
growth is hypothesised. Young firms can realise high efficiency gains due to learning processes,
which leads to higher growth rates (Ericson and Pakes 1995, Jovanovic 1982). These efficiency
gains decrease as firms become older. To test this hypothesis, I include the logarithm of firm age
in 1997 (measured in years).
Investment in R&D is of major concern to technology-oriented firms. The growth-enhancing effect
of R&D activities was already proven for the start-up periods of the firms in our sample by Bürgel
et al. (2004). R&D activities can be regarded as constituting an intangible asset that fosters firms’
growth processes as argued by the resource based view of the firm. The latter theory (e.g., Pen-
rose [1959], Wernerfelt [1984], or, in the context of firm growth Geroski [2000]) regards a firm as
an idiosyncratic bundle of assets (physical resources as well as intangible resources like know-how
or experience). Since physical assets are relatively easily obtained or imitated, a firm differentiates
from its rivals by the intangible resources it possesses or may create via R&D activities. However,
R&D activities are not necessarily exogenous if a firm decides on the amount of R&D based on its
growth prospects (see, e.g., Felder et al. 1994). Furthermore, using R&D intensity (expenditures
on R&D as percentage of total sales) as the exogenous variable is problematic, since we only know
the firms’ R&D intensity in 1997 and 2002. However, the firms’ growth rates between 1997 and
2002 are certain to also have been affected by their interim R&D activities. Therefore, instead of
R&D intensity I consider two dummy variables that indicate whether a firm is carrying out R&D
on a permanent basis or occasionally. Firms with no R&D activities are used as the base category.
13
These variables were gathered by the two surveys in addition to R&D intensity. They better de-
scribe the firms’ long-term R&D activities. Moreover, the problem of endogeneity is likely to be
less severe for the two dummy variables than for R&D intensity. Since the dummy variable for
occasional R&D activities turned out to be insignificant in the sales growth equation, it was ex-
cluded from the sales growth regression.21
From a theoretical as well as an empirical point of view, human capital of firm managers is re-
garded as one of the most important factors influencing firm growth. It can be expected that higher
levels of firm managers’ human capital imply increased knowledge and capabilities with respect to
organisation or financial and general management (see, e.g., Bates 1990, Brüderl et al. 1998).
Since it is difficult to measure the abstract concept of human capital directly, firm managers were
asked to indicate on a five point Likert scale whether they experienced a shortage of skills in
different areas, among them marketing, logistics, and R&D. The econometric model will include
two dummy variables that take the value 1 if the respective firm’s managers experienced a “seri-
ous” (4) or a “very serious shortage” (5) in marketing or R&D. These two dummy variables are
hypothesised to reduce firm growth.
The role of imperfect competition was already stressed in discussing the relationship between firm
size and growth. The argument was made that imperfect competition enables firms to realize long-
term growth. In interviewing the firms in our sample, we asked firm representatives to estimate the
time a competitor would need to launch either a similar product with superior performance or a
product with similar performance at a lower price. Bürgel et al. (2004) called this competition-free
time period in which firms can realize temporary monopolistic rents the “window of opportunity”.
It might be intuitive that a longer competition-free period leads to a higher growth rate. However,
as Porter (1979) and Caves and Porter (1979) argued, firms that successfully occupy a narrow
strategic segment do not need to exploit their competitive advantage and grow rapidly in order to
survive in their chosen market segment. Slow growth is then compatible with a niche product
strategy. Following Bürgel et al. (2004), I include a dummy variable in the econometric growth
equation that takes the value 1 if the estimated window of opportunity is one year or shorter.
Firms that face a short window of opportunity are forced to improve their products or to market
new products or services. Thus, the age of the product may also be important for firms’ growth
(see Bürgel et al. 2004). Firms with relatively old products are hypothesised to grow more slowly
21 In analysing the growth models, I also estimated a specification that includes R&D intensity. However, R&D
intensity was insignificant in both the employment growth and sales growth equations.
14
since their products are likely to be out-of-date. Especially in high-tech industries with short
product life cycles, products rapidly change or become obsolete.22 In the questionnaire, the firms’
representatives were asked in which year the then currently best-selling product was first sold by
the company. Using this information, I include the logarithm of the product’s age in 2003 in the
sales growth regression. I also tested this variable in the employment growth regression, but it
turned out to be insignificant and is therefore neglected in the final specification.
The growth equation is completed by two industry dummy variables (for the engineering industry
and other manufacturing industries including ICT-hardware and health and life sciences) and by a
regional dummy variable taking the value 1 if the firm is located in Germany. In contrast to the
productivity equation, I do not use a dummy variable for Eastern Germany because descriptive
analyses reveal that there are only minor differences in firm growth between Western and Eastern
Germany, but significant differences between Germany and the UK.
Internationalisation Equation
A profit-maximizing firm will decide to internationalise if the benefits of exporting exceed the
costs associated with international business activities. Potential benefits can be a result of an
increased growth rate or improved labour productivity. Since the costs of international business
activities cannot be observed directly, I formulate different hypotheses concerning the factors
likely to influence a firm’s decision regarding exporting. In order to identify the internationalisa-
tion equation, exogenous variables are needed that increase or reduce firms’ (potential) costs of
export activities, but that are independent of growth and labour productivity (see also the explana-
tion of the econometric model in section 5). For example, R&D activities play an important role in
the decision to internationalise. They generate assets by which a firm distinguishes itself from its
rivals. These assets not only facilitate foreign market entry – they also support a long-term en-
gagement in the international market (cf. Fryges 2004). However, as shown in the previous subsec-
tions, R&D may also be decisive for long-term growth and above-average labour productivity. In
fact, number of R&D employees is directly included in the labour productivity equation (1) as a
production factor and (permanent) R&D activities are postulated to increase the respective firm’s
growth rate in equation (4). Therefore, R&D is not suitable to identify the internationalisation
equation.
22 Of course, firms may innovate and improve their products gradually so that even if the product is fairly “old”, it
might incorporate the latest technology.
15
Using the same data set this paper is based on, I evaluated the impact of different variables pro-
posed by theories of economics and international management on entry into and exit from the
international market (see Fryges 2004). Based on these results, the following explanatory variables
are supposed to be independent of overall firm performance but can be expected to identify the
internationalisation decision.
According to the internationalisation process model developed by Johanson and Vahlne
(1977, 1990) and the so-called stage models of internationalisation (e.g., Bilkey and Tesar 1977,
Bilkey 1978), international business activities are associated with uncertainty. Accordingly, a firm
increases its international activities gradually, starting with no international activities and entering
its first foreign market at a later stage of its life cycle. However, as an exclusion of the internation-
alisation process model, Johanson and Vahlne (1990) mentioned the possibility that knowledge
necessary to reduce uncertainty about a foreign market can be acquired by employing an interna-
tionally experienced manager, enabling firms to take larger and faster steps in their internationali-
sation processes. Therefore, the firms in our sample were asked whether a member of their respec-
tive management team had work experience abroad or whether a manager was educated abroad
before joining the company. The international experience of firm managers can also be regarded as
an intangible asset that facilitates firms’ international activities from a resource-based view of the
firm (see, e.g., Wernerfelt 1984 and the explanations in the previous subsection).
Product characteristics may influence firm’s internationalisation behaviour. High customisation
requirements may act as a constraint to entering the foreign market since they involve close con-
tacts to end-users, inducing high transaction costs prior to selling the product (cf. Williamson 1985
for a presentation of transaction cost economics). The questionnaire measures the degree of cus-
tomisation on a five point Likert scale ranging from 1 “unimportant” to 5 “very important”. For the
econometric estimations, a dummy variable is used that takes the value 1 if the firm has classified
the requirement of customisation as “important” (4) or “very important” (5).
5 Econometric Implementation
The relationship between labour productivity and internationalisation is implemented econometri-
cally as a switching regression model with endogenous switching as described by Maddala (1983).
This model allows a simultaneous estimation of probability of internationalisation and of the
determinants of labour productivity. The model is given by three equations: two level (regime)
equations for productivity, dependent on the respective firm’s internationalisation status (INTS),
and a binary selection equation that determines internationalisation status of the firm in question.
16
( )1 1 1 1 , 11
ln ln ln ln 1 lni i iINTS INTS INTS INTS i i INTS
i i iINTS
Y K RA L uL L L
α β µ= = = = =
=
⎛ ⎞ ⎛ ⎞ ⎛ ⎞= + + + − +⎜ ⎟ ⎜ ⎟ ⎜ ⎟
⎝ ⎠ ⎝ ⎠ ⎝ ⎠
(5) ( )0 0 0 0 , 00
ln ln ln ln 1 lni i iINTS INTS INTS INTS i i INTS
i i iINTS
Y K RA L uL L L
α β µ= = = = =
=
⎛ ⎞ ⎛ ⎞ ⎛ ⎞= + + + − +⎜ ⎟ ⎜ ⎟ ⎜ ⎟
⎝ ⎠ ⎝ ⎠ ⎝ ⎠
1 0
1 ln ln 0
0
i ii i i i i
i i iINTS INTS
Y Yif I a C ZINTS L L
otherwise
ν ε∗
= =
⎧ ⎛ ⎞⎛ ⎞ ⎛ ⎞= ⋅ − − + = Π + >⎪ ⎜ ⎟⎜ ⎟ ⎜ ⎟⎜ ⎟= ⎨ ⎝ ⎠ ⎝ ⎠⎝ ⎠
⎪⎩
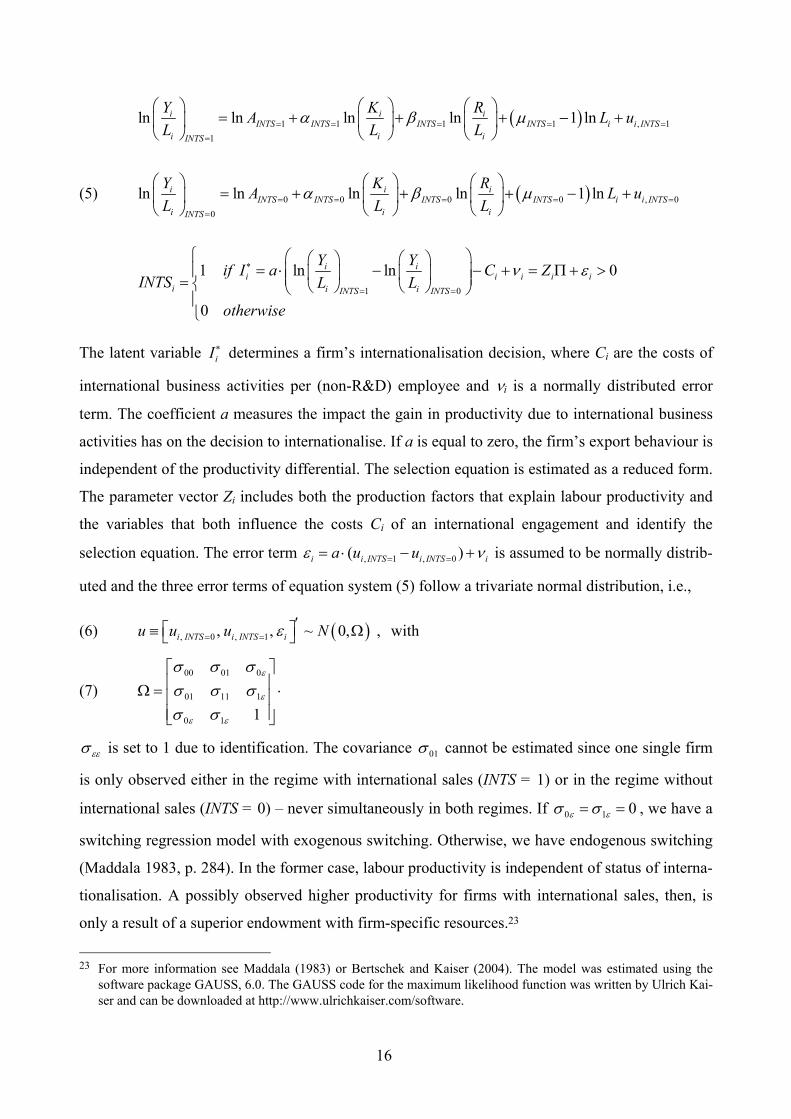
The latent variable iI ∗ determines a firm’s internationalisation decision, where Ci are the costs of
international business activities per (non-R&D) employee and νi is a normally distributed error
term. The coefficient a measures the impact the gain in productivity due to international business
activities has on the decision to internationalise. If a is equal to zero, the firm’s export behaviour is
independent of the productivity differential. The selection equation is estimated as a reduced form.
The parameter vector Zi includes both the production factors that explain labour productivity and
the variables that both influence the costs Ci of an international engagement and identify the
selection equation. The error term , 1 , 0( )i i INTS i INTS ia u uε ν= == ⋅ − + is assumed to be normally distrib-
uted and the three error terms of equation system (5) follow a trivariate normal distribution, i.e.,
(6) ( ), 0 , 1, , ~ 0,i INTS i INTS iu u u Nε= =′⎡ ⎤≡ Ω⎣ ⎦ , with
(7) 00 01 0
01 11 1
0 1 1
ε
ε
ε ε
σ σ σσ σ σσ σ
⎡ ⎤⎢ ⎥Ω = ⋅⎢ ⎥⎢ ⎥⎣ ⎦
εεσ is set to 1 due to identification. The covariance 01σ cannot be estimated since one single firm
is only observed either in the regime with international sales (INTS = 1) or in the regime without
international sales (INTS = 0) – never simultaneously in both regimes. If 0 1 0ε εσ σ= = , we have a
switching regression model with exogenous switching. Otherwise, we have endogenous switching
(Maddala 1983, p. 284). In the former case, labour productivity is independent of status of interna-
tionalisation. A possibly observed higher productivity for firms with international sales, then, is
only a result of a superior endowment with firm-specific resources.23
23 For more information see Maddala (1983) or Bertschek and Kaiser (2004). The model was estimated using the
software package GAUSS, 6.0. The GAUSS code for the maximum likelihood function was written by Ulrich Kai-ser and can be downloaded at http://www.ulrichkaiser.com/software.
17
In principle, it is possible to formulate the growth equation in dependence of the internationalisa-
tion status, analogous to equation system (5). However, while evaluating the labour productivity
equation only requires estimates of four parameters (three partial production elasticities and the
integer measuring the parameter of production efficiency), the estimation of the heuristic growth
equation is more demanding in that the parameter vector δ in equation (4) contains more than ten
parameters that have to be estimated. This constitutes a problem in the regime without interna-
tional sales, where we have less than 40 observations. In fact, econometric analysis proves that
almost all estimated coefficients in the regime without international sales are statistically insignifi-
cant, even if the point estimations are close to the (significant) point estimates of the respective
coefficients in the regime with international sales. Thus, I decided to use a unique growth equation
for both regimes (with and without international sales).
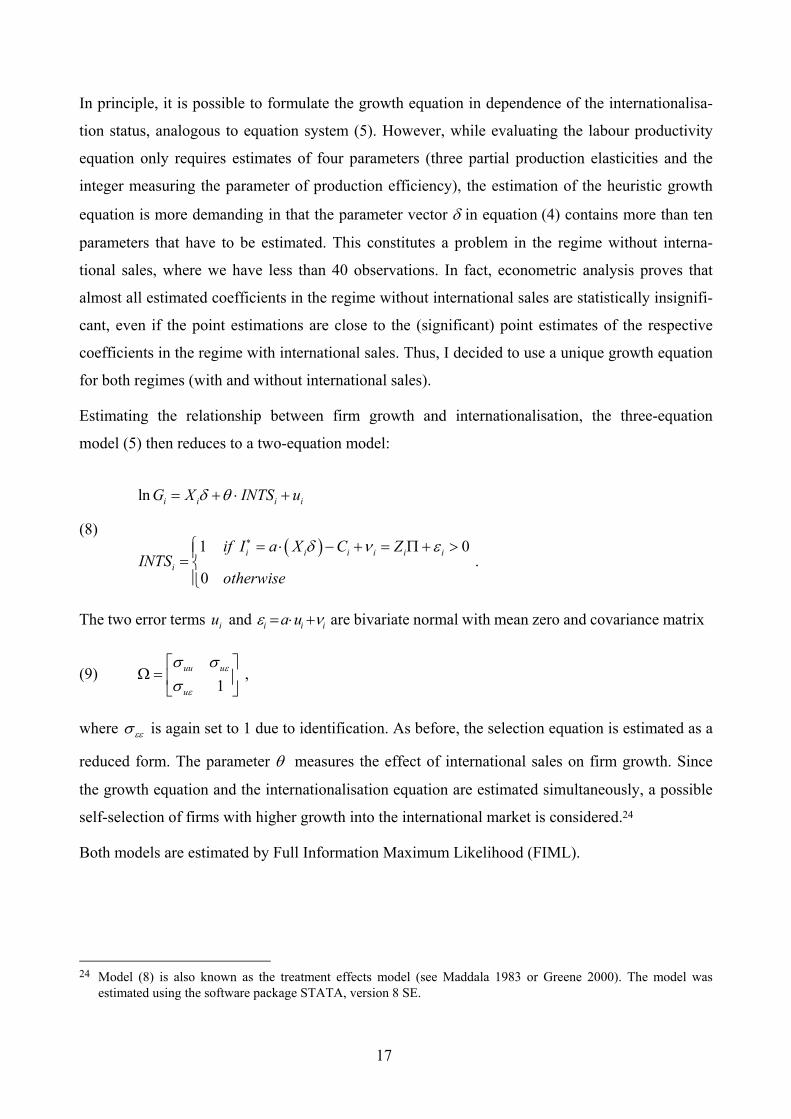
Estimating the relationship between firm growth and internationalisation, the three-equation
model (5) then reduces to a two-equation model:
(8) ( )
ln
1 0.
0
i i i i
i i i i i ii
G X INTS u
if I a X C ZINTS
otherwise
δ θ
δ ν ε∗
= + ⋅ +
⎧ = ⋅ − + = Π + >⎪= ⎨⎪⎩
The two error terms iu and i i ia uε ν= ⋅ + are bivariate normal with mean zero and covariance matrix
(9) 1
uu u
u
ε
ε
σ σσ
⎡ ⎤Ω = ⎢ ⎥
⎣ ⎦ ,
where εεσ is again set to 1 due to identification. As before, the selection equation is estimated as a
reduced form. The parameter θ measures the effect of international sales on firm growth. Since
the growth equation and the internationalisation equation are estimated simultaneously, a possible
self-selection of firms with higher growth into the international market is considered.24
Both models are estimated by Full Information Maximum Likelihood (FIML).
24 Model (8) is also known as the treatment effects model (see Maddala 1983 or Greene 2000). The model was
estimated using the software package STATA, version 8 SE.
18
6 Descriptive Analysis
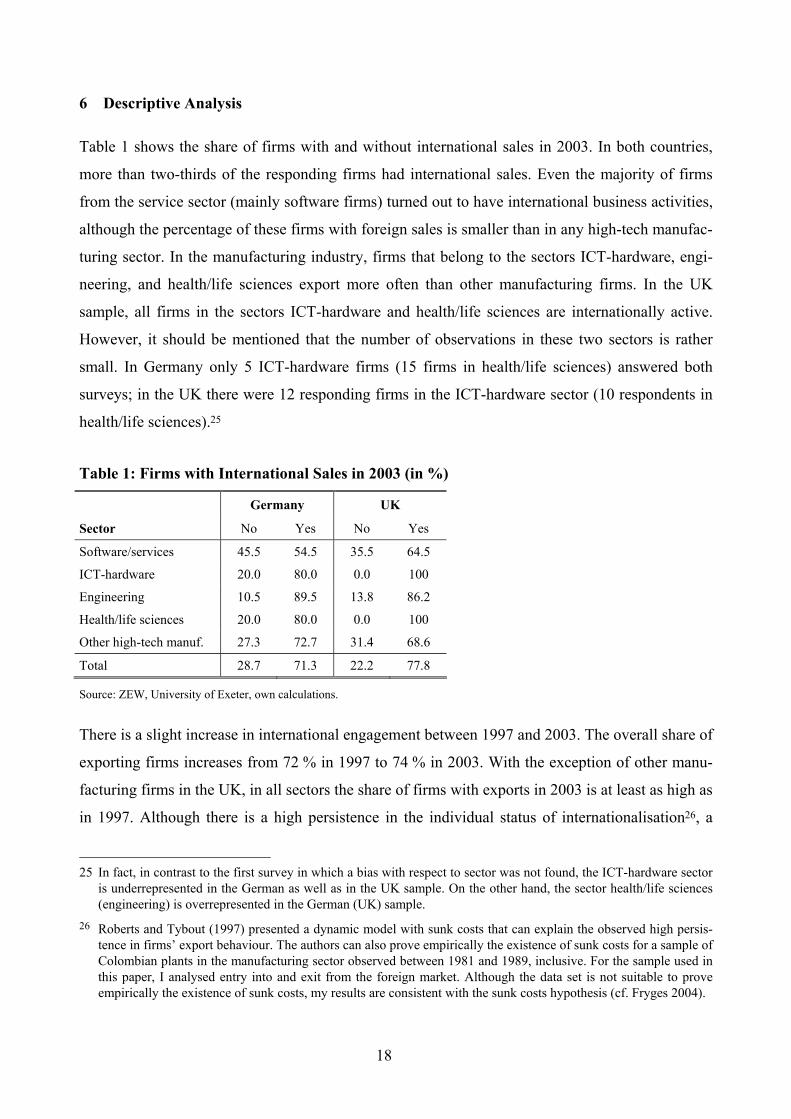
Table 1 shows the share of firms with and without international sales in 2003. In both countries,
more than two-thirds of the responding firms had international sales. Even the majority of firms
from the service sector (mainly software firms) turned out to have international business activities,
although the percentage of these firms with foreign sales is smaller than in any high-tech manufac-
turing sector. In the manufacturing industry, firms that belong to the sectors ICT-hardware, engi-
neering, and health/life sciences export more often than other manufacturing firms. In the UK
sample, all firms in the sectors ICT-hardware and health/life sciences are internationally active.
However, it should be mentioned that the number of observations in these two sectors is rather
small. In Germany only 5 ICT-hardware firms (15 firms in health/life sciences) answered both
surveys; in the UK there were 12 responding firms in the ICT-hardware sector (10 respondents in
health/life sciences).25
Table 1: Firms with International Sales in 2003 (in %)
Germany UK
Sector No Yes No Yes
Software/services 45.5 54.5 35.5 64.5
ICT-hardware 20.0 80.0 0.0 100
Engineering 10.5 89.5 13.8 86.2
Health/life sciences 20.0 80.0 0.0 100
Other high-tech manuf. 27.3 72.7 31.4 68.6
Total 28.7 71.3 22.2 77.8
Source: ZEW, University of Exeter, own calculations.
There is a slight increase in international engagement between 1997 and 2003. The overall share of
exporting firms increases from 72 % in 1997 to 74 % in 2003. With the exception of other manu-
facturing firms in the UK, in all sectors the share of firms with exports in 2003 is at least as high as
in 1997. Although there is a high persistence in the individual status of internationalisation26, a
25 In fact, in contrast to the first survey in which a bias with respect to sector was not found, the ICT-hardware sector
is underrepresented in the German as well as in the UK sample. On the other hand, the sector health/life sciences (engineering) is overrepresented in the German (UK) sample.
26 Roberts and Tybout (1997) presented a dynamic model with sunk costs that can explain the observed high persis-tence in firms’ export behaviour. The authors can also prove empirically the existence of sunk costs for a sample of Colombian plants in the manufacturing sector observed between 1981 and 1989, inclusive. For the sample used in this paper, I analysed entry into and exit from the foreign market. Although the data set is not suitable to prove empirically the existence of sunk costs, my results are consistent with the sunk costs hypothesis (cf. Fryges 2004).
19
rather high number of firms changes the internationalisation status, leading to entry and exit over
time. Nearly 12 % of German and 8 % of UK firms left the international market between 1997 and
2003. During the same time period, 14 % of German firms and 8 % of firms sited in the UK en-
tered the international market. Thus, German high-tech firms more frequently change their status
of internationalisation, whereas UK firms show a higher persistence in their internationalisation
behaviour.
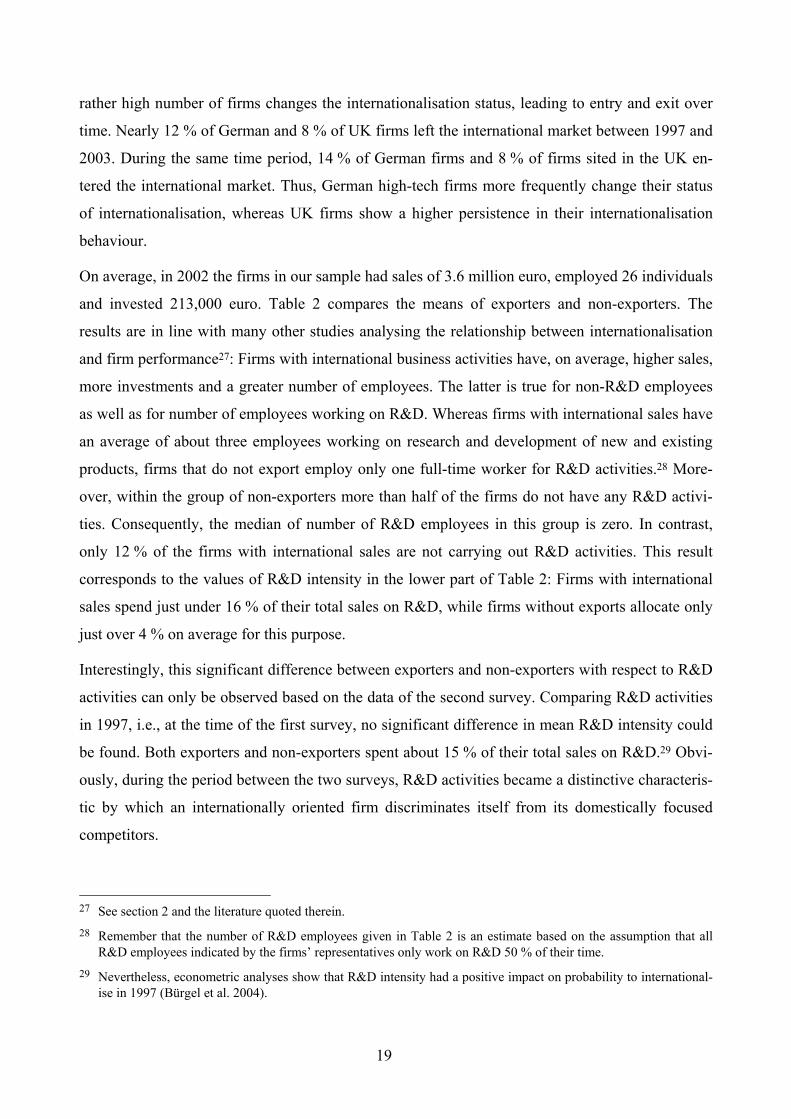
On average, in 2002 the firms in our sample had sales of 3.6 million euro, employed 26 individuals
and invested 213,000 euro. Table 2 compares the means of exporters and non-exporters. The
results are in line with many other studies analysing the relationship between internationalisation
and firm performance27: Firms with international business activities have, on average, higher sales,
more investments and a greater number of employees. The latter is true for non-R&D employees
as well as for number of employees working on R&D. Whereas firms with international sales have
an average of about three employees working on research and development of new and existing
products, firms that do not export employ only one full-time worker for R&D activities.28 More-
over, within the group of non-exporters more than half of the firms do not have any R&D activi-
ties. Consequently, the median of number of R&D employees in this group is zero. In contrast,
only 12 % of the firms with international sales are not carrying out R&D activities. This result
corresponds to the values of R&D intensity in the lower part of Table 2: Firms with international
sales spend just under 16 % of their total sales on R&D, while firms without exports allocate only
just over 4 % on average for this purpose.
Interestingly, this significant difference between exporters and non-exporters with respect to R&D
activities can only be observed based on the data of the second survey. Comparing R&D activities
in 1997, i.e., at the time of the first survey, no significant difference in mean R&D intensity could
be found. Both exporters and non-exporters spent about 15 % of their total sales on R&D.29 Obvi-
ously, during the period between the two surveys, R&D activities became a distinctive characteris-
tic by which an internationally oriented firm discriminates itself from its domestically focused
competitors.
27 See section 2 and the literature quoted therein. 28 Remember that the number of R&D employees given in Table 2 is an estimate based on the assumption that all
R&D employees indicated by the firms’ representatives only work on R&D 50 % of their time. 29 Nevertheless, econometric analyses show that R&D intensity had a positive impact on probability to international-
ise in 1997 (Bürgel et al. 2004).
20
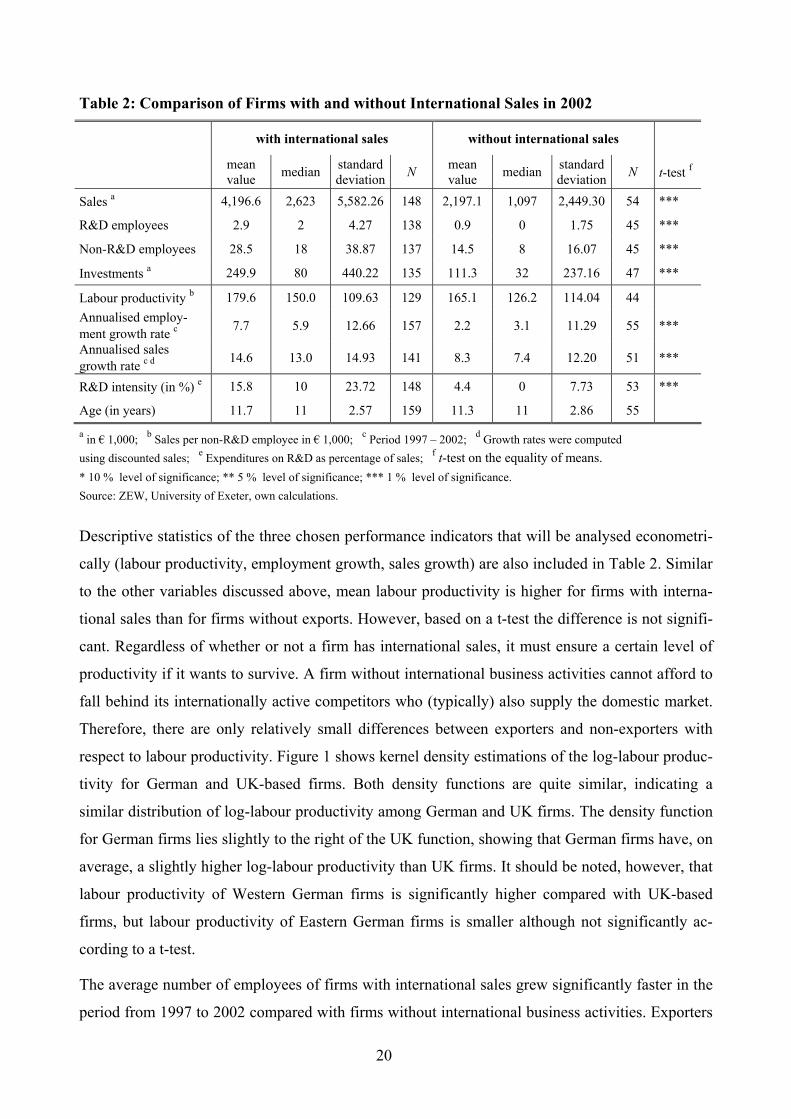
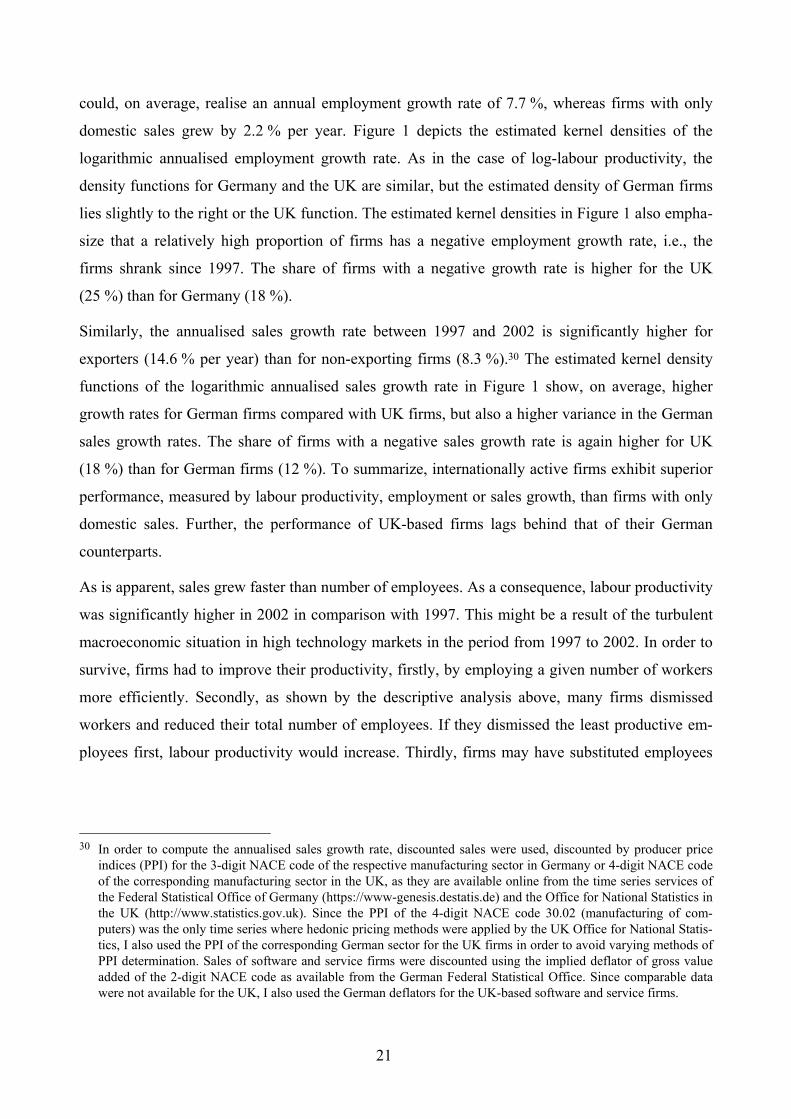
Table 2: Comparison of Firms with and without International Sales in 2002
with international sales without international sales
mean value median standard
deviation N mean value median standard
deviation N t-test f
Sales a 4,196.6 2,623 5,582.26 148 2,197.1 1,097 2,449.30 54 ***
R&D employees 2.9 2 4.27 138 0.9 0 1.75 45 ***
Non-R&D employees 28.5 18 38.87 137 14.5 8 16.07 45 ***
Investments a 249.9 80 440.22 135 111.3 32 237.16 47 ***
Labour productivity b 179.6 150.0 109.63 129 165.1 126.2 114.04 44 Annualised employ-ment growth rate c 7.7 5.9 12.66 157 2.2 3.1 11.29 55 ***
Annualised sales growth rate c d 14.6 13.0 14.93 141 8.3 7.4 12.20 51 ***
R&D intensity (in %) e 15.8 10 23.72 148 4.4 0 7.73 53 ***
Age (in years) 11.7 11 2.57 159 11.3 11 2.86 55
a in € 1,000; b Sales per non-R&D employee in € 1,000; c Period 1997 – 2002; d Growth rates were computed using discounted sales; e Expenditures on R&D as percentage of sales; f t-test on the equality of means. * 10 % level of significance; ** 5 % level of significance; *** 1 % level of significance. Source: ZEW, University of Exeter, own calculations.
Descriptive statistics of the three chosen performance indicators that will be analysed econometri-
cally (labour productivity, employment growth, sales growth) are also included in Table 2. Similar
to the other variables discussed above, mean labour productivity is higher for firms with interna-
tional sales than for firms without exports. However, based on a t-test the difference is not signifi-
cant. Regardless of whether or not a firm has international sales, it must ensure a certain level of
productivity if it wants to survive. A firm without international business activities cannot afford to
fall behind its internationally active competitors who (typically) also supply the domestic market.
Therefore, there are only relatively small differences between exporters and non-exporters with
respect to labour productivity. Figure 1 shows kernel density estimations of the log-labour produc-
tivity for German and UK-based firms. Both density functions are quite similar, indicating a
similar distribution of log-labour productivity among German and UK firms. The density function
for German firms lies slightly to the right of the UK function, showing that German firms have, on
average, a slightly higher log-labour productivity than UK firms. It should be noted, however, that
labour productivity of Western German firms is significantly higher compared with UK-based
firms, but labour productivity of Eastern German firms is smaller although not significantly ac-
cording to a t-test.
The average number of employees of firms with international sales grew significantly faster in the
period from 1997 to 2002 compared with firms without international business activities. Exporters
21
could, on average, realise an annual employment growth rate of 7.7 %, whereas firms with only
domestic sales grew by 2.2 % per year. Figure 1 depicts the estimated kernel densities of the
logarithmic annualised employment growth rate. As in the case of log-labour productivity, the
density functions for Germany and the UK are similar, but the estimated density of German firms
lies slightly to the right or the UK function. The estimated kernel densities in Figure 1 also empha-
size that a relatively high proportion of firms has a negative employment growth rate, i.e., the
firms shrank since 1997. The share of firms with a negative growth rate is higher for the UK
(25 %) than for Germany (18 %).
Similarly, the annualised sales growth rate between 1997 and 2002 is significantly higher for
exporters (14.6 % per year) than for non-exporting firms (8.3 %).30 The estimated kernel density
functions of the logarithmic annualised sales growth rate in Figure 1 show, on average, higher
growth rates for German firms compared with UK firms, but also a higher variance in the German
sales growth rates. The share of firms with a negative sales growth rate is again higher for UK
(18 %) than for German firms (12 %). To summarize, internationally active firms exhibit superior
performance, measured by labour productivity, employment or sales growth, than firms with only
domestic sales. Further, the performance of UK-based firms lags behind that of their German
counterparts.
As is apparent, sales grew faster than number of employees. As a consequence, labour productivity
was significantly higher in 2002 in comparison with 1997. This might be a result of the turbulent
macroeconomic situation in high technology markets in the period from 1997 to 2002. In order to
survive, firms had to improve their productivity, firstly, by employing a given number of workers
more efficiently. Secondly, as shown by the descriptive analysis above, many firms dismissed
workers and reduced their total number of employees. If they dismissed the least productive em-
ployees first, labour productivity would increase. Thirdly, firms may have substituted employees
30 In order to compute the annualised sales growth rate, discounted sales were used, discounted by producer price
indices (PPI) for the 3-digit NACE code of the respective manufacturing sector in Germany or 4-digit NACE code of the corresponding manufacturing sector in the UK, as they are available online from the time series services of the Federal Statistical Office of Germany (https://www-genesis.destatis.de) and the Office for National Statistics in the UK (http://www.statistics.gov.uk). Since the PPI of the 4-digit NACE code 30.02 (manufacturing of com-puters) was the only time series where hedonic pricing methods were applied by the UK Office for National Statis-tics, I also used the PPI of the corresponding German sector for the UK firms in order to avoid varying methods of PPI determination. Sales of software and service firms were discounted using the implied deflator of gross value added of the 2-digit NACE code as available from the German Federal Statistical Office. Since comparable data were not available for the UK, I also used the German deflators for the UK-based software and service firms.
22
by other production factors, e.g., capital or (imported) intermediate products. Thus, one unit of
output can then be produced by a smaller number of employees.31
Comparing the annualised growth rates in the period from 1997 to 2002 with the corresponding
growth rates from start-up to 1997, both the employment and sales growth rates have fallen sig-
nificantly on average. This observation is in accordance with the theoretical considerations that
older firms are expected to growth slower (see section 4). As Table 2 shows, in 2002 the firms of
our sample are an average of about 11 years old. Whether firm age is also suitable to explain
varying growth rates during the period from 1997 to 2002 is questionable and will be tested in the
next section, when the firms of our sample are all examined at a later stage of their development.
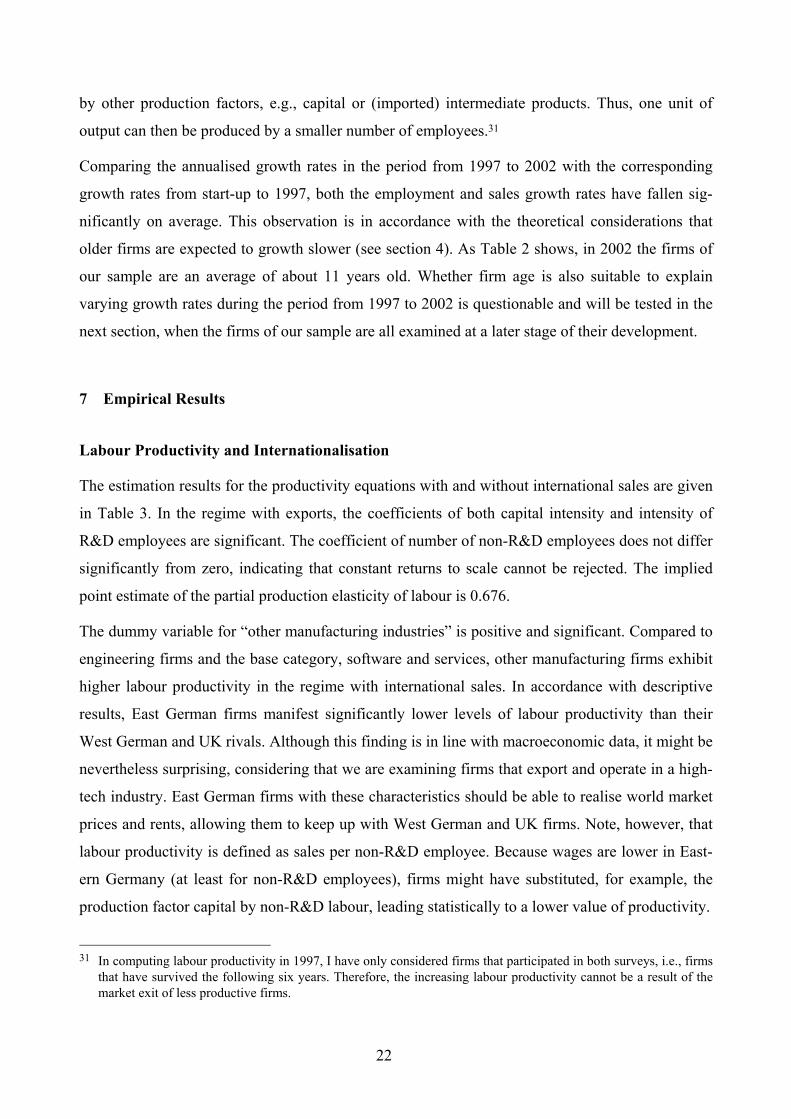
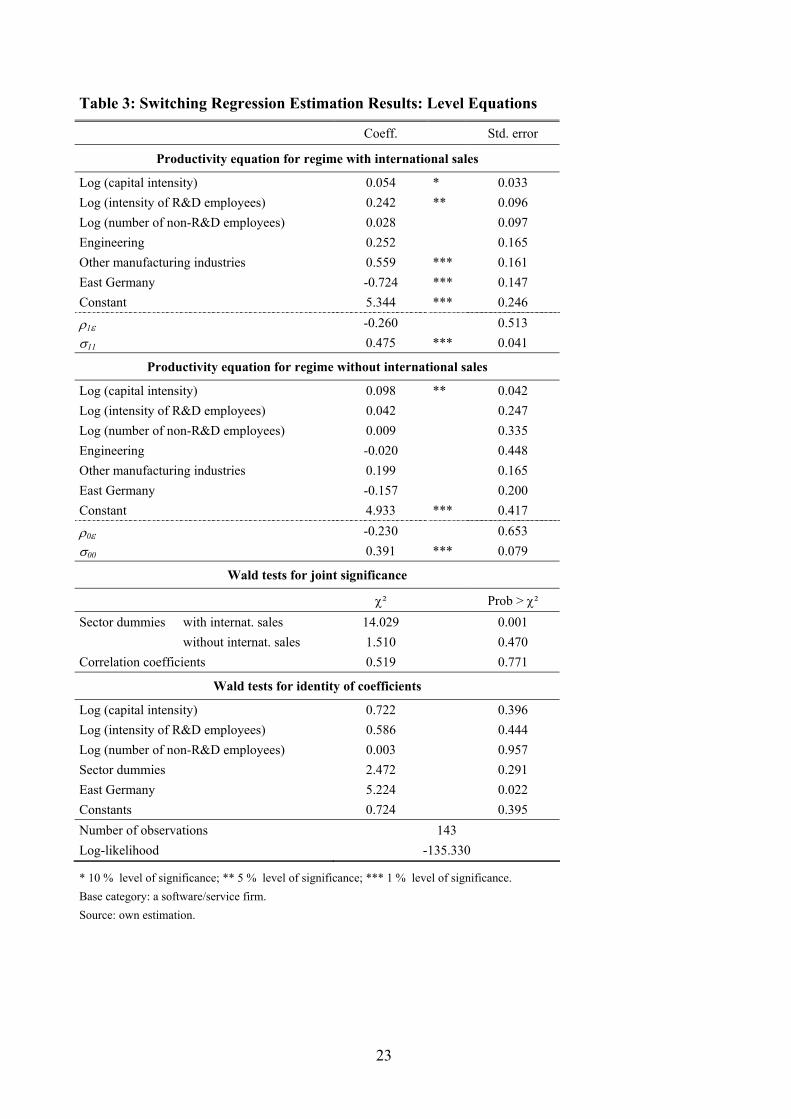
7 Empirical Results
Labour Productivity and Internationalisation
The estimation results for the productivity equations with and without international sales are given
in Table 3. In the regime with exports, the coefficients of both capital intensity and intensity of
R&D employees are significant. The coefficient of number of non-R&D employees does not differ
significantly from zero, indicating that constant returns to scale cannot be rejected. The implied
point estimate of the partial production elasticity of labour is 0.676.
The dummy variable for “other manufacturing industries” is positive and significant. Compared to
engineering firms and the base category, software and services, other manufacturing firms exhibit
higher labour productivity in the regime with international sales. In accordance with descriptive
results, East German firms manifest significantly lower levels of labour productivity than their
West German and UK rivals. Although this finding is in line with macroeconomic data, it might be
nevertheless surprising, considering that we are examining firms that export and operate in a high-
tech industry. East German firms with these characteristics should be able to realise world market
prices and rents, allowing them to keep up with West German and UK firms. Note, however, that
labour productivity is defined as sales per non-R&D employee. Because wages are lower in East-
ern Germany (at least for non-R&D employees), firms might have substituted, for example, the
production factor capital by non-R&D labour, leading statistically to a lower value of productivity.
31 In computing labour productivity in 1997, I have only considered firms that participated in both surveys, i.e., firms
that have survived the following six years. Therefore, the increasing labour productivity cannot be a result of the market exit of less productive firms.
23
Table 3: Switching Regression Estimation Results: Level Equations
Coeff. Std. error
Productivity equation for regime with international sales
Log (capital intensity) 0.054 * 0.033 Log (intensity of R&D employees) 0.242 ** 0.096 Log (number of non-R&D employees) 0.028 0.097 Engineering 0.252 0.165 Other manufacturing industries 0.559 *** 0.161 East Germany -0.724 *** 0.147 Constant 5.344 *** 0.246
ρ1ε -0.260 0.513 σ11 0.475 *** 0.041
Productivity equation for regime without international sales
Log (capital intensity) 0.098 ** 0.042 Log (intensity of R&D employees) 0.042 0.247 Log (number of non-R&D employees) 0.009 0.335 Engineering -0.020 0.448 Other manufacturing industries 0.199 0.165 East Germany -0.157 0.200 Constant 4.933 *** 0.417
ρ0ε -0.230 0.653 σ00 0.391 *** 0.079
Wald tests for joint significance
χ² Prob > χ² Sector dummies with internat. sales 14.029 0.001 without internat. sales 1.510 0.470 Correlation coefficients 0.519 0.771
Wald tests for identity of coefficients
Log (capital intensity) 0.722 0.396 Log (intensity of R&D employees) 0.586 0.444 Log (number of non-R&D employees) 0.003 0.957 Sector dummies 2.472 0.291 East Germany 5.224 0.022 Constants 0.724 0.395 Number of observations 143 Log-likelihood -135.330
* 10 % level of significance; ** 5 % level of significance; *** 1 % level of significance. Base category: a software/service firm. Source: own estimation.
24
The three dummy variables controlling for sectoral and regional differences are not significant in
the regime without international sales. As already mentioned in section 5, the number of observa-
tions is relatively small in this regime (only 35 for the final specification reported here). Whereas
the estimations of the production function’s parameters lead to plausible results, it appears to be
impossible to determine empirically differences between industries and locations since there are
only 5 engineering firms and 8 firms sited in Eastern Germany that belong to the regime of non-
exporting firms.
The integer in the productivity equation measures the parameter of efficiency A of the Cobb-
Douglas production function. The point estimate of the efficiency parameter is smaller in the
regime without international sales, indicating, ceteris paribus, that the isoquants of the production
function of non-exporting firms lie closer to the origin. The difference is, however, not significant.
Decisive for the causal relationship between productivity and internationalisation are the estima-
tions of the two correlation coefficients ρ between the residuals of the regime equations and the
internationalisation equation. As can be seen in Table 3, the two correlation coefficients are neither
individually nor jointly significantly different from zero. Thus, the labour productivity equations
are independent of the internationalisation equation. In other words, differences in labour produc-
tivity cannot be explained by export market participation, but are a result of a varying endowment
with production factors, especially R&D, and of the distinct shape of the production function. This
finding contradicts the results of Bürgel et al. (2004), who examined the same firm sample at an
early stage of the firms’ life cycles and found that internationalisation improves labour productiv-
ity. Hence, internationalisation may increase productivity during early stages of firm development.
After firms have become established in the market and have reached a “mature” stage of their life
cycles, the positive effect of internationalisation disappears.
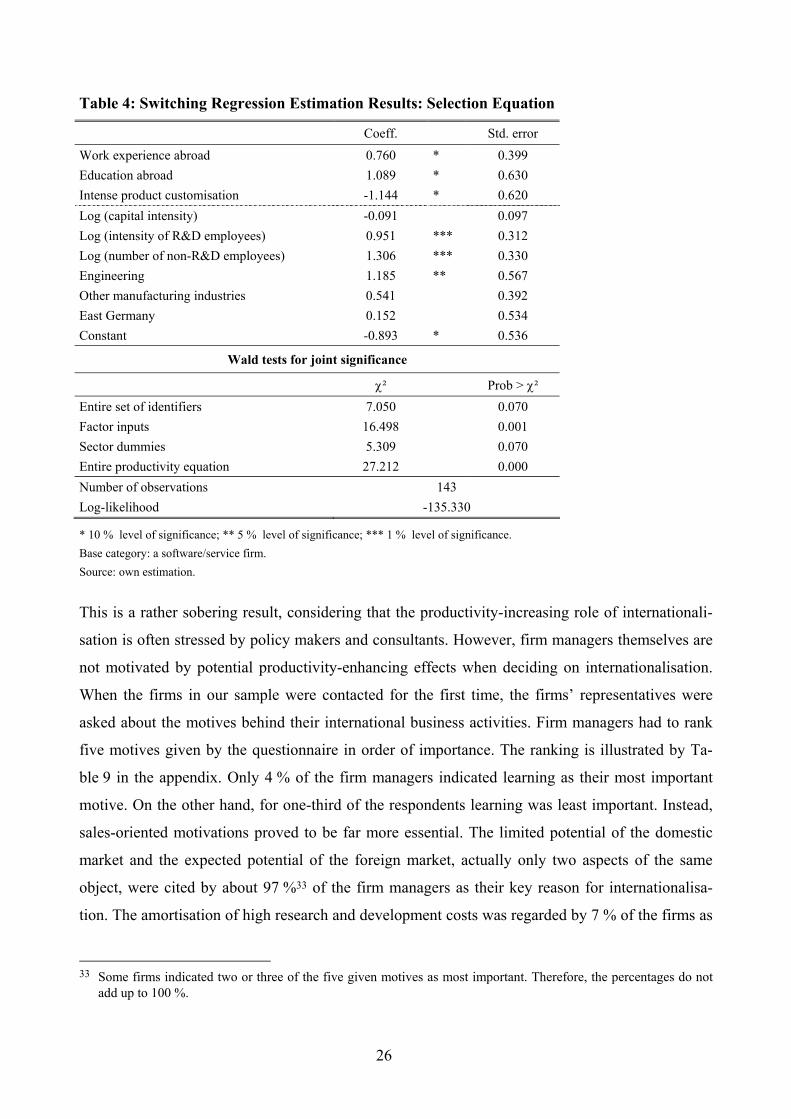
Table 4 depicts the estimation results of the switching regression model for the selection, i.e., the
internationalisation equation. In order to identify the selection equation, three variables were
included that are supposed to be independent of labour productivity, but that determine the firms’
internationalisation decisions. The international experience that the firms’ managers acquired
before entering their respective firms facilitates international business activities: If one member of
the management team has previous work experience abroad or was educated abroad, his firm will
be more likely to have international sales. This result supports Johanson and Vahlne (1990), who
stated that an internationally experienced management team can overcome the uncertainty present
in foreign markets, and the resource-based view of the firm that regards international experience as
an intangible asset that differentiates firms from their competitors. Further, intense product cus-
25
tomisation is a barrier to international business activities. If a firm has to consider the special needs
of each customer, this increases the costs of international engagement. These findings are com-
pletely in accordance with my previous results, when analysing empirically the determinants of
foreign market entry and exit for the firms in our sample (cf. Fryges 2004). The entire set of identi-
fying variables is jointly significant, although only on the 10 % level.32
Excluding capital intensity, the production factors enter the selection equation significantly. Inten-
sity of R&D employees as well as number of non-R&D employees are positively correlated with
foreign market participation. Thus, the strategic role of R&D for the internationalisation behaviour
of (small) technology-oriented firms is highlighted by the model. R&D activities can be expected
to create assets within the firm that are difficult for the firm’s rivals to imitate and thus ease the
internationalisation process as predicted by the resource-based view of the firm. Firm size, meas-
ured by number of non-R&D employees, also increases probability of being an exporter. As Jo-
hanson and Vahlne (1990) stated, larger firms possess more resources that facilitate international
business activities. Finally, engineering firms are significantly more likely to have international
sales compared with the other manufacturing and service sectors and there are no region-specific
factors influencing the export decisions of Eastern German firms.
The variables determining labour productivity are obviously also relevant for the decision to
export. Since the selection equation is estimated as a reduced form, the parameter a in the selection
equation of equation system (5) that indicates whether the productivity differential between the
regimes with and without international sales has an effect on the internationalisation decision is
not estimated directly. However, because the coefficients of the variables of the productivity
equations are individually and jointly significant, it can be concluded that the decision on export
market participation is influenced by labour productivity in the sense that more productive firms
are (or will become) exporters. Thus, this paper confirms the findings of many other studies (see
section 2): The higher labour productivity of firms with international sales is a result of self-
selection into the foreign market.
32 I also estimated the labour productivity equation separately for the two regimes by OLS, including the three
identifying variables from the selection equation. The OLS model is, in fact, appropriate, because we found that the productivity equations and the internationalisation equation are independent from one another. In the produc-tivity equation without international sales all three identifying variables are neither individually nor jointly signifi-cant. In the regime with international business activities, only the dummy variable that indicates whether one member of the firm’s management team has work experience abroad is individually significant at the five-percent level, but the three variables are nevertheless jointly insignificant on the same level of significance. Thus, the three chosen variables can be regarded as appropriate for identifying the selection equation.
26
Table 4: Switching Regression Estimation Results: Selection Equation
Coeff. Std. error
Work experience abroad 0.760 * 0.399 Education abroad 1.089 * 0.630 Intense product customisation -1.144 * 0.620 Log (capital intensity) -0.091 0.097 Log (intensity of R&D employees) 0.951 *** 0.312 Log (number of non-R&D employees) 1.306 *** 0.330 Engineering 1.185 ** 0.567 Other manufacturing industries 0.541 0.392 East Germany 0.152 0.534 Constant -0.893 * 0.536
Wald tests for joint significance
χ² Prob > χ² Entire set of identifiers 7.050 0.070 Factor inputs 16.498 0.001 Sector dummies 5.309 0.070 Entire productivity equation 27.212 0.000 Number of observations 143 Log-likelihood -135.330
* 10 % level of significance; ** 5 % level of significance; *** 1 % level of significance. Base category: a software/service firm. Source: own estimation.
This is a rather sobering result, considering that the productivity-increasing role of internationali-
sation is often stressed by policy makers and consultants. However, firm managers themselves are
not motivated by potential productivity-enhancing effects when deciding on internationalisation.
When the firms in our sample were contacted for the first time, the firms’ representatives were
asked about the motives behind their international business activities. Firm managers had to rank
five motives given by the questionnaire in order of importance. The ranking is illustrated by Ta-
ble 9 in the appendix. Only 4 % of the firm managers indicated learning as their most important
motive. On the other hand, for one-third of the respondents learning was least important. Instead,
sales-oriented motivations proved to be far more essential. The limited potential of the domestic
market and the expected potential of the foreign market, actually only two aspects of the same
object, were cited by about 97 %33 of the firm managers as their key reason for internationalisa-
tion. The amortisation of high research and development costs was regarded by 7 % of the firms as
33 Some firms indicated two or three of the five given motives as most important. Therefore, the percentages do not
add up to 100 %.
27
the most important motive. Since the amortisation of R&D costs is often only possible through fast
company growth, this can also be regarded as a sales-oriented motive. Hence, sales and growth-
related motivations are far more important than productivity or cost-related aspects.34 Considering
our estimation results, firm representatives do well not to expect too much from potential learning
effects – at least in the long run. Whether their expectations with respect to growth effects of
internationalisation are justified in the long run will be examined in the next subsection.
Growth and Internationalisation
The estimation results of the employment growth and the sales growth models are displayed in
Tables 5 and 6, respectively. The upper part contains the results of the heuristic growth equations,
the lower shows the estimations for the internationalisation equations.
In contrast to Gibrat’s law, employment growth rate decreases with number of employees, meas-
ured at the beginning of the growth period 1997. Like other empirical studies, for example, by
Evans (1987a) or Almus et al. (1999), I find a non-linear, convex relationship between firm size
and employment growth, indicated by the negative sign of the squared number of employees. It is,
however, questionable whether the observed negative relationship between firm size and growth
can be explained by firms approaching their minimum efficient scale (MES). On the one hand,
there is indeed a number of firms that were founded only a few years before the onset of the re-
garded growth period.35 For these firms it is plausible to assume growth processes in order to reach
their MES. On the other hand, our sample includes firms that were ten years old in 1997. It can be
expected that the latter firms had already arrived at their MES by 1997, making the negative
relationship between number of employees in 1997 and employment growth unattributable to the
firms’ grow processes before reaching their MES. Further, we observe many firms that shrank
during the growth period. For those firms the negative sign of the coefficient of number of em-
ployees means that the smaller the firm is, the slower it shrinks. Small firms that survive can only
reduce their number of employees by a limited amount. Large firms can and often have had to
reduce their number of employees significantly, probably because of decreasing demand following
the high-tech market downturn in 2000.
34 Even reputation effects of being an internationally active firm are more important than expected learning effects.
15 % of the firms indicated their hope of an improved reputation as their most important motive. 35 Remember that our sample contains firms that were founded between 1987 and 1996, inclusive. The regarded
growth period starts in the year of the first survey (i.e., 1997).
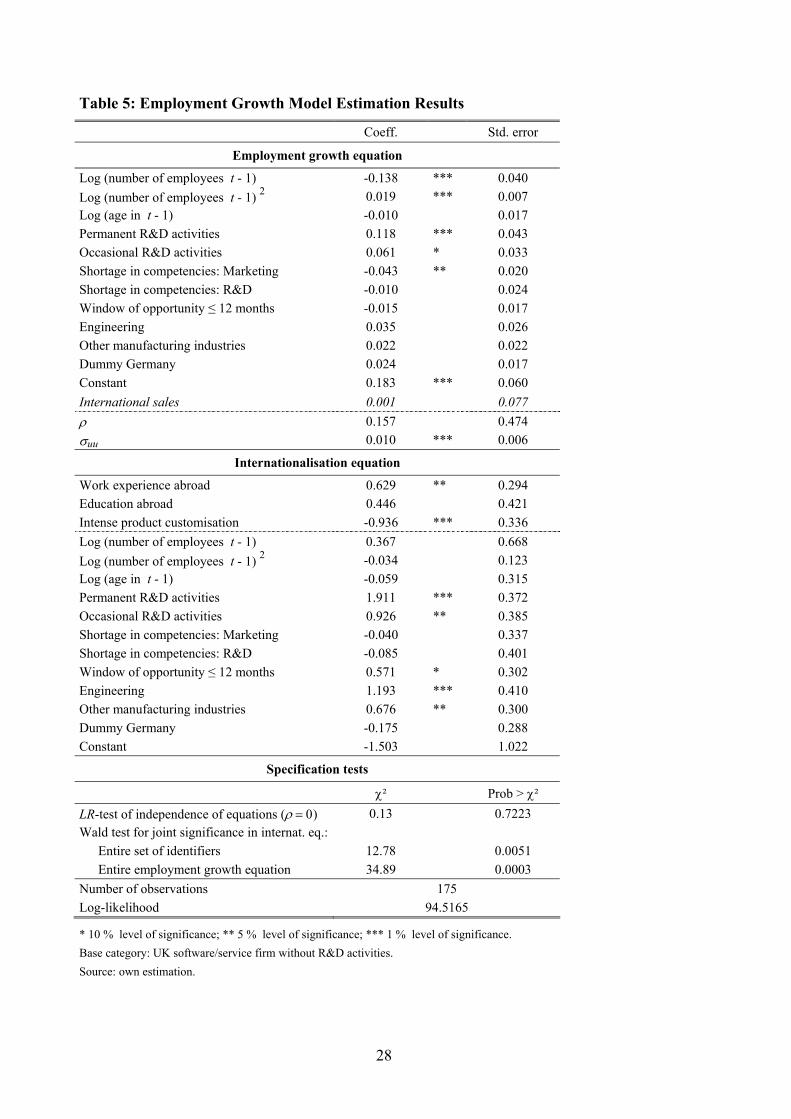
28
Table 5: Employment Growth Model Estimation Results
Coeff. Std. error
Employment growth equation
Log (number of employees t - 1) -0.138 *** 0.040 Log (number of employees t - 1) 2 0.019 *** 0.007 Log (age in t - 1) -0.010 0.017 Permanent R&D activities 0.118 *** 0.043 Occasional R&D activities 0.061 * 0.033 Shortage in competencies: Marketing -0.043 ** 0.020 Shortage in competencies: R&D -0.010 0.024 Window of opportunity ≤ 12 months -0.015 0.017 Engineering 0.035 0.026 Other manufacturing industries 0.022 0.022 Dummy Germany 0.024 0.017 Constant 0.183 *** 0.060 International sales 0.001 0.077 ρ 0.157 0.474 σuu 0.010 *** 0.006
Internationalisation equation
Work experience abroad 0.629 ** 0.294 Education abroad 0.446 0.421 Intense product customisation -0.936 *** 0.336 Log (number of employees t - 1) 0.367 0.668 Log (number of employees t - 1) 2 -0.034 0.123 Log (age in t - 1) -0.059 0.315 Permanent R&D activities 1.911 *** 0.372 Occasional R&D activities 0.926 ** 0.385 Shortage in competencies: Marketing -0.040 0.337 Shortage in competencies: R&D -0.085 0.401 Window of opportunity ≤ 12 months 0.571 * 0.302 Engineering 1.193 *** 0.410 Other manufacturing industries 0.676 ** 0.300 Dummy Germany -0.175 0.288 Constant -1.503 1.022
Specification tests
χ² Prob > χ² LR-test of independence of equations (ρ = 0) 0.13 0.7223 Wald test for joint significance in internat. eq.: Entire set of identifiers 12.78 0.0051 Entire employment growth equation 34.89 0.0003 Number of observations 175 Log-likelihood 94.5165
* 10 % level of significance; ** 5 % level of significance; *** 1 % level of significance. Base category: UK software/service firm without R&D activities. Source: own estimation.
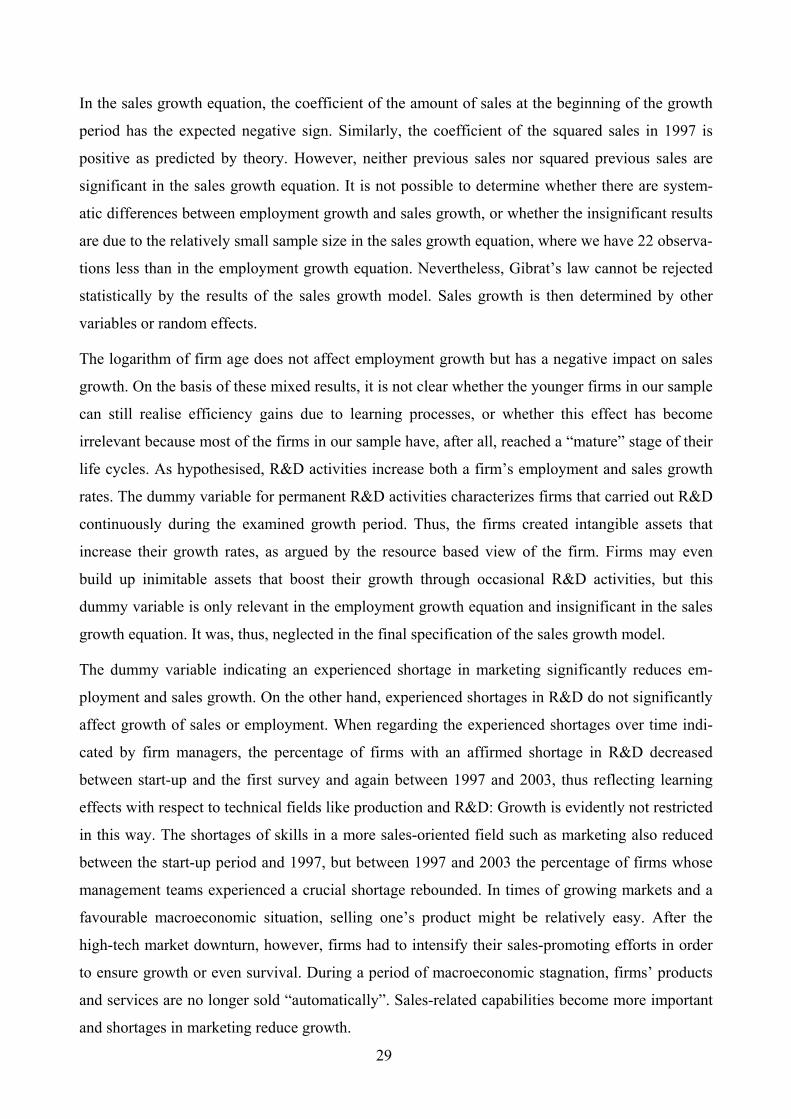
29
In the sales growth equation, the coefficient of the amount of sales at the beginning of the growth
period has the expected negative sign. Similarly, the coefficient of the squared sales in 1997 is
positive as predicted by theory. However, neither previous sales nor squared previous sales are
significant in the sales growth equation. It is not possible to determine whether there are system-
atic differences between employment growth and sales growth, or whether the insignificant results
are due to the relatively small sample size in the sales growth equation, where we have 22 observa-
tions less than in the employment growth equation. Nevertheless, Gibrat’s law cannot be rejected
statistically by the results of the sales growth model. Sales growth is then determined by other
variables or random effects.
The logarithm of firm age does not affect employment growth but has a negative impact on sales
growth. On the basis of these mixed results, it is not clear whether the younger firms in our sample
can still realise efficiency gains due to learning processes, or whether this effect has become
irrelevant because most of the firms in our sample have, after all, reached a “mature” stage of their
life cycles. As hypothesised, R&D activities increase both a firm’s employment and sales growth
rates. The dummy variable for permanent R&D activities characterizes firms that carried out R&D
continuously during the examined growth period. Thus, the firms created intangible assets that
increase their growth rates, as argued by the resource based view of the firm. Firms may even
build up inimitable assets that boost their growth through occasional R&D activities, but this
dummy variable is only relevant in the employment growth equation and insignificant in the sales
growth equation. It was, thus, neglected in the final specification of the sales growth model.
The dummy variable indicating an experienced shortage in marketing significantly reduces em-
ployment and sales growth. On the other hand, experienced shortages in R&D do not significantly
affect growth of sales or employment. When regarding the experienced shortages over time indi-
cated by firm managers, the percentage of firms with an affirmed shortage in R&D decreased
between start-up and the first survey and again between 1997 and 2003, thus reflecting learning
effects with respect to technical fields like production and R&D: Growth is evidently not restricted
in this way. The shortages of skills in a more sales-oriented field such as marketing also reduced
between the start-up period and 1997, but between 1997 and 2003 the percentage of firms whose
management teams experienced a crucial shortage rebounded. In times of growing markets and a
favourable macroeconomic situation, selling one’s product might be relatively easy. After the
high-tech market downturn, however, firms had to intensify their sales-promoting efforts in order
to ensure growth or even survival. During a period of macroeconomic stagnation, firms’ products
and services are no longer sold “automatically”. Sales-related capabilities become more important
and shortages in marketing reduce growth.
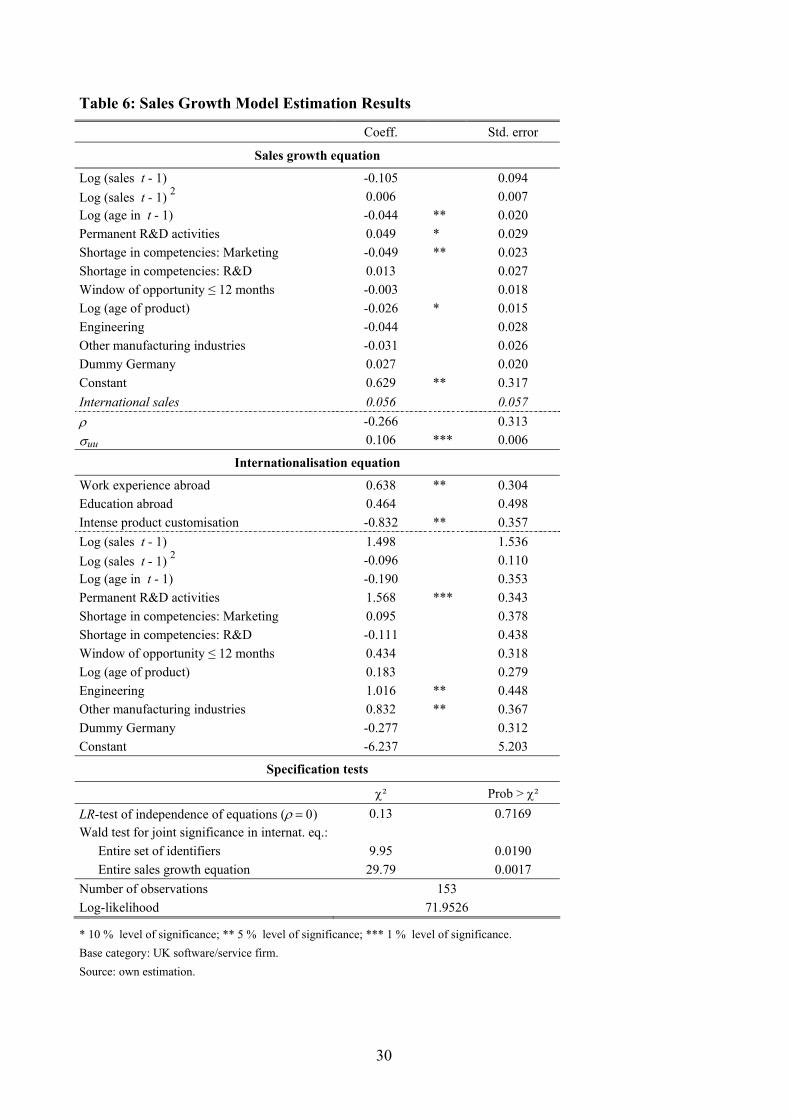
30
Table 6: Sales Growth Model Estimation Results
Coeff. Std. error
Sales growth equation
Log (sales t - 1) -0.105 0.094 Log (sales t - 1) 2 0.006 0.007 Log (age in t - 1) -0.044 ** 0.020 Permanent R&D activities 0.049 * 0.029 Shortage in competencies: Marketing -0.049 ** 0.023 Shortage in competencies: R&D 0.013 0.027 Window of opportunity ≤ 12 months -0.003 0.018 Log (age of product) -0.026 * 0.015 Engineering -0.044 0.028 Other manufacturing industries -0.031 0.026 Dummy Germany 0.027 0.020 Constant 0.629 ** 0.317 International sales 0.056 0.057 ρ -0.266 0.313 σuu 0.106 *** 0.006
Internationalisation equation
Work experience abroad 0.638 ** 0.304 Education abroad 0.464 0.498 Intense product customisation -0.832 ** 0.357 Log (sales t - 1) 1.498 1.536 Log (sales t - 1) 2 -0.096 0.110 Log (age in t - 1) -0.190 0.353 Permanent R&D activities 1.568 *** 0.343 Shortage in competencies: Marketing 0.095 0.378 Shortage in competencies: R&D -0.111 0.438 Window of opportunity ≤ 12 months 0.434 0.318 Log (age of product) 0.183 0.279 Engineering 1.016 ** 0.448 Other manufacturing industries 0.832 ** 0.367 Dummy Germany -0.277 0.312 Constant -6.237 5.203
Specification tests
χ² Prob > χ² LR-test of independence of equations (ρ = 0) 0.13 0.7169 Wald test for joint significance in internat. eq.: Entire set of identifiers 9.95 0.0190 Entire sales growth equation 29.79 0.0017 Number of observations 153 Log-likelihood 71.9526
* 10 % level of significance; ** 5 % level of significance; *** 1 % level of significance. Base category: UK software/service firm. Source: own estimation.
31
Firms with a window of opportunity that lasts 12 months or shorter do not distinguish themselves
significantly from firms with larger such periods. Interestingly, when analysing the firms in our
sample during the growth period between start-up and 1997, dummy variables indicating a large
window of opportunity significantly reduced (employment) growth rates (see Bürgel et al. 2004).
Probably, in the 1990s firms could afford to grow more slowly, under today’s difficult market
conditions, however, firms must fully exploit competitive advantages in order to maintain market
position, even if they were potentially able to profit from a relatively long competition-free period.
As hypothesised, the age of a firm’s best selling product negatively affects its sales growth rate,
although the coefficient is only significant on the 10 % level and insignificant in the employment
growth equation (and therefore not included in the final specification of the employment growth
model). Firms with older and possibly out-of-date products exhibit smaller sales growth rates than
firms that generate a higher share of sales with more recently developed products.
Industry-specific differences are of minor importance after controlling for the factors discussed
above. Similarly, in accordance with the descriptive results depicted in Figure 1, the dummy
variable for German firms is positive but insignificant. Obviously, their are no structural differ-
ences between German and UK firms additional to those covered by the variables included in the
growth equations.
International sales do not affect employment or sales growth significantly. Furthermore, the esti-
mated correlation coefficients ρ between the residuals of the growth equation and the internation-
alisation equation are also not significantly different from zero, making the employment growth
and sales growth equations each statistically independent of the respective internationalisation
equation. As in the case of labour productivity and in contrast to the expectations of the firms’
managers, internationalisation does not improve firm performance (measured by employment or
sales growth).
The set of identifying variables in the internationalisation equation is jointly significant. Further,
the estimation results for the individual variables are similar to the labour productivity model:
Firm managers’ work experience abroad increases the probability of their companies being export-
ers, whereas high product customisation is a barrier to entry into the foreign market.36 37
36 In contrast to the estimation results for the labour productivity model, the dummy variable indicating whether a
firm manager was educated abroad is not significant in the growth models. It is difficult to interpret why this single variable is significant in the selection equation of the labour productivity model but insignificant in that of the growth models. However, since there are two variables measuring specific human capital that facilitates interna-tional business activities and at least one dummy variable is significant, the two dummy variables should be inter-preted together as reflecting one dimension of specific human capital.
32
The variables of the growth equation are jointly significant in the corresponding internationalisa-
tion equation, thus showing that the variables determining growth also affect the internationalisa-
tion decision. A bit surprisingly, neither number of employees nor amount of sales is significant in
the estimated reduced form of the selection equation. In most other studies, in which a measure of
firm size is regressed on probability of having international sales, the coefficient of firm size is
positive and significant. Our findings may be due to the fact that number of employees and amount
of sales at the beginning of the growth period were included in the selection equation, while the
endogenous variable is the firms’ participation in the foreign market in 2003. Current firm size is
intended to approximate the firms’ current resources and thereby expected to be positively corre-
lated with their current export activities. During a six-year period, however, firms vary in size.
Firms’ dimensions at the beginning of the growth period might be very different form their size at
its end. Hence, there may not be a positive correlation between lagged firm size and current export
activities. It is also surprisingly that the dummy variable indicating a short window of opportunity
becomes significant in the selection equation of the employment growth model. I cannot currently
offer a convincing interpretation of this effect. The higher probability of manufacturing firms
being exporters, however, is plausible and in line with the descriptive analysis in Table 1.
The estimation results of the internationalisation equation emphasize in particular the crucial role
of R&D activities. On the one hand, R&D activities increase the probability of exporting, on the
other, they enhance employment and sales growth. This means that good firms – or, to be more
precise, more innovative firms – become exporters. After considering the self-selection of the
more innovative firms into the foreign market, internationalisation has no marginal effect on firm
growth.
8 Conclusion
This paper examines the relationship between three indicators of firm performance (labour produc-
tivity, employment growth, and sales growth) and the export behaviour of a sample of young,
small, technology-oriented firms in Germany and the UK founded in the period 1987-1996. These
firms were contacted by two surveys, which were conducted in 1997 and 2003. Examining the
37 As with the productivity model, I estimated the two growth equations by OLS, including the three identifying
variables from the selection equation. The OLS model is again appropriate, since the growth equation and the re-spective selection equation are independent of one another. In both OLS regressions, the three identifying variables are individually and jointly insignificant. Thus, employment and sales growth are independent of these variables.
33
firms in our sample during an early stage of their life cycles (from start-up to 1997), Bürgel et
al. (2004) showed that international business activities improved the firms’ labour productivity and
increased sales growth rates, but did not affect employment growth. The positive effect of interna-
tionalisation on firm performance contradicts to many other empirical studies which concluded
that causality runs from firm performance to internationalisation and not vice versa. Thus, the
question arises whether the results of Bürgel et al. will hold true if the firms are analysed at a later,
more “mature” stage of their life cycles, or if the performance-improving effect of internationalisa-
tion is only a phenomenon prevalent during early stages of the firms’ development.
My results are quite straightforward: Good firms are or will become exporters. The better perform-
ance of firms with international sales is, therefore, a result of self-selection of firms with superior
performance into the international market. Technology-oriented firms in Germany and the UK
behave exactly like the firms of most other samples studied so far. Only during early stages of the
firms’ life cycles does the relationship between internationalisation and performance seem to be
different. It is possible that learning effects which may increase the firms’ productivity are more
relevant during early stages of firm development. However, when considering a later stage of the
firms’ life cycles, the productivity-increasing effect disappears.
R&D activities play a crucial role in both the productivity and growth models as well as for the
firms’ (long-term) internationalisation behaviour. Firstly, the mean R&D intensity of firms in the
regime without international sales decreased significantly between the first and the second survey,
whereas firms with international sales maintained a high level of R&D activities. Secondly, R&D
activities improve labour productivity as well as employment and sales growth. Number of R&D
employees constitutes a production factor in the Cobb-Douglas production function. For firms with
international sales, number of R&D employees has a productivity-increasing effect. On the other
hand, in the regime of non-exporting firms, where more than half of the firms do not carry out any
R&D activities, the effect of R&D employees as a production factor can almost be neglected. In
this regime, the estimated partial production elasticity is not significantly different from zero.
Moreover, (permanent) R&D activities boost the firms’ growth rates when estimating a joint
growth equation for both exporting and non-exporting firms. Finally, the more intensive a firm’s
R&D activities, the higher its probability of internationalisation. After controlling for R&D, there
is no partial effect of internationalisation on firm performance. Hence, we can reformulate the
above statement in the sense that more innovative firms self-select into the foreign market. By
investing in R&D, firms create intangible assets that improve their growth prospects, increase
labour productivity, and facilitate international business activities with respect to both foreign
market entry and long-term engagements in the international market (cf. Fryges 2004).
34
However, the question remains: Why do firms actually enter the foreign market? What are the
benefits of international engagement? Arguing that good or more innovative firms become export-
ers is only a necessary condition for international business activities: Only firms that are endowed
with (intangible) firm-specific assets, primarily created by their intensive R&D activities, are able
to bear the additional costs of international engagement. But this argumentation does not constitute
a sufficient condition. All theoretic models of individual firms’ foreign market participation – for
example, the dynamic model formulated by Roberts and Tybout (1997) – state that a firm will
enter the international market if the (expected) benefits of such an engagement are positive. How-
ever, like many other studies this paper does not ascertain any long-term benefits. A productivity-
increasing effect of exporting is apparent only during early stages of young technology-oriented
firms’ life cycles and disappears when firms become older. Similarly, the positive influence inter-
nationalisation has on sales growth that was found in the firms’ start-up periods also vanishes
when the firms mature. Admittedly, the latter effects may be extremely important for newly
founded technology-based firms as a means of establishing themselves on the market. Besides
these early-stage effects, however, there seems to be no long-term benefits. The sufficient condi-
tion for international engagement is not met in the long run.
Additionally, the results contradict assumptions regarding profit-maximizing firms. The economet-
ric results suggest that high labour productivity and long-term growth might be realised by a firm
with only domestic sales – provided that the firm invests intensively in R&D or other firm-specific
assets. If we considered the additional costs of international engagement, exporting firms would
not behave rationally because they could realise high levels of performance at a lower cost. How-
ever, our findings should not be interpreted to suggest that firms with international sales do not
behave rationally. Firstly, the observed self-selection of more innovative firms might be a result of
forward-looking behaviour (see Bernard and Wagner 1997, or Bernard and Jensen 1999). If firms
expect that they can realise long-term growth only through an expansion to the foreign market,
they will invest in R&D in order to generate the necessary assets before becoming internationally
active. In this case, we observe intensive R&D activities in a continuously growing firm with
international sales. Statistically, this observation is consistent with a causality running from supe-
rior performance – due to a better endowment with firm-specific assets – to higher probability of
international engagement. Secondly, in this paper only direct effects of international business
activities on the performance of exporting firms are considered. Under circumstances involving
regional spillover effects, non-exporting firms might also profit from other firms’ exporting activi-
ties such that international business activities have a productivity-increasing effect on both export-
35
ing and non-exporting companies.38 If spillover effects exist, it will be difficult to measure produc-
tivity differences as a result of international engagement. Thus, we must be cautious when inter-
preting the econometric results of this and other studies. It is econometrically apparent that firms
with superior performance self-select into the foreign market. The question of whether and how
firms benefit from international engagement, however, remains unanswered.
38 For a discussion on spillover effects of export activities see Aitken et al. (1997).
36
9 References
Aitken, B., G. H. Hanson, and A. E. Harrison (1997), Spillovers, Foreign Investment, and Export Behavior, in: Journal of International Economics, 43 (1-2), 103-132.
Almus, M., D. Engel, and E. A. Nerlinger (1999), Determinanten des Beschäftigungswachstums junger Unternehmen in den alten und neuen Bundesländern: Bestehen Unterschiede hinsicht-lich der Technologieorientierung?, in: Zeitschrift für Wirtschafts- und Sozialwissenschaften, 119 (4), 561-592.
Arnold, J. M., and K. Hussinger (2004), Export Behavior and Firm Productivity in German Manu-facturing, ZEW Discussion Paper No. 04-12, Mannheim.
Aw, B. Y., S. Chung, and M. J. Roberts (2000), Productivity and Turnover in the Export Market: Micro-Level Evidence from the Republic of Korea and Taiwan (China), in: The World Bank Economic Review, 14 (1), 65-90.
Aw, B. Y., and A. Hwang (1995), Productivity and the Export Market: A Firm-level Analysis, in: Journal of Development Economics, 47, 313-332.
Baldwin, R. E. (2000), Trade and Growth: Still Disagreement About the Relationships, OECD Economics Department, Working Paper No. 264, Paris.
Bates, T. (1990), Entrepreneur Human Capital Inputs and Small Business Longevity, in: Review of Economics and Statistics, 72 (4), 551-559.
Bernard, A. B., J. Eaton, J. B. Jensen, and S. Kortum (2000), Plants and Productivity in Interna-tional Trade, National Bureau of Economic Research Working Paper No. 7688, Cambridge.
Bernard, A. B., and J. B. Jensen (1999), Exceptional Exporter Performance: Cause, Effect, or Both?, in: Journal of International Economics, 47, 1-25.
Bernard, A. B., and J. Wagner (1997), Exports and Success in German Manufacturing, in: Review of World Economics, 133 (1), 134-157.
Bertschek, I., H. Fryges, and U. Kaiser (2004), B2B or Not To Be: Does B2B E-Commerce Increase Labour Productivity?, ZEW Discussion Paper No. 04-45, Mannheim.
Bertschek, I., and U. Kaiser (2004), Productivity Effects of Organizational Change: Microecono-metric Evidence, in: Management Science, 50 (3), 394 - 404.
Bilkey, W. J. (1978), An Attempted Integration of the Literature on the Export Behavior of Firms, in: Journal of International Business Studies, 9 (1), 33-46.
Bilkey, W. J., and G. Tesar (1977), The Export Behavior of Small-Sized Wisconsin Manufacturing Firms, in: Journal of International Business Studies, 8 (1), 93-98.
Brüderl, J., P. Preisendörfer, and R. Ziegler (1998), Der Erfolg neugegründeter Betriebe: Eine empirische Studie zu den Chancen und Risiken von Unternehmensgründungen, Berlin.
Bürgel, O., A. Fier, G. Licht, and G. Murray (2004), The Internationalisation of Young High-Tech Firms, ZEW Economic Studies, 22, Heidelberg, New York.
Butchart, R. (1987), A New UK Definition of High-Technology Industries, in: Economic Trends, 400, 82-88.
Cabral, L. (1995), Sunk Costs, Firm Size and Firm Growth, in: Journal of Industrial Economics, 43, 161-172.
Caves, R. E., and M. E. Porter (1979), From Entry Barriers to Mobility Barriers, in: Quarterly Journal of Economics, 91, 241-261.
37
Clerides, S. K., S. Lach, and J. R. Tybout (1998), Is Learning by Exporting Important? Micro-Dynamic Evidence from Colombia, Mexico, and Morocco, in: The Quarterly Journal of Economics, 113 (3), 903-947.
De Loecker, J. (2004), Do Exports Generate Higher Productivity? Evidence from Slovenia, Katholieke Universiteit Leuven, LICOS Discussion Paper 151/2004, Leuven.
DIW, IAB, IfW, IWH, and ZEW (2003), Zweiter Fortschrittsbericht wirtschaftswissenschaftlicher Institute über die wirtschaftliche Entwicklung in Ostdeutschland, Sonderheft IWH, Vol. 7, Halle.
Ericson, R., and A. Pakes (1995), Markov-Perfect Industry Dynamics: A Framework for Empirical Work, in: Review of Economic Studies, 62, 53-82.
Evans, D. S. (1987a), Tests of Alternative Theories of Firm Growth, in: Journal of Political Economy, 95 (4), 657-674.
Evans, D. S. (1987b), The Relationship between Firm Growth, Size, and Age: Estimates for 100 Manufacturing Industries, in: Journal of Industrial Economics, 35 (4), 567-581.
Evenson, R. E., and L. E. Westphal (1995), Technological Change and Technology Strategy, in: H. Chenery and T. N. Srinivasan, eds., Handbook of Development Economics, Vol. 3A, Amsterdam, 2209-2299.
Feder, G. (1982), On Exports and Economic Growth, in: Journal of Development Economics, 12, 59-73.
Felder, J., G. Licht, E. A. Nerlinger, and H. Stahl (1996), Factors Determining R&D and Innova-tion Expenditures in German Manufacturing Industries, in: A. Kleinknecht, ed., Determi-nants of Innovation: The Message from New Indicators, Basingstoke: McMillan, 125-155.
Fryges, H. (2004), Stepping In and Out of the International Market: Internationalisation of Tech-nology-Oriented Firms in Germany and the UK, ZEW Discussion Paper No. 04-65, Mannheim.
Geroski, P. A. (2000), The Growth of Firms in Theory and Practice, in: N. J. Foss, ed., Compe-tence, Governance, and Entrepreneurship: Advances in Economic Strategy Research, Oxford: Oxford University Press, 168-186.
Gibrat, R. (1931), Les inégalités économiques. Applications: aux inégalités des richesses, á la concentration des entreprises, aux populations des villes, aux statistiques des familles, etc., d’une loi nouvelle: la loi de l’effect proportionnel, Paris: Sirey.
Girma, S., D. Greenaway, and R. Kneller (2002), Does Exporting Lead to Better Performance? A Microeconometric Analysis of Matched Firms, University of Nottingham GEP Research Papers No. 02/09, Nottingham.
Greene, W. H. (2000), Econometric Analysis, fourth edition, New York: Prentice-Hall.
Griliches, Z. (1979), Issues in Assessing the Contribution of R&D to Productivity Growth, in: Bell Journal of Economics, 10, 92-116.
Hall, B. H., and J. Mairesse (1995), Exploring the Relationship between R&D and Productivity in French Manufacturing Firms, in: Journal of Econometrics, 65, 263-293.
Hart, P. E. (2000), Theories of Firms’ Growth and the Generation of Jobs, in: Review of Industrial Organization, 17, 229-248.
Johanson, J., and J.-E. Vahlne (1977), The Internationalization Process of the Firm - a Model of Knowledge Development and Increasing Market Commitments, in: Journal of International Business Studies, 8 (1), 23-32.
38
Johanson, J., and J.-E. Vahlne (1990), The Mechanism of Internationalisation, in: International Marketing Review, 7 (4), 11-24.
Jovanovic, B. (1982), Selection and the Evolution of Industry, in: Econometrica, 50 (3), 640-670.
Little, A. D. (1977), New Technology-Based Firms in the United Kingdom and the Federal Repub-lic of Germany, London, Bonn: Anglo-German Foundation for the Study of Industrial Society.
Lucas, R. E. (1978), On the Size Distribution of Business Firms, in: Bell Journal of Economics, 9, 508-523.
Maddala, G. S. (1983), Limited Dependent and Qualitative Variables in Econometrics, Cambridge: Cambridge University Press.
McKinsey Global Institute (1993), Manufacturing Productivity, Washington, D.C.: McKinsey and Company.
Nelson, R. R., and S. G. Winter (1982), An Evolutionary Theory of Economic Change, Cambridge, MA: Harvard University Press.
Penrose, E. (1959), The Theory of the Growth of the Firm, Oxford: Basil Blackwell.
Porter, M. E. (1979), The Structure within Industries and Companies’ Performance, in: Review of Economics and Statistics, 61, 214-227.
Prantl, S. (2002), Bankruptcy, Subsidized Loans, and Exit Decisions of Start-Up Firms, University of Mannheim, Dissertation, Mannheim.
Reid, G. C. (1995), Early Life-Cycle Behaviour of Micro-Firms in Scotland, in: Small Business Economics, 7, 89-95.
Roberts, M. J., and J. R. Tybout (1997), The Decision to Export in Columbia: An Empirical Model of Entry with Sunk Costs, in: The American Economic Review, 87 (4), 545-564.
Sapienza, H. J., E. Autio, and S. Zahra (2003), Effects of Internationalisation on Young Firms’ Prospects for Survival and Growth, paper presented at the Academy of Management Meet-ing, Seattle, WA.
Simon, H., and C. P. Bonini (1958), The Size Distribution of Business Firms, in: American Economic Review, 48, 607-617.
Storey, D. J., and B. Tether (1996), A Review of the Empirical Knowledge and an Assessment of Statistical Data on the Economic Importance of New Technology-Based Firms in Europe, Coventry: Warwick Research Institute.
Sutton, J. (1997), Gibrat's Legacy, in: Journal of Economic Literature, 35 (1), 40-59.
Wagner, J. (1992), Firm Size, Firm Growth, and Persistence of Chance: Testing Gibrat’s Law with Establishment Data from Lower Saxony, 1978-1989, in: Small Business Economics, 4, 126-131.
Wagner, J. (2002), The Causal Effects of Export on Firm Size and Labour Productivity: First Evidence from a Matching Approach, in: Economics Letters, 77, 287-292.
Wernerfelt, B. (1984), A Resource-Based View of the Firm, in: Strategic Management Journal, 5, 171-180.
Williamson, O. E. (1985), The Economic Institutions of Capitalism, New York: Free Press.
Yli-Renko, H., D. Mani, and H. J. Sapienza (2004), Internationalization and Social Capital: Effects on the Survival and Growth of Young, Technology-Based Firms, paper presented at the Babson Kauffman Entrepreneurship Research Conference, Glasgow.
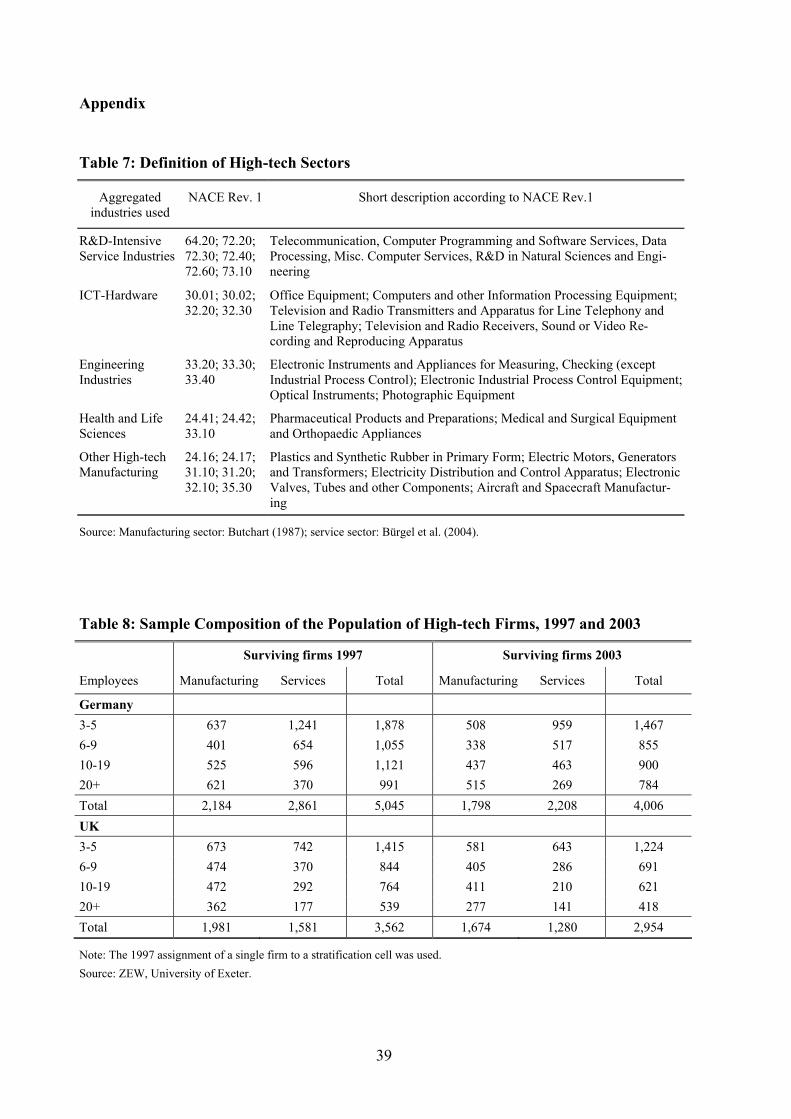
39
Appendix
Table 7: Definition of High-tech Sectors
Aggregated industries used
NACE Rev. 1 Short description according to NACE Rev.1
R&D-Intensive Service Industries
64.20; 72.20; 72.30; 72.40; 72.60; 73.10
Telecommunication, Computer Programming and Software Services, Data Processing, Misc. Computer Services, R&D in Natural Sciences and Engi-neering
ICT-Hardware 30.01; 30.02; 32.20; 32.30
Office Equipment; Computers and other Information Processing Equipment; Television and Radio Transmitters and Apparatus for Line Telephony and Line Telegraphy; Television and Radio Receivers, Sound or Video Re-cording and Reproducing Apparatus
Engineering Industries
33.20; 33.30; 33.40
Electronic Instruments and Appliances for Measuring, Checking (except Industrial Process Control); Electronic Industrial Process Control Equipment; Optical Instruments; Photographic Equipment
Health and Life Sciences
24.41; 24.42; 33.10
Pharmaceutical Products and Preparations; Medical and Surgical Equipment and Orthopaedic Appliances
Other High-tech Manufacturing
24.16; 24.17; 31.10; 31.20; 32.10; 35.30
Plastics and Synthetic Rubber in Primary Form; Electric Motors, Generators and Transformers; Electricity Distribution and Control Apparatus; Electronic Valves, Tubes and other Components; Aircraft and Spacecraft Manufactur-ing
Source: Manufacturing sector: Butchart (1987); service sector: Bürgel et al. (2004).
Table 8: Sample Composition of the Population of High-tech Firms, 1997 and 2003
Surviving firms 1997 Surviving firms 2003
Employees Manufacturing Services Total Manufacturing Services Total
Germany 3-5 637 1,241 1,878 508 959 1,467 6-9 401 654 1,055 338 517 855 10-19 525 596 1,121 437 463 900 20+ 621 370 991 515 269 784 Total 2,184 2,861 5,045 1,798 2,208 4,006 UK 3-5 673 742 1,415 581 643 1,224 6-9 474 370 844 405 286 691 10-19 472 292 764 411 210 621 20+ 362 177 539 277 141 418 Total 1,981 1,581 3,562 1,674 1,280 2,954
Note: The 1997 assignment of a single firm to a stratification cell was used. Source: ZEW, University of Exeter.
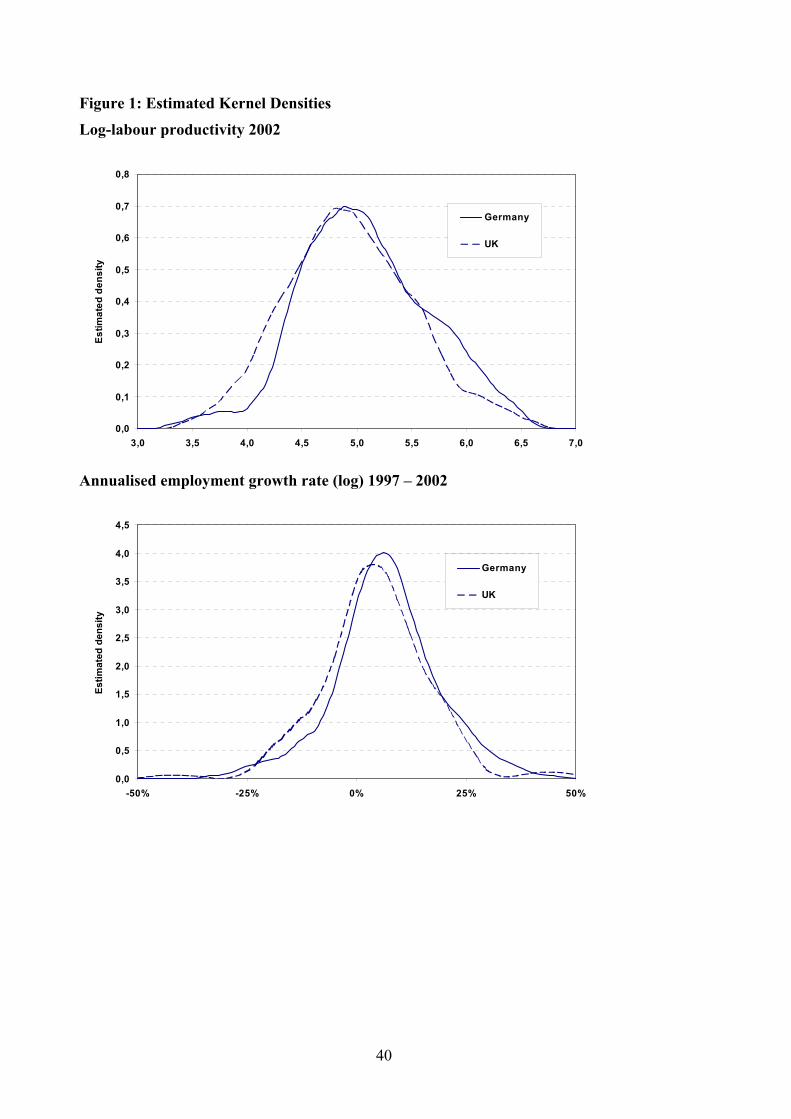
40
Figure 1: Estimated Kernel Densities
Log-labour productivity 2002
0,0
0,1
0,2
0,3
0,4
0,5
0,6
0,7
0,8
3,0 3,5 4,0 4,5 5,0 5,5 6,0 6,5 7,0
Estim
ated
den
sity
Germany
UK
Annualised employment growth rate (log) 1997 – 2002
0,0
0,5
1,0
1,5
2,0
2,5
3,0
3,5
4,0
4,5
-50% -25% 0% 25% 50%
Estim
ated
den
sity
Germany
UK
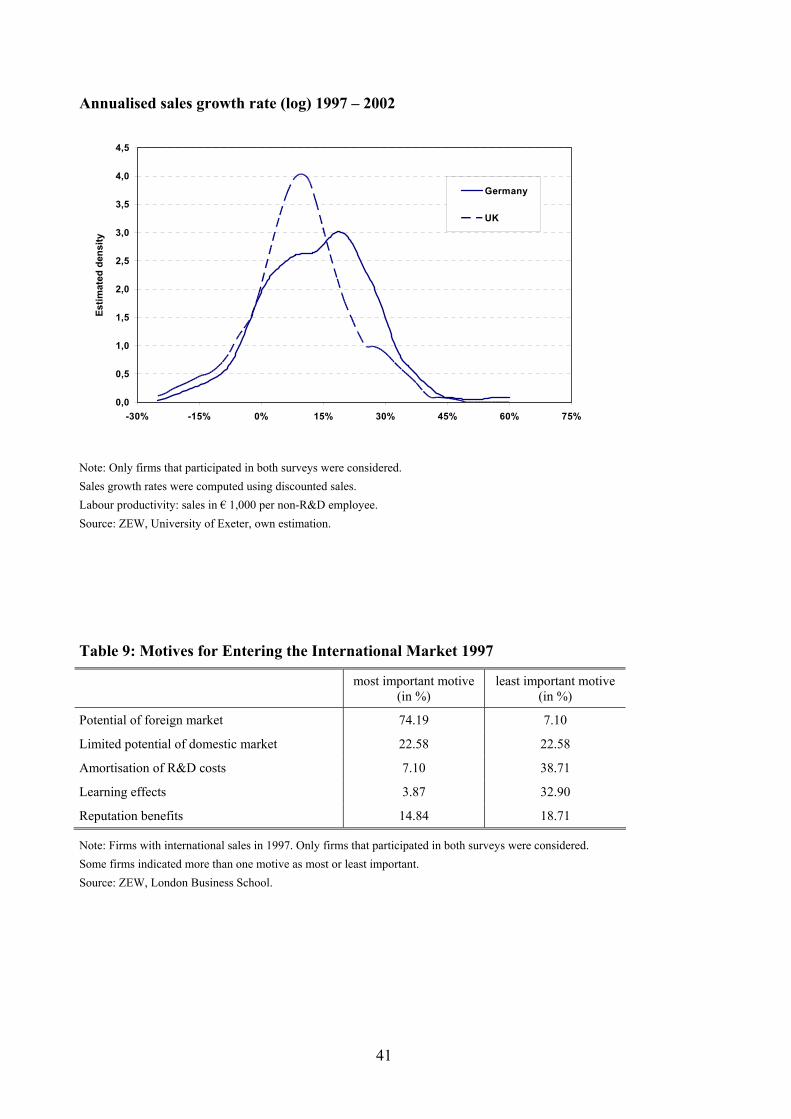
41
Annualised sales growth rate (log) 1997 – 2002
0,0
0,5
1,0
1,5
2,0
2,5
3,0
3,5
4,0
4,5
-30% -15% 0% 15% 30% 45% 60% 75%
Estim
ated
den
sity
Germany
UK
Note: Only firms that participated in both surveys were considered. Sales growth rates were computed using discounted sales. Labour productivity: sales in € 1,000 per non-R&D employee. Source: ZEW, University of Exeter, own estimation.
Table 9: Motives for Entering the International Market 1997
most important motive (in %)
least important motive (in %)
Potential of foreign market 74.19 7.10
Limited potential of domestic market 22.58 22.58
Amortisation of R&D costs 7.10 38.71
Learning effects 3.87 32.90
Reputation benefits 14.84 18.71
Note: Firms with international sales in 1997. Only firms that participated in both surveys were considered. Some firms indicated more than one motive as most or least important. Source: ZEW, London Business School.