Embed Size (px)
Citation preview
Progress and Achievement Test (PAT)
Listening Comprehension
Achievement results with student performance being compared to National Norms.
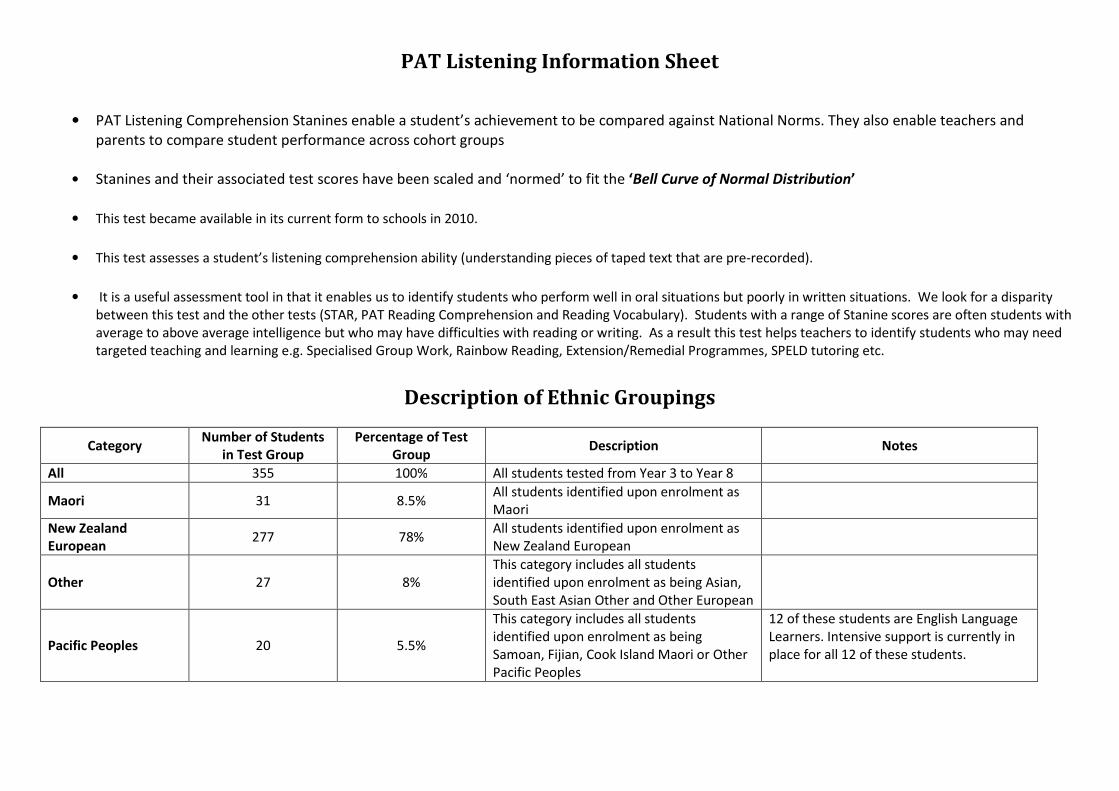
PAT Listening Information Sheet
• PAT Listening Comprehension Stanines enable a student’s achievement to be compared against National Norms. They also enable teachers and
parents to compare student performance across cohort groups
• Stanines and their associated test scores have been scaled and ‘normed’ to fit the ‘Bell Curve of Normal Distribution’
• This test became available in its current form to schools in 2010.
• This test assesses a student’s listening comprehension ability (understanding pieces of taped text that are pre-recorded).
• It is a useful assessment tool in that it enables us to identify students who perform well in oral situations but poorly in written situations. We look for a disparity
between this test and the other tests (STAR, PAT Reading Comprehension and Reading Vocabulary). Students with a range of Stanine scores are often students with
average to above average intelligence but who may have difficulties with reading or writing. As a result this test helps teachers to identify students who may need
targeted teaching and learning e.g. Specialised Group Work, Rainbow Reading, Extension/Remedial Programmes, SPELD tutoring etc.
Description of Ethnic Groupings
Category Number of Students
in Test Group
Percentage of Test
Group Description Notes
All 355 100% All students tested from Year 3 to Year 8
Maori 31 8.5% All students identified upon enrolment as
Maori
New Zealand
European 277 78%
All students identified upon enrolment as
New Zealand European
Other 27 8%
This category includes all students
identified upon enrolment as being Asian,
South East Asian Other and Other European
Pacific Peoples 20 5.5%
This category includes all students
identified upon enrolment as being
Samoan, Fijian, Cook Island Maori or Other
Pacific Peoples
12 of these students are English Language
Learners. Intensive support is currently in
place for all 12 of these students.
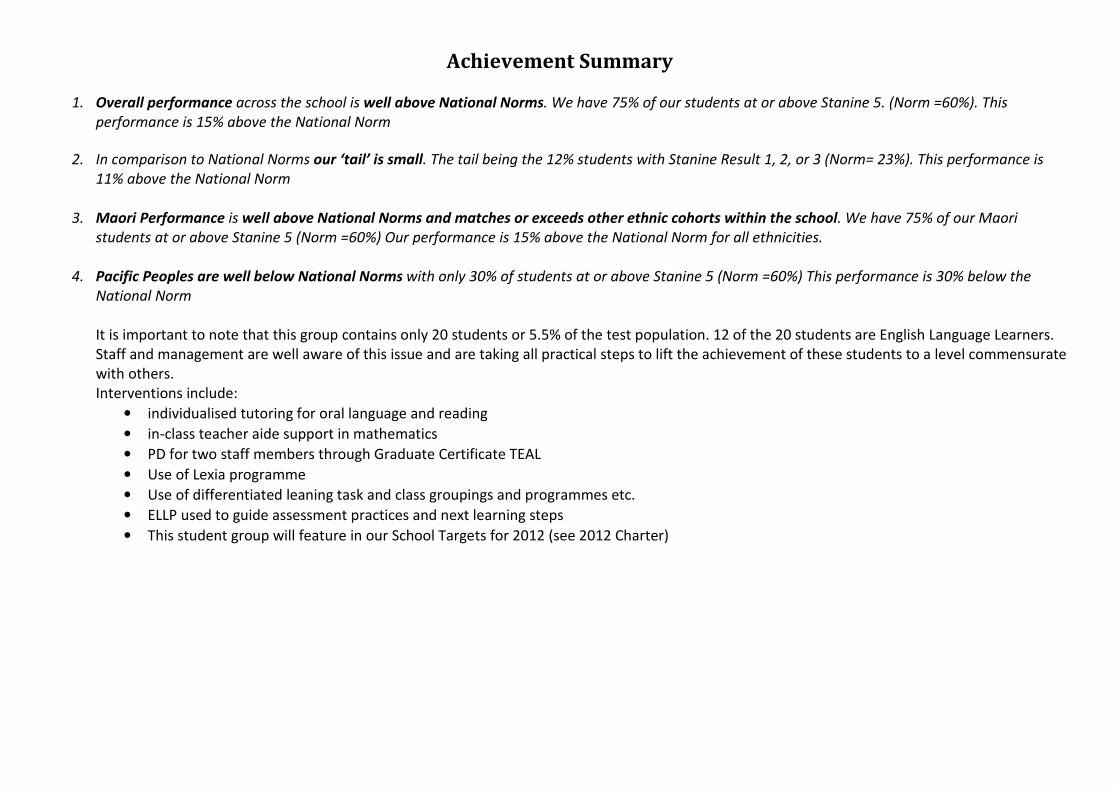
Achievement Summary
1. Overall performance across the school is well above National Norms. We have 75% of our students at or above Stanine 5. (Norm =60%). This
performance is 15% above the National Norm
2. In comparison to National Norms our ‘tail’ is small. The tail being the 12% students with Stanine Result 1, 2, or 3 (Norm= 23%). This performance is
11% above the National Norm
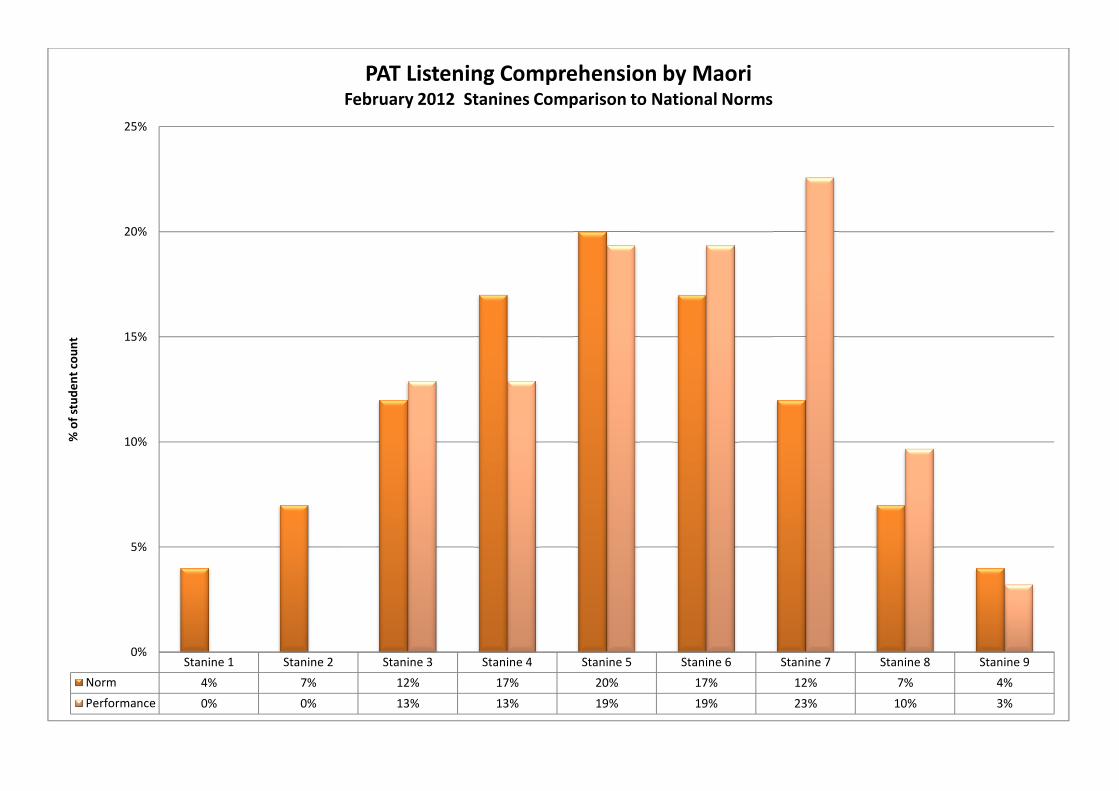
3. Maori Performance is well above National Norms and matches or exceeds other ethnic cohorts within the school. We have 75% of our Maori
students at or above Stanine 5 (Norm =60%) Our performance is 15% above the National Norm for all ethnicities.
4. Pacific Peoples are well below National Norms with only 30% of students at or above Stanine 5 (Norm =60%) This performance is 30% below the
National Norm
It is important to note that this group contains only 20 students or 5.5% of the test population. 12 of the 20 students are English Language Learners.
Staff and management are well aware of this issue and are taking all practical steps to lift the achievement of these students to a level commensurate
with others.
Interventions include:
• individualised tutoring for oral language and reading
• in-class teacher aide support in mathematics
• PD for two staff members through Graduate Certificate TEAL
• Use of Lexia programme
• Use of differentiated leaning task and class groupings and programmes etc.
• ELLP used to guide assessment practices and next learning steps
• This student group will feature in our School Targets for 2012 (see 2012 Charter)
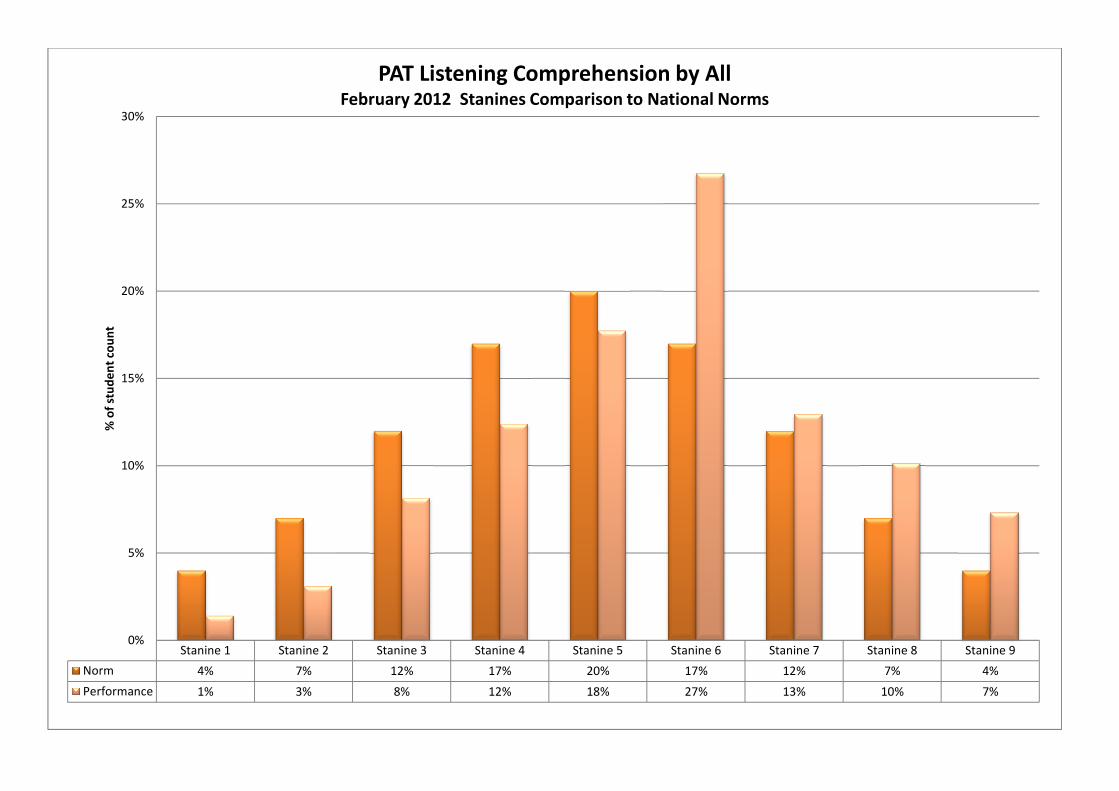
Stanine 1 Stanine 2 Stanine 3 Stanine 4 Stanine 5 Stanine 6 Stanine 7 Stanine 8 Stanine 9
Norm 4% 7% 12% 17% 20% 17% 12% 7% 4%
Performance 1% 3% 8% 12% 18% 27% 13% 10% 7%
0%
5%
10%
15%
20%
25%
30%%
of
stu
de
nt
cou
nt
PAT Listening Comprehension by AllFebruary 2012 Stanines Comparison to National Norms
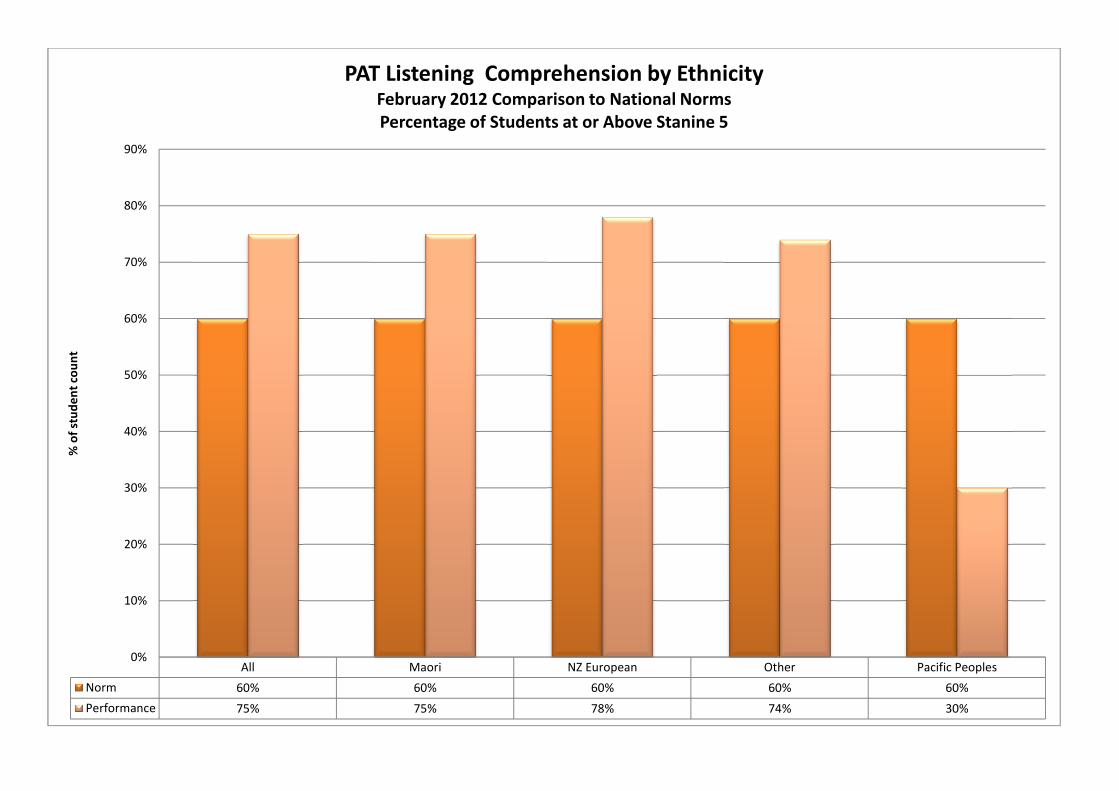
All Maori NZ European Other Pacific Peoples
Norm 60% 60% 60% 60% 60%
Performance 75% 75% 78% 74% 30%
0%
10%
20%
30%
40%
50%
60%
70%
80%
90%
% o
f st
ud
en
t co
un
tPAT Listening Comprehension by Ethnicity
February 2012 Comparison to National Norms
Percentage of Students at or Above Stanine 5
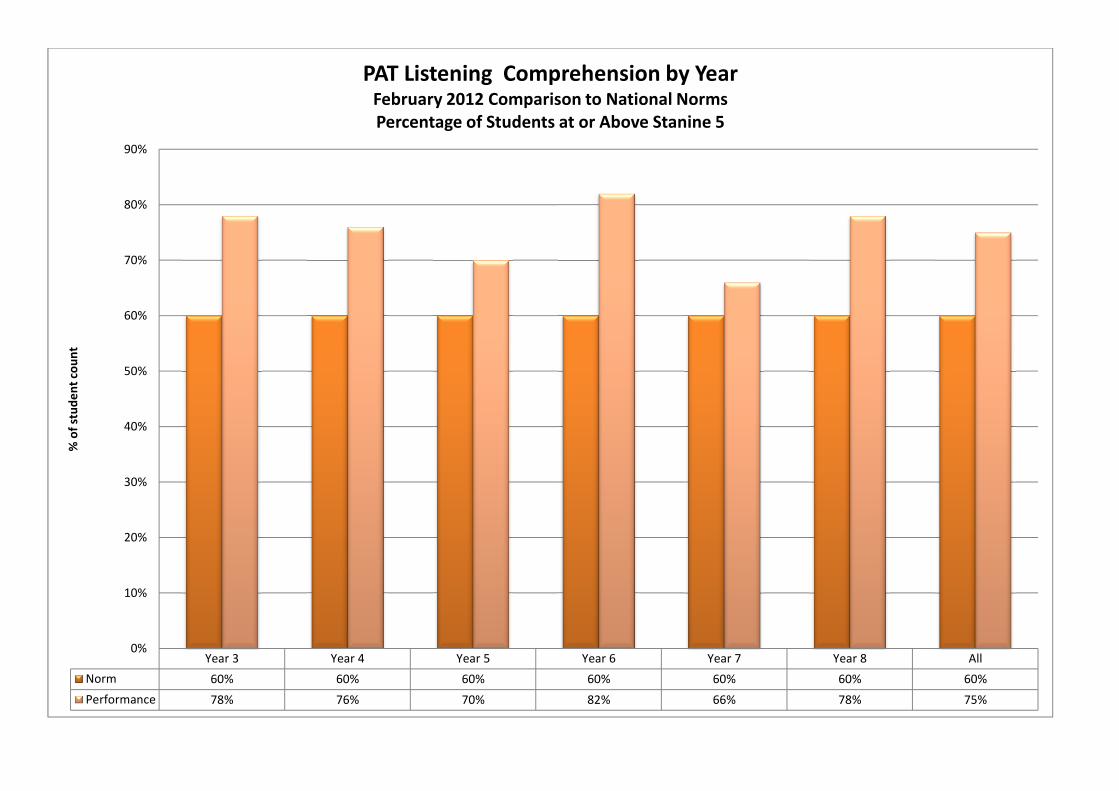
Year 3 Year 4 Year 5 Year 6 Year 7 Year 8 All
Norm 60% 60% 60% 60% 60% 60% 60%
Performance 78% 76% 70% 82% 66% 78% 75%
0%
10%
20%
30%
40%
50%
60%
70%
80%
90%
% o
f st
ud
en
t co
un
tPAT Listening Comprehension by Year
February 2012 Comparison to National Norms
Percentage of Students at or Above Stanine 5
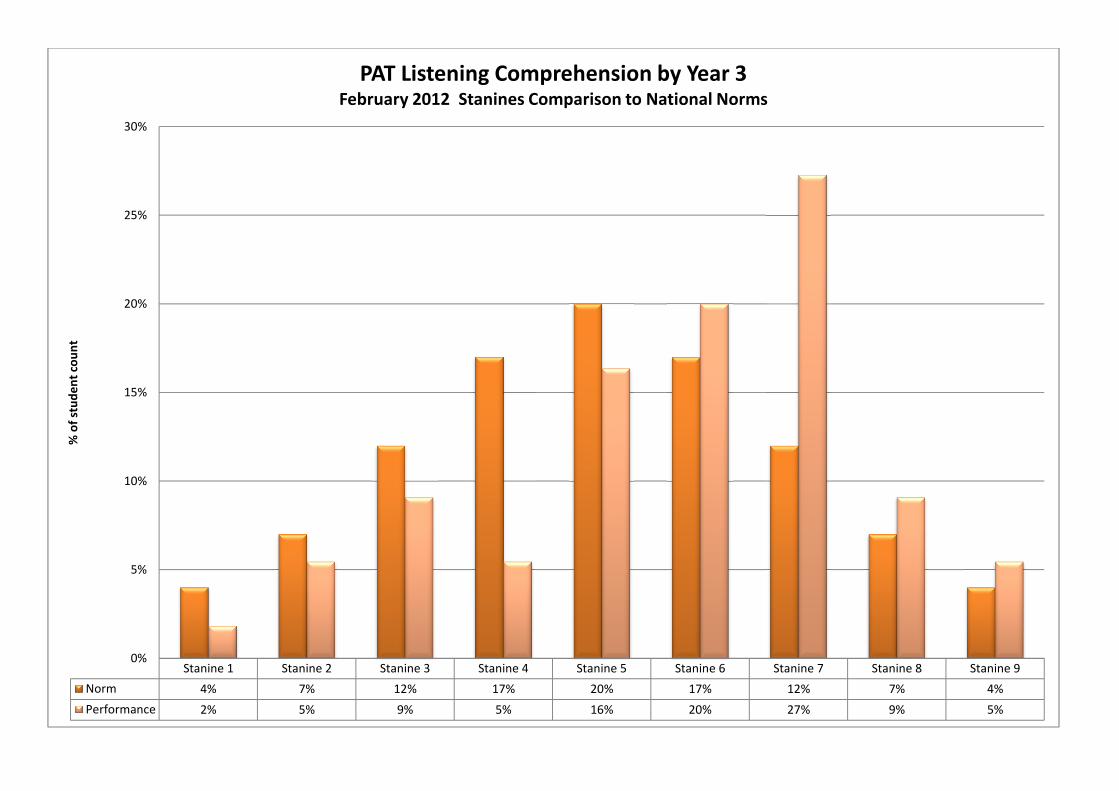
Stanine 1 Stanine 2 Stanine 3 Stanine 4 Stanine 5 Stanine 6 Stanine 7 Stanine 8 Stanine 9
Norm 4% 7% 12% 17% 20% 17% 12% 7% 4%
Performance 2% 5% 9% 5% 16% 20% 27% 9% 5%
0%
5%
10%
15%
20%
25%
30%
% o
f st
ud
en
t co
un
tPAT Listening Comprehension by Year 3
February 2012 Stanines Comparison to National Norms
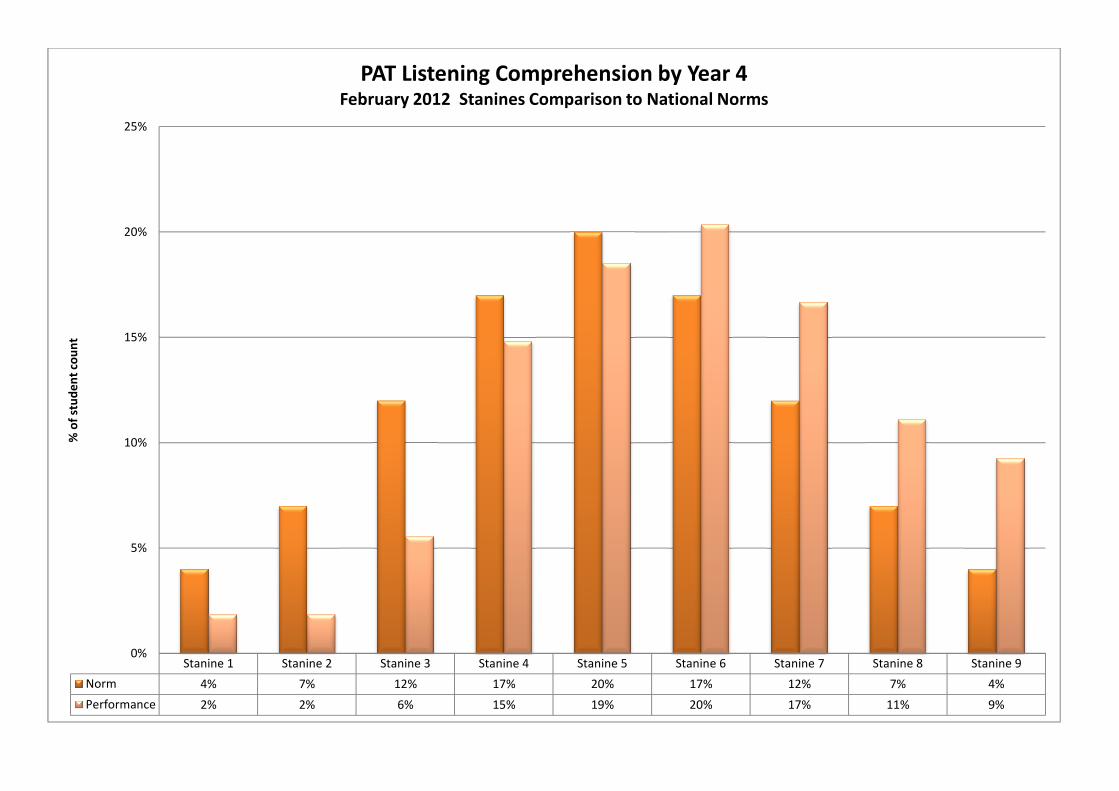
Stanine 1 Stanine 2 Stanine 3 Stanine 4 Stanine 5 Stanine 6 Stanine 7 Stanine 8 Stanine 9
Norm 4% 7% 12% 17% 20% 17% 12% 7% 4%
Performance 2% 2% 6% 15% 19% 20% 17% 11% 9%
0%
5%
10%
15%
20%
25%
% o
f st
ud
en
t co
un
tPAT Listening Comprehension by Year 4
February 2012 Stanines Comparison to National Norms
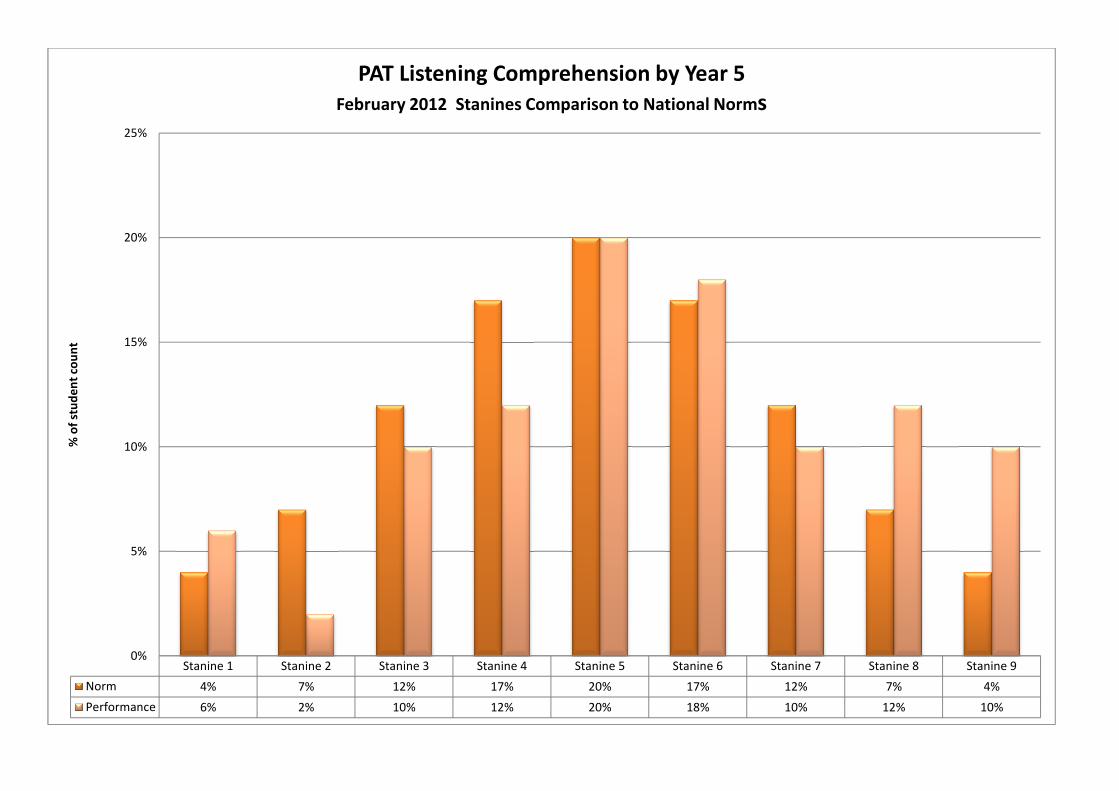
Stanine 1 Stanine 2 Stanine 3 Stanine 4 Stanine 5 Stanine 6 Stanine 7 Stanine 8 Stanine 9
Norm 4% 7% 12% 17% 20% 17% 12% 7% 4%
Performance 6% 2% 10% 12% 20% 18% 10% 12% 10%
0%
5%
10%
15%
20%
25%
% o
f st
ud
en
t co
un
tPAT Listening Comprehension by Year 5
February 2012 Stanines Comparison to National Norms
Stanine 1 Stanine 2 Stanine 3 Stanine 4 Stanine 5 Stanine 6 Stanine 7 Stanine 8 Stanine 9
Norm 4% 7% 12% 17% 20% 17% 12% 7% 4%
Performance 0% 3% 3% 12% 23% 24% 9% 14% 12%
0%
5%
10%
15%
20%
25%
30%
% o
f st
ud
en
t co
un
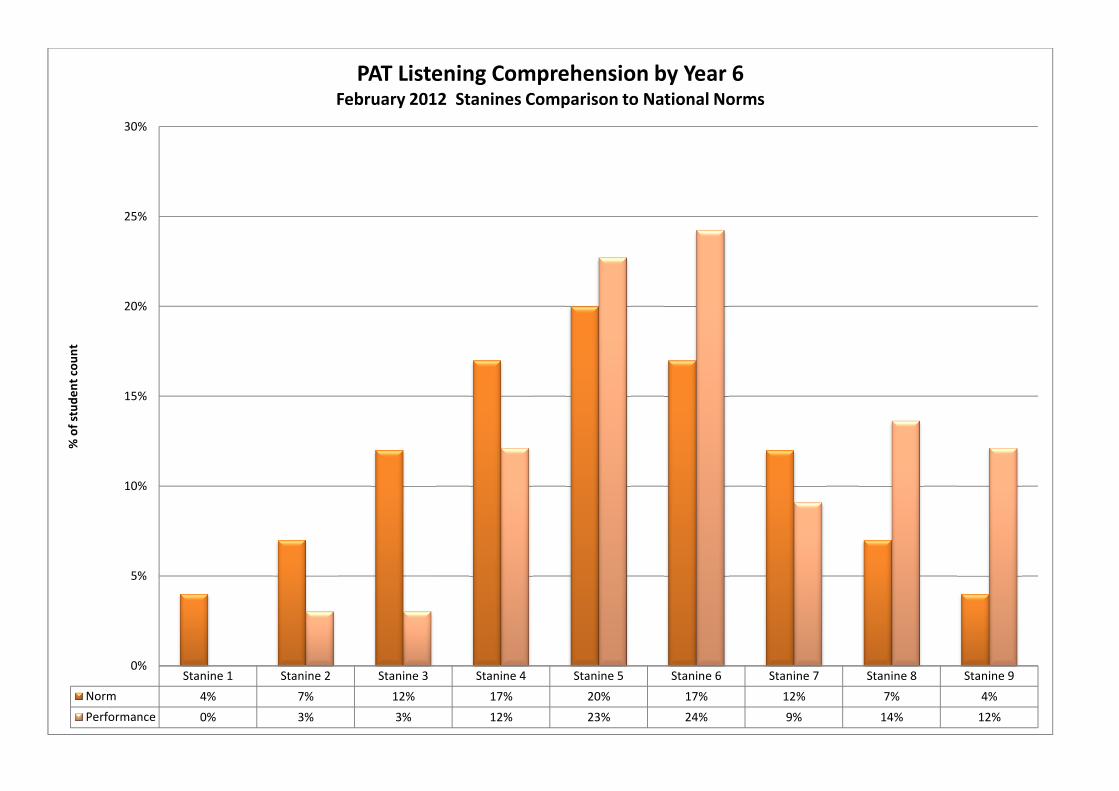
tPAT Listening Comprehension by Year 6
February 2012 Stanines Comparison to National Norms
Stanine 1 Stanine 2 Stanine 3 Stanine 4 Stanine 5 Stanine 6 Stanine 7 Stanine 8 Stanine 9
Norm 4% 7% 12% 17% 20% 17% 12% 7% 4%
Performance 0% 3% 14% 17% 11% 35% 10% 4% 6%
0%
5%
10%
15%
20%
25%
30%
35%
40%
% o
f st
ud
en
t co
un
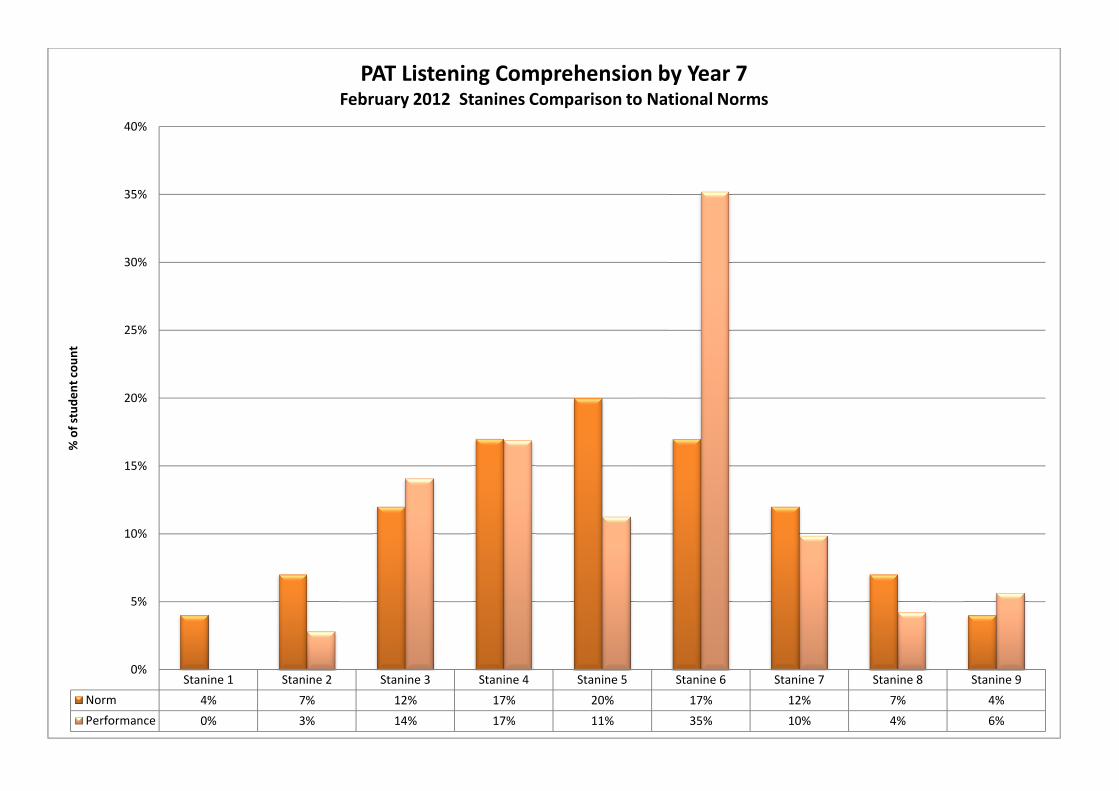
tPAT Listening Comprehension by Year 7
February 2012 Stanines Comparison to National Norms
Stanine 1 Stanine 2 Stanine 3 Stanine 4 Stanine 5 Stanine 6 Stanine 7 Stanine 8 Stanine 9
Norm 4% 7% 12% 17% 20% 17% 12% 7% 4%
Performance 0% 3% 7% 12% 19% 39% 7% 12% 2%
0%
5%
10%
15%
20%
25%
30%
35%
40%
45%
% o
f st
ud
en
t co
un
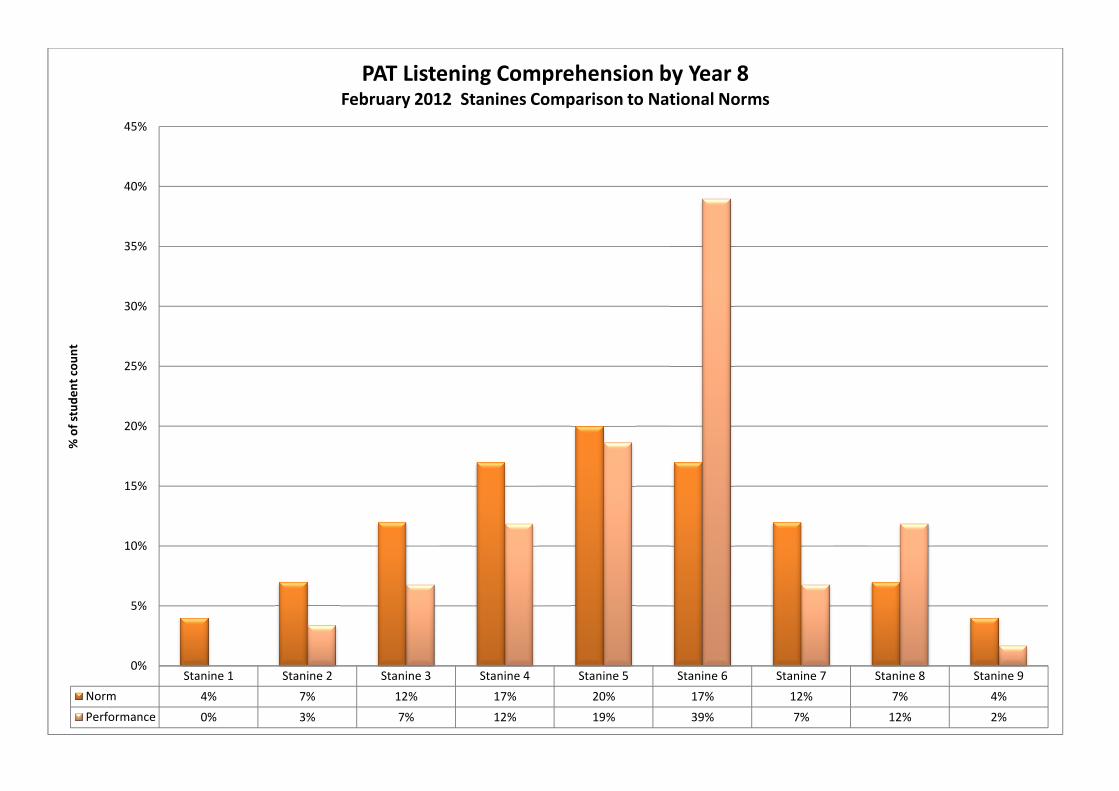
tPAT Listening Comprehension by Year 8
February 2012 Stanines Comparison to National Norms
Stanine 1 Stanine 2 Stanine 3 Stanine 4 Stanine 5 Stanine 6 Stanine 7 Stanine 8 Stanine 9
Norm 4% 7% 12% 17% 20% 17% 12% 7% 4%
Performance 0% 0% 13% 13% 19% 19% 23% 10% 3%
0%
5%
10%
15%
20%
25%
% o
f st
ud
en
t co
un
tPAT Listening Comprehension by Maori
February 2012 Stanines Comparison to National Norms
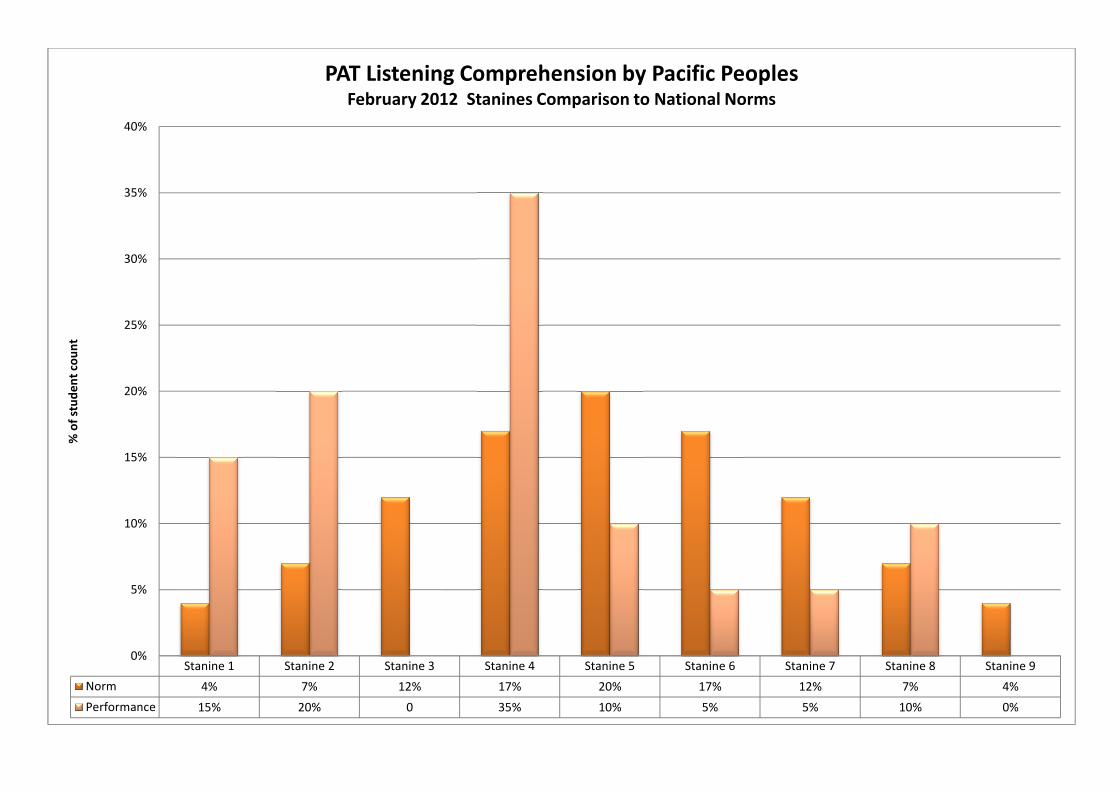
Stanine 1 Stanine 2 Stanine 3 Stanine 4 Stanine 5 Stanine 6 Stanine 7 Stanine 8 Stanine 9
Norm 4% 7% 12% 17% 20% 17% 12% 7% 4%
Performance 15% 20% 0 35% 10% 5% 5% 10% 0%
0%
5%
10%
15%
20%
25%
30%
35%
40%
% o
f st
ud
en
t co
un
tPAT Listening Comprehension by Pacific Peoples
February 2012 Stanines Comparison to National Norms