Embed Size (px)
Citation preview

Journal of Alexandria University for Administrative Sciences© – Volume 57 – No. 4– September 2020
35
Project Management (PM) Tools:
Awareness, Acceptance of Learning
and Use, User Selected Tools, and Usage
Degree in Egypt: The Case Study of College
of Management and Technology (CMT)1
Dr. Hend Abd El Halim2 Arab Academy for Science and Technology and Maritime Transport (AASTMT)
ABSTRACT
This research aims to examine Project Management (PM) tools considering the
awareness, acceptance of learning and use, user-selected tools, and usage degree in
the College of Management and Technology (CMT), in light of the Unified Theory
of Acceptance and Use of Technology (UTAUT). Having most of HE community
members in the same age range, although their diversity of awareness, motives to
learn and use, tools selection reasons, usage degree of PM tools, and software
encourage conducting such research. The research targets the project team leaders,
supervisors, and managers (majored students and staff members) as PM tools' end-
users. The research participants belonged to three departments in the CMT. The
presence of courses with projects in their study plans was the selection reason. Thus
supports the variability of end-users back-grounds, interests, learning competencies,
readiness, and project sector. The participants were surveyed through a designed
questionnaire. Some surveying questions were changed and analyzed independently
in accordance to the participants' group. The sample reached 113 participants - 86
students and 27 staff members, a descriptive analysis, correlation, and chi-square
tests were conducted. The research discussed the relationships between the
awareness, acceptance of learning and use, user-selected tools, and usage degree
1 Received in 17/8/2020, accepted in 16/9/2020.
2 Assistant Professor, Business Information Systems Department, College of Management
and Technology, Arab Academy for Science and Technology and Maritime Transport
(AASTMT), Alexandria, Egypt ([email protected]).
Journal of Alexandria University for Administrative Sciences ©
Volume 57 – No. 4 – September 2020

Project Management (PM) Tools: Awareness, ……. Dr. Hend Abd El Halim
36
and concluded that the enhancement of end-user learning and adoption practices
relied on distinguishing the impacts of individuals' factors based on their belonged
group. Such a step may support team leaders, supervisors, and managers with a
guide on how to encourage end-user learning and adoption.
Key words: Project Management (PM) Tools, Awareness, Acceptance of Learning
and Use, User Selected Tools, Usage Degree, Egypt, Private Higher
Education (HE), The Case Study of College of Management and
Technology (CMT)
1. INTRODUCTION
The usage degree of PM software has different forms, it ranged from
rarely to frequently; discrete to extreme in another words. These forms
are influenced by the drives of its usages, user belonged cluster (Howard
et al. 2017), In most cases the role of user acceptance of computer
technology, and Unified Theory of Acceptance and Use of Technology
(UTAUT) may be noted as a significant role in this context. These factors
were concerned in some recent studies i.e. (Abd El Halim, 2019).The
selected end-user PM tools and software are associated with awareness,
acceptance of learning and use and usage degree. End-user may lose
chance to more success due to the impact of issues.
According to (Information and Decision Support Center System, 2020a)
there are 23 registered private universities in Egypt. The number of
enrolled students in these private universities reached 186181 students
in July 2019 (Information and Decision Support Center System, 2020b).
In 2017 technology acceptance and usage have been examined from
individual views' by Howard et al. (2017), the researchers pointed out
the wide range of variances in the frequent of use.
Abd El Halim (2019) investigated the criteria that matter PM software
infrequent end-user in private HE sector in Egypt: tools selection,
adoption intention, and user acceptance of computer technology.
Although the existence of previous researches that focus on these issues,
some questions are not answered yet, thus motivate for more researches
on these concerns to be conducted.

Journal of Alexandria University for Administrative Sciences© – Volume 57 – No. 4– September 2020
37
2. THE RESEARCH AIM
The research mainly aims examining the PM tools with respect to the
awareness, acceptance of learning and use, user selected tools, and usage
degree in private HE in Egypt. Identify the relationships between these
issues is beneficial for different stakeholders. The stakeholders include
but not limited to projects team leaders, supervisors, project managers,
sponsors and software developers whose aim an accurate determination
the end-user requirements' during as an initial phase of software
development procedures. Reaching expectations of the customer is the
objective that triggered projects Sommerville (2011).
3. THE RESEARCH IMPORTANCE
Gaining all advantages of PM tools, software is not yet attained. Making
an allowance for the potential advantages of adopting PM software, and
tools is partially considered. Thus addressing these concerns is justified
due to the attended opportunity for applying the best practices, the
positive impact on the project deliverables and outcomes, the end-user
support that may possibly occurred. Providing a better understanding of
end-user motives and assessing the current awareness, acceptance of
learning and use, user selected tools, usage degree are mandatory
activities to be accomplished before planning for any enhancement
proceed.
4. LITERATURE REVIEW
4.1 User Acceptance and Use of Technology Factors
Early researches paid attention to the individual perspective when
studied user acceptance of computer technology and its factors such as
Davis et al. (1989). This research concentrated on user acceptance of
computer technology and suggested computer usage' individual attitude
drives: perceived usefulness, and perceived ease of use.
The UTAUT by Venkatesh et al. (2003) defined the elements that affect
information system behavioral while dependent variables were
behavioral intention and usage. The social influence and expectancies in
regards to performance, and effort were informed as affecting elements.
Additionally, the age, gender, voluntariness, and experiences were stated

Project Management (PM) Tools: Awareness, ……. Dr. Hend Abd El Halim
38
but as moderators factors. UTAUT model was functionally applied and
revised by (Howard et al. 2017) they ended their research by a revised
UTAUT model after they examined the technology acceptance and usage
from the individual perspective.
User adoption intention, tools selection, and acceptance of technology
issues have been studied in 2018 by (Rahi et al. 2018a); (Karahoca et al.
2018) and (Rahi et al. 2018b). In Nakayama & Chen (2016) the PM tools
influence on project estimates and benefits was investigated, PM
framework for improving productivity performance was presented by
(Liao et al. 2017) These studies examined the early mentioned issues
based on sector/ industry, tool, and user group. This point out to the
insufficient studies concentred on end-user aspects such as sector, usage
pattern, and any other related element as well.
In the project management context, Liberatore & Pollack-Johnson (2003)
stated the essentially of PM methods and techniques (i.e. Critical Path
Method (CPM), and Program or Project Evaluation and Review
Technique - PERT for risk analysis.) for enhancing project planning and
control. Additionally, the associations between the environmental and
intermediate elements have been investigated. Among the
environmental: years of experience in PM as a team member or leader,
and the number of projects worked on during the last year, meanwhile,
software use category (project planning only versus planning and
control), the initial year of software usage were instances of intermediate
factors- PM software usage (Liberatore & Pollack-Johnson, 2003). The
research compared PM software usage for planning to usage for both
planning and control. Moreover, PM software use degree and the level of
PM software package have been studied.
In an early publication, PM tools, Project culture, and leadership were
recognized as a subset of defined critical factors that lead to project
success as reported by Milosevic & Patanaku (2005).
In one of the most recent publications, Aguilera (2020) discussed people
readiness. The author reported the human element as a key for project
success where the clearness of roles and responsibilities is mandatory

Journal of Alexandria University for Administrative Sciences© – Volume 57 – No. 4– September 2020
39
before the project starts. A transition and activation planning project
guiding principles instances were also offered Aguilera (2020).
Errida & Lotfi (2020) concluded communication, empowerment and
coaching, training, executive engagement, development of project
management culture, and building capacity of change tasks as assistant
activities in change readiness for applying a Project Management
Methodology (PMM).
4.2 PM Tools Usage Degree
The online and offline PM tools have a role on maintain project
achievements and managing project time, cost, and quality as well D & Jr
(2017) . This study concluded the PM tools that widely adopted and other
tools support online and productivity. PM tools were considered in
earlier studies, Broder & Pihir (2007) clarified the computers adoption/
usages shapes were categorized based on their role in the project, its
significance, and the main causes of failure, and how to use software tools
to escape. Additionally, a country based study in Croatia by (Pihir et al.
2008) was investigated PM education and how project success is
impacted by Information Communication Technology- ICT. Due to the
study results on the impact of PM education in amplifying project
achievements, and reported advantages, the study suggested more
investment on PM education. Adopting PM tools should be encouraged
by project executives, and project managers D& Jr (2017).
In Sokołowska-Woźniak (2020), Work Breakdown Structures (WBS),
PERT Charts, Run Sheets and Gantt Charts were categorized as subset of
planning tools and systems used in event monitoring.
The casual PM end-user in Private HE in Egypt was considered in a study
by Abd El Halim (2019). The interactions between tools selection,
adoption intention, and acceptance of computer technology factors were
identified, the study ended by developing a model illustrated the study
recognized relationships.
As prior lines highlighted the importance of investigating and assessing
the current end-user awareness, selected tools, usage degree, learning
and adoption acceptance of the PM end-users, supported by the reported

Project Management (PM) Tools: Awareness, ……. Dr. Hend Abd El Halim
40
believes on PM importance, and benefits. As a vital practice proceeding
to any strategy developed aims to preserve the current end-users
interests' and encourage potential users in being aware, make use, adopt
PM tools, and software as well.
5. RESEARCH PROBLEM
Applying the best practices and maximizing PM methodology adoption
benefits is not an easy mission, it has some barriers and required better
understating of user/ learner motives, intentions, and the associations
between them. The private HE is a rich sector with unique cases to be
studied. Although the existence of some studies concerning PM tools,
awareness, acceptance of learning and use, user tools selection, and
usage pattern aspects, a very limited number have focused on Private HE
in Egypt. The inadequacy of researches studying the above-mentioned
aspects justifies having more researches to fill this identified gap.
6. RESEARCH INVESTIGATED FACTORS, AND HYPOTHESES
The research framework included the investigated factor and
hypotheses were developed based on the conducted review of the
previous related works. Figure 1 illustrates research framework and
hypotheses. This resulted in four factors were concerned and three
hypotheses were subject of tests. The constructed hypotheses are as
following:
H1: There is no significant difference between the acceptance of learning
and use and user selected tools
H2: There is no significant difference between the acceptance of learning
and use and usage degree
H3: There is no significant difference between the acceptance of learning
and use and awareness
H4: There is no significant difference between user selected tools and
usage degree
H5: There is no significant difference between user selected tools and
awareness

Journal of Alexandria University for Administrative Sciences© – Volume 57 – No. 4– September 2020
41
H6: There is no significant difference between awareness and usage
degree
Figure 1: Research Framework and Hypotheses
7. RESEARCH METHODOLOGY
7.1 Population Description and Sample Size
CMT was considered as the sample of the research for many reasons. On
one hand, CMT was established from over 25 years ago; it has a well-
developed technological infrastructure, available laboratories, and
learning facilities, and attended technical support that provides a steady
and stable learning environment to students. On the other hand, the
assurance of research conduction and investigating the relationships
between research variables in the absence of learning environment
factors impact on research outcomes.
In this research the population size reached 687 (Business
Administration BA students and staff members who were involved in
project(s) whether as team leader, supervisor and/or project manager in
their departments).The participants were belonged to three
departments: Business Information Systems, Accounting and Finance,
and Marketing and International Business. The students were the
majored students (last stage/ level four) to ensure their involvement at
Project Management (PM) Tools: Awareness, ……. Dr. Hend Abd El Halim
42
least in project if not more. These three departments were chosen due
to the existence of courses with projects in their study plans.
The sample size was 113 students and staff members in total. This
sample is distributed randomly to the (last stage/ level four) students
and staff members of the three selected departments: the sample size
was determined with 95% for the confidence level, and with ±8.43 for
the confidence interval Sekaran (2003). The gathered responses were 86
(76.1%) students and 27 (23.9%) staff members.
7.2 Data Gathering Method
The number of circulated questionnaires to the target participants has
been exceeded 150. In the first round 79 questionnaires have been
collected. The second round ended by receiving 40 more questionnaires.
All returned questionnaires were scanned for validity where 6
questionnaires were excluded due to invalidity. By the end, 113 returned
questionnaires were valid.
7.3 Questionnaire Design
The questionnaire was constructed taken into consideration the
required completing time, easiness. According to the defined factors, the
research participants requested to offer their views toward the
statements and questions corresponded to the investigated factors. Both
participants groups (students and staff members) have the same
questionnaire sections but the staff members group has two more
questions about their experience, age. The first section - statements
cover the duration of their last involved project in months, their
familiarity with a number of PM tools. For the same number of PM tools
their selection to use or previously used based on their preferences, their
usage degree ranged from rarely to always. The second section-
questions to identify their previously used PM software if any i.e.
Microsoft Project Standard, their agreement/ acceptance to learn PM
tools and to use, the contribution of Information Technologies and
software in project success, difference between sectors regarding the
gaining PM adoption benefits, current/ latest project belonged sector,
current/ latest project educational level. In addition to state their
experiences, age, these were only requested from staff members –

Journal of Alexandria University for Administrative Sciences© – Volume 57 – No. 4– September 2020
43
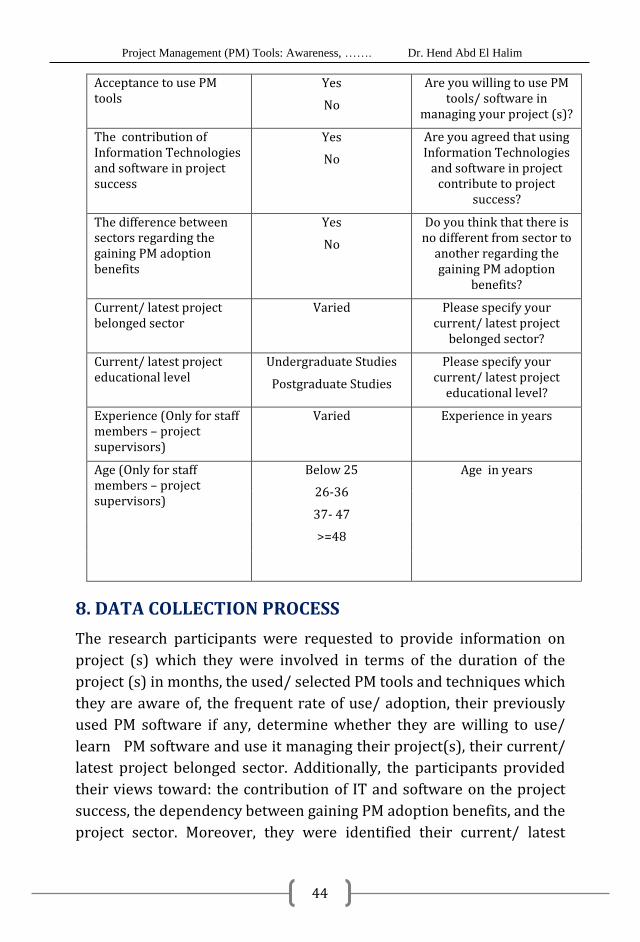
project supervisors group to answer. Table 1 below provides a summary
of the designed questionnaire: research variables, responses
alternatives, and statements/ questions corresponding to each variable.
Table 1: Research questionnaire design: variables, responses alternatives, and
statements /questions
Research Variable Responses Alternatives Statements / Questions
Project Length Varied Durations Project duration in months
Awareness
For Awareness
Aware
Not Aware
PM
To
ols
Gantt chart
Cause and effect chart
Critical Path Method (CPM)
Tools Selection
For Tool s Selection
Selected √
Not Selected ×
Develop a Risk Management Plan
Earned Value
Generate Project Budget
Usage Degree
For Usage Degree
Not ever
Rarely
Occasionally/ irregularly
Regularly
Always
Participatory Impact Pathways Analysis
Perform Post-Project Review
PERT chart
PRINCE2 (Projects IN Controlled Environments)
Schedule Resources and Perform Resource
Levelling
Track and Manage Performance of the Project
Work Breakdown Structure (WBS)
Previously used PM software
Varied Please specify your previously used any
common PM software i.e. Microsoft Project
Standard?
Acceptance to learn Yes
No
Are you willing to learn PM tools/ software?
Project Management (PM) Tools: Awareness, ……. Dr. Hend Abd El Halim
44
8. DATA COLLECTION PROCESS
The research participants were requested to provide information on
project (s) which they were involved in terms of the duration of the
project (s) in months, the used/ selected PM tools and techniques which
they are aware of, the frequent rate of use/ adoption, their previously
used PM software if any, determine whether they are willing to use/
learn PM software and use it managing their project(s), their current/
latest project belonged sector. Additionally, the participants provided
their views toward: the contribution of IT and software on the project
success, the dependency between gaining PM adoption benefits, and the
project sector. Moreover, they were identified their current/ latest
Acceptance to use PM tools
Yes
No
Are you willing to use PM tools/ software in
managing your project (s)?
The contribution of Information Technologies and software in project success
Yes
No
Are you agreed that using Information Technologies
and software in project contribute to project
success?
The difference between sectors regarding the gaining PM adoption benefits
Yes
No
Do you think that there is no different from sector to
another regarding the gaining PM adoption
benefits?
Current/ latest project belonged sector
Varied Please specify your current/ latest project
belonged sector?
Current/ latest project educational level
Undergraduate Studies
Postgraduate Studies
Please specify your current/ latest project
educational level?
Experience (Only for staff members – project supervisors)
Varied Experience in years
Age (Only for staff members – project supervisors)
Below 25
26-36
37- 47
>=48
Age in years

Journal of Alexandria University for Administrative Sciences© – Volume 57 – No. 4– September 2020
45
project educational level, staff members, and project supervisors were
requested to state their experiences in years, and their age.
A questionnaire was designed for use to gather the required data from
the research target participants. The analytical tool SPSS was employed
in analyzing the gathered data, taking into consideration group
differences. The investigated group differences and adoption degrees
were revealed through the research results and outcomes; where
anticipated beneficiaries of the research outcomes and conclusions are
PM specialists, team leaders, project supervisors, and managers.
9. STATISTICAL ANALYSIS RESULTS
9.1 Reliability Test
Reliability test is in employment to investigate the consistency of the
instrument (Sekaran,2003). In this research the value of Cronbach's
Alpha registered .831 on the scale of all variables (N= 36 variables) in the
designed questionnaire
9.2 Pearson-product-moment Test
Conducting the Pearson-product-moment test enabled more accurate
results on strength or a correlation between two sets of data (Lane,
2013). It conducted between each questionnaire sub-sections questions
and its corresponding total, then between all questionnaire questions
and the overall total. The results showed positive highly significant
correlations for all questionnaire questions and the overall total for most
of the cases (33 out of 36 questions), and positive significant correlation
for only three questions.
9.3 Descriptive Analysis
Table 2 demonstrates the research sample description using percent
according to participants’ answers according to project Length in
months, current/ latest project belonged sector, current/ latest project
educational level, and experience in years, and age (Only for staff
members – project supervisors)

Project Management (PM) Tools: Awareness, ……. Dr. Hend Abd El Halim
46
Table 2: Sample General Descriptive Using Percent
Variable Responses %
Project Length in Months
Less than 12 Months 40.7%
Other Lengths 59.3%
Current/ latest project belonged sector
IT and BIS 31%
Marketing 10.6%
Finance and Accounting 18.6%
Mass Media 3.5%
Hotel and Tourism 2.7%
Construction 8.8%
Oil and Gas 5.3%
Economic and Financial Analysis 2.7%
Education and Research 4.4%
Agriculture 12.4%
Please specify your previously used any
common PM software i.e. Microsoft Project
Standard?
Microsoft Project
Other
91.2%
8.8%
Are you willing to learn PM tools/ software? Yes
No
89%
11%
Are you willing to use PM tools/ software in
managing your project (s)?
Yes
No
79%
21%
Are you agreed that using Information
Technologies and software in project
contribute to project success?
Yes
No
87%
13%
Do you think that there is no different from
sector to another regarding the gaining PM
adoption benefits?
Yes
No
88%
12%
Current/ latest project educational level Undergraduate Studies 76.1%
Post Graduate Studies 23.9%
Experience (Only for staff members– project
supervisors)
1-5 years 27.4%
6-10 years 7.1%
11-15 years 19.1%
16-20 years 42.8%
>20 years 3.6%
Age (Only for staff members – project
supervisors)
<=25 40.7%
26-36 23.0%
37-47 19.5%
>47 16.8%
Journal of Alexandria University for Administrative Sciences© – Volume 57 – No. 4– September 2020
47
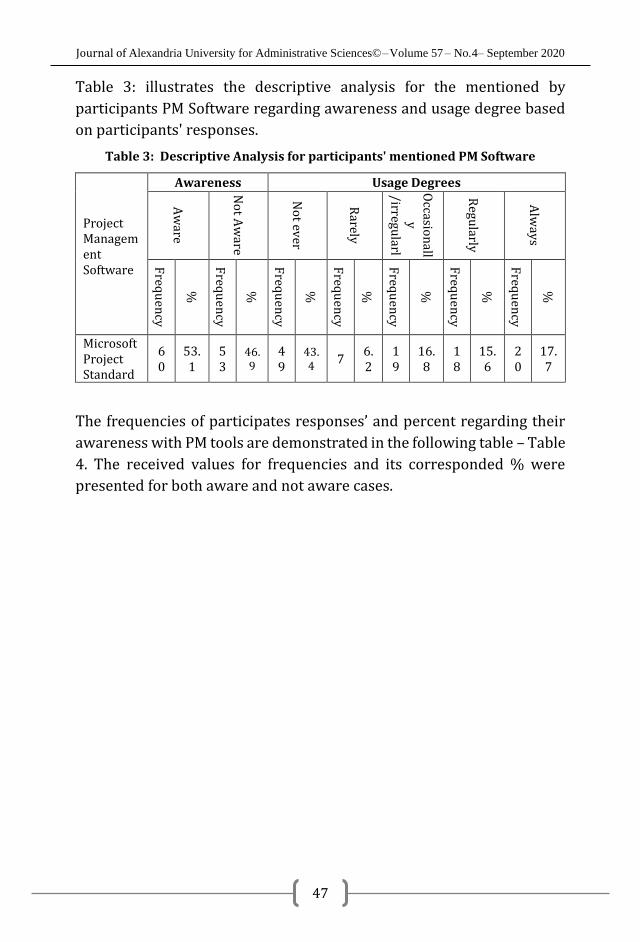
Table 3: illustrates the descriptive analysis for the mentioned by
participants PM Software regarding awareness and usage degree based
on participants' responses.
Table 3: Descriptive Analysis for participants' mentioned PM Software
Project Management Software
Awareness Usage Degrees
Aw
are
No
t Aw
are
No
t ever
Rarely
Occasio
nall
y
/irregularl
y
Regu
larly
Alw
ays
Freq
uen
cy
%
Freq
uen
cy
%
Freq
uen
cy
%
Freq
uen
cy
%
Freq
uen
cy
%
Freq
uen
cy
%
Freq
uen
cy
%
Microsoft Project Standard
60
53.1
53
46.9
49
43.4 7
6.2
19
16.8
18
15.6
20
17.7
The frequencies of participates responses’ and percent regarding their
awareness with PM tools are demonstrated in the following table – Table
4. The received values for frequencies and its corresponded % were
presented for both aware and not aware cases.

Project Management (PM) Tools: Awareness, ……. Dr. Hend Abd El Halim
48
Table 4: PM Tools Participates’ Awareness Descriptive Statistics Rated by
Frequencies and Percent
PM tools usage degrees of tools described by frequencies and percent,
the observed usage rang from not ever used to always as Tale 5 presents.
Tool Aware
Tool Not Aware
Frequency
% Frequenc
y %
Track and Manage Performance of the Project
64 56.6
%
PRINCE2 93
82.3%
Critical Path Method
62 54.9
% Participatory Impact
Pathways Analysis 91
80.5%
Perform Post-Project Review
55 48.7
%
Earned Value 84 74.3
%
Gantt chart 55 48.7
%
Schedule Resources and Perform Resource Levelling
81 71.7
%
Cause and effect chart
47 41.6
% Work Breakdown
Structure 76
67.3%
PERT chart 46 40.7
% Generate the Project
Budget 74
65.5%
Develop a Risk Management Plan
41 36.3
% Develop a Risk
Management Plan 72
63.7%
Generate the Project Budget
39 34.5
%
PERT chart 67 59.3
% Work Breakdown Structure
37 32.7
% Cause and effect
chart 66
58.4%
Schedule Resources and Perform Resource Levelling
32 28.3
%
Gantt chart 58
51.3%
Earned Value 29 25.7
% Perform Post-Project
Review 57
50.4%
Participatory Impact Pathways Analysis
22 19.5
%
Critical Path Method 51
45.1%
PRINCE2 20 17.7
%
Track and Manage Performance of the Project
49 43.4
%

Journal of Alexandria University for Administrative Sciences© – Volume 57 – No. 4– September 2020
49
Table 5: PM Tools Usage Degrees Descriptive Statistics Rated By Frequencies
and Percent
9.4 Hypotheses Testing
9.4.1 Correlations Tests
The correlation and chi-square were employed for testing associations'
presence between research variables and contributing answers for the
proposed questions. The results of the conducted examinations were
Usage Degrees (Frequency and %)
Not ever Rarely Occasionall
y/ irregularly
Regularly
Always
Freq
uen
cy
%
Freq
uen
cy
%
Freq
uen
cy
%
Freq
uen
cy
%
Freq
uen
cy
%
Critical Path Method 37
33% 38 34%
22 19% 9 8% 7 5%
Gantt chart 42
37% 30 27%
29 26% 9 8% 3 2%
PERT chart 39
35% 35 31%
20 18% 11 10%
8 6%
Cause and effect chart
47
42% 33 29%
21 19% 8 7% 4 3%
Generate the Project Budget
45
40% 40 35%
10 9% 10 9% 8 6%
Develop a Risk Management Plan
43
38% 43 38%
8 7% 13 12%
6 5%
Track and Manage Performance of the Project
57
50% 12 11%
18 16% 16 14%
10 8%
Work Breakdown Structure
44
39% 31 27%
19 17% 14 12%
5 4%
Perform Post-Project Review
58
51% 15 13%
18 16% 13 12%
9 7%
Schedule Resources and Perform Resource Levelling
49
43% 38 34%
11 10% 8 7% 7 5%
Earned Value 52
46% 40 35%
4 4% 10 9% 7 5%
Participatory Impact Pathways Analysis
61
54% 36 32%
8 7% 4 4% 4 3%
PRINCE2 73
65% 26 23%
12 11% - 0% 2 2%

Project Management (PM) Tools: Awareness, ……. Dr. Hend Abd El Halim
50
offered through the current section. Correlation tests results for the
research hypotheses are demonstrated in Table 6, while summary of the
same is displayed in Table 7.
Table 6: Corrections Tests Outcomes
Use
r Se
lecte
d
To
ols
Usa
ge
De
gre
e
Aw
are
ne
ss
Acce
pta
nce
of
lea
rnin
g a
nd
use
User Selected Tools
Pearson Correlation 1 -.459** 1.000** -.097
Sig. (2-tailed) .000 .000 .306
N 113 113 113 113
Usage Degree Pearson Correlation -.459** 1 -.459** .525**
Sig. (2-tailed) .000 .000 .000
Awareness Pearson Correlation 1.000** -.459** 1 -.097
Sig. (2-tailed) .000 .000 .306
Acceptance of learning and
use
Pearson Correlation -.097 .525** -.097 1
Sig. (2-tailed) .306 .000 .306
**. Correlation is significant at the 0.01 level (2-tailed).

Journal of Alexandria University for Administrative Sciences© – Volume 57 – No. 4– September 2020
51
Table 7: Summary of Correlation Results For Research Hypotheses
Hypothesis Factors N of
Valid Cases
Pearson Correlation
Value
Sig. (2-tailed)
Result
H1 Acceptance of learning and
use *User Selected Tools 113 -.097 .306
Not
Significant
H2 Acceptance of learning and
use * Usage Degree 113 .525** .000
Highly
Significant
H3 Acceptance of learning and
use * Awareness 113 -.097 .306
Not
Significant
H4 User Selected Tools*
Usage Degree 113 -.459** . 000
Highly
Significant
H5 User Selected Tools*
Awareness 113 1.000** .000
Highly
Significant
H6 Awareness * Usage Degree 113 -.459** .000 Highly
Significant
* Significant at the 0.05 level (2-tailed)
** Significant at the 0.01 level (2-tailed)
Table 8 displays corrections test values for PM tools awareness.
Meanwhile, Table 9 summaries existed relationships existence based on
corrections test outcomes for project duration, PM tools awareness
categorized according to the relationship strength degree into high
significant correlation, and significant correlation. The correlations
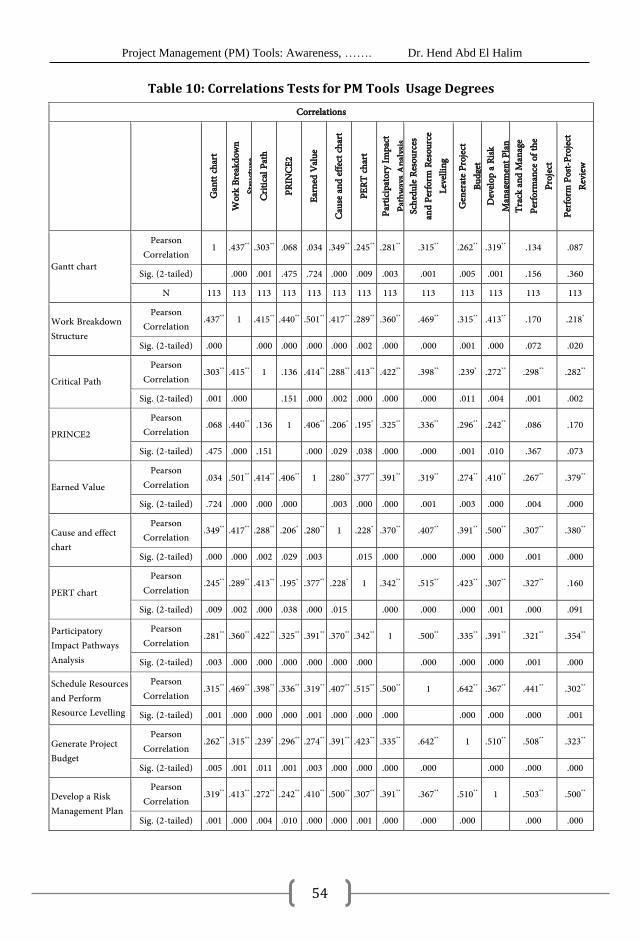
results for PM tools usage degrees were illustrated in Table 10.

Project Management (PM) Tools: Awareness, ……. Dr. Hend Abd El Halim
52
Table 8: Correlations – PM Tools Awareness
Gan
tt ch
art
Wor
k Br
eakd
own
Stru
ctur
e C
ritic
al Pa
th
Met
hod
PRIN
CE2
Earn
ed V
alue
Caus
e and
effe
ct
char
t
PERT
cha
rt
Parti
cipat
ory
Impa
ct P
athw
ays
Ana
lysis
Sc
hedu
le Re
sour
ces
and
Perfo
rm
Reso
urce
Lev
ellin
g
Gen
erat
e Pr
ojec
t Bu
dget
D
evelo
p a
Risk
M
anag
emen
t Plan
Trac
k an
d M
anag
e Pe
rform
ance
of t
he
Proj
ect
Perfo
rm P
ost-
Proj
ect R
eview
Gantt chart Pearson Correlation 1 .423** .220 .197 .165 .104 .305* .208 .256* .392** .176 .300* .078
Work Breakdown Structure
Pearson Correlation .423** 1 .221 .201 .505** .235 .235 .150 .597** .235 .235 .076 .273*
Critical Path Method
Pearson Correlation .220 .221 1 .165 .283* .096 .449** .222 .298* .333** .412** .552** .408**
PRINCE2 Pearson Correlation .197 .201 .165 1 .156 .073 .011 .168 .145 .290* .181 .191 .232
Earned Value Pearson Correlation .165 .505** .283* .156 1 .452** .231 .124 .645** .387** .323** .285* .202
Cause and effect chart
Pearson Correlation .104 .235 .096 .073 .452** 1 .216 .112 .479** .357** .164 .071 .277*
PERT chart Pearson Correlation .305* .235 .449** .011 .231 .216 1 -.005 .387** .015 .350** .392** .165
Participatory Impact
Pathways Analysis
Pearson Correlation .208 .150 .222 .168 .124 .112 -.005 1 .176 .256* .184 .274* .351**
Schedule Resources and
Perform Resource Levelling
Pearson Correlation .256* .597** .298* .145 .645** .479** .387** .176 1 .414** .350** .185 .235
Generate Project Budget
Pearson Correlation .392** .235 .333** .290* .387** .357** .015 .256* .414** 1 .357** .392** .405**
Develop a Risk Management
Plan
Pearson Correlation .176 .235 .412** .181 .323** .164 .350** .184 .350** .357** 1 .456** .533**
Track and Manage
Performance of the Project
Pearson Correlation .300* .076 .552** .191 .285* .071 .392** .274* .185 .392** .456** 1 .434**
Perform Post-Project Review
Pearson Correlation .078 .273* .408** .232 .202 .277* .165 .351** .235 .405** .533** .434** 1
**. Correlation is significant at the 0.01 level (2-tailed). *. Correlation is significant at the 0.05 level (2-tailed).

Journal of Alexandria University for Administrative Sciences© – Volume 57 – No. 4– September 2020
53
Table 9: Summary Relationships Existence Based on Corrections Tests Outcomes for
PM Tools High Significant Correlation Significant Correlation
1 Critical Path Method
Project duration, PERT chart, Generate Project Budget, Develop a Risk Management Plan, Track and Manage Performance of the Project, Perform Post-Project Review, and Microsoft Project Standard
Earned Value and Schedule Resources and Perform Resource Levelling
2 Gantt chart Work Breakdown Structure, Generate Project Budget, and MS Project Standard
PERT chart, Schedule Resources and Perform Resource Levelling, and Track and Manage Performance of the Project
3 PERT chart
Critical Path Method, Schedule Resources and Perform Resource Levelling, Develop a Risk Management Plan, Track and Manage Performance of the Project, and Microsoft Project Standard
project duration, Gantt charts Participatory Impact Pathways Analysis has positive high correlation with Perform Post-Project Review
4 Cause and effect chart Earned Value, Schedule Resources and Perform Resource Levelling, and Generate the Project Budget
Perform Post-Project Review
5 Generate the Project Budget
Gantt chart, Critical Path Method, Earned Value, Cause and effect chart, Schedule Resources and Perform Resource Levelling, Develop a Risk Management Plan, Track and Manage Performance of the Project, and Perform Post-Project Review
PRINCE2, and Participatory Impact Pathways Analysis
6 Develop a Risk Management Plan
Critical Path Method, Earned Value, PERT chart, Schedule Resources and Perform Resource Levelling, Generate the Project Budget, Track and Manage Performance of the Project, and Perform Post-Project Review
-
7 Track and Manage Performance of the Project
Critical Path Method, PERT chart, Generate the Project Budget, Develop a Risk Management Plan, Perform Post-Project Review, and Microsoft Project Standard
Gantt chart, Earned Value, and Participatory Impact Pathways Analysis
8 Work Breakdown Structure
Gantt chart, Generate Project Budget, and Schedule Resources and Perform Resource Levelling
Perform Post-Project Review, and MS Project Standard
9 Perform Post-Project Review
Critical Path Method, Participatory Impact Pathways Analysis, Generate the Project Budget, Develop a Risk Management Plan, and Track and Manage Performance of the Project
Work Breakdown Structure, Cause and effect chart, Generate the Project Budget, and Microsoft Project Standard
10 Schedule Resources and Perform Resource Levelling
Work Breakdown Structure, Earned Value, Cause and effect chart, PERT chart, Generate Project Budget, and Develop a Risk Management Plan
Critical Path Method, and Microsoft Project Standard
11 Earned Value Work Breakdown Structure, Cause and effect chart, Schedule Resources and Perform Resource Levelling, Generate the Project Budget, Develop a Risk Management Plan
Critical Path Method, and Track and Manage Performance of the Project
12 Participatory Impact Pathways Analysis
Perform Post-Project Review
Generate the Project Budget, Track and Manage Performance of the Project
13 PRINCE2 - Generate Project Budget
Project Management (PM) Tools: Awareness, ……. Dr. Hend Abd El Halim
54
Table 10: Correlations Tests for PM Tools Usage Degrees
Correlations
Gan
tt ch
art
Wor
k Br
eakd
own
Stru
ctur
e Cr
itica
l Pat
h
PRIN
CE2
Earn
ed V
alue
Caus
e and
effe
ct ch
art
PERT
char
t
Parti
cipa
tory
Impa
ct
Path
ways
Ana
lysis
Sc
hedu
le Re
sour
ces
and
Perfo
rm R
esou
rce
Leve
lling
Gen
erat
e Pro
ject
Bu
dget
D
evelo
p a
Risk
M
anag
emen
t Pla
n Tr
ack
and
Man
age
Perfo
rman
ce o
f the
Pr
ojec
t
Perfo
rm P
ost-P
rojec
t Re
view
Gantt chart
Pearson Correlation
1 .437** .303** .068 .034 .349** .245** .281** .315** .262** .319** .134 .087
Sig. (2-tailed) .000 .001 .475 .724 .000 .009 .003 .001 .005 .001 .156 .360
N 113 113 113 113 113 113 113 113 113 113 113 113 113
Work Breakdown Structure
Pearson Correlation
.437** 1 .415** .440** .501** .417** .289** .360** .469** .315** .413** .170 .218*
Sig. (2-tailed) .000 .000 .000 .000 .000 .002 .000 .000 .001 .000 .072 .020
Critical Path
Pearson Correlation
.303** .415** 1 .136 .414** .288** .413** .422** .398** .239* .272** .298** .282**
Sig. (2-tailed) .001 .000 .151 .000 .002 .000 .000 .000 .011 .004 .001 .002
PRINCE2
Pearson Correlation
.068 .440** .136 1 .406** .206* .195* .325** .336** .296** .242** .086 .170
Sig. (2-tailed) .475 .000 .151 .000 .029 .038 .000 .000 .001 .010 .367 .073
Earned Value
Pearson Correlation
.034 .501** .414** .406** 1 .280** .377** .391** .319** .274** .410** .267** .379**
Sig. (2-tailed) .724 .000 .000 .000 .003 .000 .000 .001 .003 .000 .004 .000
Cause and effect chart
Pearson Correlation
.349** .417** .288** .206* .280** 1 .228* .370** .407** .391** .500** .307** .380**
Sig. (2-tailed) .000 .000 .002 .029 .003 .015 .000 .000 .000 .000 .001 .000
PERT chart
Pearson Correlation
.245** .289** .413** .195* .377** .228* 1 .342** .515** .423** .307** .327** .160
Sig. (2-tailed) .009 .002 .000 .038 .000 .015 .000 .000 .000 .001 .000 .091
Participatory Impact Pathways Analysis
Pearson Correlation
.281** .360** .422** .325** .391** .370** .342** 1 .500** .335** .391** .321** .354**
Sig. (2-tailed) .003 .000 .000 .000 .000 .000 .000 .000 .000 .000 .001 .000
Schedule Resources and Perform Resource Levelling
Pearson Correlation
.315** .469** .398** .336** .319** .407** .515** .500** 1 .642** .367** .441** .302**
Sig. (2-tailed) .001 .000 .000 .000 .001 .000 .000 .000 .000 .000 .000 .001
Generate Project Budget
Pearson Correlation
.262** .315** .239* .296** .274** .391** .423** .335** .642** 1 .510** .508** .323**
Sig. (2-tailed) .005 .001 .011 .001 .003 .000 .000 .000 .000 .000 .000 .000
Develop a Risk Management Plan
Pearson Correlation
.319** .413** .272** .242** .410** .500** .307** .391** .367** .510** 1 .503** .500**
Sig. (2-tailed) .001 .000 .004 .010 .000 .000 .001 .000 .000 .000 .000 .000

Journal of Alexandria University for Administrative Sciences© – Volume 57 – No. 4– September 2020
55
Track and Manage Performance of the Project
Pearson Correlation
.134 .170 .298** .086 .267** .307** .327** .321** .441** .508** .503** 1 .613**
Sig. (2-tailed) .156 .072 .001 .367 .004 .001 .000 .001 .000 .000 .000 .000
Perform Post-Project Review
Pearson Correlation
.087 .218* .282** .170 .379** .380** .160 .354** .302** .323** .500** .613** 1
Sig. (2-tailed) .360 .020 .002 .073 .000 .000 .091 .000 .001 .000 .000 .000
**. Correlation is significant at the 0.01 level (2-tailed). *. Correlation is significant at the 0.05 level (2-tailed).
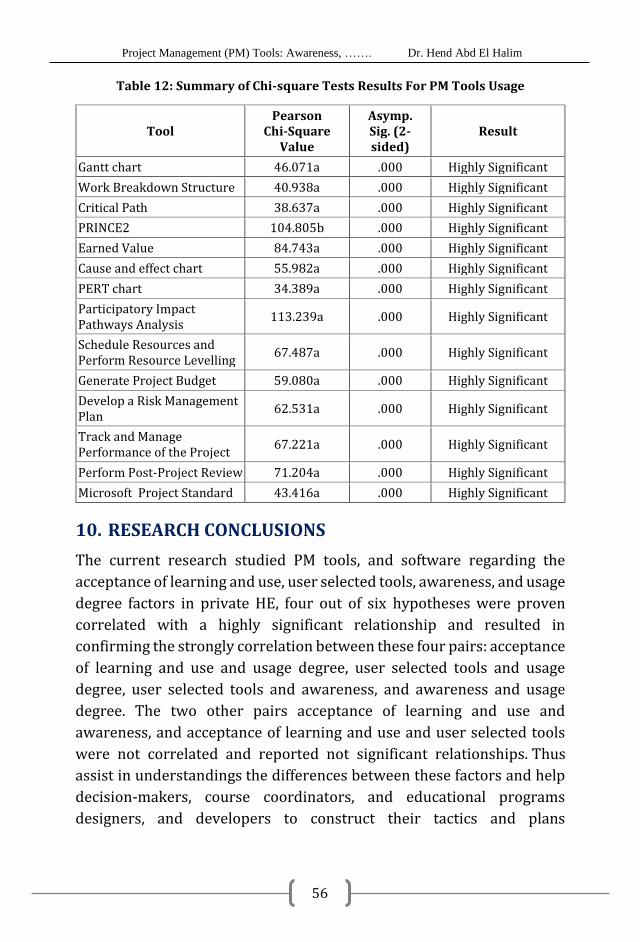
9.4.2 Chi-square Tests
Table 11 demonstrates the chi-square tests results for the PM tools and
MS project standard software. According to the results all PM tools usage
shave highly significant relationships to each other. A summary of chi-
square tests results for PM tools usage is provided by Table 12 below.
Table 11: Chi-square Tests Results For PM Tools Usage and Microsoft Project
Standard
Project Management (PM) Tools: Awareness, ……. Dr. Hend Abd El Halim
56
Table 12: Summary of Chi-square Tests Results For PM Tools Usage
Tool Pearson
Chi-Square Value
Asymp. Sig. (2-sided)
Result
Gantt chart 46.071a .000 Highly Significant
Work Breakdown Structure 40.938a .000 Highly Significant
Critical Path 38.637a .000 Highly Significant
PRINCE2 104.805b .000 Highly Significant
Earned Value 84.743a .000 Highly Significant
Cause and effect chart 55.982a .000 Highly Significant
PERT chart 34.389a .000 Highly Significant
Participatory Impact Pathways Analysis
113.239a .000 Highly Significant
Schedule Resources and Perform Resource Levelling
67.487a .000 Highly Significant
Generate Project Budget 59.080a .000 Highly Significant
Develop a Risk Management Plan
62.531a .000 Highly Significant
Track and Manage Performance of the Project
67.221a .000 Highly Significant
Perform Post-Project Review 71.204a .000 Highly Significant
Microsoft Project Standard 43.416a .000 Highly Significant
10. RESEARCH CONCLUSIONS
The current research studied PM tools, and software regarding the
acceptance of learning and use, user selected tools, awareness, and usage
degree factors in private HE, four out of six hypotheses were proven
correlated with a highly significant relationship and resulted in
confirming the strongly correlation between these four pairs: acceptance
of learning and use and usage degree, user selected tools and usage
degree, user selected tools and awareness, and awareness and usage
degree. The two other pairs acceptance of learning and use and
awareness, and acceptance of learning and use and user selected tools
were not correlated and reported not significant relationships. Thus
assist in understandings the differences between these factors and help
decision-makers, course coordinators, and educational programs
designers, and developers to construct their tactics and plans
Journal of Alexandria University for Administrative Sciences© – Volume 57 – No. 4– September 2020
57
considering the reported relationships. Davis et al. (1989) stated factors
impacted the person’s attitude toward computer were (perceived
usefulness, and perceived ease of use). The usefulness were confirmed
by participant responses' when most of them showed their agreement
on that using Information Technologies and software in project
contribute to project success. The participant showed awareness and
tools usage level reflect their beliefs on the same, this aligned with what
was indicated by Liberatore & Pollack-Johnson (2003) as PM methods
and techniques essentially i.e. Critical Path Method (CPM), and Program
or Project Evaluation and Review Technique - PERT for risk analysis of).
In conclusion, although the usefulness of the researches currently
available, the research results and verified hypotheses early provided
recommend conducting additional studies with different focuses and
answers for new questions in this context. Acceptance of technology
factors, tools selection, and usage drives and levels are still research
interests and questionable areas.
Learner is the focal point in the learning process; where any proposal for
enhancements should pay attention to individuals' differences,
awareness, motives, reasons and readiness to learn because these have
decided their tools selection, and usage patterns/ adoption level. Having
concentration on investigating the above is an initial process to get the
end-user ready and encourages to be involved in learning process. This
research focused on these end-user issues', due to the great influence of
them on the acceptance level and acceptance of end-user to learn, use,
benefit of adopting software and achieve their project targeted level of
success.
HE is a highly nominated sector to maximize the returns of PM
methodology adoption in their developed educational program plans.
The PM tools observed awareness and the frequent rate of use are
promising considering the variances between program plans in the count
of courses with a project requirement.
Having an accepted level of user approval on both learning and use is an
initial point, it triggers, and supports a smooth learning process; this may
result in attaining the targeted desired PM tools and software usage

Project Management (PM) Tools: Awareness, ……. Dr. Hend Abd El Halim
58
advantages. Failing to obtain this initial point may perform an obstacle
that negatively impacted the learning process, and might transfer
projects into impaired ones.
11. RESEARCH RECOMMENDATIONS
HE decision-makers, course coordinators, and educational programs
designers, and developers are strongly encouraged and recommended
to:
− Considering individuals' factors and their belonged group impacts
while learning and adoption practices are applied
− Developing the development strategies based on a better
understanding of their community members' motives and acceptance
of technology factors.
− Revising their offered degrees, educational programs plans, and
courses curricula on a regular base regarding the inclusion of
technological tools and software.
− Providing on campuses computer-based special-purpose tools and
applications, technical, and practical assistants as well.
− Improving the culture of PM adoption relied on supporting HE
community members whether students or staff members to use in any
project they are involved in regardless of their roles (supervisor,
assistant, ..), degrees (undergraduates/postgraduates), and projects
natures (course project/ graduations projects).
12. RESEARCH LIMITATIONS AND FUTURE WORK
DIRECTIONS
The recognized PM advantages across business and sectors, HE sector
has a noted PM tools awareness and varying usage levels. Although the
acceptance of learning and usage degree observed association between
acceptance of learning and usage degree among community members in
the HE sector, generalization is not appropriated in all cases/ sectors.
Assessing the same in other sectors is required. Additionally, the role of
decision-makers can't be neglected and needed to be measured. Having
multiple PM tools and software handy is good but not warrant achieving

Journal of Alexandria University for Administrative Sciences© – Volume 57 – No. 4– September 2020
59
the targeted success, developing a road map can assist in this. Conducting
more studies concerned the above, and providing answers for related
questions is a subject of future works directions.
REFERENCES
Abd El Halim, H. (2019). Investigating Tools Selection, Adoption
Intention, and Acceptance of Computer Technology in Private
Higher Education in Egypt: Project Management Software Casual
End-User Perspective. Journal of Alexandria University for
Administrative Sciences, 56(1), 1-20. doi:
10.21608/acj.2019.35097 Available at:
https://acjalexu.journals.ekb.eg/article_35097_25ab5c6b90dfb2
466585fb6136b5852e.pdfDate accessed: 09 July. 2020.
Aguilera, L. (2020). People Readiness", Guzman, K. (Ed.) Simplifying the
Complex, Emerald Publishing Limited, 77-91.
https://doi.org/10.1108/ 978-1-83867-969-920201005 Date
accessed: 3 Aug. 2020
Broder, K., & Pihir, I. (2007) Influence of Project Management Software
Tools Usage on Project Success, Information and Intelligent
Systems 2007, At Varaždin, Croatia. Available at:
http://www.academia.edu/26943013/Influence_of_Project_Man
agement_Software_Tools_Usage_on_Project_Success Date
accessed: 11 Jun. 2020
Davis, F.D., Bagozzi, R.P., & Warshaw, P.R., (1989) User acceptance of
computer technology: a comparison of two theoretical models.
Manag. Sci. 35, 982–1003 Date accessed: 11 Jul. 2020
D, Daniel., & Jr, Dasig. (2017) An Evaluative Study on Project
Management Tools for Managing Engineering Projects ,
Ascendens Asia Journal of Multidisciplinary Research Conference
Proceedings AAJMRCP, 1(1).
Errida, A. & Lotfi, B.(2020) Measuring Change Readiness For
Implementing A Project Management Methodology: An Action
Research Study, Academy of Strategic Management Journal;
Arden 19 (1), 1-17.

Project Management (PM) Tools: Awareness, ……. Dr. Hend Abd El Halim
60
Howard, R.; Restrepo, L., & Chang, C. (2017). Addressing individual
perceptions: An application of the unified theory of acceptance
and use of technology to building information modeling,
International Journal of Project Management 35 107–120
Available at: http://www.
sciencedirect.com/science/article/pii/S0263786316302927
Date accessed: 19 July 2020.
Information and Decision Support Center System. (2020a), Statistics and
Indicators, Information and Statistics.
https://www.idsc.gov.eg/IDSC/DMS/View.aspx?id=1833&cid=0
Information and Decision Support Center System. (2020b), Statistics and
Indicators, Information and Statistics.
https://www.idsc.gov.eg/IDSC/DMS/View.aspx?id=2334&c
id=0
Karahoca, A., Karahoca, D., & Aksöz, M. (2018) Examining intention to
adopt to internet of things in healthcare technology products.
Kybernetes. 10.1108/K-02-2017-0045.
Lane, D. M. (2013) Introduction to Statistics: An Interactive eBook.
Values of the Pearson Correlation,
http://onlinestatbook.com/http://onlinestat
book.com/Online_Statistics_Education.pdf Date accessed: 9 Sep.
2020
Liao, L., Teo, E., & Low, S. (2017). A project management framework for
enhanced productivity performance using building information
modelling, Construction Economics and Building, 17 (3), 1-26.
Available at: http://dx.doi.org/10.5130/AJCEB.v17i3.5389
Liberatore, M J., & Pollack-Johnson, B. (2003). Factors Influencing the
Usage and Selection of Project Management Software, Ieee
Transactions on Engineering ManagemenT, 50, (2).
Milosevic, D., & Patanakul, P., (2005). Standardized project management
may increase development projects success,
www.elsevier.com/locate/ ijproman, International Journal of
Project Management 23, 181–192

Journal of Alexandria University for Administrative Sciences© – Volume 57 – No. 4– September 2020
61
Nakayama, M, & Chen, C. (2016). Impact of Project Management Tools on
Project Estimates and Benefits, International Conference on
Internet Studies 22-24.
Pihir, I., Klačmer Čalopa, M., & Broder, K. (2008). Impact of Project
Management Education and ICT Usage on Project
Success, Knowledge for sustainable development : book of
abstracts of the 27th International Conference on Organizational
Science Development/ Rajkovič, Vladislav; Jereb, Eva; Kern,
Tomaž ;Kljajić, Miroljub; Pappe, Bjoern; Pagon, Milan; Vukovič
Goran (ed.) Kranj: Moderna organizacija, 1-7 Available at:
https://www.bib.irb.hr/326454
Rahi, S., Ghani, M., Alnaser, F. & Ngah, A. (2018a). Investigating the role
of unified theory of acceptance and use of technology (UTAUT) in
internet banking adoption context. Management Science Letters.
8. 173-186 Available at:
http://www.m.growingscience.com/msl/Vol8/msl_ 2018_1.pdf
Rahi, S., Ghani, M., & Ngah, A. (2018b). A structural equation model for
evaluating user's intention to adopt internet banking and
intention to recommend technology. Accounting4, 139–152
Available at:http://www.
growingscience.com/ac/Vol4/ac_2018_4.pdf
Sekaran, U., (2003). Research Methods For Business A skill-Building
Approach, Fourth.0-471-20366-1. John Wiley & Sons, Inc.
Sokołowska-Woźniak, j. (2020).The Use of Project Management Tools In
The Organization of Events, Dariusz Woźniak, Scientific Research
Priorities – 2019: theoretical and practical value, Proceedings of
the IV International Scientific and Practical Conference, 26th-30th
of November 2019.
http://repozytorium.wsbnlu.edu.pl/xmlui/bitstream/handle/11
199/10595/Wo%20niak%20Dariusz%20(ed.),%20Scientific%2
0Research%20Priorities%20%20%202019.pdf?sequence=1#pa
ge=48

Project Management (PM) Tools: Awareness, ……. Dr. Hend Abd El Halim
62
Sommerville, I., (2011). Software Engineering 9th International Edition,
Pearson Education, Inc. ISBN-1-782-73133-4
Venkatesh, V.; Morris, M.G.; Davis, G.B., & Davis, F.D., (2003). User
acceptance of information technology: toward a unified view. MIS
Q. 27 (3), 425–478 (September).

Journal of Alexandria University for Administrative Sciences© – Volume 57 – No. 4– September 2020
63
لتعلم وقبول لإلمدت، لإعتبدتر في لأخدا مع روعدتتددددددد لمشددد إد رة أدو ت در سدددد إلى لبحد هدا يهدف ضدددو في و لتكنولوجيت لإد رة بكلي لاسدددتمف ، ودرج لمسدددتمف، يمتترهت لتي و لأدو ت و لاسدددتمف ، لعدتي لتعليم مجتمع أفر د معظم وجود إن. UTAUT لتكنولوجيدت و سدددتمدف ، لقبول لموحدفة لنظريد ختيترهم وأسددبت و لاسددتمف ، للتعلم ودو فعهم إلمتمهم تنوع من بتلرغم لعمري لفئ نفس في تقريبت يسددتهف . لبح ها مثل إجر على يشددجع سددتمف مهت ودرج لمشرددوعتت إد رة وبرمجيتت لأدو ت
( لطلا لمتمصدصدين وأعءدت هيئ لتفريس ) و لمفيرين رفينددددد و لمشد روعتتددددد لمشد فرق قتدة لبح بكلي تعليمي أقسددت، ثلاث إلى لبح في لمشددتركون ينتمي. لمشرددوع إد رة لأدو ت نهتئيين كمسددتمفمين
هو لأقسددت، لهاه لفر سددي لمطط ضددمن لمشرددوعتت تتطلب مقرر ت تو فر و لتكنولوجيت ويعف لإد رة لجتهزي لتعلم وكفت ت و لاهتممتت لنهتئيين لمسددتمفمين لملفيتت تنوع يفعم مم . لإختيتر سددبب
لمجموع ووفقًت. مصددمم سددتبيتن خلال من لمشددتركون رأي سددتطلاع تم. لمشرددوع وقطتع و لاسددتعف د طتلب 86 - مشدتركتً 113 إلى لعين وصدل .مسدتقل بشدكل وتحليلهت لمسد أسدئل بعض تغيير تم لمشدتركين
Correlation and كتي مربع و ختبتر ت و لارتبتط لوصدفي لتحليل إجر وتم عءدو هيئ تفريس 27وChi-square . يمتدترهدت لتي و لأدو ت و لاسدددتمدف ، لتعلم وقبول لإلمدت، بين لعلاقدتت لبحد ندتق على يعتمف لنهتئي للمسدتمف، و لتبنى لتعلم ممرسدتت تعزيز أن إلى وخلص. لاسدتمف ، ودرج لمسدتمف، قدتدة لمطوة هداه تدفعم قدف. إليهدت ينتمون لتي لمجموعد على بندت ً لفرديد لعو مدل تدثثير ت بين لتمييز وكسددب لنهتئي و لتبنى للمسددتمف، لتعلم أنشددط تشددجيع كيفي حول بفليل و لمفيرين و لمشرددفين لفرق
. لمشروعتت و لبرمجيتت إد رة( أدو ت) لمزيف من لمز يت لنبنى أد ة
يمتترهت لتي و لإسددتمف ، و لأدو ت لتعلم لإلمت، قبولروعتتدددددد إد رة لمشدد أدو ت: لمفتتحي لكلمت و لتكنولوجيت لإد رة كلي لعتي در س حتل لإستمف ، مصر لتعليم لمستمف، درج
Suggested Citation according to APA Style
Abd El Halim, H. (2020). Project Management (PM) Tools: Awareness,
Acceptance of Learning and Use, User Selected Tools, and Usage
Degree in Egypt: The Case Study of College of Management and
Technology (CMT). Journal of Alexandria University for
Administrative Sciences, Faculty of Commerce – Aleanxdria
University 57(4), 35 – 63.
All rights reserved © 2020