Embed Size (px)
Citation preview

Project Management –Scheduling and RiskScheduling and Risk
ManagementWeek 12
1
AnnouncementAnnouncement
• Midterm 2– Wednesday, April 27
– Scope
• Week 11 – Week 12
Short answer questions– Short answer questions
Agenda (Lecture)Agenda (Lecture)
• Scheduling
• Risk managmentRisk managment
Agenda (Lab)Agenda (Lab)
• Implement a software product based on your design documents
• Submit a weekly project progress report at the end of the Wednesday lab sessiony
Project SchedulingProject Scheduling
• Manager’s responsibility– Planning, scheduling, and controlling projects– Often these projects are so large or complex that the managerOften these projects are so large or complex that the manager
cannot possibly remember all the information about the plan, schedule, and progress
• Critical Path Method (CPM)– Research and development of new products
Construction of plants buildings and highways– Construction of plants, buildings, and highways– Maintenance of large and complex equipment– etc.
5
Project Scheduling ProcessProject Scheduling Process
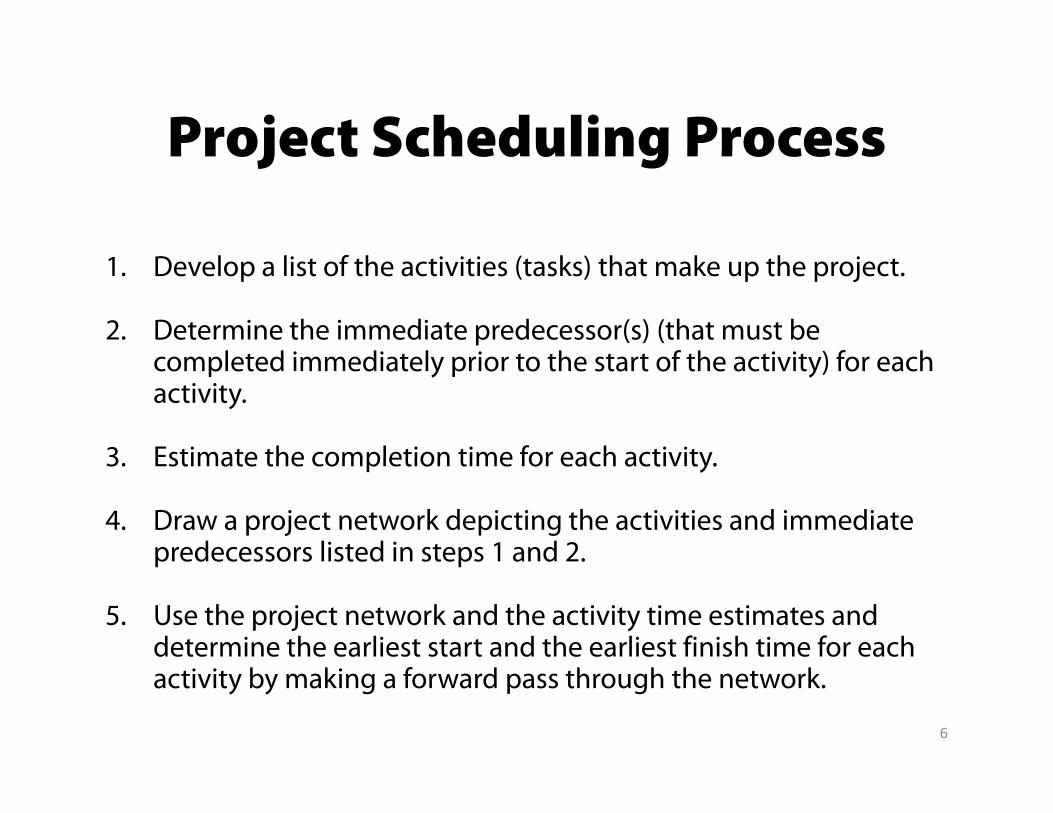
1. Develop a list of the activities (tasks) that make up the project.
2. Determine the immediate predecessor(s) (that must be l t d i di t l i t th t t f th ti it ) f hcompleted immediately prior to the start of the activity) for each
activity.
3 Estimate the completion time for each activity3. Estimate the completion time for each activity.
4. Draw a project network depicting the activities and immediate predecessors listed in steps 1 and 2.predecessors listed in steps 1 and 2.
5. Use the project network and the activity time estimates and determine the earliest start and the earliest finish time for each activity by making a forward pass through the network.
6
Project Scheduling ProcessProject Scheduling Process
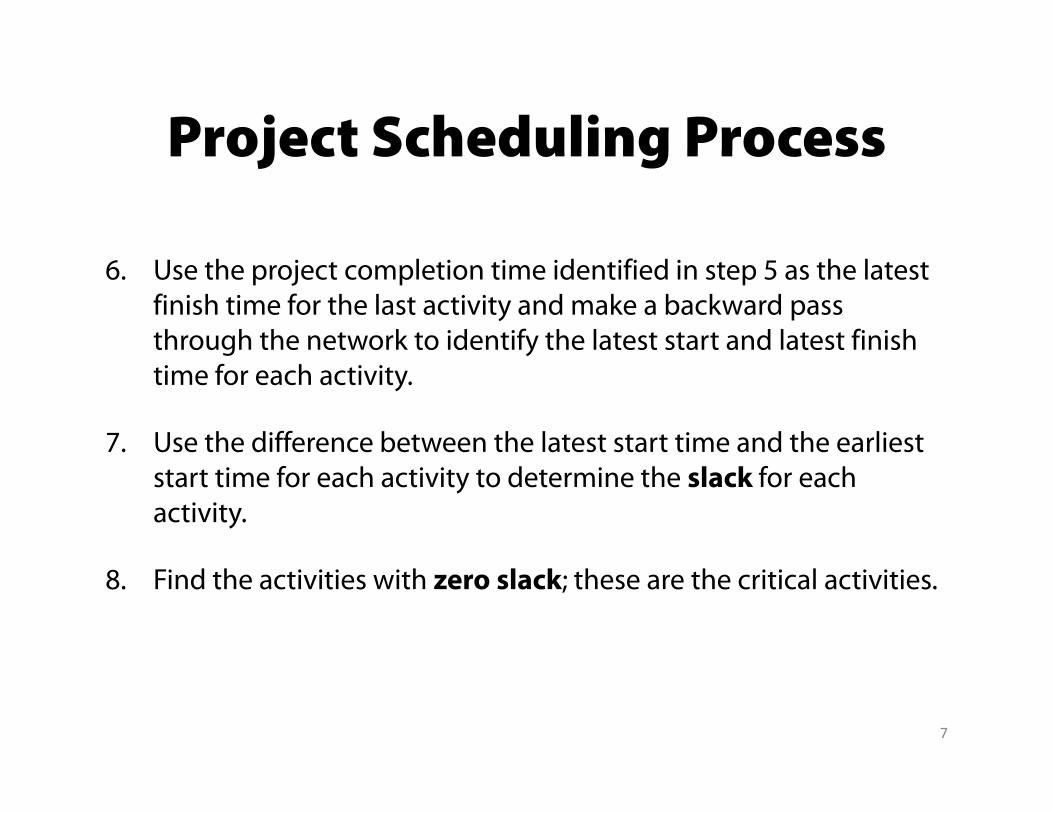
6. Use the project completion time identified in step 5 as the latest finish time for the last activity and make a backward pass through the network to identify the latest start and latest finish g ytime for each activity.
7. Use the difference between the latest start time and the earliest start time for each activity to determine the slack for each activity.
8. Find the activities with zero slack; these are the critical activities.
7
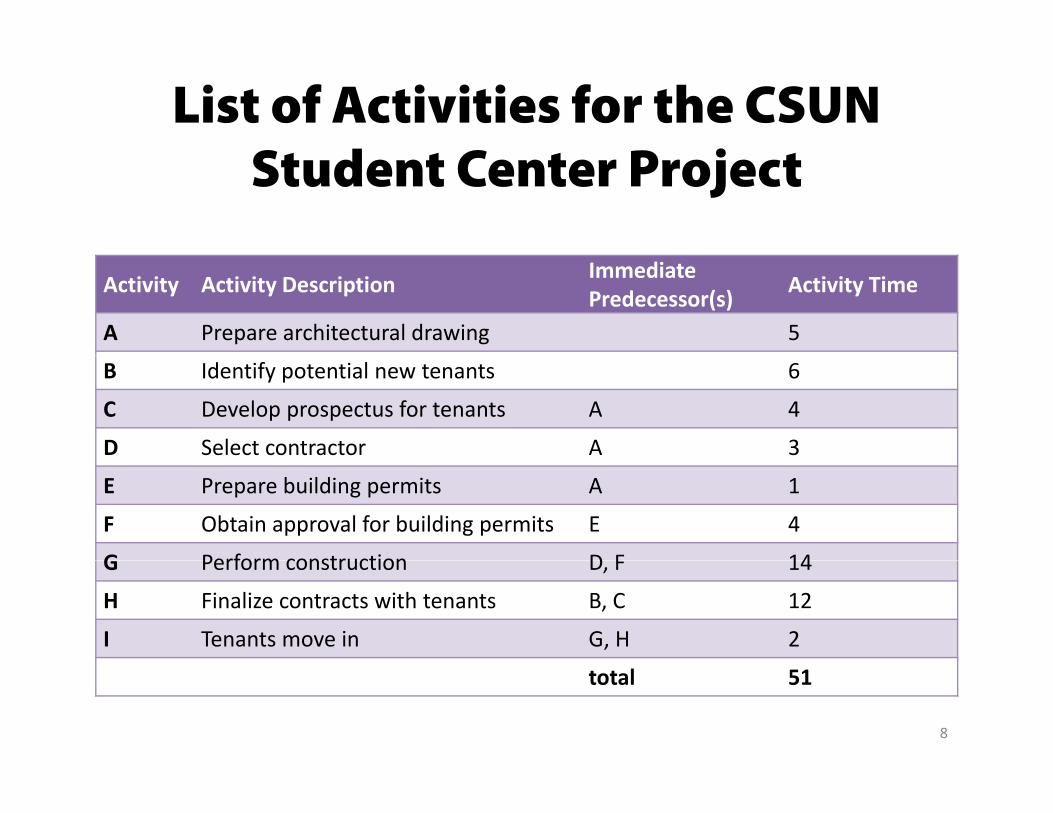
List of Activities for the CSUN S d C P jStudent Center Project
Activity Activity Description Immediate Predecessor(s) Activity Time
A Prepare architectural drawing 5
B Identify potential new tenants 6
C Develop prospectus for tenants A 4
D Select contractor A 3
E Prepare building permits A 1
F Obtain approval for building permits E 4
G Perform construction D F 14G Perform construction D, F 14
H Finalize contracts with tenants B, C 12
I Tenants move in G, H 2
total 51
8
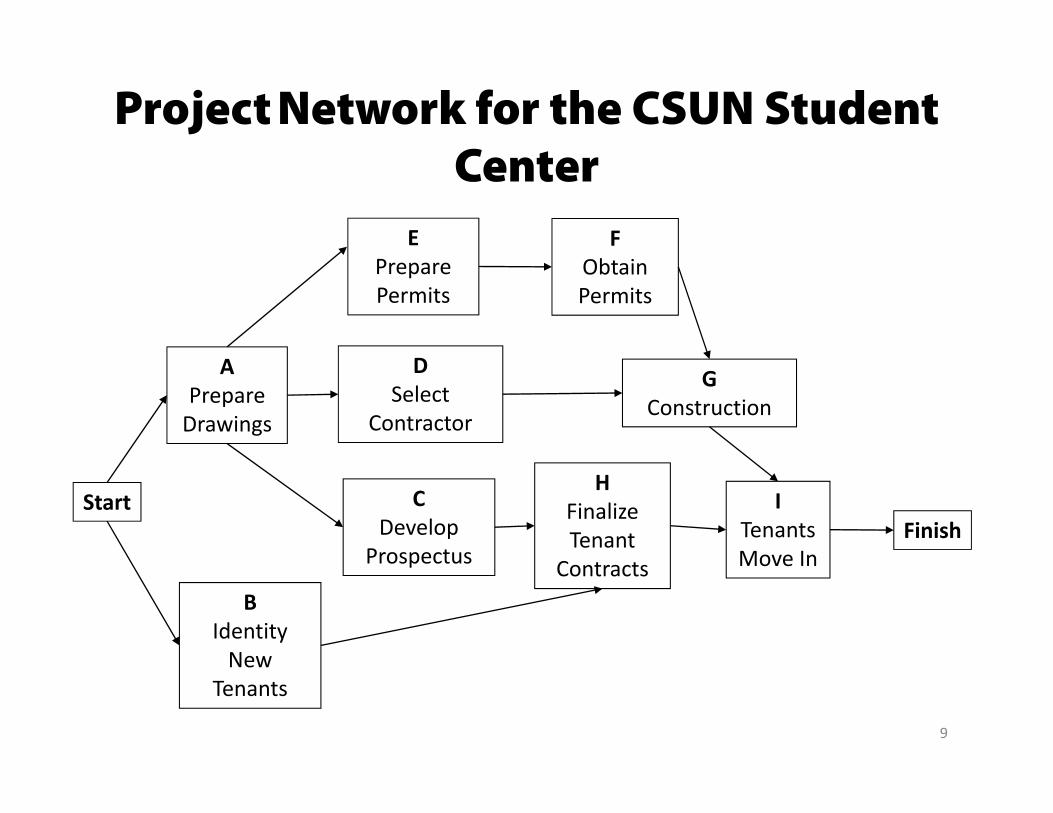
Project Network for the CSUN Student C
E F
Center
PreparePermits
ObtainPermits
APrepare Drawings
DSelect
Contractor
GConstruction
Start CDevelop
Prospectus
HFinalizeTenant
ITenantsMove In
FinishProspectus Contracts Move In
BIdentityNewNew
Tenants
9
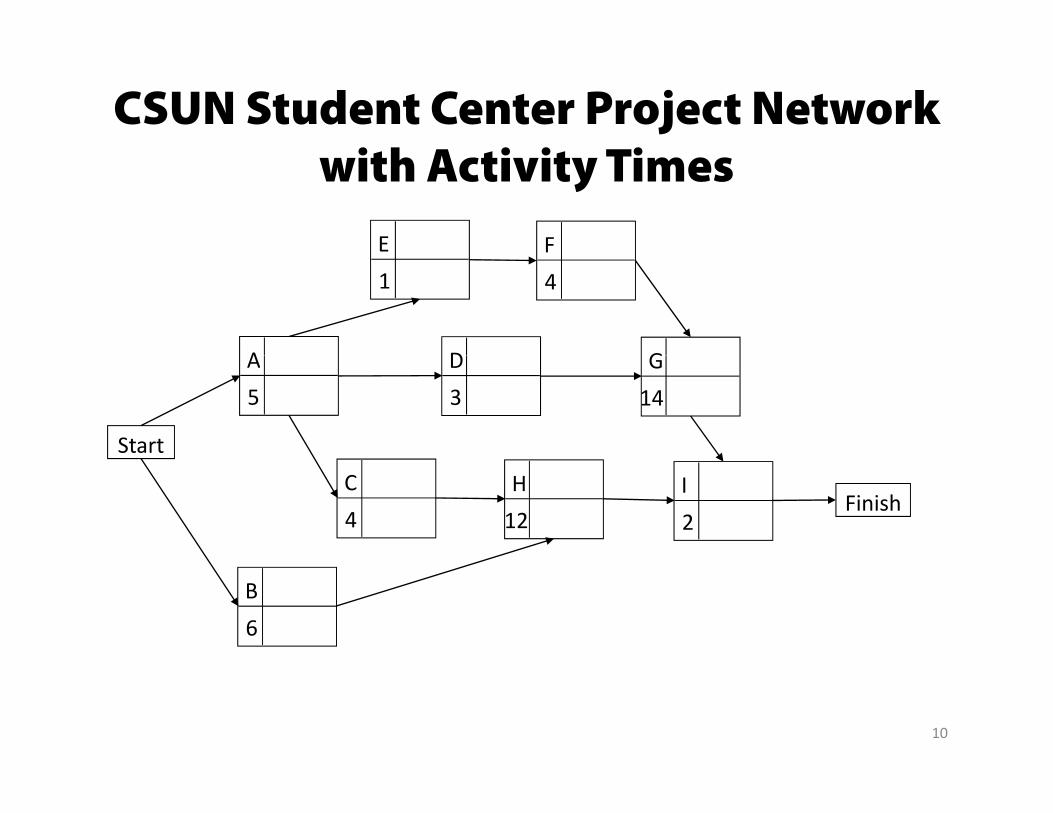
CSUN Student Center Project Network i h A i i Tiwith Activity Times
FE
A D G
41
Start
A5
D3
G14
FinishC4
H12
I2
B6
10
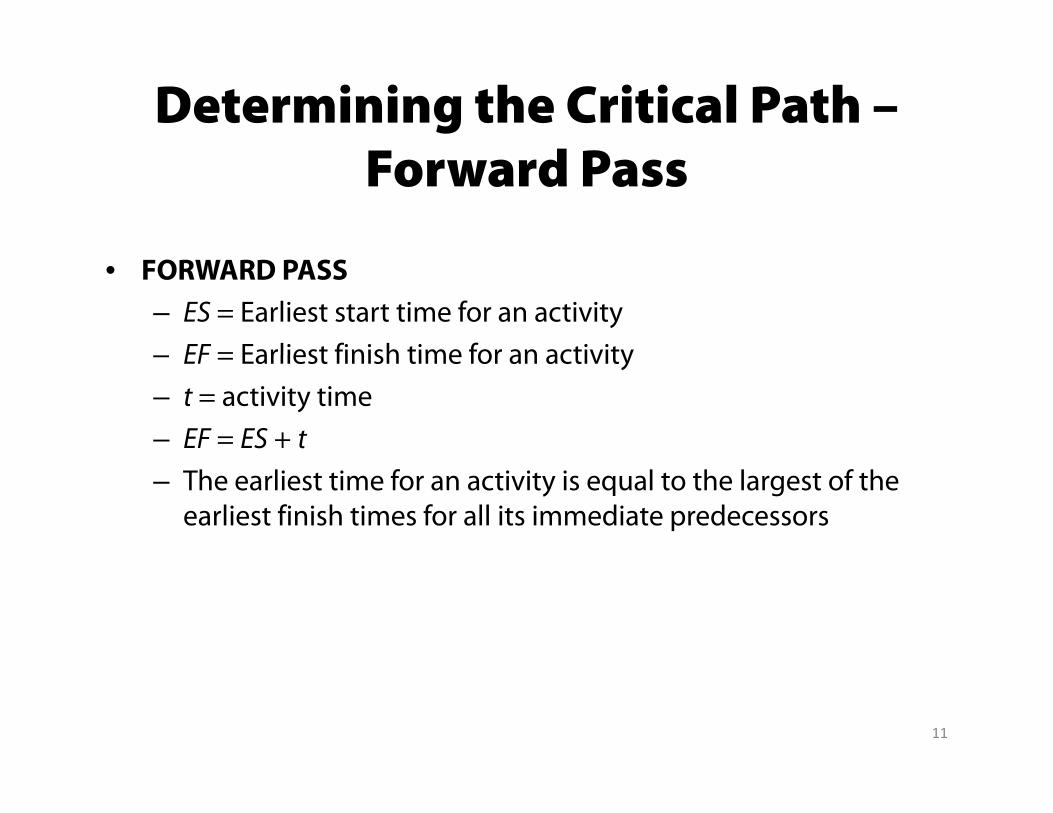
Determining the Critical Path –d PForward Pass
• FORWARD PASS– ES = Earliest start time for an activity
– EF = Earliest finish time for an activity– EF = Earliest finish time for an activity
– t = activity time
– EF = ES + t
– The earliest time for an activity is equal to the largest of the earliest finish times for all its immediate predecessors
11
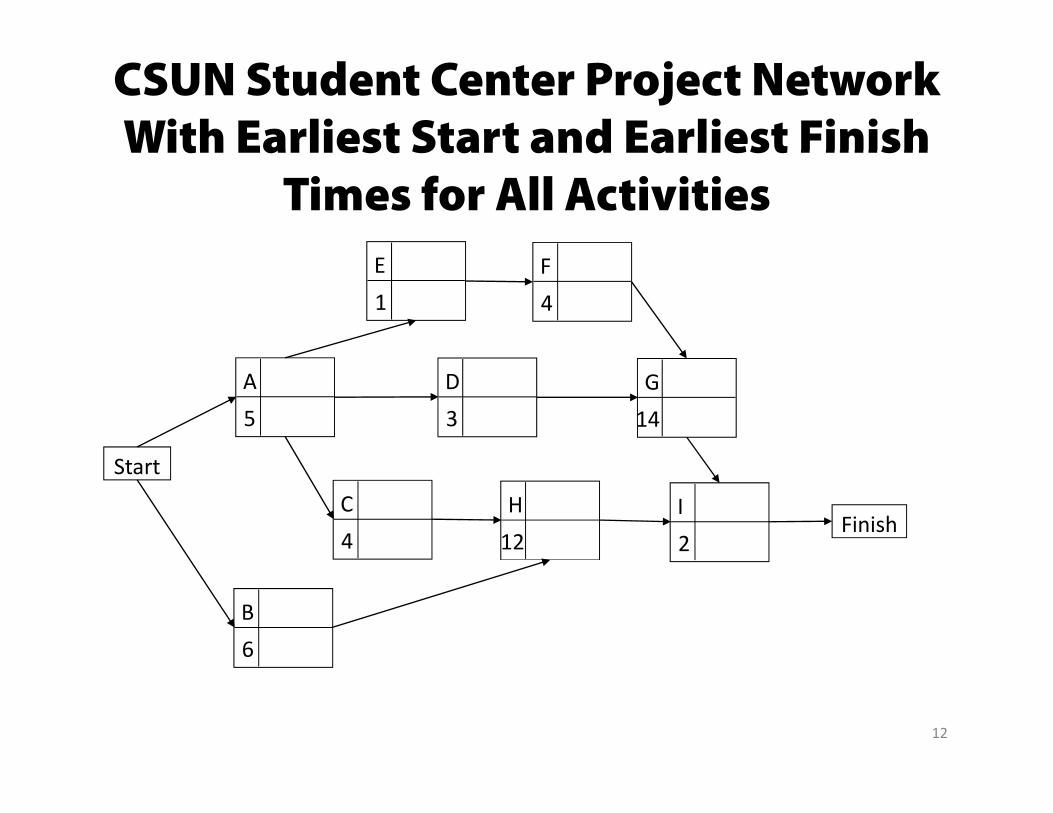
CSUN Student Center Project Network With Earliest Start and Earliest FinishWith Earliest Start and Earliest Finish
Times for All ActivitiesF4
E1
A5
D3
G14
Start
FinishC4
H12
I2
B6
12
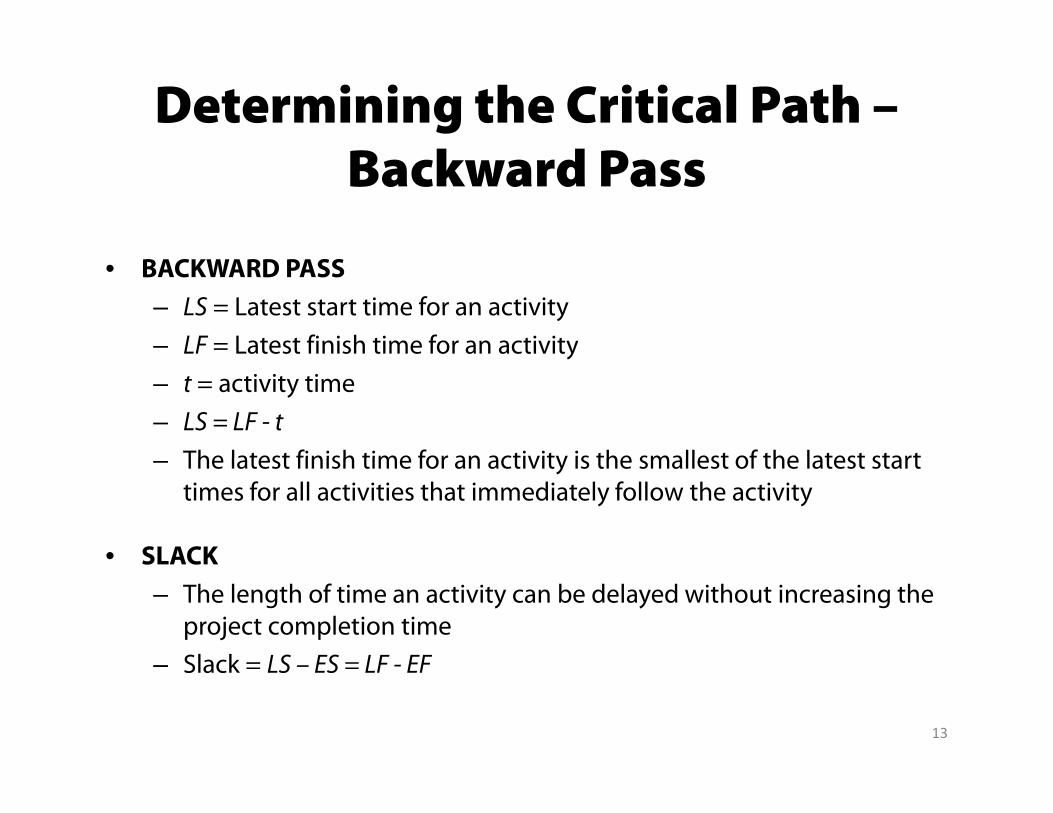
Determining the Critical Path –B k d PBackward Pass
• BACKWARD PASS
– LS = Latest start time for an activity
– LF = Latest finish time for an activityy
– t = activity time
– LS = LF - t
The latest finish time for an activity is the smallest of the latest start– The latest finish time for an activity is the smallest of the latest start times for all activities that immediately follow the activity
• SLACKSLACK
– The length of time an activity can be delayed without increasing the project completion time
Slack = LS ES = LF EF– Slack = LS – ES = LF - EF
13
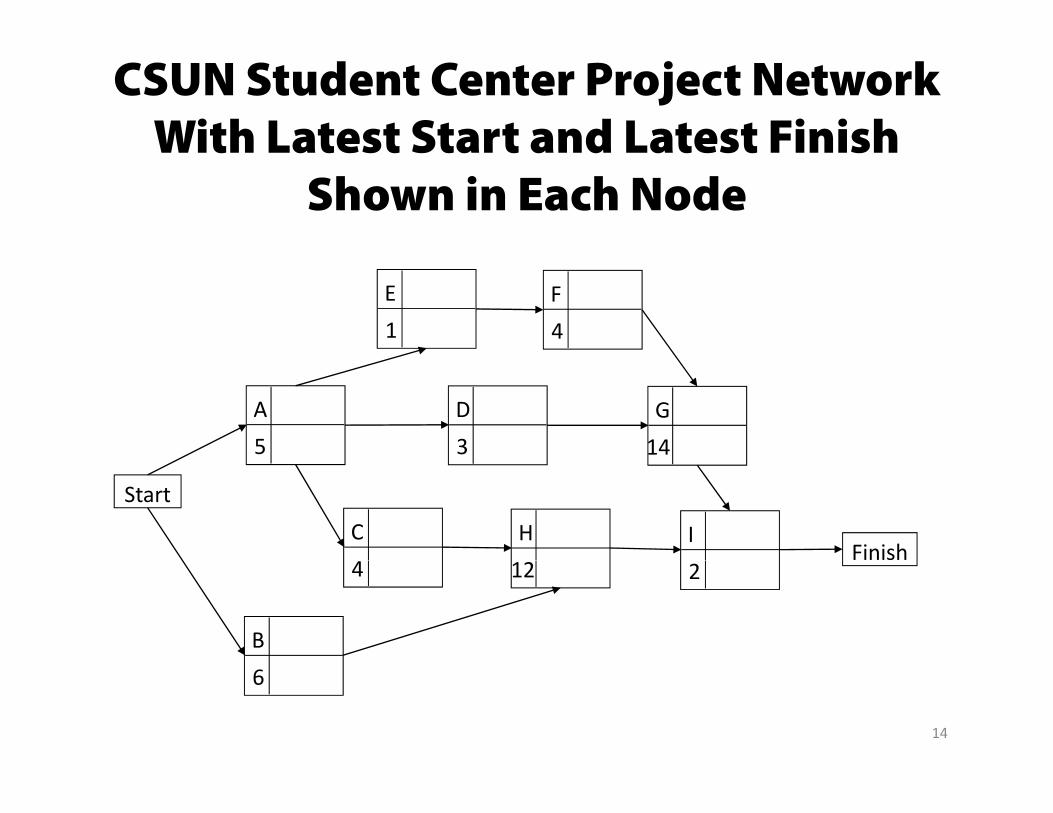
CSUN Student Center Project Network With Latest Start and Latest FinishWith Latest Start and Latest Finish
Shown in Each Node
F4
E1
A5
D3
G14
Start
FinishC H I4 12 2
B6
14
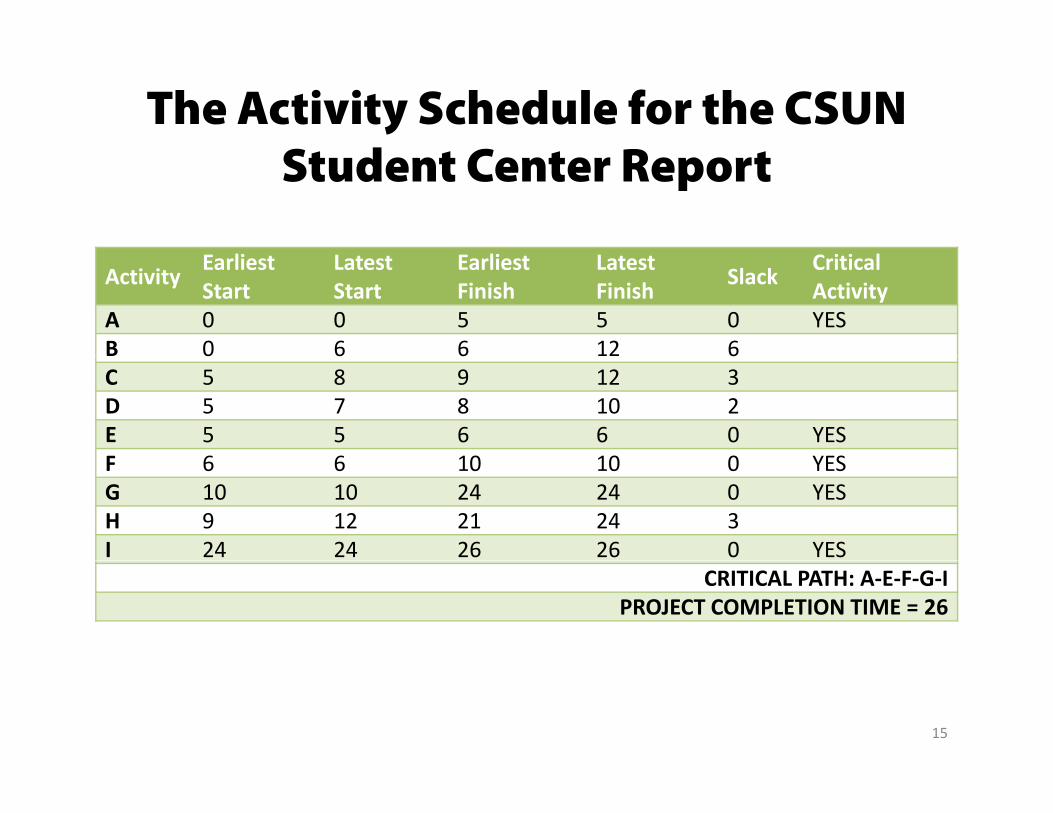
The Activity Schedule for the CSUN S d C RStudent Center Report
Activity EarliestStart
LatestStart
EarliestFinish
LatestFinish Slack Critical
ActivityA 0 0 5 5 0 YESB 0 6 6 12 6B 0 6 6 12 6C 5 8 9 12 3D 5 7 8 10 2E 5 5 6 6 0 YESF 6 6 10 10 0 YESF 6 6 10 10 0 YESG 10 10 24 24 0 YESH 9 12 21 24 3I 24 24 26 26 0 YES
CRITICAL PATH: A‐E‐F‐G‐IPROJECT COMPLETION TIME = 26
15
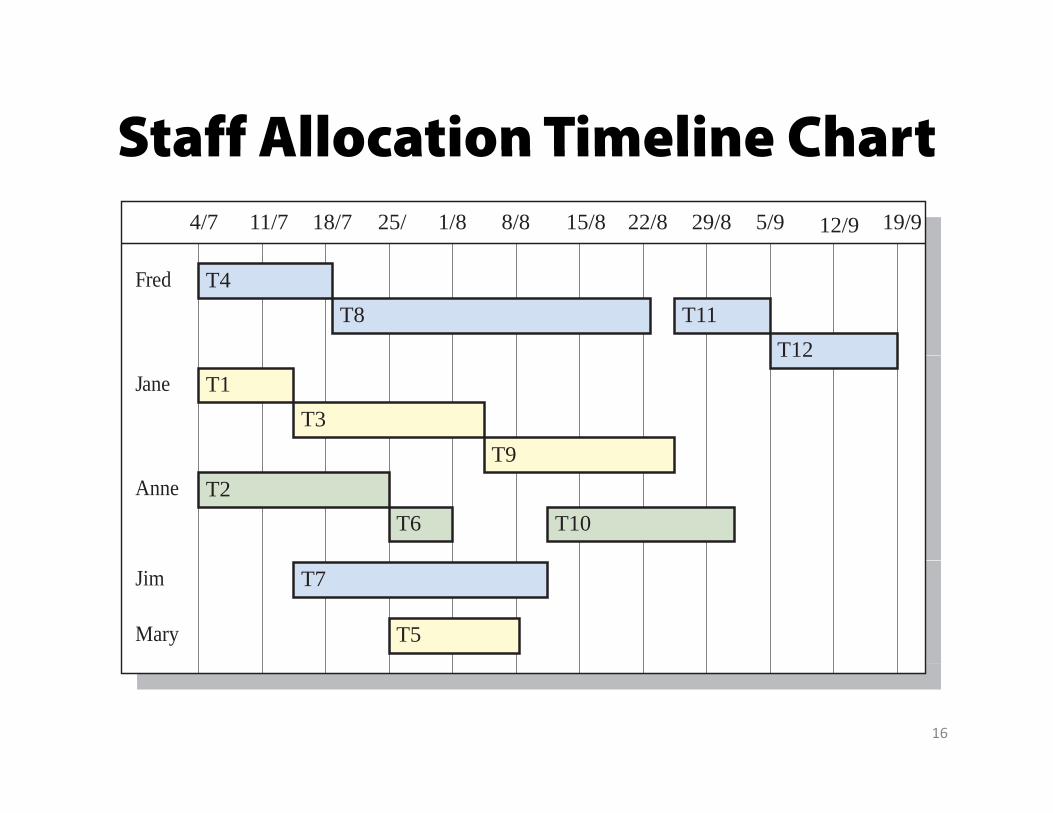
Staff Allocation Timeline ChartStaff Allocation Timeline Chart4/7 11/7 18/7 25/ 1/8 8/8 15/8 22/8 29/8 5/9 12/9 19/9
T4
T8 T11
T12
Fred
T12
T1
T3
T9
Jane
T9
T2
T6 T10
Anne
T7
T5Mary
Jim
16
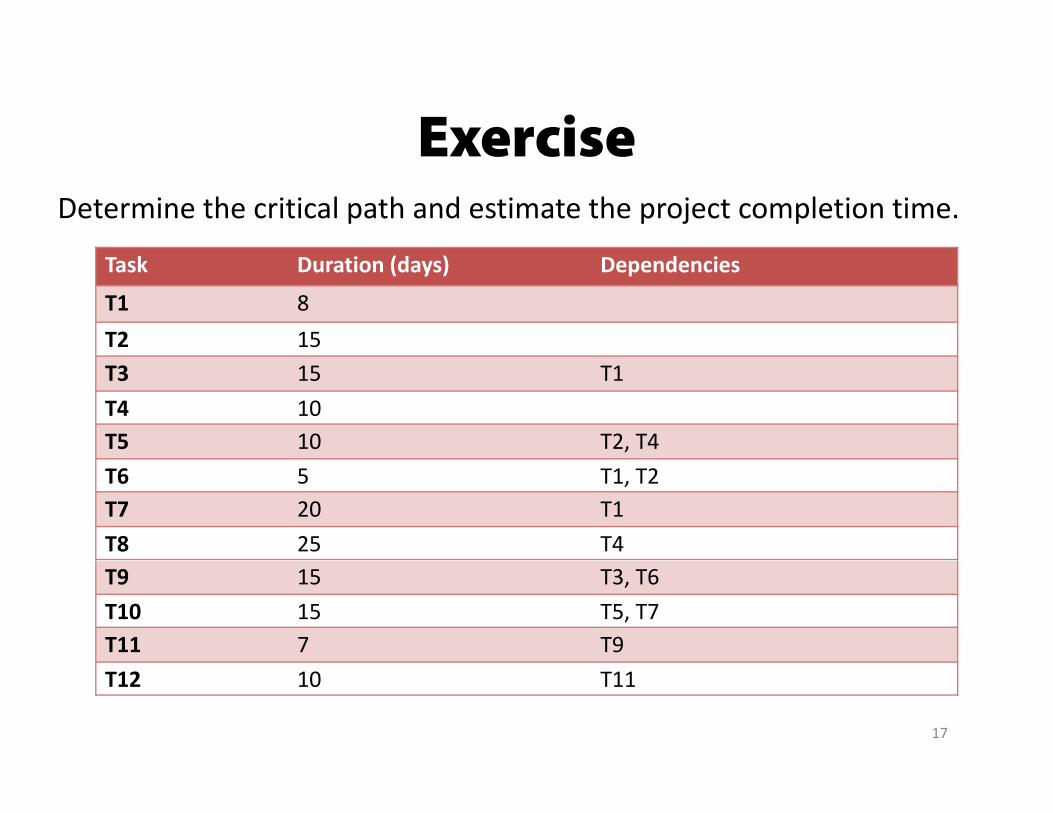
ExerciseExerciseDetermine the critical path and estimate the project completion time.
Task Duration (days) Dependencies
T1 8T2 15T3 15 T1T4 10T5 10 T2, T4T6 5 T1, T2T7 20 T1T8 25 T4T9 15 T3, T6T10 15 T5, T7T11 7 T9T12 10 T11
17
Planning ToolPlanning Tool
• Microsoft Project
18
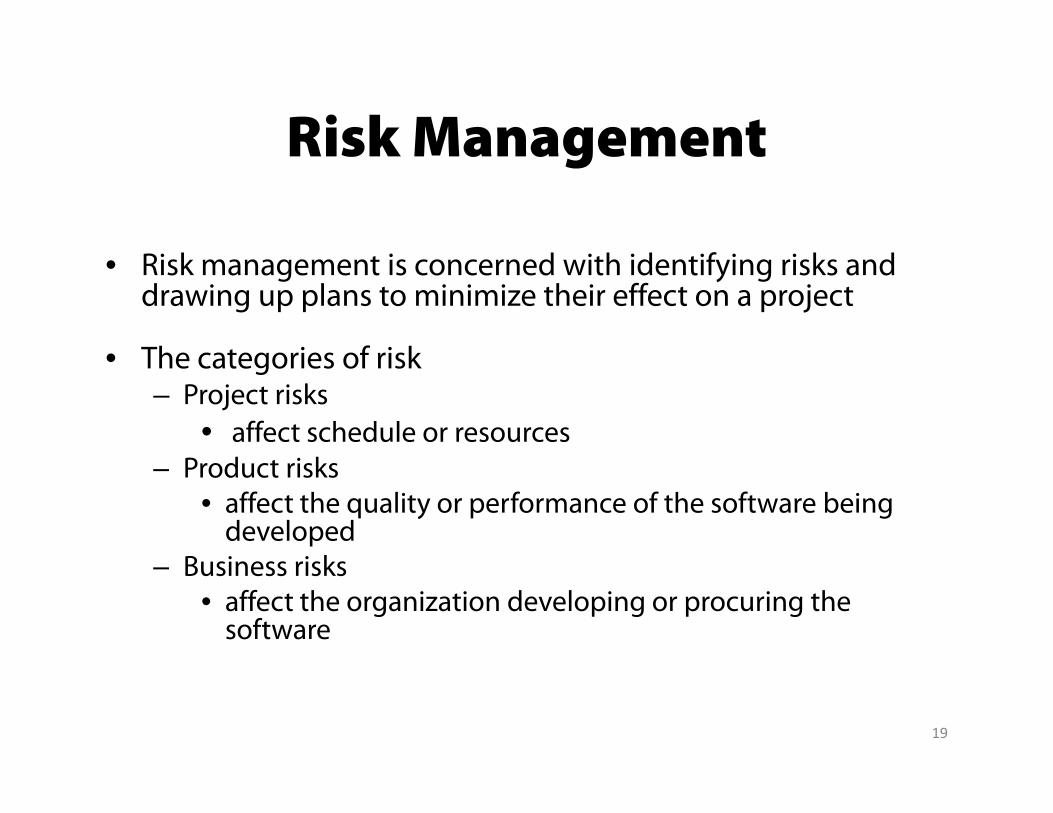
Risk ManagementRisk Management
k d h d f k d• Risk management is concerned with identifying risks and drawing up plans to minimize their effect on a project
• The categories of risk• The categories of risk – Project risks
• affect schedule or resourcesP d i k– Product risks
• affect the quality or performance of the software being developed
B i i k– Business risks • affect the organization developing or procuring the
software
19
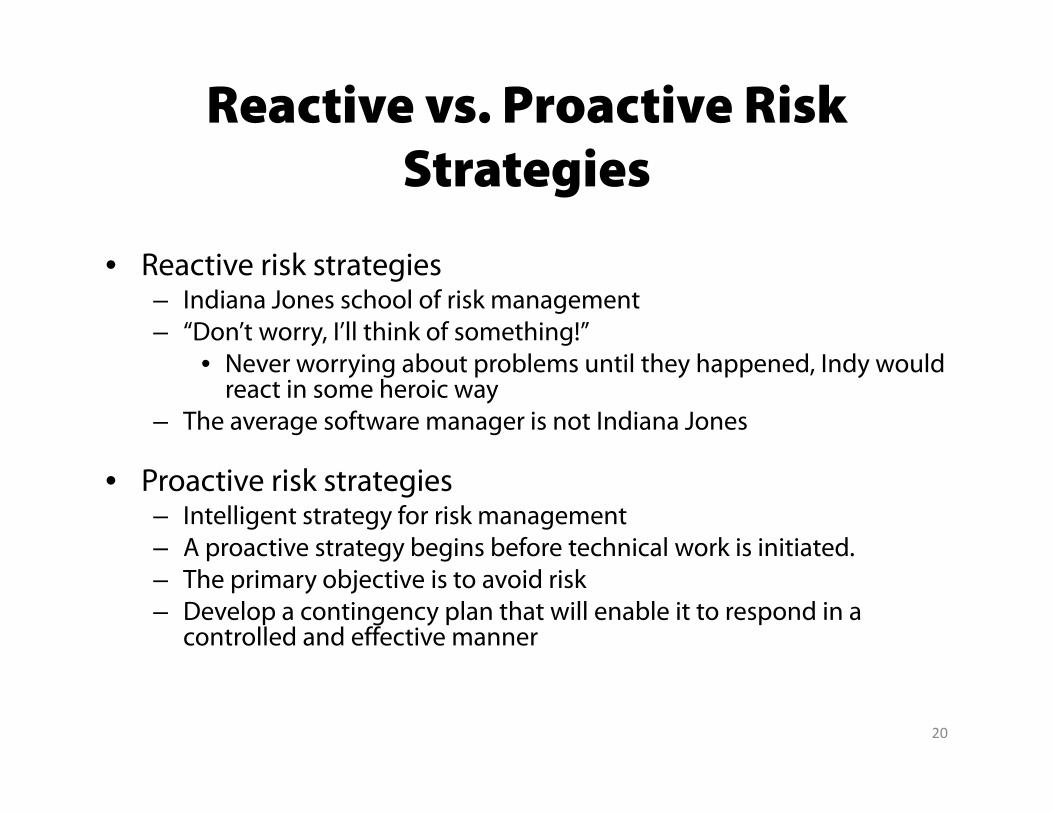
Reactive vs. Proactive Risk S iStrategies
k• Reactive risk strategies– Indiana Jones school of risk management– “Don’t worry, I’ll think of something!”
N i b bl il h h d I d ld• Never worrying about problems until they happened, Indy would react in some heroic way
– The average software manager is not Indiana Jones
• Proactive risk strategies– Intelligent strategy for risk management– A proactive strategy begins before technical work is initiated.p gy g– The primary objective is to avoid risk– Develop a contingency plan that will enable it to respond in a
controlled and effective manner
20
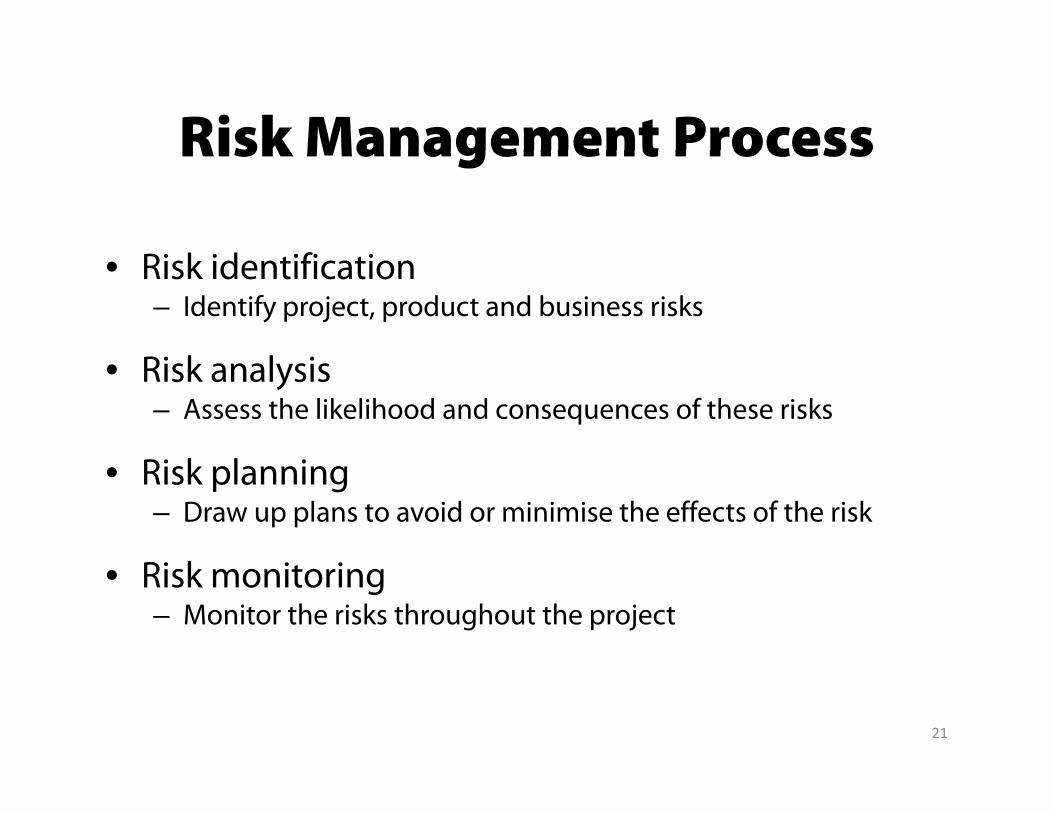
Risk Management ProcessRisk Management Process
k d f• Risk identification– Identify project, product and business risks
k l• Risk analysis– Assess the likelihood and consequences of these risks
• Risk planning– Draw up plans to avoid or minimise the effects of the risk
• Risk monitoring– Monitor the risks throughout the project
21
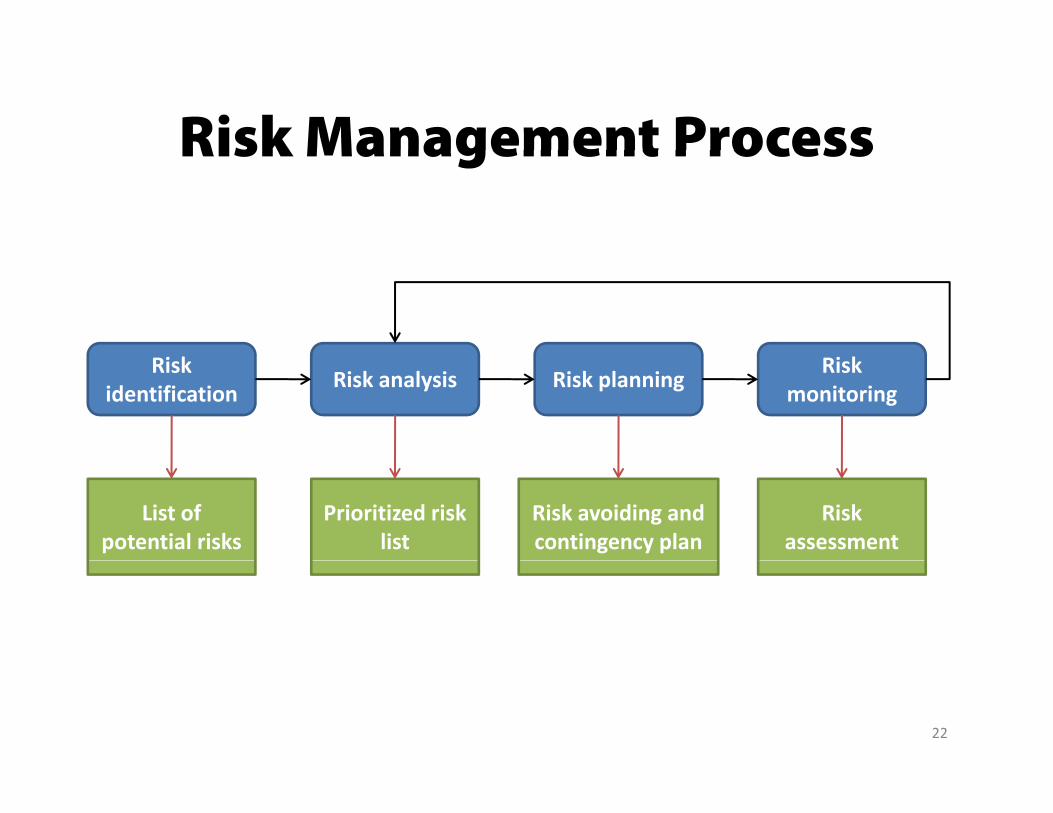
Risk Management ProcessRisk Management Process
Risk identification Risk analysis Risk planning Risk
monitoring
List of potential risks
Prioritized risk list
Risk avoiding and contingency plan
Risk assessment
22
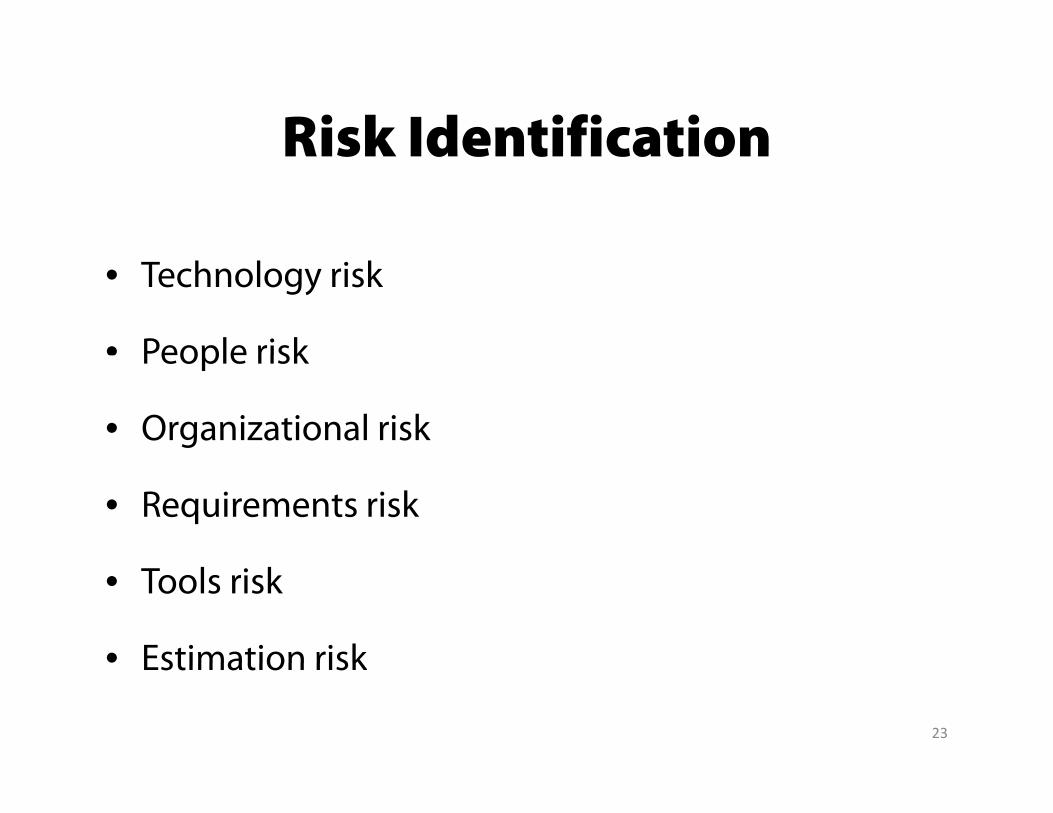
Risk IdentificationRisk Identification
• Technology risk
• People riskPeople risk
• Organizational risk
• Requirements risk
• Tools risk
• Estimation riskEstimation risk
23
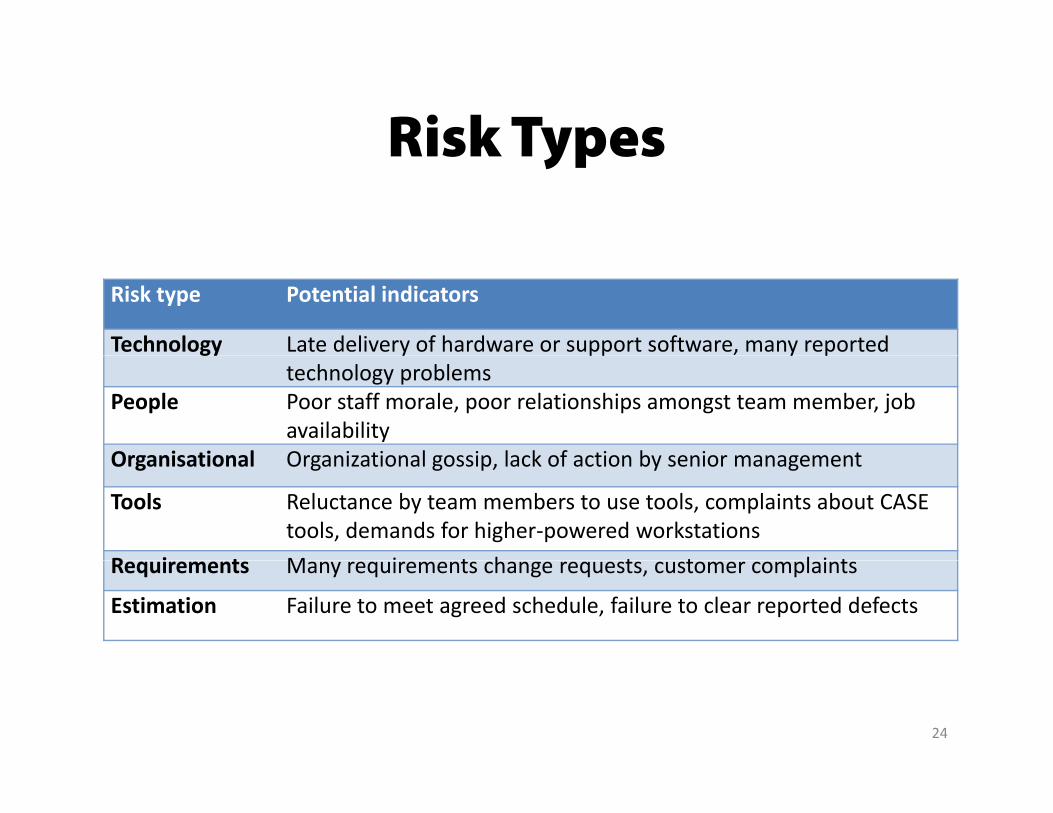
Risk TypesRisk Types
Risk type Potential indicators
Technology Late delivery of hardware or support software, many reported gy y pp y ptechnology problems
People Poor staff morale, poor relationships amongst team member, job availability
Organisational Organizational gossip lack of action by senior managementOrganisational Organizational gossip, lack of action by senior management
Tools Reluctance by team members to use tools, complaints about CASE tools, demands for higher‐powered workstations
R i t M i t h t t l i tRequirements Many requirements change requests, customer complaints
Estimation Failure to meet agreed schedule, failure to clear reported defects
24
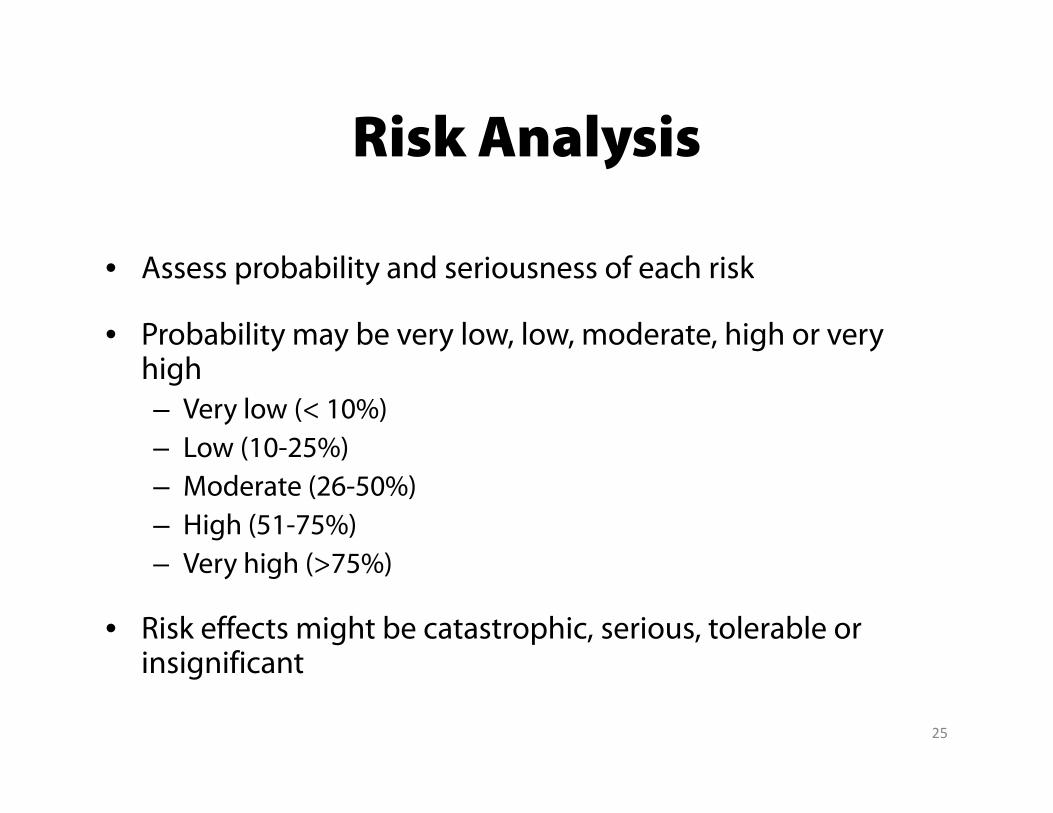
Risk AnalysisRisk Analysis
• Assess probability and seriousness of each risk
• Probability may be very low, low, moderate, high or very high– Very low (< 10%)– Low (10-25%)( )– Moderate (26-50%)– High (51-75%)
Very high (>75%)– Very high (>75%)
• Risk effects might be catastrophic, serious, tolerable or insignificantinsignificant
25
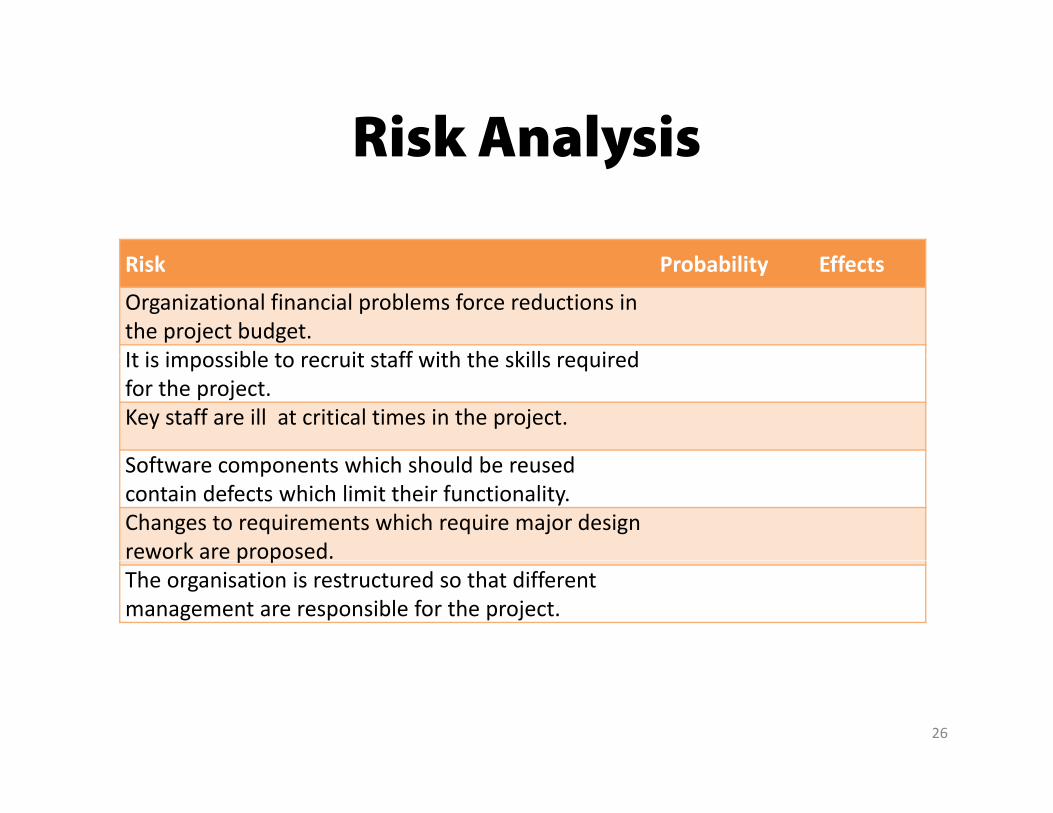
Risk AnalysisRisk Analysis
Risk Probability Effects
Organizational financial problems force reductions in the project budget. It i i ibl t it t ff ith th kill i dIt is impossible to recruit staff with the skills required for the project. Key staff are ill at critical times in the project.
S f hi h h ld b dSoftware components which should be reused contain defects which limit their functionality. Changes to requirements which require major design rework are proposed. p pThe organisation is restructured so that different management are responsible for the project.
26
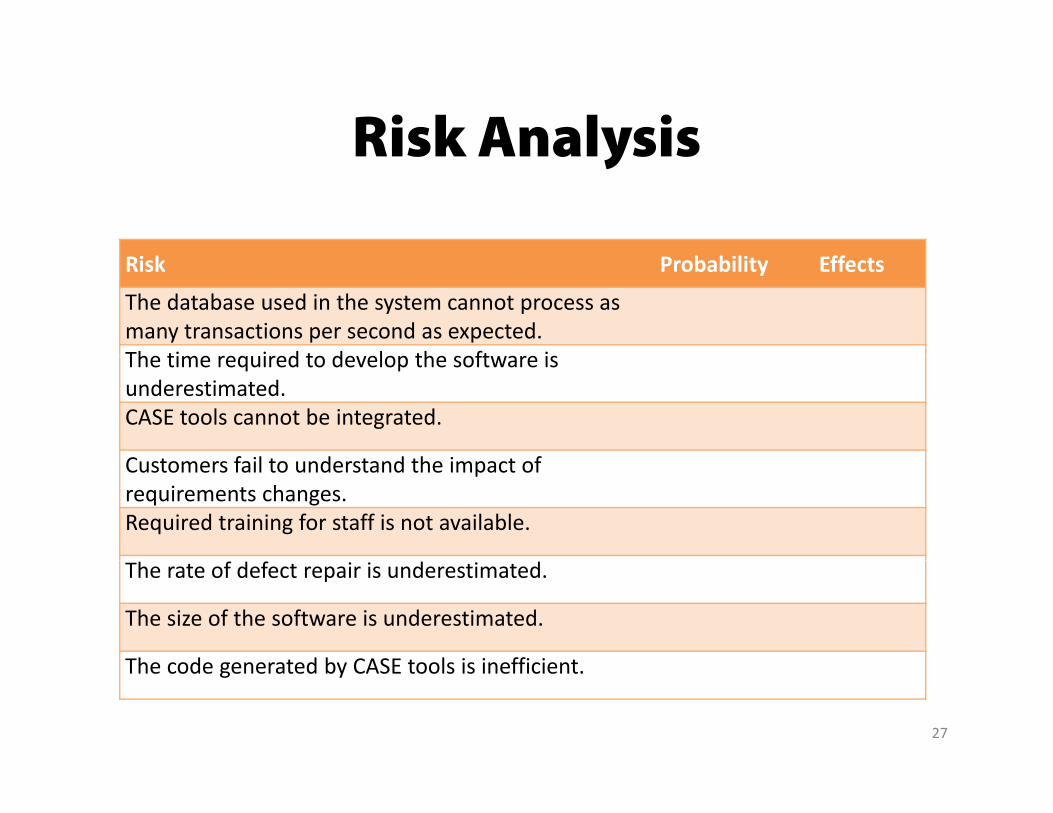
Risk AnalysisRisk Analysis
Risk Probability Effects
The database used in the system cannot process as many transactions per second as expected. Th ti i d t d l th ft iThe time required to develop the software is underestimated. CASE tools cannot be integrated.
C f il d d h i fCustomers fail to understand the impact of requirements changes. Required training for staff is not available.
The rate of defect repair is underestimated.
The size of the software is underestimated.
The code generated by CASE tools is inefficientThe code generated by CASE tools is inefficient.
27
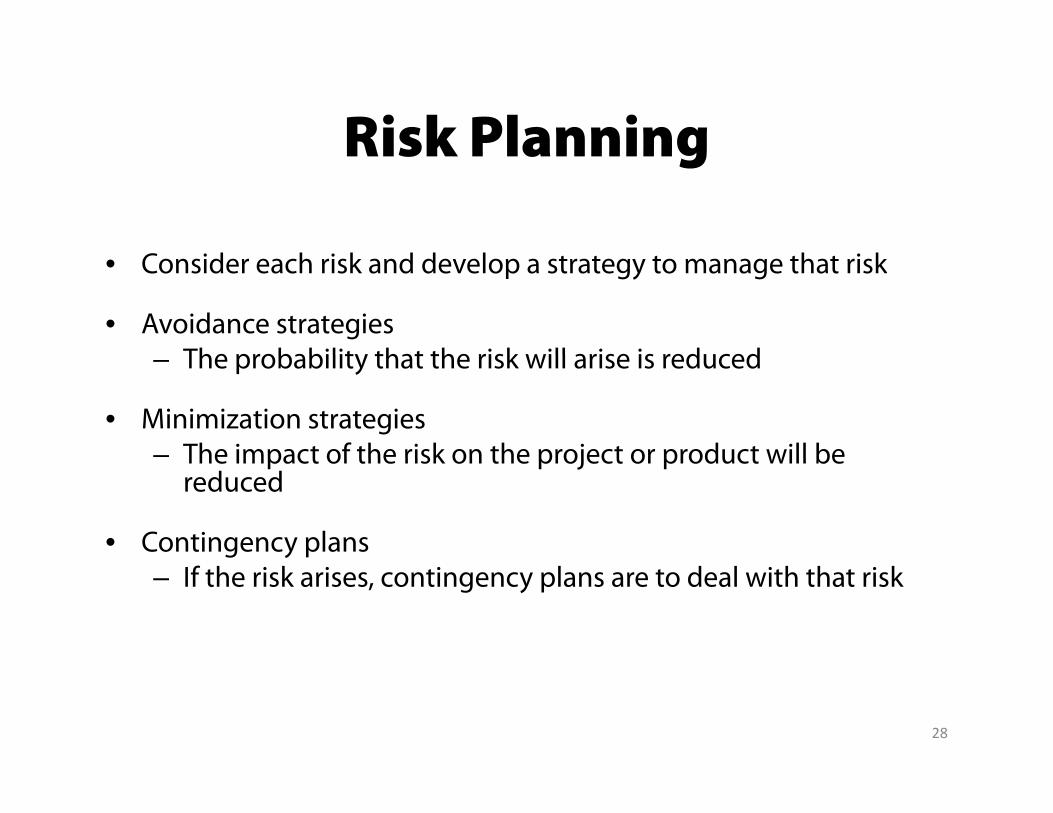
Risk PlanningRisk Planning
d h k d d l h k• Consider each risk and develop a strategy to manage that risk
• Avoidance strategiesThe probability that the risk will arise is reduced– The probability that the risk will arise is reduced
• Minimization strategies– The impact of the risk on the project or product will beThe impact of the risk on the project or product will be
reduced
• Contingency plans– If the risk arises, contingency plans are to deal with that risk
28
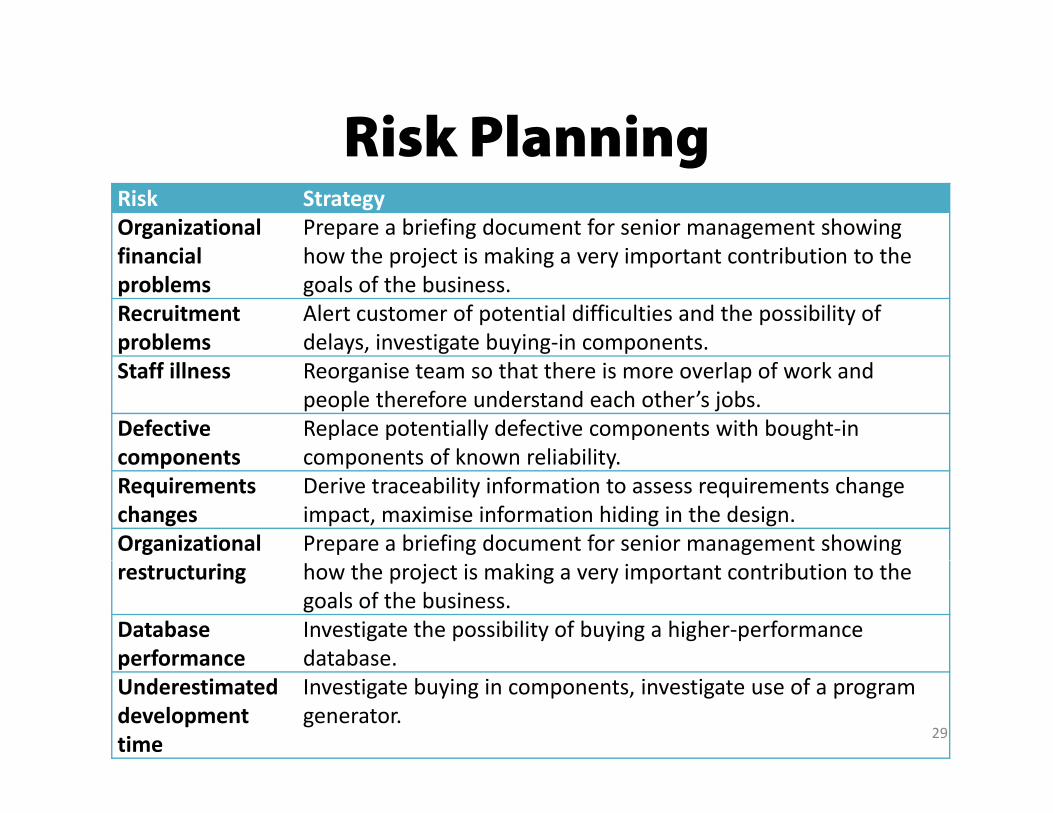
Risk PlanningRisk PlanningRisk Strategy Organizational financial
Prepare a briefing document for senior management showing how the project is making a very important contribution to thefinancial
problems how the project is making a very important contribution to the goals of the business.
Recruitment problems
Alert customer of potential difficulties and the possibility of delays, investigate buying‐in components.
Staff illness Reorganise team so that there is more overlap of work and people therefore understand each other’s jobs.
Defective components
Replace potentially defective components with bought‐in components of known reliabilitycomponents components of known reliability.
Requirements changes
Derive traceability information to assess requirements change impact, maximise information hiding in the design.
Organizational Prepare a briefing document for senior management showing restructuring how the project is making a very important contribution to the
goals of the business. Database performance
Investigate the possibility of buying a higher‐performance database.performance database.
Underestimated development time
Investigate buying in components, investigate use of a program generator.
29
Risk MonitoringRisk Monitoring
• Assess each identified risks regularly to decide whether or not it is becoming less or more probable
• Also assess whether the effects of the risk have changedg
• Each key risk should be discussed at management progress meetingsprogress meetings
30
Risk ExposureRisk Exposure
• The expected value of the risk event– Expected value
E(x) = ∑xipi
• X is a the value of risk event
• P is a risk probability• P is a risk probability
• Consider a project that has 0.5 percent probability of an undetected fault that would cost the company $100,000 in fines. Calculate the risk exposure.
31

ExerciseExercise
• If there is a $100,000 bonus for being early with an aggressive schedule (only 20 percent chance of
tt i t) b t $250 000 lt f b i l tattainment), but a $250,000 penalty for being late with any schedule (being conservative gives a 90 percent chance of being on time or early) shouldpercent chance of being on time or early), should we pursue an aggressive or conservative schedule?
32