Embed Size (px)
Citation preview

Project Time Planning
Ahmed Elyamany, PhD
1

What is Planning
�The Development of a workable program of operations to accomplish established objectives when put into action.
�Done before project starts
�Planning for:�Construction process
�Jobsite safety
�Jobsite layout
�Workforce2

Who Needs Planning
�Owner
�Designer
�Contractor�Pre-tendering planning
�Project Planning
3

Benefits of Planning
�Savings:�Cost
�Time
�Quality improvements
�Avoided problems
�Solved problems
4
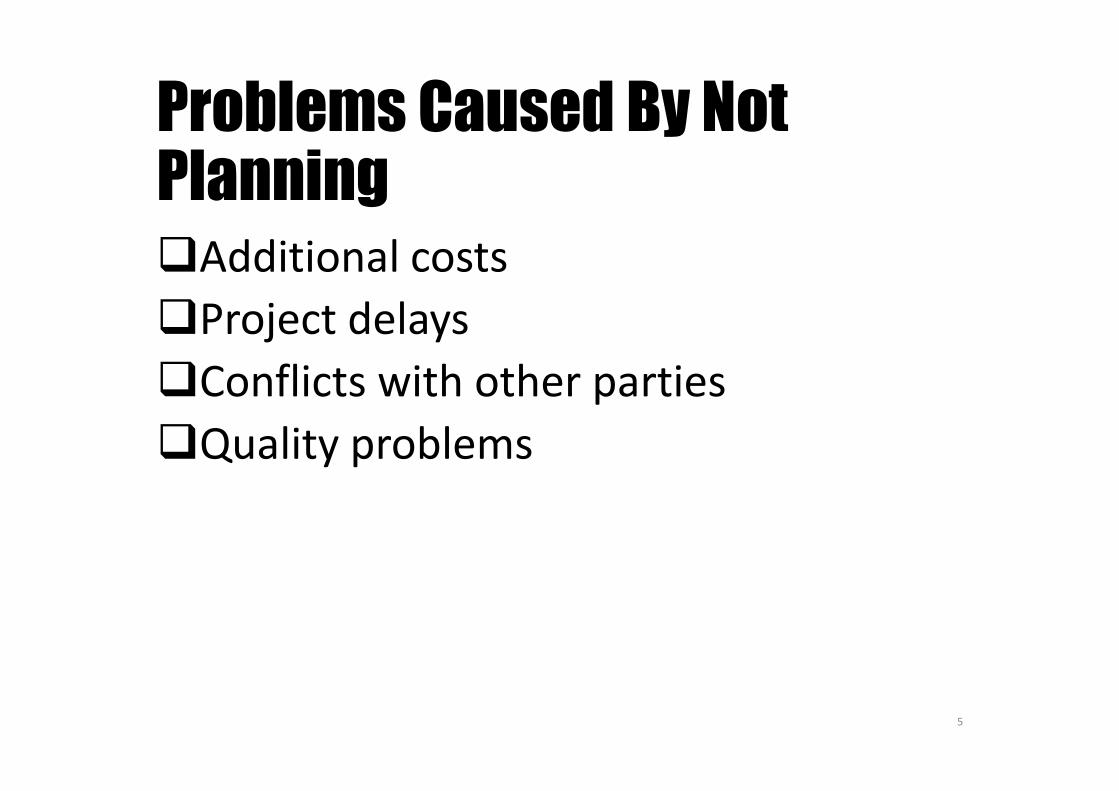
Problems Caused By Not Planning�Additional costs
�Project delays
�Conflicts with other parties
�Quality problems
5
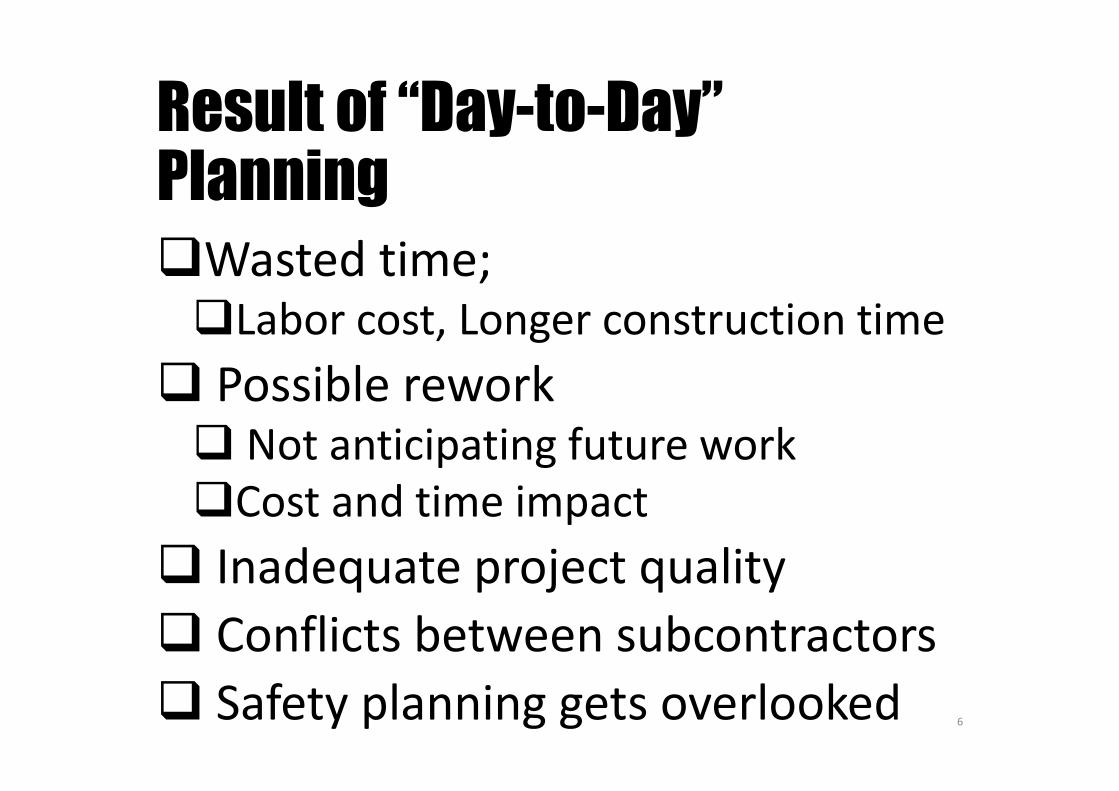
Result of “Day-to-Day” Planning
�Wasted time; �Labor cost, Longer construction time
� Possible rework� Not anticipating future work
�Cost and time impact
� Inadequate project quality
� Conflicts between subcontractors
� Safety planning gets overlooked6

Program Evaluation and
Review Technique [PERT]
7
Program Evaluation and Review Technique
(PERT)
VS
Critical Path Method(CPM)
٨
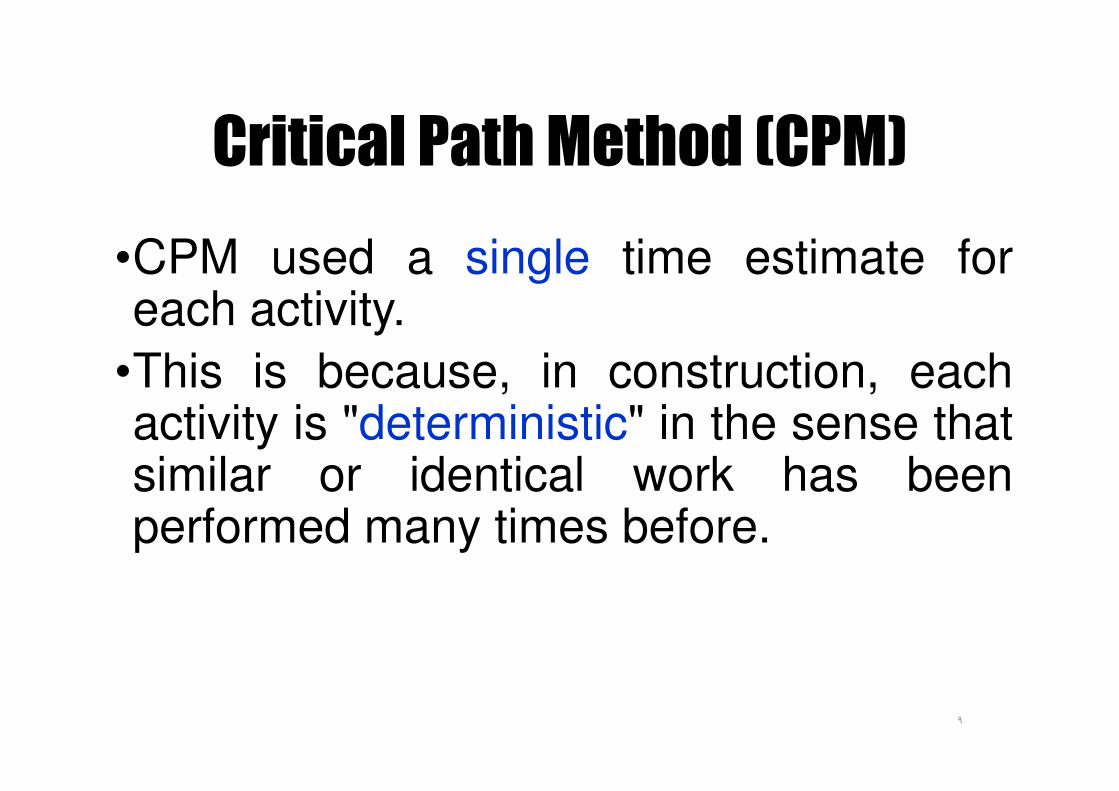
Critical Path Method (CPM)
•CPM used a single time estimate foreach activity.
•This is because, in construction, eachactivity is "deterministic" in the sense thatsimilar or identical work has beenperformed many times before.
٩
Critical Path Method (CPM)
�The single time estimate of the activitycompletely ignores the chance ofvariability associated with the conduct ofthe project activities.
�Sources of variation include weather,equipment failure, personnel or materialsproblems, or uncertainties in the methodor procedures to be used in carrying outthe activity.
١٠
Program Evaluation and Review Technique (PERT)
�PERT is appropriate for scheduling andcontrolling research and developmenttype projects, or others comprised ofactivities whose actual duration times aresubject to considerable chance ofvariation (random variation).
١١
Program Evaluation and Review Technique (PERT)
�Advantage of the PERT statisticalapproach is that it offers a method ofdealing with this chance variation,making it possible to allow for it in thescheduling calculations, and finally usingit as a basis for computing the probability(index) that the project, or key milestonesin the project, will be completed on orbefore their scheduled dates.
١٢
Program Evaluation and Review Technique (PERT)
�Probability has already been defined asa way of measuring uncertainty.
�PERT uses three time estimates foreach activity
�This is a "probabilistic" approach thatlends itself to activities for which there isno historical record of experience.
١٣
Program Evaluation and Review Technique (PERT)
�PERT uses three time estimates foreach activity:
1) an optimistic or minimum time,
2) a most likely or modal time,
3) a pessimistic or maximum time.
١٤
Optimistic Time (a/ To)
�Is the time which would be bettered onlyone time in twenty if the activity could beperformed repeatedly under the sameessential conditions.
�The activity is executed under veryfavorable conditions.
�The probability of being completed withinthis duration is about 0.05. (optimistictime = short time)
١٥
Pessimistic Time (b/ Tp)
�Is the time which would be exceededonly one time in twenty if the activitycould be performed repeatedly under thesame essential conditions.
�The activity is performed under veryunfavorable conditions.
�The probability of its occurrence is about0.05. (pessimistic time = long time)
١٦
Most Likely Time (m/ Tm)
�Is the modal value of the distribution, orthe value which is likely to occur moreoften than any other value.
�Usually closet to the actual durations.Very high probability.
١٧
The mean, expected, activity
duration (te)�Using three times estimate, the expectedtime, te, is computed.�te is used as the best available timeapproximation for the activity in question.�Mean = te = (a + 4m + b)/ 6�Where,
�a = optimistic time,
�m = most likely time,
�b = pessimistic time.١٨
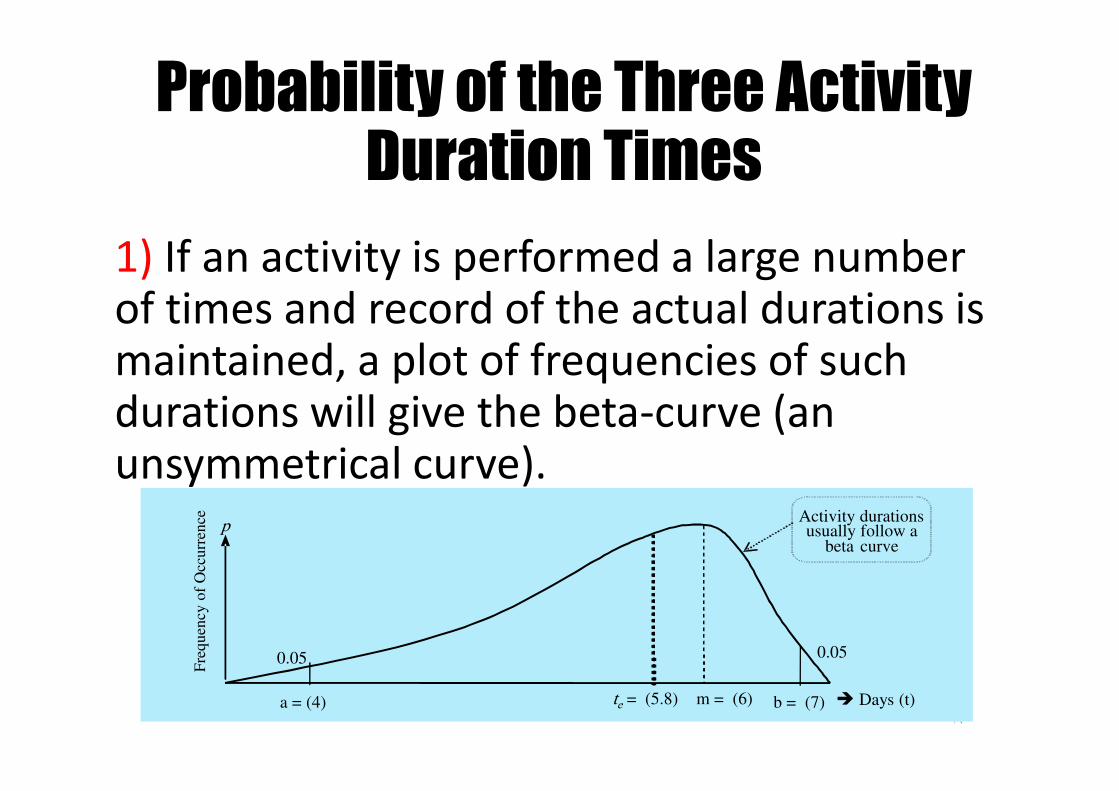
Probability of the Three Activity Duration Times
1) If an activity is performed a large number of times and record of the actual durations is maintained, a plot of frequencies of such durations will give the beta-curve (an unsymmetrical curve).
١٩
a = (4) m = (6) b = (7) � Days (t)
0.05
Fre
quen
cy o
f O
ccurr
ence
pActivity durations usually follow a
beta curve
te = (5.8)
0.05
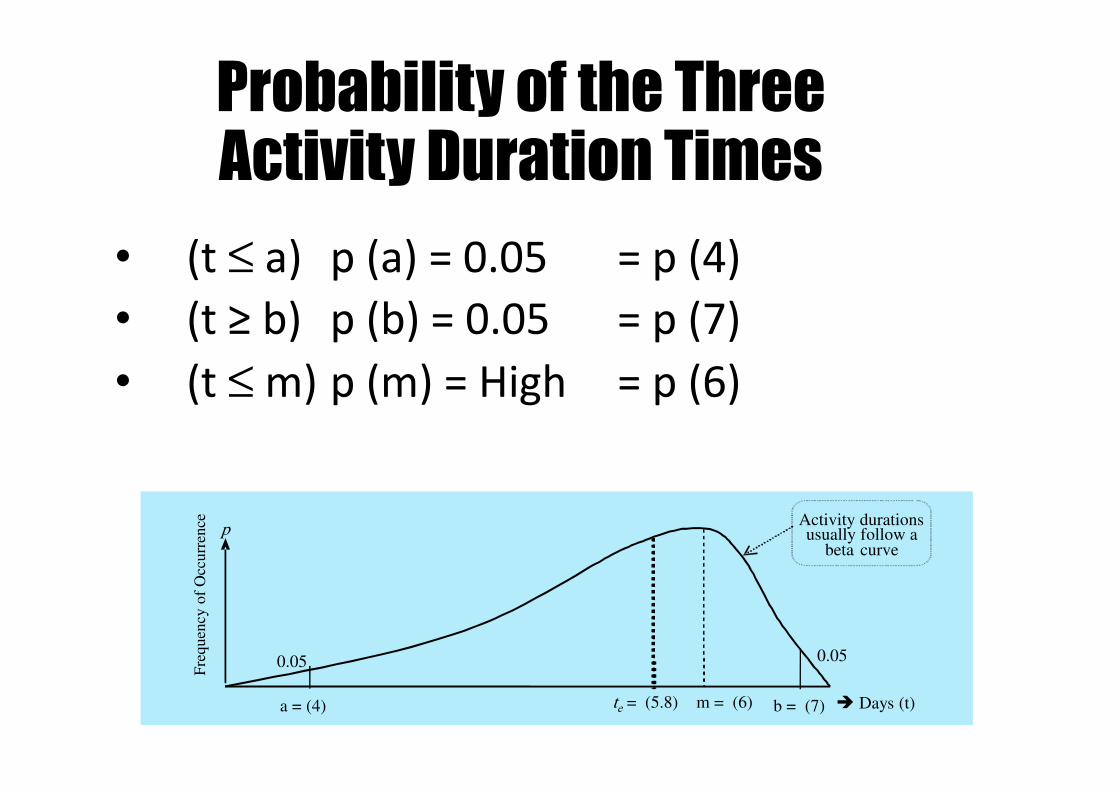
Probability of the Three Activity Duration Times
• (t ≤ a) p (a) = 0.05 = p (4)
• (t ≥ b) p (b) = 0.05 = p (7)
• (t ≤ m) p (m) = High = p (6)
٢٠
a = (4) m = (6) b = (7) � Days (t)
0.05
Fre
quen
cy o
f O
ccurr
ence
pActivity durations usually follow a
beta curve
te = (5.8)
0.05
Probability of the Three Activity Duration Times
2) Because the vertical line drawn at themost likely time (m = 6.0) does not dividethe area under the curve into two equalparts, the probability of completing thisactivity in six time units is not 0.5.
٢١
Probability of the Three Activity Duration Times
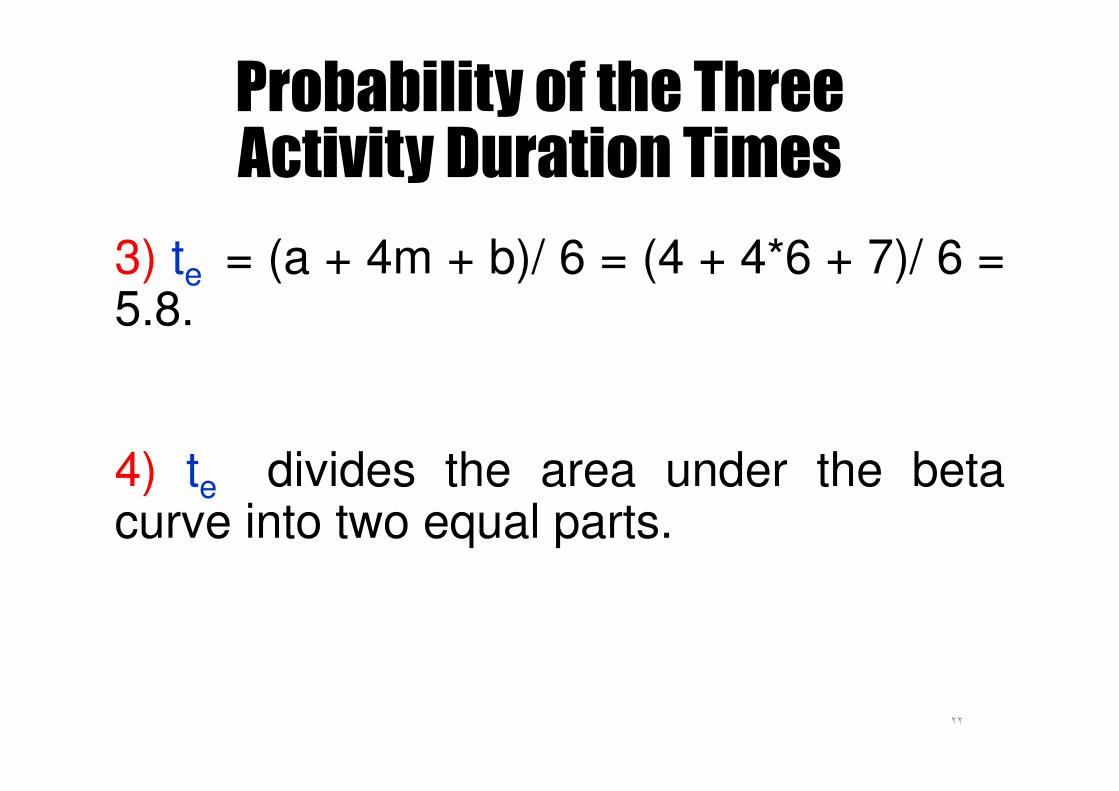
3) te = (a + 4m + b)/ 6 = (4 + 4*6 + 7)/ 6 =5.8.
4) te divides the area under the betacurve into two equal parts.
٢٢
Probability of the Three Activity Duration Times
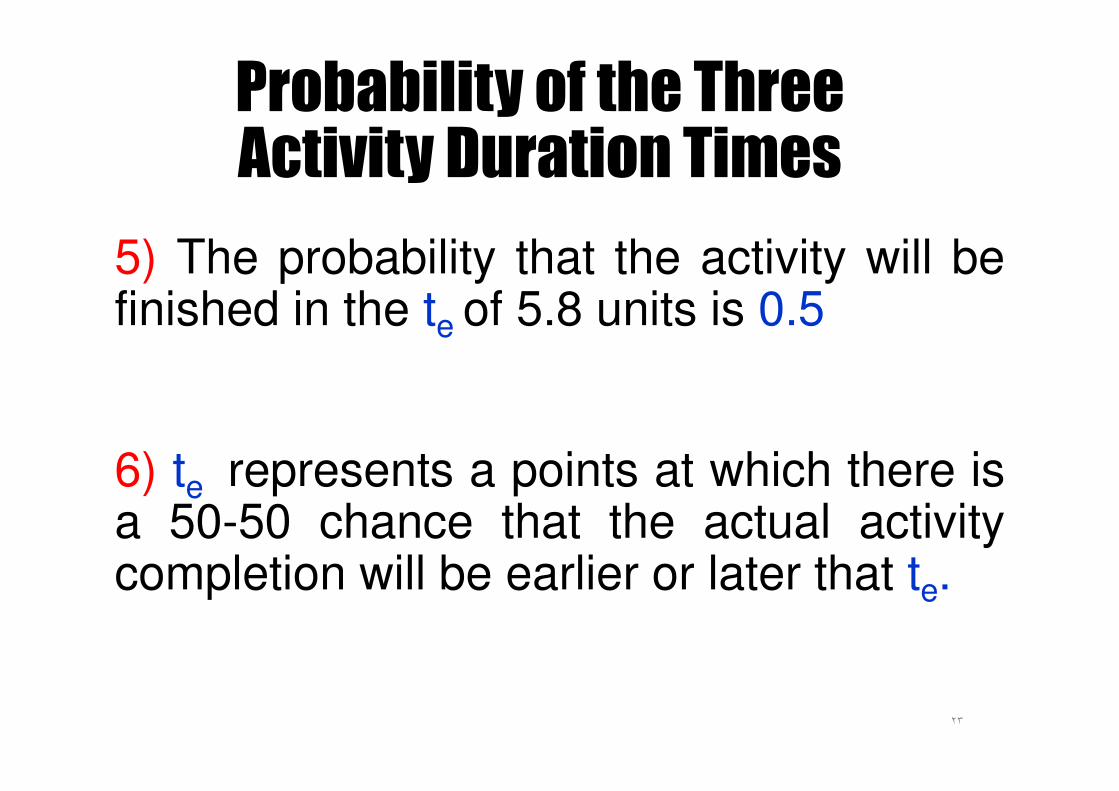
5) The probability that the activity will befinished in the te of 5.8 units is 0.5
6) te represents a points at which there isa 50-50 chance that the actual activitycompletion will be earlier or later that te.
٢٣
Measures of Central Tendency and dispersion
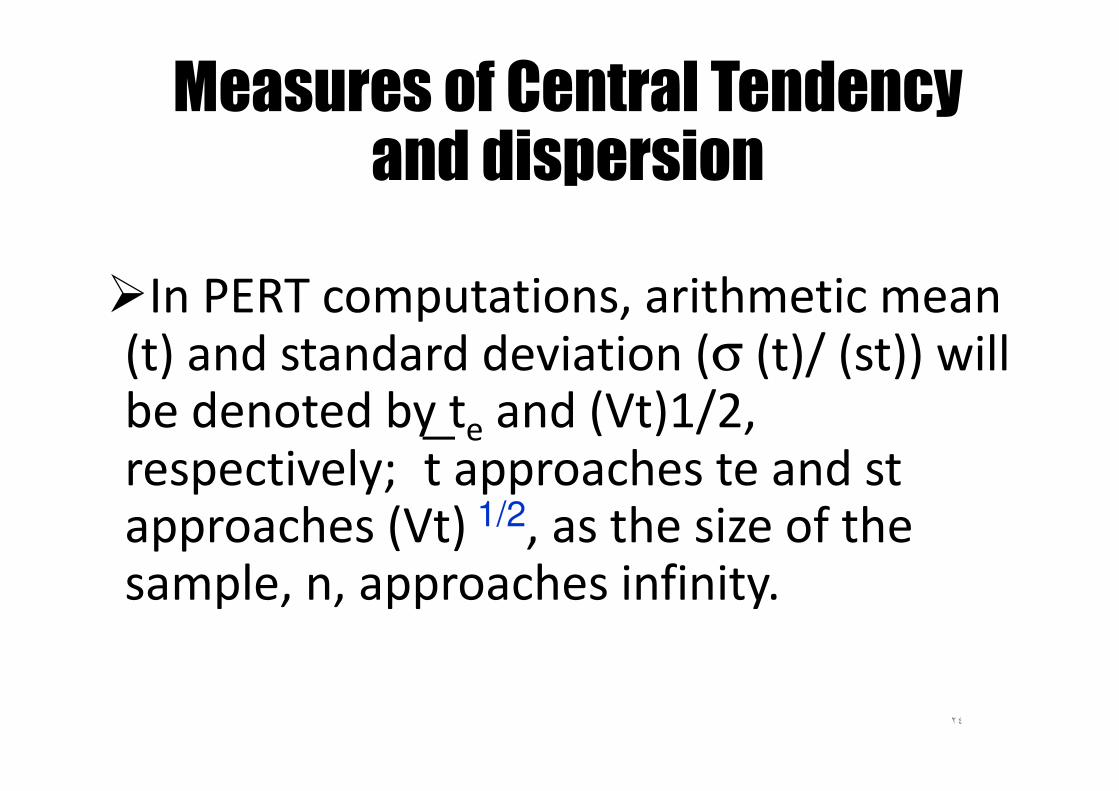
�In PERT computations, arithmetic mean (t) and standard deviation (σ (t)/ (st)) will be denoted by te and (Vt)1/2, respectively;t approaches te and stapproaches (Vt) 1/2, as the size of the sample, n, approaches infinity.
٢٤
Measures of Central Tendency and dispersion
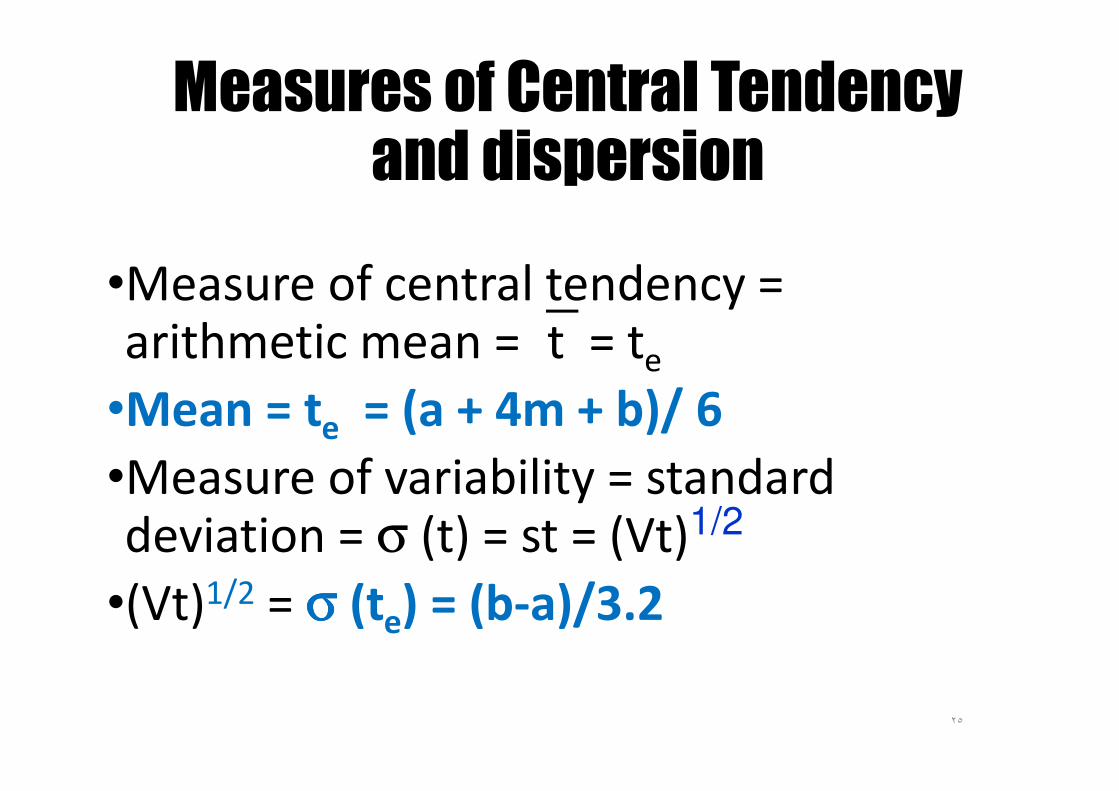
•Measure of central tendency = arithmetic mean =t = te
•Mean = te = (a + 4m + b)/ 6
•Measure of variability = standard deviation = σ (t) = st = (Vt)1/2
•(Vt)1/2 = σσσσ (te) = (b-a)/3.2
٢٥
Measures of Central Tendency and dispersion
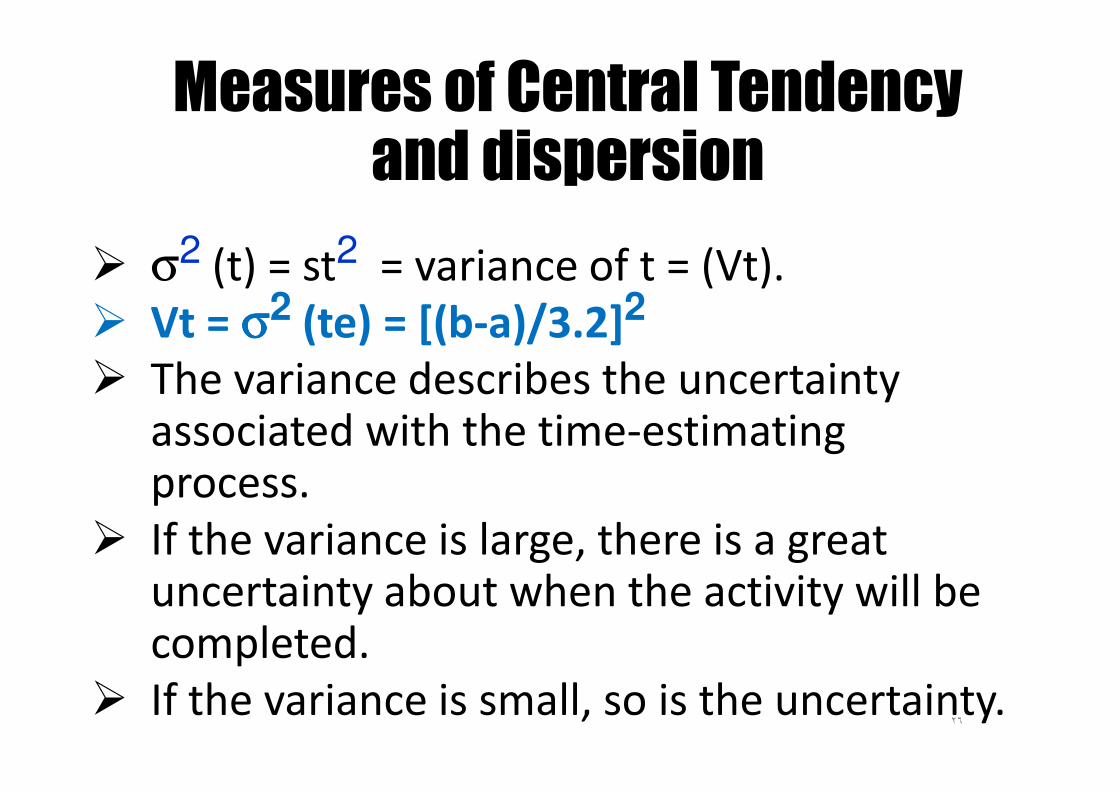
� σ2 (t) = st2 = variance of t = (Vt).
� Vt = σσσσ2 (te) = [(b-a)/3.2]2
� The variance describes the uncertainty associated with the time-estimating process.
� If the variance is large, there is a great uncertainty about when the activity will be completed.
� If the variance is small, so is the uncertainty.٢٦
Project Duration
�When te has been determined for each
activity, project duration (TE) and float can
be determined from te by forward andbackward passes as in a CPM network.
٢٧
Project Duration
�Since the probability is 0.5 that each
activity will finish at its expected time te,there is a probability of 0.5 for the entire
project being finished at time TE.
٢٨
Project Duration
�The expected project duration times do notfollow a beta curve but follow a normaldistribution curve; therefore the expectedproject durations may be assumed normallydistributed.
٢٩
PERT Computations
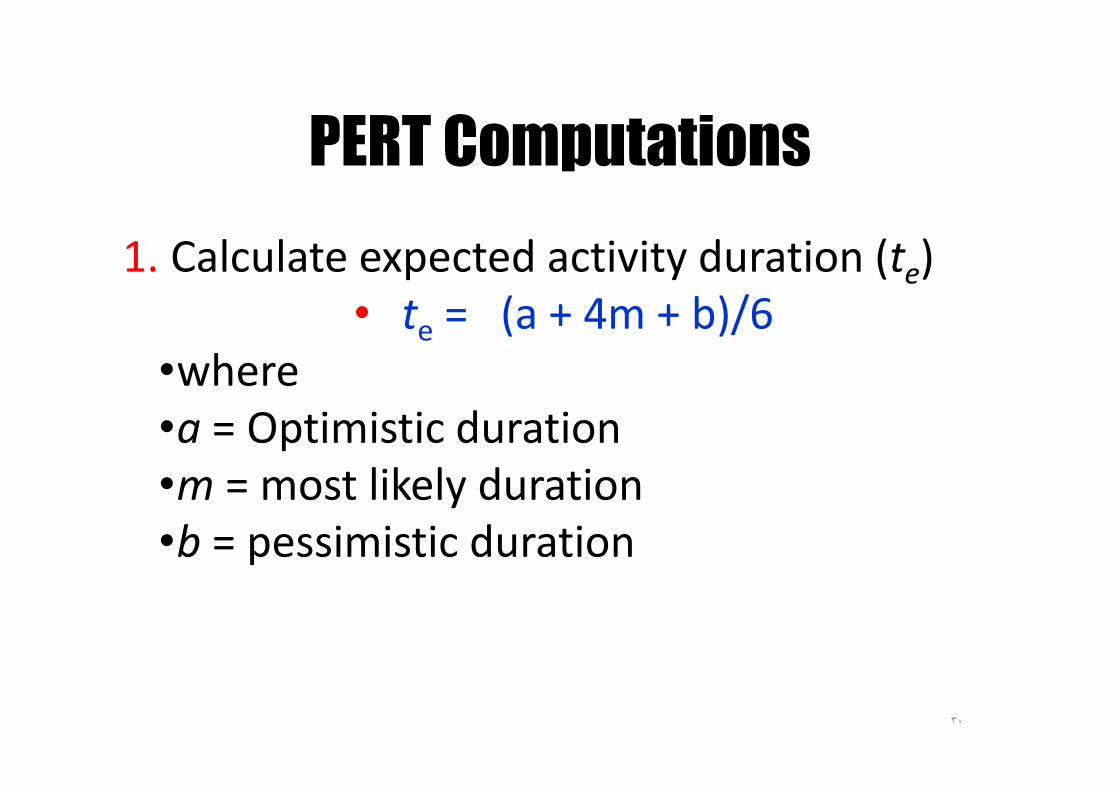
1. Calculate expected activity duration (te)
• te = (a + 4m + b)/6
•where
•a = Optimistic duration
•m = most likely duration
•b = pessimistic duration
٣٠
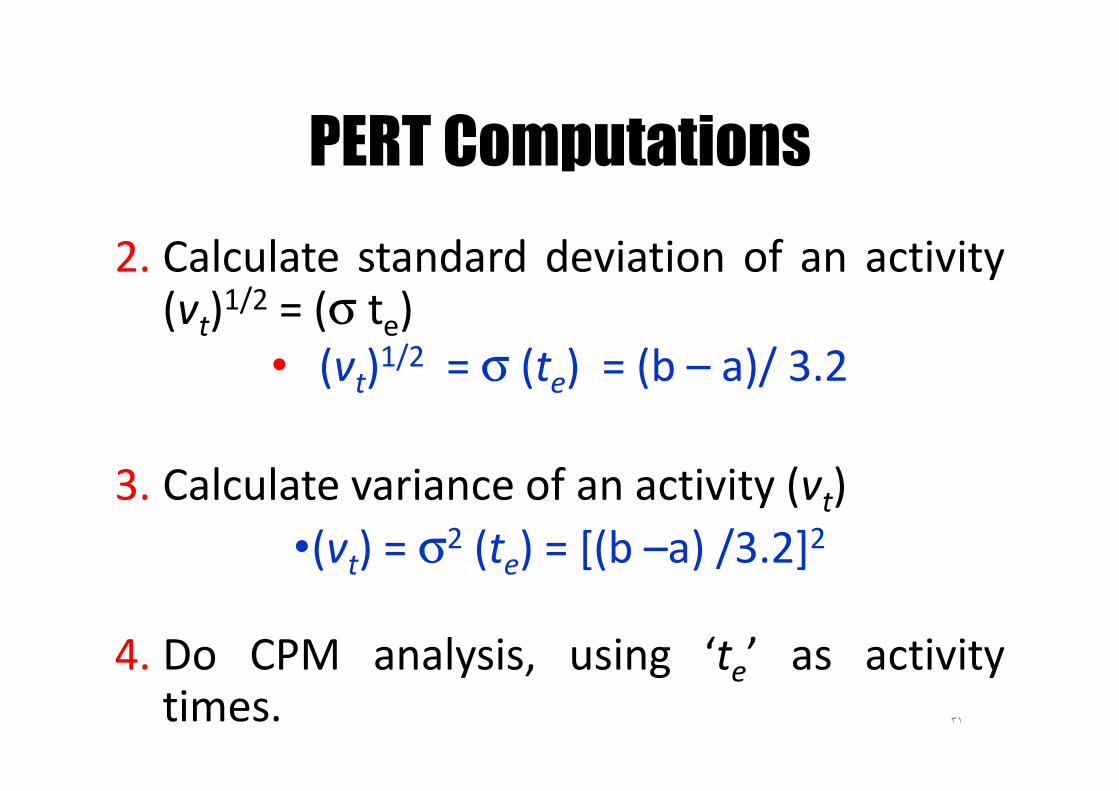
PERT Computations
2. Calculate standard deviation of an activity(vt)
1/2 = (σ te)
• (vt)1/2 = σ (te) = (b – a)/ 3.2
3. Calculate variance of an activity (vt)
•(vt) = σ2 (te) = [(b –a) /3.2]2
4. Do CPM analysis, using ‘te’ as activitytimes. ٣١
PERT Computations
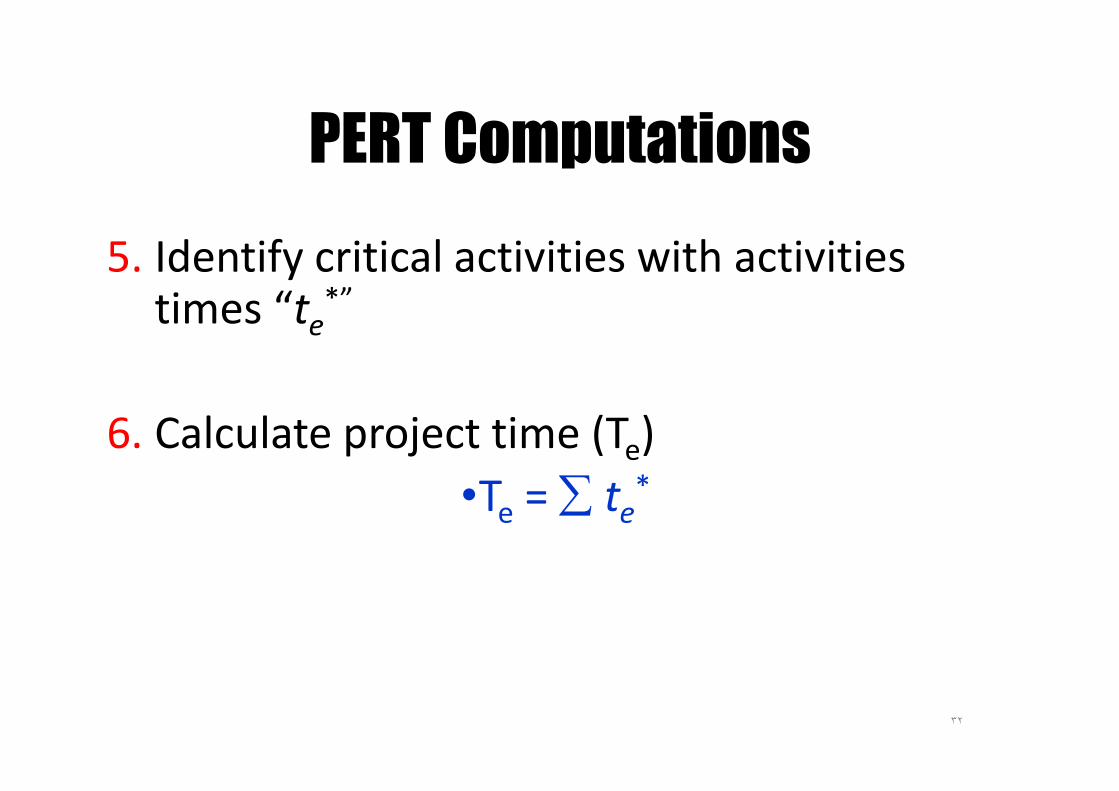
5. Identify critical activities with activities times “te
*”
6. Calculate project time (Te)
•Te = ∑ te*
٣٢
PERT Computations
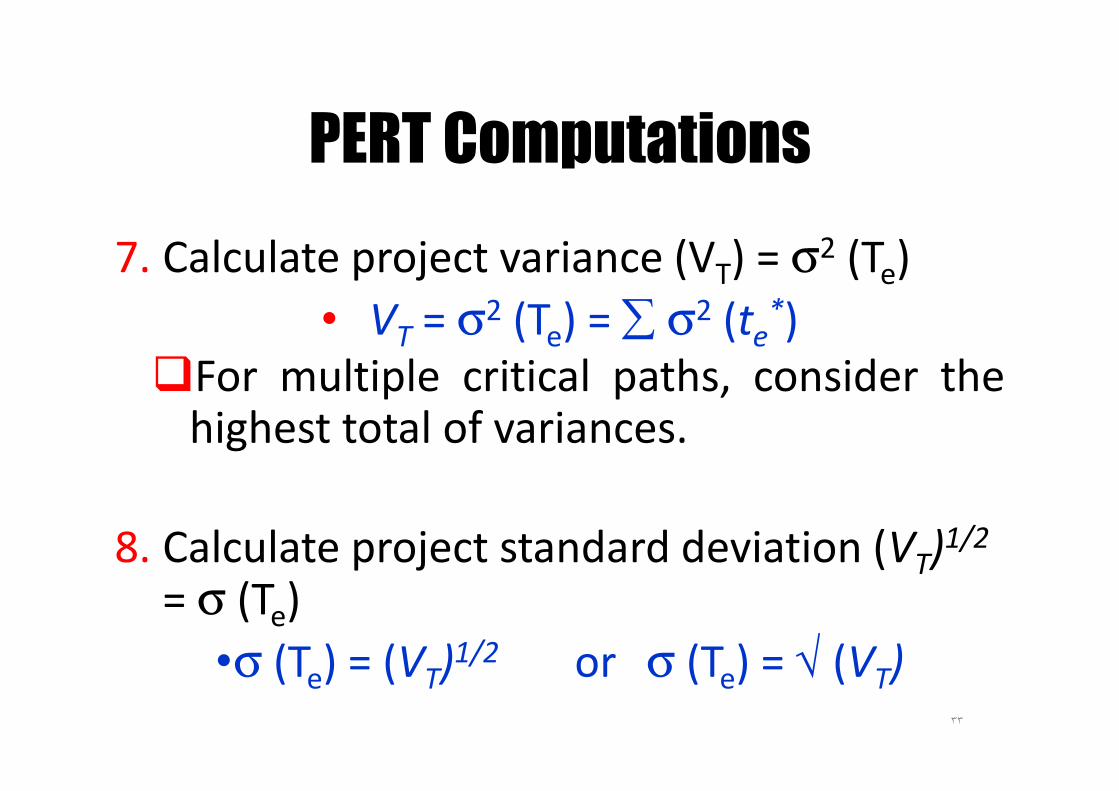
7. Calculate project variance (VT) = σ2 (Te)
• VT = σ2 (Te) = ∑ σ2 (te*)
�For multiple critical paths, consider thehighest total of variances.
8. Calculate project standard deviation (VT)1/2
= σ (Te)
•σ (Te) = (VT)1/2 or σ (Te) = √ (VT)
٣٣
Probability of Meeting a schedule Date
The following steps should beconsidered when computing theprobability of occurrence of anevent, on or before a scheduledtime.
٣٤
Probability of Meeting a schedule Date
1. Make the usual forward andbackward pass computationsbased on a single-time estimate,te , for each activity.
٣٥
Probability of Meeting a schedule Date
2. Suppose one wishes tocompute the probability ofmeeting a specified scheduledtime for event X. Then determinethe “longest path” from the initialevent to the event X.
٣٦
Probability of Meeting a schedule Date
3. Compute the variance for eventX, (VT), by summing the variancesfor the activities listed in Step 2.VT = sum of values of [(b –a) /3.2]2
, for each activity on the “longestpath” leading to event X.
٣٧
Probability of Meeting a schedule Date
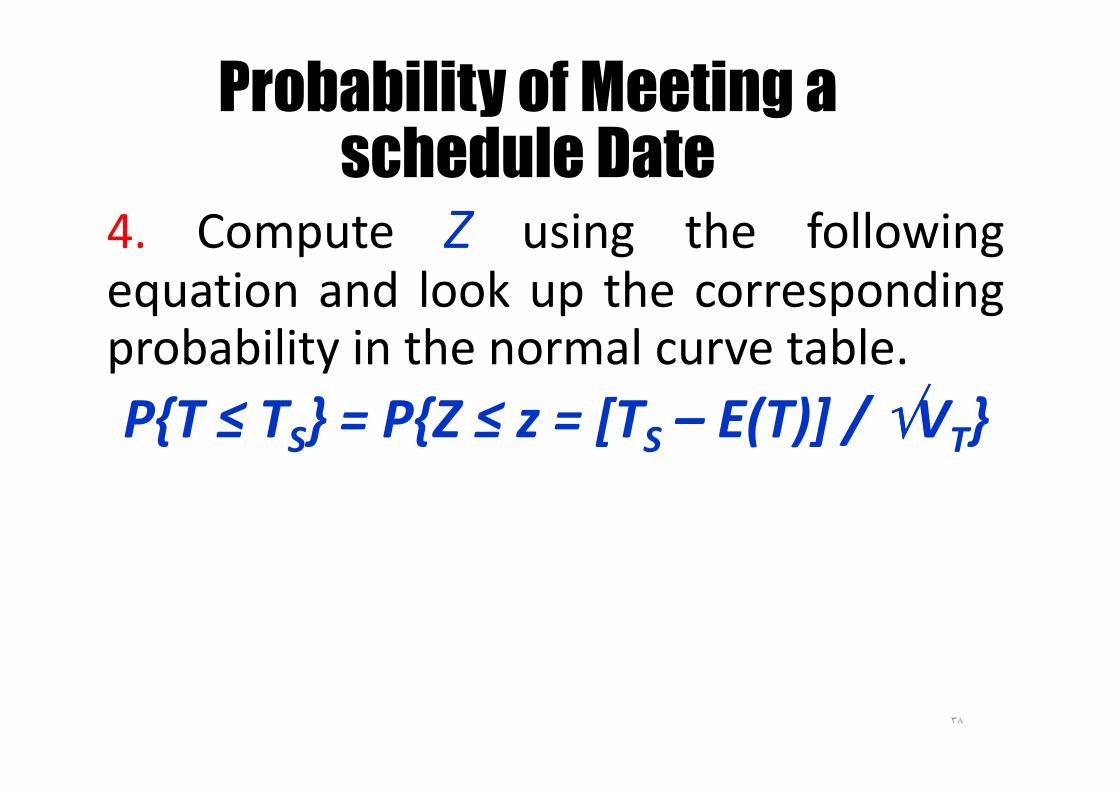
4. Compute Z using the followingequation and look up the correspondingprobability in the normal curve table.
P{T ≤ TS} = P{Z ≤ z = [TS – E(T)] / √√√√VT}
٣٨
Probability of Meeting a schedule Date
4. (cont.)
�A value of Z = 1.25 (e.g.) indicates that
the scheduled time, TS , is 1.25standard deviations greater than the
expected time, Te .
� It is essential that the correct sign is
placed on the Z.
٣٩
Example
٤٠
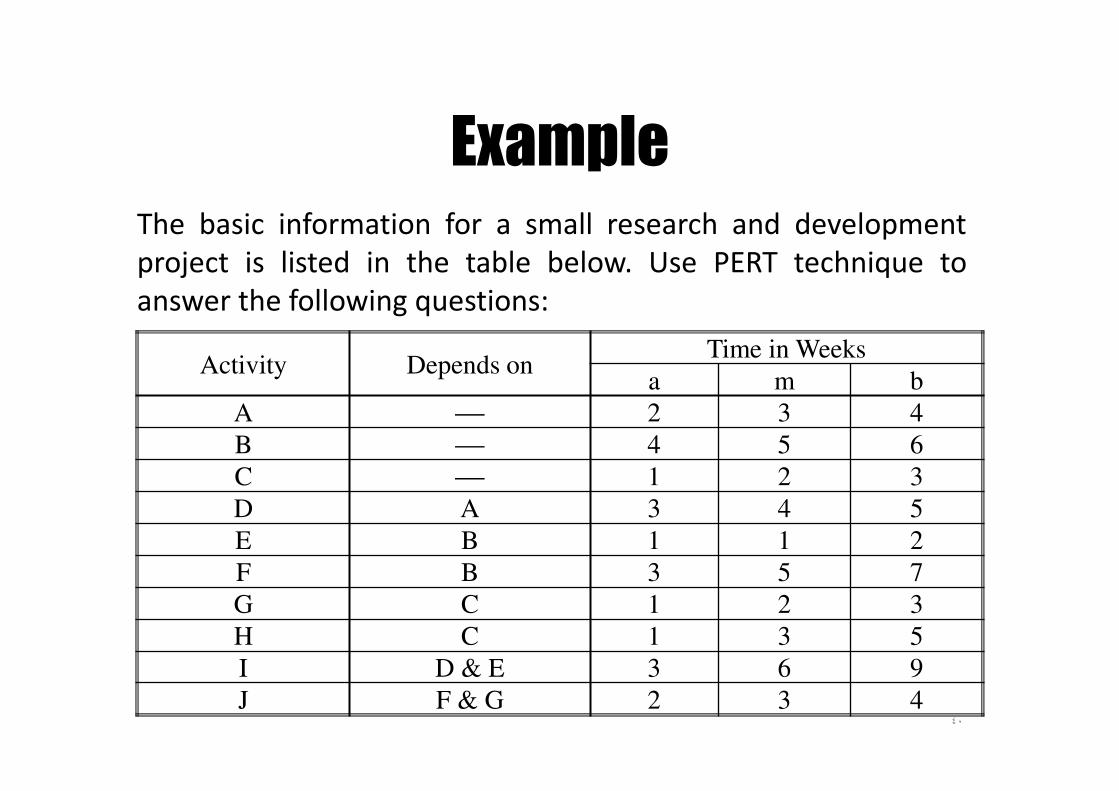
The basic information for a small research and development
project is listed in the table below. Use PERT technique to
answer the following questions:
Activity Depends onTime in Weeks
a m b
A 2 3 4
B 4 5 6
C 1 2 3
D A 3 4 5
E B 1 1 2
F B 3 5 7
G C 1 2 3
H C 1 3 5
I D & E 3 6 9
J F & G 2 3 4
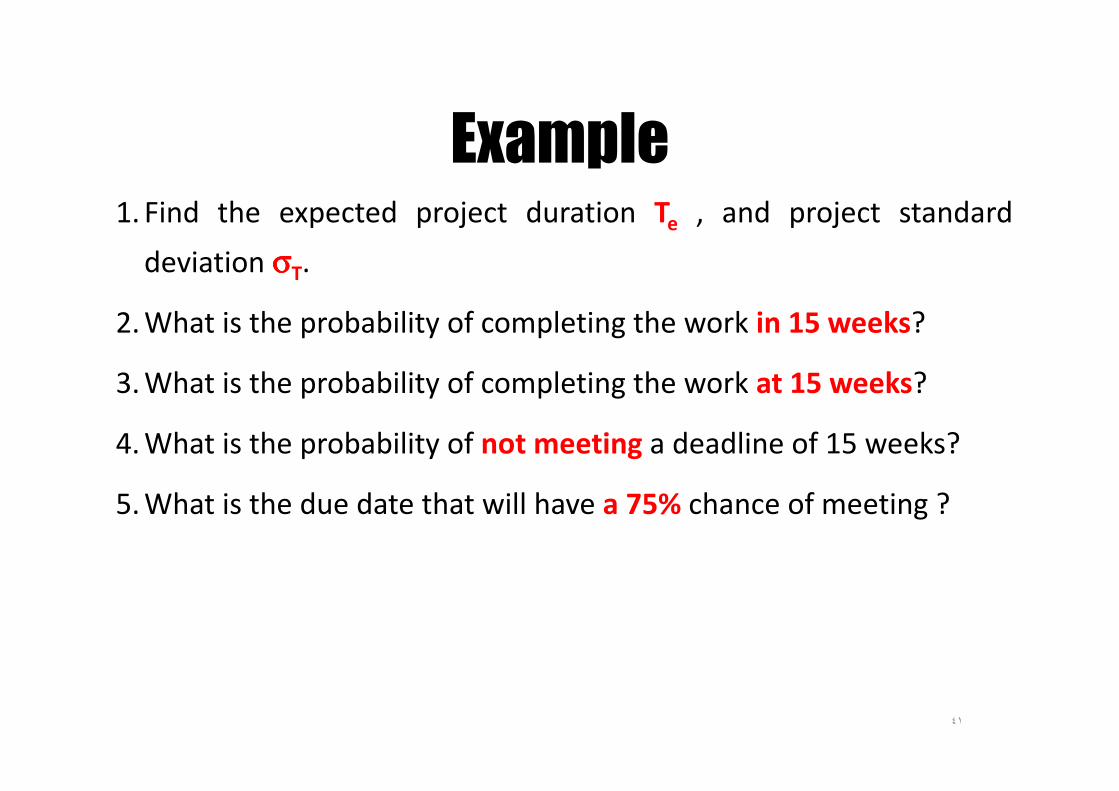
Example1. Find the expected project duration Te , and project standard
deviation σσσσT.
2. What is the probability of completing the work in 15 weeks?
3. What is the probability of completing the work at 15 weeks?
4. What is the probability of not meeting a deadline of 15 weeks?
5. What is the due date that will have a 75% chance of meeting ?
٤١
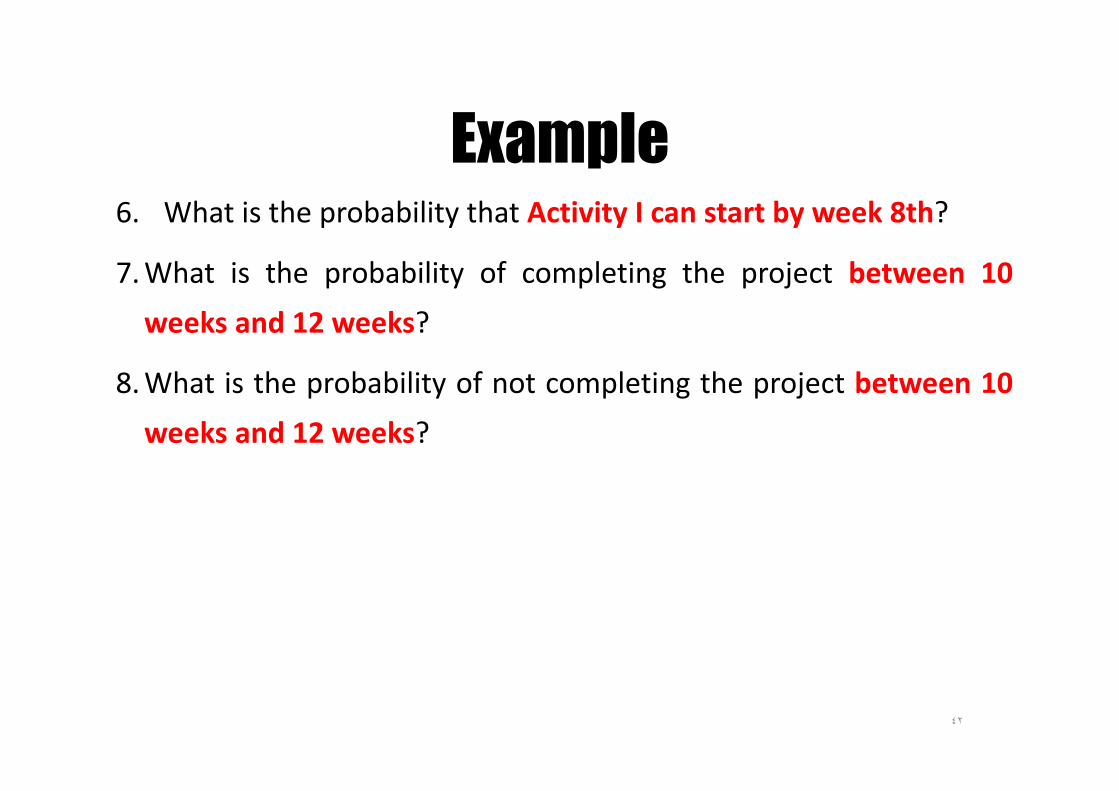
Example6. What is the probability that Activity I can start by week 8th?
7. What is the probability of completing the project between 10
weeks and 12 weeks?
8. What is the probability of not completing the project between 10
weeks and 12 weeks?
٤٢
Example
٤٣
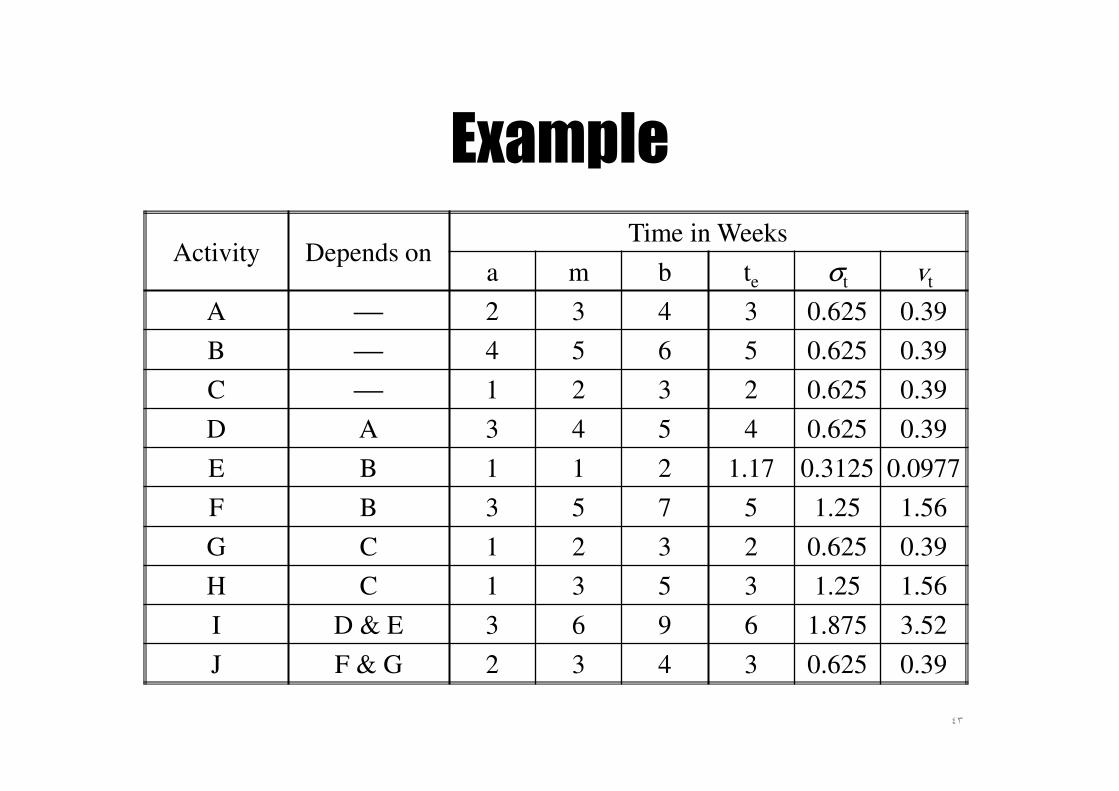
Activity Depends onTime in Weeks
a m b te σt vt
A 2 3 4 3 0.625 0.39
B 4 5 6 5 0.625 0.39
C 1 2 3 2 0.625 0.39
D A 3 4 5 4 0.625 0.39
E B 1 1 2 1.17 0.3125 0.0977
F B 3 5 7 5 1.25 1.56
G C 1 2 3 2 0.625 0.39
H C 1 3 5 3 1.25 1.56
I D & E 3 6 9 6 1.875 3.52
J F & G 2 3 4 3 0.625 0.39
Example
٤٤
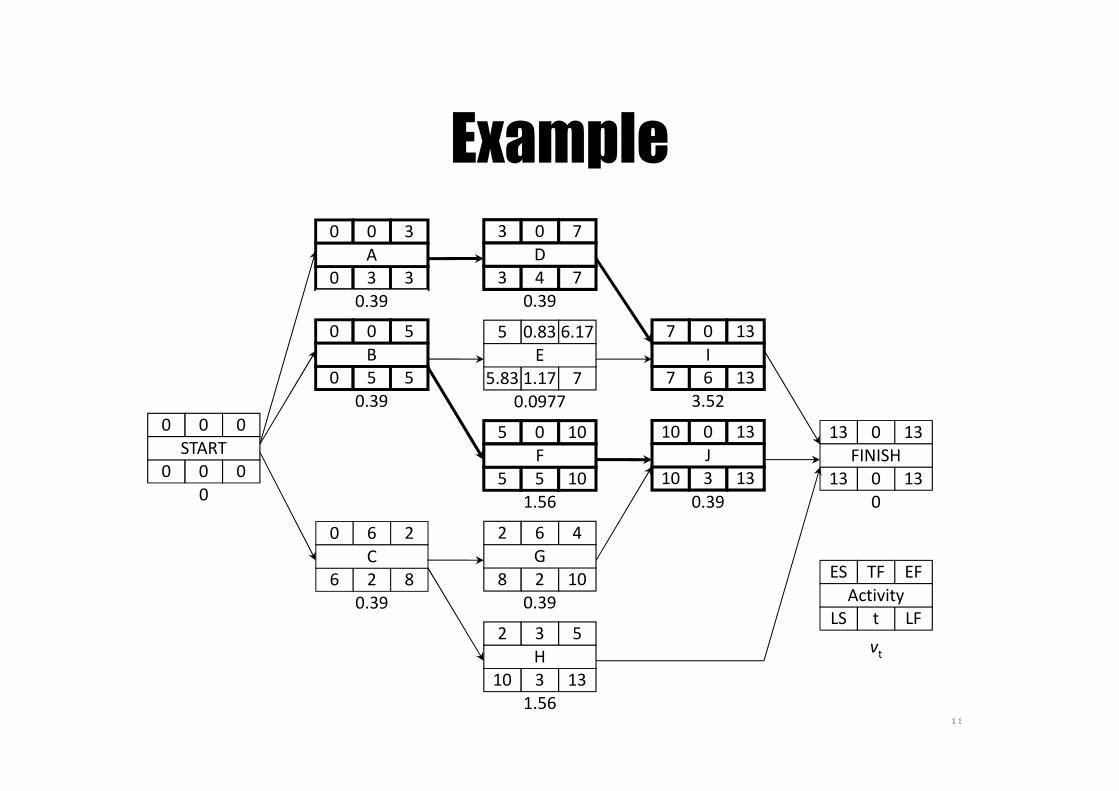
0 0 3
0 3 3
A
0.39
0
0 0 0
0 0 0
START
0.39
0 0 5
0 5 5
B
0.39
0 6 2
6 2 8
C
0.39
3 0 7
3 4 7
D
0.39
2 6 4
8 2 10
G
1.56
5 0 10
5 5 10
F
0.0977
5 0.83 6.17
5.83 1.17 7
E
3.52
7 0 13
7 6 13
I
0.39
10 0 13
10 3 13
J
0
13 0 13
13 0 13
FINISH
1.56
2 3 5
10 3 13
H
ES TF EF
LS t LF
Activity
vt
Example
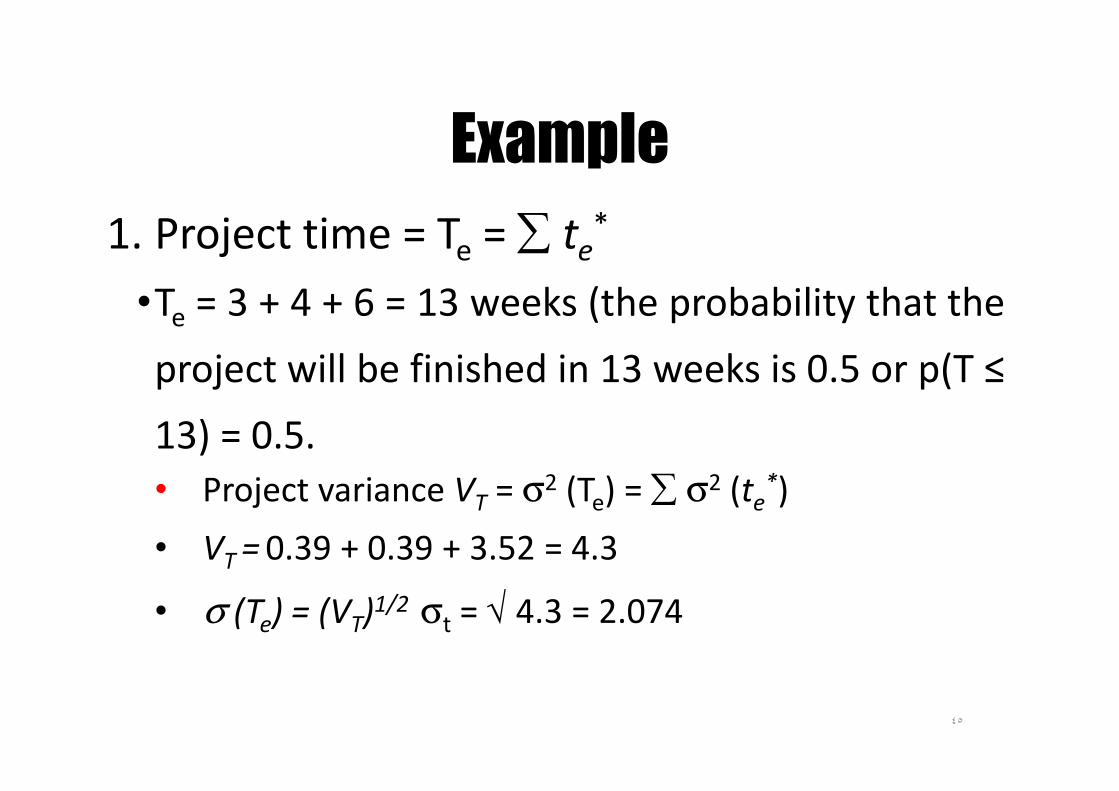
1. Project time = Te = ∑ te*
•Te = 3 + 4 + 6 = 13 weeks (the probability that the
project will be finished in 13 weeks is 0.5 or p(T ≤
13) = 0.5.
• Project variance VT = σ2 (Te) = ∑ σ2 (te*)
• VT = 0.39 + 0.39 + 3.52 = 4.3
• σ (Te) = (VT)1/2 σt = √ 4.3 = 2.074
٤٥
Example
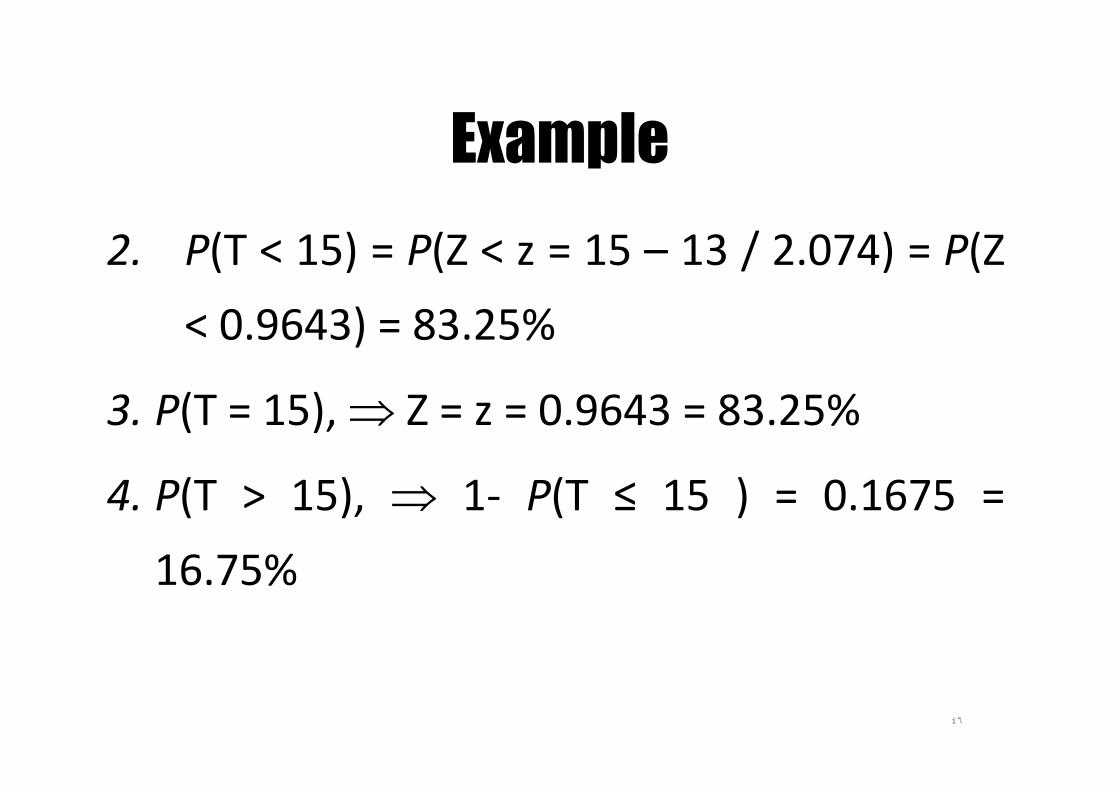
2. P(T < 15) = P(Z < z = 15 – 13 / 2.074) = P(Z
< 0.9643) = 83.25%
3. P(T = 15), ⇒ Z = z = 0.9643 = 83.25%
4. P(T > 15), ⇒ 1- P(T ≤ 15 ) = 0.1675 =
16.75%
٤٦
Example
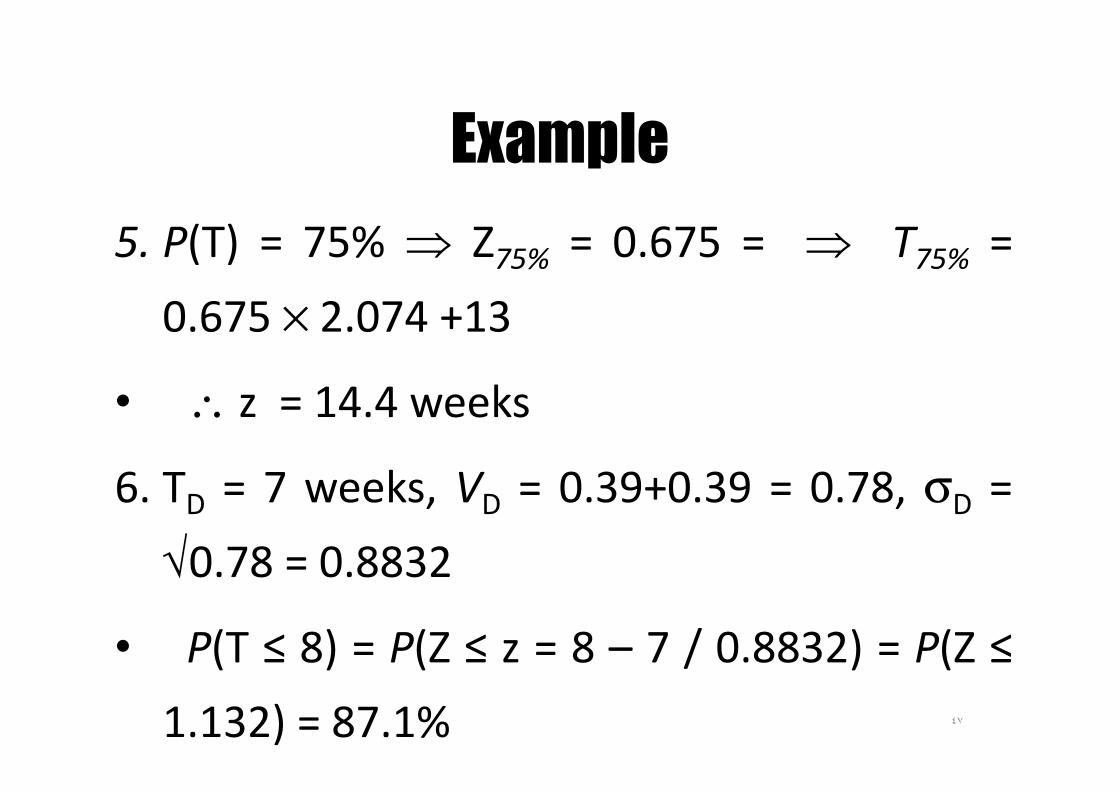
5. P(T) = 75% ⇒ Z75% = 0.675 = ⇒ T75% =
0.675 × 2.074 +13
• ∴ z = 14.4 weeks
6. TD = 7 weeks, VD = 0.39+0.39 = 0.78, σD =
√0.78 = 0.8832
• P(T ≤ 8) = P(Z ≤ z = 8 – 7 / 0.8832) = P(Z ≤
1.132) = 87.1% ٤٧
Example
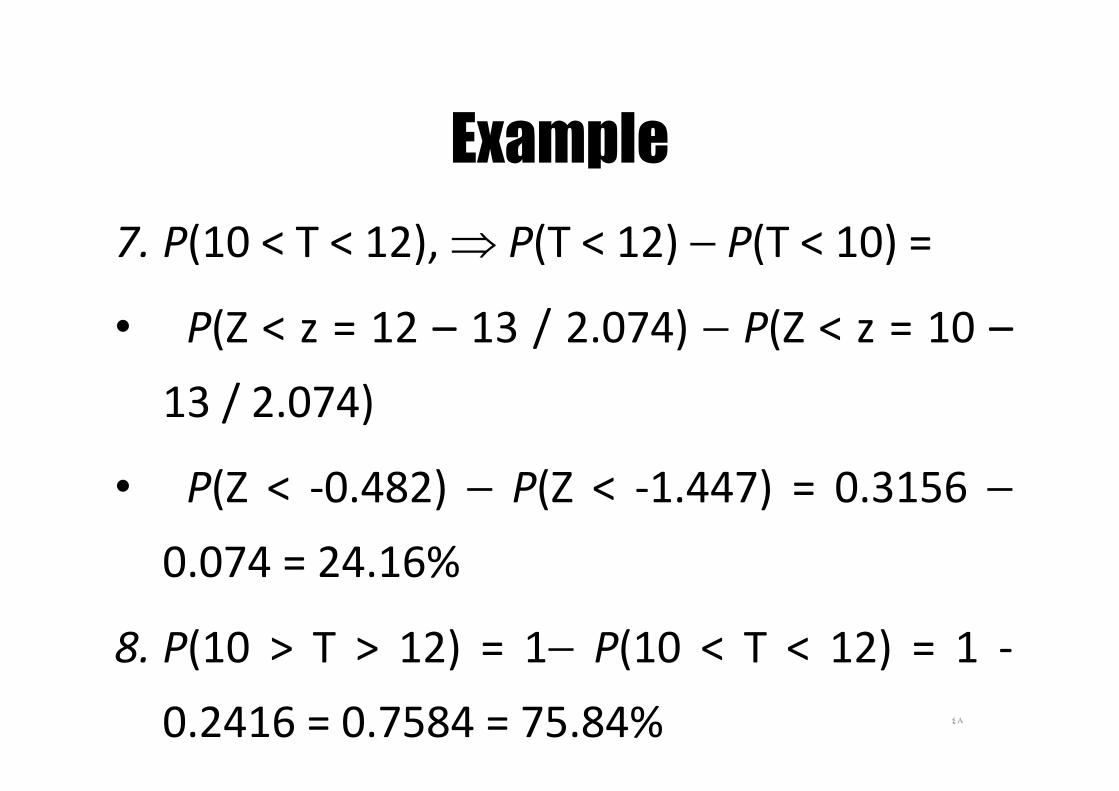
7. P(10 < T < 12), ⇒ P(T < 12) − P(T < 10) =
• P(Z < z = 12 – 13 / 2.074) − P(Z < z = 10 –
13 / 2.074)
• P(Z < -0.482) − P(Z < -1.447) = 0.3156 −
0.074 = 24.16%
8. P(10 > T > 12) = 1− P(10 < T < 12) = 1 -
0.2416 = 0.7584 = 75.84% ٤٨
Example
٤٩
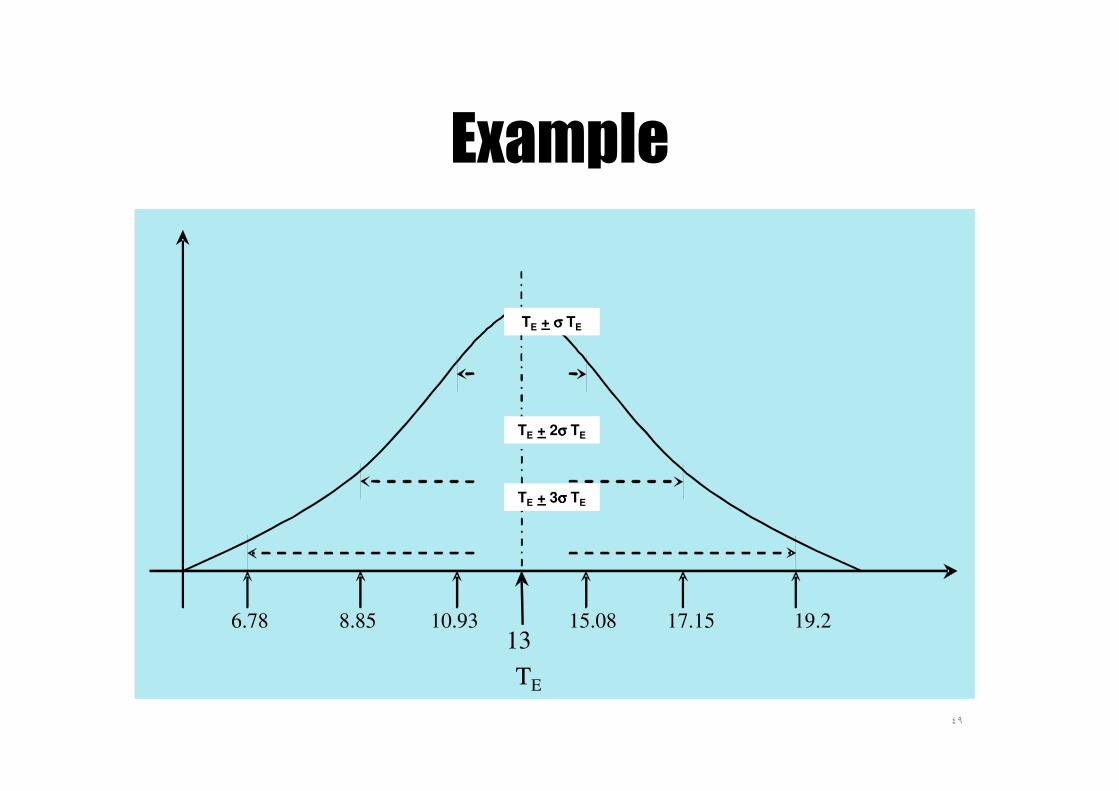
6.78 8.85 10.93 15.08 17.15 19.213
TE
TE + σσσσ TE
TE + 2σσσσ TE
TE + 3σσσσ TE
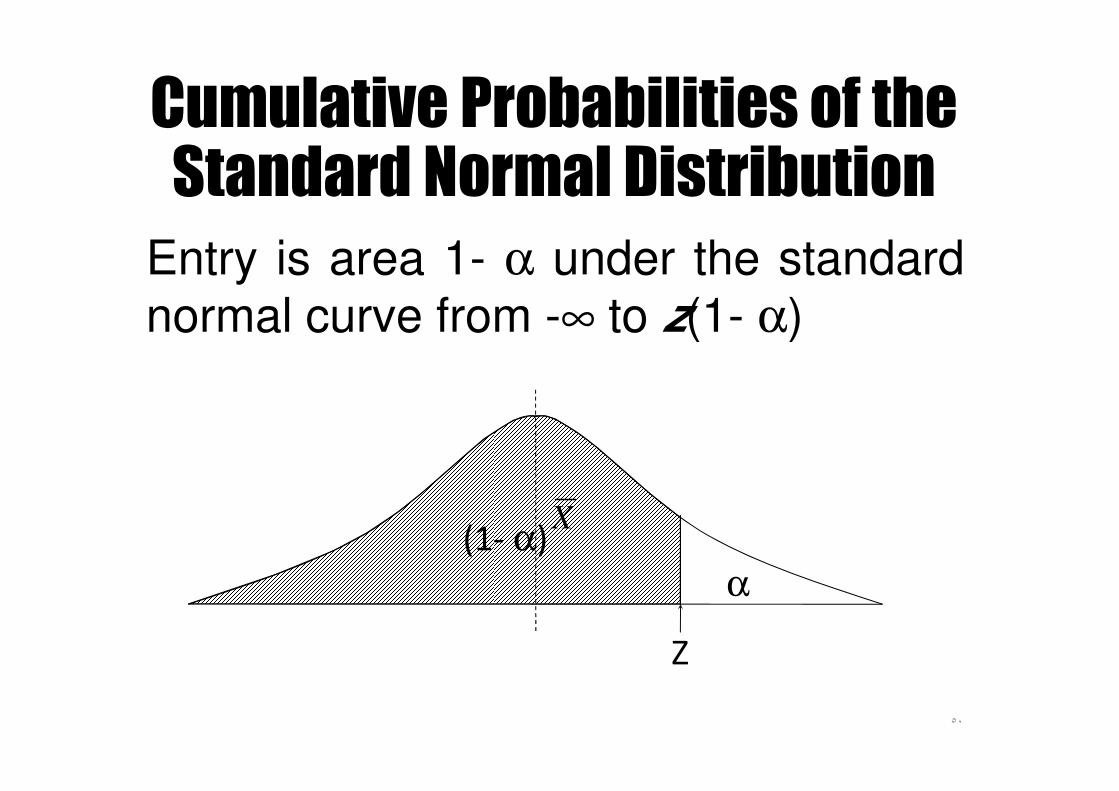
Cumulative Probabilities of the Standard Normal Distribution
٥٠
Entry is area 1- α under the standard
normal curve from -∞ to z(1- α)
(1- α)
Z
α
X
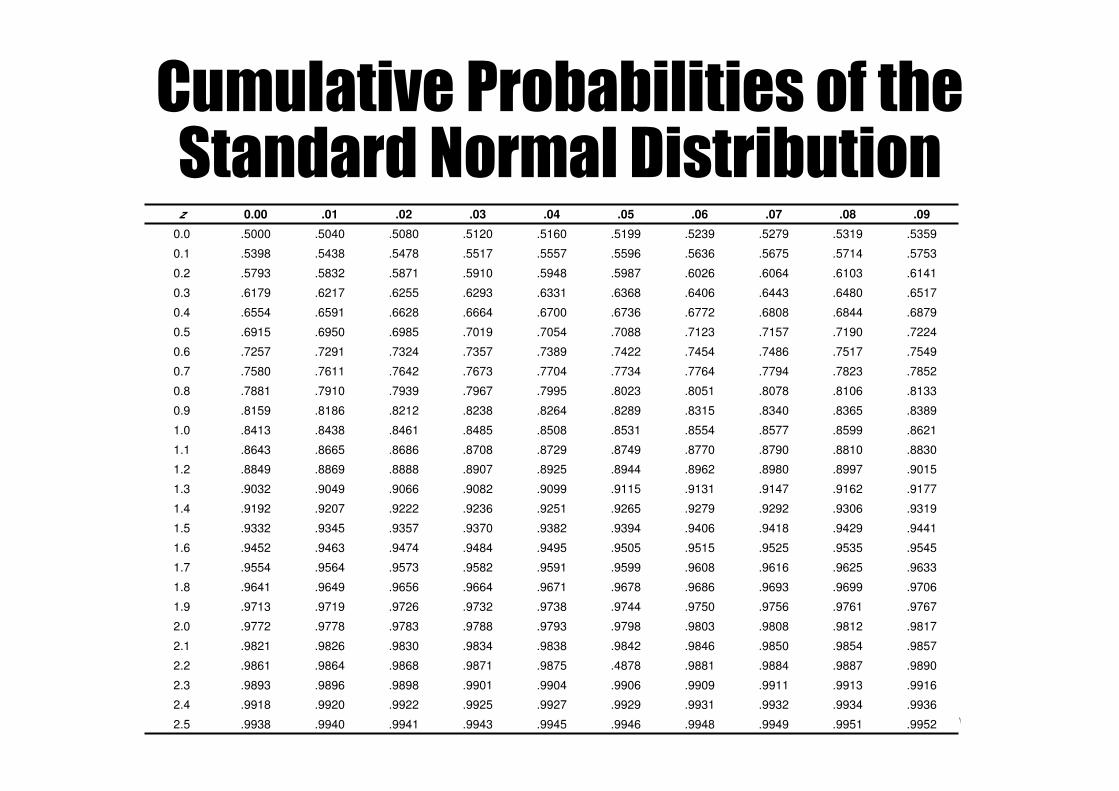
Cumulative Probabilities of the Standard Normal Distribution
٥١
z 0.00 .01 .02 .03 .04 .05 .06 .07 .08 .09
0.0 .5000 .5040 .5080 .5120 .5160 .5199 .5239 .5279 .5319 .5359
0.1 .5398 .5438 .5478 .5517 .5557 .5596 .5636 .5675 .5714 .5753
0.2 .5793 .5832 .5871 .5910 .5948 .5987 .6026 .6064 .6103 .6141
0.3 .6179 .6217 .6255 .6293 .6331 .6368 .6406 .6443 .6480 .6517
0.4 .6554 .6591 .6628 .6664 .6700 .6736 .6772 .6808 .6844 .6879
0.5 .6915 .6950 .6985 .7019 .7054 .7088 .7123 .7157 .7190 .7224
0.6 .7257 .7291 .7324 .7357 .7389 .7422 .7454 .7486 .7517 .7549
0.7 .7580 .7611 .7642 .7673 .7704 .7734 .7764 .7794 .7823 .7852
0.8 .7881 .7910 .7939 .7967 .7995 .8023 .8051 .8078 .8106 .8133
0.9 .8159 .8186 .8212 .8238 .8264 .8289 .8315 .8340 .8365 .8389
1.0 .8413 .8438 .8461 .8485 .8508 .8531 .8554 .8577 .8599 .8621
1.1 .8643 .8665 .8686 .8708 .8729 .8749 .8770 .8790 .8810 .8830
1.2 .8849 .8869 .8888 .8907 .8925 .8944 .8962 .8980 .8997 .9015
1.3 .9032 .9049 .9066 .9082 .9099 .9115 .9131 .9147 .9162 .9177
1.4 .9192 .9207 .9222 .9236 .9251 .9265 .9279 .9292 .9306 .9319
1.5 .9332 .9345 .9357 .9370 .9382 .9394 .9406 .9418 .9429 .9441
1.6 .9452 .9463 .9474 .9484 .9495 .9505 .9515 .9525 .9535 .9545
1.7 .9554 .9564 .9573 .9582 .9591 .9599 .9608 .9616 .9625 .9633
1.8 .9641 .9649 .9656 .9664 .9671 .9678 .9686 .9693 .9699 .9706
1.9 .9713 .9719 .9726 .9732 .9738 .9744 .9750 .9756 .9761 .9767
2.0 .9772 .9778 .9783 .9788 .9793 .9798 .9803 .9808 .9812 .9817
2.1 .9821 .9826 .9830 .9834 .9838 .9842 .9846 .9850 .9854 .9857
2.2 .9861 .9864 .9868 .9871 .9875 .4878 .9881 .9884 .9887 .9890
2.3 .9893 .9896 .9898 .9901 .9904 .9906 .9909 .9911 .9913 .9916
2.4 .9918 .9920 .9922 .9925 .9927 .9929 .9931 .9932 .9934 .9936
2.5 .9938 .9940 .9941 .9943 .9945 .9946 .9948 .9949 .9951 .9952