Embed Size (px)
Citation preview
ProjectionsProjections
• Goal: translate places on the Earth (3D) to Cartesian coordinates (2D)
Map Projections
• The systematic transformation of points on the Earth’s surface to corresponding points on a plane surface.– Map projections always introduce some type
of distortion– selection of a projection is done to minimize
distortion for the particular application
Creating maps– we must choose an appropriate projection for
the map to communicate effectively– part of good cartographic design
Sharing/receiving geographic
data– along with datum, coordinate system, we must
know the map projection in which the data are stored
– Then we’re able to overlay maps from originally different projections
Why do we need a projection?
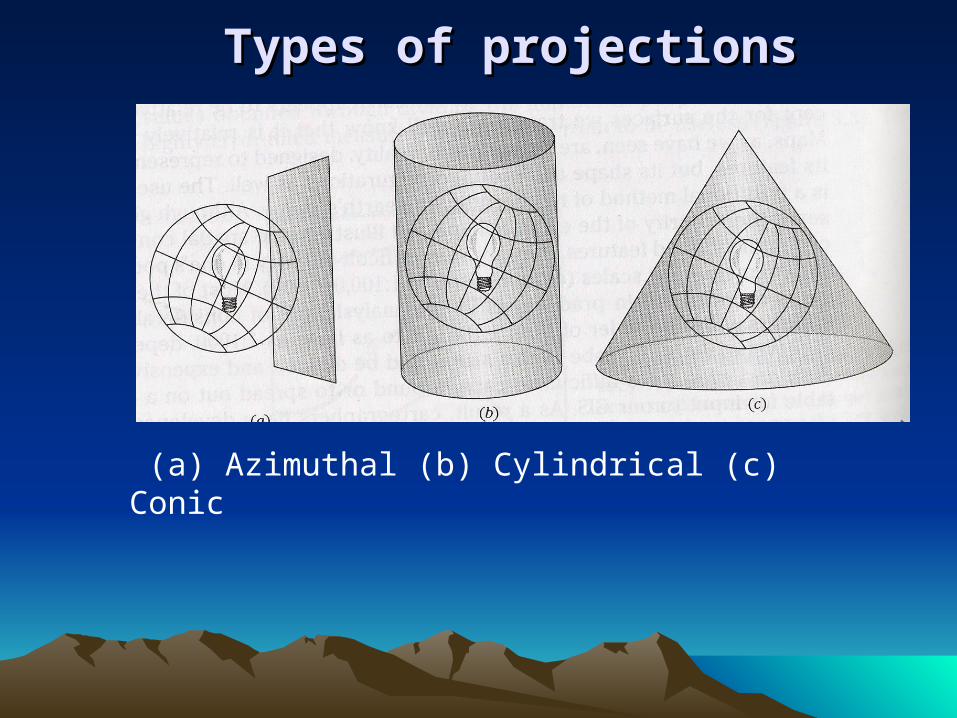
Types of projectionsTypes of projections
(a) Azimuthal (b) Cylindrical (c) Conic
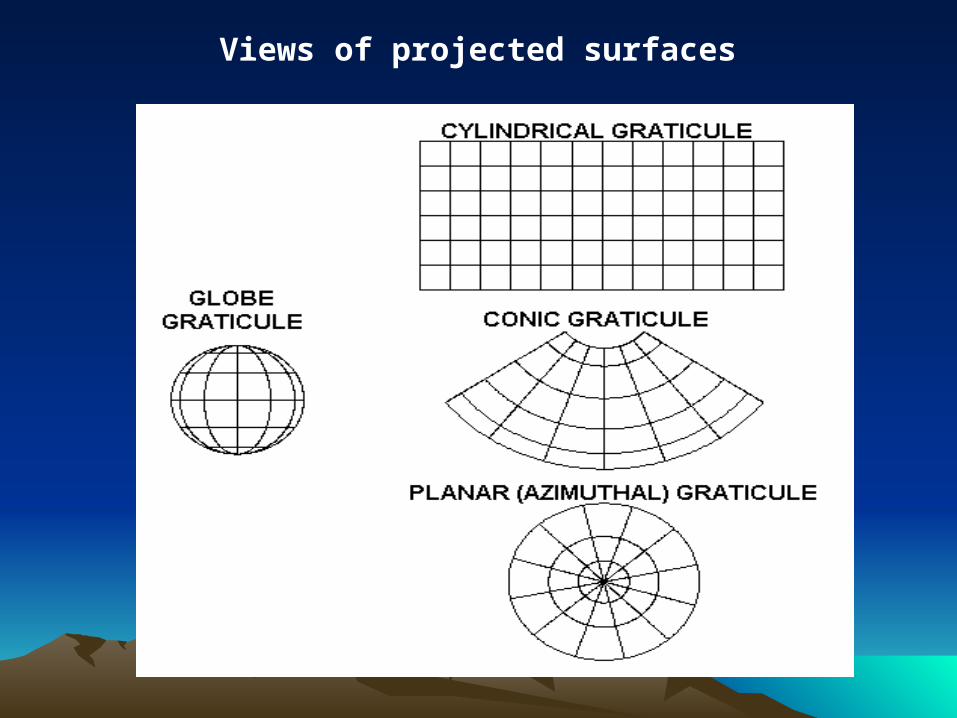
Views of projected surfaces
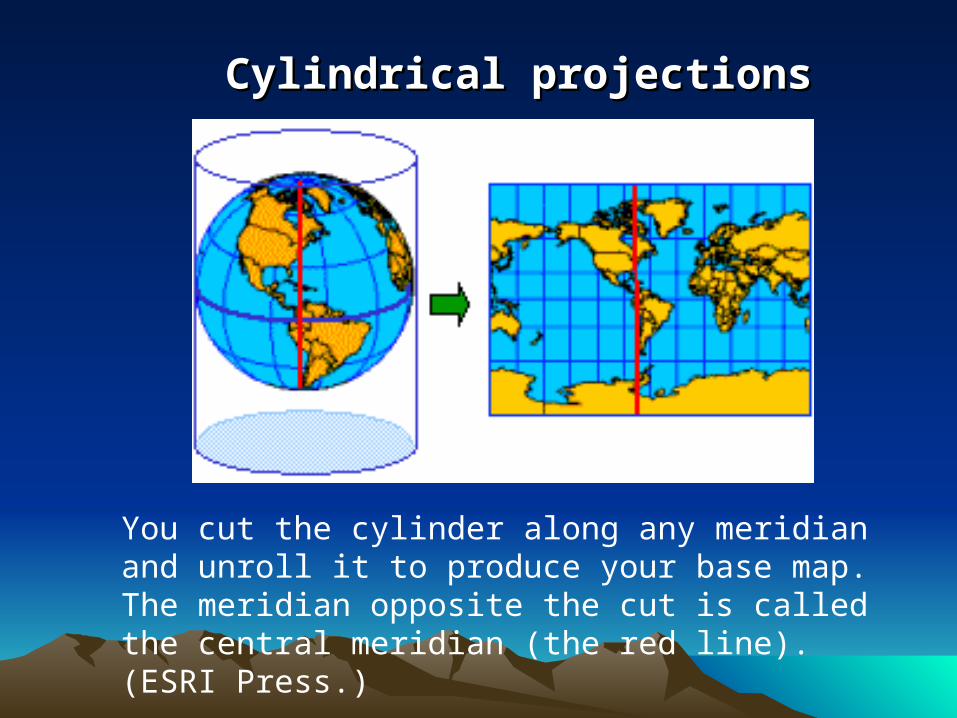
Cylindrical projectionsCylindrical projections
You cut the cylinder along any meridian and unroll it to produce your base map. The meridian opposite the cut is called the central meridian (the red line). (ESRI Press.)
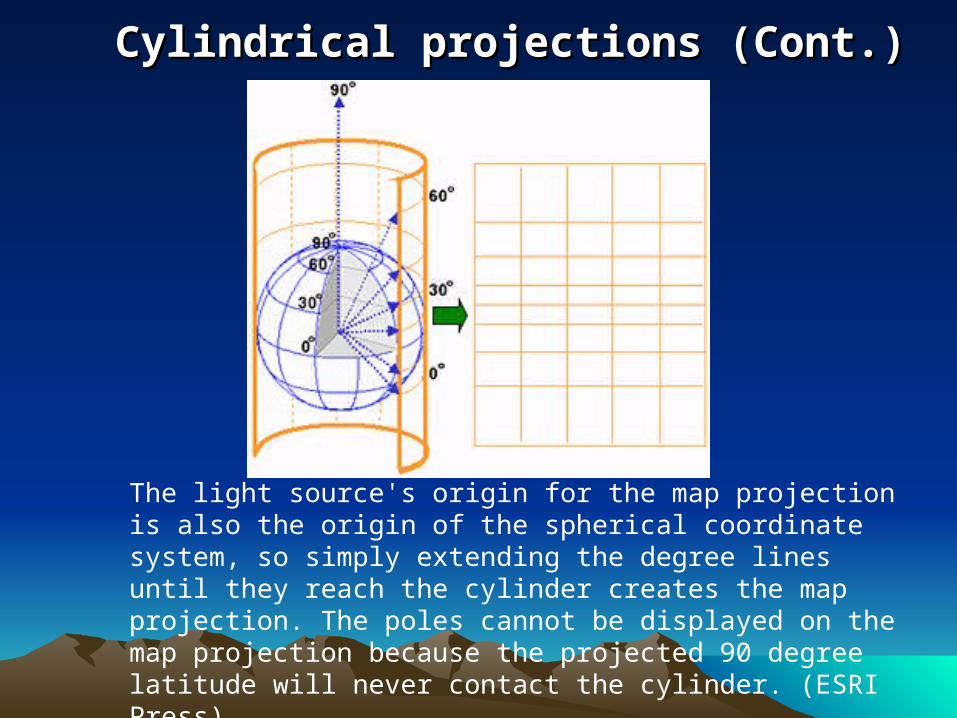
Cylindrical projections (Cont.)Cylindrical projections (Cont.)
The light source's origin for the map projection is also the origin of the spherical coordinate system, so simply extending the degree lines until they reach the cylinder creates the map projection. The poles cannot be displayed on the map projection because the projected 90 degree latitude will never contact the cylinder. (ESRI Press)
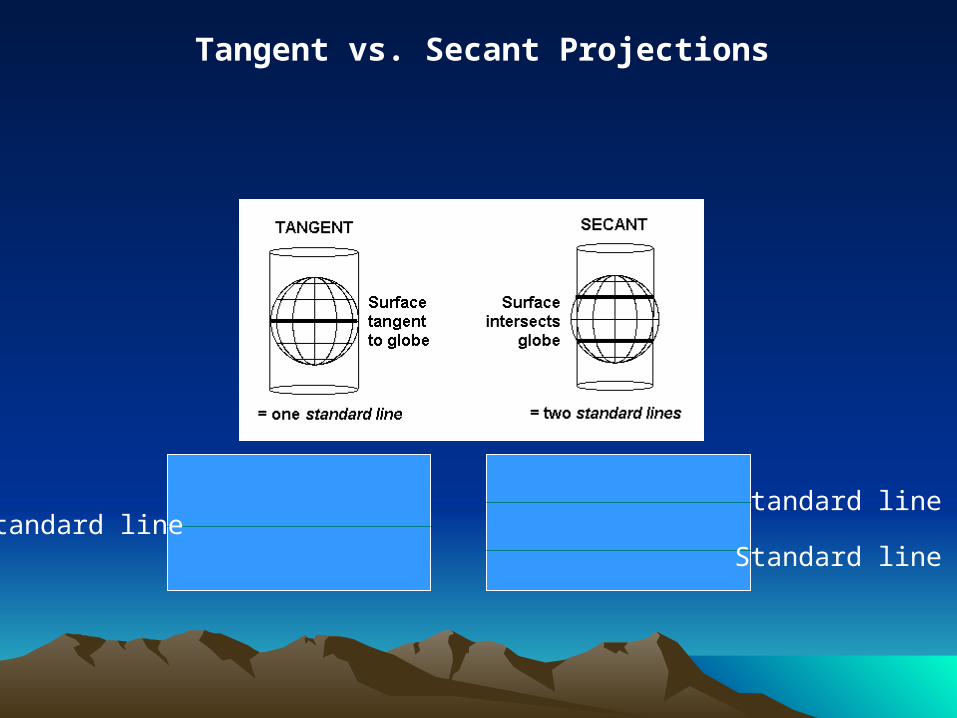
Tangent vs. Secant Projections
Standard line
Standard lineStandard line
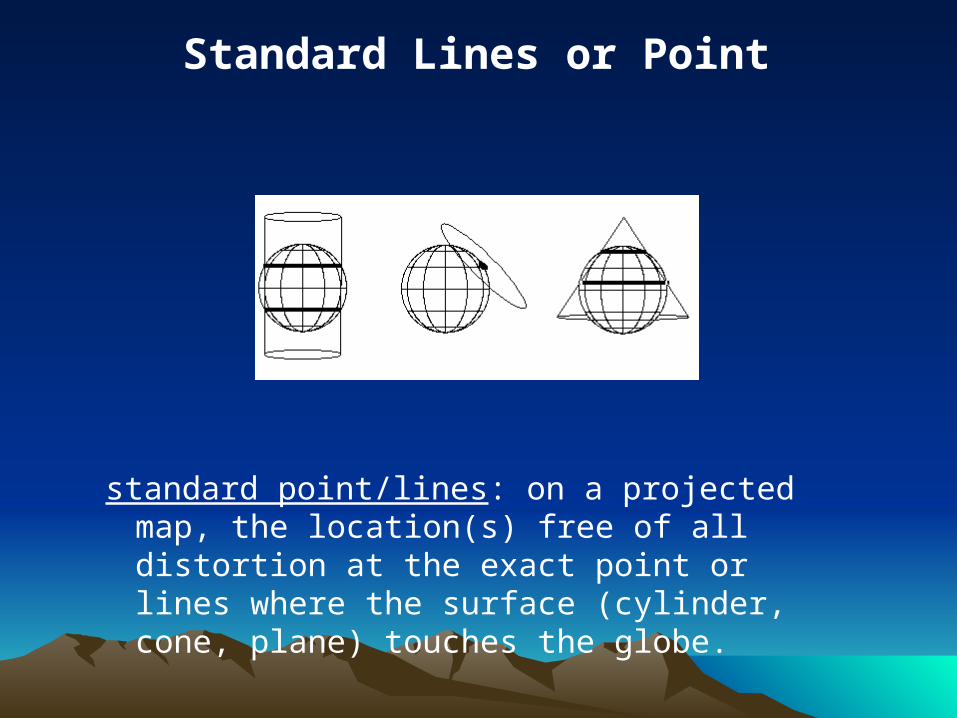
standard point/lines: on a projected map, the location(s) free of all distortion at the exact point or lines where the surface (cylinder, cone, plane) touches the globe.
Standard Lines or Point
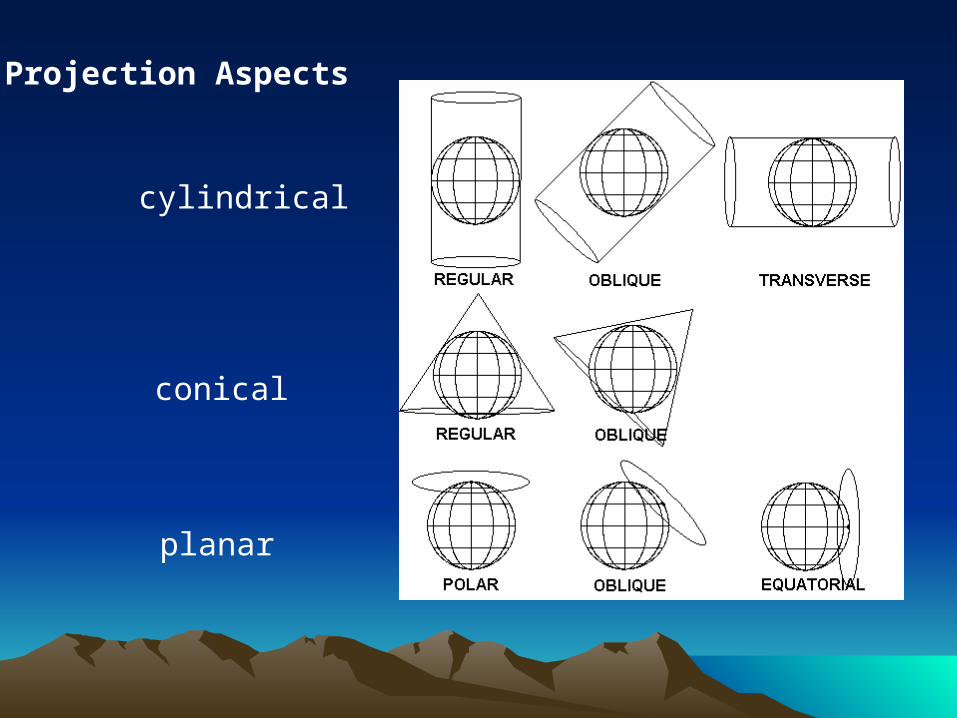
Projection Aspects
cylindrical
conical
planar
Preservation of Properties
• Map projections always introduce some sort of distortion. How to deal with it?• Choose a map projection that preserves the globe
properties appropriate for the application
• Note: The preservation of properties offers an alternative -- perhaps more meaningful -- way to categorize projections
Map projections distortionMap projections distortion
Projections cause distortion. The projection process will distort one or more of the four spatial properties listed below. Distortion of these spatial properties is inherent in any map.
Shape
Area
Distance
Direction
Conformal projections
• -preserve shape
• shape preserved for local (small) areas
(angular relationships are preserved at each point)
• sacrifices preservation of area away from standard point/lines
Equivalent/Equal-Area projections
• -preserve area
• all areas are correctly sized relative to one another
• sacrifices preservation of shape away from standard point/lines
Preservation of propertiesPreservation of properties
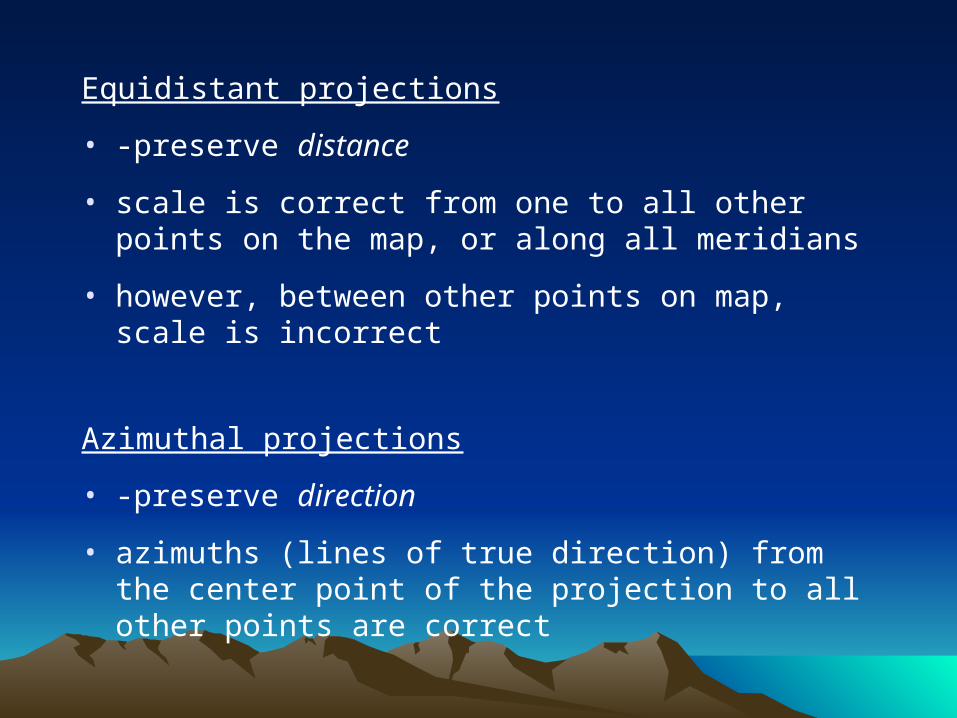
Equidistant projections
• -preserve distance
• scale is correct from one to all other points on the map, or along all meridians
• however, between other points on map, scale is incorrect
Azimuthal projections
• -preserve direction
• azimuths (lines of true direction) from the center point of the projection to all other points are correct
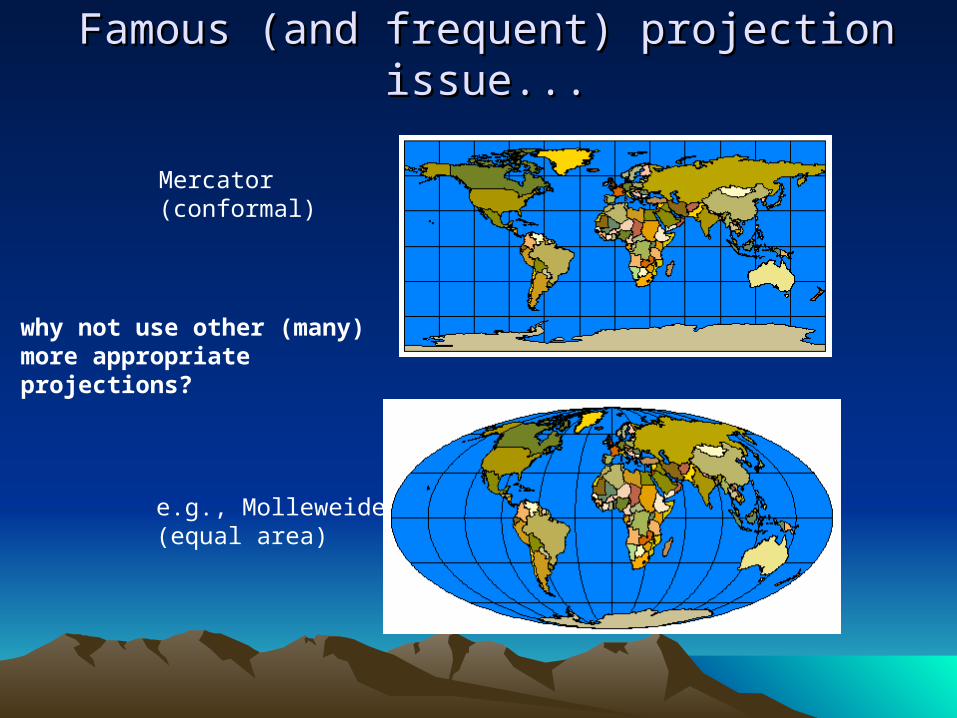
Famous (and frequent) projection issue...Famous (and frequent) projection issue...
Mercator(conformal)
why not use other (many)more appropriateprojections?
e.g., Molleweide(equal area)
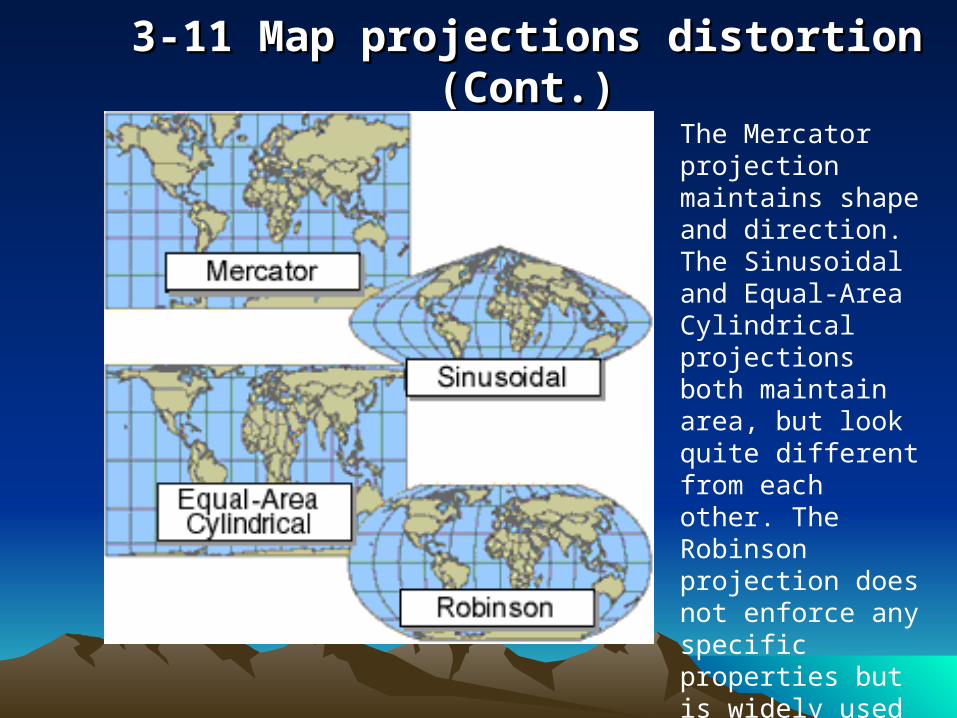
3-11 Map projections distortion (Cont.)3-11 Map projections distortion (Cont.)
The Mercator projection maintains shape and direction. The Sinusoidal and Equal-Area Cylindrical projections both maintain area, but look quite different from each other. The Robinson projection does not enforce any specific properties but is widely used because it makes the earth’s surface and its features "look right.“ (ESRI Press)
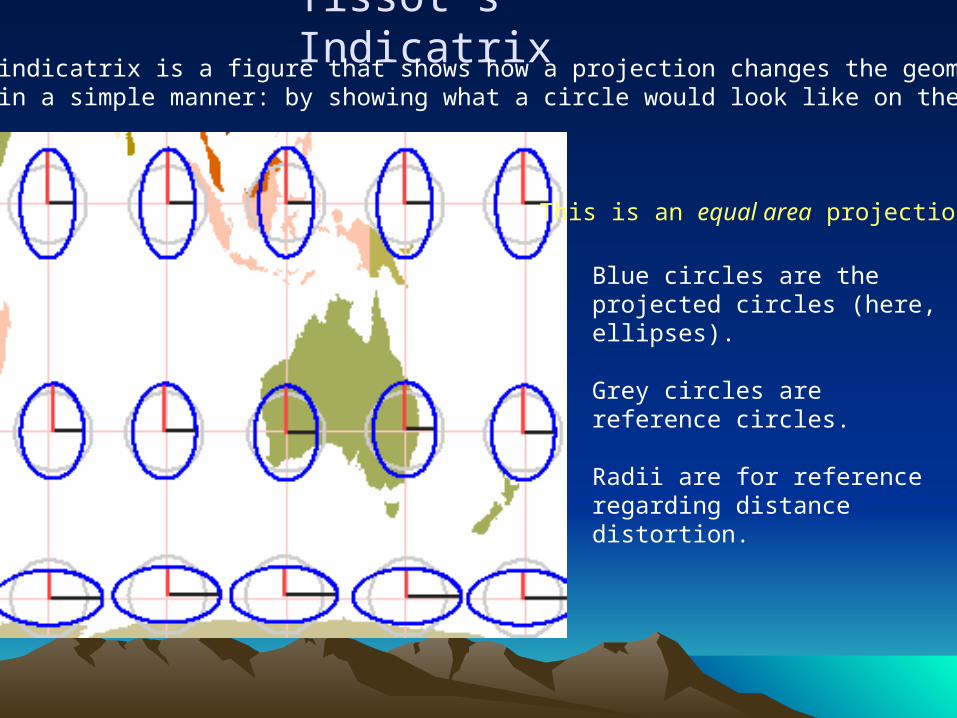
Tissot’s IndicatrixThe Tissot indicatrix is a figure that shows how a projection changes the geometry. It does so in a simple manner: by showing what a circle would look like on the map.
Blue circles are the projected circles (here, ellipses).
Grey circles are reference circles.
Radii are for reference regarding distance distortion.
This is an equal area projection.
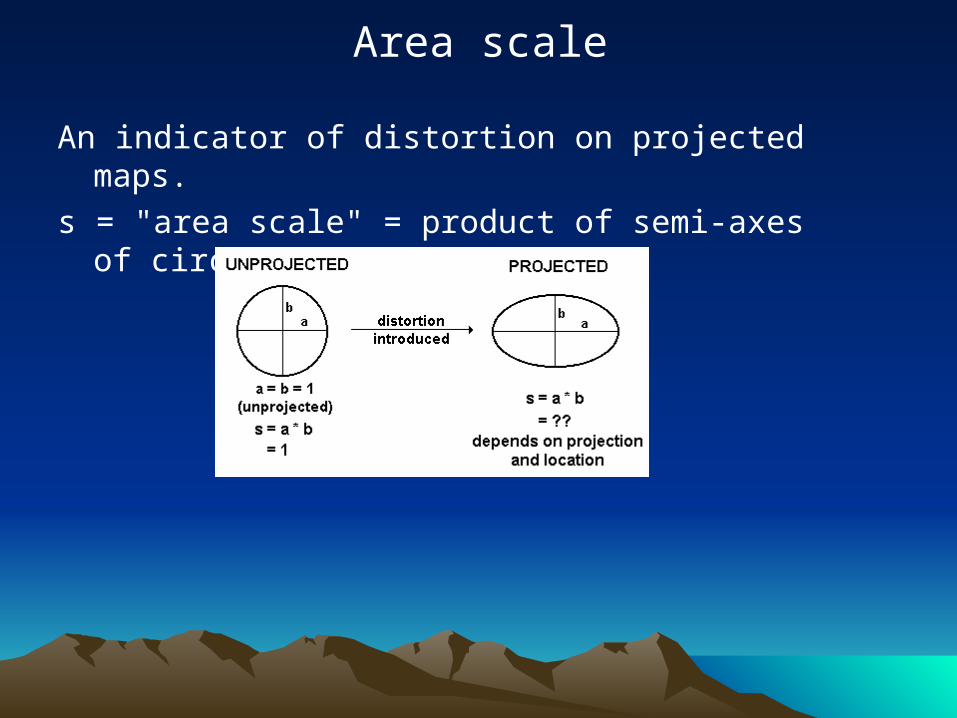
Area scale
An indicator of distortion on projected maps. s = "area scale" = product of semi-axes of
circle/ellipse.
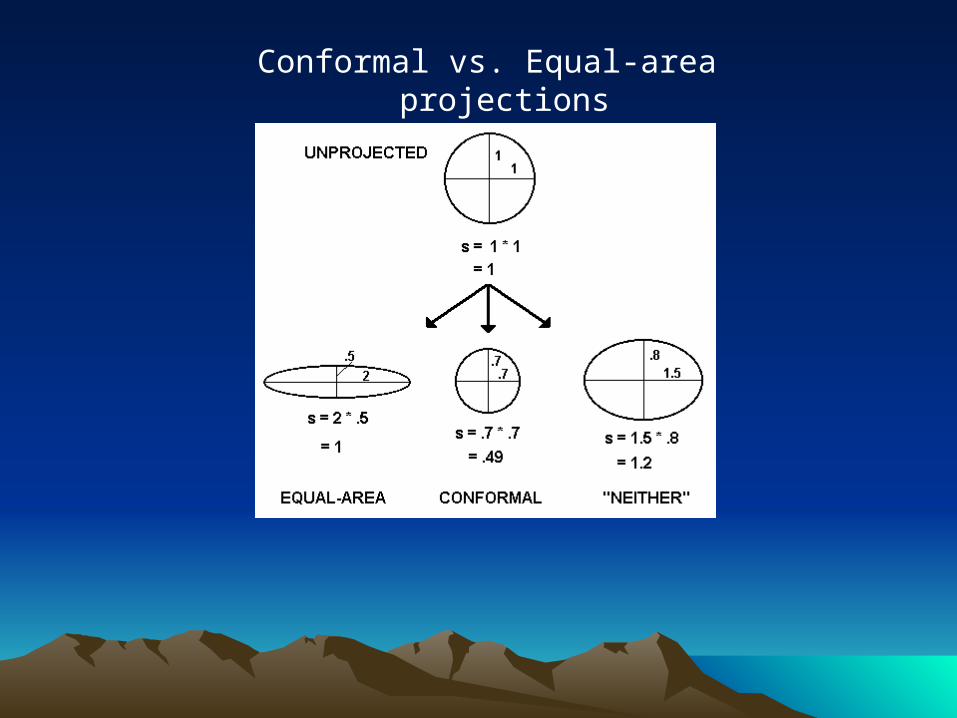
Conformal vs. Equal-area projections
Examples of projectionsExamples of projections
• Do the following examples clear up some myths we have grown to believe?
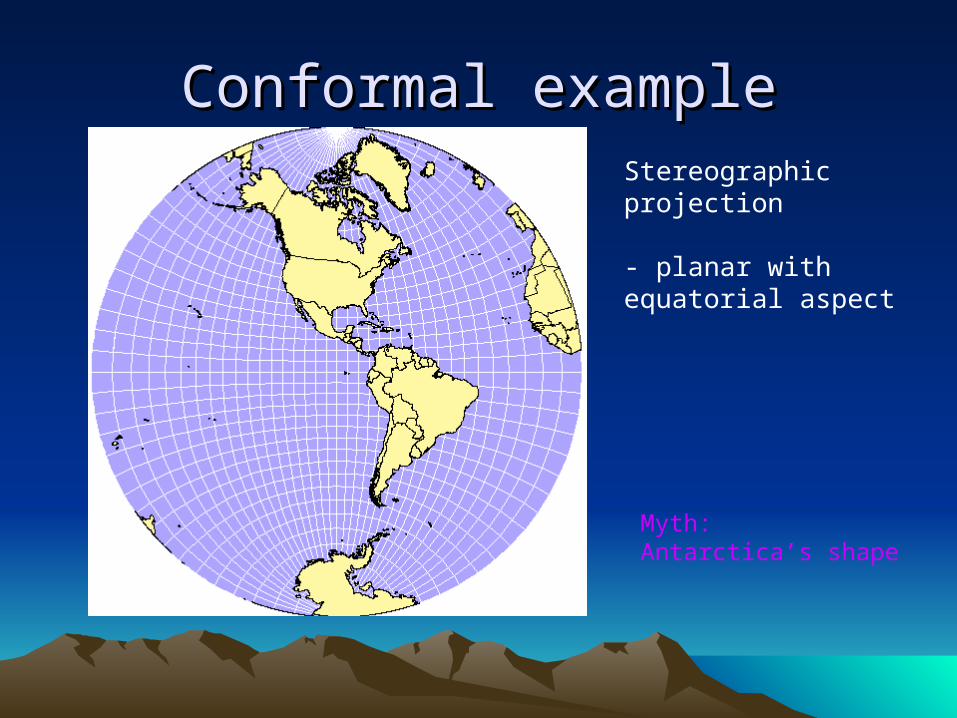
Conformal exampleConformal exampleStereographicprojection
- planar with equatorial aspect
Myth:Antarctica’s shape
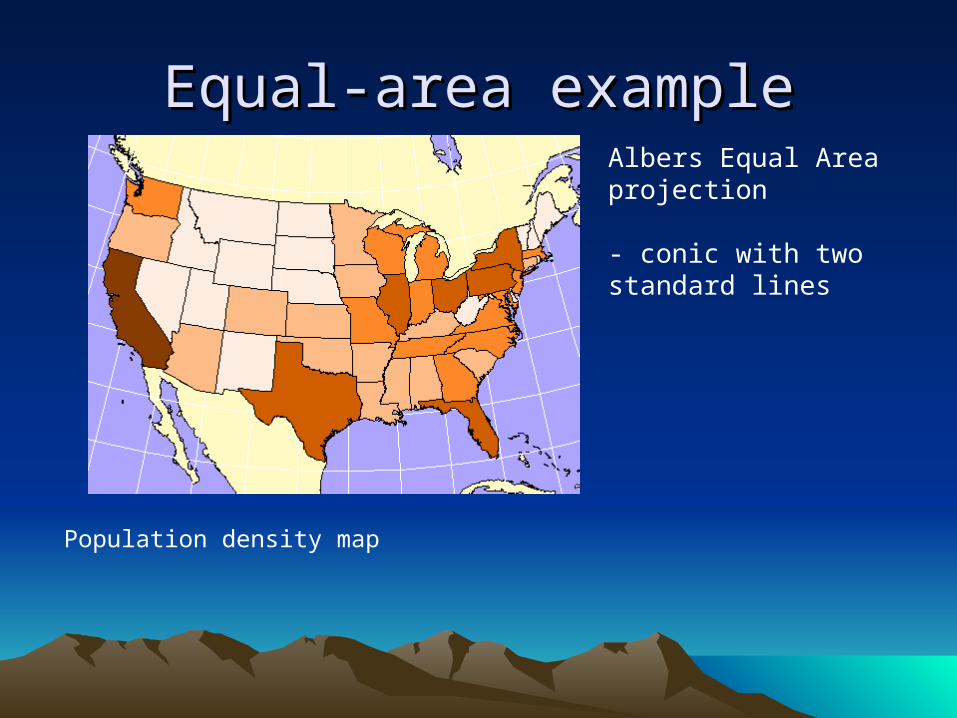
Equal-area exampleEqual-area exampleAlbers Equal Areaprojection
- conic with two standard lines
Population density map
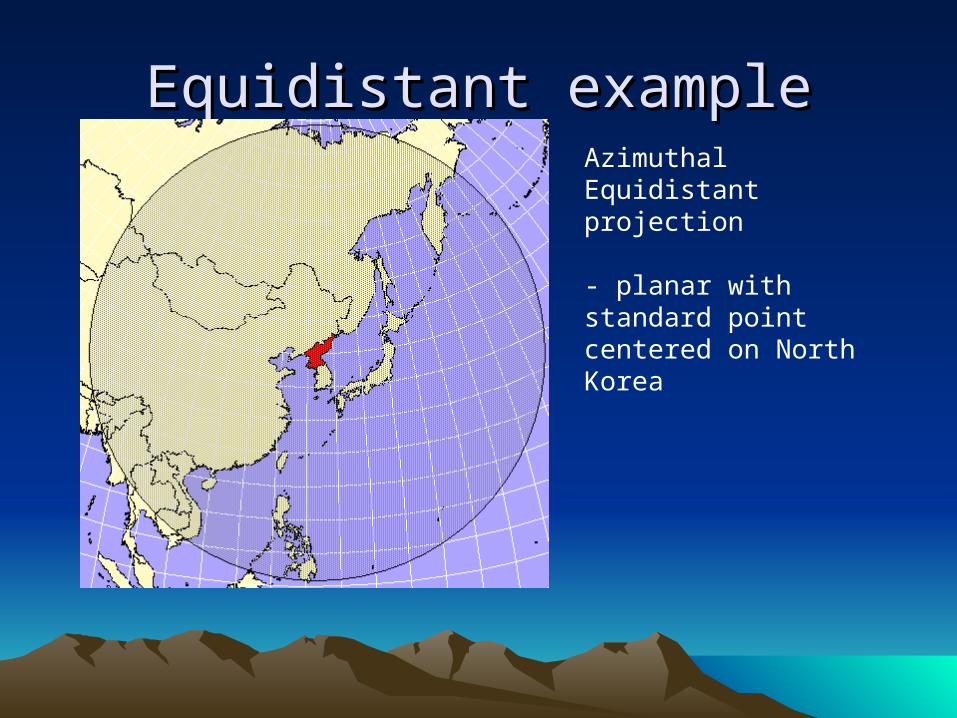
Equidistant exampleEquidistant exampleAzimuthal Equidistantprojection
- planar with standard point centered on North Korea
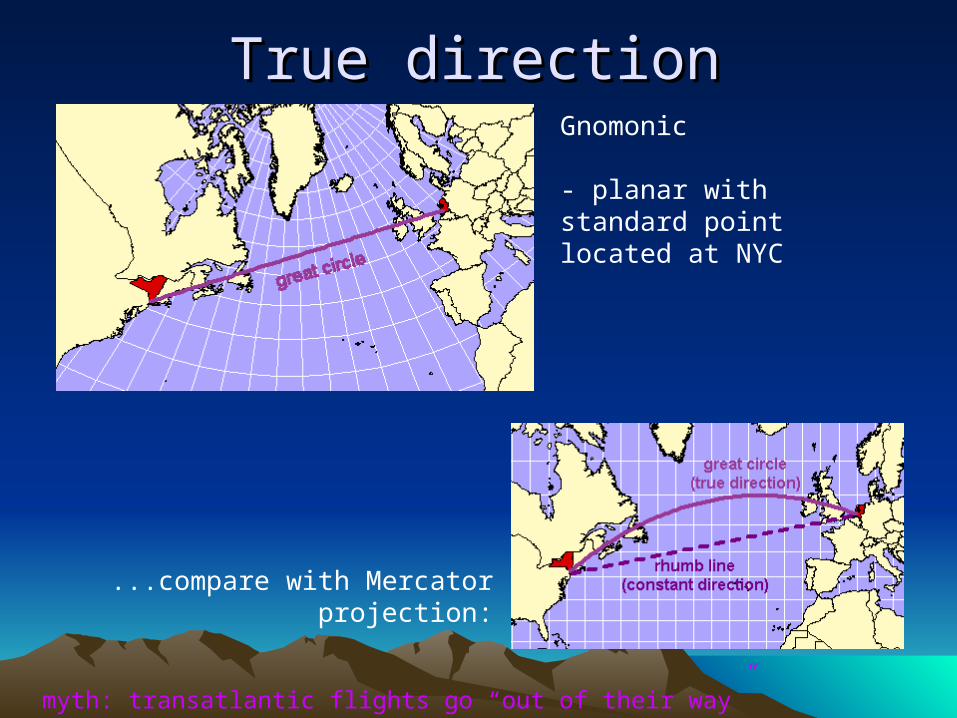
True directionTrue directionGnomonic
- planar with standard point located at NYC
...compare with Mercator projection:
myth: transatlantic flights go “out of their way”
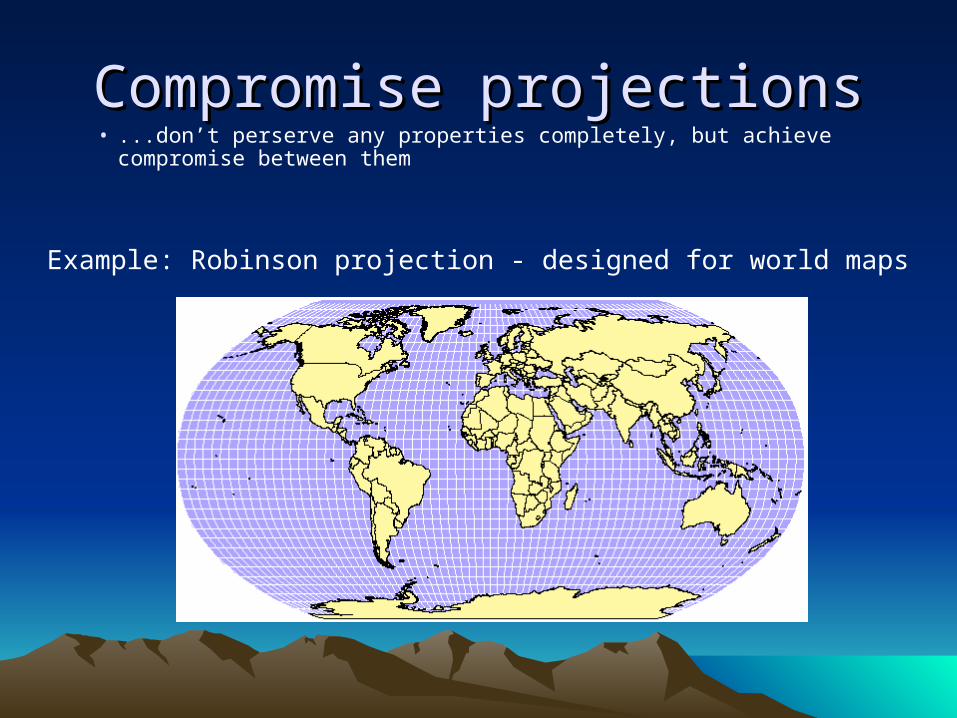
Compromise projectionsCompromise projections• ...don’t perserve any properties completely, but achieve compromise
between them
Example: Robinson projection - designed for world maps