Embed Size (px)
Citation preview

Prospective Study of Serum 25-Hydroxyvitamin D Level,Cardiovascular Disease Mortality, and All-Cause Mortalityin Older U.S. Adults
Adit A. Ginde, MD, MPH,� Robert Scragg, MBBS, PhD,w Robert S. Schwartz, MD,z andCarlos A. Camargo, Jr., MD, DrPH§
OBJECTIVES: To evaluate the association between serum25-hydroxyvitamin D (25(OH)D) levels and mortality in arepresentative U.S. sample of older adults.
DESIGN: Prospective cohort from the Third NationalHealth and Nutrition Examination Survey (NHANES III)and linked mortality files.
SETTING: Noninstitutionalized U.S. civilian population.
PARTICIPANTS: Three thousand four hundred eightNHANES III participants aged 65 and older enrolled from1988 to 1994 and followed for mortality through 2000.
MEASUREMENTS: Primary exposure was serum25(OH)D level at enrollment. Primary and secondary out-comes were all-cause and cardiovascular disease (CVD)mortality, respectively.
RESULTS: During the median 7.3 years of follow-up, therewere 1,493 (44%) deaths, including 767 CVD-relateddeaths. Median 25(OH)D level was 66 nmol/L. Adjustingfor demographics, season, and cardiovascular risk factors,baseline 25(OH)D levels were inversely associated with all-cause mortality risk (adjusted hazard ratio (HR) 5 0.95,95% confidence interval (CI) 5 0.92–0.98, per 10 nmol/L25[OH]D). Compared with subjects with 25(OH)D levelsof 100 nmol/L or higher, the adjusted HR for subjects withlevels less than 25.0 nmol/L was 1.83 (95% CI 5 1.14–2.94) and for levels of 25.0 to 49.9 nmol/L was 1.47 (95%CI 5 1.09–1.97). The association appeared stronger forCVD mortality (adjusted HR 5 2.36, 95% CI 5 1.17–4.75,for subjects with 25[OH]D levelso25.0 nmol/L vs those�100.0 nmol/L) than for non-CVD mortality (adjustedHR 5 1.42, 95% CI 5 0.73–2.79, for subjects with25[OH]D levelso25.0 nmol/L vs those �100.0 nmol/L).
CONCLUSION: In noninstitutionalized older adults, agroup at high risk for all-cause mortality, serum 25(OH)Dlevels had an independent, inverse association with CVDand all-cause mortality. Randomized controlled trials ofvitamin D supplementation in older adults are warranted todetermine whether this association is causal and reversible.J Am Geriatr Soc 57:1595–1603, 2009.
Key words: vitamin D; mortality; cardiovascular disease;epidemiology; geriatrics
Although many healthcare professionals previously be-lieved that the major health problems from vitamin D
were limited to rickets, osteoporosis, and osteomalacia,there has been intense interest in the role of vitamin D in avariety of nonskeletal medical conditions during the pastdecade.1 Vitamin D insufficiency has been associated withhigher incidences of many medical conditions that affectmortality risk, including hypertension,2,3 diabetes melli-tus,4–7 cardiovascular disease (CVD),8–12 cancer,13–17 andinfection.18–21 Vitamin D supplementation appears to mit-igate incidence of, and adverse outcomes from, these var-ious diseases.17,22,23
Accordingly, recent evidence suggests that vitamin Dmay play a role in mortality risk.11,24,25 Low serum levels of25-hydroxyvitamin D (25(OH)D), the major circulatingform of vitamin D, have been associated with all-causemortality in individuals with end-stage renal disease24 andcoronary artery disease11 and even in the general popula-tion.25 Further evidence suggests that vitamin D supple-mentation may lower mortality.26–29 Although older adultsare at high risk for lower 25(OH)D levels1 and mortality,30
the association between vitamin D insufficiency and mor-tality risk has not been specifically evaluated in older adults.
Older adults are at high risk for vitamin D insuffi-ciency because of a reduction of 7-dehydrocholesterol, the
Address correspondence to Adit A. Ginde, Department of EmergencyMedicine; University of Colorado Denver School of Medicine; 12401 E. 17thAvenue, B-215, Aurora, CO 80045. E-mail: [email protected]
DOI: 10.1111/j.1532-5415.2009.02359.x
From the�Department of Emergency Medicine, zDivision of GeriatricMedicine, School of Medicine, University of Colorado Denver, Aurora,Colorado;wSchool of Population Health, University of Auckland, Auckland,New Zealand; and §Department of Emergency Medicine, MassachusettsGeneral Hospital, Harvard Medical School, Boston, Massachusetts.
JAGS 57:1595–1603, 2009r 2009, Copyright the AuthorsJournal compilation r 2009, The American Geriatrics Society 0002-8614/09/$15.00

precursor for vitamin D in the skin,1 and lower ultraviolet(UV) B light exposure from lower outdoor activity.31 Fur-thermore, the incidence of vitamin D insufficiency in olderadults is increasing,32 and currently recommended supple-mentation doses appear inadequate to support the higher25(OH)D levels associated with improved general healthoutcomes.33,34 Thus, although serum 25(OH)D predictsall-cause mortality for U.S. adults aged 20 and older,25 thisstudy sought to evaluate the association between serum25(OH)D levels and mortality in a sample of adults aged65 and older representative of the U.S. population, includ-ing specific evaluation of mortality from CVD.
METHODS
Study Design and Participants
From October 1988 to October 1994, the National Centerfor Health Statistics conducted the Third National Healthand Nutrition Examination Survey (NHANES III), fol-lowed by the mortality assessment from enrollment throughDecember 31, 2000. A secondary analysis of this nationallyrepresentative, prospective observational cohort of thenoninstitutionalized U.S. civilian population, limited toolder adults (aged �65) was performed. A waiver from theinstitutional review boards was received as an exemptstudy.
Full details of survey methodology, including sampling,interview, examination, laboratory measurements, mortal-ity linkage, ethics approval, and informed consent, are de-scribed elsewhere.35 Briefly, the survey used a complex,stratified, multistage probability sample design. NHANESIII oversampled certain subgroups of people, includinglow-income persons, adolescents, older adults, AfricanAmericans, and Mexican Americans. Because physicaland laboratory examinations occurred in mobile examin-ation centers, inclement weather was a challenge duringdata collection. To avoid this challenge and improve re-sponse, the NHANES preferentially scheduled data collec-tion in the lower latitudes (farther south) during wintermonths and higher latitudes (farther north) in the summermonths.36
NHANES III collected household interview data, in-cluding demographic characteristics and data on health andnutrition, for 33,994 (85.6%) of 39,695 invited partici-pants, of whom 5,262 were aged 65 and older The majority(4,094, 77.8%) subsequently received physical and labora-tory examination in a mobile examination center or at ahome visit. Participants without reported serum 25(OH)Dmeasurements (216 missing) and valid mortality data (7missing) were excluded. Poverty:income ratio (ratio of afamily’s income to the poverty threshold of a family of thesame size) was used to assess socioeconomic status; 463participants without data for this important covariate wereexcluded. Thus, 3,408 participants, who represent 24 mil-lion older U.S. adults, were included in the final analysis.Serum 25(OH)D levels were similar for excluded and an-alyzed participants (data not shown).
Definition of Study Variables
From the household interview data, information on self-reported age, sex, race or ethnicity, and socioeconomic sta-
tus, as measured according to the poverty-income ratio wasanalyzed. Smoking history (current smoking and pack-years), current asthma, and chronic obstructive pulmonarydisease (emphysema or chronic bronchitis) diagnosis fromself-reported history were included. Physical activity wasmeasured in total metabolic equivalent tasks (METs) andcalculated as the sum of leisure-time physical activities re-ported during the prior month (as measured for each ac-tivity by the product of intensity rating, in METS, andfrequency of activity during the month). Factors that areknown to be associated with serum 25(OH)D,31 but with-out a clear direct relationship to mortality, such as milkintake and vitamin D supplementation, were not includedin the models because of collinearity.
From the examination data, body mass index wascalculated as weight in kilograms divided by the squareheight in meters. Hypertension was defined as self-reportedphysician-diagnosed hypertension, average systolic bloodpressure greater than 140 mmHg at baseline, or averagediastolic blood pressure greater than 90 mmHg at baseline.One to three blood pressure measurements were made atthe baseline data collection. Diabetes mellitus was definedas self-reported physician-diagnosed diabetes mellitus (ex-cept gestational diabetes only), fasting (48 hours) bloodglucose of 126 mg/dL or greater at baseline, or nonfastingblood glucose of 200 mg/dL or greater at baseline. Hyper-lipidemia was defined as self-reported physician-diagnosedhigh cholesterol, non-high-density lipoprotein cholesterolof 160 mg/dL or greater, or triglycerides of 200 mg/dL orgreater.
Blood samples collected during the examination werecentrifuged, aliquoted, and frozen to �701C on site andshipped on dry ice to central laboratories, where they werestored at � 701C until analysis. The National Center forEnvironmental Health (Atlanta, GA) measured serum25(OH)D levels using a radioimmunoassay kit after ex-traction with acetonitrile (DiaSorin, Stillwater, MN). Thedate of the examination and laboratory data collection wasused to most accurately adjust for the effect of season onserum 25(OH)D levels. Estimated glomerular filtration ratewas calculated using the abbreviated Modification in Dietin Renal Disease (MDRD) equation. Serum creatininemeasurements were calibrated to the MDRD standard bysubtracting 0.23 mg/dL from NHANES III values, as pre-viously described.37
Vital Status and Cause of Death
Mortality outcomes were collected by matching NationalDeath Index screen or death certificate data from the time ofenrollment until December 31, 2000. Participants wereclassified as ‘‘dead’’ or, for all participants without a prob-abilistic match, ‘‘presumed alive.’’ The underlying cause ofdeath was coded using the International Classification ofDiseases, Ninth Revision (ICD-9) until 1998 and ICD-10 in1999 and 2000. The National Center for Health Statisticssubsequently recoded all deaths before 1999 to ICD-10codes for comparability. CVD mortality was defined asICD-10 codes I00-I99 and non-CVD mortality as all othercauses of death.
The primary outcome for the cohort was all-causemortality during the follow-up period, and the secondary
1596 GINDE ET AL. SEPTEMBER 2009–VOL. 57, NO. 9 JAGS

outcome was CVD mortality. It was attempted to analyzecancer and infection-related mortality, but the number ofobservations was too small for meaningful analysis; thus,non-CVD mortality was used as a second category for causeof death.
Statistical Analysis
Statistical analyses were performed using Stata 9.0 (Stata-Corp., College Station, TX). Using survey commands,the recommended subsample weights for the interviewplus examination data were applied to account for un-equal probabilities of selection and to accurately repre-sent estimates for the U.S. population. All results arepresented as weighted values. Variance was calculatedbased on NHANES-provided masked variance units,using the Taylor Series linearization method. All P-valueswere two-tailed, with Po.05 considered statisticallysignificant.
For the primary analysis, serum 25(OH)D levels werestratified into five groups (o25.0 nmol/L, 25.0–49.9 nmol/L,50.0–74.9 nmol/L, 75.0–99.9 nmol/L, and �100.0 nmol/L),which were chosen a priori based on previously reported25(OH)D thresholds for improving general health.1,38 Itis likely that consistency of thresholds in the literature,rather than using percentiles (which vary from study tostudy), facilitates integration of multiple studies in the lit-erature, although a secondary analysis of 25(OH)D decileshas also been included to evaluate linearity of observedassociations.
Proportions and means with 95% confidence intervals(CIs) were calculated for the selected covariates, accordingto 25(OH)D strata. Univariate associations were deter-mined between characteristics and 25(OH)D levels usingthe Pearson chi-square test for categorical variables andanalysis of variance for continuous variables. The associ-ation between each covariate and mortality outcomes wasevaluated using simple (unadjusted) Cox proportional haz-ards analysis.
The primary analysis focused on the association be-tween baseline serum 25(OH)D level and all-cause, CVD,and non-CVD mortality during follow-up using multivari-able Cox proportional hazards models. Three differentmultivariable models were used, specified a priori, to testfor the independent effect of serum 25(OH)D levels onmortality. The first model adjusted for age, sex, and race orethnicity (all important in adjustment of mortality rates)and season (important in adjustment of 25(OH)D levels).Building on the first model, the second model added otherpotential confounders: poverty: income ratio, region, bodymass index, physical activity, smoking status, cigarette packyears, asthma, chronic obstructive pulmonary disease, andrenal function. This model was considered to be fully ad-justed for subsequent analyses. The third model added po-tential intermediates to help explain the observedassociations, including hypertension, diabetes mellitus,hyperlipidemia, history of myocardial infarction, historyof stroke, and history of cancer (nonskin). Finally, effectmodification by covariates on the associations between25(OH)D and mortality were formally tested for by addinginteraction terms to the adjusted models.
RESULTS
Characteristics of the weighted NHANES III sample, strat-ified according to baseline 25(OH)D level, are summarizedin Table 1. The median 25(OH) D level was 66.0 nmol/L.Women, non-Hispanic blacks, and Mexican Americans hadlower 25(OH)D levels. Lower socioeconomic status, winterseason, Midwest region, lower physical activity, hyperten-sion, diabetes mellitus, and history of stroke were alsoassociated with lower 25(OH)D levels.
During the median 7.3 years of follow-up, there were1,493 (43.8%) deaths among the 3,408 participants, ofwhich 767 (51.4%) were related to CVD. The remaining726 non-CVD deaths could not be further stratified ac-cording to other causes (e.g., cancer, infection) for validanalysis because of the small number of individual obser-vations. The association between baseline characteristicsand all-cause, CVD, and non-CVD mortality are presentedin Table 2. Baseline 25(OH)D level, older age, diabetesmellitus, history of myocardial infarction, and history ofstroke were most strongly associated with CVD and all-cause mortality (all Po.05).
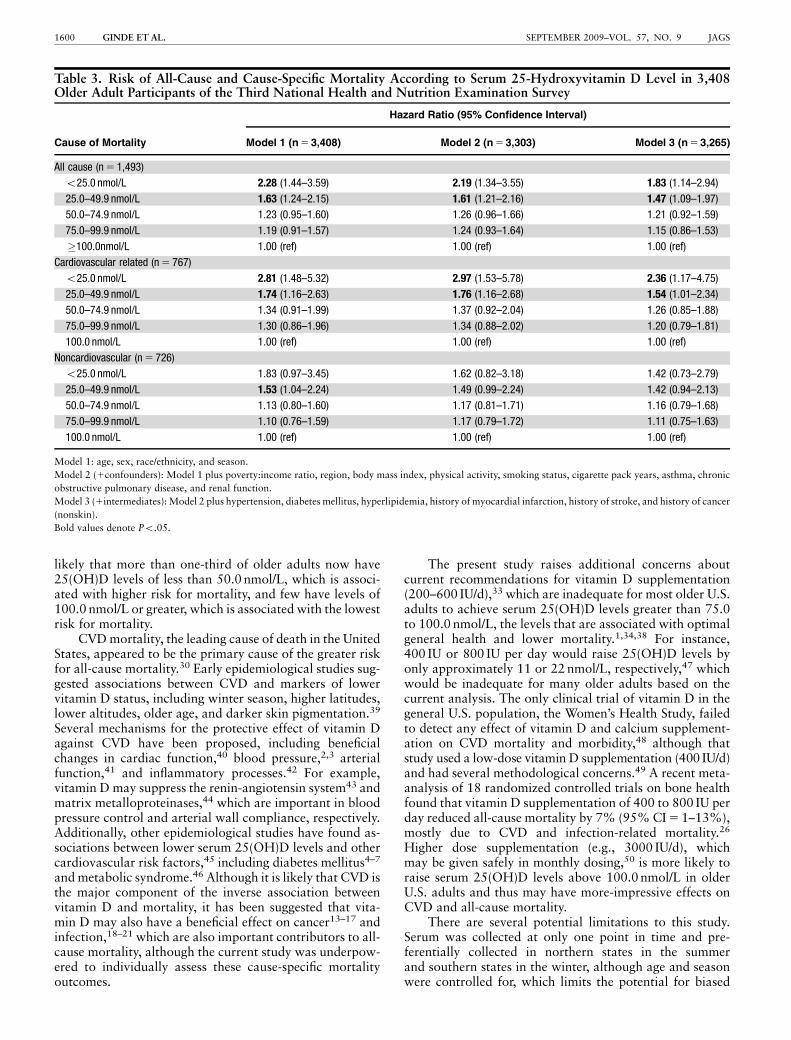
In the multivariable models (Table 3), baseline serum25(OH)D level maintained an independent association withall-cause mortality, even after controlling for potential con-founders and intermediate variables. Additionally, theKaplan-Meier curves (Figure 1A) demonstrates an imme-diate and sustained divergence of mortality risk between25(OH)D strata. Stratification of the mortality outcomesuggested that the association was stronger for CVD thanfor non-CVD mortality (Figure 1B, C).
There appeared to be a dose-response association with thelargest risk in the lowest 25(OH)D stratum (o25.0 nmol/L).Additionally, analysis according to deciles suggests that theassociation between 25(OH)D and mortality is linear in therange from 0 to 120 nmol/L (Figure 2), and baseline25(OH)D levels analyzed as a continuous and linear vari-able had a strong inverse association with mortality risk(hazard ratio (HR) 5 0.95, 95% CI 5 0.92–0.98 for every10-nmol/L increase in 25(OH)D). The association be-tween 25(OH)D and all-cause mortality was stronger inparticipants with diabetes mellitus at baseline than in thosewithout (HRs 5 0.86 and 0.96, respectively; P for interac-tion 5 .02). There was no other statistically significant in-teraction between covariates and the associations between25(OH)D and all-cause or CVD mortality (data notshown).
DISCUSSION
This study demonstrated a significant inverse associationbetween baseline serum 25(OH)D level and mortality riskin older adults. The association was strong (two timegreater odds of mortality for 25(OH)D level o25.0 nmol/L)and appeared linear within the range of the data and in-dependent of demographic factors and other common CVDand mortality risk factors. Additional strengths of the studyinclude the generalizability of this large, diverse, nationallyrepresentative sample, the robust measurement of covari-ates, and the quality of the mortality follow-up data.
These results are consistent with several recent reportsthat link vitamin D insufficiency with CVD,8–12 CVD mor-tality,11 and all-cause mortality risk.11,24,25 The data add to
VITAMIN D AND MORTALITY 1597JAGS SEPTEMBER 2009–VOL. 57, NO. 9

the existing literature in that the cohort already was at highrisk for mortality, with an overall mortality rate of 44%during the median 7.3 years of follow-up. For instance, thisrate was higher than recently reported (14% over median8.7 years of follow-up25 and 23% over median 7.7 years offollow-up11). A nested case-control study of hemodialysispatients, a group that is also at higher risk for mortality,found that lower baseline 25(OH)D levels were associatedwith higher 90-day mortality.24 Given the aging population,and that even a small reduction in mortality could have asubstantial effect on public health, the potential importanceof these findings is large. Additionally, a stronger associa-tion was found between vitamin D and all-cause mortalityin older adults with diabetes mellitus than in those without.
These results differ from those reported previously25 intheir more-general look at the NHANES III data for adultsaged 20 and older. This age-specific difference may be re-lated to higher prevalence of diabetes mellitus, vitamin Dinsufficiency, or mortality in the older cohort in the currentstudy and requires further study.
The association between vitamin D and mortality wasparticularly robust in participants with baseline 25(OH)Dlevels less than 25.0 nmol/L and 25.0 to 49.9 nmol/L.Although these subgroups represented 26% of the currentcohort, epidemiological data suggests that vitamin D in-sufficiency is increasing in the U.S. population. For instance,it was recently reported that the proportion of older U.S.adults with serum 25(OH)D levels less than 25 nmol/L
Table 1. Description of Baseline Characteristics According to Serum 25-Hydroxyvitamin D Levels in 3,408 Participantsof the Third National Health and Nutrition Examination Survey Aged �65
Characteristic
Total
Serum 25-Hydroxyvitamin D Levels (nmol/L)
P-Value
o25.0 25.0–49.9 50.0–74.9 75.0–99.9 �100.0
N 5 3,408 n 5 115 n 5 904 n 5 1,296 n 5 775 n 5 318
Age, mean � SD 73 � 0.2 76 � 0.8 74 � 0.4 74 � 0.3 73 � 0.3 72 � 0.4 .001
Women, n (%) 56 (1.1) 84 (3.1) 71 (1.9) 56 (1.8) 45 (1.8) 40 (2.7) o.001
Race/ethnicity, n (%)
Non-Hispanic white 87 (1.1) 67 (4.5) 77 (2.7) 89 (1.2) 90 (1.2) 95 (1.4) o.001
Non-Hispanic black 7 (1) 27 (4.7) 15 (1.8) 6 (0.7) 4 (0.6) 1 (nc)
Mexican American 2 (0.2) 4 (nc) 3 (0.4) 2 (0.2) 1 (0.3) 1 (0.1)
Other 4 (0.6) 2 (nc) 5 (nc) 3 (0.8) 4 (nc) 3 (nc)
Poverty:income ratio, mean � SD 3 � 0.1 2 � 0.3 3 � 0.1 3 � 0.1 3 � 0.2 3 � 0.2 o.001
Season, n (%) o.001
Winter (December to February) 13 (2.6) 24 (8.3) 15 (3.5) 11 (2.3) 13 (3.1) 10 (2.9)
Spring (March to May) 23 (4.8) 30 (6.3) 25 (5.0) 22 (5.1) 21 (4.9) 22 (5.3)
Summer (June to August) 34 (5.6) 23 (7.1) 31 (5.7) 36 (5.7) 34 (6.0) 35 (6.8)
Fall (September to November) 30 (6.1) 24 (8.0) 28 (5.9) 30 (5.9) 32 (7.1) 32 (7.8)
Region, n (%) .04
Northeast 21 (2.1) 20 (4.8) 21 (2.5) 22 (2.3) 19 (2.7) 19 (3.9)
South 26 (2.9) 14 (3.0) 21 (3.0) 28 (3.2) 27 (3.1) 30 (5.3)
Midwest 30 (3.4) 42 (7.7) 30 (4.0) 28 (3.5) 34 (4.2) 29 (4.5)
West 22 (4.8) 24 (4.9) 27 (6.4) 22 (4.7) 19 (4.1) 22 (6.0)
Body mass index, kg/m2, mean � SD 27 � 0.1 26 � 1.0 27 � 0.3 27 � 0.2 26 � 0.2 26 � 0.3 o.001
Physical activity, metabolicequivalents, mean � SD
97 � 3.7 23 � 6.3 71 � 6.1 87 � 4.1 120 � 7.9 149 � 12 o.001
Smoking status, n (%) .14
Nonsmoker 45 (1.1) 49 (6.4) 45 (3.3) 47 (1.7) 43 (2.5) 42 (3.0)
Current 13 (0.9) 23 (6.6) 15 (1.9) 12 (1.4) 11 (1.3) 12 (2.2)
Former 42 (1.4) 28 (5.6) 40 (3.6) 40 (1.9) 46 (2.3) 46 (3.5)
Cigarette amount, pack years, mean � SD 20 � 0.8 21 � 5.2 19 � 1.7 20 � 1.2 20 � 1.5 23 � 2.2 .28
Estimated glomerular filtration rate,mL/min per 1.73 m2, mean � SD
73 � 0.5 74 � 3.9 72 � 1.0 74 � 0.7 72 � 0.9 71 � 1.2 .38
Hypertension, n (%) 66 (1.1) 80 (4.6) 70 (1.6) 66 (1.4) 63 (2.3) 62 (3.9) .02
Diabetes mellitus, n (%) 15 (1.0) 28 (7.1) 22 (2.1) 15 (1.4) 11 (1.4) 9 (1.7) o.001
Hyperlipidemia, n (%) 67 (1.6) 60 (6.5) 66 (3.4) 67 (1.9) 69 (2.1) 68 (3.5) .65
History of myocardial infarction, n (%) 12 (1.0) 15 (nc) 12 (1.6) 12 (1.6) 14 (1.4) 10 (2.1) .59
History of stroke, n (%) 7 (0.6) 16 (nc) 9 (1.4) 6 (0.9) 7 (1.0) 6 (nc) .02
History of cancer, n (%) 10 (0.7) 16 (nc) 9 (1.4) 9 (1.1) 12 (1.7) 8 (1.6) .20
Asthma, n (%) 5 (0.4) 7 (nc) 4 (0.7) 5 (0.9) 5 (1.1) 4 (nc) .58
Chronic obstructive pulmonary disease, n (%) 13 (0.8) 14 (nc) 14 (2.0) 13 (1.2) 11 (1.7) 15 (2.6) .80
SD 5 standard deviaion; nc 5 not calculable because of fewer than 30 observations.
1598 GINDE ET AL. SEPTEMBER 2009–VOL. 57, NO. 9 JAGS
increased from 2% during 1988 to 1994 to 6% during 2001to 2004. Similarly, the percentage of adults with levels of25.0 to 49.9 nmol/L increased from 24% to 30%.32 Be-cause exposure to UVB rays is the primary determinant of
vitamin D status in humans,1 it is likely that decreases inoutdoor physical activity and widespread campaigns forsunscreen use have contributed to the recently observedpopulation increase in vitamin D insufficiency.31 Thus, it is
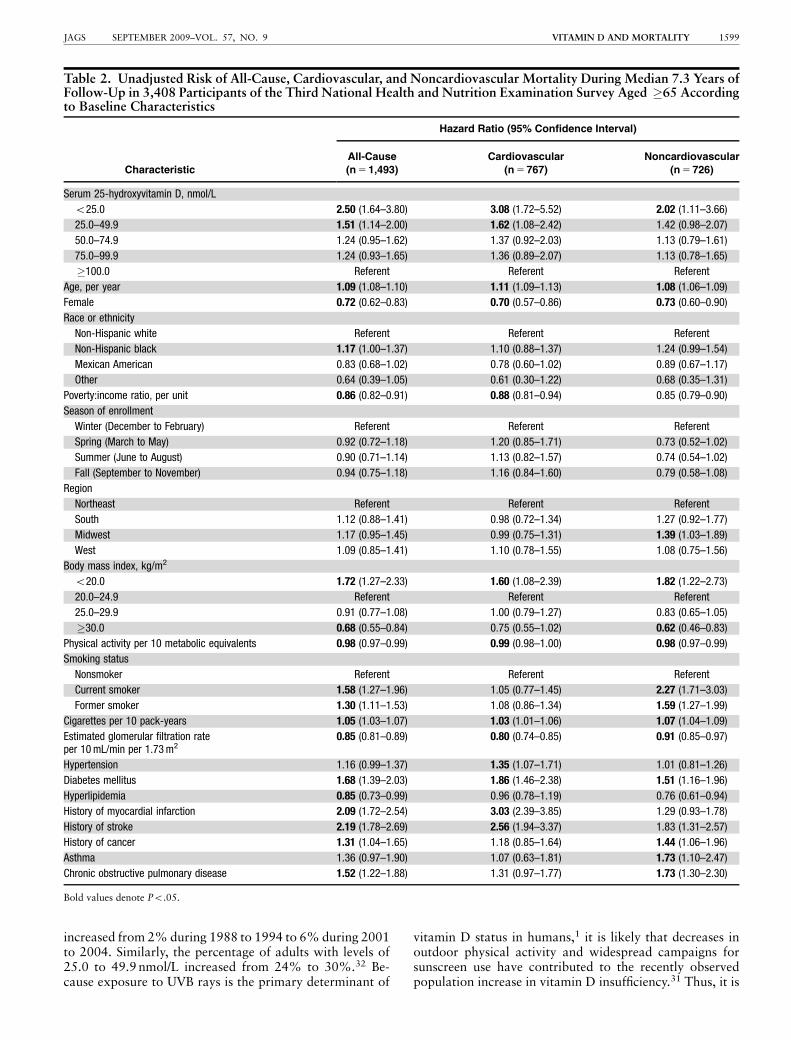
Table 2. Unadjusted Risk of All-Cause, Cardiovascular, and Noncardiovascular Mortality During Median 7.3 Years ofFollow-Up in 3,408 Participants of the Third National Health and Nutrition Examination Survey Aged �65 Accordingto Baseline Characteristics
Characteristic
Hazard Ratio (95% Confidence Interval)
All-Cause Cardiovascular Noncardiovascular
(n 5 1,493) (n 5 767) (n 5 726)
Serum 25-hydroxyvitamin D, nmol/L
o25.0 2.50 (1.64–3.80) 3.08 (1.72–5.52) 2.02 (1.11–3.66)
25.0–49.9 1.51 (1.14–2.00) 1.62 (1.08–2.42) 1.42 (0.98–2.07)
50.0–74.9 1.24 (0.95–1.62) 1.37 (0.92–2.03) 1.13 (0.79–1.61)
75.0–99.9 1.24 (0.93–1.65) 1.36 (0.89–2.07) 1.13 (0.78–1.65)
�100.0 Referent Referent Referent
Age, per year 1.09 (1.08–1.10) 1.11 (1.09–1.13) 1.08 (1.06–1.09)
Female 0.72 (0.62–0.83) 0.70 (0.57–0.86) 0.73 (0.60–0.90)
Race or ethnicity
Non-Hispanic white Referent Referent Referent
Non-Hispanic black 1.17 (1.00–1.37) 1.10 (0.88–1.37) 1.24 (0.99–1.54)
Mexican American 0.83 (0.68–1.02) 0.78 (0.60–1.02) 0.89 (0.67–1.17)
Other 0.64 (0.39–1.05) 0.61 (0.30–1.22) 0.68 (0.35–1.31)
Poverty:income ratio, per unit 0.86 (0.82–0.91) 0.88 (0.81–0.94) 0.85 (0.79–0.90)
Season of enrollment
Winter (December to February) Referent Referent Referent
Spring (March to May) 0.92 (0.72–1.18) 1.20 (0.85–1.71) 0.73 (0.52–1.02)
Summer (June to August) 0.90 (0.71–1.14) 1.13 (0.82–1.57) 0.74 (0.54–1.02)
Fall (September to November) 0.94 (0.75–1.18) 1.16 (0.84–1.60) 0.79 (0.58–1.08)
Region
Northeast Referent Referent Referent
South 1.12 (0.88–1.41) 0.98 (0.72–1.34) 1.27 (0.92–1.77)
Midwest 1.17 (0.95–1.45) 0.99 (0.75–1.31) 1.39 (1.03–1.89)
West 1.09 (0.85–1.41) 1.10 (0.78–1.55) 1.08 (0.75–1.56)
Body mass index, kg/m2
o20.0 1.72 (1.27–2.33) 1.60 (1.08–2.39) 1.82 (1.22–2.73)
20.0–24.9 Referent Referent Referent
25.0–29.9 0.91 (0.77–1.08) 1.00 (0.79–1.27) 0.83 (0.65–1.05)
�30.0 0.68 (0.55–0.84) 0.75 (0.55–1.02) 0.62 (0.46–0.83)
Physical activity per 10 metabolic equivalents 0.98 (0.97–0.99) 0.99 (0.98–1.00) 0.98 (0.97–0.99)
Smoking status
Nonsmoker Referent Referent Referent
Current smoker 1.58 (1.27–1.96) 1.05 (0.77–1.45) 2.27 (1.71–3.03)
Former smoker 1.30 (1.11–1.53) 1.08 (0.86–1.34) 1.59 (1.27–1.99)
Cigarettes per 10 pack-years 1.05 (1.03–1.07) 1.03 (1.01–1.06) 1.07 (1.04–1.09)
Estimated glomerular filtration rateper 10 mL/min per 1.73 m2
0.85 (0.81–0.89) 0.80 (0.74–0.85) 0.91 (0.85–0.97)
Hypertension 1.16 (0.99–1.37) 1.35 (1.07–1.71) 1.01 (0.81–1.26)
Diabetes mellitus 1.68 (1.39–2.03) 1.86 (1.46–2.38) 1.51 (1.16–1.96)
Hyperlipidemia 0.85 (0.73–0.99) 0.96 (0.78–1.19) 0.76 (0.61–0.94)
History of myocardial infarction 2.09 (1.72–2.54) 3.03 (2.39–3.85) 1.29 (0.93–1.78)
History of stroke 2.19 (1.78–2.69) 2.56 (1.94–3.37) 1.83 (1.31–2.57)
History of cancer 1.31 (1.04–1.65) 1.18 (0.85–1.64) 1.44 (1.06–1.96)
Asthma 1.36 (0.97–1.90) 1.07 (0.63–1.81) 1.73 (1.10–2.47)
Chronic obstructive pulmonary disease 1.52 (1.22–1.88) 1.31 (0.97–1.77) 1.73 (1.30–2.30)
Bold values denote Po.05.
VITAMIN D AND MORTALITY 1599JAGS SEPTEMBER 2009–VOL. 57, NO. 9
likely that more than one-third of older adults now have25(OH)D levels of less than 50.0 nmol/L, which is associ-ated with higher risk for mortality, and few have levels of100.0 nmol/L or greater, which is associated with the lowestrisk for mortality.
CVD mortality, the leading cause of death in the UnitedStates, appeared to be the primary cause of the greater riskfor all-cause mortality.30 Early epidemiological studies sug-gested associations between CVD and markers of lowervitamin D status, including winter season, higher latitudes,lower altitudes, older age, and darker skin pigmentation.39
Several mechanisms for the protective effect of vitamin Dagainst CVD have been proposed, including beneficialchanges in cardiac function,40 blood pressure,2,3 arterialfunction,41 and inflammatory processes.42 For example,vitamin D may suppress the renin-angiotensin system43 andmatrix metalloproteinases,44 which are important in bloodpressure control and arterial wall compliance, respectively.Additionally, other epidemiological studies have found as-sociations between lower serum 25(OH)D levels and othercardiovascular risk factors,45 including diabetes mellitus4–7
and metabolic syndrome.46 Although it is likely that CVD isthe major component of the inverse association betweenvitamin D and mortality, it has been suggested that vita-min D may also have a beneficial effect on cancer13–17 andinfection,18–21 which are also important contributors to all-cause mortality, although the current study was underpow-ered to individually assess these cause-specific mortalityoutcomes.
The present study raises additional concerns aboutcurrent recommendations for vitamin D supplementation(200–600 IU/d),33 which are inadequate for most older U.S.adults to achieve serum 25(OH)D levels greater than 75.0to 100.0 nmol/L, the levels that are associated with optimalgeneral health and lower mortality.1,34,38 For instance,400 IU or 800 IU per day would raise 25(OH)D levels byonly approximately 11 or 22 nmol/L, respectively,47 whichwould be inadequate for many older adults based on thecurrent analysis. The only clinical trial of vitamin D in thegeneral U.S. population, the Women’s Health Study, failedto detect any effect of vitamin D and calcium supplement-ation on CVD mortality and morbidity,48 although thatstudy used a low-dose vitamin D supplementation (400 IU/d)and had several methodological concerns.49 A recent meta-analysis of 18 randomized controlled trials on bone healthfound that vitamin D supplementation of 400 to 800 IU perday reduced all-cause mortality by 7% (95% CI 5 1–13%),mostly due to CVD and infection-related mortality.26
Higher dose supplementation (e.g., 3000 IU/d), whichmay be given safely in monthly dosing,50 is more likely toraise serum 25(OH)D levels above 100.0 nmol/L in olderU.S. adults and thus may have more-impressive effects onCVD and all-cause mortality.
There are several potential limitations to this study.Serum was collected at only one point in time and pre-ferentially collected in northern states in the summerand southern states in the winter, although age and seasonwere controlled for, which limits the potential for biased
Table 3. Risk of All-Cause and Cause-Specific Mortality According to Serum 25-Hydroxyvitamin D Level in 3,408Older Adult Participants of the Third National Health and Nutrition Examination Survey
Cause of Mortality
Hazard Ratio (95% Confidence Interval)
Model 1 (n 5 3,408) Model 2 (n 5 3,303) Model 3 (n 5 3,265)
All cause (n 5 1,493)
o25.0 nmol/L 2.28 (1.44–3.59) 2.19 (1.34–3.55) 1.83 (1.14–2.94)
25.0–49.9 nmol/L 1.63 (1.24–2.15) 1.61 (1.21–2.16) 1.47 (1.09–1.97)
50.0–74.9 nmol/L 1.23 (0.95–1.60) 1.26 (0.96–1.66) 1.21 (0.92–1.59)
75.0–99.9 nmol/L 1.19 (0.91–1.57) 1.24 (0.93–1.64) 1.15 (0.86–1.53)
�100.0nmol/L 1.00 (ref) 1.00 (ref) 1.00 (ref)
Cardiovascular related (n 5 767)
o25.0 nmol/L 2.81 (1.48–5.32) 2.97 (1.53–5.78) 2.36 (1.17–4.75)
25.0–49.9 nmol/L 1.74 (1.16–2.63) 1.76 (1.16–2.68) 1.54 (1.01–2.34)
50.0–74.9 nmol/L 1.34 (0.91–1.99) 1.37 (0.92–2.04) 1.26 (0.85–1.88)
75.0–99.9 nmol/L 1.30 (0.86–1.96) 1.34 (0.88–2.02) 1.20 (0.79–1.81)
100.0 nmol/L 1.00 (ref) 1.00 (ref) 1.00 (ref)
Noncardiovascular (n 5 726)
o25.0 nmol/L 1.83 (0.97–3.45) 1.62 (0.82–3.18) 1.42 (0.73–2.79)
25.0–49.9 nmol/L 1.53 (1.04–2.24) 1.49 (0.99–2.24) 1.42 (0.94–2.13)
50.0–74.9 nmol/L 1.13 (0.80–1.60) 1.17 (0.81–1.71) 1.16 (0.79–1.68)
75.0–99.9 nmol/L 1.10 (0.76–1.59) 1.17 (0.79–1.72) 1.11 (0.75–1.63)
100.0 nmol/L 1.00 (ref) 1.00 (ref) 1.00 (ref)
Model 1: age, sex, race/ethnicity, and season.
Model 2 (1confounders): Model 1 plus poverty:income ratio, region, body mass index, physical activity, smoking status, cigarette pack years, asthma, chronic
obstructive pulmonary disease, and renal function.
Model 3 (1intermediates): Model 2 plus hypertension, diabetes mellitus, hyperlipidemia, history of myocardial infarction, history of stroke, and history of cancer
(nonskin).
Bold values denote Po.05.
1600 GINDE ET AL. SEPTEMBER 2009–VOL. 57, NO. 9 JAGS

results. This prospective cohort was an observational study;thus, the causality of the association between vitamin Dand mortality requires further study. The study attempted
to address this shortcoming by controlling for knownconfounders, but unmeasured confounding could exist.For instance, although common conditions associatedwith CVD and mortality were adjusted for, lower 25(OH)Dlevels may be a nonspecific marker of poor generalhealth, and thus, vitamin D insufficiency may identifyindividuals who are less likely to go outdoors and producevitamin D from sunlight exposure. Large randomizedcontrolled trials of vitamin D supplementation are requiredto enhance causal inference. Finally, it was not possibleto evaluate individual non-CVD mortality causes of mor-tality (e.g., cancer, infection) because of limited statisticalpower.
In summary, in noninstitutionalized older adults, agroup at high risk for mortality, baseline serum 25(OH)Dlevels had an independent, inverse association withCVD and all-cause mortality. Individuals with baseline25(OH)D levels less than 50.0 nmol/L appear to be at high-est risk for mortality, but levels of 100.0 nmol/L or greatermay be necessary for better survival. Current dosage rec-ommendations for vitamin D supplementation appear to beinadequate in most older adults to support these higher25(OH)D levels that are associated with optimal generalhealth and reduced mortality. Randomized controlled trialsof higher-dose vitamin D supplementation in older adultsare warranted to determine whether this association iscausal and reversible.
ACKNOWLEDGMENTS
Conflict of Interest: The editor in chief has reviewed theconflict of interest checklist provided by the authors and hasdetermined that the authors have no financial or any otherkind of personal conflicts with this paper.
Figure 1. Survival (Kaplan-Meier) curves for mortality accordingto serum 25-hydroxyvitamin D levels. (A) All-cause mortality. Com-pared with �100.0 nmol/L group: Po.001 for o25.0 nmol/L,P 5.004 for 25.0–49.9 nmol/L, P 5.12 for 50.0–74.9 nmol/L, andP 5.14 for 75.0–99.9 nmol/L. (B) Cardiovascular disease mortality.Compared with �100 nmol/L group: Po.001 for o25.0 nmol/L,P 5.02 for 25.0–49.9nmol/L, P 5.12 for 50.0–74.9 nmol/L, andP 5.15 for 75.0–99.9 nmol/L. (C) Noncardiovascular diseasemortality. Compared with �100.0 nmol/L group: P 5.02 foro25 nmol/L, P 5.07 for 25.0–49.9 nmol/L, P 5.50 for 50.0–74.9 nmol/L, and P 5.52 for 75.0–99.9 nmol/L. Serum 25-hydroxyvitamin D levels: dark solid: �100.0 nmol/L; graydashed: 75.0–99.9 nmol/L; gray solid: 50.0–74.9 nmol/L; blackdashed: 25.0–49.9 nmol/L; black solid: o25.0 nmol/L.
0.5
1
1.5
2
2.5
3
20 30 40 50 60 70 80 90 100 110 120Serum 25(OH)D Levels, nmol/L
Mo
rtal
ity
Haz
ard
Rat
io
Figure 2. Adjusted hazard ratios for all-cause mortality accord-ing to serum 25-hydroxyvitamin D (25(OH)D) deciles. X-axisvalues for point estimates represent median 25(OH)D value ineach decile. Error bars represent 95% confidence intervals foreach mortality hazard ratio estimate. Referent group was highestdecile (4103 nmol/L; group median 115 nmol/L). Values ad-justed for age, season, sex, race or ethnicity, poverty:income ra-tio, region, body mass index, physical activity, smoking status,cigarette pack years, asthma, chronic obstructive pulmonarydisease, and renal function.
VITAMIN D AND MORTALITY 1601JAGS SEPTEMBER 2009–VOL. 57, NO. 9

Dr. Ginde was supported by the University of ColoradoDenver Hartford/Jahnigen Center of Excellence in Geriat-rics and National Institutes of Health (NIH) Grant KL2RR025779. Dr. Scragg was supported by the HealthResearch Council of New Zealand. Dr. Schwartz wassupported by NIH Grants R01 AG019339 and R01AG028746. Dr. Camargo was supported by the Massachu-setts General Hospital Center for D-receptor ActivationResearch and NIH Grant R01 HL84401.
Author Contributions: Dr. Ginde had full access to allof the data in the study and takes responsibility for theintegrity of the data and the accuracy of the data analysis.Study concept and design: Ginde, Camargo. Acquisition ofdata: Ginde. Analysis and interpretation of data: Ginde,Scragg, Schwartz, Camargo. Preparation of the manuscript:Ginde. Critical revision of the manuscript for importantintellectual content: Ginde, Scragg, Schwartz, Camargo.Statistical analysis: Ginde.
Sponsor’s Role: The sponsors had no role in the design,methods, analysis, or preparation of the manuscript.
REFERENCES
1. Holick MF. Vitamin D deficiency. N Engl J Med 2007;357:266–281.
2. Forman JP, Giovannucci E, Holmes MD et al. Plasma 25-hydroxyvitamin D
levels and risk of incident hypertension. Hypertension 2007;49:1063–1069.
3. Scragg R, Sowers M, Bell C. Serum 25-hydroxyvitamin D, ethnicity, and blood
pressure in the Third National Health and Nutrition Examination Survey. Am
J Hypertens 2007;20:713–719.
4. Scragg R, Holdaway I, Singh V et al. Serum 25-hydroxyvitamin D3 levels
decreased in impaired glucose tolerance and diabetes mellitus. Diabetes Res
Clin Pract 1995;27:181–188.
5. Scragg R, Sowers M, Bell C. Serum 25-hydroxyvitamin D, diabetes, and eth-
nicity in the Third National Health and Nutrition Examination Survey.
Diabetes Care 2004;27:2813–2818.
6. Pittas AG, Dawson-Hughes B, Li T et al. Vitamin D and calcium intake in
relation to type 2 diabetes in women. Diabetes Care 2006;29:650–656.
7. Chonchol M, Scragg R. 25-hydroxyvitamin D, insulin resistance, and kidney
function in the Third National Health and Nutrition Examination Survey.
Kidney Int 2007;71:134–139.
8. Scragg R, Jackson R, Holdaway IM et al. Myocardial infarction is inversely
associated with plasma 25-hydroxyvitamin D3 levels: A community-based
study. Int J Epidemiol 1990;19:559–563.
9. Kendrick J, Targher G, Smits G et al. 25-hydroxyvitamin D deficiency is in-
dependently associated with cardiovascular disease in the Third National
Health and Nutrition Examination Survey. Atherosclerosis 2008 Nov 11.
[Epub ahead of print].
10. Giovannucci E, Liu Y, Hollis BW et al. 25-hydroxyvitamin D and risk of
myocardial infarction in men: A prospective study. Arch Intern Med 2008;168:
1174–1180.
11. Dobnig H, Pilz S, Scharnagl H et al. Independent association of low
serum 25-hydroxyvitamin D and 1,25-dihydroxyvitamin D levels
with all-cause and cardiovascular mortality. Arch Intern Med 2008;168:
1340–1349.
12. Wang TJ, Pencina MJ, Booth SL et al. Vitamin D deficiency and risk of car-
diovascular disease. Circulation 2008;117:503–511.
13. Garland C, Comstock GW, Garland FC et al. Serum 25-hydroxyvitamin D and
colon cancer: Eight-year prospective study. Lancet 1989;2:1176–1178.
14. Giovannucci E, Liu Y, Rimm EB et al. Prospective study of predictors of
vitamin D status and cancer incidence and mortality in men. J Natl Cancer Inst
2006;98:451–459.
15. Garland CF, Garland FC, Gorham ED et al. The role of vitamin D in cancer
prevention. Am J Public Health 2006;96:252–261.
16. Lin J, Manson JE, Lee IM et al. Intakes of calcium and vitamin D and breast
cancer risk in women. Arch Intern Med 2007;167:1050–1059.
17. Lappe JM, Travers-Gustafson D et al. Vitamin D and calcium supplementation
reduces cancer risk: Results of a randomized trial. Am J Clin Nutr 2007;85:
1586–1591.
18. Cannell JJ, Vieth R, Umhau JC et al. Epidemic influenza and vitamin D.
Epidemiol Infect 2006;134:1129–1140.
19. Liu PT, Stenger S, Li H et al. Toll-like receptor triggering of a vitamin
D-mediated human antimicrobial response. Science 2006;311:1770–1773.
20. Laaksi I, Ruohola JP, Tuohimaa P et al. An association of serum vitamin D
concentrations o40 nmol/L with acute respiratory tract infection in young
Finnish men. Am J Clin Nutr 2007;86:714–717.
21. Ginde AA, Mansbach JM, Camargo CA Jr. Association between serum 25-
hydroxyvitamin D level and upper respiratory tract infections in the Third
National Health and Nutrition Examination Survey. Arch Intern Med
2009;169:384–390.
22. Avenell A, Cook JA, Maclennan GS et al. Vitamin D supplementation to
prevent infections: A sub-study of a randomised placebo-controlled trial in
older people (RECORD trial, ISRCTN 51647438). Age Ageing 2007;36:
574–577.
23. Martineau AR, Wilkinson RJ, Wilkinson KA et al. A single dose of vitamin D
enhances immunity to mycobacteria. Am J Respir Crit Care Med
2007;176:208–213.
24. Wolf M, Shah A, Gutierrez O et al. Vitamin D levels and early mortality among
incident hemodialysis patients. Kidney Int 2007;72:1004–1013.
25. Melamed ML, Michos ED, Post W. 25-hydroxyvitamin D levels and the
risk of mortality in the general population. Arch Intern Med 2008;168:
1629–1637.
26. Autier P, Gandini S. Vitamin D supplementation and total mortality: A meta-
analysis of randomized controlled trials. Arch Intern Med 2007;167:
1730–1737.
27. Wolf M, Betacourt J, Chang Y et al. Impact of activated vitamin D and
race on survival among hemodialysis patients. J Am Soc Nephrol 2008;19:
1379–1388.
28. Kovesdy CP, Ahmadzadeh S, Anderson JE et al. Association of activated vi-
tamin D treatment and mortality in chronic kidney disease. Arch Intern Med
2008;168:397–403.
29. Naves-Diaz M, Alvarez-Hernandez D, Passlick-Deetjen J et al. Oral active
vitamin D is associated with improved survival in hemodialysis patients. Kid-
ney Int 2008;74:1070–1078.
30. Heron MP, Hoyert DL, Xu J et al. Deaths: Preliminary data for 2006. Natl
Vital Stat Rep 2007, 1–52.
31. Scragg R, Camargo CA Jr. Frequency of leisure time physical activity and
serum 25-hydroxyvitamin D levels in the U.S. population: Results from the
Third National Health and Nutrition Examination Survey. Am J Epidemiol
2008;168:577–586.
32. Ginde AA, Liu MC, Camargo CA Jr. Demographic differences and trends of
vitamin D insufficiency in the US population, 1988–2004. Arch Intern Med
2009;169:626–632.
33. Standing Committee on the Scientific Evaluation of Dietary Reference Intakes
Food and Nutrition Board, Institute of Medicine. Dietary Reference Intakes
for Calcium, Phosphorus, Magnesium, Vitamin D, and Fluoride. Washington,
DC: National Academy Press, 1999.
34. Vieth R, Bischoff-Ferrari H, Boucher BJ et al. The urgent need to recommend
an intake of vitamin D that is effective. Am J Clin Nutr 2007;85:649–650.
35. Centers for Disease Control and Prevention (CDC). National Center for
Health Statistics (NCHS). National Health and Nutrition Examination Survey
Data. Hyattsville, MD: U.S. Department of Health and Human Services. [on-
line]. Available at http://www.cdc.gov/nchs/about/major/nhanes/nh3data.htm
Accessed January 18, 2009.
36. Looker AC, Dawson-Hughes B, Calvo MS et al. Serum 25-hydroxyvitamin D
status of adolescents and adults in two seasonal subpopulations from
NHANES III. Bone 2002;30:771–777.
37. Coresh J, Astor BC, Greene T et al. Prevalence of chronic kidney disease and
decreased kidney function in the adult US population. Third National Health
and Nutrition Examination Survey. Am J Kidney Dis 2003;41:1–12.
38. Bischoff-Ferrari HA, Giovannucci E, Willett WC et al. Estimation of optimal
serum concentrations of 25-hydroxyvitamin D for multiple health outcomes.
Am J Clin Nutr 2006;84:18–28.
39. Scragg R. Sunlight, vitamin D and cardiovascular disease. In: Crass MF, Av-
ioloi LV, editors. Calcium-Regulating Hormones and Cardiovascular Func-
tion. Boca Raton: CRC Press, 1995, pp 213–237.
40. Weishaar RE, Kim SN, Saunders DE et al. Involvement of vitamin D3 with
cardiovascular function. III. Effects on physical and morphological properties.
Am J Physiol 1990;258:E134–E142.
41. Sugden JA, Davies JI, Witham MD et al. Vitamin D improves endothelial
function in patients with type 2 diabetes mellitus and low vitamin D levels.
Diabet Med 2008;25:320–325.
42. Willheim M, Thien R, Schrattbauer K et al. Regulatory effects of 1alpha,25-
dihydroxvitamin D3 on the cytokine production of human peripheral blood
lymphocytes. J Clin Endocrinol Metab 1999;84:3739–3744.
43. Li YC, Kong J, Wei M et al. 1,25-dihydroxyvitamin D(3) is a negative en-
docrine regulator of the rennin angiotensin system. J Clin Invest 2002;110:
229–238.
1602 GINDE ET AL. SEPTEMBER 2009–VOL. 57, NO. 9 JAGS

44. Timms PM, Mannan N, Hitman GA et al. Circulating MMP9, vitamin D and
variation in the TIMP-1 response with VDR genotype: Mechanisms for in-
flammatory damage in chronic disorders? OJM 2002;95:787–796.
45. Martins D, Wolf M, Pan D et al. Prevalence of cardiovascular risk factors and
the serum levels of 25-hydroxyvitamin D in the United States: Data from the
Third National Health and Nutrition Examination Survey. Arch Intern Med
2007;167:1159–1165.
46. Ford ES, Ajani UA, McGuire LC et al. Concentrations of serum vitamin D and
the metabolic syndrome among US adults. Diabetes Care 2005;28:1228–1230.
47. Barger-Lux MS, Heaney RP, Dowell S et al. Vitamin D and its major metab-
olites: Serum levels after graded oral dosing in healthy men. Osteoporos Int
1998;8:222–230.
48. Hsia J, Heiss G, Ren H et al. Calcium/vitamin D supplementation and car-
diovascular events. Circulation 2007;115:846–854.
49. Michos ED, Blumenthal RS. Vitamin D supplementation and cardiovascular
risk [letter]. Circulation 2007;115:827–828.
50. Bacon CJ, Gamble GD, Horne AM et al. High-dose oral vitamin D3 supple-
mentation in the elderly. Osteoporos Int 2009; in press.
VITAMIN D AND MORTALITY 1603JAGS SEPTEMBER 2009–VOL. 57, NO. 9


![Vitamin D Deficiency: Impact on Neuropsychiatric Disorderscdn.neiglobal.com/content/encore/congress/2011/slides_at...Mean Serum 25-hydroxyvitamin D (25[OH]D) Levels in the Third National](https://img.pdfslide.net/doc/110x75/60cecdd7c53ab5441b687b84/vitamin-d-deficiency-impact-on-neuropsychiatric-mean-serum-25-hydroxyvitamin.jpg)


![eprints.whiterose.ac.ukeprints.whiterose.ac.uk/151893/9/Zhang... · Web view[9] Targher G, Bertolini L, Scala L et al. Associations between serum 25-hydroxyvitamin D3 concentrations](https://img.pdfslide.net/doc/110x75/5ec0ca15456e3f18ae1c2b9d/web-view-9-targher-g-bertolini-l-scala-l-et-al-associations-between-serum-25-hydroxyvitamin.jpg)