Embed Size (px)
Citation preview
PROTECTIVE VENTILATION VS. HYPERCAPNIA FOR THE ATTENUATION OF VENTILATOR-ASSOCIATED LUNG INJURY
by
Nada Mezher Ismaiel
Submitted in partial fulfilment of the requirements for the degree of Master of Science
at
Dalhousie University Halifax, Nova Scotia
August 2011
© Copyright by Nada Mezher Ismaiel, 2011

DALHOUSIE UNIVERSITY
DEPARTMENT OF PHYSIOLOGY AND BIOPHYSICS
The undersigned hereby certify that they have read and recommend to the Faculty of
Graduate Studies for acceptance a thesis entitled “PROTECTIVE VENTILATION VS.
HYPERCAPNIA FOR THE ATTENUATION OF VENTILATOR-ASSOCIATED
LUNG INJURY” by Nada Mezher Ismaiel in partial fulfilment of the requirements for
the degree of Master of Science.
Dated: August 10, 2011
Supervisor: _________________________________
Readers: _________________________________
_________________________________
_________________________________
Departmental Representative: _________________________________
ii
DALHOUSIE UNIVERSITY
DATE: August 10, 2011
AUTHOR: Nada Mezher Ismaiel
TITLE: PROTECTIVE VENTILATION VS. HYPERCAPNIA FOR THE ATTENUATION OF VENTILATOR-ASSOCIATED LUNG INJURY
DEPARTMENT OR SCHOOL: Department of Physiology and Biophysics
DEGREE: MSc CONVOCATION: October YEAR: 2011
Permission is herewith granted to Dalhousie University to circulate and to have copied for non-commercial purposes, at its discretion, the above title upon the request of individuals or institutions. I understand that my thesis will be electronically available to the public. The author reserves other publication rights, and neither the thesis nor extensive extracts from it may be printed or otherwise reproduced without the author’s written permission. The author attests that permission has been obtained for the use of any copyrighted material appearing in the thesis (other than the brief excerpts requiring only proper acknowledgement in scholarly writing), and that all such use is clearly acknowledged.
_______________________________ Signature of Author
iii
DEDICATION
I dedicate this Master of Science thesis to my parents for their continued support.
iv

TABLE OF CONTENTS
LIST OF TABLES...........................................................................................................viii
LIST OF FIGURES ........................................................................................................... ix
ABSTRACT....................................................................................................................... xi
LIST OF ABBREVIATIONS USED ...............................................................................xii
ACKNOWLEDGEMENTS.............................................................................................xiv
CHAPTER 1 INTRODUCTION ........................................................................................1
1.1 ...................................................... 1 ACUTE LUNG INJURY
1.1.1 Definitions and Prevalence .................................... 1
1.1.2 Causes of Acute Lung Injury.................................. 2
1.1.3 Ventilator-Associated Lung Injury........................... 2
1.1.4 Local and Systemic Manifestations of VALI............... 4
1.2 MECHANICAL VENTILATION............................................. 7
1.2.1 Definition and Context .......................................... 7
1.2.2 Modes of Ventilation ............................................. 7
1.2.3 Ventilation Strategies ………………………………………………. 8
1.3 HYPERCAPNIA AND HYPERCAPNIC ACIDOSIS .................... 111.3.1 Anti-Inflammatory Effects ................................... 11
1.3.2 Effects on Other Organs………………………………………….. 14
1.3.3 Potentially Harmful Effects………………………………….…… 16
1.4 PURPOSE AND HYPOTHESES ........................................ 18
1.4.1 Purpose of the Study…………….………………………..……...18
1.4.2 Research Hypotheses…………….………………………..……...19
CHAPTER 2 MATERIALS AND METHODS ..............................................................21
2.1 RAT HANDLING AND INSTRUMENTATION ...................... 21
2.2 EQUIPMENT CALIBRATION .......................................... 22
2.3 PHYSIOLOGIC MEASUREMENTS ................................... 23
2.3.1 Hemodynamics……………………………….……………….…... 23
2.3.2 Respiratory Mechanics……………..……………………..…... 24
v

2.3.3 Gas Exchange……………..……..…………………..……. 25
2.4 EXPERIMENTAL PROTOCOL ............................................ 25
2.4.1 Sedation Protocol……………..………………….………...…... 25
2.4.2 Acute Lung Injury…………………………………………………… 26
2.4.3 Mechanical Ventilation…………………………….……………. 27
2.4.4 Tissue Dissection Protocol………………….…..……………. 28
2.5 TISSUE PROCESSING AND HISTOLOGICAL PREPARATION 30
2.6 HISTOLOGICAL SCORING AND ANALYSIS....................... 31
2.7 CYTOKINE ANALYSIS................................................... 31
2.8 TISSUE HOMOGENIZATION.......................................... 33
2.9 BRADFORD PROTEIN ASSAY......................................... 34
2.10 WESTERN BLOTTING FOR CASPASE-3 AND ACTIN........... 35
2.11 DENSITOMETRIC ANALYSIS OF CASPASE-3 EXPRESSION 36
2.12 STATISTICAL ANALYSIS .............................................. 37
CHAPTER 3 RESULTS..................................................................................................38
3.1 HEMODYNAMICS......................................................... 38
3.2 RESPIRATORY MECHANICS .......................................... 38
3.2.1 CONFIRMATION OF EXPERIMENTAL DESIGN……………………..38
3.3 GAS EXCHANGE.......................................................... 40
3.4 WET-TO-DRY LUNG RATIO ........................................... 41
3.5 DIFFUSE ALVEOLAR DAMAGE LUNG INJURY SCORE ......... 41
3.6 CYTOKINE ANALYSIS................................................... 43
3.6.1 Plasma Cytokines…………………………………………………… 43
3.6.2 BALF Cytokines.........................................................................43
3.7 CASPASE-3 ACTIVATION IN LUNG HOMOGENATES .......... 44
CHAPTER 4 DISCUSSION...........................................................................................45
4.1 PHYSIOLOGIC EFFECTS ................................................ 45
vi

4.2 SYSTEMIC AND PULMONARY INFLAMMATION................... 54
4.3 APOPTOSIS IN THE LUNG.............................................. 61
4.4 PERMISSIVE VS. THERAPEUTIC HYPERCAPNIA ................. 63
4.5 LIMITATIONS OF THE STUDY......................................... 65
4.5.1 Ventilation Settings ........................................... 65
4.5.2 Ventilation Duration ................................................................66
4.5.3 PaCO Targets2 .................................................. 68
4.5.4 Rat Strain ........................................................ 69
4.5.5 Assessment of Survival ...................................... 70
4.5.6 Representative Lung Sampling ...........................................70
4.6 SUPPORT FOR HYPOTHESES.......................................... 71
4.7 CLINICAL IMPLICATIONS AND CONCLUSIONS.................. 72
REFERENCES ................................................................................................................74
APPENDIX 1: TABLES..................................................................................................90
APPENDIX 2: FIGURES................................................................................................95
vii

LIST OF TABLES
Table 1 Summary of target ventilation settings for tidal volume, respiratory rate and partial pressure of carbon dioxide…………………………………90 Table 2 Hemodynamic measurements of mean arterial pressure, heart rate and cardiac index at baseline, 1 hour and 4 hours of ventilation………….. 91 Table 3 Respiratory mechanic measurements of tidal volume, respiratory rate, minute ventilation and elastance at baseline, 1 hour and 4 hours of ventilation…………………………………………………….…….93
Table 4 Gas exchange measurements of partial pressure of oxygen and Carbon dioxide, and pH at baseline, 1 hour and 4 hours of ventilation…………………………………………………………………... 94
viii
LIST OF FIGURES
Figure 1 Schematic diagram of the protective effects of hypercapnic acidosis……………………………………………………………………... 95
Figure 2 Flow chart outlining the experimental protocol……………………….......... 96 Figure 3 Mean arterial pressure measurements at baseline, 1 hour and 4 hours of ventilation……………………………………………...….… 97 Figure 4 Heart rate measurements at baseline, 1 hour and 4 hours of ventilation……………………………………………………..………...…… 98 Figure 5 Measurements of cardiac index at baseline, 1 hour and 4 hours of ventilation…………………………………………………………...…….. 99 Figure 6 Tidal volume measurements at baseline, 1 hour and 4 hours of ventilation…………………………………………………………...…...…. 100 Figure 7 Respiratory rate measurements at baseline, 1 hour and 4 hours of ventilation………………………………………………………………... 101 Figure 8 Minute ventilation measurements at baseline, 1 hour and 4 hours of ventilation…………………………………………………………...…… 102 Figure 9 Elastance measurements at baseline, 1 hour and 4 hours of ventilation………………………………………………………………...… 103 Figure 10 Measurements of the partial pressure of oxygen at baseline, 1 hour and 4 hours of ventilation………...………………………………......104 Figure 11 Measurements of the partial pressure of carbon dioxide at baseline, 1 hour and 4 hours of ventilation……………………………..…. 105 Figure 12 Measurements of arterial pH at baseline, 1 hour and 4 hours of of ventilation………………………………………………………………...106 Figure 13 Postmortem wet/dry lung ratio……………….…………………………...…107 Figure 14 Diffuse Alveolar Damage lung injury score……….…………………...….. 108 Figure 15 Diffuse Alveolar Damage subscores: Interstitial Edema, Alveolar Edema, Hyaline Membranes, Atelectasis and Alveolar Damage …………..110 Figure 16 Lung histo-pathology stained with hematoxylin and eosin…………………113
ix
Figure 17 Cytokine and chemokine concentrations in plasma………………..……… 116 Figure 18 Cytokine and chemokine concentrations in bronchoalveolar lavage fluid……………………………………………………………….... 120 Figure 19 Western blot analysis of caspase-3 expression in lung homogenates…………………………………………………………......… 123 Figure 20 Ratio of active: inactive caspase-3 in rat lung homogenates after 4 hours of ventilation……………………………...………….…….... 124
x

ABSTRACT Mechanically ventilated patients are at risk of developing Ventilator-Associated Lung
Injury (VALI). Improved ventilation strategies by lung-protective settings may cause
hypercapnia. This study investigated whether attenuation of VALI is attributed to
protective ventilation with low tidal volume (VT) or hypercapnia. Lung injury was
induced in rats by instillation of 1.25M HCl. Ten rats each were ventilated for 4 hours
with: Conventional Normocapnia (highVT), Lung-Protective Ventilation (VT 8mL/Kg),
Injurious Normocapnia (highVT, added dead space), Conventional Hypercapnia
(highVT, inhaled CO2), Protective Hypercapnia (VT 8mL/Kg, inhaled CO2) and
Permissive Hypercapnia (VT 8mL/Kg, hypoventilation). Lung-Protective Ventilation
reduced pulmonary edema compared to Conventional and Injurious Normocapnia.
Therapeutic hypercapnia reduced alveolar damage and inflammation by reducing IL-6
and MCP-1 in the lung, and IL-1 and TNF- systemically. Therapeutic hypercapnia may
be more effective in attenuating some of the biomarkers of VALI and protecting the lung
than protective ventilation alone.
xi
LIST OF ABBREVIATIONS USED
ALI Acute Lung Injury ANOVA Analysis of Variance AP-1 Activator Protein-1 ARDS Acute Respiratory Distress Syndrome BALF Bronchoalveolar Lavage Fluid BIPAP Bi-level Positive Airway Pressure BSA Bovine Serum Albumin CI Cardiac Index CMV Controlled Mechanical Ventilation CO Cardiac Output CO2 Carbon Dioxide CRE c-fos Responsive Element CV Conventional Ventilation DAD Diffuse Alveolar Damage DAMPs Damage-Associated Molecular Pattern molecules ECG Electrocardiogram EDTA Ethylenediaminetetraacetic Acid Dipotassium Dihydrate FiO2 Fraction of Inspired Oxygen GM-CSF Granulocyte Macrophage-Colony Stimulating Factor HCA Hypercapnic Acidosis HCl Hydrochloric Acid HCO3
- Bicarbonate
HR Heart Rate ICAM-1 Intercellular Adhesion Molecule-1 1- B Inhibitory- kappa B IL-1 Interleukin-1 IL-1RA Interleukin-1 Receptor Antagonist IL-4 Interleukin-4 IL-6 Interleukin-6 IL-8 Interleukin-8 IL-10 Interleukin-10 IL-13 Interleukin-13 KC Keratinocyte Chemoattractant KCl Potassium Chloride LPV Lung-Protective Ventilation MAP Mean Arterial Pressure MCP-1 Monocyte Chemoattractant Protein-1 MIP-1 /2 Macrophage Inflammatory Protein-1 or 2 MMP-9 Matrix Metalloproteinase-9 MODS Multiple Organ Dysfunction Syndrome NF- B Nuclear Factor- kappa B NOS Nitric Oxide Synthase O2
-2 Superoxide Radical
OD Optical Density
xii
PaCO2 Partial Pressure of Carbon Dioxide PaO2 Partial Pressure of Oxygen P/F Partial Pressure of O2: Fraction of Inspired O2 PEEP Positive End-Expiratory Pressure PHC Permissive Hypercapnia PMN Polymorphonuclear PSV Pressure Support Ventilation RIPA Radioimmunoprecipitation Assay RNS Reactive Nitrogen Species ROS Reactive Oxygen Species RR Respiratory Rate TACE Tumor Necrosis Factor Alpha Conveting Enzyme THC Therapeutic Hypercapnia TLC Total Lung Capacity TNF- Tumor Necrosis Factor- TUNEL Terminal Deoxynucleotidyl Transferase dUTP Nick End Labeling VALI Ventilator-Associated Lung Injury VA/Q Ventilation/Perfusion VE Minute Ventilation VEGF Vascular Endothelial Growth Factor VT Tidal Volume W/D Wet-to Dry Lung Ratio
xiii

xiv
ACKNOWLEDGEMENTS
First, I would like to thank my supervisor Dr. Dietrich Henzler for his guidance, support
and help throughout the completion of my MSc and the preparation of this thesis.
Thank you to my supervisory committee members Drs. Elizabeth Cowley and Brent
Johnston for their helpful suggestions and feedback.
A major thanks goes to Nancy McGrath, Sara Whynot, Dr. Juan Zhou, Mandana Kianian,
Raymond Chankalal, Ayham Al-Afif, Dr. Jean Marshall, Carolyn Doucette, Dustin
Conrad, Dr. Valérie Chappe and Dr. Zhaolin Xu for their technical assistance. Also,
thank you to our collaborators Drs. Haibo Zhang and Arthur Slutsky at the University of
Toronto.
I extend my sincere appreciation to my family for their continuous support and
encouragement throughout my academic career to date.
This research project was funded by the Canadian Institutes of Health Research Frederick
Banting and Charles Best Canada Graduate Scholarship, and the Dalhousie University
Faculty of Medicine.
CHAPTER 1 INTRODUCTION
1.1 Acute Lung Injury
1.1.1 Definitions and Prevalence Acute Lung Injury (ALI) is a critical condition where damage to the lungs causes
a severe impairment in gas exchange and hemodynamic deterioration, eventually leading
to systemic inflammation and hypoxemic respiratory failure (Rubenfeld et al. 2005).
Based on a survey in the United States, in North America ALI is estimated to develop for
79 in every 100,000 individuals (Rubenfeld et al. 2005). On average, the mortality rate of
ALI patients is approximately 38.5% (Rubenfeld et al. 2005), and has been reported to be
as high as 50% in Europe (Brun-Buisson et al. 2004). The criteria for ALI diagnosis are
defined by the acute onset of injury with a ratio of arterial partial pressure of oxygen to
fraction of inspired oxygen (PaO2:FiO2) equal to or less than 300 mmHg (normally at
500 mmHg), and the presence of bilateral pulmonary infiltrates of non-cardiogenic origin
(Bernard et al. 1994; Ware and Matthay 2000). The bilateral chest infiltrates are not
consistent with left atrial hypertension, and therefore suggest the presence of non-
cardiogenic pulmonary edema (Ware and Matthay 2000).
Acute Respiratory Distress Syndrome (ARDS) is the more severe form of ALI,
and is defined by a PaO2:FiO2 ratio that is equal to or less than 200 mmHg, along with
the criteria used for ALI diagnosis (Ware and Matthay 2000). In addition to the impaired
gas exchange and hemodynamic compromise that is characteristic of ALI, ARDS is
marked by a hypoxemic state that is more severe than that of ALI (Thomsen and Morris,
1995). ARDS is a more complex manifestation of ALI, and approximately 20-50% of
1

ALI patients progress to ARDS within seven days of developing ALI. In the United
States, the ARDS mortality rate is estimated at approximately 41%, and almost 58% in
Europe (Rubenfeld et al. 2005; Brun-Buisson et al. 2004).
1.1.2 Causes of Acute Lung Injury
Acute Lung Injury may be directly caused by pneumonia, aspiration of acidic
gastric content or inhalation of toxic substances, and indirectly by sepsis and physical
trauma, among other conditions (Ware and Matthay, 2000). The resulting ALI leads to
severe oxygenation impairment, and thus patients require ventilatory support. This is
primarily achieved by mechanical ventilation, which is used to restore gas exchange
(Tremblay and Slutsky, 2006). However, it is now accepted that mechanical ventilation
itself, while supportive, has the potential to exacerbate the existing lung injury, and may
contribute to morbidity and mortality associated with ALI (Tremblay and Slutsky, 2006).
This exacerbated state has been termed Ventilator-Associated Lung Injury (VALI), and is
primarily caused by the addition of positive or negative pressure to the lungs during
ventilation (Pinhu et al. 2003).
1.1.3 Ventilator-Associated Lung Injury
VALI subjects the injured lungs to further damage by four primary mechanisms:
volutrauma, barotrauma, atelectotrauma, and biotrauma. Volutrauma is the injury caused
by mechanical ventilation using high tidal volumes (VT) (Dreyfuss et al. 1988).
Volutrauma has been shown to be injurious to the lungs by causing overdistention
2
(hyperinflation), often to the total lung volume capacity (TLC) (Pinhu et al. 2003;
Dreyfuss et al. 1988). Clinical trials have demonstrated that ventilation with a VT of 12
ml/kg predicted body weight produced volutrauma, and resulted in morbidity and
mortality in ventilated ALI and ARDS patients (Petrucci and Lacovelli, 2004; ARDS
Network, 2000). Volutrauma is typically accompanied by barotrauma, a mechanism of
injury caused by ventilation with high inspiratory plateau pressures (Oeckler and
Hubmayr, 2007). Barotrauma causes severe damage to the connective tissue matrix
around alveolar spaces, and leads to the leakage of various substances into extra-alveolar
spaces, including proteins and air (Oeckler and Hubmayr, 2007). Together, volutrauma
and barotrauma are the adverse effects of ventilatory attempts to restore physiologic gas
exchange in the short-term, but actually cause VALI in the long-term.
Atelectotrauma is another common mechanism of VALI, and is characterized by
alveolar collapse resulting from cyclic opening and closing of alveoli during mechanical
ventilation (Pinhu et al. 2003). The continuous recruitment and derecruitment of alveoli
and small airways leads to airway collapse, and thus no gas exchange can occur at these
collapsed and/or occluded airways. As such, pulmonary gas exchange deteriorates further
and contributes to the potentiation of VALI. Positive-End Expiratory Pressure (PEEP) is
often applied during mechanical ventilation in order to prevent repeated opening and
closing of airways and ultimately improve gas exchange. However, PEEP itself, if
applied excessively and continuously, has the potential to produce barotrauma by
damaging the alveolar barrier membranes (Oeckler and Hubmayr, 2007).
The VALI resulting from volutrauma, barotrauma and atelectotrauma is
accompanied by excessive stress, strain and physical damage to epithelial cells. This
3

activates various chemical mediators that promote cell and tissue inflammation, a
phenomenon known as biotrauma (Pinhu et al. 2003; Oeckler and Hubmayr, 2007).
These chemical mediators are bioactive molecules involved in complex signaling
pathways. Ultimately, biotrauma is an outcome of widespread inflammation by the
release of additional cytokines and chemokines from leukocytes and epithelial cells,
formation of reactive biological species (oxygen- and nitrogen-based), and activation of
mediators that promote cell death, including tumor necrosis factor- (Oeckler and
Hubmayr, 2007).
1.1.4 Local and Systemic Manifestations of VALI
Mechanical stress on the lungs causes biotrauma on a local (pulmonary) and
systemic level. Locally, the release of cytokines, chemokines and other chemoattractant
molecules from alveolar macrophages and epithelial cells recruits polymorphonuclear
(PMN) cells such as neutrophils, basophils and eosinophils to the lungs (Imanaka et al.
2001). PMN cells infiltrate the lungs by adhering to the endothelial surface of pulmonary
capillaries, aggregating and modifying their shape to translocate from the circulation into
the lung interstitium (Reutershan and Ley, 2004). Upon entering the lungs, a complex
network of cytokines and other pro-inflammatory mediators is released into the airspaces,
thereby potentiating the inflammatory state of the lungs. This process involves activation
of the transcription factor Nuclear Factor Kappa-B (NF- B), which mediates the
production of pro-inflammatory genes coding for cytokines, chemokines and other
inflammatory substances (Fan et al. 2001).
In its inactive state, NF- B is bound to Inhibitory B (I- B) in the cytoplasm,
which prevents its translocation to the nucleus. NF- B activation can be triggered by a
4

variety of stimuli, including pro-inflammatory signaling molecules (cytokines and
chemokines), reactive oxygen species (ROS), and bacterial and viral products at the cell
surface and intracellularly by toll-like receptor activation (Barnes and Karin, 1997).
Activation of NF- B is the final stage of the signal cascade initiated at the cell surface,
and leads to the phosphorylation of I- B, followed by its dissociation from NF- B (Fan et
al. 2001). In turn, this leaves NF- B free to translocate to the nucleus, bind to and
transcribe downstream pro-inflammatory mediators such as TNF- , interleukin (IL)-1 ,
IL-6, MIP-2 and IL-8. Anti-inflammatory mediators such as IL-1 receptor antagonist
(IL-1RA), IL-4, IL-10 and IL-13 are generated in response to the pro-inflammatory
agents (Goodman et al. 1996). However, in ALI and ARDS, there is a marked imbalance
between pro- and anti-inflammatory cytokines that correlates with the severity of injury
and mortality rates (Donnelly et al. 1996). In the lungs, this translates into a disruption in
alveolar and endothelial barrier function, and programmed cell death (apoptosis), leading
to deterioration of gas exchange, hypoxia, and acute respiratory failure (Ware and
Matthay, 2000).
Respiratory failure may also serve as the gateway to multiple organ failure, also
known as Multiple Organ Dysfunction Syndrome (MODS). This is by way of a
“spillover” of inflammatory mediators from the lungs into the systemic circulation (Plötz
et al. 2004; Slutsky and Tremblay, 1998). The release of inflammatory mediators into the
circulation from the lungs is facilitated by increased permeability of the alveolar-capillary
interface, in addition to the fact that the large surface area of the lungs is exposed to a
sizable fraction of the total circulating blood (Tutor et al. 1994; Debs et al. 1998). While
the mechanisms of cytokine “spillover” remain unclear, it is possible that the
5
translocation of cytokines into the systemic circulation is mediated by the increase the
permeability of the pulmonary endothelium. Under physiologic conditions, healthy
pulmonary endothelium plays an important role in filtering the blood before it enters the
systemic circulation (Orfanos et al. 2004). Since lung injury has been associated with
extensive damage to endothelial cells (Orfanos et al. 2004), it is possible that damage to
the endothelium mediates cytokine spillover from the lungs into the circulation.
Effectively, this causes a systemic inflammatory response in mechanically ventilated
ARDS patients, with elevated levels of tumor necrosis factor alpha (TNF- ), IL-6, IL-8,
and IL-1 in bronchoalveolar lavage fluid (BALF) (Meduri et al. 1995). Though
biotrauma plays a key role in potentiating VALI, it may not be the only factor associated
with MODS secondary to mechanical ventilation. It is likely that multiple factors are
involved in exacerbating the systemic inflammatory response associated with VALI.
VALI has been shown to have downstream systemic effects on distal organs by
compromising hemodynamic function. This is especially evident in the effects of
mechanical ventilation on cardiac output, which is markedly reduced during ventilation
(Slutsky and Tremblay, 1998). A reduction in cardiac output markedly decreases
intestinal, hepatic and renal perfusion, leading to the dysfunction and potential failure of
those organs. A limitation in organ perfusion impairs oxygen delivery to the distal
organs, potentially leading to dysfunction in these tissues (Love et al. 1995; Gammanpila
et al. 1977). While a direct relationship between mechanical ventilation and MODS is yet
to be established, several studies have shown that varying the mechanical ventilation
settings reduces the likelihood of developing MODS secondary to VALI, ultimately
6
reducing ALI/ARDS patient mortality rates (ARDS Network, 2000; Amato et al. 1998;
Hickling et al. 1994).
1.2 Mechanical Ventilation
1.2.1 Definition and Context
Mechanical ventilation is the process whereby positive pressure is applied from a
machine through the trachea in order to adequately provide fresh gas and ventilate the
lungs. Mechanical ventilation is widely used in clinical practice to provide ventilatory
support to critically ill patients. While these patients are typically admitted for conditions
such as sepsis, trauma, or post-operative care, respiratory failure secondary to such
conditions is not uncommon. For that reason, mechanical ventilation is the first standard
of care to provide ventilatory support (Task Force on Guidelines, Society of Critical Care
Medicine, 1991).
1.2.2 Modes of Ventilation
There are several modes of mechanical ventilation used to manage ALI and
ARDS patients. Mechanical ventilation can provide additional support for spontaneously
breathing patients, as well as patients that rely completely on mechanical breathing.
Patients that exhibit some spontaneous breathing efforts can receive varying degrees of
pressure support ventilation (PSV) to supplement their respiratory function. Patients that
require complete artificial ventilation undergo controlled mechanical ventilation (CMV),
a strategy in which the peak airway pressure, respiratory rate and tidal volume are set by
the ventilator (Hooper, 1998).
7
To facilitate CMV in spontaneously breathing patients, neuromuscular blocking
agents are sometimes used to abolish spontaneous breathing efforts and facilitate lung
ventilation solely by the machine (Papazian et al. 2010). This has the added advantage of
allowing more manipulation of the patient’s respiratory mechanics through changes in
ventilator settings. A recent multicenter study demonstrated that the use of cisatracurium
besylate (a neuromuscular relaxant) in patients with early and severe ARDS undergoing
CMV was effective in improving the adjusted 90-day survival rate, and did not cause
respiratory muscle weakness when discontinued (Papazian et al. 2010). This suggests that
the use of neuromuscular blockade to facilitate CMV may improve the outcome of lung
injury for ventilated patients. In the application of CMV and PSV, Dembinski et al.
(2002) also showed a better outcome of VALI with an improvement in the
ventilation/perfusion (VA/Q) distribution in CMV compared with PSV in a pig model of
ALI caused by repeated lung lavage. However, in that model, PSV appeared to be more
effective in improving pulmonary gas exchange (Dembinski et al. 2002). Interestingly,
Putensen et al. (1999) showed that PSV with preserved spontaneous breathing is
beneficial for ARDS patients, particularly because it improves pulmonary gas exchange
by altering the VA/Q distribution in the ventilated lung. These studies demonstrate that
both CMV and PSV contribute to the development and exacerbation of VALI.
1.2.3 Ventilation Strategies
CMV settings have been extensively studied and refined in an attempt to find the
best means of restoring gas exchange and improving the outcome of VALI in patients.
The conventional ventilation (CV) strategy constitutes the use of high tidal volumes
8

ranging from 10 to 15 ml/kg predicted body weight (Determann et al. 2010; Amato et al.
1998; ARDS Network, 2000; Broccard et al. 1998; Marini, 1996). Large tidal volumes
are traditionally used in the ventilatory management of ALI and ARDS patients in order
to achieve adequate pH and arterial partial pressures of carbon dioxide (PaCO2) and
oxygen (PaO2) (ARDS Network, 2000). Since large volumes are achieved by large
inspiratory pressures, conventional ventilation often produces lung overdistention,
leading to VALI by way of barotrauma, volutrauma, and a potentiated inflammatory
response. Severe pulmonary inflammation has the potential to spread to other organ
systems and has been associated with MODS, however this relationship has yet to be
confirmed (Tremblay et al. 1997; Parker et al. 1993). These findings have also been
demonstrated experimentally in large and small animal models, including rats, mice,
rabbits and sheep (Dreyfuss et al. 1988; Veldhuizen et al. 2001; Wilson et al. 2003;
Bellardine et al. 2006; Savel et al. 2001).
These outcomes prompted intensive care clinicians to adopt the use of lower tidal
volumes to promote lung-protective ventilation (LPV). This includes mechanical
ventilation with tidal volumes ranging from 5 to 8 ml/kg predicted body weight and low
plateau pressures (ARDS Network, 2000; Broccard et al. 1998; Brower et al. 1999). This
ventilation strategy was incorporated into the standard management of ALI/ARDS
patients to reduce VALI by decreasing the ventilation stress caused by excessive lung
stretch (ARDS Network, 2000). While LPV indeed reduced lung stretch, it also proved
effective in attenuating pulmonary inflammation by reducing the release of pro-
inflammatory substances and improved fluid clearance from the lungs, which improved
9
the patient mortality rate (Hickling et al. 1990; Hickling et al. 1994; Ware and Matthay,
2001). However, ventilation with low VT tended to result in a decreased arterial
oxygenation, increased PaCO2, leading to respiratory acidosis (Hickling et al. 1990;
Hickling et al. 1994). Meanwhile, an experimental model of VALI using rabbits showed
that LPV can improve oxygenation, hemodynamic stability and acid-base homeostasis
(Savel et al. 2001). Overall, experimental models of VALI in rats, mice and rabbits are in
agreement with clinical trials demonstrating the potential for LPV to attenuate the
deleterious effects of VALI (Frank et al. 2002; Wilson et al. 2003; Savel et al., 2001).
The low VT used in LPV can produce hypercapnia (high PaCO2), where the
PaCO2 rises spontaneously due to the accumulating CO2 as an outcome of a decrease in
minute ventilation (Hickling et al. 1994; Kavanagh and Laffey, 2006). This phenomenon
has since been termed permissive hypercapnia (PHC), and is named accordingly because
it is a tolerated side effect of LPV that has gained acceptance as a therapy for managing
ALI/ARDS patients (Ismaiel and Henzler, 2011). The effects of PHC have never been
directly examined clinically or experimentally. However, several clinical studies have
investigated LPV with permissive hypercapnia as a tolerated side effect (Hickling et al.
1990; Hickling, 1992; Hickling et al. 1994; Bidani et al. 1994). Though the direct effects
of PHC remain unclear, PHC has been associated with a reduction in lung stretch, and
improved patient survival (Hickling et al. 1994; Bidani et al. 1994).
Realizing the potential benefits of PHC, hypercapnia may no longer be viewed as
a side effect, but instead as a helpful ventilation strategy (Kavanagh and Laffey, 2006).
This sparked interest in investigating the effects of therapeutic hypercapnia (THC), where
a small fraction of inhaled CO2 is added to the gas mixture during ventilation, or
10

physiologic dead space is added (Kavanagh and Laffey, 2006; Ismaiel and Henzler,
2011). This is used to “deliberately” increase the PaCO2 and induce hypercapnia
exogenously. The concept of THC remains experimental, since there is evidence
supporting and rejecting the effects of THC. THC was shown to attenuate pulmonary
inflammation and free radical production, and preserved pulmonary mechanics in an
ischemia-reperfusion-induced lung injury model in the rabbit (Laffey et al. 2000b)
(Figure.1). In vitro, alveolar macrophages incubated with CO2 to induce significant
hypercapnia (60-146 mmHg) showed a remarkable decrease in the production of free
radical compounds, particularly the superoxide radical (O2-) (Kogan et al. 1996). The
effects of THC thus far have been attributed to the acidotic state that results from
hypercapnia, termed hypercapnic acidosis (HCA) (Reviewed in Kavanagh and Laffey,
2006), and is characterized by the decrease in intracellular pH due to the accumulating
CO2 (Reviewed in Ismaiel and Henzler, 2011). HCA has been associated with a
reduction in pulmonary inflammation, and cell death (Laffey et al. 2000b) (Figure.1), and
protects other organ systems in several experimental models of ALI, including that
induced by sepsis, ischemia-reperfusion, and mechanical ventilation (Reviewed in
Ismaiel and Henzler, 2011).
1.3 Hypercapnia and Hypercapnic Acidosis
1.3.1 Anti-Inflammatory Effects
Several studies have demonstrated the anti-inflammatory effects of HCA. Laffey
et al. (2000b) showed a reduction in IL-1 and TNF- in BALF collected from injured
rabbit lungs treated with HCA. In this study, the pH was approximately 7.00 after 90
11
minutes of protective ventilation (VT=7.5 ml/kg) with inspired CO2 (Laffey et al. 2000b).
In cultured human pulmonary artery endothelial cells incubated with endotoxin, HCA
inhibited the activation of NF- B by a mechanism that reduced I B degradation
(Takeshita et al. 2003). This decreased the transcription of intracellular cell adhesion
molecule (1-CAM) and IL-8 (Figure.1), and limited neutrophil adherence to pulmonary
endothelial cells (Takeshita et al. 2003). HCA also reduced neutrophil counts in BALF
and reduced alveolar wall thickening and inflammatory cell infiltration in a rat model of
ALI induced by intratracheal instillation of endotoxin (Laffey et al. 2004).
HCA has been reported to inhibit the production of nitric oxide (NO) and other
NO metabolites such as peroxynitrite and nitrotyrosine in lung homogenates compared to
untreated control animals, demonstrating a reduction in reactive nitrogen species (RNS)
(Nichol et al. 2010). This may be mediated by a mechanism that inhibits nitric oxide
synthase (NOS), thus reducing pulmonary oxidative reactions (Nichol et al. 2010).
Kristof et al. (1998) provide evidence for this by demonstrating that knocking out
inducible Nitric Oxide Synthase (iNOS), which produces NO, reduces the susceptibility
to endotoxin-induced ALI in mice. Shibata et al. (1998) also showed that HCA attenuates
the production of RNS. In that study, a model of isolated rabbit lung was used to show
that HCA reduces the activity of the xanthine oxidase enzyme, which is responsible for
the production of reactive oxygen and nitrogen species (Figure.1). These studies suggest
an important role for HCA in the attenuation of pulmonary inflammation by reducing the
production and release of pro-inflammatory mediators, as well as the production of NO
and its metabolites.
12

Conversely, treatment with inhaled NO improved the histopathologic outcome,
lung leukocyte counts, and reduced pulmonary oxidant stress in a rabbit model of saline
lavage-induced ALI (Floretto et al. 2011). In a swine model of sepsis-induced ALI,
pretreatment with inhaled NO also reduced the production of the superoxide anion and
neutrophil counts in lavage fluid (Bloomfield et al. 1997). Therefore, the role of NO in
ALI remains elusive, given the evidence implicating NO as a biomarker of ALI and as a
potential therapy.
To better model clinical sepsis, a cecal ligation model of ALI (secondary to
sepsis) showed that HCA protects against ALI in early and prolonged sepsis (Costello et
al. 2009). Similarly, Chonghaile and colleagues (2008) demonstrated that HCA
substantially reduces bacterial counts in a model of bacterial pneumonia-induced lung
injury in rats. In addition, HCA reduced structural lung damage and produced a lower
grade of histologic injury compared to normocapnic animals.
Sinclair et al. (2002) used a model of ALI induced by injurious ventilation in
rabbits, and showed that HCA reduced pulmonary edema as measured by a decreased
wet-to-dry lung ratio postmortem, and reduced protein concentrations in BALF. As well,
HCA-treated animals showed lower inflammatory cell infiltration compared to untreated
animals (Sinclair et al. 2002).
More recently, Peltekova and colleagues (2010) provide additional evidence
highlighting the therapeutic effects of HCA. In that study, a mouse model of ventilator-
induced lung injury treated with HCA exhibited a reduction in several key pro-
inflammatory mediators, including IL-6, Monocyte Chemoattractant Protein-1 (MCP-1),
Matrix Metalloproteinase-9 (MMP-9), and Keratinocyte Chemoattractant factor (KC).
13

This effect was even more pronounced when HCA was coupled with protective
ventilation settings. Inhibition of these inflammatory substances was also noted in a dose-
dependent fashion, such that HCA induced with 25% inspired CO2 had the greatest effect
compared to 12% and 5% CO2, respectively (Peltekova et al. 2010). These effects were
reflected in the histopathological evaluation of the lungs, which showed a reduction in
PMN cell infiltrates.
Therefore, there is a growing body of experimental evidence demonstrating the
anti-inflammatory effects of therapeutic hypercapnia and hypercapnic acidosis, and lends
support to its benefits in several experimental models of ALI. In fact, Laffey et al.
(2000a) and Nichol et al. (2009) both showed that buffering HCA with sodium
bicarbonate actually exacerbates the existing injury in the lungs and myocardium. This
was supported by an increase in the wet-to-dry lung ratio and xanthine oxidase activity of
the lungs after the HCA was buffered with bicarbonate (Laffey et al. 2000a). These
findings suggest an increase in the production of pulmonary edema and reactive
molecules with buffering, rendering the effects of HCA ineffective. In turn, this provides
further support as to the important role of hypercapnic acidosis in the attenuation of
VALI. Taken together, it is clear that therapeutic hypercapnia and the resulting
hypercapnic acidosis are closely related, and have been associated with the attenuation of
lung injury by reducing various biomarkers of VALI.
1.3.2 Effects on Other Organs
HCA has been shown to exert its therapeutic effects beyond the lungs in other
organ systems. Early experiments with HCA in a model of cardioplegia (stopping of the
heart during cardiac surgery) demonstrated the ability of HCA to protect the working
14

myocardium during ischemia-reperfusion injury and under hypoxic conditions (Nomura
et al. 1994). Similarly, following ischemia, HCA at a pH of 6.6 was shown to reduce cell
death upon reperfusion and protect the ventricular myocardium compared to reperfusion
at a pH of 7.6, where significant cell death was noted (Kaplan et al. 1995). This effect
was attributed to the inhibition of the Na+/H+ exchanger under acidotic conditions,
thereby preventing H+ movement into the extracellular environment (Kaplan et al. 1995).
In a canine model of cardiac infarction, HCA also reduced the infarct size during
reperfusion (Kitakaze et al. 1997). Findings from these studies highlight the protective
effects of HCA in the myocardium.
The protective effects of HCA have also been examined in the central nervous
system. Vannucci et al. (1995) demonstrated the neuroprotective effects of HCA induced
by therapeutic hypercapnia in a model of ischemia-reperfusion in the brain. In that study,
treatment with 6% CO2 showed the greatest reduction in brain damage in rat pups
compared to 3% and 9% CO2 (Vannucci et al. 1995). In fact, these same effects were
exacerbated when hypocapnia was applied. Findings from this study showed that
hypercapnia is neuroprotective compared to both hypocapnia and normocapnia in the
developing rat brain. Other studies have also evaluated the protective effects of HCA in
the brain, including a reduction in neuronal apoptosis, lipid peroxidation, and decreased
production of free radical compounds (Xu et al. 1998; Barth et al. 1998). This effect is
likely mediated by the inhibition of various biological enzymes that function optimally at
physiologic pH. A similar effect has been noted in the liver, where cell death is
attenuated in hepatocytes treated with HCA (Gores et al. 1989). Together, these studies
15
provide sufficient evidence to support the protective role of hypercapnia and hypercapnic
acidosis in different organ systems.
1.3.3 Potentially Harmful Effects
While many studies (in vivo and in vitro) demonstrated the therapeutic potential
of hypercapnia and hypercapnic acidosis, others have shown that THC and HCA also
have deleterious effects. For example, two in vitro studies with rat alveolar epithelial
cells showed that treating these cells with CO2 increases the production of RNS, and
increases the expression and activation of iNOS (Lang et al. 2000; Briva et al. 2007).
Lang et al. used the terminal deoxynucleotidyl transferase dUTP nick end labeling
(TUNEL) stain to show that THC increases cell death in alveolar epithelial cells (Lang et
al. 2000). Despite the conflicting results in the application of THC in vitro, it is important
to possible that these negative effects were observed in alveolar epithelial cells, whereas
THC reduced free radical production in alveolar macrophages (Kogan et al. 1996).
Therefore, it is possible that THC has different effects on different lung cell populations.
In an ex vivo perfused rat lung model of ventilator-induced lung injury, epithelial
cell wound healing was impaired under hypercapnic conditions (Doerr et al. 2005). This
study suggests that THC does not provide healthy physiologic conditions to facilitate
lung cell repair after injury. Two in vivo rat models of ALI also provide evidence against
HCA. In one study, hydrochloric acid (HCl) was injected intravenously to cause acid-
induced lung injury. That study showed that treatment with HCA potentiated the
inflammatory response, increased NO production, and caused hemodynamic instability
through severe hypotension in the rats (Pedoto et al. 1999). Therefore, Pedoto et al.
showed that HCA has global deleterious effects in their model of acid-induced lung
16

injury. O’Croinin et al. (2008) used a rat model of endotoxin-induced lung injury by
intratreacheal E.coli instillation to investigate the effects of HCA sustained for two days.
In that study, prolonged HCA increased the animals’ susceptibility to subsequent
bacterial infections, which exacerbated the existing ALI. This effect was likely mediated
by the immunosuppressive effects of HCA (O’Croinin et al. 2008). As such, this study
provides evidence that prolonged HCA has deleterious effects, but does not provide the
same evidence for short-term HCA.
Recent work has also demonstrated that therapeutic hypercapnia does not improve
the outcome of lung injury. Treatment with 5% CO2 in hyperoxic neonatal rats caused
the greatest degree of histopathologic damage in the lungs, which were scored based on
the presence of inflammatory cells and hemorrhages (MacCarrick et al. 2010). However,
therapeutic hypercapnia appeared to reduce the release of pro-inflammatory cytokines IL-
1 and TNF- (MacCarrick et al. 2010). Lang et al. (2005) also provide evidence against
hypercapnia (induced permissively, causing acidosis) in a rabbit model of LPS-induced
ALI. In that study, rabbits received protective ventilation (VT= 7 mL/Kg) for 6 hours
under normocapnic or hypercapnic conditions. Hypercapnia was shown to increase total
protein concentrations and cell counts in bronchoalveolar lavage fluid (BALF) compared
to animals under normocapnic conditions (Lang et al. 2005). Hypercapnia also increased
pulmonary edema, histopathologic injury, and the expression of iNOS, NO metabolites
(nitrite and nitrate) and myeloperoxidase content in the lungs (Lang et al. 2005).
Therefore, there is strong evidence against hypercapnia and hypercapnic acidosis in the
context of ALI.
17

Therapeutic hypercapnia has been shown to impair the diaphragmatic muscle
function of rats. In that study, Kumagai et al. (2001) showed that diaphragmatic muscle
fibers can degenerate following a 6-week exposure of rats in a 10 % CO2 chamber
compared to rats exposed to a 6-week exposure in a normocapnic chamber. This study
involved healthy rats, however the findings may have important implications for
mechanically-ventilated animals with ALI. This is particularly true at the time of weaning
from mechanical ventilation because it requires appropriate diaghragmatic function
(Reviewed in (Ijland et al. 2010). Jaber et al. (2008) provide additional evidence for the
diaphragmatic impairment under hypercapnic conditions. In that study, ventilated piglets
exposed to measured increases in PaCO2 (40, 50,70,90 and 110 mmHg) demonstrated a
decrease in the contractile force of diaphragmatic muscle that was directly proportional to
the increase in PaCO2. Impaired diaphragmatic activity may represent an important
mechanism for worsening VALI as it reduces spontaneous breathing efforts and promotes
increased dependence on controlled mechanical ventilation. Therefore, these findings
contribute to the current body of literature demonstrating both the potentially benefical
and harmful effects of hypercapnia and hypercapnia acidosis.
1.4 Purpose and Hypotheses
1.4.1 Purpose of the Study
To date, multiple studies have demonstrated the potential benefits of lung-
protective ventilation, permissive and therapeutic hypercapnia for the attenuation of
VALI. These effects have been evaluated in several experimental models of ALI,
including ALI induced by mechanical ventilation, pneumonia, sepsis, and ischemia-
18
reperfusion. However, no study has directly addressed whether the attenuation of VALI is
attributed to lung-protective ventilation (with low tidal volumes and pressures) or the
resulting hypercapnia (increased PaCO2). In addition, no study has investigated these
effects in an acid aspiration model of ALI. For that reason, the purpose of this study was
to determine whether the attenuation of VALI is mainly associated with protective
ventilation settings or hypercapnia in an aspiration-induced model of ALI. An acid
aspiration model of ALI was used as a representation of clinical ALI caused by the
aspiration of gastric acids in patients. If the source of attenuation in VALI is indeed an
outcome of hypercapnia, is there a difference in the effect of permissive and therapeutic
hypercapnia? That is, does therapeutic hypercapnia by inhaled CO2 gas offer an
additional benefit to permissive hypercapnia by endogenous CO2?
These effects were investigated in a rat model of aspiration-induced ALI with
different experimental groups subject to controlled mechanical ventilation with lung-
protective settings, permissive hypercapnia and therapeutic hypercapnia. The outcomes
of the different ventilation groups were evaluated using parameters of hemodynamics,
respiratory mechanics, gas exchange, histology, inflammation, and programmed cell
death.
1.4.2 Research Hypotheses
There were three hypotheses in the present study. First, it was hypothesized that
hypercapnia protects the lung from VALI by attenuating inflammation and alveolar
damage. Second, it was hypothesized that protective ventilation with reduced pressures
and tidal volumes attenuates VALI. Finally, it was hypothesized that therapeutic
19
hypercapnia with inhaled CO2 is more protective compared to permissive hypercapnia
with endogenous CO2.
20
CHAPTER 2 MATERIALS AND METHODS
2.1 Rat Handling and Instrumentation
Sixty Male Sprague-Dawley rats (weight, 400-490 g) were obtained from Charles
River Laboratories (Saint-Constant, QC, Canada). The rats were maintained at the
Carlton Animal Care Facility at Dalhousie University on a 12-hour light/dark cycle. The
rats were housed in conventional cages (10.5” W x 19” D x 8” H) in pairs with Beta Chip
and hay in the cages. The room temperature was maintained daily at 21-22°C. The rats
were given unlimited access to Prolab Rodent Chow and water. All rats received daily
health checks by animal care staff at Dalhousie University to ensure the well being of all
animals.
All experimental procedures and protocols were conducted with approval of the
University Committee on Laboratory Animals and the Carlton Animal Care Facility at
Dalhousie University (protocol No. 08-132). Rats were initially weighed using a balance
scale (Ohaus, Explorer model E0D110, Parsippany, NJ, USA) to determine appropriate
dosing for anesthesia, analgesia and calculating the appropriate tidal volume for
ventilation. Rats were anesthetized by intraperitoneal injection of sodium pentobarbital
(55 mg/kg). The neck and femoral regions of the body were shaved to facilitate access to
those areas for vessel cannulation. The rats were laid in supine position on a Shor-Line
stainless steel operating table (22” width x 60” length, distributed by Harvard Apparatus
Canada, Saint-Laurent, QC, Canada) with an internal surface heater maintained at 37°C.
Additional heat was also provided by an overhead lamp (Burton Medical, Chatsworth,
CA, USA) as needed.
21

During the instrumentation, the rats received oxygen therapy using 100% O2
delivered from a neonatal ventilator (Evita XL, Draeger Medical Inc., Richmond Hill,
ON, Canada). The oxygen was delivered through a tube attached to the facial region of
the rats. An incision was made in the right femoral region, and the surrounding tissue was
dissected, allowing the isolation of the right femoral artery. A thermocouple temperature
probe was carefully inserted into the aorta through the right femoral artery to facilitate the
monitoring of body temperature and the measurement of cardiac output (CO) (IT-21,
Type T thermocouple copper-constantan, Physitemp Instruments Inc., Clifton, NJ, USA).
An incision was then made in the neck, and connective tissue was dissected to expose the
left jugular vein. A catheter was then inserted into the left jugular vein and secured to the
vessel. The left carotid artery was isolated and cannulated to monitor mean arterial
pressure (MAP). Finally, the trachea was isolated, and a tracheostomy was performed by
inserting a 14G cannula into the trachea and securing it in place. The temperature probe,
two vessel catheters and tracheal cannula were secured in their positions using fine
threads tied at the proximal and distal ends of the vessel or trachea.
2.2 Equipment Calibration ChartPro 6.0 software (ADInstruments, Colorado Springs, CO, USA) was run on a
laptop computer (Fujitsu Siemens Lifebook S7110, Germany) and used to calibrate the
PowerLab operating system (ADInstruments, Colorado Springs, CO, USA). The
physiologic pressure transducers (SensoNor SP 844, ADInstruments, Colorado Springs,
CO, USA) for measuring MAP and esophageal pressure were connected to the PowerLab
system. Pressure transducers were calibrated with a sphygmomanometer using a two-
point calibration for each transducer. The MAP transducer was calibrated from 0 to 100
22

mmHg, and the esophageal pressure transducer was calibrated from 0 to 100 mmHg,
which was then converted on a scale of 0 to 130 cmH2O units. The pneumotach (Series
8420B, rat and guinea pig-specific, Hans Rudolph Inc., Shawnee, KS, USA) was used to
measure spirometry flow and tidal volume (VT) during each experiment was calibrated
using a 100 ml calibration syringe (Series 5510, Hans Rudolph Inc., Shawnee, KS, USA).
The syringe was set to measure a 20 ml volume. Twenty ml of air was pushed through the
pneumotach and the area under the flow curve was recorded and set to equal 20 ml.
The tissue implantable thermocouple temperature probe was calibrated once per
week using a two-point calibration. The temperature-sensitive tip of the probe was
submerged into a beaker containing water at 25°C and another beaker containing water at
37°C, while the other end was plugged into an output port connected to the PowerLab
operating system. The neonatal ventilator used for oxygen delivery and mechanical
ventilation was automatically calibrated daily. The ABL 700 blood gas analyzer and the
species adjusted co-oximeter OSM 3 (Radiometer Canada, London, ON, Canada) were
automatically calibrated using one and two-point calibrations every 2 hours and 4 hours,
respectively. The blood gas measurements obtained from the ABL 700 were
automatically adjusted to barometric pressure.
2.3 Physiologic Measurements
2.3.1 Hemodynamics
The arterial catheter was attached to the physiologic pressure transducer calibrated
to measure MAP. The thermocouple temperature probe was connected to an output unit,
and cardiac output was measured using the thermodilution principle. Briefly, 0.5 ml of
saline solution (0.9% NaCl) was administered as an intravenous bolus and temperature
23

changes were recorded. Cardiac output was computed by the ChartPro software. Two
cardiac output measurements were taken at each time point, and the mean was calculated
and recorded. Heart rate was measured using three electrocardiogram (ECG) leads
positioned according to Einthoven’s Triangle (right arm, left arm and left leg). The ECG
leads, temperature probe, and MAP transducer were connected to the PowerLab system
and data was inputted into the ChartPro 6.0 software for live monitoring and recording.
The cardiac output was measured at baseline and at the end of each hour of ventilation.
Meanwhile, body temperature, heart rate and MAP were measured at baseline and six
times during each hour of ventilation using live recordings.
2.3.2 Respiratory Mechanics
The tracheal cannula was connected to the pneumotach, which was coupled to a
signal amplifier (Series 1110, Hans Rudolph Inc., Shawnee, KS, USA). The ventilator
was set to deliver mechanical ventilation, and the pneumotach was connected to the
ventilator. The ventilator was set in BIPAP (Bi-level Positive Airway Pressure) mode.
The inspiratory pressure on the ventilator was set to achieve a tidal volume of 8 ml/kg,
PEEP (Positive End Expiratory Pressure) was set to 5 cmH2O, FiO2 (Fraction of Inspired
O2) set to 1.0 (100% O2), and respiratory rate set to achieve a PaCO2 (arterial partial
pressure of CO2) of 40-55 mmHg. The Tinsp (inspiratory time) was adjusted to achieve a
1:1 ratio between inspiratory and expiratory time during ventilation.
This set-up provided live monitoring of airway pressure, tidal volume, flow, and
respiratory rate. Elastance, which is the pressure required to displace lung volume, was
also measured to indicate changes in the elastic properties of the lung. Mathematically,
elastance is defined as the airway pressure divided by the tidal volume (E=P/V). Since
24

the mechanical ventilator measures airway pressure and tidal volume, the elastance in
each group was calculated manually. The elastance was used to measure the presence of
ALI, since an increase in elastance indicates that more pressure is required to ventilate
with the set tidal volume. This is indicative of ALI because a higher airway pressure
suggests that the lung is less compliant to inflate.
Esophageal pressure was measured by inserting a 16G cannula into the esophagus
through the oral cavity. A catheter was attached to the physiologic pressure transducer
calibrated to measure esophageal pressure, with the distal end inserted into the esophagus
through the 16G cannula. Esophageal pressure was monitored to ensure that all
spontaneous breathing efforts were eliminated to facilitate controlled ventilation. Tidal
volume, flow, airway pressure, respiratory rate, elastance, and esophageal pressure were
measured at baseline and six times during each hour of ventilation with live recordings.
2.3.3 Gas Exchange Blood gases were measured by collecting 0.3 ml of arterial blood and 0.3 ml of
venous blood drawn into heparinized syringes. Arterial and venous blood gases and
oxymetry were analyzed using the ABL 700 blood gas analyzer and the species adjusted
co-oximeter OSM 3. The pH, PaCO2 and PaO2 in the arterial and venous blood gases
were measured at baseline and at the end of each hour of ventilation.
2.4 Experimental Protocol
2.4.1 Sedation Protocol
The venous catheter was connected to a conventional syringe pump (Perfusor
Space, Braun Medical, Melsungen, Germany) to facilitate the continuous intravenous
25

infusion of 20 g/ml remifentanil and 25 g/ml pancuronium (diluted in 0.9% NaCl in a
60 ml syringe) at 5 ml/hour. The remifentanil was given at 0.4 g/kg/min to provide
continuous analgesia and sedation, and the pancuronium was given at 0.2 mg/kg/hr to
provide neuromuscular blockade to facilitate CMV. The remifentanil was obtained at a
concentration of 10 g/ml, and the pancuronium was obtained at a concentration of 2
mg/ml and were diluted with 0.9% NaCl solution to obtain the final concentration. The
intravenous infusion of remifentanil and pancuronium was continuously delivered
throughout the duration of the ventilation period.
2.4.2 Acute Lung Injury After baseline measurements were completed and respiratory paralysis was
achieved, acute lung injury (ALI) was induced. Unbuffered hydrochloric acid (pH 1.25)
was instilled into the trachea through the 14G cannula at 2.5 ml/kg. The acid was instilled
such that 60% of the total volume was delivered to the right lung and 40% of the total
volume was delivered into the left lung. First, the tracheal cannula was disconnected from
the pneumotach and ventilator. The rat was elevated and tilted to the right side, and the
acid designated for the right lung was slowly pushed through a syringe into the trachea.
While still tilted to the right, the rat was shaken for approximately 15 seconds to allow
the acid to spread evenly throughout the three lobes of the right lung. The trachea was
then re-connected to the ventilator, and airway pressure was adjusted to achieve a tidal
volume of 8 ml/kg. After ensuring the rat had stabilized after the first acid instillation, the
same procedure was repeated for acid instillation into the left lung.
The rats were ventilated with the same BIPAP settings set at baseline with the
exception of the airway pressure, which was increased in order to maintain a tidal volume
26

of 8 ml/kg and PaCO2 of 40-55 mmHg. These settings were maintained for one hour of
CMV in order to allow ALI to develop. During that time, six 2-minute data recordings
were taken by LabChart, each separated by an 8-minute unrecorded monitoring period.
At the end of one-hour of CMV, two cardiac output measurements were taken (as
described above). In addition, arterial and venous blood samples were collected in
heparinized syringes to test blood gases and oxymetry, and the data were recorded. The
extent of the lung injury was evaluated based on a marked decrease in the ratio of arterial
partial pressure of O2 to the FiO2; PaO2/FiO2 or P/F ratio) from baseline. For this study,
the development of acute lung injury was considered to be a P/F ratio equal to 300 mmHg
or less, as defined clinically (Ware and Matthay, 2000; Hammer, 2000).
2.4.3 Mechanical Ventilation Once acute lung injury was established, a recruitment maneuver was performed.
This was achieved by linking the airway pressure to the PEEP on the ventilator, and then
increasing the PEEP from 5 cmH2O to 7 cmH2O and ventilating at this PEEP for one
minute. The PEEP was subsequently increased from 7 to 9 cmH2O and held for one
minute, and finally increased from 9 to 10 cmH2O and held for one minute. The
recruitment maneuver was performed in order to recruit airways that became closed
during the development of ALI. After the recruitment maneuver, the PEEP was once
again returned to 5 cmH2O, and unlinked to the airway pressure.
A total of 60 rats were randomly assigned to six experimental groups (each with 10
animals). The groups varied in the ventilation settings for respiratory rate (RR), VT,
PaCO2, and the addition of inspired CO2 or dead space. Three groups were ventilated
under normocapnic conditions (low CO2; PaCO2=40-55 mmHg) and three groups under
27

hypercapnic conditions (high CO2; PaCO2=60-70 mmHg). While ventilation with a low
or ‘protective’ tidal VT was targeted at 8.0 mL/kg, ventilation with a high or
‘conventional’ VT was defined by a volume high enough to achieve the target PaCO2.
Similarly, the low and high respiratory rate settings were defined by a rate necessary to
achieve the target PaCO2. Meanwhile, protective and conventional therapeutic
hypercapnia groups received inspired CO2 (1.6%) to increase the PaCO2 to the desired
target, and the injurious normocapnia group received 1.0 ml of additional dead space
through added rubber tubing. The settings for all groups are detailed in Table 1.
After random assignment to the groups, the rats were ventilated for three hours in
each of their respective groups. During each hour of ventilation, six 2-minute data
recordings were taken, each separated by an 8-minute unrecorded monitoring period. At
the end of each hour, two cardiac output measurements were taken (as described above).
Arterial and venous blood was sampled in heparinized syringes to evaluate blood gases
and oxymetry, and the data were recorded. At the end of the three-hour ventilation in
each group, 1 ml of arterial blood and 1 ml of venous blood were each drawn into
syringes containing 0.10 ml ethylenediaminetetraacetic acid dipotassium dihydrate
(EDTA) to prevent blood coagulation (EDTA was obtained from Sigma Aldrich,
Oakville, ON, Canada). The blood samples were centrifuged (Brinkmann micro
centrifuge model 5415, obtained from Eppendorf, Hauppauge, NY, USA) at 5000 rpm for
15 minutes at room temperature, and the resulting supernatant (plasma) was collected in
cryotubes. This experimental protocol is summarized in Figure 2.
2.4.4 Tissue Dissection Protocol After all recordings and measurements were taken, the animals were sacrificed
28

using 1.0 ml of potassium chloride (KCl) delivered as an intravenous bolus. The table
surface heater and the overhead lamp were turned off to prevent early tissue degradation
from the heat. The tracheal cannula was detached from the pneumotach and ventilator,
and a cuff pressure gauge (VBM Medizintechnik GmbH, Germany) was attached
immediately to the trachea with PEEP=20 cmH2O to maintain lung inflation during the
dissection.
The thoracic cavity was opened by a straight incision from the trachea and through
the abdominal cavity. The diaphragm was cut and the rib cage was removed, exposing the
heart and lungs. The connective tissue surrounding the trachea was removed, and the
heart and lungs were excised in a single block while the cuff pressure gauge still
maintained the lungs inflated with 20 cmH2O of pressure. The middle lobe of the right
lung was tied with thread, and the left hilus was clamped with a hemostat. The pressure
gauge was removed, and broncheoalveolar lavage fluid (BALF) was collected by
delivering 2 ml of 0.9% NaCl into the trachea and recovering as much fluid as possible.
The BALF was centrifuged for 15 minutes at 5000 rpm, and the resulting supernatant was
collected in cryotubes. The right hilus, including the main bronchus and associated
vessels, was ligated. The upper and lower lobes of the right lung were cut off and placed
in separate cryotubes for future analysis. The middle lobe of the right lung was cut off,
placed in a pre-weighed glass scintillation vial, weighed again, and placed in a warming
oven at 40°C for 48 hours. After that time, the dried lobe was removed from the oven and
weighed. The weight of vial when empty, when containing the wet lung, and when
containing the dry lung were all recorded and used to calculate the ratio of the wet to dry
lung and used as a measure of pulmonary edema. The weight measurements were
29
collected using a precision balance scale (Sartoius GmBH, Gottingen, Germany).
The inflation of the left lung was maintained at 20 cmH2O, and the hemostat was
removed. The left lung was perfused with 10 ml of 10% unbuffered formalin injected
through the right ventricle of the heart. In its inflated state, the perfused left lung was tied
off at the main bronchus using a thread and submerged in 10% formalin. The left kidney
was isolated, submerging half of it in 10% formalin and transferring the other half to a
cryotube for future analysis. Similarly, the right lobe of the liver was isolated, where half
was submerged in10% formalin and the other half transferred to a cryotube for future
analysis. Finally, all samples kept in cryotubes (plasma, BALF, lung lobes, kidney and
liver) were frozen by submerging them in liquid nitrogen and stored at -80°C until
analysis.
2.5 Tissue Processing and Histological Preparation
The left lung was removed from 10% formalin, cut into three pieces (top third,
middle third, and bottom third of the lung) representing apical, middle and basal lung
sections. The tissue pieces were placed into a plastic cassette, washed twice with 70%
ethanol, and embedded in paraffin overnight at 60°C using an automated tissue processor
from Leica Micosystems Inc. (Richmond Hill, ON, Canada). The paraffin-embedded
tissue blocks were sectioned using a microtome (5 m section; Jung AG Heidelberg,
Germany) and electronic tissue float water bath (model No. 375, Lipshaw MFG Co,
Detroit, MI, USA) heated to 44°C. The tissue sections were subsequently transferred onto
glass microscope slides and baked in an oven to ensure tissue adhesion to the slides.
The slides were stained with hematoxylin and eosin to evaluate morphological
changes and determine the extent of ALI in the ventilated rat lung tissues. Briefly, the
30

slides were de-paraffinized, washed with xylene, alcohol and distilled water, and stained
with freshly filtered hematoxylin for 2 minutes. The excess stain was washed away with
water, and Scott’s Solution was added for 2 minutes. The solution was rinsed away, and
each slide was briefly dipped in a 1% eosin stain solution 13 times to ensure thorough
staining. Finally, excess eosin stain was washed away with ethanol and xylene washes.
Glass coverslips were mounted onto the slides and sealed with Cytoseal solution
(Electron Microscopy Sciences, Fort Washington, PA, USA), ensuring no air bubbles
were under the coverslips. The slides were dried overnight under a fume hood and briefly
examined to ensure proper staining of cellular structures.
2.6 Histological Scoring and Analysis
The lung tissue samples were scored by a blinded lung pathologist based on the
presence of seven criteria: interstitial edema (within lung tissues), alveolar edema,
hemorrhaging, polymorphonuclear (PMN) cell infiltrates, atelectasis (alveolar collapse),
alveolar damage, and hyaline membranes (fibrous structures lining the alveoli) (Castro,
2006; Henzler et al. 2011). The presence and severity of each criterion was rated from 0
to 3. A score of 0 represents ‘no damage present’, 1 represents ‘mild damage, few
lesions’, 2 represents ‘moderate damage, lesions in every visual field’ and 3 represents
‘severe damage, lesions ubiquitous’. The arithmetic mean of all subscores was taken as
the diffuse alveolar damage (DAD) score for each lung sample.
2.7 Cytokine Analysis
The inflammatory response associated with VALI was evaluated using a 10-plex
Procarta Cytokine Assay kit (Affymetrix Inc., Santa Clara, CA, USA). The cytokines and
31

chemokines measured were interleukin (IL)-1 , ICAM-1, IL-6, TNF- , GM-CSF, IL-10,
RANTES, KC, MCP-1, and MIP-1 . The bronchoalveolar lavage fluid (BALF) and
arterial plasma samples collected from all animals at the end of each experiment were
analyzed using the cytokine assay kit and Luminex Technology Analyzer and BioPlex
Manager software from BIO-RAD (Mississauga, ON, Canada). The Luminex instrument
was calibrated before every experiment, and validated once every 30 days. Calibration
and Validation kits (BIO-RAD) were used to test and ensure the optimal performance of
the Luminex instrument. The instrument was used to run cytokine assays only when the
calibration and validation were successful.
The antibody beads (containing beads for the 10 selected cytokines) were loaded
into all wells and washed by vacuum filtration. Rat-specific bodily fluid buffer was
added to all wells (25 l). The standards used to calculate cytokine concentrations in the
samples were prepared by reconstituting the lyophilized premixed standard powder in
500 l of rat-specific bodily fluid buffer. A total of 8 standards were prepared starting at
10,000 pg/ml of each analyte and decreasing 4-fold with each standard. All standards and
samples were loaded into a 96-well filter plate in duplicates (25 l/well for a final volume
of 50 l/well). The standards and samples were incubated on a shaker at 500 rpm for 1
hour at room temperature, and subsequently removed from the plate by vacuum filtration.
The wells were washed with 1X wash buffer, and the detection antibody was added to the
plate (25 l/well) and incubated on a shaker at 500 rpm for 30 minutes. The antibody was
removed by vacuum filtration and the plate was washed with 1X wash buffer.
Streptavidin-PE was added to each well (50 l/well) and incubated on a shaker at 500
rpm for 30 minutes. Finally, the streptavidin-PE was removed by vacuum filtration and
32

washed with 1X wash buffer. Reading buffer (120 l/well) was added to all wells and
incubated on a shaker at 500 rpm for 5 minutes and then inserted into the Luminex
instrument for reading.
A separate standard curve was produced for each cytokine measured, with a limit of
detection 1 pg/ml for each cytokine. Since each standard and sample were assayed in
duplicates, the mean of the measured concentrations was taken. The final dilution of
sample was 1:2, and the cytokine concentrations were calculated based on the set
dilution. To ensure that an adequate standard curve was used for each analyte, the ratio of
[observed/expected] x 100 standard concentrations was 100 ± 30, and all standard values
were within this range.
2.8 Tissue Homogenization
The right upper lobe was homogenized to probe for caspase-3 activation by western
blotting. The right upper lobe was cut into smaller pieces using a razor and placed in a
pre-weighed 15 ml Falcon tube. The lung was weighed again and the weight recorded.
Ice-cold 1X radioimmunoprecipitation assay (RIPA) buffer (Cell Signaling Technology)
was purchased through New England Biolabs (Pickering, ON, Canada). The serine
protease inhibitor phenylmethanesulfonylfluoride (1 mM PMSF; Sigma Aldrich,
Oakville, ON, Canada) was added to the RIPA buffer prior to use (75 l PMSF/0.01 g of
tissue). A tissue homogenizer (PRO200, Monroe, CT, USA) was used on high speed for
45-60 seconds to mechanically break the lung tissue. The homogenized tissue was placed
at 4°C with gentle rocking (Rocker 25 from Labnet, Edison, NJ, USA) for 15 minutes,
followed by 30 seconds of vortexing and repeated. The homogenates were then subject to
3 cycles of sonication (30 seconds/cycle) using a probe ultrasonic homogenizer (4710
33
series, from Cole Parmer, Montreal, QC, Canada). The homogenates were centrifuged
(MIKRO 120, Hettich, Beverly, MA, USA) at 8000 rpm for 10 minutes at 4°C, and the
supernatant transferred into fresh tubes. This supernatant was once again vortexed,
centrifuged at 13000 rpm for 20 minutes at 4°C, and the resulting supernatant was
collected and stored at -20°C for future protein measurement and western blotting.
2.9 Bradford Protein Assay
A protein assay was performed to determine the protein concentration in the rat
lung homogenates (Kruger, 2002). A protein standard curve was created using bovine
serum albumin (BSA; 2 mg/ml from BIO-RAD, Mississauga, ON, Canada) with five
BSA standards (0, 2, 5, 10 and 15 g of BSA), run in duplicates. Bradford Reagent Dye
(500 l), double-distilled water, 1X RIPA buffer were added to each standard for a final
measuring volume of 1 ml. The lung homogenate test samples were prepared similarly in
duplicates, adding 10 l of protein, double-distilled water, and Bradford Reagent Dye
(500 l) for a final volume of 1 ml. The BSA standards and lung homogenate samples
were measured on a 2802 UV/VIS spectrophotometer (UNICO, Dayton, NJ, USA) at 595
nm, and the optical density (OD) values were recorded using the UV/VIS Analyst
software. Based on the measured ODs of the standards, a curve was constructed and a
linear regression was used to fit the ODs and calculate the R2 value. An R2 value between
0.950 and 1.00 was considered adequate for estimating the protein concentrations in the
lung homogenates based on the measured ODs. For this study, all standard curves
constructed had an R2 value between 0.960-0.990. The lung protein concentration was
calculated, and the loading volume was determined based on loading 50 g of protein in
each well during the western blot.
34
2.10 Western Blotting for Caspase-3 and Actin
To examine whether apoptotic activity was modified in the rat lung as an outcome
of ALI, western blotting was used to probe for caspase-3 activation. This was determined
by the expression levels of uncleaved (inactive) and cleaved (active) forms of caspase-3
in the lung homogenates. The lung homogenate samples were prepared based on the
determined volumes from the protein assay (50 g loaded protein) and 5X sample buffer.
Prior to loading, the samples were heated for 5 minutes at 85°C to denature the proteins,
and the boiled samples were loaded into a 12% SDS-PAGE resolving gel. Alongside the
samples, a Precision Plus Kaleidoscope 10-band protein standard (10-250 kD, from BIO-
RAD, Mississauga, ON, Canada) was used. The gel gasket chamber was filled with 1X
running buffer and connected to a PowerPac HC from BIO-RAD, and run at 90V and
300W for approximately 70 minutes.
Upon protein separation on the gel, the proteins were transferred onto a pure
nitrocellulose membrane (Pall Corporation, Pensacola, FL, USA) in the gasket chamber
(filled with 1X transfer buffer) for 2 hours at 45V. The membrane was saturated with a
5% milk solution (made with 1X TBS and 0.2% Tween; 1X TTBS) for 1 hour with gentle
rocking at room temperature (Stovall Lifescience Inc., Greensboro, NC, USA). The
primary polyclonal Caspase-3 antibody (raised in the rabbit) detects the uncleaved 35 kD
protein, as well as 17 and 12 kD cleaved fragments. The antibody has species cross-
reactivity for human, mouse, rat and monkey (Cell Signaling Technology). The primary
antibody was added at 1:1000 dilution prepared with 5% milk and 1X TTBS and
incubated overnight at 4°C with gentle rocking.
The primary antibody was removed, and the membrane washed with 1X TBS and
35
TTBS. The secondary antibody (Anti-rabbit IgG, HRP-linked, Cell Signaling
Technology) was added at a 1:1000 dilution prepared with 5% milk and 1X TTBS and
incubated for 2 hours with gentle rocking at room temperature. The secondary antibody
was removed, and the membrane was washed with 1X TBS and TTBS. The membrane
was imaged using the ECL Plus western blot detection system (GE Healthcare, purchased
from Fisher Scientific, Ottawa, ON, Canada). The membrane was exposed to film for 10
minutes and subsequently developed.
The primary and secondary antibodies were stripped off the membrane using
Restore western blot stripping buffer from Thermo Scientific (from Fisher Scientific,
Ottawa, ON, Canada). The membrane was saturated with 5% milk solution and re-probed
with an actin antibody as a loading control. The membrane was incubated in a 1:400
dilution of mouse monoclonal antibody of Actin HRP-linked IgG (Santa Cruz
Biotechnology Inc., Santa Cruz, CA, USA) overnight at 4°C with gentle rocking. The
antibody dilution was prepared with 1X TBS and 0.2% BSA. The actin antibody was
removed, and the membrane was washed with 1X TBS and TTBS and imaged using the
ECL Plus detection kit. The membrane was exposed to film for 1 minute and
subsequently developed.
2.11 Densitometric Analysis of Caspase-3 Expression
The developed films were scanned and analyzed using the Image J software
(National Institues of Health, Bethesda, USA). The images were inverted and the density
of the uncleaved caspase-3 band (35 kD), cleaved caspase-3 band (17 kD), and
background were measured and recorded. The difference between the measured bands
and the background was calculated, and the ratio of active: inactive caspase-3 was
36
determined.
2.12 Statistical Analysis Two rats were excluded from the Injurious Normocapnia group, and two rats were
excluded from the Permissive Hypercapnia group. These animals were excluded due to
premature death before the end of the 3-hour ventilation period, and failure to meet the
set PaCO2 targets for normocapnia and hypercapnia. Therefore, Conventional
Normocapnia, Lung-Protective Ventilation, Conventional Hypercapnia and Protective
Hypercapnia each had n=10 per group. Meanwhile, Injurious Normocapnia and
Permissive Hypercapnia had n=10 rats per group.
Data are expressed as means ± SD or SEM. All statistical analysis was conducted
using the SPSS 10.0 software (Chicago, IL, USA) and the GraphPad Prism 5.0 software
(La Jolla, CA, USA). Data sets were tested for normality using the D'Agostino & Pearson
Omnibus normality test (Graphpad Prism 5.0), and the data were normally distributed
(p>0.05). Differences between groups were tested by analysis of variance (one-way
ANOVA), followed by Tukey or Dunnett post-hoc tests, or a two-tailed Student’s t-test.
Two-way ANOVAs were used to test differences between experimental time points
(baseline, 1 hour, 4 hours) in each group. The repeated-measures ANOVA was used to
compare within-subjects measurements at baseline, after 1 hour and 4 hours and between-
subjects interactions. The level of significance was set at P< 0.05.
37
CHAPTER 3 RESULTS
3.1 Hemodynamics
At baseline, all groups had equal hemodynamic functions, with no differences in
the MAP, HR and cardiac index (cardiac output normalized to the body surface area of
the rat) (CI). One hour (60 min) after induction of acute lung injury (ALI), the groups did
not differ in MAP, HR and CI. After 4 hours of ventilation, all groups had equal MAP,
HR and CI (p=0.5435, p=0.7254, p=0.9524, respectively). There were no time-dependent
changes in MAP, HR and CI at baseline, 1 hour and 4 hours of ventilation in all groups.
The MAP, HR and CI measurements at baseline, 1 hour and 4 hours of ventilation for
each group are summarized in Table 2, and illustrated in Figure 3, Figure 4, and Figure 5.
3.2 Respiratory Mechanics At baseline, all groups were ventilated with equal equal VT, RR, and minute
ventilation (VE),. Elastance was equal in all groups at baseline, demonstrating equal
respiratory mechanics in all groups at baseline. One hour after induction of ALI, VT and
RR, and VE were maintained from baseline, and hence did not differ between groups.
The elastance increased significantly in all groups after 1 hour of ventilation (p<0.0001)
(Figure 9).
3.2.1 Confirmation of Experimental Design
After 4 hours of ventilation in each group, VT, RR and VE differed in all groups
as per the target group settings. Three groups were ventilated with a conventional VT
(Conventional Normocapnia, Injurious Normocapnia, and Conventional Hypercapnia),
38
where VT was increased in order to achieve the target PaCO2 in each group. The three
remaining groups were ventilated with a protective VT (Lung-Protective Ventilation,
Protective Hypercapnia, and Permissive Hypercapnia), which was limited to 8 mL/Kg
maintained from baseline. After 4 hours of ventilation, the Conventional Normocapnia,
Injurious Normocapnia and Conventional Hypercapnia groups had significantly higher
VT compared to Lung-Protective Ventilation, Protective Hypercapnia, and Permissive
Hypercapnia (p<0.0001) (Figure 6). Meanwhile, the protective VT in Lung-Protective
Ventilation, Protective Hypercapnia, and Permissive Hypercapnia groups also did not
differ (p=0.4726). The conventional VT was higher in Conventional Normocapnia
compared to Conventional Hypercapnia (p=0.0032) (Figure 6). There was a significant
interaction between changes in VT and the ventilation duration (p<0.0001), indicating
changes in VT over 4 hours of ventilation.
Respiratory rate was increased in three groups (Lung-Protective Ventilation,
Injurious Normocapnia, and Protective Hypercapnia) compared to Conventional
Normocapnia, Conventional Hypercapnia and Permissive Hypercapnia groups, which
were ventilated with a reduced RR after 4 hours of ventilation (p<0.0001) (Figure 7). In
addition, there was a significant interaction between the changes in RR and the
ventilation duration, indicating changes in RR over time (p<0.0001). The changes in VT
and RR resulted in VE that was significantly greater in Lung-Protective Ventilation and
Injurious Normocapnia compared to other groups at the end of ventilation (p<0.0001)
(Figure 8). There was also a significant interaction between changes in VE and the
ventilation duration, indicating changes in VE over 4 hours of ventilation (p<0.0001). The
Injurious Normocapnia group exhibited the highest VE due to a combination of increased
39

VT and RR, which represents a potentially injurious ventilatory mechanism. After 4 hours
of ventilation, the elastance increased equally in all groups (p=0.3351). The increase in
elastance was significant compared to baseline elastance, but not different compared to
elastance after 1 hour of ventilation (Figure 9). The values are shown in detail in Table 3.
3.3 Gas Exchange Equal gas exchange was achieved at baseline, with physiologic values of pH,
PaO2 and PaCO2 in all groups. The ratio of PaO2 to the FiO2 (P/F) ratio was used to
evaluate oxygenation. After 1 hour of ventilation, The P/F ratio decreased equally in all
groups, however this was not a statistically significant from baseline. At the end of
ventilation period (4 hours), the P/F ratio deteriorated further in all groups compared to
baseline (p<0.0001). All groups developed ALI per definitionem (P/F ratio 300 mmHg)
(Table 4) (Figure 10).
The PaCO2 did not significantly in all groups at 1 hour compared to baseline.
However, after 4 hours of ventilation, the three normocapnic groups (Conventional
Normocapnia, Lung-Protective Ventilation, Injurious Normocapnia) had a PaCO2
between 40-55 mmHg. The three hypercapnic groups (Conventional Hypercapnia,
Protective Hypercapnia, Permissive Hypercapnia) had a PaCO2 between 60-70 mmHg
(Table 4). The PaCO2 was significantly higher in the hypercapnic groups compared to the
normocapnic groups (p<0.0001) (Figure 11) but the PaCO2 did not differ within the three
normocapnia (p=0.1723) or the three hypercapnia groups (p=0.4158). There was a
significant interaction between the changes in PaCO2 and the ventilation duration
(p=0.0098), confirming changes in the PaCO2 over 4 hours of ventilation.
40
Permissive Hypercapnia was the only group to produce profound respiratory
acidosis in the rats. This was defined by an arterial pH less than 7.20, and shown by a
significantly lower pH in Permissive Hypercapnia compared to Lung-Protective
Ventilation (p=0.0264) after 4 hours of ventilation (Figure 12). In addition, only in the
Permissive Hypercapnia group was the pH significantly lower after 4 hours of ventilation
compared to baseline (7.37 ± 0.08 vs. 7.17 ± 0.11, p=0.0009) (Figure 12). Interestingly,
the inhaled CO2 in Conventional Hypercapnia and Protective Hypercapnia did not induce
severe respiratory acidosis. These changes in pulmonary gas exchange are outlined in
Table 4.
3.4 Wet-to-Dry Lung Ratio Lung-Protective Ventilation resulted in a significantly lower wet-to-dry (W/D)
ratio compared to Conventional Normocapnia (6.93 ± 0.86 vs. 8.62 ± 1.87, p=0.0186),
with a similar difference found between Lung-Protective Ventilation and Injurious
Normocapnia (6.93 ± 0.86 vs. 8.43 ± 1.79, p=0.0328) (Figure 13). In addition, the W/D
ratio was significantly lower in Protective Therapeutic Hypercapnia compared to
Injurious Normocapnia (6.37 ± 2.10 vs. 8.43 ± 1.79, p=0.0428) (Figure 13). Meanwhile,
Conventional Therapeutic Hypercapnia and Permissive Hypercapnia produced similar
W/D ratios at 7.81 ± 1.56 and 7.44 ± 2.03, respectively.
3.5 Diffuse Alveolar Damage Lung Injury Score The Diffuse Alveolar Damage (DAD) score was significantly lower in
Conventional Hypercapnia compared to Injurious Normocapnia (1.06 ± 0.27 vs. 1.64 ±
41

0.33, p=0.0317), Conventional Normocapnia (1.06 ± 0.27 vs. 1.49 ± 0.38) (p=0.0097),
and Lung-Protective Ventilation (1.06 ± 0.27 vs. 1.44 ± 0.42) (p=0.0247) (Figure 14).
The DAD scores for Protective Hypercapnia, and Permissive Hypercapnia were 1.34 ±
0.38, and 1.23 ± 0.47, respectively (Figure 14).
The DAD score was the arithmetic mean of seven subscores, which included
alveolar edema, interstitial edema, PMN infiltrates, hemorrhaging, atelectasis, hyaline
membranes and alveolar damage. The subscores for hemorrhages and PMN infiltrates are
not shown because there were no differences between the groups. The subscores for
alveolar edema, interstitial edema, atelectasis, hyaline membranes and alveolar damage
are shown in Figure 15. Alveolar edema was lower in Protective Hypercapnia than
Permissive Hypercapnia (p=0.0125), however interstitial edema (within lung tissues) was
lower in Permissive Hypercapnia compared to Protective Hypercapnia (p=0.0295).
Interstitial edema was lower in Conventional Hypercapnia compared to Injurious
Normocapnia (p=0.0152). The alveolar damage subscore was also lower in Conventional
Hypercapnia compared to Injurious Normocapnia (p=0.0214), with a similar difference in
hyaline membranes (fibrous structures lining alveoli) (p=0.0101). The differences
between Conventional Hypercapnia and Injurious Normocapnia in the alveolar damage,
interstitial edema and hyaline membrane subscores are also reflected in the DAD score.
The development of hyaline membranes was also greater in Injurious Normocapnia
compared to Lung-Protective Ventilation, Protective Hypercapnia and Permissive
Hypercapnia (p=0.0292). Atelectasis (alveolar collapse) was lower in Conventional
Hypercapnia compared to Conventional Normocapnia and Lung-Protective Ventilation
(p=0.0453). The presence of alveolar edema, interstitial edema, hyaline membranes,
42

atelectasis, alveolar damage, PMN infiltrates, and hemorrhages is also illustrated in
representative lung tissues from each group (Figure 16).
3.6 Cytokine Analysis 3.6.1 Plasma Cytokines
Ten inflammatory mediators were measured in the arterial plasma. These
mediators were IL-1 , I-CAM, IL-6, TNF- , GM-CSF, IL-10, RANTES, KC, MCP-1,
and MIP-1 . Plasma IL-1 concentrations were lower in Protective Hypercapnia
compared to Conventional Normocapnia and Lung-Protective Ventilation (p=0.0042).
(Figure 17A). Conventional Hypercapnia decreased IL-1 compared to Conventional
Normocapnia (p=0.0196). TNF- levels were lower in Protective Hypercapnia compared
to Conventional Normocapnia (p=0.0194) (Figure 17D). Surprisingly, IL-10 levels were
higher in the Conventional Normocapnia group compared to Protective Hypercapnia
(p=0.0480) (Figure 17F). Meanwhile, I-CAM, IL-6, RANTES, KC, MIP-1 and MCP-1
levels did not differ significantly between the groups, and GM-CSF was present in
negligible concentrations (<10 pg/ml for all groups) (Tremblay et al. 1997;
Venkataraman et al. 2002; Yang et al. 2000; Nanji et al. 1999).
3.6.2 BALF Cytokines IL-1 , I-CAM, IL-6, TNF- , GM-CSF, IL-10, RANTES, KC, MCP-1, and MIP-
1 . were also measured in bronchoalveolar lavage fluid (BALF) collected from the lungs
after 4 hours of ventilation. IL-6 was significantly lower in Conventional Hypercapnia
compared to Injurious Normocapnia (p=0.0206), and Conventional Normocapnia
(p=0.0202) (Figure 18C). IL-10 levels were higher in Permissive Hypercapnia compared
43

44
to Lung-Protective Ventilation (p=0.0244) (Figure 18F). Monocyte Chemotactic Protein-
1 (MCP-1) levels were lower in all hypercapnia groups compared to Conventional
Normocapnia (p=0.0021), Lung-Protective Ventilation (p=0.0189), and Injurious
Normocapnia (p=0.0003) (Figure 18I). IL-1 , I-CAM, TNF- , RANTES, KC, and MIP-
1 concentrations did not differ significantly between all groups. Similar to plasma GM-
CSF, the concentration of GM-CSF in BALF was also negligible in all groups (<
10pg/ml) (Tremblay et al. 1997; Beck-Schimmer et al. 1997; Yang et al. 2007; Miyake et
al. 2004; Elgrabli et al. 2008).
3.7 Caspase-3 Activation in Lung Homogenates
Caspase-3 activation was measured in lung homogenates as an indication of
apoptotic activity (programmed cell death) in the lung. The inactive (uncleaved) form of
caspase-3 showed a 35 kD protein (Figure 19). Meanwhile, the prominent form of active
(cleaved) caspase-3 showed a 17 kD band (Figure 19). Caspase-3 expression is shown as
a ratio of active (17 kD) to inactive (35 kD) caspase-3. An increase in caspase-3
activation was defined by a ratio of active: inactive caspase-3 that is greater than 1.0.
While only Protective Hypercapnia showed an increase caspase-3 activation (ratio>1.0)
(Figure 20), Lung-Protective Ventilation showed more activation relative to Injurious
Normocapia (p=0.0183).

CHAPTER 4 DISCUSSION
This study was designed to investigate whether the attenuation of VALI during
protective ventilation is attributed to low tidal volume or the resulting hypercapnia. It was
hypothesized that VALI attenuation is primarily attributed to hypercapnia. Rats were
used in an acid aspiration model of ALI and assigned to six groups, where VT settings
(protective vs. conventional) and PaCO2 targets (normocapnia vs. hypercapnia) were
varied. The effect of permissive (endogenous) and therapeutic (inhaled) CO2 was also
evaluated. The findings indicate that a protective VT alone only reduced lung edema, but
increased apoptosis compared to a high VT. Meanwhile, hypercapnia reduced several
biomarkers of systemic and lung inflammation, suggesting some potential anti-
inflammatory effects of hypercapnia via intracellular CO2-mediated mechanisms.
4.1 Physiologic Effects All groups were hemodynamically stable at baseline and throughout ventilation,
as shown by no differences in MAP, heart rate and cardiac index. This demonstrates that
protective ventilation and hypercapnia (permissive and therapeutic) do not compromise
hemodynamic stability compared to conventional ventilation and normocapnia, and thus
did not affect the hemodynamic outcome of VALI. Sinclair et al. (2002) also showed
equal hemodynamic stability in hypercapnic and normocapnic animals. Costello et al.
(2009) also showed hemodynamic stability in hypercapnic and normocapnic animals in
lung injury secondary to prolonged systemic sepsis. In the same study however, Costello
et al. reported that hypercapnia can increase MAP compared to normocapnia in early
systemic sepsis. Changes in MAP were not noted in the present study, however this effect
45

may be specific to the model used (acid apsiration vs. sepsis-induced ALI), or the
experimental time course (early vs. late phase of illness). It is possible that no significant
hemodynamic changes were observed in our model of aspiration-induced ALI because
the injury may have been largely localized to the lung and not systemic enough to cause
hemodynamic changes. Therefore, the hemodynamic stability established in hypercapnia
and normocapnia in this study is consistent with previous findings.
The increased elastance in all groups after 1 and 4 hours of ventilation confirms
the progressive development of ALI (Figure 9). This is because more pressure is required
to force air into the lungs and achieve the set tidal volume (protective or conventional).
Elastance is inversely related to lung compliance, which is the ability of the lung to recoil
to its original volume after inflation (Jonson et al. 1999). A highly compliant lung
requires less pressure to inflate, while a reduction in compliance indicates a need for high
pressures to inflate the lung adequately. The increased elastance indicates a decreased
lung compliance, resulting in a lung which is less compliant to stretch during ventilation.
This change in the mechanical properties of the respiratory system has been shown to
correlate with the amount and increase of non-aerated lung in other acute lung injury
models (Henzler et al. 2005) and can be regarded as a correlate of the severity of lung
injury.
Extreme changes in minute ventilation can also contribute to the development of
lung injury. Minute ventilation that is too low (as seen in Permissive Hypercapnia) causes
hypoventilation leading to alveolar edema (Figure 15), which, along with interstitial
edema, contributes to the total lung edema measured by the wet-to-dry lung ratio (Figure
13). Alveolar edema contributes to ALI because fluid accumulation in alveolar spaces
46

limits the amount of gas that can flow across alveolar walls. Though we did not show that
Permisisve Hypercapnia causes atelectasis, this has previously been shown (Fehil et al.
2000) and reviewed by Bigatello et al. (2001). Atelectasis may also result from
hypoventilation, and can impair gas exchange and worsen VALI by alveolar collapse,
such that fewer alveoli can participate in gas exchange. Therefore, while hypoventilation
can reduce excessive lung stretch and tissue tearing during ventilation, it also has the
potential to worsen VALI.
While the optimal low (protective) tidal volume is yet to be determined for the
attenuation of VALI, Frank et al. (2002) reported a reduction in epithelial and endothelial
injury in the lungs of rats ventilated with 3 and 6 mL/Kg. However, Muscedere et al.
(1994) ventilated isolated rat lungs with 5-6 mL/Kg. They concluded that ventilation with
volumes below the inflection point on the pressure-volume curve (the volume at which
the majority of alveoli are open) reduces lung compliance and increases the progression
of ALI. This is likely an outcome of atelectasis, which contributes to the exacerbation of
VALI. In the present study, atelectasis resulting from a low tidal volume was only present
in Lung-Protective Ventilation (compared to Conventional Hypercapnia). Therefore, it is
important to define the range of low tidal volumes that may be used in lung-protective
settings without causing hypoventilation and atelectasis.
Conversely, minute ventilation that is too high (as seen in Injurious Normocapnia)
causes interstitial edema, alveolar damage and hyaline membranes (Figure 15). These
changes represent important biomarkers which impair gas exchange and contribute to
VALI. Interstitial edema is marked by fluid accumulation within lung tissue, making the
lung less compliant to inflate adequately during ventilation. Alveolar damage is the
47

hallmark of high minute ventilation by causing excessive stretch and tissue tearing in the
lung, which destroys the alveolar epithelium. Hyaline membranes are fibrous eosinophilic
structures made of fibrin, collagen, elastin and cellular debris (Castro, 2006). The
formation of hyaline membranes along alveolar walls disrupts gas exchange by creating
an additional barrier through which gas exchange must occur, thereby worsening VALI.
Therefore, minute ventilation that is too high exacerbates VALI in an injurious
mechanism separate from the injurious mechanism caused by hypoventilation.
These changes in minute ventilation may have also worsened VALI by causing
hemorrhages. All groups showed equal lung hemorrhages, suggesting that the ventilation
settings in each group may be causing equal amounts of tissue damage by a mechanism
that disrupts the alveolar-capillary interface. Damage to the alveolar-capillary interface
can facilitate the entry of extracellular fluids and red blood cells into the lung interstitium
and alveolar spaces (Marini et al. 2003). Mechanical ventilation settings leading to
increased microvascular pressure in pulmonary capillaries are enough to disrupt the
alveolar-capillary interface and cause tissue hemorrhages by a process known as Stress
Failure (West et al. 1991; Fu et al. 1992). Therefore, it is possible that all groups
exhibited equal lung hemorrhages because of a high tidal volume (Conventional
Normocapnia, Injurious Normocapnia, Conventional Hypercapnia), high respiratory rate
(Lung-Protective Ventilation and Protective Ventilation) and extreme changes in minute
ventilation (Injurious Normocapnia and Permissive Hypercapnia). An increased
respiratory rate can be particularly important in disrupting the alveolar-capillary interface
because it increases cyclic opening and closing of alveoli during ventilation, which
causes lung tissue tearing.
48

While Lung-Protective Ventilation also exhibited high minute ventilation by
increased RR (Figure 8), hyaline membranes (Figure 15) and edema (Figure 13) were
significantly reduced in this group compared to Injurious Normocapnia. Since both
groups were ventilated under normocapnic conditions, the development of hyaline
membranes in Injurious Normocapnia may be a function of high tidal volume. The
hyaline membrane subscore in Conventional Normocapnia may show some support for
this notion since this group also had a high volume, however this was not a statistically
significant difference with Lung-Protective Ventilation (Figure 15). Conventional
Hypercapnia had a high tidal volume as well, however it produced significantly fewer
hyaline membranes and a lower grade of diffuse alveolar damage (DAD) compared to the
three normocapnic groups (Figure 14). This may be due to the inhaled CO2 leading to
hypercapnia, suggesting that hypercapnia may have a beneficial effect even in the
presence of an injurious ventilation mechanism.
The reduced wet-to-dry lung ratio in Lung-Protective Ventilation compared to
Conventional and Injurious Normocapnia suggests that pulmonary edema may also be a
function of high tidal volume (Figure 13). This is supported by reduced pulmonary edema
in Protective Hypercapnia compared to Injurious Normocapnia, demonstrating the
importance of a low (protective) tidal volume for reducing lung edema. This finding also
suggests that hypercapnia by inhaled CO2 does not attenuate edema. Interestingly, both
Laffey et al. (2000b) and Sinclair et al. (2002) showed that therapeutic hypercapnia by
inhaled CO2 reduces lung edema (lower wet-to-dry ratio) compared to normocapnia. The
wet-to-dry lung ratio is a gross assessment of total lung edema, however it can be an
effective technique for estimating fluid content in the lung.
49

Meanwhile, the detailed assessment of lung edema by the alveolar and interstitial
edema subscores does not support for the findings of the wet-to-day ratio. We show that
Protective Hypercapnia reduced alveolar edema compared to Permissive Hypercapnia,
however Protective Hypercapnia produced more interstitial edema than Permissive
Hypercapnia (Figure 15). The increased alveolar edema in Permissive Hypercapnia may
be due to hypoventilation leading to atelectasis and fluid accumulation in collapsed
alveoli. Both Permissive and Protective Hypercapnia had a low (protective) tidal volume,
Protective Hypercapnia did not cause hypoventilation because of the increased RR as
well as the flow of inhaled CO2, which may have maintained proper inflation of alveoli.
However, the continuous flow of CO2 gas in addition to the oxygen from the ventilator
may have pushed some fluid into the lung interstitium, causing interstitial edema. This
likely did not occur in Permissive Hypercapnia because of the endogenous CO2, causing
less interstitial edema in that group.
Lung edema is believed to be an outcome of impaired fluid clearance from the
lungs during ventilation, which has been shown in rats and in patients with ALI and
ARDS (Lecuona et al. 1999; Ware and Matthay, 2001). This effect has been attributed to
the endocytosis of the Na+/K+ ATPase in the membranes of alveolar epithelial cells
(Lecuona et al. 2007; Dada et al. 2007). Endocytosis of the Na+/K+ ATPase has been
described by the PURED (Phosphorylation-Ubiquitination-Recognition-Endocytosis-
Degradation) pathway, and may be used to explain impaired fluid clearance during
ventilation (Lecuona et al. 2007; reviewed in Ismaiel and Henzler, 2011). High tidal
volume in conventional ventilation or hypoventilation in Permissive Hypercapnia can
impair gas exchange, leading to hypoxia (Dada et al. 2003; Lecuona et al. 2007). Hypoxia
50

can initiate the phosphorylation and ubiquitination of the Na+/K+ ATPase, leading to its
internalization and lysosomal degradation (Dada et al. 2007). With fewer Na+/K+
ATPases, Na+ ion transport across the alveolar epithelium is markedly reduced, thereby
reducing water transport by transcellular or paracellular mechanisms and allowing more
fluid to accumulate in alveoli.
Alternatively, the epithelial sodium channel (ENaC) and cystic fibrosis
transmembrane conductance regulator (CFTR) chloride channel have also been
implivated in alveolar fluid clearance (Folkesson et al. 1998; Fang et al. 2005). It is
possible that impairment in the expression of these membrane proteins can lead to
alveolar fluid accumulation leading to pulmonary edema in the ventilated lung. This has
been attributed to the potential downregulation of ENaC in alveolar epithelial type II cells
during high tidal volume ventilation by a cGMP-dependent mechanism (Frank et al.
2003). In the present study, this may explain the increased pulmonary edema in the high
tidal volume groups (Conventional and Injurious Normocapnia) compared to Lung-
Protective Ventilation.
We have clearly demonstrated that mechanical ventilation has the potential to
worsen the existing aspiration-induced ALI, leading to VALI that is marked by further
deterioration of gas exchange and a less compliant lung. Indeed, gas exchange (measured
by the P/F ratio) deteriorated equally in all groups (Table 4). It is possible that this equal
deterioration may be attributed to the intitial insult to the lungs (acid aspiration). Since
each group was ventilated for only 4 hours, and since all animals received the same dose
of acid aspiration, it is likely that the deteriorated P/F ratio is primarily attributed to the
aspiration. In addition, a 4-hour ventilation may not have been long enough to
51

significantly improve gas exchange with the different ventilation settings in each group.
While we did not show an improvement in gas exchange, we established an experimental
model of aspiration-induced ALI (1.25M HCl at 2.5 ml/kg) such that the injury is
progressive over 4 hours without causing hemodynamic instability.
We previously showed that inducing ALI by acid aspiration using 5 mL of 1M
HCl caused significant ARDS, where the P/F ratio decreased significantly after 1 hour
but did not deteriorate further after 5 hours (Henzler et al. 2011). While that model
established lung injury more quickly than the present study, establishing ARDS within 1
hour of ventilation increases the risk for hemodynamic instability and premature death.
Our present model is particularly effective because it better reflects clinical aspiration-
induced ALI, which develops over several hours as opposed to a single hour.
Despite the changes in PaCO2, physiologic pH was maintained in all groups
except for Permissive Hypercapnia, which caused profound respiratory acidosis relative
to Conventional Normocapnia and Lung-Protective Ventilation (Figure 12). In the
normocapnic groups, physiologic pH (approximately 7.30-7.40 in the rat, Fraser et al.
1978) was maintained by limiting CO2 accumulation. This was achieved either by
increased tidal volume or respiratory rate, which both facilitate CO2 clearance from the
lungs by increasing minute ventilation. Permissive Hypercapnia was induced by
decreasing minute ventilation, which lead to hypoventilation and accumulation of
endogenous CO2. Interestingly, the Protective and Conventional Hypercapnia groups
(inhaled CO2) did not induce respiratory acidosis. Hypercapnia by endogenous CO2
caused respiratory acidosis, however inhaled CO2 did not affect the pH. This may be an
outcome of a compensatory buffering mechanism in the presence of exogenous CO2 that
52

is otherwise not present or impaired when the CO2 originates endogenously and
accumulates quickly. It is possible that bicarbonate (HCO3-) plays an important role in
this compensatory buffering mechanism. While HCO3- concentrations were not analyzed
in this study, sustained hypercapnia has previously been shown to activate renal
acidification processes and prevent hypercapnic acidosis (Battle et al. 1985). This is
likely achieved by increasing the secretion of hydrogen ions (H+) from the collecting duct
of the nephron.
CO2 can be sensed by central and peripheral chemoreceptors (Lahiri and Forster,
2003; Jiang et al. 2005). Central Chemoreceptors (which also sense H+) are located on
medullary neurons in the medulla oblongata, while peripheral chemoreceptors are located
in the carotid and aortic bodies (Lahiri and Forster, 2003). CO2 and H+ concentrations are
specifically monitored by the CO2/H+ sensor-receptor (Lahiri and Forster, 2003; Forster
and Smith, 2010). This chemosensor plays a key role in quickly detecting and buffering
CO2 in order to prevent H+ accumulation leading to acidosis. In Permissive Hypercapnia,
it is possible that the accumulated endogenous CO2 impaired or disrupted the function of
the CO2/H+ receptors. This may have prevented the detection of accumulated CO2 to
activate buffering mechanisms by HCO3-, leading to H+ accumulation and respiratory
acidosis. With Protective and Conventional Hypercapnia, inhaled CO2 may have been
immediately detected by the peripheral CO2/H+ sensor-receptors. This may have
activated downstream buffering mechanisms involving HCO3- to increase renal clearance
of H+ and prevent respiratory acidosis. However, the role of the CO2/H+ sensor-receptor
is still not well understood in the context of Permissive and Therapeutic Hypercapnia.
53

Perhaps future in vitro experiments using alveolar epithelial cells can uncover the role of
the CO2/H+ receptor and its mechanism of action in preventing respiratory acidosis.
Several other studies have demonstrated that Therapeutic Hypercapnia by inhaled
CO2 leads to respiratory (hypercapnic) acidosis (Laffey et al. 2000b; Sinclair et al. 2002;
Peltekova et al. 2010). Meanwhile, we showed that Permissive rather than Therapeutic
Hypercapnia caused respiratory acidosis. This difference can be attributed to the fraction
of inspired CO2, which was only 1.6% in this study, but was as high as 5-12% (Sinclair et
al. 2002; Laffey et al. 2000b, Peltekova et al. 2010). A low inhaled CO2 fraction was
chosen for this study to cause moderate hypercapnia and evaluate its true effects in the
absence of hypercapnic acidosis.
4.2 Systemic and Pulmonary Inflammation Protective Hypercapnia by inhaled CO2 reduced both IL-1 and TNF- in the
circulating plasma (Figure 17), suggesting a decrease in some of the important
biomarkers of systemic inflammation. This effect may be attributed to the protective tidal
volume or the inhaled CO2. In the case of IL-1 , it is likely due to the inhaled CO2
because Protective Hypercapnia reduced systemic IL-1 compared to Lung-Protective
Ventilation. Both groups had the same tidal volume and only differed in the PaCO2 target
(normocapnia vs. hypercapnia). IL-1 was also reduced in Conventional Hypercapnia
compared to Conventional Normocapnia, demonstrating a potential anti-inflammatory
effect of hypercapnia by inhaled CO2 that is evident even in the presence of a high tidal
volume. IL-1 is synthesized as a proprotein, after which it is cleaved by caspase-1 to
produce active IL-1 and released by monocytes, dendritic cells and macrophages
54

(Eder et al. 2009). IL-1 release can be triggered by a variety of stimuli. In the case of
VALI, mechanical stress on the body during ventilation may have produced Damage-
Associated Molecular Pattern molecules (DAMPs) that induced IL-1 secretion (Eder et
al. 2009; Lotze et al. 2007). It is possible that CO2 entry across leukocyte cell membranes
in Protective Hypercapnia may have disrupted IL-1 cleavage and activation, thereby
reducing its release from activated macrophages and monocytes.
TNF- is another potent pro-inflammatory cytokine that can be released by
activated macrophages, T-cells, B-cells and natural killer cells (Pradines-Figueres and
Raetz, 1992). TNF- is initially synthesized as a membrane-anchored proprotein and later
proteolytically processed to produce the mature form (Gearing et al. 1994). TNF-
inhibition in Protective Hypercapnia may be attributed to the protective tidal volume or
the inhaled CO2. If it is due to the inhaled CO2, it is possible that the CO2 may have
interacted with and inhibited the TNF- converting enzyme (TACE) (Mohan et al. 2002).
Inhibition of this enzyme would likely prevent the cleavage and activation of TNF- ,
rendering it biologically inactive.
However, if the reduction in TNF- in Protective Hypercapnia is due to the
protective tidal volume, this may have been mediated by a mechanism involving the
reduction of pulmonary edema (Figure 13). Dagenais et al. (2004) showed that TNF-
can downregulate ENaC expression in alveolar epithelial cells, thereby reducing alveolar
fluid clearance by impairing Na+ transport. Interestingly however, in this study we did
not show a reduction in TNF- release in Protective Hypercapnia in BALF (Figure 18).
This may be due to the activation of TNF- that peaks approximately 90-120 minutes
after the insult to the lungs (Horgan et al. 1993). Since cytokines were sampled 4 hours
55

after the insult to the lung, peak TNF- activation may have been missed. Plasma
cytokines were specifically sampled after the 4 hours to determine whether 4 hours of
ventilation in each group is enough to modulate the inflammatory response associated
with VALI.
Surprisingly, the anti-inflammatory cytokine IL-10 was present in higher
concentrations in Conventional Normocapnia compared to Protective Therapeutic
Hypercapnia (Figure 17). This difference is the reverse of the TNF- concentrations in
those groups. This is particularly surprising because IL-10 has been reported to reduce
LPS-induced release of TNF- and IL-1 from activated monocytes (Wang et al. 1994).
Wang et al. (1995) later showed that IL-10 exhibits its anti-inflammatory effects in a
mechanism that inhibits NF- B. Wang et al. (1995) showed that IL-10 inhibited NF- B
translocation into the nucleus, suggesting that IL-10 may have prevented the proteosomal
degradation of I- B and its dissociation from NF- B.
Our data demonstrate that Protective Hypercapnia can reduce plasma IL-1 and
TNF- , however this reduction is likely not mediated by IL-10-dependent inhibition of
cytokine transcription. Rather, this reduction could be mediated by another anti-
inflammatory cytokine such as IL-4. While IL-4 does not inhibit NF- B (Wang et al.
1995), it can effectively inhibit cytokine synthesis in monocytes (Wang et al. 1994).
While we did not measure plasma IL-4 levels, it is still possible that IL-4 may have been
involved in the inhibition of IL-1 and TNF- in Protective Hypercapnia in an IL-10-
independent mechanism.
Alternatively, previous reports indicate that physical stress caused by mechanical
ventilation activates the -adrenergic signaling system by releasing catecholamines that
56

bind to 2 adrenergic receptors on leukocytes. This signaling cascade downregulates pro-
inflammatory cytokines such as TNF- , and upregulates anti-inflammatory cytokine
activation such as IL-10 (Plötz et al. 2004; Kavelaars et al. 1997). In line with the present
findings, Frank et al. (2002) also found elevated IL-10 plasma concentrations in rats
ventilated with a high VT. This is likely due to the activation of innate immune responses
that upregulate IL-10 to protect against the injurious ventilation mechanisms (Figure 17).
Increasing IL-10 release during Conventional Ventilation may have limited the release of
downstream pro-inflammatory cytokines in response to tissue damage not only in the
lung, but also in distal organs such as the liver and kidney.
Systemic inflammation is an important component of VALI because it contributes
to multiple-organ dysfunction. The changes in IL-1 and TNF- are likely not an
outcome of a “spill-over” of cytokines originating from the lung because these cytokines
were equally upregulated in the BALF of all treatment groups. Therefore, the systemic
changes in IL-1 and TNF- may have originated from circulating leukocytes and not
from lung-infiltrating immune cells..
IL-6 was lower in the BALF of the Conventional Hypercapnia group compared to
Injurious and Conventional Normocapnia (Figure 18). This reflects the same difference
found in the DAD lung injury score (Figure 14), and confirms that inhaled CO2 has some
therapeutic potential even in the presence of non-protective (high tidal volume)
ventilation settings. Peltekova et al. (2010) also showed a downregulation in IL-6 content
in the BALF of mice ventilated with therapeutic hypercapnia (inhaled CO2) compared to
normocapnia using a model of ventilator-induced lung injury. Therefore, our results
57
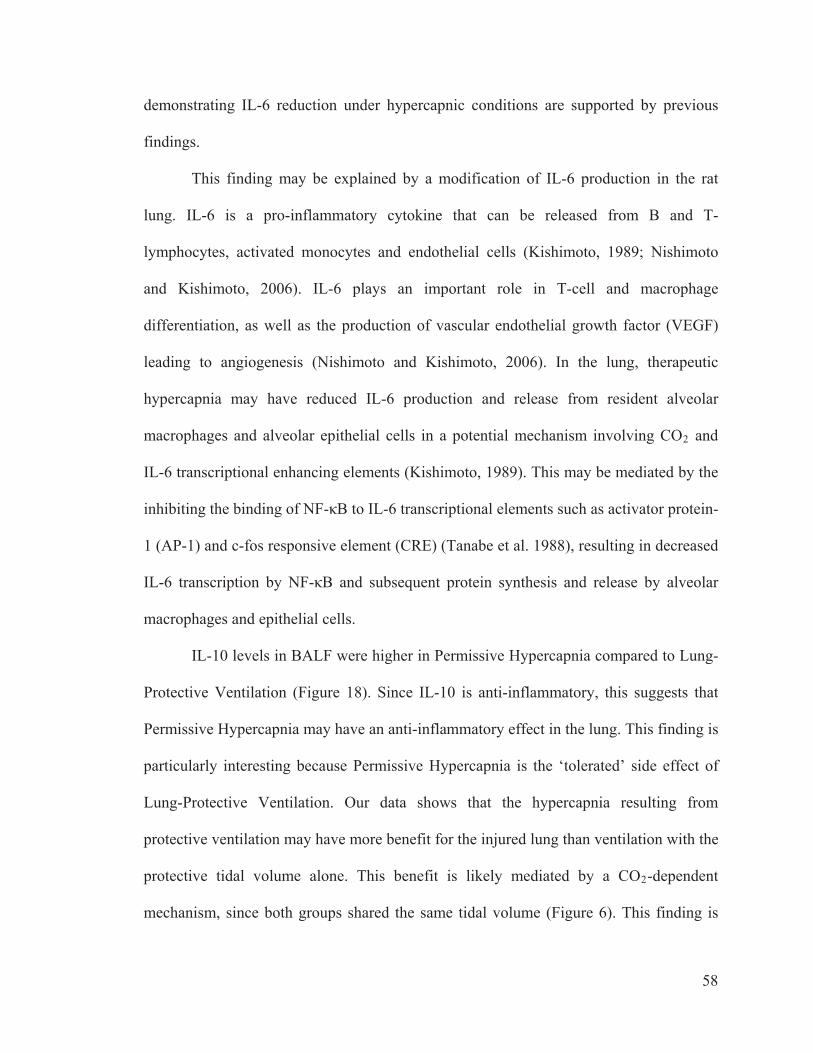
demonstrating IL-6 reduction under hypercapnic conditions are supported by previous
findings.
This finding may be explained by a modification of IL-6 production in the rat
lung. IL-6 is a pro-inflammatory cytokine that can be released from B and T-
lymphocytes, activated monocytes and endothelial cells (Kishimoto, 1989; Nishimoto
and Kishimoto, 2006). IL-6 plays an important role in T-cell and macrophage
differentiation, as well as the production of vascular endothelial growth factor (VEGF)
leading to angiogenesis (Nishimoto and Kishimoto, 2006). In the lung, therapeutic
hypercapnia may have reduced IL-6 production and release from resident alveolar
macrophages and alveolar epithelial cells in a potential mechanism involving CO2 and
IL-6 transcriptional enhancing elements (Kishimoto, 1989). This may be mediated by the
inhibiting the binding of NF- B to IL-6 transcriptional elements such as activator protein-
1 (AP-1) and c-fos responsive element (CRE) (Tanabe et al. 1988), resulting in decreased
IL-6 transcription by NF- B and subsequent protein synthesis and release by alveolar
macrophages and epithelial cells.
IL-10 levels in BALF were higher in Permissive Hypercapnia compared to Lung-
Protective Ventilation (Figure 18). Since IL-10 is anti-inflammatory, this suggests that
Permissive Hypercapnia may have an anti-inflammatory effect in the lung. This finding is
particularly interesting because Permissive Hypercapnia is the ‘tolerated’ side effect of
Lung-Protective Ventilation. Our data shows that the hypercapnia resulting from
protective ventilation may have more benefit for the injured lung than ventilation with the
protective tidal volume alone. This benefit is likely mediated by a CO2-dependent
mechanism, since both groups shared the same tidal volume (Figure 6). This finding is
58

also interesting because Permissive Hypercapnia and Lung-Protective Ventilation have
never been directly compared in experimental VALI.
Monocyte Chemotactic Protein-1 (MCP-1) is a potent chemotactic cytokine.
MCP-1 can be produced by epithelial cells, monocytes, and endothelial cells (Reviewed
in Deshmane et al. 2009). MCP-1 in BALF was significantly lower in all three
hypercapnia groups compared to all three normocapnia groups (Figure 18). This suggests
that hypercapnia has the potential to reduce the recruitment of monocytes and other
immune cells (T-cells, macrophages and dendritic cells) to the injured lung. Interestingly,
MCP-1 levels were reduced in Permissive Hypercapnia (endogenous CO2) Conventional
and Protective Hypercapnia (inhaled CO2) equally. This demonstrates that CO2 may play
a role in reducing monocyte recruitment to the lung, regardless of whether the CO2
originates endogenously or exogenously. As well, CO2 appears to reduce monocyte
recruitment to the lung independently of tidal volume settings, since all three hypercapnia
groups reduced MCP-1 equally. The mechanism of MCP-1 inhibition by CO2 is unclear,
however it likely includes CO2 disruption of MCP-1 synthesis and release from
monocytes. This may be mediated by the enzyme heme oxygenase-1, which has been
shown to downregulate MCP-1 expression (Shokawa et al. 2006).
Meanwhile, no differences were found in the levels of I-CAM, GM-CSF,
RANTES, macrophage inflammatory protein-1 (MIP-1 ), and keratinocyte
chemoattractant (KC). This finding was surprising, since many of these biomarkers have
previously been implicated in various models of lung injury (Nathens et al. 1998;
Frossard et al. 2002; Shanley et al. 1995; Imanaka et al. 2001; Kwon et al. 1995;
Yanagisawa et al. 2003). GM-CSF (Granulocyte Macrophage-Colony Stimulating Factor)
59
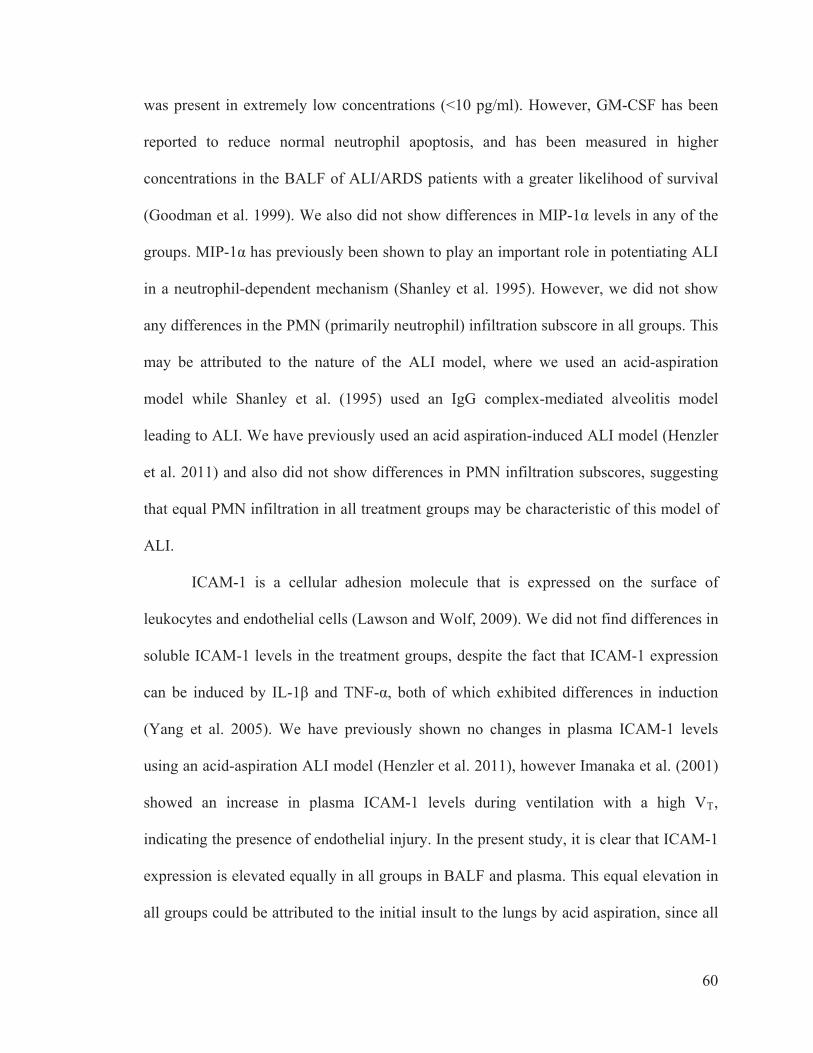
was present in extremely low concentrations (<10 pg/ml). However, GM-CSF has been
reported to reduce normal neutrophil apoptosis, and has been measured in higher
concentrations in the BALF of ALI/ARDS patients with a greater likelihood of survival
(Goodman et al. 1999). We also did not show differences in MIP-1 levels in any of the
groups. MIP-1 has previously been shown to play an important role in potentiating ALI
in a neutrophil-dependent mechanism (Shanley et al. 1995). However, we did not show
any differences in the PMN (primarily neutrophil) infiltration subscore in all groups. This
may be attributed to the nature of the ALI model, where we used an acid-aspiration
model while Shanley et al. (1995) used an IgG complex-mediated alveolitis model
leading to ALI. We have previously used an acid aspiration-induced ALI model (Henzler
et al. 2011) and also did not show differences in PMN infiltration subscores, suggesting
that equal PMN infiltration in all treatment groups may be characteristic of this model of
ALI.
ICAM-1 is a cellular adhesion molecule that is expressed on the surface of
leukocytes and endothelial cells (Lawson and Wolf, 2009). We did not find differences in
soluble ICAM-1 levels in the treatment groups, despite the fact that ICAM-1 expression
can be induced by IL-1 and TNF- , both of which exhibited differences in induction
(Yang et al. 2005). We have previously shown no changes in plasma ICAM-1 levels
using an acid-aspiration ALI model (Henzler et al. 2011), however Imanaka et al. (2001)
showed an increase in plasma ICAM-1 levels during ventilation with a high VT,
indicating the presence of endothelial injury. In the present study, it is clear that ICAM-1
expression is elevated equally in all groups in BALF and plasma. This equal elevation in
all groups could be attributed to the initial insult to the lungs by acid aspiration, since all
60

groups received the same dose and concentration of HCl. In addition, animals may not
have been ventilated long enough (only 4 hours) to see effects of individual ventilation
strategies on ICAM-1 expression.
4.3 Apoptosis in the Lung We showed that Lung-Protective Ventilation produced more active caspase-3
compared to Injurious Normocapnia (Figure 20). This finding was unexpected, since
protective ventilation settings and hypercapnia were expected to reduce programmed cell
death in the lung by decreasing caspase-3 activation. This is based on previous studies
showing apoptotic activity in alveolar epithelial cells and endothelial cells in endotoxin-
induced ALI (Fujita et al. 1998; Kitamura et al. 2001). In addition, Laffey et al. (2000b)
also showed a marked reduction in cell death in rabbits treated with therapeutic
hypercapnia and hypercapnia acidosis using the TUNEL stain, with similar findings
shown by Tateda et al. (2003) and Kawasaki et al. (2000). However, the TUNEL stain
may not be a true indicator of apoptosis because it labels DNA fragments of dead cells in
addition to cells in the process of apoptosis. Since cells can die by apoptotic or necrotic
mechanisms, TUNEL staining may not be the most effective technique to evaluate
apoptosis. Meanwhile, measuring active caspase-3 expression may be a better indicator
of apoptotic cell activity.
Our findings may be explained if apoptosis is considered a protective rather than a
harmful cellular regulatory mechanism. That is, Lung-Protective Ventilation may have
increased apoptotic activity in the lung by caspase-3 activation in order to prevent cell
death by necrotic cellular pathways. The fact that Injurious Normocapnia shows the
lowest active: inactive caspase-3 ratio (Figure 20) may lend some support for this
61

concept, because a ratio of active: inactive caspase-3 less than 1.0 indicates less active
caspase-3. If Injurious Normocapnia did not activate as much caspase-3 as Lung-
Protective Ventilation, cell death in Injurious Normocapnia may have been induced by
necrosis as opposed to apoptosis.
Cells of the lung (epithelial cells and fibroblasts) are continuously replaced as
aged or damaged cells undergo cell death and new cells differentiate into different types
of epithelial cells (Bowden, 1983). Such a process is tightly regulated and involves basal
apoptotic activity that creates a balance between the cells undergoing apoptosis and
differentiation (Bowden, 1983). The use of a 1:1 ratio to quantify active:inactive caspase-
3 reflects this balance between the two biological forms of caspase-3. A ratio less than
1.0 indicates a reduction in active caspase-3 expression. It is interesting to note that both
Lung-Protective Ventilation and Injurious Normocapnia produced ratios less than 1.0,
indicating a reduction in the basal 1:1 ratio of active:inactive caspase-3 expression.
However, caspase-3 activation in Injurious Normocapnia deviates from basal levels more
so than Lung-Protective Ventilation (Figure 20). This may be attributed to the injurious
nature of mechanical ventilation, which is worse in Injurious Normocapnia than Lung-
Protective Ventilation.
Alternatively, it is still possible that there were other undetected differences in
cell death in the rat lung, however this cell death may be attributed to necrosis rather than
apoptosis. Necrosis may have occurred as an outcome of volutrauma, barotrauma, and
biotrauma in all groups, regardless of protective or conventional ventilation settings,
normocapnia or hypercapnia, or the source of hypercapnia (endogenous or inhaled CO2).
It is equally possible that no differences in cell death were observed in this study due to
62

the type of ALI model used and not the ventilation settings. For example, Laffey et al.
(2000b) reported differences in cell death in rabbit lungs in an ischemia-reperfusion
model of ALI, and Tateda et al. (2003) reported differences in cell death in a murine
model of pneumonia-induced ALI. Therefore, the induction of cell death in lung tissue
may be more dependent on the lung injury model as opposed to the ventilation settings.
4.4 Permissive vs. Therapeutic Hypercapnia
Although the mechanisms by which hypercapnia occurred were different in
Permissive and Therapeutic Hypercapnia, the three hypercapnic groups did not differ in
the overall effect on VALI, except for the profound respiratory (hypercapnia) acidosis in
Permissive Hypercapnia. Previous studies have shown hypercapnic acidosis to be
effective for the attenuation of VALI (Laffey et al. 2000b; Sinclair et al. 2002; Laffey et
al. 2004). However, in all these studies, hypercapnic acidosis resulted from Therapeutic
and not Permissive Hypercapnia.
In this study, hypercapnic acidosis resulting from Permissive Hypercapnia did not
attenuate VALI, since Therapeutic Hypercapnia by inhaled CO2 appeared to have a
greater effect on reducing diffuse alveolar damage as well as some biomarkers of
systemic inflammation. However, Permissive Hypercapnia upregulated the anti-
inflammatory cytokine IL-10 in the lung, which may suggest some benefit of endogenous
CO2 and potentially hypercapnic acidosis. Meanwhile, previous studies have also
described the deleterious effects of hypercapnic acidosis using in vivo and in vitro models
(Lang et al. 2000; Doerr et al. 2005; O’Croinin et al. 2008). Although both in vitro and in
vivo studies are useful elements for investigating experimental ALI and VALI, both
systems have their limitations. In vivo studies tend to provide more applicable results as
63
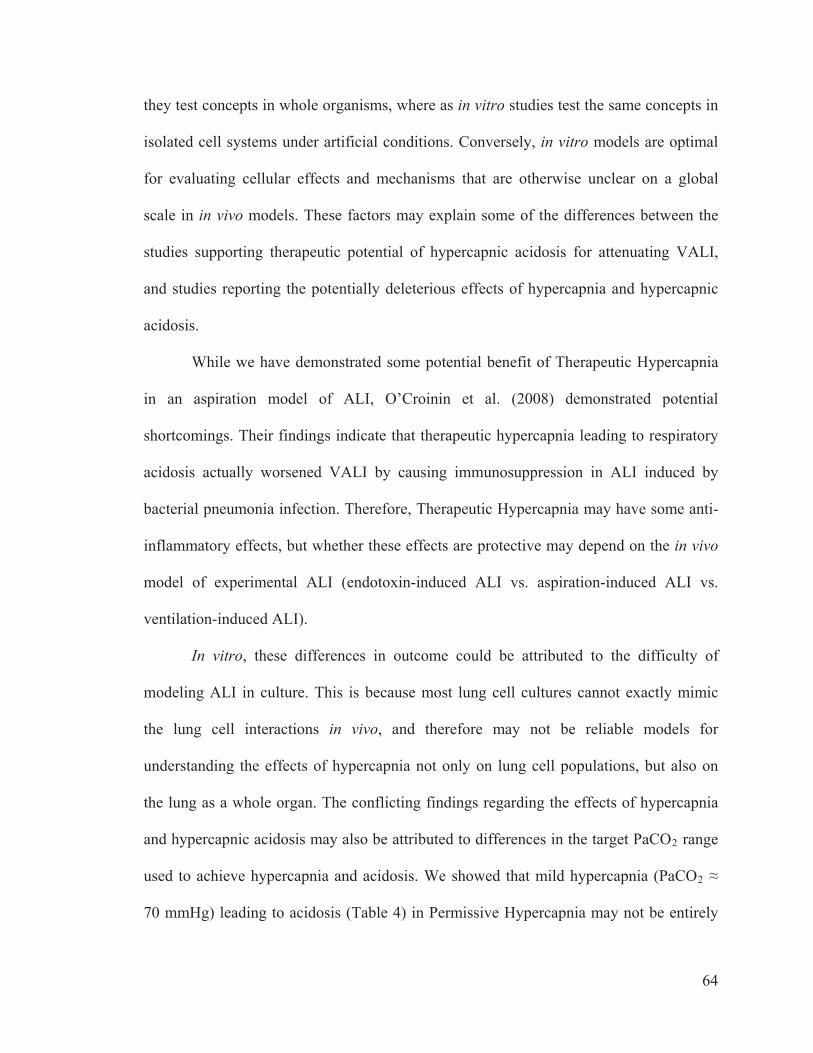
they test concepts in whole organisms, where as in vitro studies test the same concepts in
isolated cell systems under artificial conditions. Conversely, in vitro models are optimal
for evaluating cellular effects and mechanisms that are otherwise unclear on a global
scale in in vivo models. These factors may explain some of the differences between the
studies supporting therapeutic potential of hypercapnic acidosis for attenuating VALI,
and studies reporting the potentially deleterious effects of hypercapnia and hypercapnic
acidosis.
While we have demonstrated some potential benefit of Therapeutic Hypercapnia
in an aspiration model of ALI, O’Croinin et al. (2008) demonstrated potential
shortcomings. Their findings indicate that therapeutic hypercapnia leading to respiratory
acidosis actually worsened VALI by causing immunosuppression in ALI induced by
bacterial pneumonia infection. Therefore, Therapeutic Hypercapnia may have some anti-
inflammatory effects, but whether these effects are protective may depend on the in vivo
model of experimental ALI (endotoxin-induced ALI vs. aspiration-induced ALI vs.
ventilation-induced ALI).
In vitro, these differences in outcome could be attributed to the difficulty of
modeling ALI in culture. This is because most lung cell cultures cannot exactly mimic
the lung cell interactions in vivo, and therefore may not be reliable models for
understanding the effects of hypercapnia not only on lung cell populations, but also on
the lung as a whole organ. The conflicting findings regarding the effects of hypercapnia
and hypercapnic acidosis may also be attributed to differences in the target PaCO2 range
used to achieve hypercapnia and acidosis. We showed that mild hypercapnia (PaCO2
70 mmHg) leading to acidosis (Table 4) in Permissive Hypercapnia may not be entirely
64

protective. Meanwhile, Sinclair et al. (2002) treated with therapeutic hypercapnia (PaCO2
95 mmHg) causing more profound hypercapnic acidosis (pH 6.99) and shown effective
in attenuating lung injury. These effects could be an outcome of the severity of acidosis,
or the method by which hypercapnia was induced (permissive vs. therapeutic). Therefore,
more experimental studies are still necessary in order to create a unified understanding of
the effects of hypercapnia and hypercapnic acidosis in ALI and VALI.
4.5 Limitations of the Study
4.5.1 Ventilation Settings While the findings of this study are novel and scientifically applicable, there are
several factors that may have limited the study. First, the ventilation settings assigned for
each group did not differ sufficiently to produce greater difference in outcomes. The
ventilation settings for all groups may have been too injurious to differentiate between
those groups designated as ‘protective’ (Lung-Protective Ventilation, Protective and
Permissive Hypercapnia) from the groups designated as ‘conventional’ (Conventional
and Injurious Normocapnia, Conventional Hypercapnia). In this study, a protective VT
was defined as 8 mL/Kg in order to limit lung stretch without causing hypoventilation.
However, other studies have used a protective VT as low as 5-7 mL/Kg predicted body
weight (Hickling et al. 1990; ARDS Network, 2000; Ranieri et al. 1999). These studies
showed ventilation with VT between 5-7 mL/Kg to be significantly more protective
compared to conventional VT by reducing lung stretch, inflammation, and improving
survival. Therefore, a VT of 8 mL/Kg may not have been protective enough for the
injured lungs in this model of acid aspiration-induced ALI. As a result, this may have
diluted the differences between protective and conventional ventilation.
65

Alternatively, it is also possible that the ventilation settings for all groups may
have been fairly protective such that the differences between the ‘protective’ and
‘conventional’ groups were lost. In the present study, a ‘conventional’ VT was achieved
by increasing VT enough to achieve the target PaCO2, which was approximately 12-13
mL/Kg in the conventional ventilation groups. This coincided with previously reported
conventional VT that were shown to produce VALI in patients (ARDS Network, 2000;
Amato et al. 1998). However, other studies previously reported the use of VT as high as
15 mL/Kg during conventional ventilation of ARDS patients (Kollef and Schuster, 1995;
Kacmarek and Venegas, 1987). In addition, a VT as high as 30 mL/Kg was used in a rat
model of ALI as part of a conventional ventilation strategy in order to achieve significant
injury compared to protective ventilation with low VT (Frank et al. 2003). Taken
together, these studies suggest the potential need for higher VT in order to create a
conventional ventilation strategy that is more likely to cause VALI. In the present study,
the use of VT less than 15 mL/Kg for conventional ventilation could have made this
ventilation strategy somewhat protective.
4.5.2 Ventilation Duration In this study, all rats were ventilated for one hour after the induction of ALI, and
three hours in each of the assigned groups, for a total of four hours of ventilation. This
was based on previous studies where four hours of a given ventilation strategy was
enough to cause significant changes in gas exchange, inflammation, and lung damage
(Rotta et al. 2001; Sinclair et al. 2002; Chiumello et al. 1999). A 4-hour ventilation
period was also chosen for this study to minimize the risk for premature death in the
animals, which we have shown previously (unpublished data). In the current study, four
66

hours of ventilation was long enough to detect differences in the inflammatory response,
pulmonary edema and diffuse alveolar damage. However, it may not have been long
enough to detect differences in gas exchange, hemodynamics and overall attenuation of
VALI. For example, Laffey et al. (2004) ventilated rats with therapeutic hypercapnia for
6 hours and showed a significant reduction in pulmonary nitric oxide metabolites, PMN
infiltration and alveolar wall thickness in the lung, as well as improved respiratory
mechanics and survival rate. In another study, a 5-hour ventilation period in healthy mice
was enough to show the potentially deleterious effects of mechanical ventilation. These
effects included the induction of ALI by an increase in neutrophil infiltration and protein
concentrations in BALF, and an increase in pro-inflammatory cytokines in the lung and
systemically (Wolthuis et al. 2009).
There are other studies that ventilated for less than four hours, and still achieved
comparable results. For example, a ventilation period of only 90 minutes with protective
ventilation and therapeutic hypercapnia significantly reduced IL-1 and TNF- in BALF
(Laffey et al. 2000b). Moreover, a 3-hour ventilation period in a mouse model of
ventilator-induced lung injury with protective therapeutic hypercapnia showed a
significant decrease in pro-inflammatory cytokine activation and PMN infiltrates in the
lung (Peltekova et al. 2010). However, no differences in gas exchange or hemodynamics
were noted in that model, similar to the findings of the present study. Meanwhile,
mechanical ventilation in intensive care patients is often delivered for up to several days,
weeks and even months, depending on the patient’s condition. In some clinical studies, a
28-day survival period was used to evaluate the effects of mechanical ventilation
67

strategies in ALI and ARDS patients (ARDS Network, 2000; Amato et al. 1998; Ranieri
et al. 1999). Therefore, there is evidence to suggest that ventilation periods longer and
less than 4 hours have the potential to reduce the inflammatory and histopathological
markers of VALI in experimental models.
4.5.3 PaCO2 Targets
The PaCO2 targets for normocapnia and hypercapnia were well defined and
limited, however they were relatively close in range. Since normocapnia was defined by a
PaCO2 of 40-55 mmHg and hypercapnia by a PaCO2 of 60-70 mmHg, this increased the
likelihood of overlapping PaCO2 measurements in the different groups. The hypercapnia
range was chosen in order to induce hypercapnia without respiratory acidosis, in order to
evaluate the true effects of hypercapnia independent of hypercapnic acidosis. This was
successfully achieved in Protective and Conventional Hypercapnia (inhaled CO2) groups,
but not in Permissive Hypercapnia (Figure 12).
The normocapnia range was chosen so as to avoid hypocapnia, but still establish a
physiologic range of PaCO2. While the PaCO2 target for normocapnia was successfully
achieved, it may have been closer to hypercapnia than physiologic normocapnia. This
could have made the Injurious and Conventional Normocapnia groups more protective
than intended as per the experimental protocol. Therefore, having relatively close PaCO2
target ranges for normocapnia and hypercapnia may have diluted the potentially
therapeutic effects of hypercapnia.
Interestingly, Peltekova et al. (2010) used a PaCO2 target for normocapnia similar
to that of this study, however the PaCO2 target for hypercapnia was approximately 125
mmHg, demonstrating a substantial difference in the two PaCO2 ranges, and the presence
68

of hypercapnic acidosis. Alternatively, Hickling et al. (1994) reported a mean PaCO2 of
approximately 65 mmHg in ARDS patients ventilated with protective VT and permissive
hypercapnia, and showed improved patient survival. This supports the present study in
that a target PaCO2 range of 60-70 mmHg for hypercapnia may offer some benefit.
4.5.4 Rat Strain In this study, ALI was induced by acid aspiration in male Sprague-Dawley rats.
One hour after the induction of ALI, the PaO2 decreased from baseline in all groups,
however ALI per definitionem was only established in all groups at the end of ventilation
(4 hours) (Table 4). Since it took 4 hours for ALI or ARDS to develop in all groups, it is
possible that Sprague-Dawley rats may be somewhat robust and resistant to injury.
Several studies have investigated the effects of hypercapnia and hypercapnic acidosis in
ALI in different rat strains. Chonghaile et al (2008) also used Sprague-Dawley rats in
their model of ALI induced by bacterial pneumonia. In that study, the rats that received
E.coli instillation for 6 hours showed a small drop in PaO2 compared to untreated
controls, however this difference was statistically significant (157 ± 6 vs. 114 ± 25
mmHg). This may suggest some level of resistance to infection and injury in Sprague-
Dawley rats.
Alternatively, a study using a model of ventilator-induced lung injury in Wistar
rats demonstrated more drastic changes than those observed in Sprague-Dawley rats. In
that study, the PaO2 markedly dropped within 40 minutes of injurious ventilation with a
high pressure (45 cmH2O) (139 ± 27 vs. 45 ± 8 mmHg). Interestingly, there was also a
drop in the PaO2 of the rats ventilated with a low (protective) pressure (7 cmH2O) (133 ±
25 vs. 84 ± 15 mmHg) (Imanaka et al. 2001). Although this drop in PaO2 was small, it
69

was significant compared to baseline. While it is not clear whether these effects are due
to differences in rat strains or the nature of the ALI model, it is important to consider to
that different rat strains may respond differently to lung injury and ventilatory
interventions. Experimentally, it is important for animals to develop ALI as per protocol
in order to model clinical lung injury and objectively evaluate the effects of a treatment
or ventilation strategy on the animals.
4.5.5 Assessment of Survival After four hours of ventilation the animals were euthanized to eliminate any
potential pain and suffering. This prevented assessing the effects of hypercapnia and
protective ventilation on the survival of rats in this study. Laffey et al. (2004)
demonstrated an improvement in the survival of rats treated with hypercapnic acidosis
compared to untreated rats, after all animals were subject to endotoxin-induced ALI (89%
vs. 33%). Clinically, the assessment of survival in ALI and ARDS patients is of the
utmost importance. As such, protective ventilation and permissive hypercapnia have been
reported to improve patient survival (ARDS Network, 2000; Hickling 1994; Amato et al.
1998). This demonstrates the importance of evaluating the effect of ventilatory strategies
on the overall survival of the study population. This assessment was not undertaken in
this study and thus may have limited the findings.
4.5.6 Representative Lung Sampling
The upper lobe of the right lung was homogenized and used to analyze caspase-3
activation as a measure of programmed cell death in the rat lung. This lobe was chosen
because it was large enough to extract enough protein for western blot analysis of
70
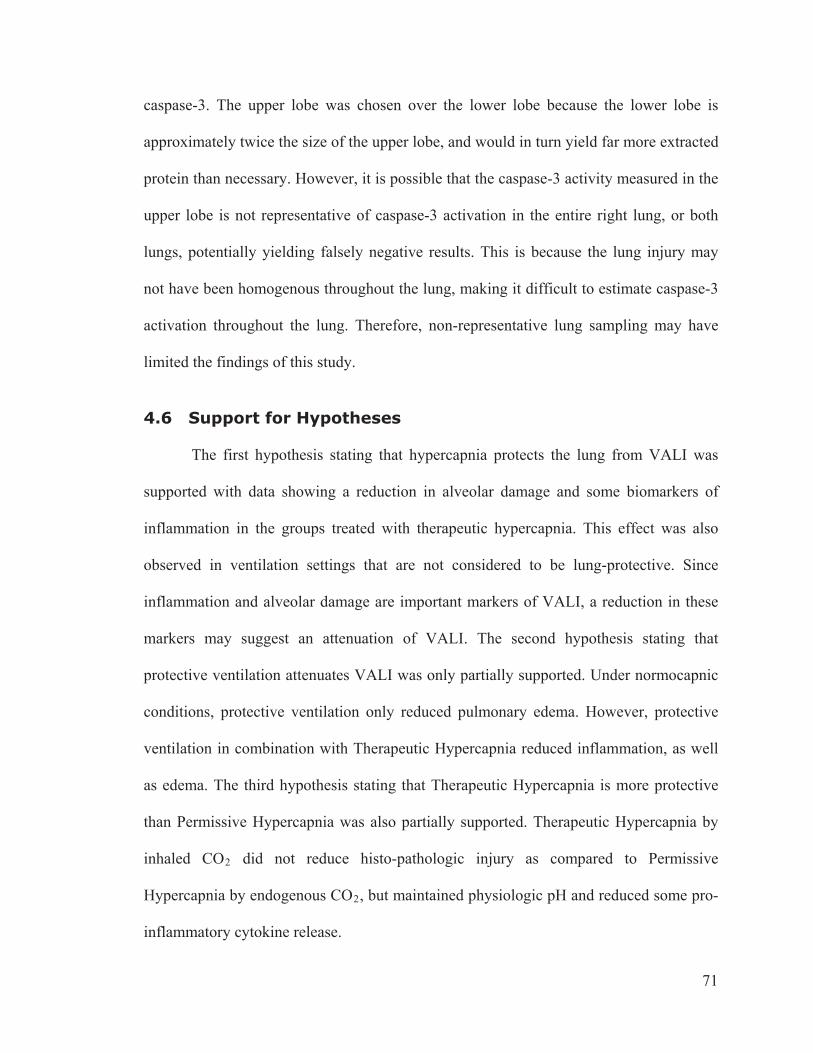
caspase-3. The upper lobe was chosen over the lower lobe because the lower lobe is
approximately twice the size of the upper lobe, and would in turn yield far more extracted
protein than necessary. However, it is possible that the caspase-3 activity measured in the
upper lobe is not representative of caspase-3 activation in the entire right lung, or both
lungs, potentially yielding falsely negative results. This is because the lung injury may
not have been homogenous throughout the lung, making it difficult to estimate caspase-3
activation throughout the lung. Therefore, non-representative lung sampling may have
limited the findings of this study.
4.6 Support for Hypotheses The first hypothesis stating that hypercapnia protects the lung from VALI was
supported with data showing a reduction in alveolar damage and some biomarkers of
inflammation in the groups treated with therapeutic hypercapnia. This effect was also
observed in ventilation settings that are not considered to be lung-protective. Since
inflammation and alveolar damage are important markers of VALI, a reduction in these
markers may suggest an attenuation of VALI. The second hypothesis stating that
protective ventilation attenuates VALI was only partially supported. Under normocapnic
conditions, protective ventilation only reduced pulmonary edema. However, protective
ventilation in combination with Therapeutic Hypercapnia reduced inflammation, as well
as edema. The third hypothesis stating that Therapeutic Hypercapnia is more protective
than Permissive Hypercapnia was also partially supported. Therapeutic Hypercapnia by
inhaled CO2 did not reduce histo-pathologic injury as compared to Permissive
Hypercapnia by endogenous CO2, but maintained physiologic pH and reduced some pro-
inflammatory cytokine release.
71
4.7 Clinical Implications and Conclusions The findings of this study may be clinically relevant for ALI and ARDS patients
that require mechanical ventilation. ALI and ARDS patients receive ventilatory support
to restore physiologic gas exchange, however the ventilation settings used to achieve this
outcome have the potential to cause VALI. To date, therapeutic hypercapnia has only
been studied in experimental models, and has been shown to be protective by reducing
inflammation, reactive oxygen and nitrogen species, and cell death. The current study
presents clinically relevant findings showing that therapeutic hypercapnia in combination
with protective ventilatory settings have the potential to attenuate VALI. These findings
may be particularly relevant to patients that develop ALI and ARDS by aspiration of
gastric acids. With additional research investigating the effects of therapeutic
hypercapnia on VALI, it may become possible to induce hypercapnia in ALI and ARDS
patients using a small fraction of inhaled CO2 to attenuate VALI and improve patient
survival.
In conclusion, this study investigated the effects of protective ventilatory settings,
Permissive and Therapeutic Hypercapnia on the attenuation of VALI. The effects of these
ventilatory strategies were studied in comparison to the effects of normocapnia and
conventional ventilation settings. Protective ventilation has the potential to attenuate
VALI in a mechanism which reduces pulmonary edema. Hypercapnia may also attenuate
VALI, however its effects may be mediated by a mechanism which reduces diffuse
alveolar damage, immune cell recruitment, and inflammation. Protective ventilation and
hypercapnia did not improve oxygenation, however they also did not cause hemodynamic
compromise. Therapeutic Hypercapnia by inhaled CO2 has the potential to reduce several
72

biomarkers of systemic inflammation without causing respiratory acidosis. This is the
first study to directly compare the effects of Therapeutic and Permissive Hypercapnia,
where Therapeutic Hypercapnia maintained physiologic pH without buffering. This study
is also the first to evaluate the effects of protective ventilation and hypercapnia together
in a rat model of acid aspiration-induced acute lung injury. We have demonstrated the
therapeutic potential for inhaled CO2 and protective ventilatory settings to attenuate
VALI and limit some of the biomarkers of inflammation, which should be continually
tested in future experimental and clinical trials.
Our results are encouraging, however there are various necessary experiments to
validate our present findings and proposed cellular mechanisms. First, a longer
ventilation duration (more than 4 hours) may allow us to better evaluate the effects of
hypercapnia and protective ventilation on the attenuation of VALI. In addition, analyzing
bicarbonate concentrations in arterial blood can help us better understand the
compensatory buffering mechanism in therapeutic hypercapnia. Histopatholigic
examination of liver and kidney tissues may give us an indication of multiple organ
dysfunction secondary to VALI. As well, measuring reactive nitrogen species such as
peroxynitrite and nitrotyrosine in urine samples may be useful for attributing some of the
effects of VALI to the production of reactive biological species. Finally, measuring total
protein concentrations (especially albumin) in BALF can serve as an indicator of vascular
leakage of serum proteins into the lungs (suggesting endothelila damage). These
experiments may allow us to better understand the global effects of VALI, as well as the
potential cellular mechanisms involved in the development and exacerbation of VALI.
73

REFERENCES
Amato MBP, Barbas CSV, Medeiros DM, Magaldi RB, Schettino GPP, Lorenzi-Filho G, Kairalla RA, Deheinzelin D, Munoz C, Oliveira R, Takagaki TY, Carvalho CRR. Effect of a protective-ventilation strategy on mortality in the acute respiratory distress syndrome. N Engl J Med 1998; 338: 347-354. ARDS Network. Ventilation with lower tidal volumes as compared with traditional tidal volumes for acute lung injury and the acute respiratory distress syndrome. N Engl J Med 2000; 342: 1301-1308. Barnes PJ, Karin M. Nuclear factor-kappaB: a pivotal transcription factor in chronic inflammatory diseases. N Engl J Med 1997; 336: 1066-1071. Barth A, Bauer R, Gedrange T, Walter B, Klinger W, Zwiener U. Influence of hypoxia and hypoxia/hypercapnia upon brain and blood peroxidative and glutathione status in normal weight and growth-restricted newborn piglets. Exp Toxicol Pathol 1998; 50: 402-410. Battle DC, Downer M, Gutterman C, Kurtzman NA. Relationship of urinary and blood carbon dioxide tension during hypercapnia in the rat: its significance in the elevation of collecting duct hydrogen ion secretion. J Clin Invest 1985; 75: 1517-1530. Beck-Schimmer B, Chimmer RC, Warner RL, Schemal H, Nordblom G, Flory CM, Lesch ME, Friedl HP, Schrier DJ, Ward PA. Expression of lung vascular and airway ICAM-1 after exposure to bacterial lipopolysaccharide. Am J Respir Cell Mol Biol 1997; 17: 344-352. Bellardine CL, Hoffman AM, Tsai L, Ingenito EP, Arold SP, Lutchen KR, Suki B. Comparison of variable and conventional ventilation in a sheep saline lavage lung injury model. Crit Care Med 2006; 34: 439-445. Bernard GR, Artigas A, Brigham KL, Carlet J, Falke K, Hudson L, Lamy M, Legall JR, Morris A, Spragg R. The American-European consensus conference on ARDS. Am J Respir Crit Care Med 1994; 149: 818-824. Bidani A, Tzouanakis AE, Cardenas VJ Jr, Zwischenberger JB. Permissive hypercapnia in acute respiratory failure. JAMA 1994; 272: 957-962.
74

Bigatello LM, Patroniti N, Sangalli F. Permissive hypercapnia. Curr Opin Crit Care 2001; 7: 34-40. Bloomfield GL, Holloway S, Ridings PC, Fisher BJ, Blocher CR, Sholley M, Bunch T, Sugerman HJ, Fowler AA. Pretreatment with inhaled nitric oxide inhibits neutrophil migration and oxidative activity resulting in attenuated sepsis-induced acute lung injury. Crit Care Med 1997; 25: 584-593. Bowden DH. Cell turnover in the lung. Am Rev Respir Dis 1983; 128: S46-S48. Briva A, Vadász I, Lecuona E, Welch LC, Chen J, Dada LA, Trejo HE, Dumasius V, Azzam Zs, Myrianthefs PM, Battle D, Gruenbaum Y, Sznajder JI. High CO2 levels impair alveolar epithelial function independently of pH. PLoS one 2007; 2: e1238. Brochard L, Roudot-Thoraval F, Roupie E, Delclaux C, Chatre J, Fernandez-Mondéjar E, Clémenti E, Mancebo J, Factor P, Matamis D, Ranieri M, Blanch L, Rodi G, Mentec H, Dreyfuss D, Ferrer M, Brun-Buisson C, Tobin M, Lemaire F. Tidal volume reduction for prevention of ventilator-induced lung injury in acute respiratory distress syndrome. Am J Respir Crit Care Med 1998; 158: 1831-1838. Brower RG, Shanholtz CB, Fessler HE, Shade DM, White P Jr, Wiener CM, Teeter JG, Dodd-o JM, Almog Y, Piantadosi S. Prostective, randomized, controlled clinical trial comparing traditional versus reduced tidal volume ventilation in acute respiratory distress syndrome patients. Crit Care Med 1999; 27: 1492-1498. Brun-Buisson C, Minelli C, Bertolini G, Brazzi L, Pimentel J, Lewandowski K, Bion J, Romand JA, Villar J, Thorsteinsson A, Damas P, Armaganidis A, Lemaire F. Epidemiology and outcome of acute lung injury in European intensive care units. Intensive Care Med 2004; 30: 51-61. Castro CY. ARDS and diffuse alveolar damage: A pathologist’s perspective. Semin Thorac Cardiovasc Surg 2006; 18: 13-19. Chiumello D, Pristine G, Slutsky AS. Mechanical ventilation affects local and systemic cytokines in an animal model of acute respiratory distress syndrome. Am J Respir Crit Care Med 1999; 160: 109-116.
75

Chonghaile MN, Higgins BD, Costello J, Laffey JG. Hypercapnic acidosis attenuates lung injury induced by established bacterial pneumonia. Anesthesiology 2008; 109: 837-848. Costello J, Higgins B, Contreras M, Chonghaile MN, Hassett P, O’Toole D, Laffey JG. Hypercapnic acidosis attenuates shock and lung injury in early and prolonged systemic sepsis. Crit Care Med 2009; 37: 2412-2420. Dada LA, Chandel NS, Ridge KM, Pedemonte C, Bertorello AM, Sznajder JI. Hypoxia-induced endocytosis of Na,K-ATPase in alveolar epithelial cells is mediated by mitochondrial reactive oxygen species and PKC- . J Clin Invest 2003; 111: 1057-1064. Dada LA, Welch LC, Zhou G, Ben-Saadon R, Ciechanover A, Sznajder JI. Phosphorylation and ubiquitination are necessary for Na,K-ATPase endocytosis during hypoxia. Cell Signal 2007; 19: 1893-1898. Dagenais A, Fréchette R, Yamagata Y, Yamagata T, Carmel JF, Clermont ME, Brochiero E, Massé C, Berthiaume Y. Downregulation of ENaC activity and expression by TNF-alpha in alveolar epithelial cells. Am J Physiol Lung Cell Mol Physiol 2004; 286: L301-L311. Debs RJ, Fuchs HJ, Philip R, Montgomery AB, Brunette EN, Liggitt D, Patton JS, Shellito JE. Lung-specific delivery of cytokines induces sustained pulmonary and systemic immunomodulation in rats. J Immunol 1998; 140: 3482-3488. Dembinski R, Max M, Bensberg R, Rossaint R, Kuhlen R. Pressure support compared with controlled mechanical ventilation in experimental lung injury. Anesth Analg 2002; 94: 1570-1576. Deshmane SL, Kremlev S, Amini S, Sawaya BE. Monocyte chemoattractant protein-1 (MCP): an overview. J Interferon Cytokine Res 2009; 29: 313-326. Determann RM, Royakkers A, Wolthuis EK, Vlaar AP, Choi G, Paulus F, Hofstra JJ, de Graff MJ, Korevaar JC, Schultz MJ. Ventilation with lower tidal volumes as compared with conventional tidal volumes for patients without acute lung injury: a preventative randomized controlled trial. Crit Care 2010; 14: R1.
76

Doerr CH, Gajic O, Berrios JC, Caples S, Abdel M, Lymp JF, Hubmayr RD. Hypercapnic acidosis impairs plasma membrane wound resealing in ventilator-injured lungs. Am J Respir Crit Care Med 2005; 171: Epub ahead of print. Donnelly SC, Strieter RM, Reid PT, Kunkel SL, Burdick MD, Armstrong I, Mackenzie A, Haslett C. The association between mortality rates and decreased concentrations of interleukin-10 and interleukin-1 receptor antagonist in the lung fluids of patients with the acute respiratory distress syndrome. Ann Intern Med 1996; 125: 191-196. Dreyfuss D, Soler P, Basset G, Saumon G. High inflation pressure pulmonary edema. Respective effects of high airway pressure, high tidal volume, and positive end-expiratory pressure. Am Rev Respir Dis 1988; 137: 1159-1164. Eder C. Mechanisms of interleukin-1 beta release. Immunobiology 2009; 214: 543-553. Elgrabli D, Floriani M, Abella-Gallart S, Meunier L, Gamez C, Delalain P, Rogerieux F, Boczkowski J, Lacroix G. Biodistribution and clearance of instilled carbon nanotubes in rat lung. Part Fibre Toxicol 2008; 5:20-32. Fan J, Ye RD, Malik AB. Transcriptional mechanisms of acute lung injury. Am J Physiol Lung Cell Mol Physiol 2001; 281: 1037-1050. Fang X, Song Y, Hirsch J, Galietta LJ, Pedemonte N, Zemans RL, Dolganov G, Verkman AS, Matthay MA. Contribution of CFTR to apical-basolateral fluid transport in cultured human alveolar epithelial type II cells. Am J Physiol Lung Cell Mol Physiol 2005; 290: L242-249. Fehil F, Eckert P, Brimioulle S, Jacobs O, Schaller MD, Mélot C, Naeije R. Permissive hypercapnia impairs pulmonary gas exchange in the acute respiratory distress syndrome. Am J Respir Crit Care Med 2000; 162: 209-215. Floretto JR, Campos FJ, Ronchi CF, Ferreira AL, Kurokawa CS, Carpi MF, Moraes MA, Bonatto RC, Defaveri J, Yeum KJ. Respir Care 2011; July (Epub ahead of print). Folkesson HG, Nitenberg G, Oliver BL, Jayr C, Albertine KH, and Matthay MA. Upregulation of alveolar epithelial fluid transport after subacute lung injury in rats from bleomycin. Am J Physiol Lung Cell Mol Physiol 275: L478–L490, 1998.
77

Forster HV, Smith CA. Contributions of central and peripheral chemoreceptors to the ventilatory response to CO2/H+. J Appl Physiol 2010; 108: 989-994. Frank JA, Gutierrez JA, Jones KD, Allen L, Dobbs L, Matthay MA. Low tidal volume reduces epithelial and endothelial injury in acid-injured rat lungs. Am J Respir Crit Care Med 2002; 165: 242-249. Frank JA, Pittet JF, Lee H, Godzich M, Matthay MA. High tidal volume ventilation induces NOS2 and impairs cAMP-dependent air space fluid clearance. Am J Physiol Lung Physiol 2003; 284: 791-798. Fraser JR, Oliveira PH, Hüttner I. Effect of blood pH on anionic ferritin transport through rat aortic endothelium. Experientia 1978; 34: 1171-1172. Frossard JL, Saluja AK, Mach N, Lee HS, Bhagat L, Hadenque A, Rubbia-Brandt, Dranoff G, Steer ML. In vivo evidence for the role of GM-CSF as a mediator in acute pancreatitis-associated lung injury. Am J Physiol Lung Cell Mol Physiol 2002; 283: L541-L548. Fu Z, Costello ML, Tsukimoto K, Prediletto R, Elliott AR, Mathieu-Costello O, West JB. High lung volume increases stress failure in pulmonary capillaries. J Appl Physiol 1992; 73: 123-133. Fujita M, Kuwano K, Kunitake R, Hagimoto N, Miyazaki H, Kaneko Y, Kawasaki M, Maeyama T, Hara N: Endothelial cell apoptosis in lipopolysaccharide-induced lung injury in mice. Int Arch Allergy Immunol 1998, 117: 202-208 Gammanpila S, Bevan DR, Bhudu R. Effect of positive and negative expiratory pressure on renal function. Br J Anaesth 1977; 49: 199-205. Gearing AJ, Beckett P, Christodoulou M, Churchill M, Clements J, Davidson AH, Drummond AH, Galloway WA, Gilbert R, Gordon JL. Processing of tumor necrosis factor-alpha precursor by metalloproteinases. Nature 1994; 370: 555-557.
78

Goodman ER, Striker P, Velavicius M et al. Role of granulocyte-macrophage colony-stimulating factor and its receptor in the genesis of acute respiratory distress syndrome through an effect on neutrophil apoptosis. Arch Surg 1999; 134: 1049-1054. Goodman RB, Strieter RM, Martin DP, Steinberg KP, Milberg JA, Maunder RJ, Kunkel SL, Walz A, Hudson LD, Martin TR. Inflammatory cytokines in patients with persistence of the acute respiratory distress syndrome. Am J Respir Crit Care Med 1996; 154: 602-611. Gores GJ, Nieminen AL, Wray BE, Herman B, Lemasters JJ. Intracellular pH during “chemical hypoxia” in cultured rat hepatocytes. Protection by intracellular acidosis against the onset of cell death. J Clin Invest 1989; 83: 386-396.
Hammer J. Acute Lung Injury: pathophysiology, assessment, and current therapy. Paed Resp Rev 2000; 2: 10-21.
Henzler D, Hochhausen N, Chankalal R, Xu Z, Whynot SC, Slutsky AS, Zhang H. Physiologic and biologic characteristics of three experimental models of acute lung injury in rats. Anesth Analg 2011; 112: 1139-1146. Henzler D, Pelosi P, Dembinski R, Ullmann A, Mahnken AH, Rossaint R, Kuhlen R. Respiratory compliance but not gas exchange correlates with changes in lung aeration after a recruitment maneuver: an exprerimental study in pigs with saline lavage lung injury. Crit Care 2005; 9: 471-482. Hickling KG, Henderson SJ, Jackson R. Low mortality with low volume pressure limited ventilation with permissive hypercapnia in severe adult respiratory distress syndrome. Intensive Care Med 1990; 16: 372-377. Hickling KG. Low volume ventilation with permissive hypercapnia in the adult respiratory distress syndrome. Clin Intensive Care 1992; 3: 67-78. Hickling KG, Walsh J, Henderson S, Jackson R, Low mortality in adult respiratory distress syndrome using low-volume, pressure-limited ventilation with permissive hypercapnia: a prospective study. Crit Care Med 1994; 22: 1568-1578. Hooper J. Advances in mechanical ventilation. Can J Anaesth 1998; 45: 149-159.
79

Horgan MJ, Palace GP, Everitt JE, Malik AB. TNF-alpha release in endotoxemia contributes to neutrophil-dependent pulmonary edema. Am J Physiol Heart Circ Physiol 1993; 264: 1161-1165. Ijland MM, Heunks LM, van der Hoeven JG. Bench-to-bedside review: hypercapnic acidosis in lung injury—from ‘permissive’ to ‘therapeutic’. Crti Care 2010; 14 (Epub Nov). Imanaka H, Shimaoka M, Matsuura N, Nishimura M, Ohta N, Kiyono H. Ventilator-induced lung injury is associated with neutrophil infiltration, macrophage activation, and TGF-beta 1 mRNA upregulation in rat lungs. Anesth Analg 2001; 92: 428-436. Ismaiel NM, Henzler D. Effects of hypercapnia and hypercapnic acidosis on attenuation of ventilator-associated lung injury. Minerva Anestesiol 2011; 77:723-733. Jaber S, Jung B, Sebbane M, Ramonatxo M, Capdevila X, Mercier J, Eldejam JJ, Matecki S. Alterations of the piglet diaphragm contractility in vivo and its recovery after acute hypercapnia. Anesthesiology 2008; 108: 651-658. Jiang C, Rojas A, Wang R, Wang X. CO2 central chemosensitivity: why are there so many sensory molecules. Respir Physiol Neurobiol 2005; 145: 115-126. Jonson B, Richard JC, Straus C, Mancebo J, Lemaire F, Brochard L. Pressure-volume curves and compliance in acute lung injury: Evidence of recruitment above the lower inflection point. Am J Respir Crit Care Med 1999; 159: 1172-1178. Kacmarek RM, Venegas J. Mechanical ventilatory rates and tidal volumes. Respir Care 1987; 32: 466-478. Kaplan SH, Yang H, Gilliam DE, Shen J, Lemasters JJ, Cascio WE. Hypercapnic acidosis and dimethyl amiloride reduce reperfusion induced cell death in ischaemic ventricular myocardium. Cardiovasc Res 1995; 29: 231-238. Kavanagh BP, Laffey JG. Hypercapnia: permissive and therapeutic. Minerva Anestesiol 2006; 72: 567-576.
80

Kavelaars A, Pol M van de, Zijlstra J, Heijnen CJ. Beta-2-adrenergic activation enhances interleukin-8 production by human monocytes. J Neuroimmunol 1997; 177: 211-216. Kawasaki M, Kuwano K, Hagimoto N, Matsuba T, Kunitake R, Tanaka T, Maeyama T, Hara N. Protection from lethal apoptosis in lipopolysaccharide-induced acute lung injury in mice by a caspase inhibitor. Am J Pathol 2000; 157: 597-603. Kishimoto T. The biology of interleukin-6. Blood 1989; 74: 1-10. Kitakaze M, Takashima S, Funaya H, Minamino T, Node K, Shinozaki Y, Mori H, Hori M. Temporary acidosis during reperfusion limits myocardial infarct size in dogs. Am J Physiol 1997; 272: 2071-2078. Kitamura Y, Hashimoto S, Mizuta N, Kobayashi A, Kooguchi K, Fujiwara I, Nakajima H. Fas/FasL-dependent apoptosis of alveolar cells after lipopolysaccharide-induced lung injury in mice. Am J Respir Crit Care Med 2001; 163: 762-769. Kogan AKh, Grachev SV, Eliseeva SV, Bolevich S. Ability of carbon dioxide to inhibit generation of superoxide anion radical in cells and its biomedical role. Vopr Med Khim 1996; 42: 193-202. Kollef MH, Schuster DP. The acute respiratory distress syndrome. N Engl J Med 1995; 332: 27-37. Kristof AS, Goldberg P, Laubach V, Hussain SNA. Role of inducible nitric oxide synthase in endotoxin-induced acute lung injury. Am J Respir Crit Care Med 1998; 158: 1883-1889. Kruger NJ. The Bradford method for protein quantitation. In: The protein protocols handbook. (2nd end). Walker JM. (ed.) Humana Press Inc., USA, 2002, pp 15-21. Kumagai M, Kondo T, Ohta Y, Ishihara T. Size and composition changes in diaphragmatic fibers in rats exposed to chronic hypercapnia. Chest 2001; 119: 565-571.
81

Kwon OJ, Jose PJ, Robbins RA, Schall TJ, Williams TJ, Barnes PJ. Glucocorticoid inhibition of RANTES expression in human lung epithelial cells. Am J Respir Cell Mol Biol 1995; 12: 488-496. Laffey JG, Engelberts D, Kavanagh BP. Buffering hypercapnic acidosis worsens acute lung injury. Am J Respir Crit Care Med 2000a; 161: 141-146. Laffey JG, Tanaka M, Engelberts D, Luo X, Yuan S, Tanswell AK, Post M, Lindsay T, Kavanagh BP. Therapeutic hypercapnia reduces pulmonary and systemic injury following in vivo lung reperfusion. Am J Respir Crit Care Med 2000b; 162: 2287-2294. Laffey JG, Honan D, Hopkins N, Hyvelin JM, Boylan JF, McLoughlin P. Hypercapnic acidosis attenuates endotoxin-induced acute lung injury. Am J Respir Crit Care Med 2004; 169: 46-46. Lahiri S, Forster RE II. CO2/H+ sensing: peripheral and central chemoreception. Int J Biochem Cell Biol 2003; 35: 1413-1435. Lang JD Jr, Chumley P, Eiserich JP, Estevez A, Bamberg T, Adhami A, Crow J, Freeman BA. Am J Physiol Lung Cell Mol Physiol 2000; 279: 994-1002. Lang JD, Figueroa M, Sanders KD, Aslan M, Liu Y, Chumley P, Freeman BA. Hypercapnia via reduced rate and tidal volume contributes to lipopolysaccharide-induced lung injury. Am J Respir Crit Care Med 2005; 171: 147-157. Lawson C, Wolf S. ICAM-1 signaling in endothelial cells. Pharmacol Rep 2009; 61: 22-32. Lecuona E, Salidas F, Comellas A, Ridge K, Guerrero C, Sznajder JI. Ventilator-associated lung injury decreases ability to clear edema in rats. Am J Respir Crit Care Med 1999; 159: 603-609. Lecuona E, Trejo HE, Sznajder JI. Regulation of Na-K-ATpase during acut lung injury. J Bioenerg Biomemb 2007; 39: 391-395.
82
Lotze MT, Zeh HJ, Rubartello A, Sparvero LJ, Amoscato AA, Washburn NR, Devera ME, Liang X, Tör M, Billiar T. The grateful dead: damage-associated molecular and reduction/oxidation regulate immunity. Immunol Rev 2007; 220: 60-81. Love R, Choe E, Lippton H, Flint L, Steinberg S. Positive end-expiratory pressure decreases mesenteric blood flow despite normalization of cardiac output. J Trauma 1995; 39: 195-199. MacCarrick MJ, Torbati D, Kimura D, Raszynski A, Zeng W, Totapally BR. Does hypercapnia ameliorate hyperoxia-induced lung injury in neonatal rats? Lung 2010; 188: 235-240. Marini JJ. Evolving concepts in the ventilatory management of acute respiratory distress syndrome. Clin Chest Med 1996; 17: 555-575. Marini JJ, Hotchkiss JR, Broccard AF. Bench-to-bedside review: microvascular and airspace linkage in ventilator-induced lung injury. Crit Care 2003; 7: 435-444. Meduri GU, Kohler G, Headley S, Tolley E, Stentz F, Postlethwaite A. Inflammatory cytokines in the BAL of patients with ARDS. Persistent elevation over time predicts poor outcome. Chest 1995; 108: 1303-1314. Miyake M, Morishita M, Ito K, Ito A, Torii S, Sakamoto T. Production of granulomatous inflammation in lungs of rat pups and adults by sephadex beads. Pediatr Res 2004; 56: 205-211. Mohan MJ, Seaton T, Mitchell J, Howe A, Blackburn K, Burkhart W, Moyer M, Patel I, Waitt GM, Becherer JD, Moss ML, Milla ME. The tumor necrosis factor-alpha converting enzyme (TACE): a unique metalloproteinase with highly defined substrate selectivity. Biochemistry 2002; 41: 9462-9469. Nanji AM, Jokelainen K, Rahemtulla A, Miao L, Fogt F, Matsumoto H, Tahan SR, Su GL. Activation of nuclear factor kappa B and cytokine imbalance in experimental alcoholic liver disease in the rat. Hepatology 1999; 30: 934-943.
83
Nathens AB, Bitar R, Watson RWG Issekutz TB, Marshall JC, Dackiw APB, Rotstein OD. Thiol-mediated regulation of ICAM-1 expression in endotoxin0induced acute lung injury. J Immunol 1998; 160: 2959-2966. Nichol AD, O’Croinin DF, Howell K, Naughton F, O’Brien S, Boylan J, O’Connor C, O’Toole D, Laffey JG, McLoughlin P. Infection-induced lung injury is worsened after renal buffering of hypercapnic acidosis. Crit Care Med 2009; 37: 2953-2961. Nichol AD, O’Croinin DF, Naughton F, Hopkins N, Boylan J, McLoughlin P. Hypercapnic acidosis reduces oxidative reactions in endotoxin-induced lung injury. Anesthesiology 2010; 113: 116-125. Nicholson DW, Ali A, Thornberry NA, Vaillancourt JP, Ding CK, Gallant M, gareau Y, Griffin PR, Labelle M, Lazebnik YA, Munday NA, Raju SM, Smulson ME, Yamin TT, Yu VL, Miller DK. Identification and inhibition of the ICE/CED-3 protease necessary for mammalian apoptosis. Nature 1995; 376: 37-43. Nishimoto N, Kishimoto T. Interleukin 6: from bench to bedside. Nat Clin Pract Rheumatol 2006; 2: 619-626. Nomura F, Aoki M, Forbess JM, Mayer JE Jr. Effects of hypercarbic acidotic reperfusion on recovery of myocardial function after cardioplegic ischemia in neonatal lambs. Circulation 1994; 90: 321-327. O’Croinin DF, Nichol AD, Hopkins N, Boylan J, O’Brien S, O’Connor C, Laffey JG, McLoughlin P. Sustained hypercapnic acidosis during pulmonary infection increases bacterial load and worsens lung injury. Crit Care Med 2008; 36: 2128-2135. Oeckler RA, Hubmayr RD. Ventilator-associated lung injury: a search for better therapeutic targets. Eur Respir J 2007; 30: 1216-1226. Orfanos SE, Mavrommati I, Korovesi I, Roussos C. Pulmonary endotheliumin acute lung injury: from basic science to the critically ill. Intensive Care Med 2004; 30: 1702-1714. Papazian L, Forel JM, Gacouin A, Penot-Ragon C, Perrin G, Loundou A, Jaber S, Arnal JM, Perez D, Seghboyan JM, Constantin JM, Courant P, Lefrant JY, Guérin C, Prat G,
84
Morange S, Roch A. Neuromuscular blockers in early acute respiratory distress syndrome. N Engl J Med 2010; 363: 1107-1116. Parker JC, hernandez LA, Peevy KJ. Mechanisms of ventilator-induced lung injury. Crit Care Med 1993; 21: 131-143. Pedoto A, Caruso JE, Nandi J, Oler A, Hoffmann SP, Tassiopoulos AK, McGraw DJ, Camporesi EM, Hakim TS. Acidosis stimulates nitric oxide production and lung damage in rats. Am J Respir Crit Care Med 1999; 159: 397-402. Peltekova V, Engelberts D, Otulakowski G, Uematsu S, Post M, Kavanagh BP. Hypercapnic acidosis in ventilator-induced lung injury. Intensive Care Med 2010; 36: 869-878. Petrucci N, Lacovelli W. Ventilation with lower tidal volumes versus traditional tidal volumes in adults for acute lung injury and acute respiratory distress syndrome. Cochrane Database Syst Rev 2004; 2: 1469-1493. Pinhu L, Whitehead T, Evans T, Griffiths M. Ventilator-associated lung injury. Lancet 2003; 361: 332-340. Plötz FB, Slutsky AS, Van Vught AJ, Heijnen CJ. Ventilator-induced lung injury and multiple organ failure: a critical review of facts and hypotheses. Intensive Care Med 2004; 30: 1865-1872. Pradines-Figueres A, Raetz CRH. Processing and secretion of tumor-necrosis factor in endotoxin-treated mono mac 6 cells are dependent on phorbol myristate acetate. J Biol Chem 267: 23261-23268. Putensen C, Mutz NJ, Putensen-Himmer G, Zinserling J. Spontaneous breathing during ventilatory support improves ventilation-perfusion distributions in patients with acute respiratory distress syndrome. Am J Respir Crit Care Med 1999; 159: 1241-1248. Ranieri VM, Suter PM, Tortorella C, De Tullio R, Dayer JM, Brienza A, Bruno F, Slutsky AS. Effect of mechanical ventilation on inflammatory mediators in patients with acute respiratory distress syndrome. JAMA 1999; 282: 54-61.
85

Reutershan J, Ley K. Bench-to-bedside review: acute respiratory distress syndrome- how neutrophils migrate into the lung. Crit Care 2004; 8: 453-461. Rubenfeld GD, Caldwell E, Peabody E, Weaver J, Martin DP, Neff M, Stern EJ, Hudson LD. Incidence and outcomes of acute lung injury. N Engl J Med 2005; 353: 1685-1693. Savel RH, Yao EC, Gropper MA. Protective effects of low tidal volume ventilation in a rabbit model of Pseudomonas aeruginosa-induced acute lung injury. Crit Care Med 2001; 29: 392-398. Shanley TP, Schmal H, Friedl HP, Jones ML, Ward PA. Role of macrophage inflammatory protein-1 alpha (MIP-1 alpha) in acute lung injury in rats. J Immunol 1995; 154: 4793-4802. Shibata K, Cregg N, Engelberts D, Takeuchi A, Fedorko L, Kavanagh BP. Hpercapnic acidosis may attenuate acute lung injury by inhibition of endogenous xanthine oxidase. Am J Respir Crit Care Med 1998; 158: 1578-1584. Shokawa T, Yoshizumi M, Yamamoto H, Omura S, Toyofuku M, Shimizu Y, Imazu M, Kohno N. Induction of heme oxygenase-1 inhiits monocyte chemoattractant protein-1 mRNA expression in U937 cells. J Pharmacol Sci 2006; 100: 162-166. Sinclair SE, Kregenow DA, Lamm WJ, Starr IR, Chi EY, Hlastala MP. Hypercapnic acidosis is protective in an in vivo model of ventilator-induced lung injury. Am J Respir Crit Care Med 2002; 166: 403-408. Slutsky AS, Tremblay LN. Multiple system organ failure. Is mechanical ventilation a contributing factor? Am J Respir Crit Care Med 1998; 157: 1721-1751. Takeshita K, Suzuki Y, Nishio K, Takeuchi O, Toda K, Kudo H, Miyao N, Ishii M, sato N, Naoki K, Aoki T, Suzuki K, Hiraoka R, Yamaguchi K. Hypercapnic acidosis attenuates endotoxin-induced nuclear factor-[kappa]B activation. Am J Respir Cell Mol Biol 2003; 29: 124-132.
86
Tanabe O, Akira S, Kamiya T, Wong GG, Hirano T, Kishimoto T. Genomic structure of the murine IL-6: high degree conservation of potential regulatory sequences between mouse and human. J Immunol 1988; 141: 3875-3881. Task Force on Guidelines, Society of Critical Care Medicine: Guidelines for standards of care for patients with acute respiratory failure on mechanical ventilatory support. Crit Care Med 1991; 19: 275-278. Tateda K, Deng JC, Moore TA, Newstead MW, Paine III R, Kobayashi N, Yamaguchi K, Standiford TJ. Hypoxia mediates acute lung injury and increased lethality in murine legionella pneumonia: the role of apoptosis. J Immunol 2003; 170: 4209-4216. Thomsen GE, Morris AH. Incidence of the adult respiratory distress syndrome in the state of Utah. Am J Respir Crit Care Med 1995; 152: 965-971. Tremblay L, Valenza F, Ribeiro SP, Slutsky AS. Injurious ventilatory strategies increase cytokines and c-fos m-RNA expression in an isolated rat lung model. J Clin Invest 1997; 99: 944-952. Tremblay LN, Slutsky AS. Ventilator-induced lung injury: from the bench to the bedside. Appl Physiol Intensive Care Med 2006; 3: 357-366. Tutor JD, Mason CM, Dobard E, Beckerman RC, Summer WR, Nelson S. Loss of compartmentalization of alveolar tumor necrosis factor after lung injury. Am J Respir Crit Care Med 1994; 149: 1107-1111. Vannucci RC, Towfighi J, Heitjan DF, Brucklacher RM. Carbon dioxide protects the perinatal brain from hypoxic-ischemic damage: an experimental study in the immature rat. Pediatrics 1995; 95: 868-874. Veldhuizen RA, Slutsky AS, Joseph M, McCaig L. Effects of mechanical ventilation of isolated mouse lungs on surfactant and inflammatory cytokines. Eur Respir J 2001; 17: 488-494.
87

Venkataraman R, Kellum JA, Song M, Fink MP. Resuscitation with ringer’s ethyl pyruvate solution prolongs survival and modulates plasma cytokine and nitrite-nitrate concentrations in a rat model of lipopolysaccharide-induced shock. Shock 2002; 18: 507-512. Wang P, Wu P, Anthes JC, Siegel MI, Egan RW, Billah MM. Interleukin-10 inhibits interleukin-8 production in human neutrophils. Blood 1994; 83: 2678-2683. Wang P, Wu P, Siegel MI, Egan RW, Billah MM. Interleukin (IL)-10 inhibits nuclear factor kappa B (NF kappa B) activation in human monocytes. IL-10 and IL-4 suppress cytokine synthesis by different mechanisms. J Biol Chem 1995; 270: 9558-9563. Ware LB, Matthay MA. The acute respiratory distress syndrome. N Engl J Med 2000; 342: 1334-1349. Ware LB, Matthay MA. Alveolar fluid clearance is impaired in the majority of patients with acute lung injury and the acute respiratory distress syndrome. Am J Respir Crit Care Med 2001; 163: 1376-1383. West JB, Tsukimoto K, Mathiu-Costello O, Prediletto R. Stress failure in pulmonary capillaries. J Appl Physiol 1991; 70: 1731-1742. Wilson MR, Choudhury S, Goddard ME, O’Dea KP, Nicholson AG, Takata M. High tidal volume upregulates intrapulmonary cytokines in an in vivo mouse model of ventilator-induced lung injury. J Appl Physiol 2003; 95: 1385-1393. Wolthuis EK, Vlaar APJ, Choi G, Roelofs JJTH, Juffermans NP, Schultz MJ. Mechanical ventilation using non-injurious ventilation settings causes lung injury in the absence of pre-existing lung injury in healthy mice. Crit Care 2009; 13 Xu L, Glassford AJ, Giaccia AJ, Giffard RG. Acidosis reduces neuronal apoptosis. Neuroreport 1998; 9: 875-879. Yanagisawa R, Takano H, Inoue K, Ichinose T, Sadakane K, Yoshino S, Yamaki K, Kumagai K, Uchiyama K, Yoshikawa T, Morita M. Enhancement of acute lung injury related to bacterial endotoxin by components of diesel exhaust particles. Thorax 2003; 58: 605-612.
88
Yang BM, Demaine AG, Kingsnorth A. Chemokines MCP-1 and RANTES in isolated rat pancreatic acinar cells treated with CCK and ethanol in vitro. Pancreas 2000; 21: 22-31. Yang L, Froio RM, Sciuto TE, Dvorak AM, Alon R, Luscinskas FW. ICAM-1 regulates neutrophil adhesion and transcellular migration of TNF-alpha-activated vascular endothelium under flow. Blood 2005; 106: 584-592. Yang SR, Wright J, Bauter M, Seweryniak K, Kode A, Rahman I. Sirtuin regulates cigarette smoke-induced proinflammatory mediator release via RelA/p65 NF- B in macrophages in vitro and in rat lungs in vivo: implications for chronic inflammation and aging. Am J Physiol Lung Cell Mol Physiol 2007; 292: L567-L576.
89
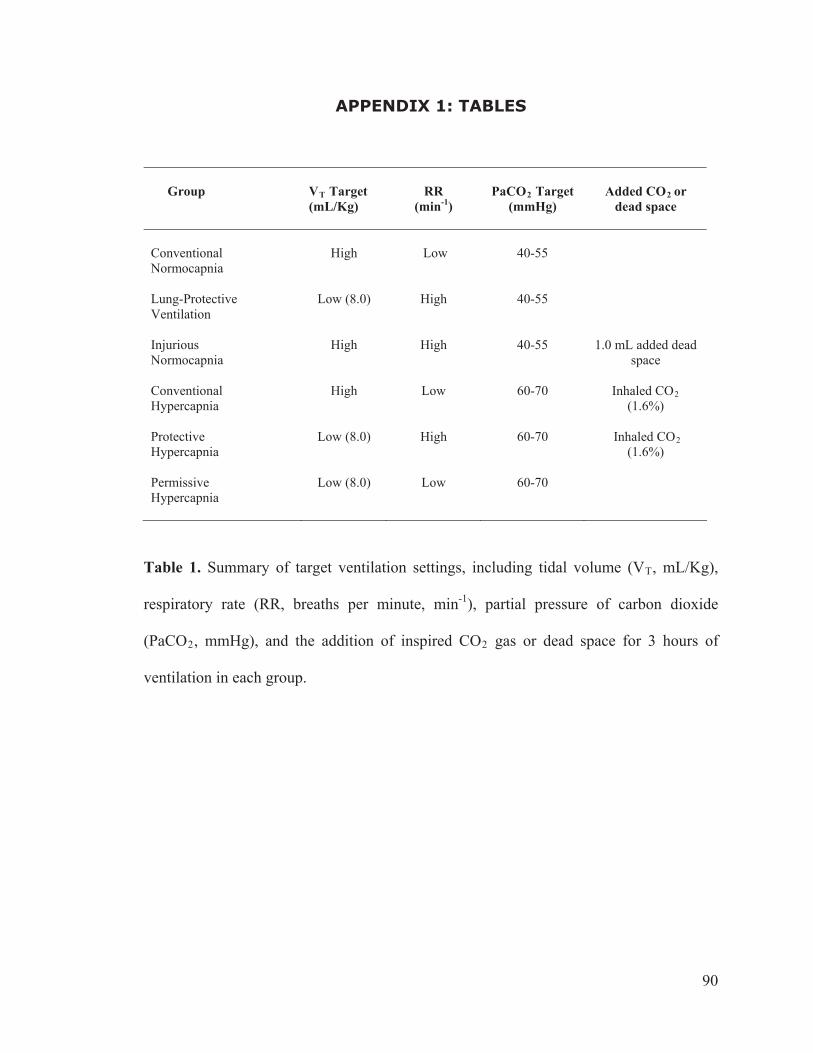
APPENDIX 1: TABLES
Group VT Target (mL/Kg)
RR(min-1)
PaCO2 Target (mmHg)
Added CO2 or dead space
Conventional Normocapnia
High
Low
40-55
Lung-Protective Ventilation
Low (8.0)
High
40-55
Injurious Normocapnia Conventional Hypercapnia
High
High
High
Low
40-55
60-70
1.0 mL added dead space
Inhaled CO2
(1.6%) Protective Hypercapnia Permissive Hypercapnia
Low (8.0)
Low (8.0)
High
Low
60-70
60-70
Inhaled CO2
(1.6%)
Table 1. Summary of target ventilation settings, including tidal volume (VT, mL/Kg),
respiratory rate (RR, breaths per minute, min-1), partial pressure of carbon dioxide
(PaCO2, mmHg), and the addition of inspired CO2 gas or dead space for 3 hours of
ventilation in each group.
90
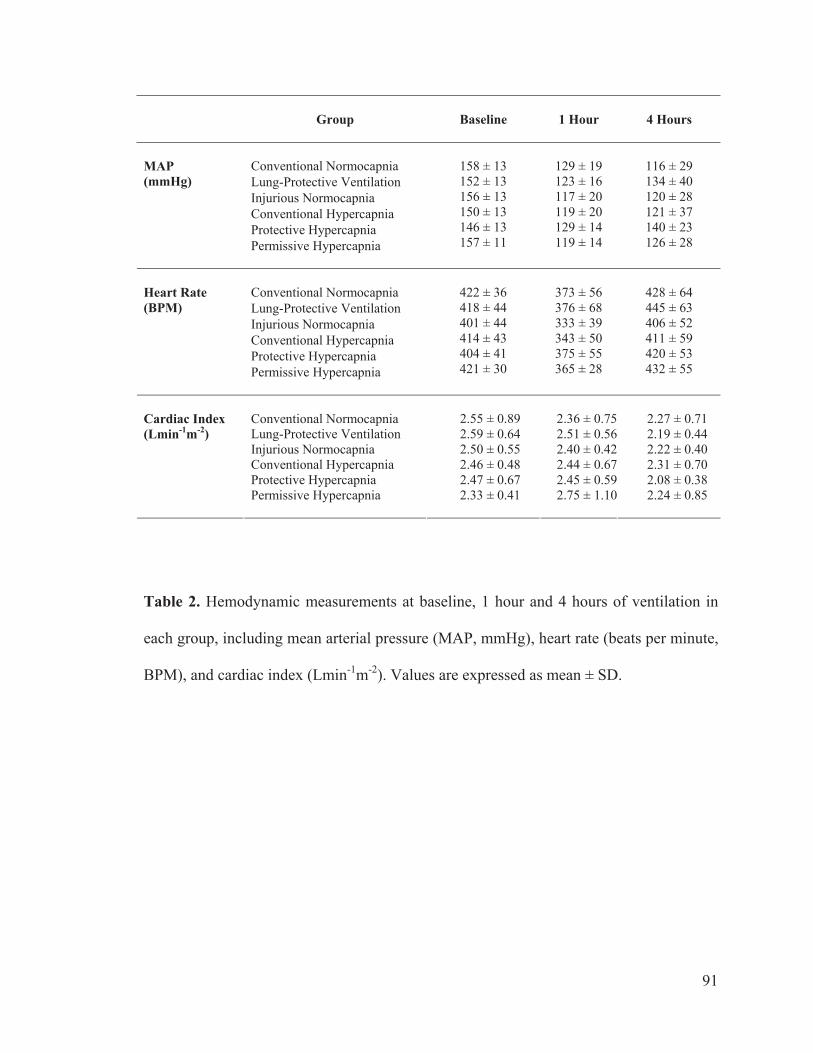
Group Baseline 1 Hour 4 Hours
Conventional Normocapnia Lung-Protective Ventilation Injurious Normocapnia Conventional Hypercapnia Protective Hypercapnia
MAP (mmHg)
Permissive Hypercapnia
158 ± 13 152 ± 13 156 ± 13 150 ± 13 146 ± 13 157 ± 11
129 ± 19 123 ± 16 117 ± 20 119 ± 20 129 ± 14 119 ± 14
116 ± 29 134 ± 40 120 ± 28 121 ± 37 140 ± 23 126 ± 28
Conventional Normocapnia Lung-Protective Ventilation Injurious Normocapnia Conventional Hypercapnia Protective Hypercapnia
Heart Rate (BPM)
Permissive Hypercapnia
422 ± 36 418 ± 44 401 ± 44 414 ± 43 404 ± 41 421 ± 30
373 ± 56 376 ± 68 333 ± 39 343 ± 50 375 ± 55 365 ± 28
428 ± 64 445 ± 63 406 ± 52 411 ± 59 420 ± 53 432 ± 55
Conventional Normocapnia Lung-Protective Ventilation Injurious Normocapnia Conventional Hypercapnia Protective Hypercapnia
Cardiac Index (Lmin-1m-2)
Permissive Hypercapnia
2.55 ± 0.89 2.59 ± 0.64 2.50 ± 0.55 2.46 ± 0.48 2.47 ± 0.67 2.33 ± 0.41
2.36 ± 0.752.51 ± 0.562.40 ± 0.422.44 ± 0.672.45 ± 0.592.75 ± 1.10
2.27 ± 0.71 2.19 ± 0.44 2.22 ± 0.40 2.31 ± 0.70 2.08 ± 0.38 2.24 ± 0.85
Table 2. Hemodynamic measurements at baseline, 1 hour and 4 hours of ventilation in
each group, including mean arterial pressure (MAP, mmHg), heart rate (beats per minute,
BPM), and cardiac index (Lmin-1m-2). Values are expressed as mean ± SD.
91

Table 3. Respiratory mechanics measurements at baseline, 1 hour and 4 hours of
ventilation in each group, including tidal volume (VT, mL/Kg), respiratory rate (RR,
breaths per minute, min-1), minute ventilation (VE, mL/min) and elastance (cmH2O/L).
Values are expressed as mean ± SD.
* p<0.0001 vs. baseline § p<0.0001 vs. low VT groups (Lung-Protective Ventilation, Protective Hypercapnia, Permissive Hypercapnia) at 4 hours
# p<0.01 vs. Conventional Hypercapnia at 4 hours
@ p<0.0001 vs. low RR groups (Conventional Normocapnia, Conventional Hypercapnia, Permissive Hypercapnia) at 4 hours
¶ p<0.001 vs. Conventional Normocapnia, Conventional Hypercapnia, Protective Hypercapnia and Permissive Hypercapnia at 4 hours
92

Group Baseline 1 Hour 4 Hours
Conventional Normocapnia Lung-Protective Ventilation Injurious Normocapnia Conventional Hypercapnia Protective Hypercapnia
VT(mL/Kg)
Permissive Hypercapnia
8.3 ± 0.7 8.3 ± 0.8 7.9 ± 0.7 8.4 ± 0.9 8.3 ± 0.5 8.3 ± 0.6
8.2 ± 0.6 8.1 ± 0.7 8.6 ± 1.0 8.5 ± 0.6 8.9 ± 1.4 8.3 ± 0.7
13.4 ± 1.2 *§#
8.4 ± 1.4
12.3 ± 1.4 *§ 10.9 ± 1.7 *§ 7.8 ± 0.7 8.1 ± 1.3
Conventional Normocapnia Lung-Protective Ventilation Injurious Normocapnia Conventional Hypercapnia Protective Hypercapnia
RR (min-1)
Permissive Hypercapnia
69 ± 14 68 ± 13 72 ± 19 68 ± 16 68 ± 13 68 ± 11
69 ± 16 68 ± 13 72 ± 18 69 ± 18 68 ± 13 68 ± 13
42 ± 10 * 92 ± 14 *@ 72 ± 16 @ 42 ± 11 * 68 ± 19 @ 52 ± 26
Conventional Normocapnia Lung-Protective Ventilation Injurious Normocapnia Conventional Hypercapnia Protective Hypercapnia
VE(mL/min)
Permissive Hypercapnia
261 ± 61 256 ± 65 252 ± 67 258 ± 69 261 ± 58 253 ± 36
260 ± 76 252 ± 64 275 ± 75 267 ± 76 279 ± 73 256 ± 57
254 ± 56 347 ± 91 *¶
367 ± 104 *¶ 204 ± 68 245 ± 66 191 ± 107 *
Elastance(cmH2O/L)
Conventional Normocapnia Lung-Protective Ventilation Injurious Normocapnia Conventional Hypercapnia Protective Hypercapnia Permissive Hypercapnia
2.4 ± 0.4 2.5 ± 0.7 2.6 ± 0.5 2.6 ± 0.7 2.3 ± 0.5 2.4 ± 0.4
3.8 ± 0.7 * 4.2 ± 0.7 * 3.8 ± 0.8 * 4.3 ± 1.2 * 3.7 ± 0.7 * 4.1 ± 1.1 *
3.6 ± 1.0 * 4.5 ± 0.8 * 4.9 ± 2.3 * 3.9 ± 1.4 * 4.2 ± 0.8 * 4.8 ± 1.8 *
93
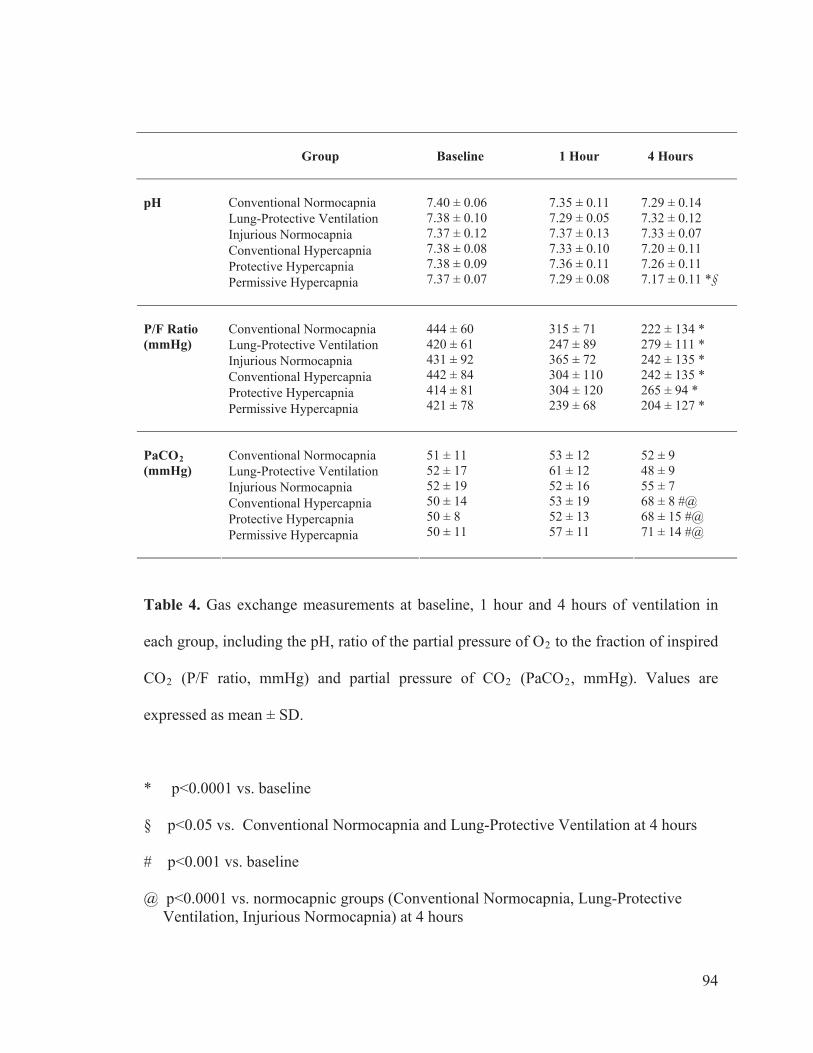
Group Baseline 1 Hour 4 Hours
Conventional Normocapnia Lung-Protective Ventilation Injurious Normocapnia Conventional Hypercapnia Protective Hypercapnia
pH
Permissive Hypercapnia
7.40 ± 0.06 7.38 ± 0.10 7.37 ± 0.12 7.38 ± 0.08 7.38 ± 0.09 7.37 ± 0.07
7.35 ± 0.11 7.29 ± 0.05 7.37 ± 0.13 7.33 ± 0.10 7.36 ± 0.11 7.29 ± 0.08
7.29 ± 0.14 7.32 ± 0.12 7.33 ± 0.07 7.20 ± 0.11 7.26 ± 0.11 7.17 ± 0.11 *§
Conventional Normocapnia Lung-Protective Ventilation Injurious Normocapnia Conventional Hypercapnia Protective Hypercapnia
P/F Ratio (mmHg)
Permissive Hypercapnia
444 ± 60 420 ± 61 431 ± 92 442 ± 84 414 ± 81 421 ± 78
315 ± 71 247 ± 89 365 ± 72 304 ± 110 304 ± 120 239 ± 68
222 ± 134 * 279 ± 111 * 242 ± 135 * 242 ± 135 * 265 ± 94 * 204 ± 127 *
Conventional Normocapnia Lung-Protective Ventilation Injurious Normocapnia Conventional Hypercapnia Protective Hypercapnia
PaCO2(mmHg)
Permissive Hypercapnia
51 ± 11 52 ± 17 52 ± 19 50 ± 14 50 ± 8 50 ± 11
53 ± 12 61 ± 12 52 ± 16 53 ± 19 52 ± 13 57 ± 11
52 ± 9 48 ± 9 55 ± 7 68 ± 8 #@ 68 ± 15 #@ 71 ± 14 #@
Table 4. Gas exchange measurements at baseline, 1 hour and 4 hours of ventilation in
each group, including the pH, ratio of the partial pressure of O2 to the fraction of inspired
CO2 (P/F ratio, mmHg) and partial pressure of CO2 (PaCO2, mmHg). Values are
expressed as mean ± SD.
* p<0.0001 vs. baseline § p<0.05 vs. Conventional Normocapnia and Lung-Protective Ventilation at 4 hours # p<0.001 vs. baseline @ p<0.0001 vs. normocapnic groups (Conventional Normocapnia, Lung-Protective
Ventilation, Injurious Normocapnia) at 4 hours
94

APPENDIX 2: FIGURES
Alveolar Epithelial Cell Type II
Figure 1. Hypercapnic acidosis (HCA) develops when carbon dioxide (CO2)
accumulates in the cell and reduces intracellular pH. HCA inhibits the apoptotic activity
of alveolar epithelial cells by reducing caspase-3 activity (1), reduces free radical
production by inhibiting xanthine oxidase enzymatic activity (2), and decreases the
production of pro-inflammatory cytokines by inhibiting NF- B activity (3). OH-:
Hydroxide Radical; O2-: Superoxide Radical; TNF- : Tumor Necrosis-alpha; NF- B:
Nuclear Factor- appa B. Modified from Ismaiel and Henzler, Minerva Anesth 2011; 77:
723-733.
95

Figure 2. The experimental protocol entails the instrumental of rats (N=60), induction of
Acute Lung Injury (ALI) with hydrochloric acid (HCl) and allowing the injury to develop
over 1 hour of protective settings under controlled mechanical ventilation (CMV) and
respiratory paralysis. After establishment of ALI, animals were randomly assigned to six
groups (n=10 per group), ventilated for 3 hours, and samples were collected. Legend:
blue border: normocapnia (Partial Pressure of Arterial CO2, PaCO2 target= 40-55
mmHg); pink border: hypercapnia (PaCO2 target=60-70 mmHg); solid background:
conventional ventilation settings (high tidal volume, VT); blank background: protective
ventilation settings (VT target of 8 mL/Kg).
96
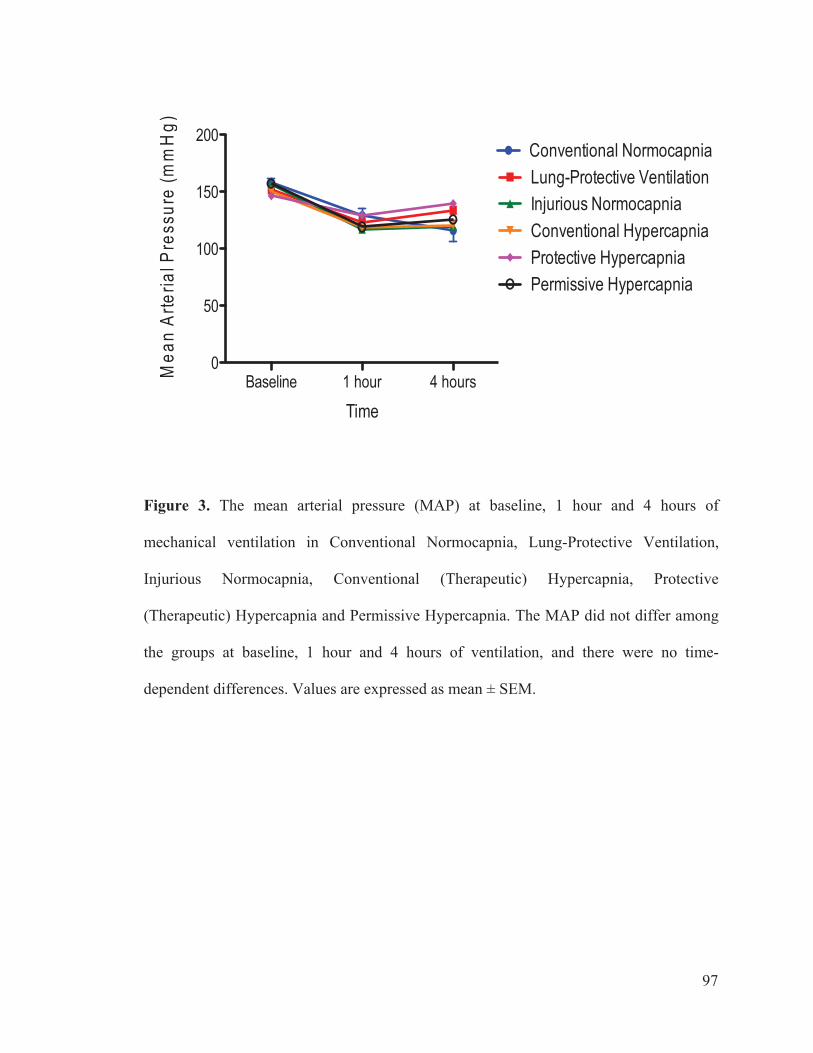
Baseline 1 hour 4 hours0
50
100
150
200Conventional NormocapniaLung-Protective VentilationInjurious NormocapniaConventional HypercapniaProtective HypercapniaPermissive Hypercapnia
Time
Mea
n Ar
teria
l Pre
ssur
e (m
mH
g)
Figure 3. The mean arterial pressure (MAP) at baseline, 1 hour and 4 hours of
mechanical ventilation in Conventional Normocapnia, Lung-Protective Ventilation,
Injurious Normocapnia, Conventional (Therapeutic) Hypercapnia, Protective
(Therapeutic) Hypercapnia and Permissive Hypercapnia. The MAP did not differ among
the groups at baseline, 1 hour and 4 hours of ventilation, and there were no time-
dependent differences. Values are expressed as mean ± SEM.
97

Baseline 1 hour 4 hours200
300
400
500Conventional NormocapniaLung-Protective VentilationInjurious NormocapniaConventional HypercapniaProtective HypercapniaPermissive Hypercapnia
Time
Hea
rt R
ate
(BPM
)
Figure 4. The heart rate (HR) at baseline, 1 hour and 4 hours of mechanical ventilation in
Conventional Normocapnia, Lung-Protective Ventilation, Injurious Normocapnia,
Conventional (Therapeutic) Hypercapnia, Protective (Therapeutic) Hypercapnia and
Permissive Hypercapnia. The HR did not differ among the groups at baseline, 1 hour and
4 hours of ventilation, and there were no time-dependent differences in HR. Values are
expressed as mean ± SEM.
98

Baseline 1 hour 4 hours1.5
2.0
2.5
3.0
3.5Conventional NormocapniaLung-Protective VentilationInjurious NormocapniaConventional HypercapniaProtective HypercapniaPermissive Hypercapnia
Time
Car
diac
Inde
x (L
min
-1m
-2)
Figure 5. The cardiac index (CI) at baseline, 1 hour and 4 hours of mechanical
ventilation in Conventional Normocapnia, Lung-Protective Ventilation, Injurious
Normocapnia, Conventional (Therapeutic) Hypercapnia, Protective (Therapeutic)
Hypercapnia and Permissive Hypercapnia. The CI did not differ among the groups at
baseline, 1 hour and 4 hours of ventilation, and there were no time-dependent differences.
Values are expressed as mean ± SEM.
99

Baseline 1 hour 4 hours0
5
10
15Conventional NormocapniaLung-Protective VentilationInjurious NormocapniaConventional HypercapniaProtective HypercapniaPermissive Hypercapnia
Time
Tida
l Vol
ume
(mL/
Kg) *
* *
§
§
§ #
Figure 6. The tidal volume (VT) at baseline, 1 hour and 4 hours of mechanical ventilation
in Conventional Normocapnia, Lung-Protective Ventilation, Injurious Normocapnia,
Conventional (Therapeutic) Hypercapnia, Protective (Therapeutic) Hypercapnia and
Permissive Hypercapnia. The CI did not differ among the groups at baseline and 1 hour
of ventilation. At 4 hours, VT was higher in Conventional Normocapnia, Injurious
Normocapnia and Conventional Hypercapnia compared to Lung-Protective Ventilation,
Protective Hypercapnia and Permissive Hypercapnia (§ p<0.0001). * p< 0.0001 vs.
baseline and 1 hour, # p<0.01 vs. Conventional Hypercapnia. Values are expressed as
mean ± SEM.
100

Baseline 1 hour 4 hours0
20
40
60
80
100
120Conventional NormocapniaLung-Protective VentilationInjurious NormocapniaConventional HypercapniaProtective HypercapniaPermissive Hypercapnia
Time
Res
pira
tory
Rat
e (m
in-1
)
* *
* @
@@
Figure 7. The respiratory rate (RR) at baseline, 1 hour and 4 hours of mechanical
ventilation in Conventional Normocapnia, Lung-Protective Ventilation, Injurious
Normocapnia, Conventional (Therapeutic) Hypercapnia, Protective (Therapeutic)
Hypercapnia and Permissive Hypercapnia. The RR did not differ among the groups at
baseline and 1 hour of ventilation. At 4 hours, RR was higher in Lung-Protective
Ventilation, Injurious Normocapnia and Protective Hypercapnia compared to
Conventional Normocapnia, Conventional Hypercapnia and Permissive Hypercapnia (@
p<0.0001). * p< 0.0001 vs. baseline and 1 hour. Values are expressed as mean ± SEM.
101
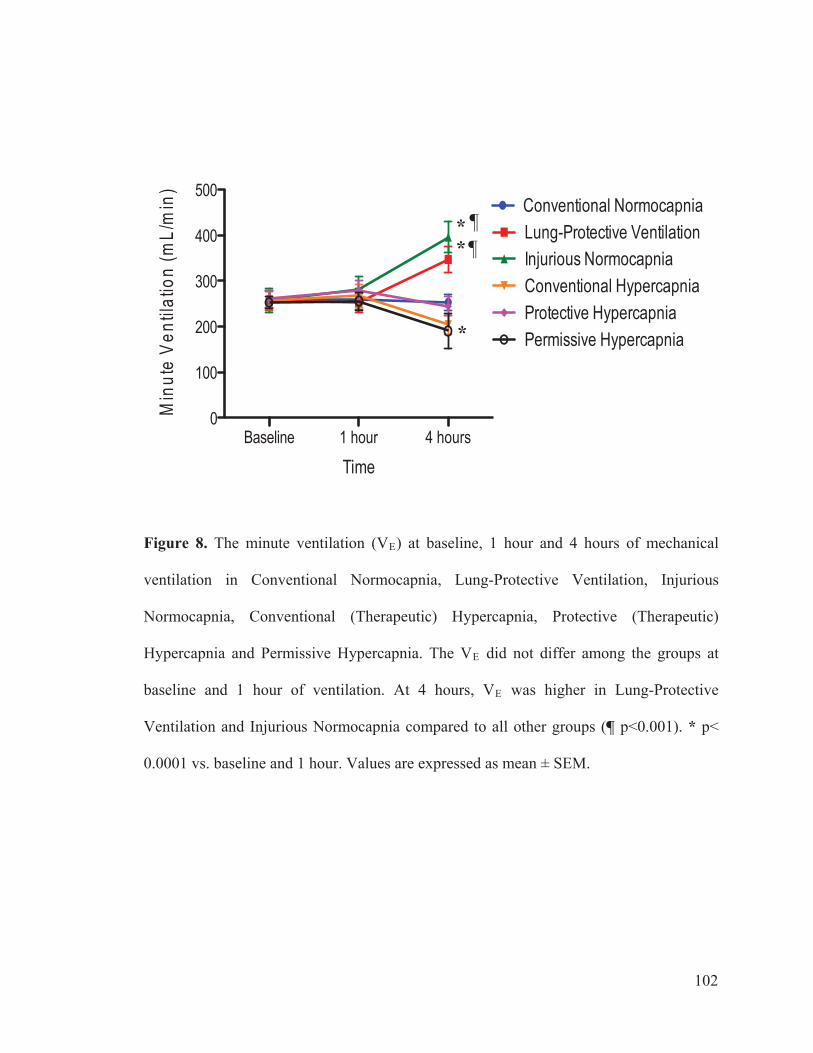
Baseline 1 hour 4 hours0
100
200
300
400
500Conventional NormocapniaLung-Protective VentilationInjurious NormocapniaConventional HypercapniaProtective HypercapniaPermissive Hypercapnia
Time
Min
ute
Vent
ilatio
n (m
L/m
in)
* *
*
¶ ¶
Figure 8. The minute ventilation (VE) at baseline, 1 hour and 4 hours of mechanical
ventilation in Conventional Normocapnia, Lung-Protective Ventilation, Injurious
Normocapnia, Conventional (Therapeutic) Hypercapnia, Protective (Therapeutic)
Hypercapnia and Permissive Hypercapnia. The VE did not differ among the groups at
baseline and 1 hour of ventilation. At 4 hours, VE was higher in Lung-Protective
Ventilation and Injurious Normocapnia compared to all other groups (¶ p<0.001). * p<
0.0001 vs. baseline and 1 hour. Values are expressed as mean ± SEM.
102
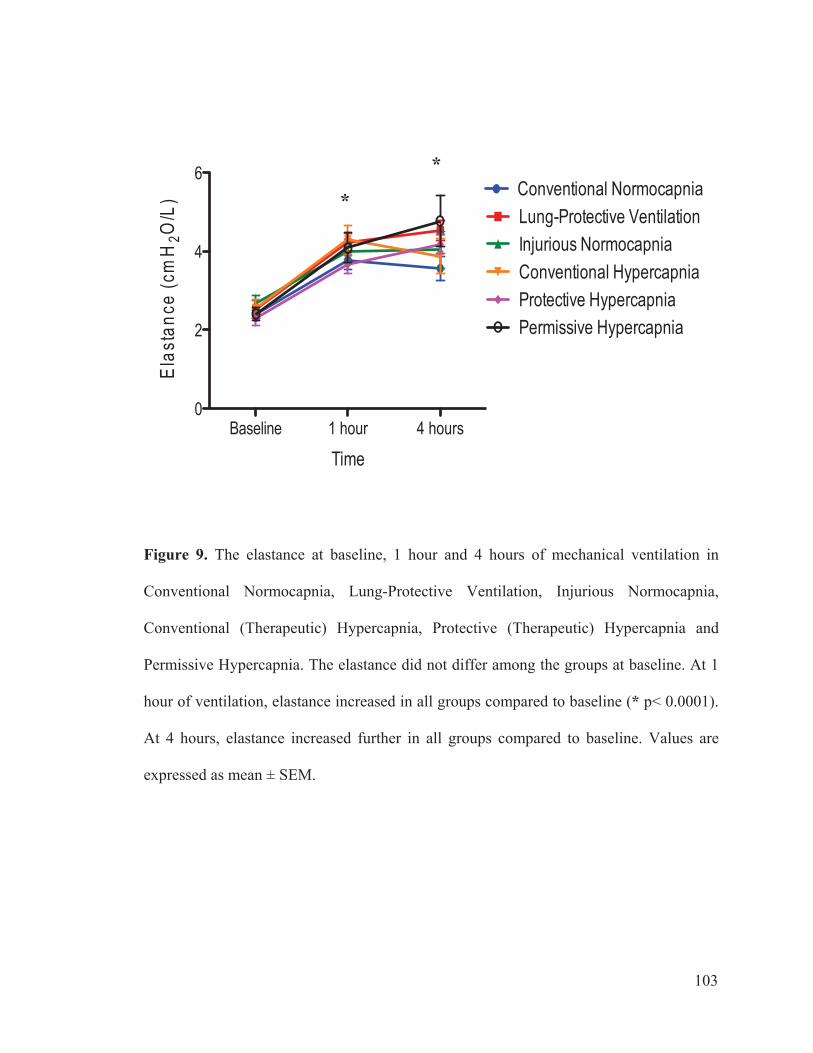
Baseline 1 hour 4 hours0
2
4
6Conventional NormocapniaLung-Protective VentilationInjurious NormocapniaConventional HypercapniaProtective HypercapniaPermissive Hypercapnia
Time
Elas
tanc
e (c
mH
2O/L
) *
*
Figure 9. The elastance at baseline, 1 hour and 4 hours of mechanical ventilation in
Conventional Normocapnia, Lung-Protective Ventilation, Injurious Normocapnia,
Conventional (Therapeutic) Hypercapnia, Protective (Therapeutic) Hypercapnia and
Permissive Hypercapnia. The elastance did not differ among the groups at baseline. At 1
hour of ventilation, elastance increased in all groups compared to baseline (* p< 0.0001).
At 4 hours, elastance increased further in all groups compared to baseline. Values are
expressed as mean ± SEM.
103
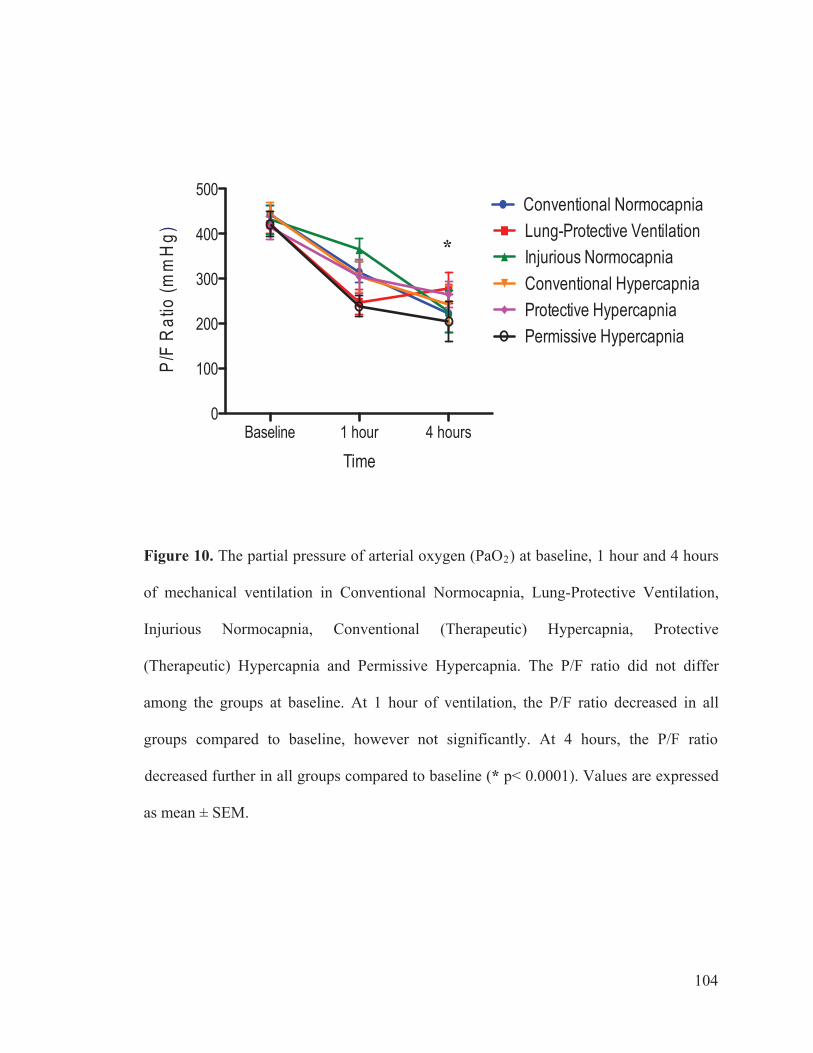
Baseline 1 hour 4 hours0
100
200
300
400
500Conventional NormocapniaLung-Protective VentilationInjurious NormocapniaConventional HypercapniaProtective HypercapniaPermissive Hypercapnia
Time
P/F
Rat
io(m
mH
g) *
Figure 10. The partial pressure of arterial oxygen (PaO2) at baseline, 1 hour and 4 hours
of mechanical ventilation in Conventional Normocapnia, Lung-Protective Ventilation,
Injurious Normocapnia, Conventional (Therapeutic) Hypercapnia, Protective
(Therapeutic) Hypercapnia and Permissive Hypercapnia. The P/F ratio did not differ
among the groups at baseline. At 1 hour of ventilation, the P/F ratio decreased in all
groups compared to baseline, however not significantly. At 4 hours, the P/F ratio
decreased further in all groups compared to baseline (* p< 0.0001). Values are expressed
as mean ± SEM.
104
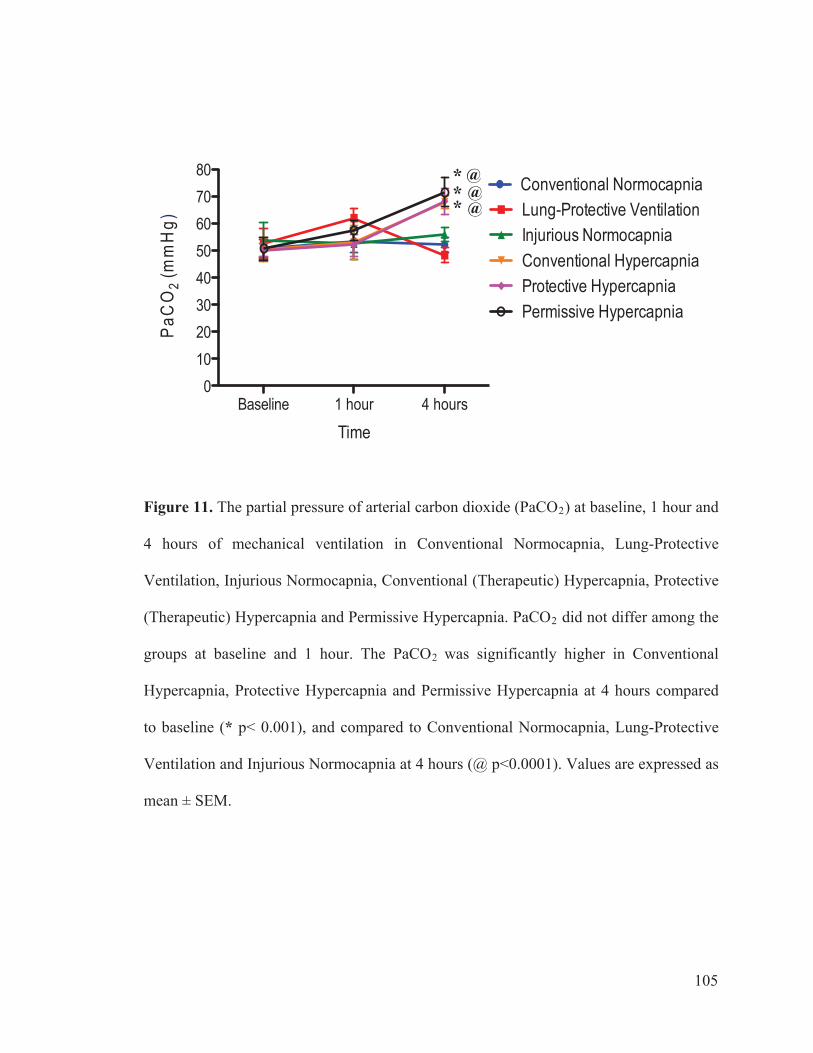
Baseline 1 hour 4 hours0
1020304050607080
Conventional NormocapniaLung-Protective VentilationInjurious NormocapniaConventional HypercapniaProtective HypercapniaPermissive Hypercapnia
Time
PaC
O2
(mm
Hg)
* *
*
@
@@
Figure 11. The partial pressure of arterial carbon dioxide (PaCO2) at baseline, 1 hour and
4 hours of mechanical ventilation in Conventional Normocapnia, Lung-Protective
Ventilation, Injurious Normocapnia, Conventional (Therapeutic) Hypercapnia, Protective
(Therapeutic) Hypercapnia and Permissive Hypercapnia. PaCO2 did not differ among the
groups at baseline and 1 hour. The PaCO2 was significantly higher in Conventional
Hypercapnia, Protective Hypercapnia and Permissive Hypercapnia at 4 hours compared
to baseline (* p< 0.001), and compared to Conventional Normocapnia, Lung-Protective
Ventilation and Injurious Normocapnia at 4 hours (@ p<0.0001). Values are expressed as
mean ± SEM.
105

Baseline 1 hour 4 hours6.8
6.9
7.0
7.1
7.2
7.3
7.4
7.5Conventional NormocapniaLung-Protective VentilationInjurious NormocapniaConventional HypercapniaProtective HypercapniaPermissive Hypercapnia
Time
pH
§ *
Figure 12. Arterial pH at baseline, 1 hour and 4 hours of mechanical ventilation in
Conventional Normocapnia, Lung-Protective Ventilation, Injurious Normocapnia,
Conventional (Therapeutic) Hypercapnia, Protective (Therapeutic) Hypercapnia and
Permissive Hypercapnia. pH did not differ among the groups at baseline and 1 hour. At 4
hours, pH was significantly lower in Permissive Hypercapnia compared to Lung-
Protective Ventilation at 4 hours (§ p< 0.05), and compared to baseline pH in Permissive
Hypercapnia (* p<0.0001). Values are expressed as mean ± SEM.
106

Conve
ntion
al Norm
ocap
nia
Lung
-Prot
ectiv
e Ventila
tion
Injuri
ous Norm
ocap
nia
Conve
ntion
alHyp
ercap
nia
Protec
tive H
yperc
apnia
Permisi
sve Hyp
ercap
nia0
2
4
6
8
10
Group
Wet
/Dry
Lun
g R
atio
* * *
Figure 13. Postmortem Wet-to-Dry Lung Ratio was lower in Lung-Protective
Ventilation compared to Conventional Ventilation and Injurious Normocapnia. Protective
Hypercapnia produced a lower wet/dry lung ratio compared to Injurious Normocapnia (*
p<0.05). Legend: blue border: normocapnia (Partial Pressure of Arterial CO2, PaCO2
target= 40-55 mmHg); pink border: hypercapnia (PaCO2 target=60-70 mmHg); solid
bars: conventional ventilation settings (high tidal volume, VT); open bars: protective
ventilation settings (VT target of 8 mL/Kg). Values are expressed as mean ± SEM.
107

Figure 14. Diffuse Alveolar Damage (DAD) lung injury score was lower in Conventional
Injurious Normocapnia, Conventional Normocapnia and Lung-Protective Ventilation (*
p<0.05). Legend: blue border: normocapnia (Partial Pressure of Arterial CO2, PaCO2
target= 40-55 mmHg); pink border: hypercapnia (PaCO2 target=60-70 mmHg); solid
bars: conventional ventilation settings (high tidal volume, VT); open bars: protective
ventilation settings (VT target of 8 mL/Kg). Values are expressed as mean ± SEM.
Conve
ntion
al Norm
ocap
nia
Lung
-Prot
ectiv
e Ventila
tion
Injuri
ous N
ormoc
apnia
Conve
ntion
al Hyp
ercap
nia
Protec
tive H
yperc
apnia
Permiss
ive H
yperc
apnia
0.0
0.5
1.0
1.5
2.0
Group
Diff
use
Alve
olar
Dam
age
Scor
e
*
108

109
Figure 15. Diffuse Alveolar Damage (DAD) subscores: Interstitial edema, alveolar
edema, hyaline membranes, atelectasis, and alveolar damage. Legend: blue border:
normocapnia (Partial Pressure of Arterial CO2, PaCO2 target= 40-55 mmHg); pink
border: hypercapnia (PaCO2 target=60-70 mmHg); solid bars: conventional ventilation
settings (high tidal volume, VT); open bars: protective ventilation
settings (VT target of 8 mL/Kg). Values are expressed as mean ± SEM.
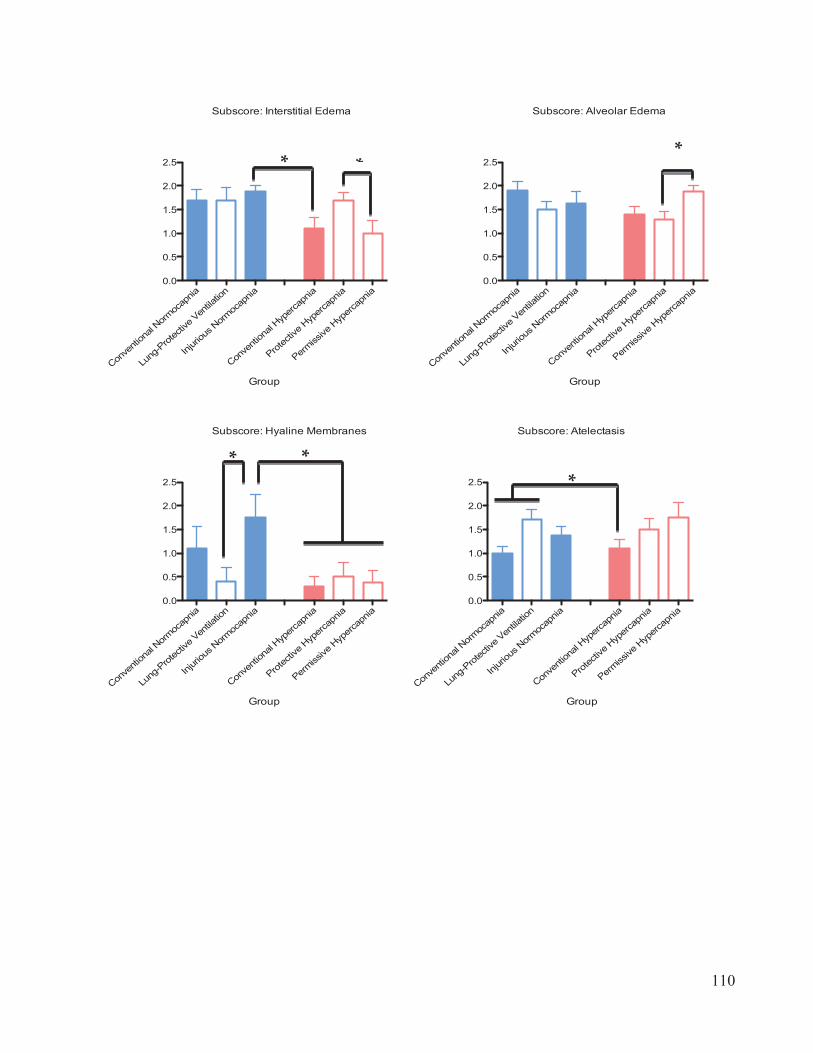
Conve
ntion
alNorm
ocap
nia
Lung
-Prot
ectiv
e Ventila
tion
Injuri
ous Norm
ocap
nia
Conve
ntion
alHyp
ercap
nia
Protec
tive Hyp
ercap
nia
Permiss
iveHyp
ercap
nia0.0
0.5
1.0
1.5
2.0
2.5
Group
Subscore: Alveolar Edema
*
Conve
ntion
alNorm
ocap
nia
Lung
-Prot
ectiv
e Ventila
tion
Injuri
ous Norm
ocap
nia
Conve
ntion
alHyp
ercap
nia
Protec
tive Hyp
ercap
nia
Permiss
iveHyp
ercap
nia0.0
0.5
1.0
1.5
2.0
2.5
Group
Subscore: Interstitial Edema
**
Conve
ntion
alNorm
ocap
nia
Lung
-Prot
ectiv
e Ventila
tion
Injuri
ous Norm
ocap
nia
Conve
ntion
alHyp
ercap
nia
Protec
tive Hyp
ercap
nia
Permiss
iveHyp
ercap
nia0.0
0.5
1.0
1.5
2.0
2.5
Group
Subscore: Hyaline Membranes
* *
Conve
ntion
alNorm
ocap
nia
Lung
-Prot
ectiv
e Ventila
tion
Injuri
ous Norm
ocap
nia
Conve
ntion
alHyp
ercap
nia
Protec
tive Hyp
ercap
nia
Permiss
iveHyp
ercap
nia0.0
0.5
1.0
1.5
2.0
2.5
Group
Subscore: Atelectasis
*
110
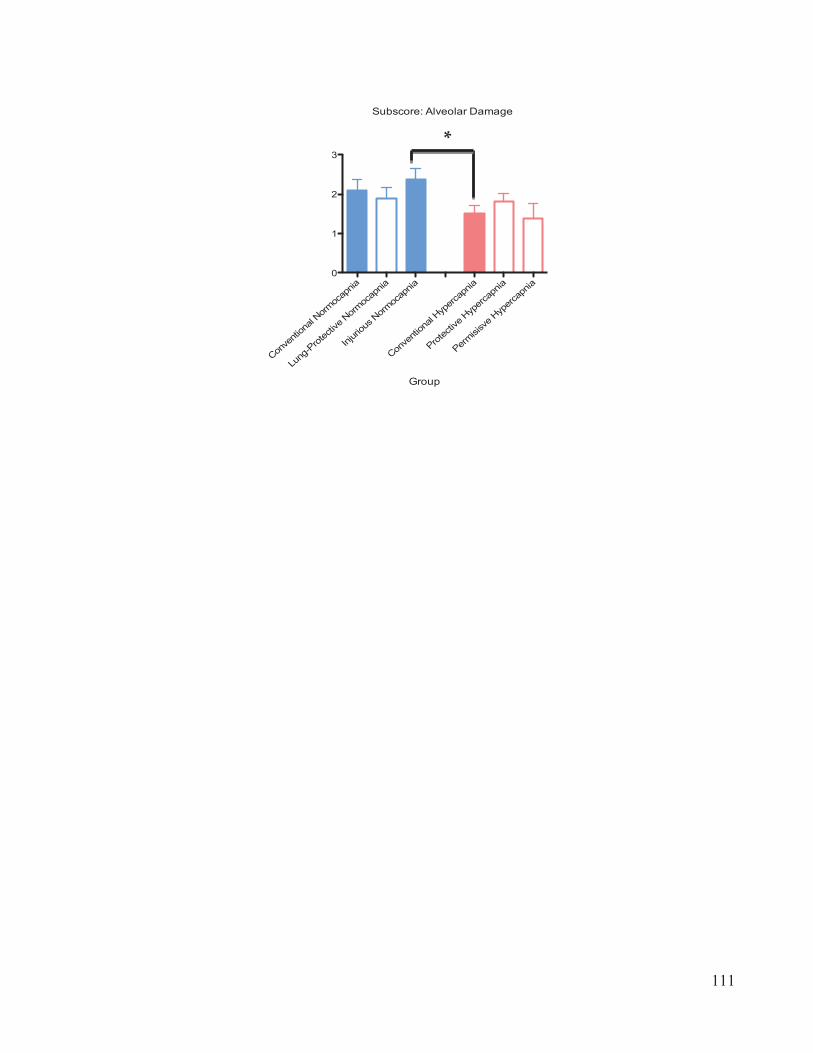
111
Conve
ntion
alNorm
ocap
nia
Lung
-Prot
ectiv
e Normoc
apnia
Injuri
ous Norm
ocap
nia
Conve
ntion
alHyp
ercap
nia
Protec
tive Hyp
ercap
nia
Permisi
sve Hyp
ercap
nia0
1
2
3
Group
Subscore: Alveolar Damage
*

112
Figure 16. Morphological changes in lung tissue stained with hematoxylin and eosin after 4
hours of ventilation, shown in 40X magnification. Lung tissues show the presence of
polymorphonuclear (PMN) cell infiltration (P), atelectasis (A), hyaline membranes (HM),
hemorrhages (H), and edema (E).
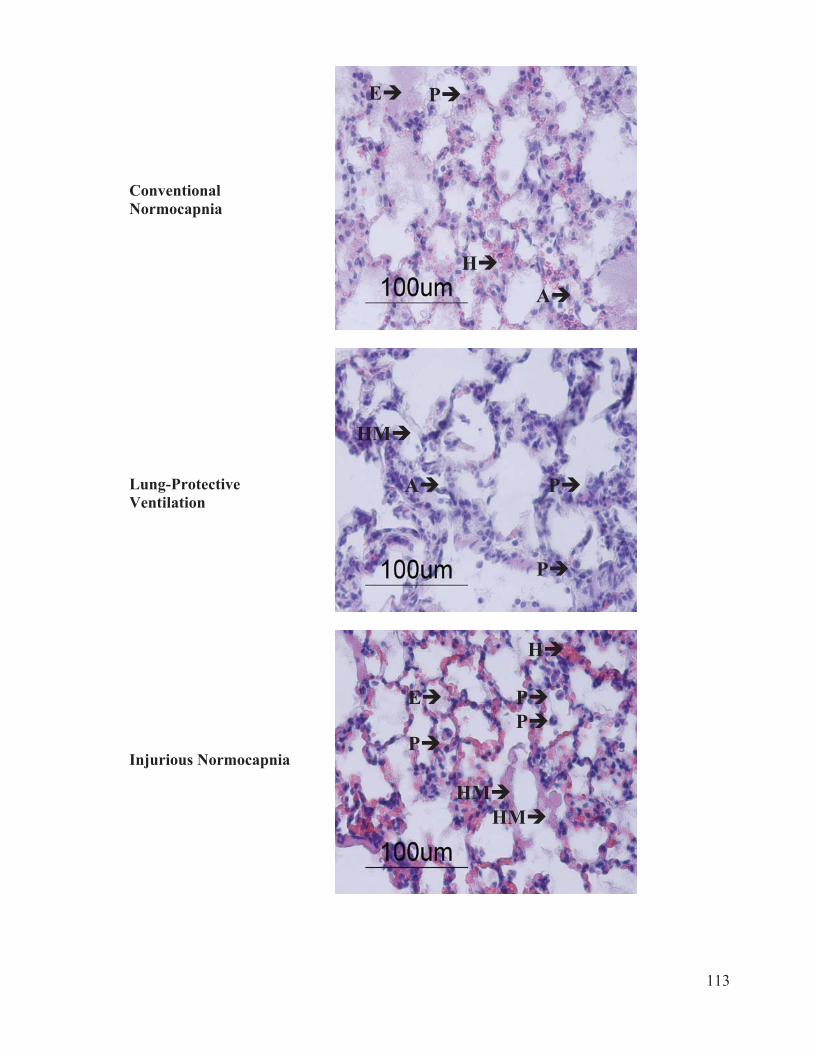
113
E P
ConventionalNormocapnia
HM
P
P
P
H
E
HM
HM
P A
P
A H
Lung-ProtectiveVentilation
Injurious Normocapnia
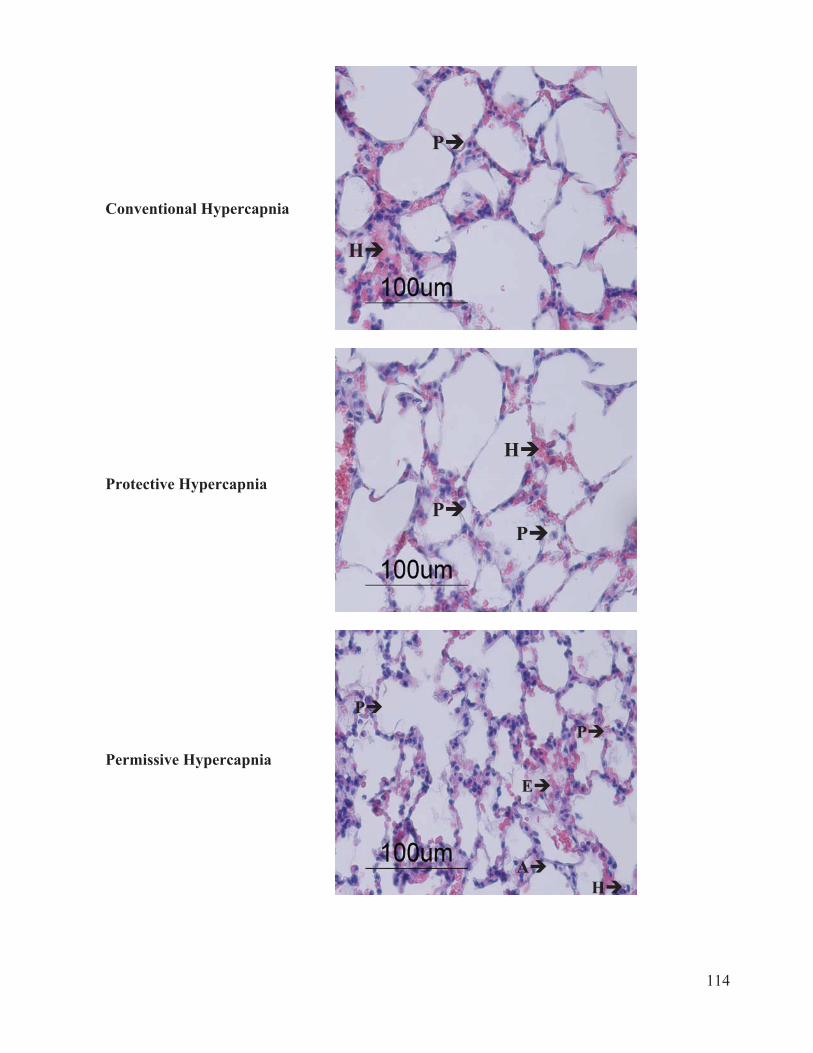
114
H
P
Conventional Hypercapnia
H
Protective Hypercapnia
P
P
P
P
Permissive Hypercapnia
E
H A
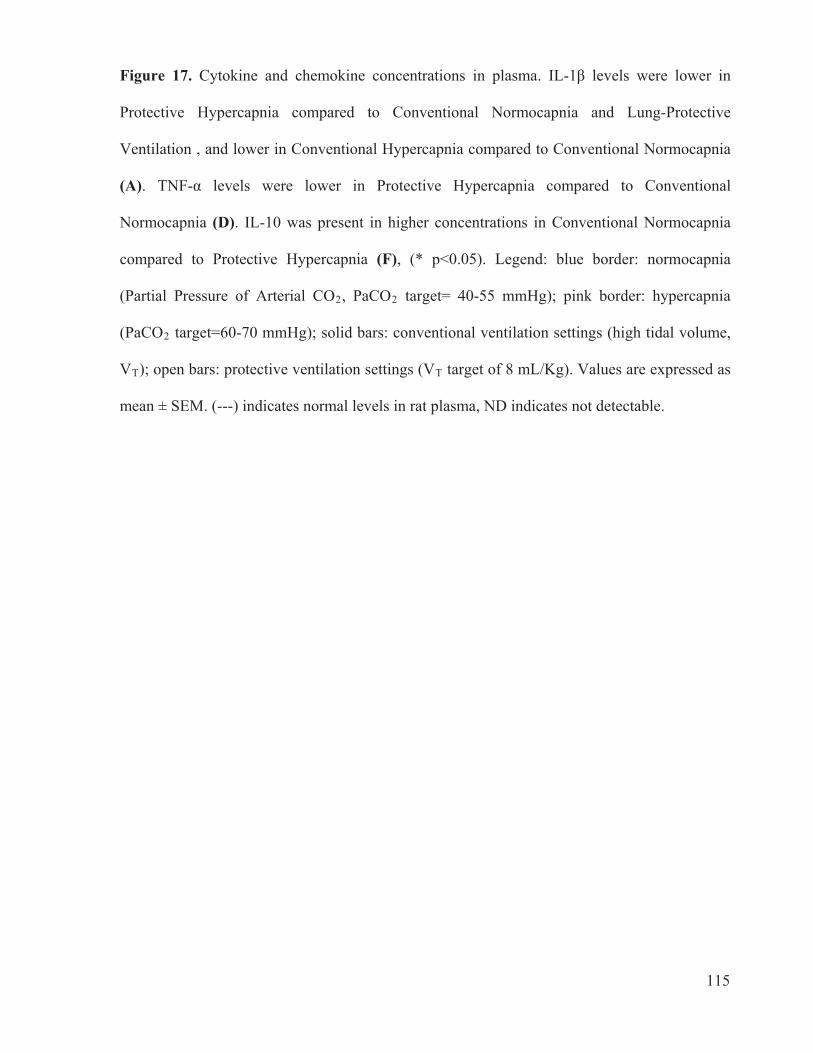
115
Figure 17. Cytokine and chemokine concentrations in plasma. IL-1 levels were lower in
Protective Hypercapnia compared to Conventional Normocapnia and Lung-Protective
Ventilation , and lower in Conventional Hypercapnia compared to Conventional Normocapnia
(A). TNF- levels were lower in Protective Hypercapnia compared to Conventional
Normocapnia (D). IL-10 was present in higher concentrations in Conventional Normocapnia
compared to Protective Hypercapnia (F), (* p<0.05). Legend: blue border: normocapnia
(Partial Pressure of Arterial CO2, PaCO2 target= 40-55 mmHg); pink border: hypercapnia
(PaCO2 target=60-70 mmHg); solid bars: conventional ventilation settings (high tidal volume,
VT); open bars: protective ventilation settings (VT target of 8 mL/Kg). Values are expressed as
mean ± SEM. (---) indicates normal levels in rat plasma, ND indicates not detectable.
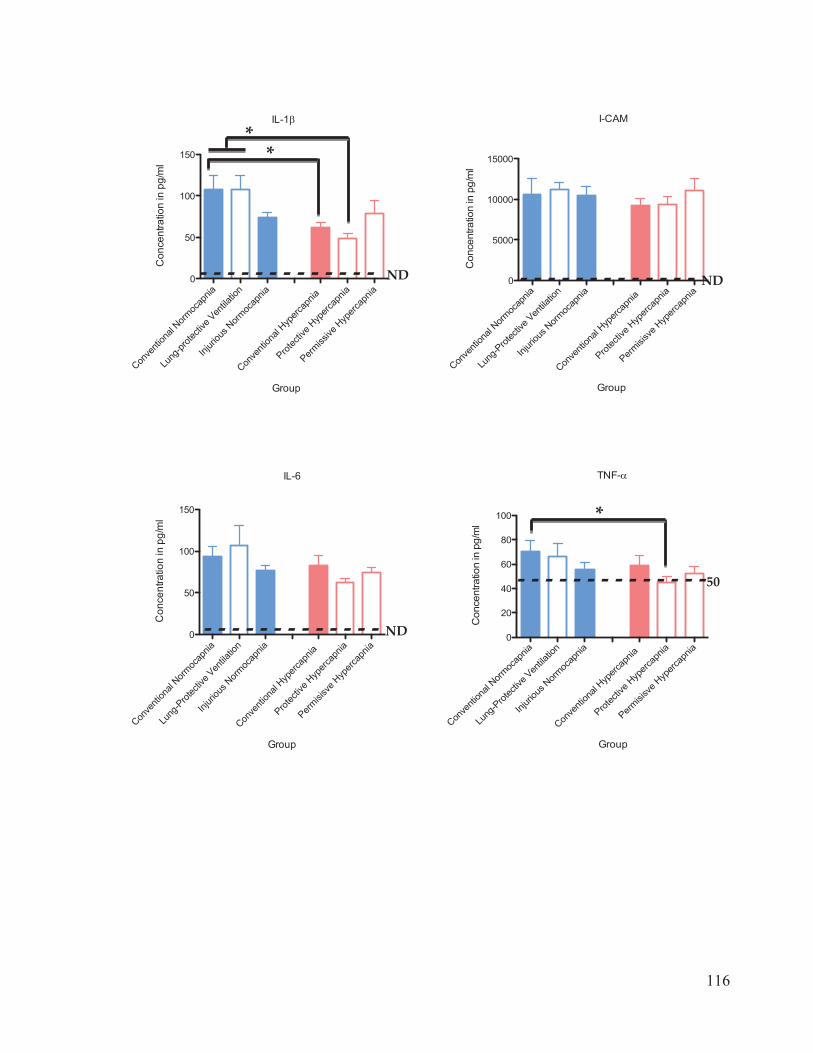
116
Conve
ntion
al Norm
ocap
nia
Lung
-Prot
ectiv
e Ventila
tion
Injuri
ous Norm
ocap
nia
Conve
ntion
al Hyp
ercap
nia
Protec
tive Hyp
ercap
nia
Permisi
sve Hyp
ercap
nia0
20
40
60
80
100
TNF-
Group
Con
cent
ratio
n in
pg/
ml
50
*
Conve
ntion
al Norm
ocap
n
Lung
-Prot
ectiv
e Ve
Injuri
ous No
ap
Conve
ntion
al Hyp
ercap
ni
Protec
tive H
yperc
ap
Permisi
sve H
yperc
apniaia
ntilat
ion
rmoc
nia a nia0
50
100
150
IL-6
Group
Con
cent
ratio
n in
pg/
ml
ND
Conve
ntion
alNorm
ocap
n
Lung
-Prot
ectiv
e Ven
tilat
Injuri
ous Norm
ocap
Conve
ntion
alHyp
ercap
n
Protec
tive Hyp
ercap
Permisi
sve Hyp
ercap
ia ion nia ia nia nia0
5000
10000
15000
I-CAM
Group
Con
cent
ratio
n in
pg/
ml
ND
Conve
ntion
al Norm
ocap
n
Lung
-prote
ctive
Ventila
tio
Injuri
ous N
ormoc
apni
Conve
ntion
al Hyp
ercap
nia
Protec
tive Hyp
ercap
nia
Permiss
ive H
yperc
apniaia n a
0
50
100
150
IL-1
Group
Con
cent
ratio
n in
pg/
ml
* *
ND
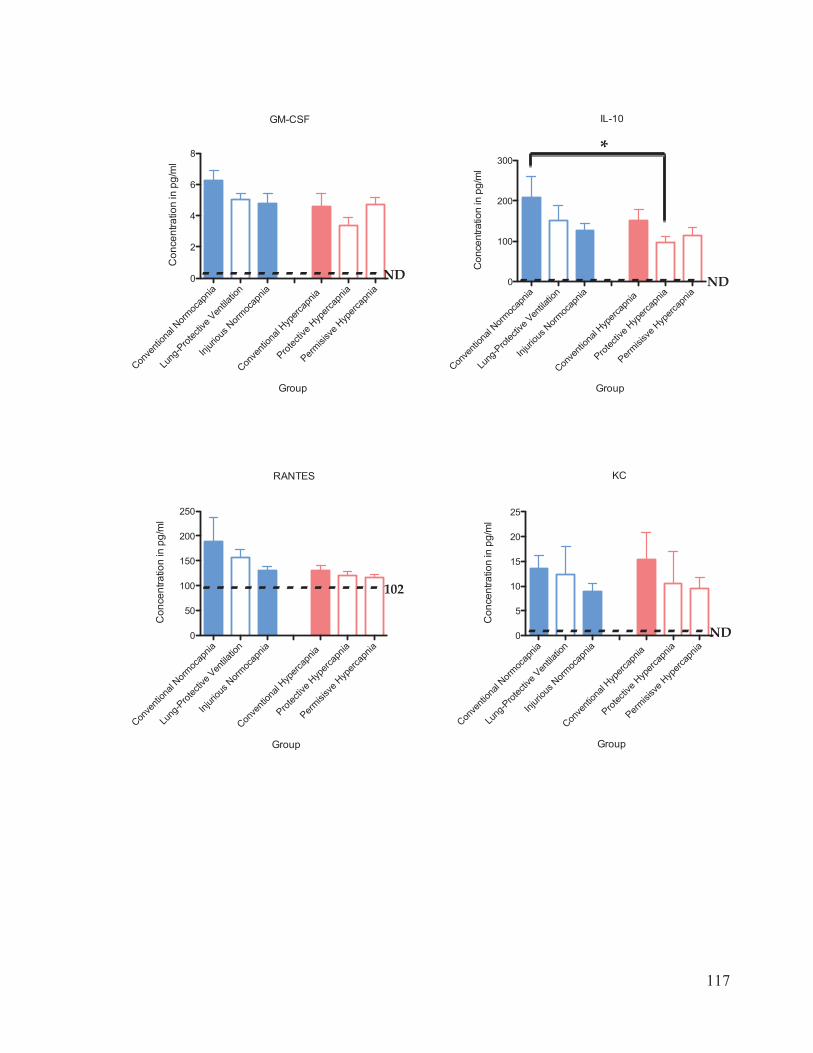
117
Conve
ntion
alNorm
ocap
Lung
-Prot
ectiv
e V
Injuri
ous N
ormoc
ap
Conve
ntion
alHyp
ercap
nia
Protec
tive Hyp
ercap
Permisi
sve Hyp
ercap
nia
entila
tion nia nia nia
0
100
200
300
IL-10
Group
Con
cent
ratio
n in
pg/
ml
D N
*
Conve
ntion
alNorm
ocap
ni
Lung
-Prot
ectiv
e Ven
tilatio
n
Injuri
ous N
ormoc
apn
Conve
ntion
alHyp
ercap
nia
Protec
tive Hyp
ercap
nia
Permisi
sve Hyp
ercap
niaa ia0
2
4
6
8
GM-CSF
Group
Con
cent
ratio
n in
pg/
ml
ND
Conve
ntion
alNorm
ocap
n
Lung
-Prot
ectiv
e Ventila
ti
Injuri
ous N
ormoc
apn
Conve
ntion
al Hyp
ercap
nia
Protec
tive Hyp
ercap
n
Permisi
sve H
yperc
apnia on ia ia ia
0
5
10
15
20
25
KC
Group
Con
cent
ratio
n in
pg/
ml
ND
Conve
ntion
alNorm
ocap
nia
Lung
-Prot
ectiv
e Ventila
tion
Injuri
ous Norm
ocap
nia
Conve
ntion
alHyp
ercap
nia
Protec
tive Hyp
ercap
nia
Permisi
sve Hyp
ercap
nia0
50
100
150
200
250
RANTES
Group
Con
cent
ratio
n in
pg/
ml
102

118
Conve
ntion
alNorm
ocap
Lung
-Prot
ectiv
e V
ti
Injuri
ous N
ormoc
apn
Conve
ntion
al Hyp
ercap
nia
Protec
tive H
yperc
apnia
Permisi
sve H
yperc
apnia
entila
on ia nia0
500
1000
1500
2000
MCP-1
Group
Con
cent
ratio
n in
pg/
ml
20
Conve
ntion
alNorm
ocap
nia
Lung
-Prot
ectiv
e Ven
tilatio
n
Injuri
ous Norm
ocap
nia
Conve
ntion
alHyp
ercap
nia
Protec
tive H
yperc
apnia
Permisi
sve Hyp
ercap
nia0
10
20
30
40
50
MIP-1
Group
Con
cent
ratio
n in
pg/
ml
5

119
detectable .
Figure 18. Cytokine and chemokine concentrations in bronchoalveolar lavage fluid (BALF).
IL-6 levels were lower in Conventional Hypercapnia compared to Conventional Normocapnia
and Injurious Normocapnia (C). IL-10 levels were higher in Permissive Hypercapnia compared
to Lung-Protective Ventilation (F). Monocyte Chemotactic Protein-1 (MCP-1) was lower in all
hypercapnia groups (pink) compared to all normocapnia groups (blue) (J) (* p<0.05). Legend:
blue border: normocapnia (Partial Pressure of Arterial CO2, PaCO2 target= 40-55 mmHg);
pink border: hypercapnia (PaCO2 target=60-70 mmHg); solid bars: conventional ventilation
settings (high tidal volume, VT); open bars: protective ventilation settings (VT target of 8
mL/Kg). Values are expressed as mean ± SEM. (---) indicates normal levels in BALF, ND
indicates not
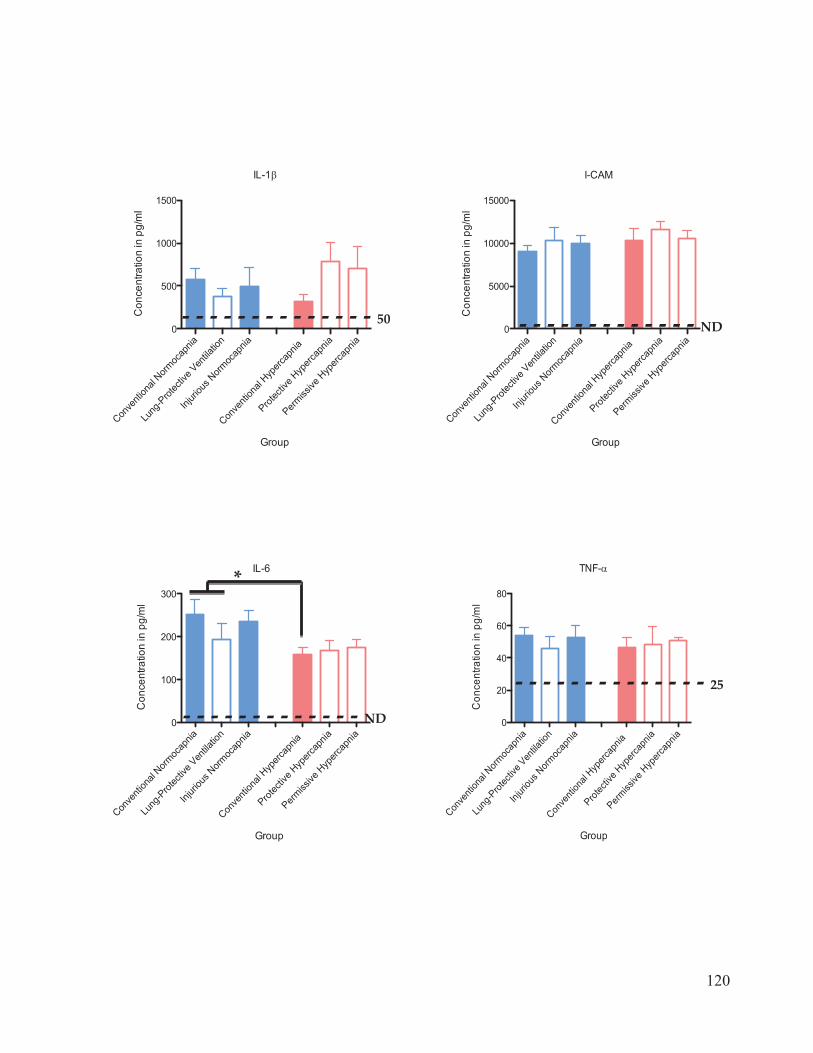
120
Conve
ntion
alNorm
ocap
nia
Lung
-Prot
ectiv
e Ventila
tion
Injuri
ous Norm
ocap
nia
Conve
ntion
alHyp
ercap
nia
Protec
tive Hyp
ercap
nia
Permiss
iveHyp
ercap
nia0
20
40
60
80
TNF-
Group
Con
cent
ratio
n in
pg/
ml
25
Conve
ntion
alNorm
oca
Lung
-Prot
ectiv
e Ven
tilatio
n
Injuri
ous N
ormoc
apnia
Conve
ntion
alHyp
ercap
nia
Protec
tive H
yperc
apnia
Permiss
ive H
yperc
apniapn
ia0
500
1000
1500
IL-1
Group
Con
cent
ratio
n in
pg/
ml
50
Conve
ntion
alNorm
ocap
n
Lung
-Prot
ectiv
e Ventila
tio
Injuri
ous Norm
ocap
n
Conve
ntion
alHyp
ercap
nia
Protec
tive Hyp
ercap
ni
Permiss
iveHyp
ercap
niia n ia a a0
5000
10000
15000
I-CAM
Group
Con
cent
ratio
n in
pg/
ml
ND
Conve
ntion
alNorm
ocap
n
Lung
-Prot
ectiv
e Ventila
tio
Injuri
ous Norm
ocap
n
Conve
ntion
alHyp
ercap
nia
Protec
tive H
yperc
apni
Permiss
ive H
yperc
apniaia n ia a
0
100
200
300
IL-6
Group
Con
cent
ratio
n in
pg/
ml
*
ND
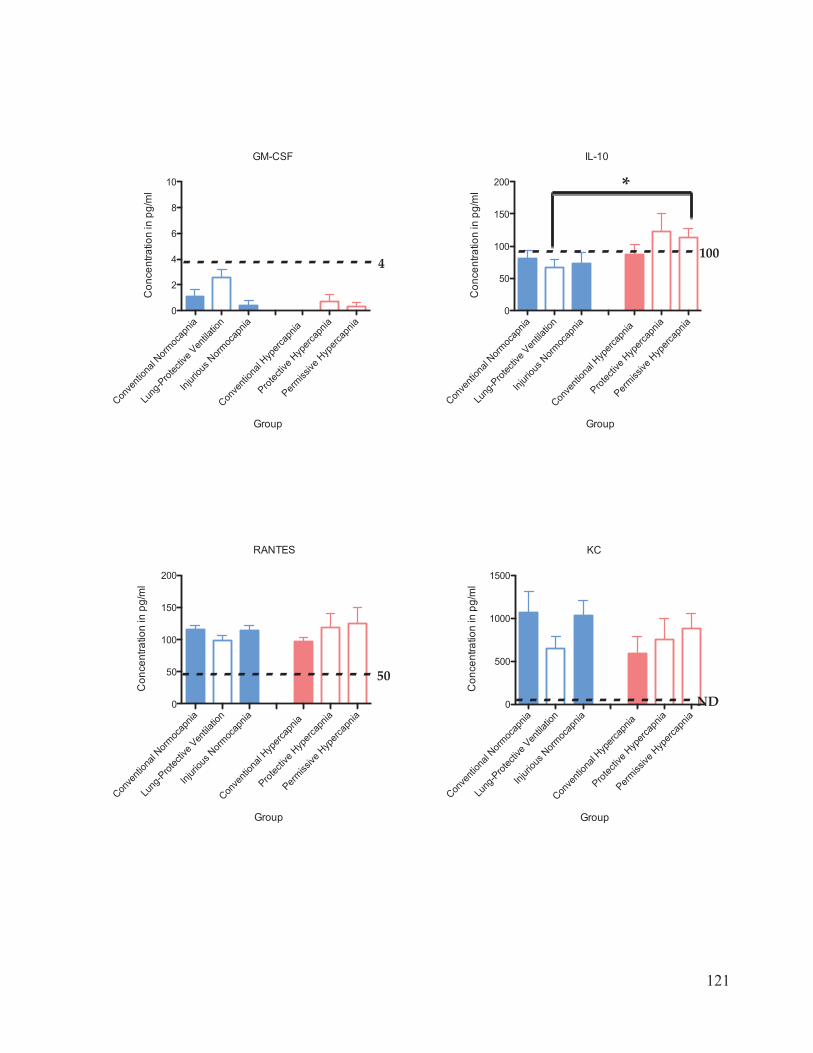
121
Conve
ntion
alNorm
ocap
nia
Lung
-Prot
ectiv
e Ven
tilatio
n
Injuri
ous N
ormoc
apnia
Conve
ntion
alHyp
ercap
nia
Protec
tive H
yperc
apnia
Permiss
ive H
yperc
apnia
0
50
100
150
200
RANTES
Group
Con
cent
ratio
n in
pg/
ml
50
Conve
ntion
alNorm
ocap
nia
Lung
-Prot
ectiv
e Ventila
tion
Injuri
ous Norm
ocap
nia
Conve
ntion
alHyp
ercap
nia
Protec
tive H
yperc
apnia
Permiss
iveHyp
ercap
nia0
50
100
150
200
IL-10
Group
Con
cent
ratio
n in
pg/
ml
100
*
Conve
ntion
alNorm
ocap
nia
Lung
-Prot
ectiv
e Ventila
tion
Injuri
ous Norm
ocap
nia
Conve
ntion
alHyp
ercap
nia
Protec
tive H
yperc
apnia
Permiss
ive H
yperc
apnia
0
2
4
6
8
10
GM-CSF
Group
Con
cent
ratio
n in
pg/
ml
4
Conve
ntion
alNorm
ocap
n
Lung
-Prot
ectiv
e Ven
tilatio
Injuri
ous N
ormoc
apn
Conve
ntion
alHyp
ercap
ni
Protec
tive H
yperc
apn
Permiss
ive H
yperc
apnia n ia a ia ia
0
500
1000
1500
KC
Group
Con
cent
ratio
n in
pg/
ml
ND
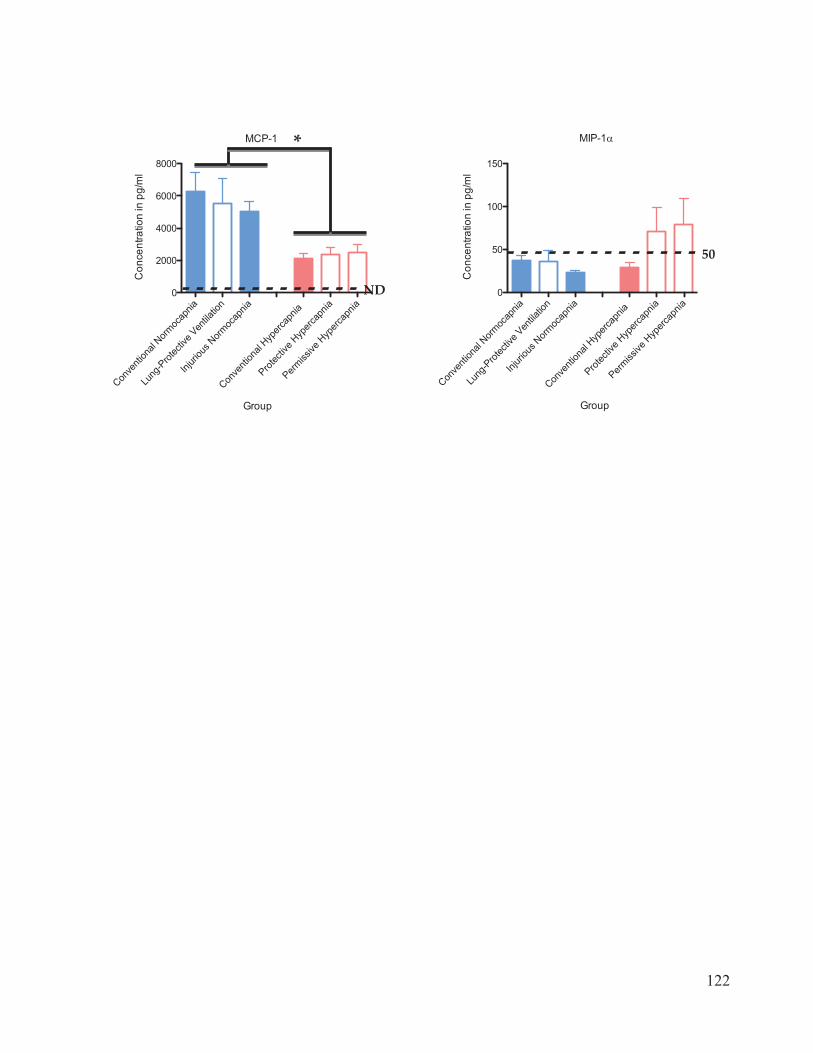
122
Conve
ntion
al Norm
ocap
nia
Lung
-Prot
ectiv
e Ven
tilatio
n
Injuri
ous Norm
ocap
nia
Conve
ntion
al Hyp
ercap
nia
Protec
tive H
yperc
apnia
Permiss
ive H
yperc
apnia
0
50
100
150
MIP-1
Group
Con
cent
ratio
n in
pg/
ml
50
Conve
ntion
al Norm
ocap
n
Lung
-Prot
ectiv
e Ventila
tio
Injuri
ous Norm
ocap
n
Conve
ntion
al Hyp
ercap
nia
Protec
tive H
yperc
apn
Permiss
ive H
yperc
apniia n ia ia a
0
2000
4000
6000
8000
MCP-1
Group
Con
cent
ratio
n in
pg/
ml
*
ND
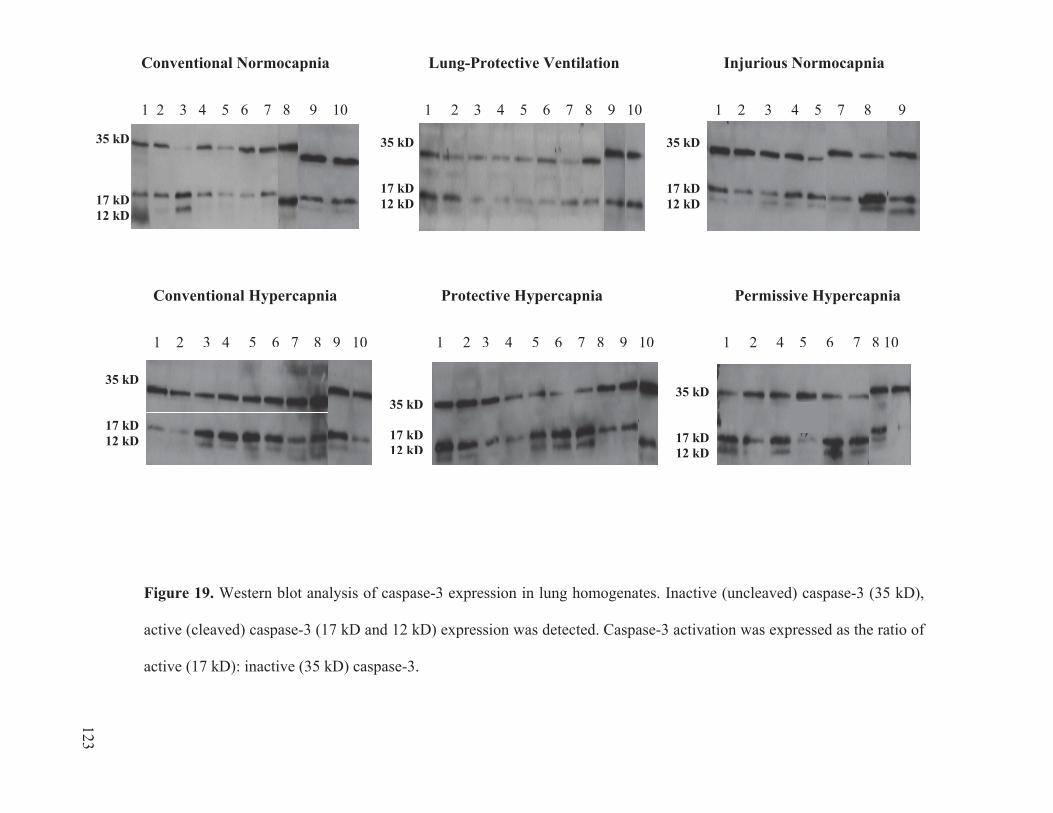
Conventional Normocapnia Lung-Protective Ventilation Injurious Normocapnia
1 2 3 4 5 6 7 8 9 10 1 2 3 4 5 6 7 8 9 10 1 2 3 4 5 7 8 9
Figure 19. Western blot analysis of caspase-3 expression in lung homogenates. Inactive (uncleaved) caspase-3 (35 kD),
active (cleaved) caspase-3 (17 kD and 12 kD) expression was detected. Caspase-3 activation was expressed as the ratio of
active (17 kD): inactive (35 kD) caspase-3.
35 kD 35 kD 35 kD
17 kD 12 kD
17 kD 17 kD 12 kD
12 kD
Conventional Hypercapnia Protective Hypercapnia Permissive Hypercapnia
1 2 3 4 5 6 7 8 9 10 1 2 3 4 5 6 7 8 9 10 1 2 4 5 6 7 8 10
35 kD
17 kD 12 kD
35 kD
17 kD 12 kD
35 kD
17 kD 12 kD
118 123

Conve
ntion
al Norm
ocap
nia
Lung
-Prot
ectiv
e Ventila
tion
Injuri
ous Norm
ocap
nia
Conve
ntion
alHyp
ercap
nia
Protec
tive Hyp
ercap
nia
Permisi
sve H
yperc
apnia
0.0
0.5
1.0
1.5
2.0
Group
Activ
e/In
activ
e C
aspa
se-3
Exp
ress
ion
*
Figure 20. Ratio of active: inactive caspase-3 expression in rat lung homogenates after 4
hours of ventilation, as measured by western blot densitometric analysis. Legend: blue
border: normocapnia (Partial Pressure of Arterial CO2, PaCO2 target= 40-55 mmHg);
pink border: hypercapnia (PaCO2 target=60-70 mmHg); solid bars: conventional
ventilation settings (high tidal volume, VT); open bars: protective ventilation settings (VT
target of 8 mL/Kg). Values are expressed as mean ± SEM.
124
![[PPT]Gentle Ventilation - Neonatal Research · Web viewGentle Ventilation We all want to do it… but what is it? Outline: Avoiding ventilator induced lung injury Permissive Hypercapnia](https://img.pdfslide.net/doc/110x75/5b0504b37f8b9a6c0b8e9bdb/pptgentle-ventilation-neonatal-research-viewgentle-ventilation-we-all-want-to.jpg)