Embed Size (px)
Citation preview
Public and Independent School Enrollment Growth and Decline in Burnaby, Coquitlam, Richmond, Surrey, and Vancouver Andrew Yan
November 2010
2
Public and Independent School Enrollment Growth and Decline in Burnaby, Coquitlam, Richmond, Surrey, and Vancouver Andrew Yan [email protected] Brief Highlights
• In the span of 10 school years (2000/01-2009/10), total public school enrollment in Burnaby, Coquitlam, Richmond, Surrey, and Vancouver declined by 0.3 percent (-617). However, growth and decline in public school enrollment is very uneven as cities like Vancouver and Coquitlam declined by 3,092 (-5.5 percent) and 2,451 students (-7.4 percent) respectively whereas Surrey grew by 6,452 students (11 percent).
o Surrey has the only public school enrollment to grow as Vancouver, Burnaby, Richmond, and Coquitlam shrunk by four to seven percent.
o Since the 1999/2000 school year, the public elementary and secondary school system in Surrey has had the largest enrollment in the Metro Vancouver region.
• Independent school enrollment has grown by 19 percent (5,300 students) on average in 10 years. Growth in independent school enrollment in Burnaby, Richmond, Surrey, and Vancouver ranges from 0.1 to 36 percent.
• Public school enrollment declines in Burnaby and Vancouver have occurred while the population of school aged children (aged 5-18) is at near 10 year highs in these cities
o From a 20 year perspective, the school age population in every school district is at an all time high.
• 40 percent of independent schools in Burnaby, Coquitlam, Richmond, Surrey, and Vancouver are less than 20 years old.
• The decline in public school enrollment may not necessarily be attributed towards just the student outflow into the independent system and the user fragmentation of primary and secondary education, but also the effects of changing demography and housing costs and type to restrain the growth of the total number of families with children and number of children in Metro Vancouver.
• Enrollment patterns illustrate a set of large urban planning consequences, challenges, and opportunities for cities in the region in term of affordable family oriented housing for low and middle income families, family oriented development and the intensification and densification of schools as an “educational land reserve”.
• Between a growing school aged student population, higher relative birth rates, and affordable family oriented housing, growing public and independent school enrollment will likely remain the strongest in the City of Surrey for the near and intermediate future.
3
Introduction School enrollment can provide key insights into a city’s vitality and social sustainability. With enrollment data provided by the British Columbia Ministry of Education on the five largest school districts in the Metro Vancouver region1 -- Burnaby, Coquitlam2, Richmond, Surrey, and Vancouver, this data brief compiles standard public elementary and secondary school enrollment from the 1991/92 to 2009/10 school years with a focus on the most recent ten school years of 2000/01 to 2009/10.3 To place these numbers in a context, this brief also examines the state of enrollment in independent (private) schools for these cities as well as school age population estimates and birth rate statistics from StatsBC. This brief specifically studies public enrollment in standard school programs who are distinct persons/students as oppose to enrolments by students who can enroll in course in multiple schools or districts. This brief excludes home schooling as well as those in alternative programs, continuing education, district distance education with the rationale of focusing on those students who would most utilized traditional types of physical school infrastructure. Two recently published documents highlight the interest in school enrollments in the region: the Vancouver Board of Education’s Administrative Report on Schools Consider for Potential Closure and Surrey Board of Trade’s Education Today, Productivity Tomorrow.4,5 Given different counting techniques, enrollment statistics in this paper will differ from those presented in those documents.6 Nevertheless, they will generally concur with similar enrollment trends. Key themes include this brief include the ascension of the Surrey as the largest public school system in both the region and province while other public school systems have seen modest enrollment growth, if not shrinkage, in the past decade. It shows how the user fragmentation of primary and secondary education through choices like independent schools, demography through declining birth rates, and the lack of affordable and suitable family oriented housing, might shape this trend.
1 With the exception of the Coquitlam School District, the school districts of Burnaby, Richmond, Surrey, and Vancouver are contiguous with their respective city boundaries. 2 The Coquitlam School District serves the cities of Coquitlam, Port Coquitlam, and Port Moody as well as Belcarra and Anmore 3 Older enrollment statistics were not readily available as the BC Ministry of Education instituted a new enrollment tracking system via Student Personal Education Numbers in the 1991/92 school year. 4 Vancouver School Board. 2010. “Vancouver Board of Education Administrative Report Schools Considered for Potential Closure”. Retrieved from http://www.vsb.bc.ca/sites/default/files/publication-files/FINAL-Administrative%20report3.pdf 5 Surrey Board of Trade. 2010. “Education Today, Productivity Tomorrow”. Retrieved from http://www.businessinsurrey.com/storage/advocacy_docs/SBoT_Education_Paper2010.pdf 6 For example, this brief does not exclude international students in its standard population count whereas the Vancouver Board of Education study uses a K-12 headcount and the Surrey Board of Trade uses a Full Time Equivalent Funded Enrollment methodology that includes school-age and adult populations.
4
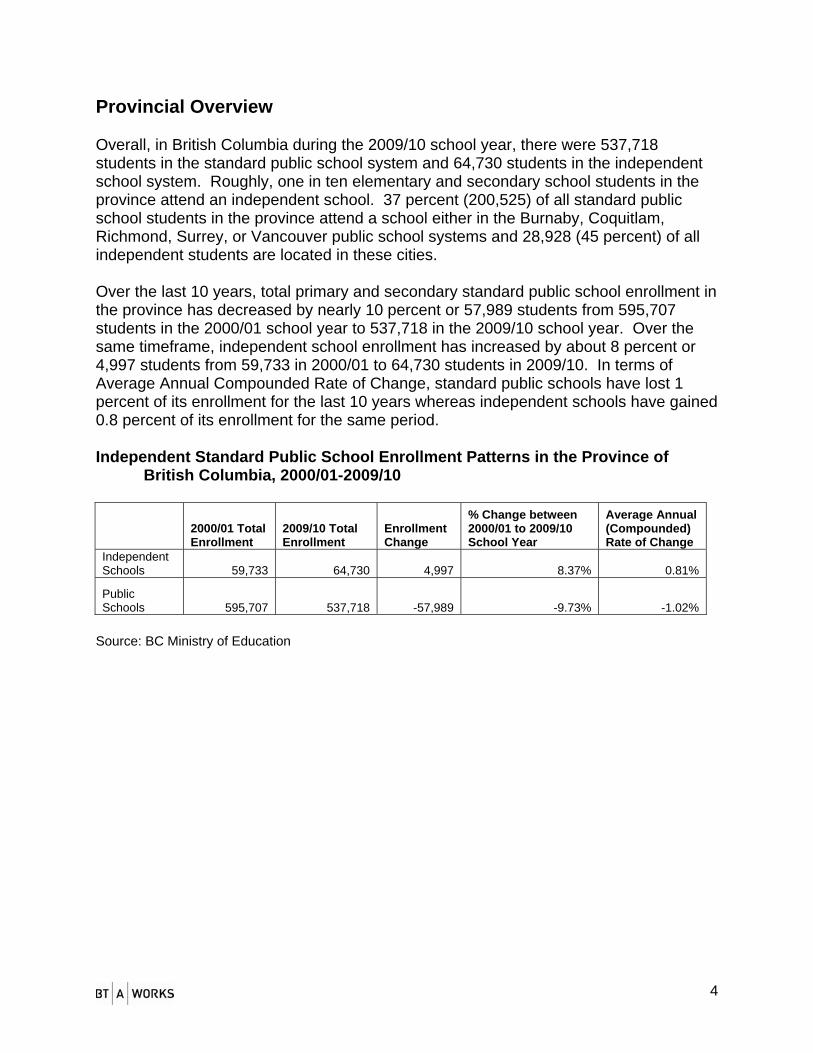
Provincial Overview Overall, in British Columbia during the 2009/10 school year, there were 537,718 students in the standard public school system and 64,730 students in the independent school system. Roughly, one in ten elementary and secondary school students in the province attend an independent school. 37 percent (200,525) of all standard public school students in the province attend a school either in the Burnaby, Coquitlam, Richmond, Surrey, or Vancouver public school systems and 28,928 (45 percent) of all independent students are located in these cities. Over the last 10 years, total primary and secondary standard public school enrollment in the province has decreased by nearly 10 percent or 57,989 students from 595,707 students in the 2000/01 school year to 537,718 in the 2009/10 school year. Over the same timeframe, independent school enrollment has increased by about 8 percent or 4,997 students from 59,733 in 2000/01 to 64,730 students in 2009/10. In terms of Average Annual Compounded Rate of Change, standard public schools have lost 1 percent of its enrollment for the last 10 years whereas independent schools have gained 0.8 percent of its enrollment for the same period. Independent Standard Public School Enrollment Patterns in the Province of
British Columbia, 2000/01-2009/10
2000/01 Total Enrollment
2009/10 Total Enrollment
Enrollment Change
% Change between 2000/01 to 2009/10 School Year
Average Annual (Compounded) Rate of Change
Independent Schools 59,733 64,730
4,997 8.37% 0.81%
Public Schools 595,707 537,718 -57,989 -9.73% -1.02%
Source: BC Ministry of Education
5
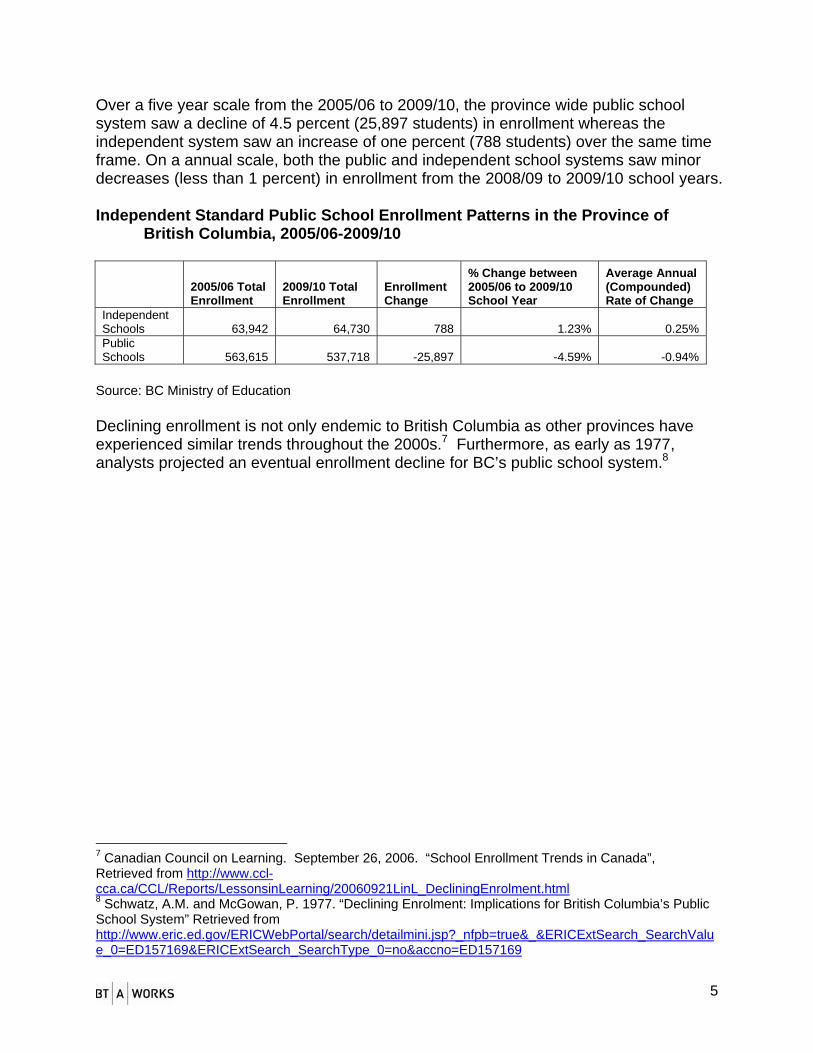
Over a five year scale from the 2005/06 to 2009/10, the province wide public school system saw a decline of 4.5 percent (25,897 students) in enrollment whereas the independent system saw an increase of one percent (788 students) over the same time frame. On a annual scale, both the public and independent school systems saw minor decreases (less than 1 percent) in enrollment from the 2008/09 to 2009/10 school years. Independent Standard Public School Enrollment Patterns in the Province of
British Columbia, 2005/06-2009/10
2005/06 Total Enrollment
2009/10 Total Enrollment
Enrollment Change
% Change between 2005/06 to 2009/10 School Year
Average Annual (Compounded) Rate of Change
Independent Schools
63,942
64,730
788 1.23% 0.25%
Public Schools
563,615
537,718
-25,897 -4.59% -0.94%
Source: BC Ministry of Education Declining enrollment is not only endemic to British Columbia as other provinces have experienced similar trends throughout the 2000s.7 Furthermore, as early as 1977, analysts projected an eventual enrollment decline for BC’s public school system.8
7 Canadian Council on Learning. September 26, 2006. “School Enrollment Trends in Canada”, Retrieved from http://www.ccl-cca.ca/CCL/Reports/LessonsinLearning/20060921LinL_DecliningEnrolment.html 8 Schwatz, A.M. and McGowan, P. 1977. “Declining Enrolment: Implications for British Columbia’s Public School System” Retrieved from http://www.eric.ed.gov/ERICWebPortal/search/detailmini.jsp?_nfpb=true&_&ERICExtSearch_SearchValue_0=ED157169&ERICExtSearch_SearchType_0=no&accno=ED157169
6
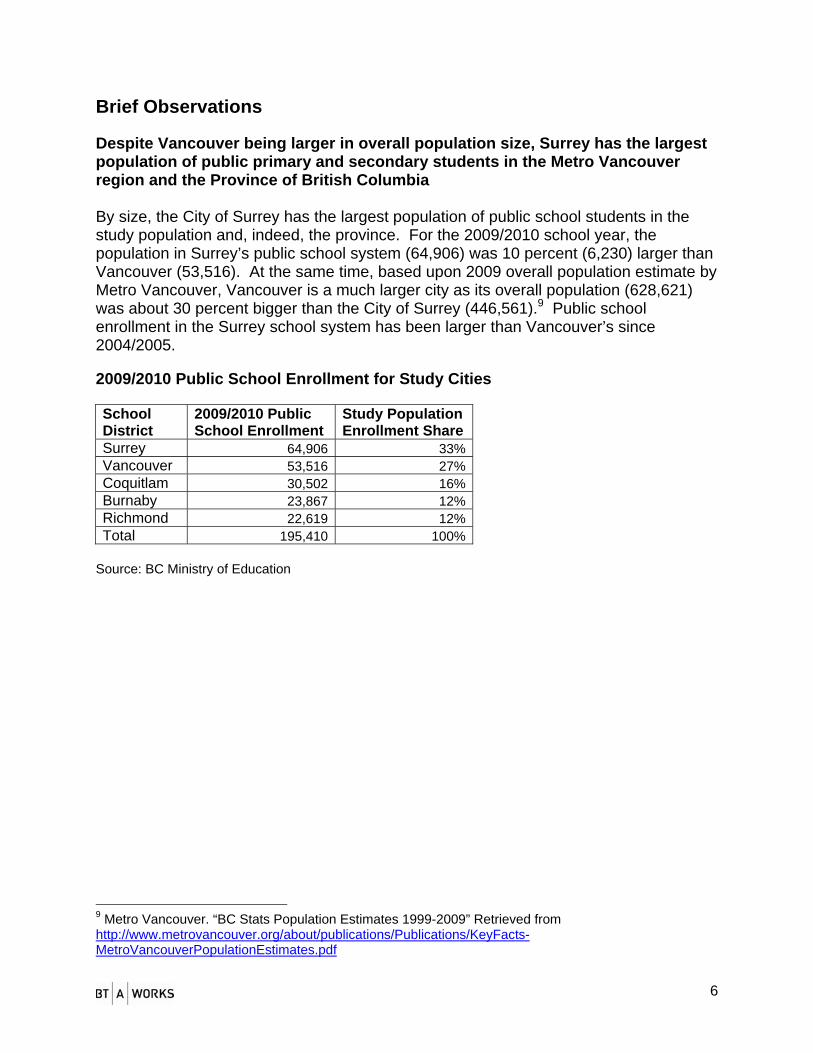
Brief Observations Despite Vancouver being larger in overall population size, Surrey has the largest population of public primary and secondary students in the Metro Vancouver region and the Province of British Columbia By size, the City of Surrey has the largest population of public school students in the study population and, indeed, the province. For the 2009/2010 school year, the population in Surrey’s public school system (64,906) was 10 percent (6,230) larger than Vancouver (53,516). At the same time, based upon 2009 overall population estimate by Metro Vancouver, Vancouver is a much larger city as its overall population (628,621) was about 30 percent bigger than the City of Surrey (446,561).9 Public school enrollment in the Surrey school system has been larger than Vancouver’s since 2004/2005. 2009/2010 Public School Enrollment for Study Cities School District
2009/2010 Public School Enrollment
Study Population Enrollment Share
Surrey 64,906 33%Vancouver 53,516 27%Coquitlam 30,502 16%Burnaby 23,867 12%Richmond 22,619 12%Total 195,410 100%
Source: BC Ministry of Education
9 Metro Vancouver. “BC Stats Population Estimates 1999-2009” Retrieved from http://www.metrovancouver.org/about/publications/Publications/KeyFacts-MetroVancouverPopulationEstimates.pdf
7
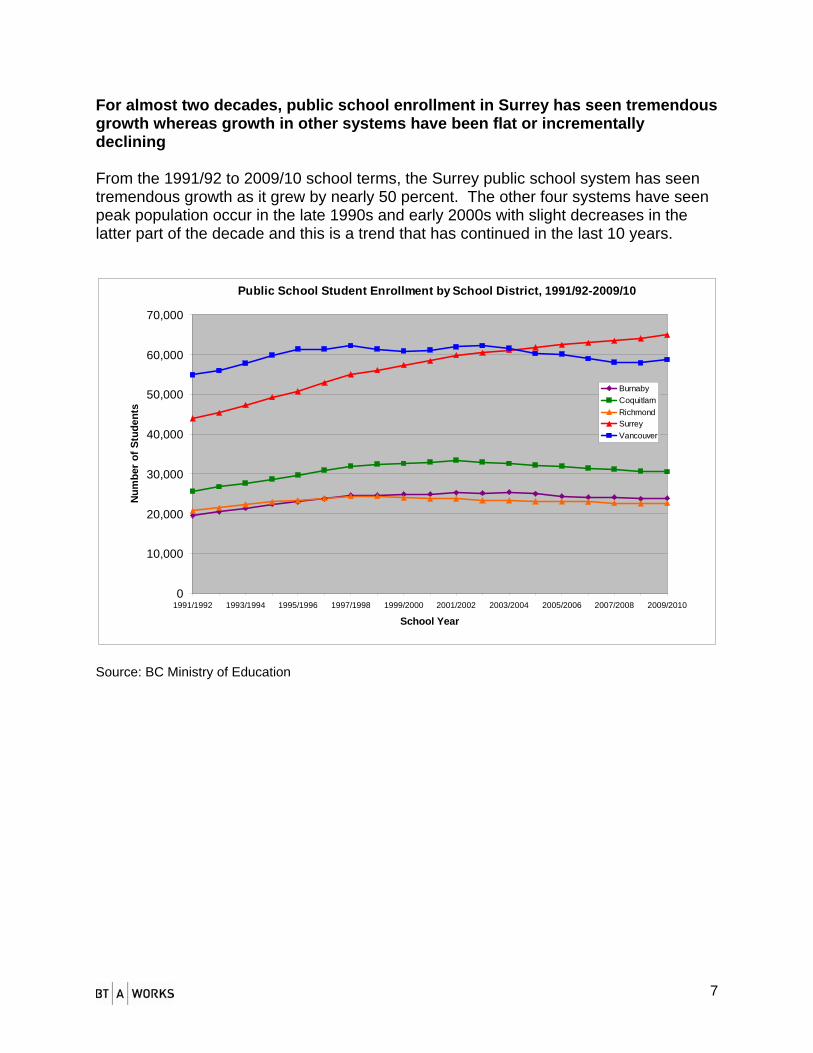
For almost two decades, public school enrollment in Surrey has seen tremendous growth whereas growth in other systems have been flat or incrementally declining From the 1991/92 to 2009/10 school terms, the Surrey public school system has seen tremendous growth as it grew by nearly 50 percent. The other four systems have seen peak population occur in the late 1990s and early 2000s with slight decreases in the latter part of the decade and this is a trend that has continued in the last 10 years.
Public School Student Enrollment by School District, 1991/92-2009/10
0
10,000
20,000
30,000
40,000
50,000
60,000
70,000
1991/1992 1993/1994 1995/1996 1997/1998 1999/2000 2001/2002 2003/2004 2005/2006 2007/2008 2009/2010
School Year
Num
ber
of S
tude
nts
BurnabyCoquitlamRichmondSurreyVancouver
Source: BC Ministry of Education
8
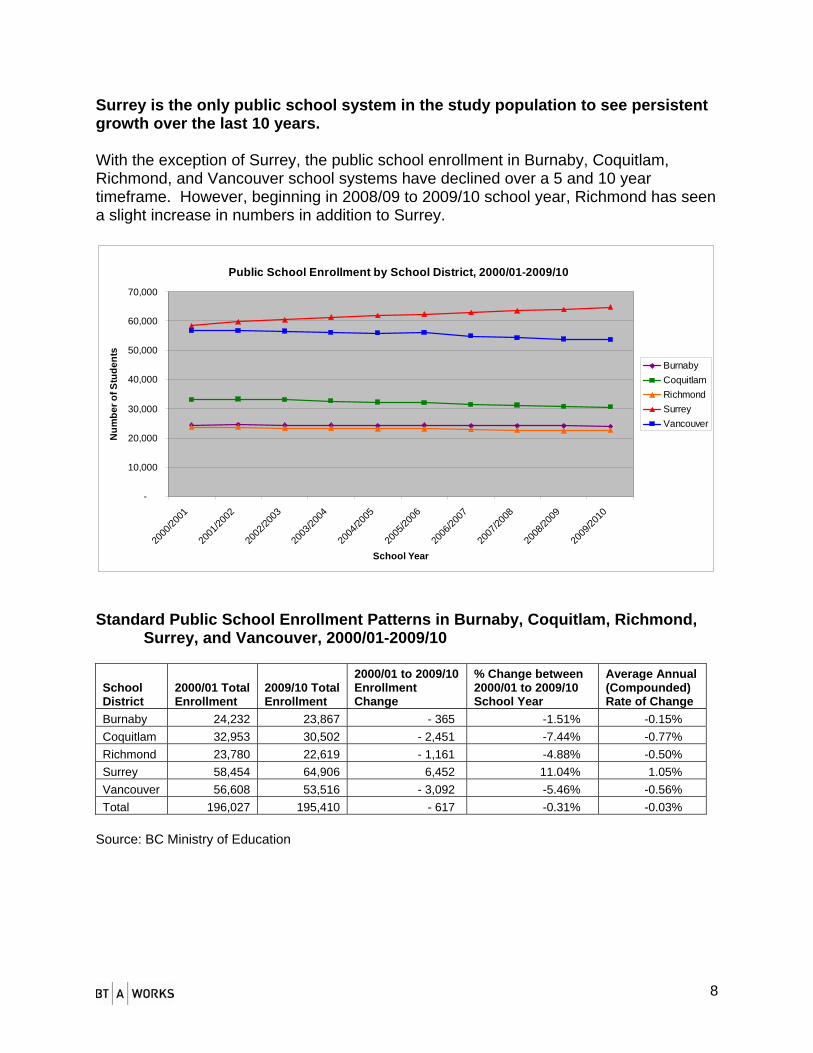
Surrey is the only public school system in the study population to see persistent growth over the last 10 years. With the exception of Surrey, the public school enrollment in Burnaby, Coquitlam, Richmond, and Vancouver school systems have declined over a 5 and 10 year timeframe. However, beginning in 2008/09 to 2009/10 school year, Richmond has seen a slight increase in numbers in addition to Surrey.
Public School Enrollment by School District, 2000/01-2009/10
-
10,000
20,000
30,000
40,000
50,000
60,000
70,000
2000
/2001
2001
/2002
2002
/2003
2003
/2004
2004
/2005
2005
/2006
2006
/2007
2007
/2008
2008
/2009
2009
/2010
School Year
Num
ber o
f Stu
dent
s
BurnabyCoquitlamRichmondSurreyVancouver
Standard Public School Enrollment Patterns in Burnaby, Coquitlam, Richmond,
Surrey, and Vancouver, 2000/01-2009/10
School District
2000/01 Total Enrollment
2009/10 Total Enrollment
2000/01 to 2009/10 Enrollment Change
% Change between 2000/01 to 2009/10 School Year
Average Annual (Compounded) Rate of Change
Burnaby 24,232 23,867 - 365 -1.51% -0.15% Coquitlam 32,953 30,502 - 2,451 -7.44% -0.77% Richmond 23,780 22,619 - 1,161 -4.88% -0.50% Surrey 58,454 64,906 6,452 11.04% 1.05% Vancouver 56,608 53,516 - 3,092 -5.46% -0.56% Total 196,027 195,410 - 617 -0.31% -0.03%
Source: BC Ministry of Education

9
From a five year perspective, public school enrollment has continued to decline in all school districts with the exception of Surrey; however, from an annual perspective, enrollments have slightly increased in Richmond and Surrey. Standard Public School Enrollment Patterns in Burnaby, Coquitlam, Richmond,
Surrey, and Vancouver, 2004/05-2009/10
School District
2004/05 Total Enrollment
2009/10 Total Enrollment
2004/05 to 2009/10 Enrollment Change
% Change between 2004/05 to 2009/10 School Year
Average Annual (Compounded) Rate of Change
Burnaby 24,267 23,867 - 400 -1.65% -0.33% Coquitlam 31,918 30,502 - 1,416 -4.44% -0.90% Richmond 23,008 22,619 - 389 -1.69% -0.34% Surrey 62,378 64,906 2,528 4.05% 0.80% Vancouver 55,992 53,516 - 2,476 -4.42% -0.90% Total 197,563 195,410 - 2,153 -1.09% -0.22%
Source: BC Ministry of Education Standard Public School Enrollment Patterns in Burnaby, Coquitlam, Richmond,
Surrey, and Vancouver, 2008/09-2009/10
School District
2008/09 Total Enrollment
2009/10 Total Enrollment
2008/09 to 2009/10 Enrollment Change
% Change between 2008/09 to 2009/10 School Year
Burnaby 24,060 23,867 - 193 -0.80% Coquitlam 30,688 30,502 - 186 -0.61% Richmond 22,507 22,619 112 0.50% Surrey 64,039 64,906 867 1.35% Vancouver 53,741 53,516 - 225 -0.42% Total 195,035 195,410 375 0.19%
Source: BC Ministry of Education
10
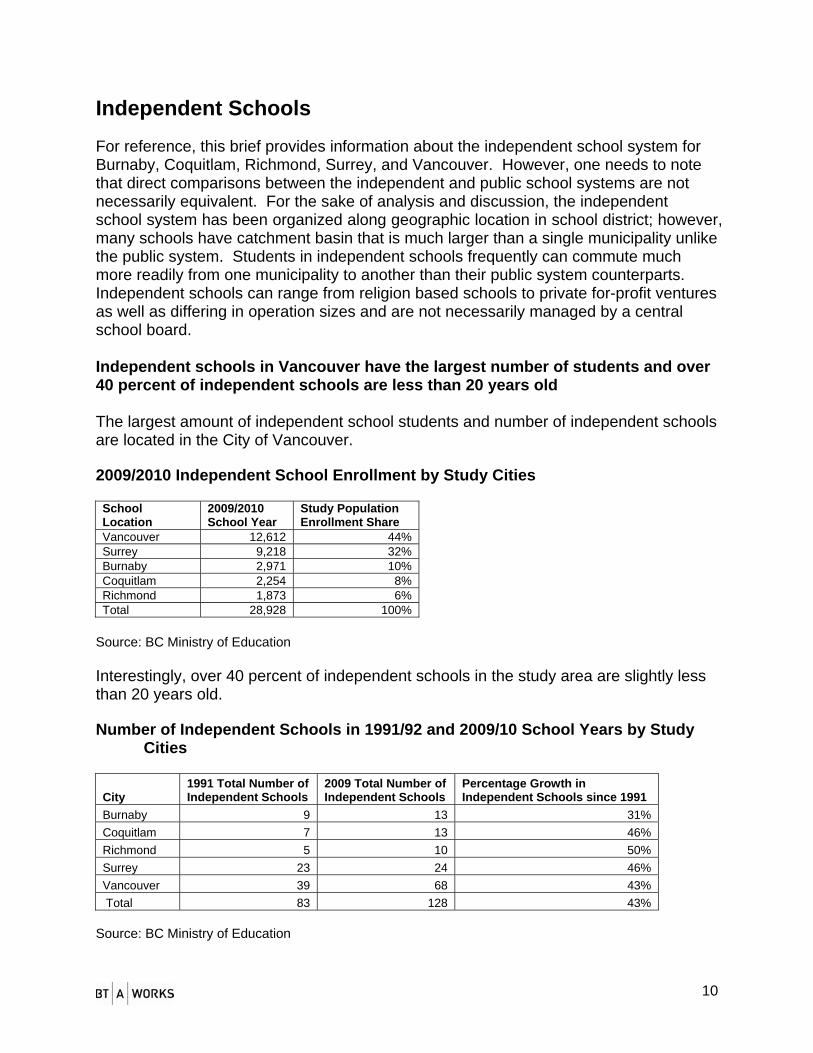
Independent Schools For reference, this brief provides information about the independent school system for Burnaby, Coquitlam, Richmond, Surrey, and Vancouver. However, one needs to note that direct comparisons between the independent and public school systems are not necessarily equivalent. For the sake of analysis and discussion, the independent school system has been organized along geographic location in school district; however, many schools have catchment basin that is much larger than a single municipality unlike the public system. Students in independent schools frequently can commute much more readily from one municipality to another than their public system counterparts. Independent schools can range from religion based schools to private for-profit ventures as well as differing in operation sizes and are not necessarily managed by a central school board. Independent schools in Vancouver have the largest number of students and over 40 percent of independent schools are less than 20 years old The largest amount of independent school students and number of independent schools are located in the City of Vancouver. 2009/2010 Independent School Enrollment by Study Cities
School Location
2009/2010 School Year
Study Population Enrollment Share
Vancouver 12,612 44% Surrey 9,218 32% Burnaby 2,971 10% Coquitlam 2,254 8% Richmond 1,873 6% Total 28,928 100%
Source: BC Ministry of Education Interestingly, over 40 percent of independent schools in the study area are slightly less than 20 years old. Number of Independent Schools in 1991/92 and 2009/10 School Years by Study
Cities
City 1991 Total Number of Independent Schools
2009 Total Number of Independent Schools
Percentage Growth in Independent Schools since 1991
Burnaby 9 13 31% Coquitlam 7 13 46% Richmond 5 10 50% Surrey 23 24 46% Vancouver 39 68 43% Total 83 128 43%
Source: BC Ministry of Education
11
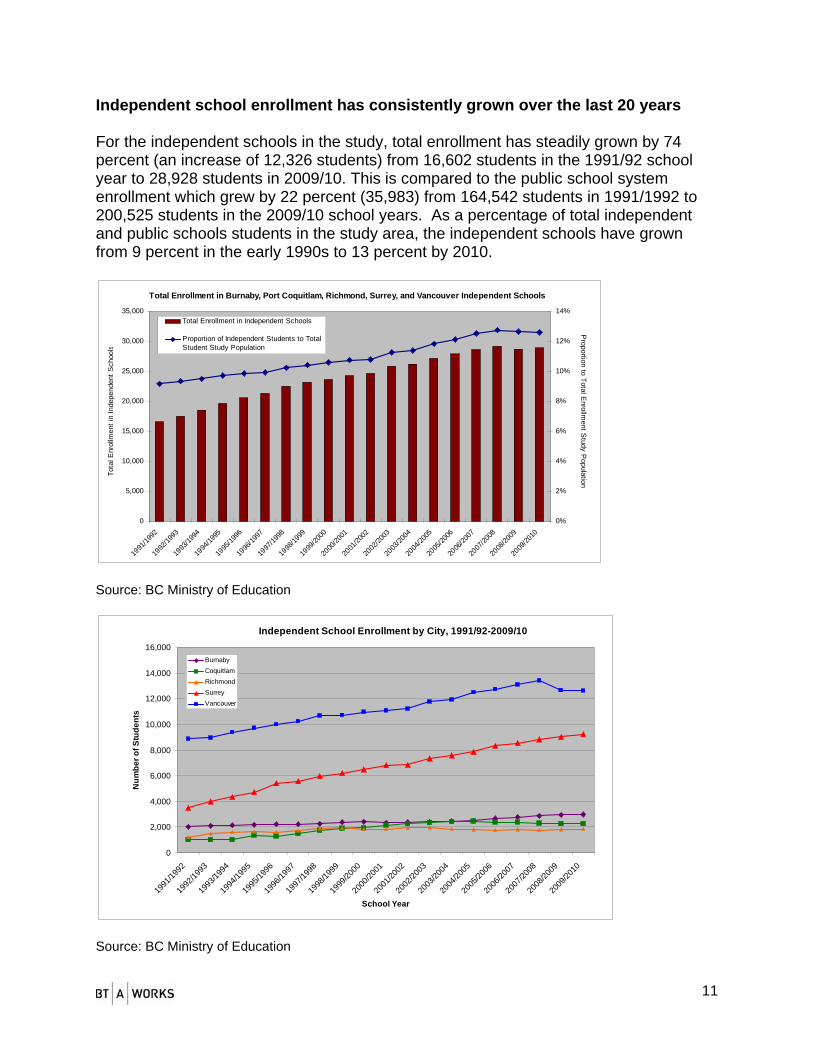
Independent school enrollment has consistently grown over the last 20 years For the independent schools in the study, total enrollment has steadily grown by 74 percent (an increase of 12,326 students) from 16,602 students in the 1991/92 school year to 28,928 students in 2009/10. This is compared to the public school system enrollment which grew by 22 percent (35,983) from 164,542 students in 1991/1992 to 200,525 students in the 2009/10 school years. As a percentage of total independent and public schools students in the study area, the independent schools have grown from 9 percent in the early 1990s to 13 percent by 2010.
0
5,000
10,000
15,000
20,000
25,000
30,000
35,000
1991
/1992
1992
/1993
1993
/1994
1994
/1995
1995
/1996
1996
/1997
1997
/1998
1998
/1999
1999
/2000
2000
/2001
2001
/2002
2002
/2003
2003
/2004
2004
/2005
2005
/2006
2006
/2007
2007
/2008
2008
/2009
2009
/2010
0%
2%
4%
6%
8%
10%
12%
14%Total Enrollment in Independent Schools
Proportion of Independent Students to TotalStudent Study Population
Proportion to Total E
nrollment S
tudy Population
Total Enrollment in Burnaby, Port Coquitlam, Richmond, Surrey, and Vancouver Independent Schools
Tota
l Enr
ollm
ent i
n In
depe
nden
t Sch
ools
Source: BC Ministry of Education
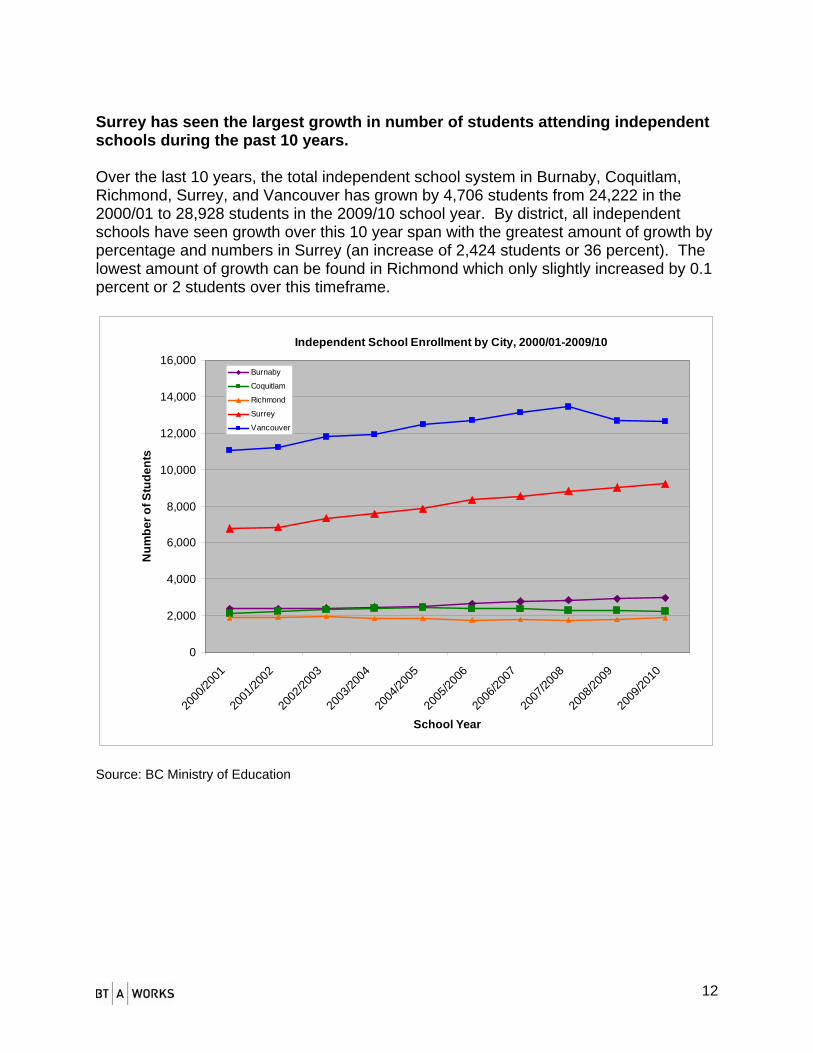
Independent School Enrollment by City, 1991/92-2009/10
0
2,000
4,000
6,000
8,000
10,000
12,000
14,000
16,000
1991
/1992
1992
/1993
1993
/1994
1994
/1995
1995
/1996
1996
/1997
1997
/1998
1998
/1999
1999
/2000
2000
/2001
2001
/2002
2002
/2003
2003
/2004
2004
/2005
2005
/2006
2006
/2007
2007
/2008
2008
/2009
2009
/2010
School Year
Num
ber o
f Stu
dent
s
BurnabyCoquitlamRichmondSurreyVancouver
Source: BC Ministry of Education
12
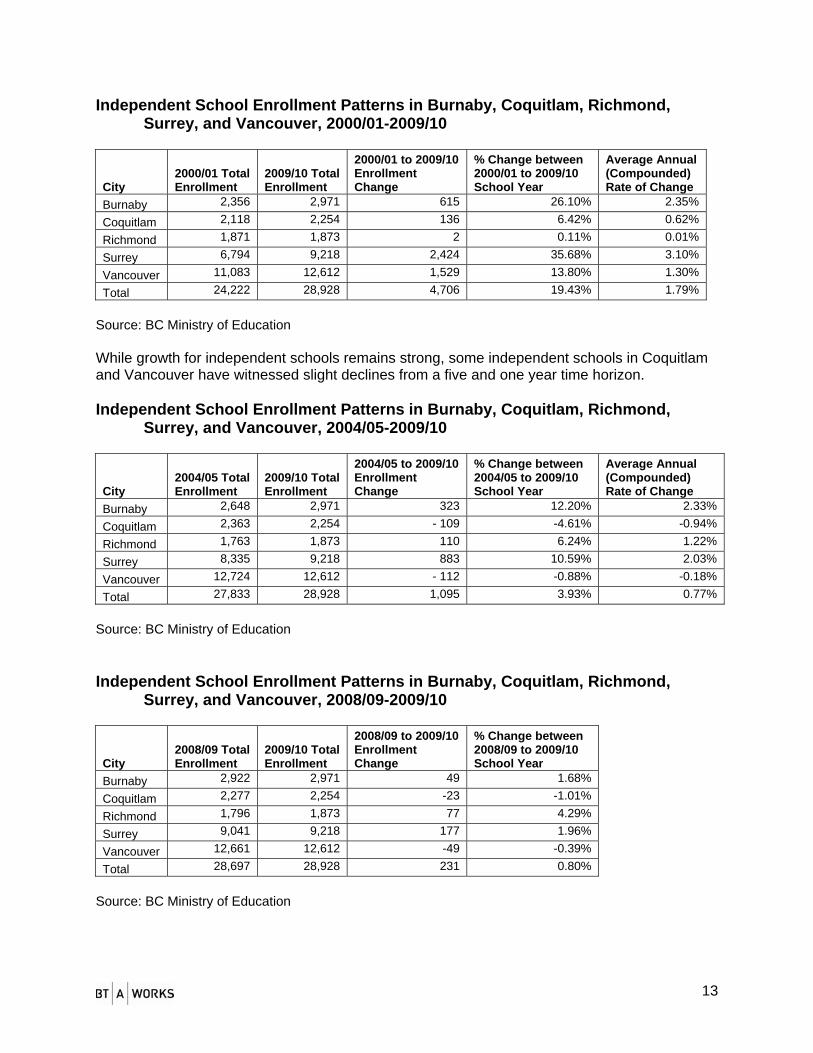
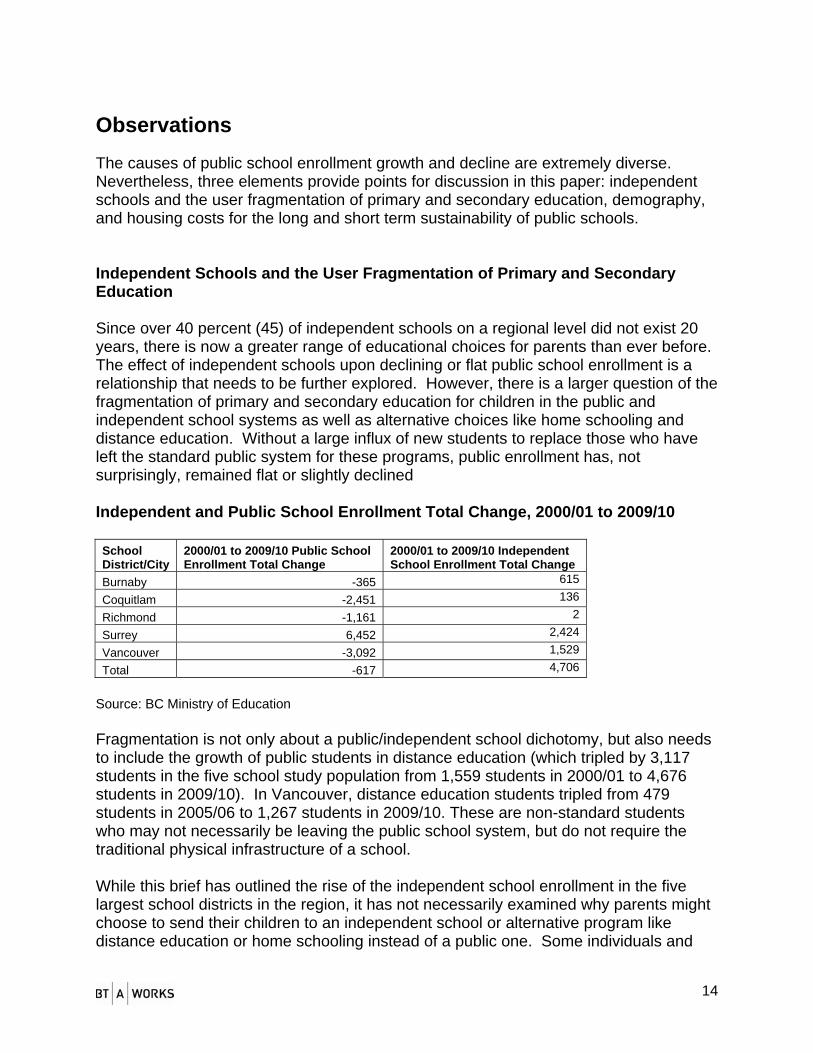
Surrey has seen the largest growth in number of students attending independent schools during the past 10 years. Over the last 10 years, the total independent school system in Burnaby, Coquitlam, Richmond, Surrey, and Vancouver has grown by 4,706 students from 24,222 in the 2000/01 to 28,928 students in the 2009/10 school year. By district, all independent schools have seen growth over this 10 year span with the greatest amount of growth by percentage and numbers in Surrey (an increase of 2,424 students or 36 percent). The lowest amount of growth can be found in Richmond which only slightly increased by 0.1 percent or 2 students over this timeframe.
Independent School Enrollment by City, 2000/01-2009/10
0
2,000
4,000
6,000
8,000
10,000
12,000
14,000
16,000
2000
/2001
2001
/2002
2002
/2003
2003
/2004
2004
/2005
2005
/2006
2006
/2007
2007
/2008
2008
/2009
2009
/2010
School Year
Num
ber o
f Stu
dent
s
Burnaby
Coquitlam
Richmond
Surrey
Vancouver
Source: BC Ministry of Education
13
Independent School Enrollment Patterns in Burnaby, Coquitlam, Richmond, Surrey, and Vancouver, 2000/01-2009/10
City 2000/01 Total Enrollment
2009/10 Total Enrollment
2000/01 to 2009/10 Enrollment Change
% Change between 2000/01 to 2009/10 School Year
Average Annual (Compounded) Rate of Change
Burnaby 2,356 2,971 615 26.10% 2.35%
Coquitlam 2,118 2,254 136 6.42% 0.62%
Richmond 1,871 1,873 2 0.11% 0.01%
Surrey 6,794 9,218 2,424 35.68% 3.10%
Vancouver 11,083 12,612 1,529 13.80% 1.30%
Total 24,222 28,928 4,706 19.43% 1.79%
Source: BC Ministry of Education While growth for independent schools remains strong, some independent schools in Coquitlam and Vancouver have witnessed slight declines from a five and one year time horizon. Independent School Enrollment Patterns in Burnaby, Coquitlam, Richmond,
Surrey, and Vancouver, 2004/05-2009/10
City 2004/05 Total Enrollment
2009/10 Total Enrollment
2004/05 to 2009/10 Enrollment Change
% Change between 2004/05 to 2009/10 School Year
Average Annual (Compounded) Rate of Change
Burnaby 2,648 2,971 323 12.20% 2.33%
Coquitlam 2,363 2,254 - 109 -4.61% -0.94%
Richmond 1,763 1,873 110 6.24% 1.22%
Surrey 8,335 9,218 883 10.59% 2.03%
Vancouver 12,724 12,612 - 112 -0.88% -0.18%
Total 27,833 28,928 1,095 3.93% 0.77%
Source: BC Ministry of Education Independent School Enrollment Patterns in Burnaby, Coquitlam, Richmond,
Surrey, and Vancouver, 2008/09-2009/10
City 2008/09 Total Enrollment
2009/10 Total Enrollment
2008/09 to 2009/10 Enrollment Change
% Change between 2008/09 to 2009/10 School Year
Burnaby 2,922 2,971 49 1.68%
Coquitlam 2,277 2,254 -23 -1.01%
Richmond 1,796 1,873 77 4.29%
Surrey 9,041 9,218 177 1.96%
Vancouver 12,661 12,612 -49 -0.39%
Total 28,697 28,928 231 0.80%
Source: BC Ministry of Education
14
Observations The causes of public school enrollment growth and decline are extremely diverse. Nevertheless, three elements provide points for discussion in this paper: independent schools and the user fragmentation of primary and secondary education, demography, and housing costs for the long and short term sustainability of public schools. Independent Schools and the User Fragmentation of Primary and Secondary Education Since over 40 percent (45) of independent schools on a regional level did not exist 20 years, there is now a greater range of educational choices for parents than ever before. The effect of independent schools upon declining or flat public school enrollment is a relationship that needs to be further explored. However, there is a larger question of the fragmentation of primary and secondary education for children in the public and independent school systems as well as alternative choices like home schooling and distance education. Without a large influx of new students to replace those who have left the standard public system for these programs, public enrollment has, not surprisingly, remained flat or slightly declined Independent and Public School Enrollment Total Change, 2000/01 to 2009/10 School District/City
2000/01 to 2009/10 Public School Enrollment Total Change
2000/01 to 2009/10 Independent School Enrollment Total Change
Burnaby -365 615
Coquitlam -2,451 136
Richmond -1,161 2
Surrey 6,452 2,424
Vancouver -3,092 1,529
Total -617 4,706
Source: BC Ministry of Education Fragmentation is not only about a public/independent school dichotomy, but also needs to include the growth of public students in distance education (which tripled by 3,117 students in the five school study population from 1,559 students in 2000/01 to 4,676 students in 2009/10). In Vancouver, distance education students tripled from 479 students in 2005/06 to 1,267 students in 2009/10. These are non-standard students who may not necessarily be leaving the public school system, but do not require the traditional physical infrastructure of a school. While this brief has outlined the rise of the independent school enrollment in the five largest school districts in the region, it has not necessarily examined why parents might choose to send their children to an independent school or alternative program like distance education or home schooling instead of a public one. Some individuals and
15
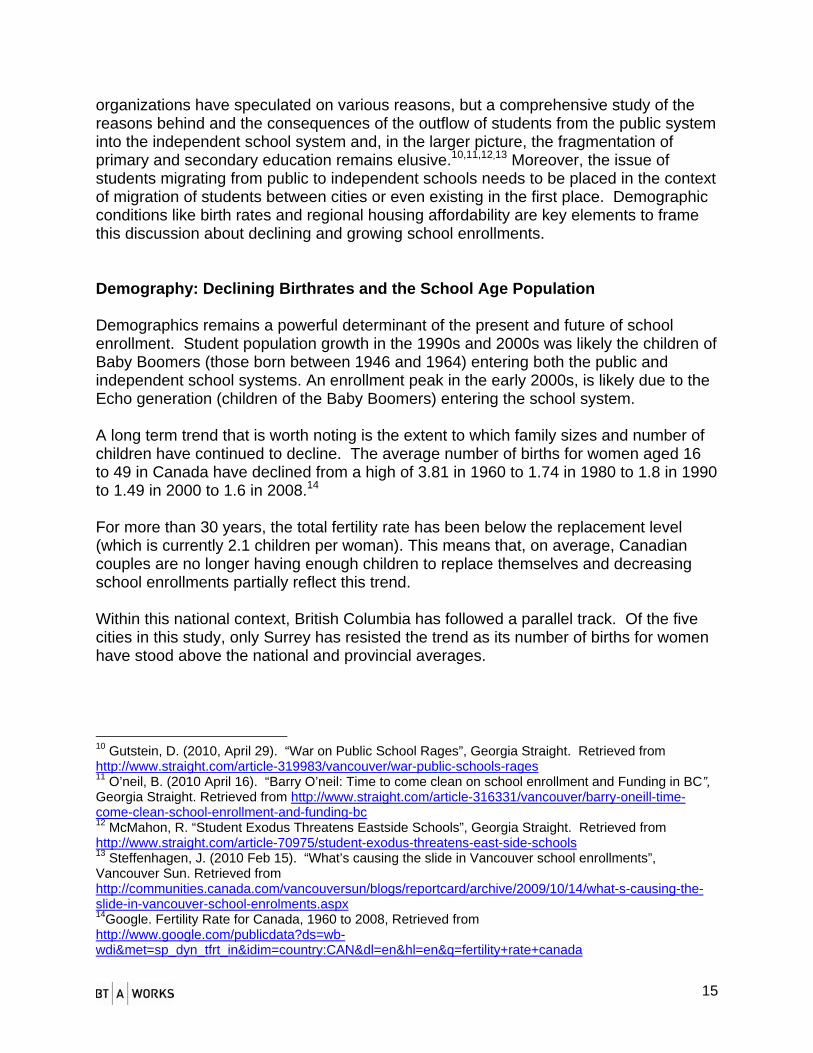
organizations have speculated on various reasons, but a comprehensive study of the reasons behind and the consequences of the outflow of students from the public system into the independent school system and, in the larger picture, the fragmentation of primary and secondary education remains elusive.10,11,12,13 Moreover, the issue of students migrating from public to independent schools needs to be placed in the context of migration of students between cities or even existing in the first place. Demographic conditions like birth rates and regional housing affordability are key elements to frame this discussion about declining and growing school enrollments. Demography: Declining Birthrates and the School Age Population Demographics remains a powerful determinant of the present and future of school enrollment. Student population growth in the 1990s and 2000s was likely the children of Baby Boomers (those born between 1946 and 1964) entering both the public and independent school systems. An enrollment peak in the early 2000s, is likely due to the Echo generation (children of the Baby Boomers) entering the school system. A long term trend that is worth noting is the extent to which family sizes and number of children have continued to decline. The average number of births for women aged 16 to 49 in Canada have declined from a high of 3.81 in 1960 to 1.74 in 1980 to 1.8 in 1990 to 1.49 in 2000 to 1.6 in 2008.14 For more than 30 years, the total fertility rate has been below the replacement level (which is currently 2.1 children per woman). This means that, on average, Canadian couples are no longer having enough children to replace themselves and decreasing school enrollments partially reflect this trend. Within this national context, British Columbia has followed a parallel track. Of the five cities in this study, only Surrey has resisted the trend as its number of births for women have stood above the national and provincial averages.
10 Gutstein, D. (2010, April 29). “War on Public School Rages”, Georgia Straight. Retrieved from http://www.straight.com/article-319983/vancouver/war-public-schools-rages 11 O’neil, B. (2010 April 16). “Barry O’neil: Time to come clean on school enrollment and Funding in BC”, Georgia Straight. Retrieved from http://www.straight.com/article-316331/vancouver/barry-oneill-time-come-clean-school-enrollment-and-funding-bc 12 McMahon, R. “Student Exodus Threatens Eastside Schools”, Georgia Straight. Retrieved from http://www.straight.com/article-70975/student-exodus-threatens-east-side-schools 13 Steffenhagen, J. (2010 Feb 15). “What’s causing the slide in Vancouver school enrollments”, Vancouver Sun. Retrieved from http://communities.canada.com/vancouversun/blogs/reportcard/archive/2009/10/14/what-s-causing-the-slide-in-vancouver-school-enrolments.aspx 14Google. Fertility Rate for Canada, 1960 to 2008, Retrieved from http://www.google.com/publicdata?ds=wb-wdi&met=sp_dyn_tfrt_in&idim=country:CAN&dl=en&hl=en&q=fertility+rate+canada

16
Average Births per Woman (Aged 16-49) in Burnaby, Coquitlam, Richmond, Surrey and Vancouver, 1990-2009
0.00
0.50
1.00
1.50
2.00
2.50
1990
1991
1992
1993
1994
1995
1996
1997
1998
1999
2000
2001
2002
2003
2004
2005
2006
2007
2008
2009
Year
Ave
rage
Birt
hs p
er W
oman
BurnabyCoquitlamRichmondSurreyVancouver AggregateBC Average
Source: BC Stats, modified from Total Fertility Rates by Local Health Area-1987 to 2009 http://www.bcstats.gov.bc.ca/DATA/pop/vital/lha_tfr.asp Within the City of Vancouver, average births drastically differ from area to area. Birth rates have been rising in the City Centre and, to a certain degree, the Westside of Vancouver, but generally decreasing in the rest of the City.15 Average Births per Woman (Aged 16-49) in the City of Vancouver by Local Health
Area Subarea, 1990-2009 Local Health Area 1990 1995 2000 2009 Vancouver - City Centre 0.59 0.60 0.62 0.74Vancouver - Downtown Eastside 1.68 1.42 1.05 0.96Vancouver - North East 1.57 1.55 1.37 1.39Vancouver - Westside 0.99 0.88 0.88 1.03Vancouver - Midtown 1.60 1.68 1.29 1.29Vancouver - South 1.60 1.58 1.33 1.37Vancouver – Aggregate 1.29 1.23 1.05 1.08
Source: BC Stats Average Birth Rates (ABRs) by themselves do not necessarily define a forthcoming school age population. ABRs need to be place in context to the population of women of child bearing age (between the ages of 16-49). This population has grown consistently for all the study cities where by birth, immigration or emigration. For the population of
15 For a reference to the Local Health Areas for the City of Vancouver, see Sub-Vancouver Local Health Areas http://www.bcstats.gov.bc.ca/DATA/pop/maps/VanSHAs.pdf
17
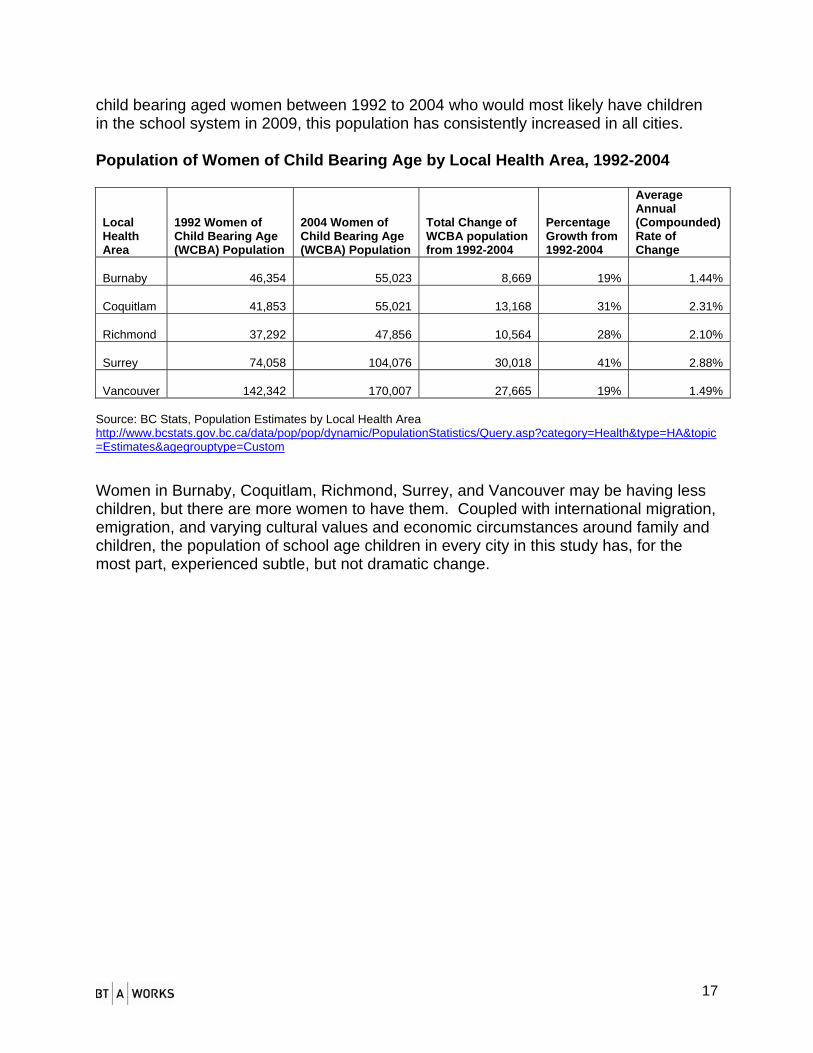
child bearing aged women between 1992 to 2004 who would most likely have children in the school system in 2009, this population has consistently increased in all cities. Population of Women of Child Bearing Age by Local Health Area, 1992-2004
Local Health Area
1992 Women of Child Bearing Age (WCBA) Population
2004 Women of Child Bearing Age (WCBA) Population
Total Change of WCBA population from 1992-2004
Percentage Growth from 1992-2004
Average Annual (Compounded) Rate of Change
Burnaby
46,354
55,023
8,669 19% 1.44%
Coquitlam
41,853
55,021
13,168 31% 2.31%
Richmond
37,292
47,856
10,564 28% 2.10%
Surrey
74,058
104,076
30,018 41% 2.88%
Vancouver
142,342
170,007
27,665 19% 1.49% Source: BC Stats, Population Estimates by Local Health Area http://www.bcstats.gov.bc.ca/data/pop/pop/dynamic/PopulationStatistics/Query.asp?category=Health&type=HA&topic=Estimates&agegrouptype=Custom Women in Burnaby, Coquitlam, Richmond, Surrey, and Vancouver may be having less children, but there are more women to have them. Coupled with international migration, emigration, and varying cultural values and economic circumstances around family and children, the population of school age children in every city in this study has, for the most part, experienced subtle, but not dramatic change.
18
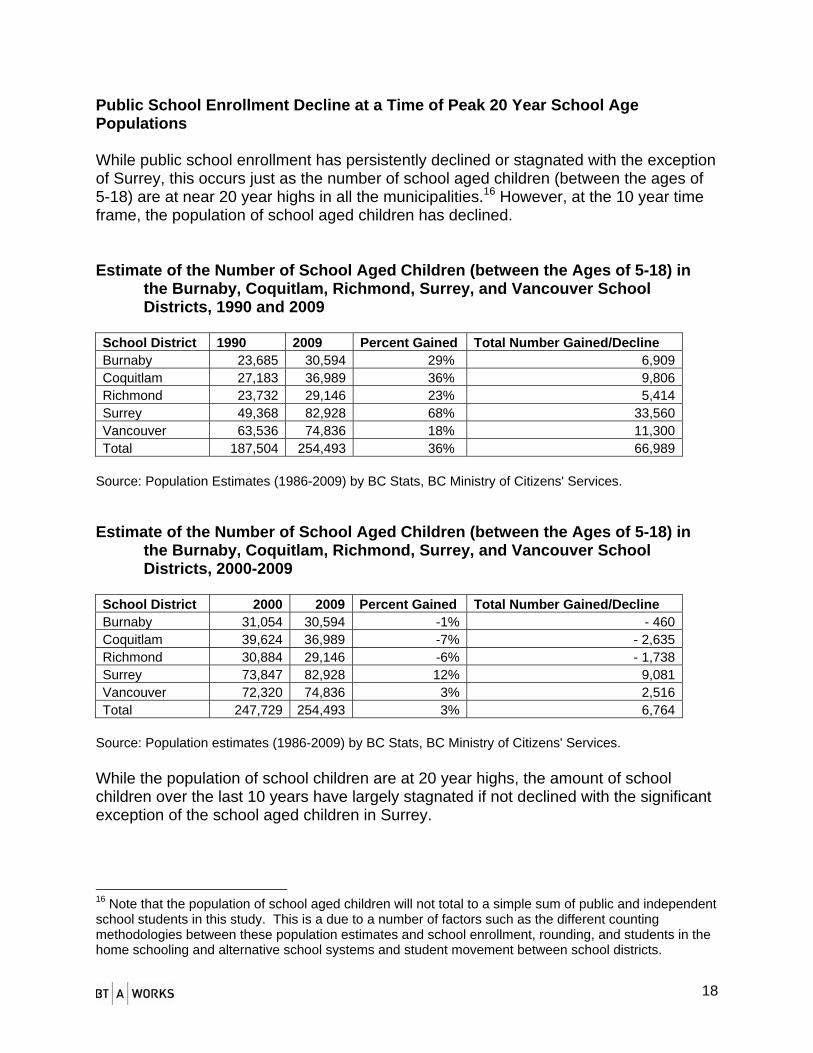
Public School Enrollment Decline at a Time of Peak 20 Year School Age Populations While public school enrollment has persistently declined or stagnated with the exception of Surrey, this occurs just as the number of school aged children (between the ages of 5-18) are at near 20 year highs in all the municipalities.16 However, at the 10 year time frame, the population of school aged children has declined. Estimate of the Number of School Aged Children (between the Ages of 5-18) in
the Burnaby, Coquitlam, Richmond, Surrey, and Vancouver School Districts, 1990 and 2009
School District 1990 2009 Percent Gained Total Number Gained/Decline Burnaby 23,685 30,594 29% 6,909 Coquitlam 27,183 36,989 36% 9,806 Richmond 23,732 29,146 23% 5,414 Surrey 49,368 82,928 68% 33,560 Vancouver 63,536 74,836 18% 11,300 Total 187,504 254,493 36% 66,989
Source: Population Estimates (1986-2009) by BC Stats, BC Ministry of Citizens' Services. Estimate of the Number of School Aged Children (between the Ages of 5-18) in
the Burnaby, Coquitlam, Richmond, Surrey, and Vancouver School Districts, 2000-2009
School District 2000 2009 Percent Gained Total Number Gained/Decline Burnaby 31,054 30,594 -1% - 460 Coquitlam 39,624 36,989 -7% - 2,635 Richmond 30,884 29,146 -6% - 1,738 Surrey 73,847 82,928 12% 9,081 Vancouver 72,320 74,836 3% 2,516 Total 247,729 254,493 3% 6,764
Source: Population estimates (1986-2009) by BC Stats, BC Ministry of Citizens' Services. While the population of school children are at 20 year highs, the amount of school children over the last 10 years have largely stagnated if not declined with the significant exception of the school aged children in Surrey.
16 Note that the population of school aged children will not total to a simple sum of public and independent school students in this study. This is a due to a number of factors such as the different counting methodologies between these population estimates and school enrollment, rounding, and students in the home schooling and alternative school systems and student movement between school districts.
19
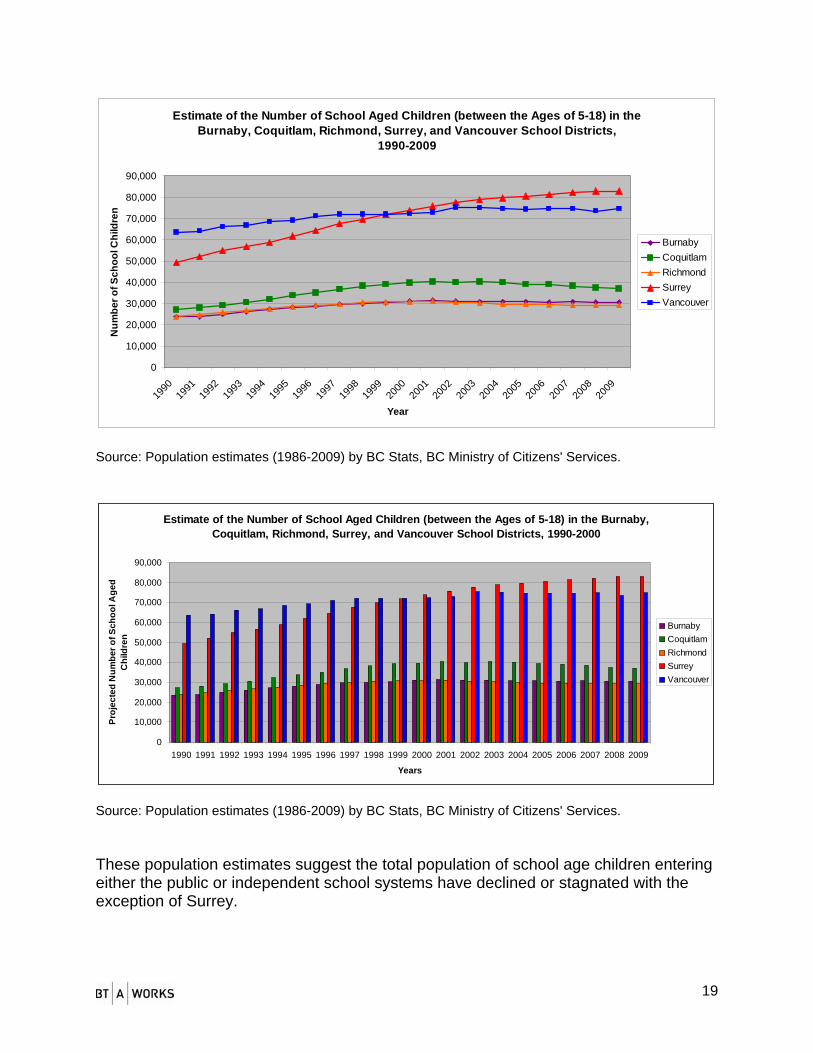
Estimate of the Number of School Aged Children (between the Ages of 5-18) in the Burnaby, Coquitlam, Richmond, Surrey, and Vancouver School Districts,
1990-2009
0
10,000
20,000
30,000
40,000
50,000
60,000
70,000
80,000
90,000
1990
1991
1992
1993
1994
1995
1996
1997
1998
1999
2000
2001
2002
2003
2004
2005
2006
2007
2008
2009
Year
Num
ber o
f Sch
ool C
hild
ren
BurnabyCoquitlamRichmondSurreyVancouver
Source: Population estimates (1986-2009) by BC Stats, BC Ministry of Citizens' Services.
Estimate of the Number of School Aged Children (between the Ages of 5-18) in the Burnaby, Coquitlam, Richmond, Surrey, and Vancouver School Districts, 1990-2000
0
10,000
20,000
30,000
40,000
50,000
60,000
70,000
80,000
90,000
1990 1991 1992 1993 1994 1995 1996 1997 1998 1999 2000 2001 2002 2003 2004 2005 2006 2007 2008 2009
Years
Proj
ecte
d N
umbe
r of S
choo
l Age
d C
hild
ren
BurnabyCoquitlamRichmondSurreyVancouver
Source: Population estimates (1986-2009) by BC Stats, BC Ministry of Citizens' Services. These population estimates suggest the total population of school age children entering either the public or independent school systems have declined or stagnated with the exception of Surrey.

20
Housing Affordability Housing affordability is another element towards the decline and growth of school enrollments. Housing prices throughout the Metro Vancouver region soared through the 1990s and 2000s. From 1990 to 2010, the average single family home in Metro Vancouver increased by 2.77 times whereas median household income in the region has stagnated if inflation is accounted for.17,18 As a ratio of median house prices to median household income, Metro Vancouver is the most unaffordable region in the world.19 Enrollment patterns between the public schools systems follow those of housing affordability. From 1990 to 2010, Surrey saw the largest expansion of affordable family oriented housing in this period with public and independent school enrollments following suit. Of the five school districts, Surrey still has the lowest housing costs in terms of single family homes, townhouses, and apartments and perhaps more importantly the ratio to median income is the lowest. Benchmark Housing Prices by Type and City, September 201020,21
Benchmark Housing Prices by Type and City, September 2010
$0$200,000$400,000$600,000$800,000
$1,000,000$1,200,000$1,400,000$1,600,000$1,800,000
Detached $771,010 $519,025 $884,696 $509,974 $727,208 $1,631,322 $790,992
Attached/Townhomes $484,637 $392,212 $519,195 $321,747 $516,267 $768,997 $490,385
Apartment $350,941 $245,400 $341,446 $236,862 $326,387 $497,262 $388,373
Burnaby Coquitlam Richmond SurreyVancouver
EastVancouver
West
Greater Vancouver Average
Source: Real Estate Board of Greater Vancouver and Fraser Valley Real Estate Board22
17 Teranet-National Bank House Price Index, “House Price Index”, Retrieved from http://www.housepriceindex.ca/default.aspx?langue=EN 18 Metro Vancouver, “Household Income - Average Income and Median Income,1991-1996-2001-2006 Census”, Retrieved from http://www.metrovancouver.org/about/publications/Publications/KeyFacts-AverageHouseholdIncome1991-1996-2001-06.pdf 19 Demographia International Housing Affordability Survey: 2010, Retrieved from http://www.demographia.com/dhi.pdf 20 Estimated sale price of a benchmark property. Benchmarks represent a typical property within each market. 21 The City of Vancouver is divided into Vancouver East and Vancouver West. 22 Real Estate Board of Greater Vancouver. “MLSLink HPI for September 2010”, Retrieved from http://www.rebgv.org/housing-price-index?region=all&type=all&date=2010-09-01 and Fraser Valley Real Estate Board, “Monthly Statistics Package September 2010”, Retrieved from http://www.fvreb.bc.ca/statistics/Package%20201009.pdf
21
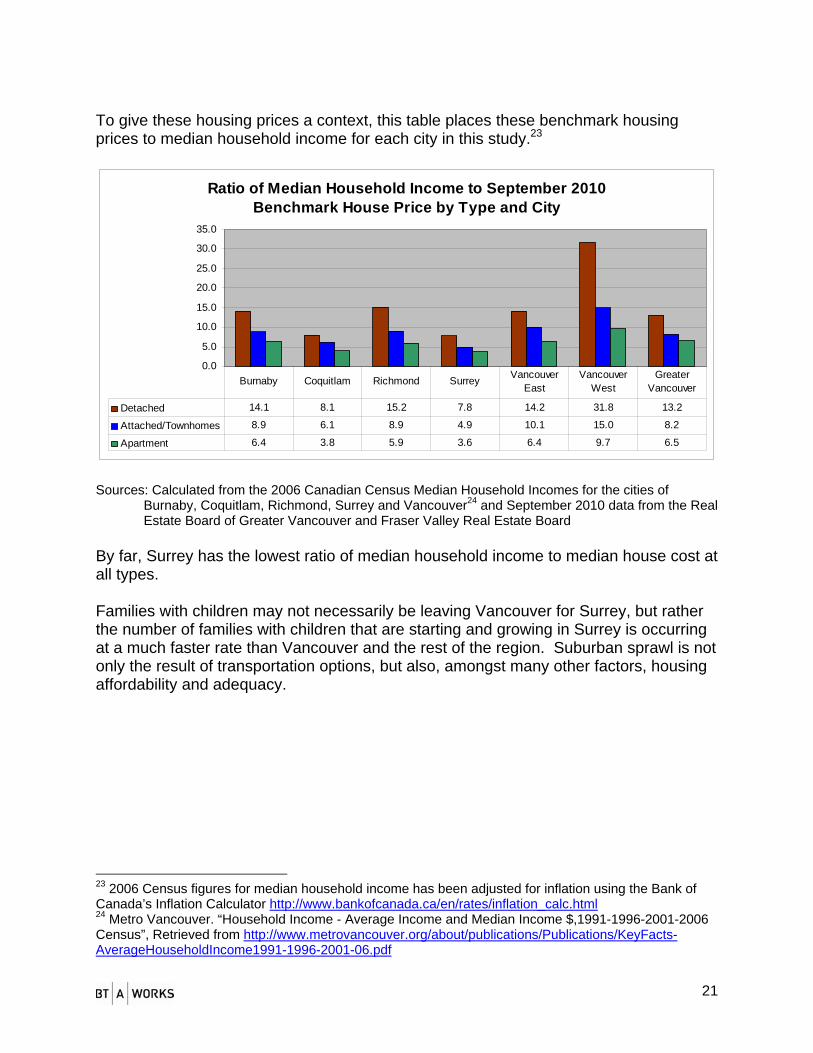
To give these housing prices a context, this table places these benchmark housing prices to median household income for each city in this study.23
Ratio of Median Household Income to September 2010 Benchmark House Price by Type and City
0.0
5.0
10.0
15.0
20.0
25.0
30.0
35.0
Detached 14.1 8.1 15.2 7.8 14.2 31.8 13.2
Attached/Townhomes 8.9 6.1 8.9 4.9 10.1 15.0 8.2
Apartment 6.4 3.8 5.9 3.6 6.4 9.7 6.5
Burnaby Coquitlam Richmond Surrey Vancouver East
Vancouver West
Greater Vancouver
Sources: Calculated from the 2006 Canadian Census Median Household Incomes for the cities of
Burnaby, Coquitlam, Richmond, Surrey and Vancouver24 and September 2010 data from the Real Estate Board of Greater Vancouver and Fraser Valley Real Estate Board
By far, Surrey has the lowest ratio of median household income to median house cost at all types. Families with children may not necessarily be leaving Vancouver for Surrey, but rather the number of families with children that are starting and growing in Surrey is occurring at a much faster rate than Vancouver and the rest of the region. Suburban sprawl is not only the result of transportation options, but also, amongst many other factors, housing affordability and adequacy.
23 2006 Census figures for median household income has been adjusted for inflation using the Bank of Canada’s Inflation Calculator http://www.bankofcanada.ca/en/rates/inflation_calc.html 24 Metro Vancouver. “Household Income - Average Income and Median Income $,1991-1996-2001-2006 Census”, Retrieved from http://www.metrovancouver.org/about/publications/Publications/KeyFacts-AverageHouseholdIncome1991-1996-2001-06.pdf
22
School Enrollment and its Implications for Urban Planning The issue of school closures due to declining enrollment (such as those presently being experienced in Vancouver) illustrates the consequences of a number of urban challenges. It also presents some potential opportunities towards increasing the livability, sustainability, and affordability of the region. What is seen as a surplus facility today, could easily be a critically needed community asset tomorrow. Primary and secondary schools have served as key “educational land reserves” for communities throughout the region. Many schools created in the first half of the 20th Century, particularly in Vancouver, have generous land endowments which, in many cases, are underutilized. Just as educational curriculum has changed since then, there is an opportunity to rethink schools and their existing and surrounding land uses as well as its relationships to the surrounding neighborhood. Given the expected regional population growth from 2.3 million in 2009 to 3.4 million by 2040, cities consider how to intensify and diversify their uses and users. As the original and still critical social network and community hubs for neighborhoods, schools are and can become crucial institutions and engines of cultural, economic, and social sustainability. Existing schools without the school population to support them could be re-used (leased or used for alternate city uses) in the short-medium term and then reclaimed for educational purposes when population increases warrant it. A distinct planning challenge for schools is the need for affordable family oriented housing in the region at all levels of density, particularly for those families on low and middle range incomes.25 Without a creative, concerted, and committed effort to create more affordable family oriented housing, unaffordable and family unfriendly housing may inadvertently magnify the effects of lower birth rates and further the decline of public school enrollment. While migration to the independent school system has had an effect on the decline public school enrollment, the lack of affordable family oriented housing will govern the vitality of both school systems. Without housing and development policies that balance sustainability, livability, and affordability, cities run the risk of hardwiring neighborhoods against young families with children through unaffordable housing and insufficient housing forms. A proliferation of small, predominantly studio or one bedroom units in current residential developments both as strata and rental will not resolve this affordable family oriented housing challenge. Housing initiatives like laneway housing and their typical locations in areas with rich family nurturing infrastructure like schools, parks, and community centres should be sized for family occupancy (typically two or more bedrooms). The family nurturing infrastructure from schools to community centres in this region is a remarkable public 25 High density housing is not necessarily family unfriendly as, in 1992, the City of Vancouver published, albeit under appreciated, series of guidelines on high-density housing for families with children. This document could be found here: http://vancouver.ca/commsvcs/guidelines/H004.pdf
23
legacy we have all inherited. Indeed, around family nurturing infrastructure, there is an opportunity to create family oriented development criteria just as there has been a parallel movement around transit oriented developments and its desire to leverage public transportation investments in terms of density. Conclusion The exact short and long term effects of demography, the availability of affordable and appropriate housing, and the fragmentation of primary and secondary education behind the growth and decline of the public school system remain an area for further research. This brief highlights some of the significant demographic, social, economic, and planning changes and challenges facing policy makers in response to declining and growing public and independent schools systems of Burnaby, Coquitlam, Richmond, Vancouver, and Surrey. This is a critical subject for not only those interested in the state of public education, but for those interested in the vitality and the ecological, social, and economic sustainability of our cities.
24
Special Thanks to: Bing Thom, Michael Heeney, Eileen Keenan, Hillary Meredith, and Helen Ritts at Bing Thom Architects Chris Hvid, Research Officer, Analysis and Reporting Group, British Columbia Ministry of Education The brief was generously sponsored by Bing Thom Architects About BTAworks BTAworks is the architectural and urban research and development division of Bing Thom Architects committed to promoting innovative and resilient design, dialogue, and good urban living. Disclaimer This information may be used and copies made for research, academic, policy or other non-commercial purposes. Proper attribution is required. Whilst every effort has been made to ensure the accuracy of the information supplied herein, BTAworks cannot be held responsible for any errors or omissions. Any errors or omissions are solely those of the author. Unless otherwise indicated, opinions expressed herein are those of the author and do not necessarily represent the corporate views of Bing Thom Architects or BTAworks.