Embed Size (px)
Citation preview

Public Opinions of Roadway Assets using Roadway Reviews and Focus Groups
NCDOT Project 2016-04
FHWA/NC/2016-04
August 2016
Chris Cunningham, PE Daniel Findley, PhD, PE Joy Davis, MPA Sarah Searcy, MA James Martin, PE Institute for Transportation Research & Education North Carolina State University

This page is intentionally blank.

North Carolina Department of Transportation Research Project No. 2016-04
Chris Cunningham, PE Daniel Findley, PhD, PE Joy Davis, MPA Sarah Searcy, MA James Martin, PE August 2016
Public Opinions of Roadway Assets using Roadway Reviews and Focus Groups
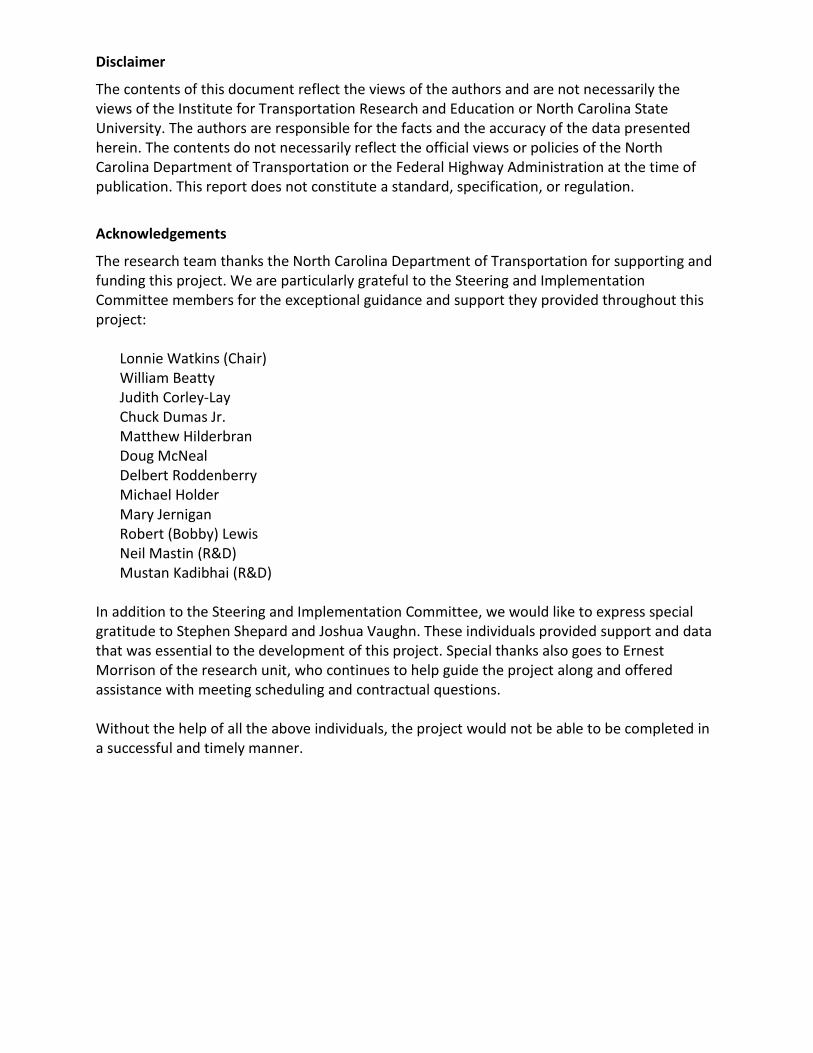
Technical Documentation Page
Report No. FHWA/NC/2016-04
Government Accession No.
Recipient’s Catalog No.
4. Title and Subtitle Public Opinions of Roadway Assets using Roadway Reviews and Focus Groups
Report Date August 30, 2016 Performing Organization Code
Author(s) Chris Cunningham, P.E.; Daniel J. Findley, Ph.D., P.E.; Joy Davis, MPA; Sarah Searcy, MA; James Martin, P.E.
Performing Organization Report No.
Performing Organization Name and Address Institute for Transportation Research and Education North Carolina State University Centennial Campus Box 8601, Raleigh, NC
Work Unit No. (TRAIS) Contract or Grant No.
Sponsoring Agency Name and Address North Carolina Department of Transportation Research and Analysis Group 104 Fayetteville Street Raleigh, North Carolina 27601
Type of Report and Period Covered Final Project Report August 2015 to July 2016 Sponsoring Agency Code 2016-04
Supplementary Notes:
Abstract: This project uses Roadway Reviews and Focus Groups to gain insight into how North Carolina residents assess and prioritize roadway assets. During a three-week period in November 2015, researchers from the Institute for Transportation Research and Education (ITRE) surveyed more than 350 residents in six locations across the state (Asheville, Burlington, Charlotte, Jonesville, Rocky Mount, and Wilmington) during both daytime and nighttime hours to determine expectations for the condition of NC roadways and to identify features that NC residents think are the most important on different types of roadways.
Key Words Maintenance, Survey, Roadway, Pavement, Public Opinion, Asphalt
Distribution Statement
Security Classif. (of this report) Unclassified
Security Classif. (of this page) Unclassified
No. of Pages 77
Price
Form DOT F 1700.7 (8-72) Reproduction of completed page authorized
Disclaimer
The contents of this document reflect the views of the authors and are not necessarily the views of the Institute for Transportation Research and Education or North Carolina State University. The authors are responsible for the facts and the accuracy of the data presented herein. The contents do not necessarily reflect the official views or policies of the North Carolina Department of Transportation or the Federal Highway Administration at the time of publication. This report does not constitute a standard, specification, or regulation.
Acknowledgements
The research team thanks the North Carolina Department of Transportation for supporting and funding this project. We are particularly grateful to the Steering and Implementation Committee members for the exceptional guidance and support they provided throughout this project:
Lonnie Watkins (Chair) William Beatty Judith Corley-Lay Chuck Dumas Jr. Matthew Hilderbran Doug McNeal Delbert Roddenberry Michael Holder Mary Jernigan Robert (Bobby) Lewis Neil Mastin (R&D) Mustan Kadibhai (R&D)
In addition to the Steering and Implementation Committee, we would like to express special gratitude to Stephen Shepard and Joshua Vaughn. These individuals provided support and data that was essential to the development of this project. Special thanks also goes to Ernest Morrison of the research unit, who continues to help guide the project along and offered assistance with meeting scheduling and contractual questions. Without the help of all the above individuals, the project would not be able to be completed in a successful and timely manner.

Executive Summary
Seeking to most effectively allocate limited resources, the North Carolina Department of Transportation initiated Research Project No. 2016-04: Public Opinions of Roadway Assets using Roadway Reviews and Focus Groups to gain insight into how North Carolina residents assess and prioritize roadway assets. During a three-week period in November 2015, researchers from the North Carolina State University Institute for Transportation Research and Education (ITRE) surveyed more than 350 residents across the state using an innovative methodology termed “Roadway Reviews.” The purpose of the Roadway Reviews was: (1) to determine expectations for the condition of NC roadways and (2) to identify features that NC residents think are the most important on different types of roadways in the areas of overall condition, safety, and appearance.
Unlike traditional methods which separate participants by distance or time, such as web, mail, and phone surveys, this study solicited citizen input face-to-face through surveys that asked residents about state-maintained roadways while they were driven on in real time. Study participants were asked to rate whether the condition of roadway features met their basic expectations, i.e. what they find personally acceptable, and to rank the importance of the features for primary, secondary, and interstate roadway types and for NC roadways overall. Eleven roadway features were examined, including pavement, signs, markings, lighting, and guardrails.
In 2011, North Carolina became one of the first states in the country to undertake such an effort. The present study expands on previous research to incorporate a more robust analysis and the addition of focus groups which provided further details about how and why citizens value roadway features as they do. To identify how public perceptions of roadways compare to the actual conditions of roadways, expectation ratings provided by survey respondents were compared to the physical condition of individual features on each route as measured by NCDOT and federal standards.
Condition of Roadways
Overall, residents were generally satisfied with the condition of major (interstate and primary) roadways. They were less satisfied with the condition of minor (secondary) roadways.
Among all roadways that were rated, the best rated highway features were:
• Condition of signs • Flow of traffic • Visibility of signage
The lowest rated features were:
• Width of outside (right) shoulders • Raised pavement markers • Width of inside (left) shoulders • Lighting

Features that Most Influence Perceptions of Roadway Condition, Safety, and Appearance
After traveling on a specific type of roadway, survey participants were asked to identify the roadway features that had the greatest impact on their perception of the 1) overall condition, 2) overall safety, and 3) overall appearance of the roadway.
The features that were considered most important for overall condition were:
• Roadway markings • Physical condition of the road surface • Smoothness/feel of the road surface
The features that were considered most important for overall safety were:
• Roadway markings • Physical condition of the road surface • Visibility of signs
The features that were considered most important for overall appearance were:
• Cleanliness • Mowing and trimming of areas other than along the guard rails • Physical condition of the road surface
Determining Acceptable Conditions for Various Roadway Features
NCDOT provided field-measured technical data for each of the roadway segments that were rated. To identify how public perceptions of roadways compare to the actual conditions of the roadways and determine what acceptable conditions are for each roadway feature that was rated, expectation ratings provided by survey respondents were compared to the physical condition of individual features on each route as measured by NCDOT and federal standards. Standards that generally met survey participant expectations were derived for the following features:
• Pavement Smoothness: All Roadways (IRI score of 100 or less) • Lane Width: Interstates (12 and 13 feet); Primary and Secondary Roadways (10 to 12
feet) • Shoulder Type: Interstates (Paved); Primary (Paved and Unpaved); Secondary (Paved and
Unpaved) • Raised Pavement Markers: Interstates (Average RPM failure of 16% or less); Primary
Roadways (Average RPM failure of 42% or less); Secondary Roadways (Average RPM failure of 63% or less)
• Litter: Interstates (107 pieces of litter or less); Primary Roadways (93 pieces of litter or less); Secondary Roadways (40 pieces of litter or less)

Table of Contents
Technical Documentation Page .................................................................................. iv
Disclaimer ................................................................................................................... v
Acknowledgements .................................................................................................... v
Executive Summary.................................................................................................... vi
List of Exhibits ............................................................................................................. ii
1. Introduction ........................................................................................................ 3 1.1. Background ...........................................................................................................3 1.2. Objectives..............................................................................................................3 1.3. Scope ....................................................................................................................4
2. Literature Review ................................................................................................ 4 2.1. Previous Study .......................................................................................................4 2.2. Roadway Features Examined ..................................................................................5
3. Methodology ....................................................................................................... 5 3.1. Sample Selection ...................................................................................................7
3.1.1. Routes .................................................................................................................... 7 3.1.2. Participants ........................................................................................................... 8
3.2. Condition Ratings ...................................................................................................8 3.3. Importance Ratings ................................................................................................9 3.4. Focus Groups .........................................................................................................9
4. Findings ............................................................................................................. 10 4.1. Sample Size and Characteristics ............................................................................ 10 4.2. Level of Confidence and Precision of the Data Collected ........................................ 11 4.3. Condition Ratings ................................................................................................. 12 4.4. Importance Ratings .............................................................................................. 13
4.4.1. Features that Most Influence Perceptions of Roadway Condition ..................... 13 4.4.2. Features that Most Influence Perceptions of Safety ........................................... 15 4.4.3. Features that Most Influence Perceptions of Appearance ................................. 16
4.5. Importance/Condition Matrices ........................................................................... 17 4.6. Summary of Areas of Concern .............................................................................. 20 4.7. Determining Acceptable Conditions for Various Highway Features ........................ 21
4.7.1. Pavement Smoothness ........................................................................................ 21 4.7.2. Lane Width .......................................................................................................... 23 4.7.3. Shoulder Type ...................................................................................................... 25 4.7.4. Raised Pavement Markers (RPMs) ...................................................................... 26 4.7.5. Litter .................................................................................................................... 28 4.7.6. Physical Condition of Road .................................................................................. 30 4.7.7. Roadway Markings .............................................................................................. 31 4.7.8. Lighting ................................................................................................................ 32 4.7.9. Sign Visibility ........................................................................................................ 33 4.7.10. Participant Expectation Ratings Sample Sizes ..................................................... 34
4.8. Focus Group Results ............................................................................................. 34 4.9. Overall Quality of Roadways in North Carolina ..................................................... 38

NCDOT 2016-04 Project Report
i
5. Conclusions ....................................................................................................... 38
6. Future Research ................................................................................................ 39
7. References ........................................................................................................ 39
8. Appendices ....................................................................................................... 40 8.1. Appendix A: Site Route Maps and Segment Data .................................................. 40
8.1.1. Asheville Route .................................................................................................... 40 8.1.2. Burlington Route ................................................................................................. 41 8.1.3. Charlotte Route ................................................................................................... 42 8.1.4. Jonesville Route ................................................................................................... 43 8.1.5. Rocky Mount Route ............................................................................................. 44 8.1.6. Wilmington Route ............................................................................................... 45 8.1.7. All Route Segment Descriptions, IRI Scores, and Average Participant Perceived Pavement Smoothness Ratings ............................................................................................ 46
8.2. Appendix B: Survey Condition Ratings Example .................................................... 54 8.3. Appendix C: Survey Importance Ratings Example .................................................. 55 8.4. Appendix D: Survey Importance Ratings Ranking Example .................................... 56 8.5. Appendix E: Survey Discussion Questions Section ................................................. 57 8.6. Appendix F: Focus Group Presentation Example ................................................... 58 8.7. Appendix G: Focus Group Written Survey Example ............................................... 59 8.8. Appendix H: Expectation Ratings for Mountain Region.......................................... 60 8.9. Appendix I: Expectation Ratings for Piedmont Region ........................................... 62 8.10. Appendix J: Expectation Ratings for Coastal Region .............................................. 64 8.11. Appendix K: Importance Ratings for Mountain Region .......................................... 66 8.12. Appendix L: Importance Ratings for Piedmont Region ........................................... 68 8.13. Appendix M: Importance Ratings for Coastal Region ............................................. 70

NCDOT 2016-04 Project Report
ii
List of Exhibits Exhibit 1: Map of Roadway Review Locations in North Carolina .................................................... 6 Exhibit 2: Demographic Summary of the Study Sample ................................................................ 11 Exhibit 3: Number of Observations by Location and Roadway Type ............................................ 12 Exhibit 4: Mean Condition Ratings for Roadway Features by Roadway Type ............................... 13 Exhibit 5: Perceived Importance of Roadway Features for Overall Condition by Roadway Type 14 Exhibit 6: Perceived Importance of Roadway Features for Feeling of Safety by Roadway Type .. 15 Exhibit 7: Perceived Importance of Roadway Features for Appearance by Roadway Type ......... 16 Exhibit 8: NCDOT Highway Feature Performance Matrix for Interstates...................................... 18 Exhibit 9: NCDOT Highway Performance Matrix for Primary Roadways....................................... 19 Exhibit 10: NCDOT Highway Feature Performance Matrix for Secondary Roadways ................... 20 Exhibit 11: NCDOT Measure IRI versus Average Participant Perceived Pavement Smoothness .. 22 Exhibit 12: Participant Expectation Ratings for Smoothness of Road Surface by Roadway Type. 23 Exhibit 13: Participant Expectation Ratings for Lane Width in Feet by Roadway Type ................ 24 Exhibit 14: Participant Expectation Ratings for Shoulder Type by Roadway Type ........................ 25 Exhibit 15: Average RPM Failure (%) to Meet Basic Expectations by Roadway Type ................... 26 Exhibit 16: Participant Expectation Ratings for RPMs by Roadway Type ...................................... 27 Exhibit 17: Average Number of Litter Pieces to Meet Basic Expectations by Roadway Type ....... 28 Exhibit 18: Participant Expectation Ratings for Litter by Roadway Type ...................................... 29 Exhibit 19: Expectation Ratings for Physical Condition of Road by Roadway Type ...................... 30 Exhibit 20: Participant Expectation Ratings for Roadway Markings by Roadway Type ................ 31 Exhibit 21: Participant Expectation Ratings for Lighting by Roadway Type .................................. 32 Exhibit 22: Participant Expectation Ratings for Sign Visibility by Roadway Type .......................... 33 Exhibit 23: Participant Expectation Ratings Sample Sizes ............................................................. 34 Exhibit 24: Focus Group Roadway Feature Evaluation Results ..................................................... 36 Exhibit 25: Roadway Features Listed as Important by Focus Groups ........................................... 37 Exhibit 26: Survey Results for Overall Quality of Roadways in North Carolina ............................. 38
NCDOT 2016-04 Project Report
3
1. Introduction
During a three-week period in November 2015, researchers from NC State University’s Institute for Transportation Research and Education (ITRE) surveyed residents at six locations across the state using an innovative methodology. This method, which was first piloted in North Carolina by ITRE in 2011, is called “Roadway Reviews.” In contrast with traditional customer survey methods like web-based and phone surveys, Roadway Reviews engage roadway users face-to-face through surveys that asked residents about state-maintained roadways while they were driven on in real time.
North Carolina is one of only a few states in the country that has conducted this type of study. Both the 2011 study and the present study were initiated with the purpose of identifying how citizens’ opinions about roadway features compare to the actual measured “ground truth” conditions of those features and the variables that influence these personal perceptions. Compared to the previous study, the present study incorporates a more robust analysis of perceived versus measured conditions as well as the addition of focus groups. Findings from this study can be used to inform decisions related to resource allocation and asset maintenance prioritization.
1.1. Background
Currently, the NCDOT has a robust system for measuring the conditions of roadway assets and maintaining them accordingly. However, to most effectively allocate resources, it is vital that transportation agencies like the NCDOT incorporate stakeholder feedback into their asset management decisions. For this reason, the NCDOT recently began integrating resident feedback from an annual statewide transportation customer service survey administered online, via mail, and over the phone into their asset management practices.
While these surveys continue to offer valuable insight into customer opinions about an array of NCDOT services, they provide minimal information about which assets roadway users prioritize and the “why” behind their opinions. Knowing these details are important because, while quantitative information like that gleaned through the NCDOT’s asset management measurement systems is valuable for determining when assets may need improvements, in-depth qualitative feedback from customers can better help the agency identify which assets should be improved first given limited funds and human resources.
Through this study, the NCDOT sought to gain more comprehensive opinions from North Carolina residents about roadway assets.
1.2. Objectives
As North Carolina’s population continues to grow, the usage of roadways is increasing and the needs of roadway users are increasing. In spite of this growth, however, the human and financial resources available to manage roadway assets continues to be limited. As such, the Roadway Reviews project was initiated to enhance the asset management decisions by NCDOT, with the purpose of:
NCDOT 2016-04 Project Report
4
1) Objectively determine expectations that North Carolina residents have for North Carolina’s roadways
2) Identify roadway features that residents believe are most important on different types of roadways
1.3. Scope
This study was designed to capture the wide range of North Carolina’s roadway features, geography, and residents. Research was purposefully conducted in each of North Carolina’s three geographic regions: 1) Mountain, 2) Piedmont, and 3) Coastal. Study sites included six locations selected to reflect the state’s diverse economic conditions and geographic areas: Asheville, Charlotte, Rocky Mount, Jonesville, Burlington, and Wilmington. These are the same locations that were chosen for the 2011 study.
Similarly, this project focused on examining opinions about varied roadway features and roadway types. Survey and focus group questions revolved around eleven roadway features commonly maintained by the NCDOT. The routes surveyed by participants included a mixture of primary roadways, secondary roadways, and interstates. Routes were selected to ensure that each route incorporated an array of different types of facilities in various conditions.
ITRE researchers met with NCDOT staff numerous times to ensure that project objectives, key outcomes, data to be collected, and the methodology used to collect and analyze data aligned with the goals of the project.
2. Literature Review
In the absence of customer feedback, transportation agencies often rely on quantitative data and legacy processes to inform asset management plans. Integrating data on customer opinions into resource management practices can enable transportation agencies to more efficiently allocate and prioritize public resources (Guirao, García-Pastor, and López-Lambas 2016). This study utilizes the approach explored by Hu (2010), which examines quality of service in terms of the variance between perceived and adequate quality.
2.1. Previous Study
Similar to this study, the 2011 Roadway Reviews study was designed to assess the expectations residents have for specific highway features and to identify the level of importance that residents place on each of these features. As with the 2011 study, the present study is a collaboration between ITRE and the ETC Institute, a market research firm specializing in community-based research for government organizations. However, in 2011, ETC, who developed the Roadway Reviews method, led the project, while the second time around ITRE led the study with ETC providing only participant recruitment services.

NCDOT 2016-04 Project Report
5
While similar to the 2011 study, the present study expanded the scope of the research with the addition of focus groups and refined data analysis strategies. The team made efforts to select roadway features similar to those collected in the previous study, allowing for before and after comparisons. Lessons learned from the first study were incorporated and some procedures were adjusted accordingly.
2.2. Roadway Features Examined
Public opinion about eleven roadway features were examined through this study. In both 2011 and 2015, ITRE researchers worked closely with the NCDOT to ensure that the surveys and focus group sessions included questions about the features that NCDOT was most interested in evaluating. These features included:
• Roadway markings • Raised pavement markers • Lighting • Smoothness and physical condition of road surface • Width of lanes • Flow of traffic • Visibility and condition of signs • Width of inside and outside shoulders • Shoulder type • Mowing & trimming along guard rails and other areas • Cleanliness (lack of litter/debris)
Features were grouped by type to enhance participant understanding. For example mowing- and litter-related assets were grouped into a category called “Vegetation and Litter.” More information is available in the following section of this report.
3. Methodology
Wan et al. (2016) note that a customer’s level satisfaction is combination of their expectations and perceptions. Accordingly, this unique Roadway Review methodology employed a mixture of small survey and focus groups to gauge both the expectations of roadway users and their perceptions about the importance of roadway features. Three, two-hour study sessions were held at each of the six locations across the state. A map of the study locations is provided in Exhibit 1. The session times were:
Session 1: 11am - 1pm
Session 2: 4pm - 6pm
Session 3: 7pm - 9pm

NCDOT 2016-04 Project Report
6
Exhibit 1: Map of Roadway Review Locations in North Carolina
The time for Session 3 was selected so that participants could evaluate the roadway features in nighttime conditions. This was particularly useful for raised pavement markings, signs, and roadway lighting.
At each session at each location, approximately 15-20 residents participated in the roadway surveys and approximately 8-10 residents participated in a focus group in lieu of participating in the roadway survey. For all sites, at least one focus group was held during at least one of these sessions at the same time as roadway surveys. Ultimately, the team aimed for 50 survey participants and 10 focus group participants at each location, with a goal of 360 participants overall.
Participants met with researchers in a conference room at a hotel in a location near the survey route. During each session, survey participants were driven in one of four 15-passenger vans, each with their own driver and facilitator. Participants were divided into 3 or 4 approximately equal groups of 5-7 people per van to help ensure that they could adequately see the roadway features that they were asked to rate.
Survey participants were oriented to the study, associated terminology, and their roles to start of each session. Focus group participants were held in a separate area to avoid any bias that could be caused by the orientation information. Once survey vans departed, focus groups were conducted in the hotel conference room.
Asheville
Jonesville Burlington
Charlotte
Rocky Mount
Wilmington

NCDOT 2016-04 Project Report
7
The first section of each route was used as practice section to ensure that the participants understood how to complete the survey form. Once all participants indicated that they understood how to complete the survey, the driver began the survey route and a trained facilitator helped identify features to be rated on each roadway segment. Through the survey process, the facilitator provided guidance to the participants and ensured that the survey forms were completed properly.
Survey participants were asked to rate the conditions of the roadway segments they traveled based on whether features met their basic expectations based on what they find personally acceptable (Appendix B). Participants were also asked to rate and rank the importance of the features (Appendix C; Appendix D), including pavement, signs, markings, lighting, and guardrails, as well as answer four “end of course” discussion questions (Appendix E). Once the last section of the route was been rated, participants returned to the starting location to submit their surveys and collect a $50 gift card that was offered as an incentive for their participation.
3.1. Sample Selection
3.1.1. Routes
To the extent possible, the routes used in this study were conducted along similar or the same roadways used in the previous 2011 study. Routes were selected to include adequately diverse features, in particular a balanced sample of IRI, or International Roughness Index, scores for pavement. Prior to the development of the updated routes, the team conducted an on-site visit to each of the locations to physically review each route to ensure they were suitable for the study and include the majority of the roadway features desired. Video of each route was also captured using a vehicle mounted camera to allow further off-site inspection of routes.
The NCDOT captured “ground truth” data on the physical condition of each route. Based on the actual conditions observed at each location and input from the NCDOT, the initial routes were modified to ensure routes included a representative sample of roadway features and conditions from across the state. For example, initial investigations revealed that one proposed route needed to be reconfigured because multiple bridges on the route were under construction. In cases where early assessments showed that a given route lacked IRI diversity, for example a lack of roadway segments labeled “Poor,” ITRE collaborated with the NCDOT to identify nearby segments that could be integrated into the route to increase the range of IRI conditions for a site.
Each route consisted of around 10-15 roadway sections. Online and GIS maps were developed for each route. These maps can be used for further data analysis in the future. Routes for each site were finalized once routes with sufficient asset and type diversity were agreed upon by ITRE and the NCDOT. These routes were incorporated into the unique surveys for each of the sites. Route maps and a summary of route segment attributes are provided in Appendix A.
NCDOT 2016-04 Project Report
8
3.1.2. Participants
A total of 358 citizens participated in the 2015 Roadway Reviews study. This sample size includes 296 residents surveyed in the vans along the routes, 55 focus group participants, and 7 community leaders and legislators. Study participants were recruited via phone calls administered and managed by the ETC Institute.
ETC recruited a participant pool representative of the general adult population in North Carolina in addition to contacting a small sample of local leaders residing near the six study sites. The sample of residents was recruited via a list of public phone numbers for residents with 50 miles of each site location. Using a contact list provided by the NCDOT, a similar method was used to recruit community leaders, such as local and state elected officials, representing the areas surrounding the study sites. Emails and mailed packets with more details about the study were sent to those who expressed an interest in participating.
Initially, residents were randomly selected from the list and were called by an ETC recruiter. However, ETC transitioned to a more targeted sampling approach mid-way through the recruitment process to ensure that participants were indeed representative of North Carolina’s population. For example, extra effort was made to recruit participants under 40 years of age because ETC found that younger residents were less likely to answer their phone and were less likely to agree to participate in the study.
As a recruitment tool, and to compensate participants for their personal time and travel to the site, recruiters informed potential participants that they would receive $50 in Visa Debit cards. In addition to the financial incentive, lunch was provided for participants during Session 1 and snacks provided for Sessions 2 and 3. Recruiters asked participants to commit to attend one of the three, two-hour study sessions.
In accordance with university and NCDOT research standards, this studied applied for and received approval from the North Carolina State University Internal Review Board (IRB). The study procedures approved by the IRB were strictly followed, including ensuring that each participant explicitly consented to their involvement in the study. Such practices helped ease any participant concern by assuring participant anonymity and the confidential maintenance of any personal, identifiable information that may be collected during this project.
3.2. Condition Ratings
This study aimed to capture the expectations that residents have for NCDOT-maintained roadway assets by asking them to rated specific segment features on a five-point scale. In the Condition Ratings sections of the roadway surveys, participants rated eleven features such as “lighting” and “mowing and trimming along guardrails” for each route segment of interest compared to how they aligned with their basic expectations. Each feature was rated by circling the appropriate number that corresponded to a scale ranging from “Greatly Exceeds Expectations” (5) to “Far Below Expectations” (1), as shown in Appendix B. Study facilitators made a significant effort to explain to participants that “basic expectation” means the minimum condition that they would personally expect for a given asset.
NCDOT 2016-04 Project Report
9
For example, if as participant expected that a roadway should have less litter than what was present they may have rated the condition of “Cleanliness (lack of litter/debris)” as “1” or “2” because it did not meet their expectations. Alternatively, if a feature was cleaner than they expected they may have felt that it exceeded their expectations and may have rated it as “4” or “5.”
3.3. Importance Ratings
Upon completion of a series of Condition Ratings for a group of segments of the same roadway type (primary, secondary, or interstate), roadway survey participants were asked to fill out an Importance Rating section on the corresponding segments. Importance Rating sections were designed to identify how important each of the eleven features were to the participant for a given roadway type (primary, secondary, or interstate) similar to the section of roadway just rated for conditions. Accordingly, respondents were asked to “Rate how important the following features are to you when traveling on the type of highway you just finished rating.”
Participants rated the importance of each of the features on a five-point scale, from “Extremely Important” (5) to “Not Important” (1) by circling the number that corresponded with their importance rating, as shown in Appendix C.
Then, participants identified which attributes were most important regarding their perceptions of 1) Overall Condition, 2) Safety, and 3) Appearance for the given roadway type. For this section, respondents ranked the three most important features that influenced their preceptions for each of the three categories by listing the letter that corresponded with the feature they found important, provided in Appendix D. For example, for “Safety,” a participant may have written the letters that indicated that they ranked lighting first, visibility of signs second, and width of lanes third in importance.
Both of these Importance Rating sections were created to better idenify how residents prioritize roadway features and how these features influence their perceptions while traveling on roadways. Once the route and survey were completed, participants were asked to answer “end of course” discussion questions, as shown in Appendix E.
Throughout all roadway survey sections, participants were given the opporunity to provide explanatory written comments and feedback.
3.4. Focus Groups
One key addition to the present study compared to the 2011 study was the integration of focus groups. At each of the six sites, between 6 and 15 residents were asked to participate in focus groups instead of the roadway surveys. These individuals were shown video footage of roadway segments as well as photos of select features in various conditions and were asked to provide feedback about their expectations and perceptions regarding the features they viewed.

NCDOT 2016-04 Project Report
10
At the start of each session, video footage of roadways during nighttime and in daylight were shown. Each video included a selection of roadway features in various conditions. Participants were asked to describe what they liked and disliked about the features in each video.
After each section of video, participants were shown photos of five different roadway features in various conditions. These features included signage, road surface, striping, pavement markings, and mowing along guardrails, as shown in Appendix F. For each roadway feature, participants selected the photos that they found acceptable based on their expectations for the given feature. Participants first marked the number of each photo they found acceptable with an “X” on a written survey, as shown in Appendix G, and then explained their selection and the reasoning behind it in a group discussion.
Following the discussions on all five roadway features, participants were asked to identify the three roadway features they found most important by writing them on the written survey and then discussing their choices with the rest of the focus group, as shown below in Appendix G.
Focus groups were added to the 2015 study framework for two primary reasons. First, they allowed researchers to control for the variance in roadway conditions present at each study location by presenting the same videos and photos of roadway features at all six locations. Second, they allowed researchers to more thoroughly capture the “why” of perceptions because the focus group environment provided an opportunity for facilitators to ask follow up questions that added context to participant responses. Ultimately, pairing the focus group method with that of the roadway survey provided a more complete understanding of the data which the NCDOT can use to guide resource allocation decisions.
4. Findings
4.1. Sample Size and Characteristics
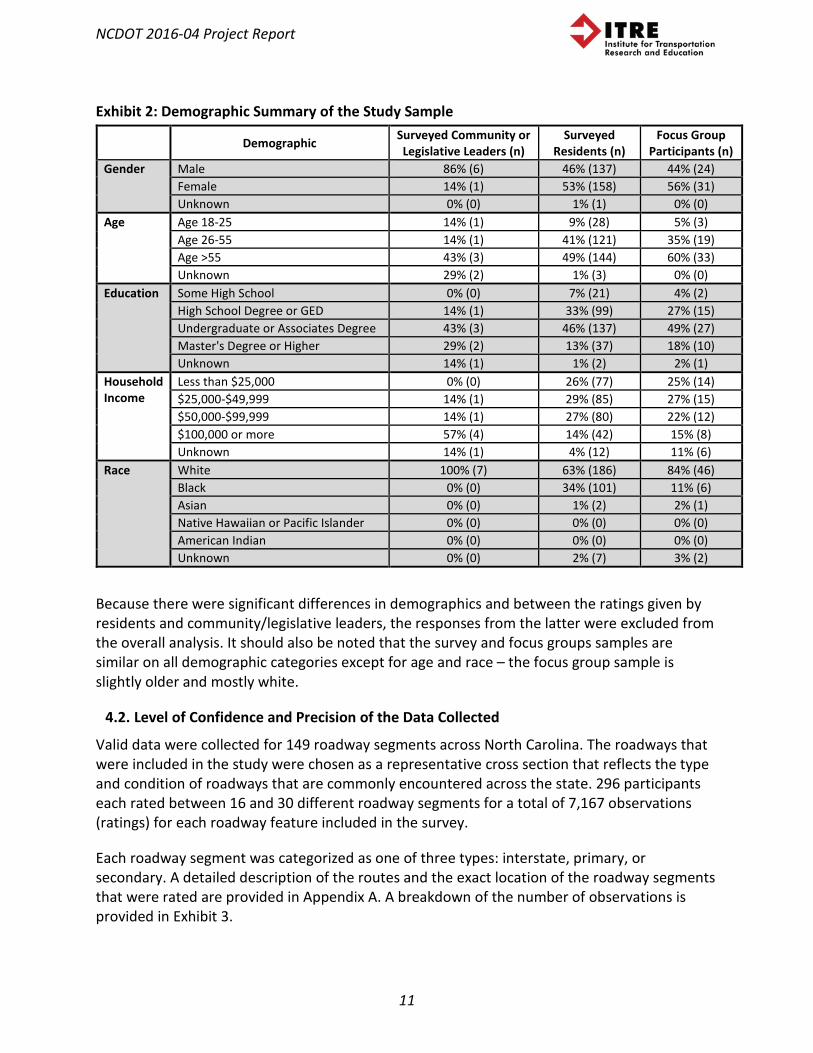
A total of 358 people participated in the study. Participants were randomly recruited to ensure statistical validity. The majority of participants (303) were assigned to complete the roadway survey. Most of the roadway survey participants (296) were residents (from within 50 miles of a study location), while a small subset (7) were community or legislative leaders. The remaining participants (55) completed the focus group exercise. Exhibit 2 provides a demographic summary of the study sample.
NCDOT 2016-04 Project Report
11
Exhibit 2: Demographic Summary of the Study Sample Demographic Surveyed Community or
Legislative Leaders (n) Surveyed
Residents (n) Focus Group
Participants (n) Gender Male 86% (6) 46% (137) 44% (24)
Female 14% (1) 53% (158) 56% (31) Unknown 0% (0) 1% (1) 0% (0)
Age Age 18-25 14% (1) 9% (28) 5% (3) Age 26-55 14% (1) 41% (121) 35% (19) Age >55 43% (3) 49% (144) 60% (33) Unknown 29% (2) 1% (3) 0% (0)
Education Some High School 0% (0) 7% (21) 4% (2) High School Degree or GED 14% (1) 33% (99) 27% (15) Undergraduate or Associates Degree 43% (3) 46% (137) 49% (27) Master's Degree or Higher 29% (2) 13% (37) 18% (10) Unknown 14% (1) 1% (2) 2% (1)
Household Income
Less than $25,000 0% (0) 26% (77) 25% (14) $25,000-$49,999 14% (1) 29% (85) 27% (15) $50,000-$99,999 14% (1) 27% (80) 22% (12) $100,000 or more 57% (4) 14% (42) 15% (8) Unknown 14% (1) 4% (12) 11% (6)
Race White 100% (7) 63% (186) 84% (46) Black 0% (0) 34% (101) 11% (6) Asian 0% (0) 1% (2) 2% (1) Native Hawaiian or Pacific Islander 0% (0) 0% (0) 0% (0) American Indian 0% (0) 0% (0) 0% (0) Unknown 0% (0) 2% (7) 3% (2)
Because there were significant differences in demographics and between the ratings given by residents and community/legislative leaders, the responses from the latter were excluded from the overall analysis. It should also be noted that the survey and focus groups samples are similar on all demographic categories except for age and race – the focus group sample is slightly older and mostly white.
4.2. Level of Confidence and Precision of the Data Collected
Valid data were collected for 149 roadway segments across North Carolina. The roadways that were included in the study were chosen as a representative cross section that reflects the type and condition of roadways that are commonly encountered across the state. 296 participants each rated between 16 and 30 different roadway segments for a total of 7,167 observations (ratings) for each roadway feature included in the survey.
Each roadway segment was categorized as one of three types: interstate, primary, or secondary. A detailed description of the routes and the exact location of the roadway segments that were rated are provided in Appendix A. A breakdown of the number of observations is provided in Exhibit 3.

NCDOT 2016-04 Project Report
12
Exhibit 3: Number of Observations by Location and Roadway Type
Location Number of Observations All Roadways Included in Study Asheville 796 Burlington 1096 Charlotte 1391 Jonesville 1546 Rocky Mount 1396 Wilmington 942
Total 7167 Level of Confidence +/-1.2% Precision 95%
Interstate Asheville 158 Burlington 152 Charlotte 103 Jonesville 207 Rocky Mount 54 Wilmington 177
Total 851 Level of Confidence +/-3.4% Precision 95%
Primary Asheville 399 Burlington 447 Charlotte 1029 Jonesville 562 Rocky Mount 806 Wilmington 589
Total 3832 Level of Confidence +/-1.6% Precision 95%
Secondary Asheville 239 Burlington 497 Charlotte 259 Jonesville 777 Rocky Mount 536 Wilmington 176
Total 2484 Level of Confidence +/-2.0% Precision 95%
4.3. Condition Ratings
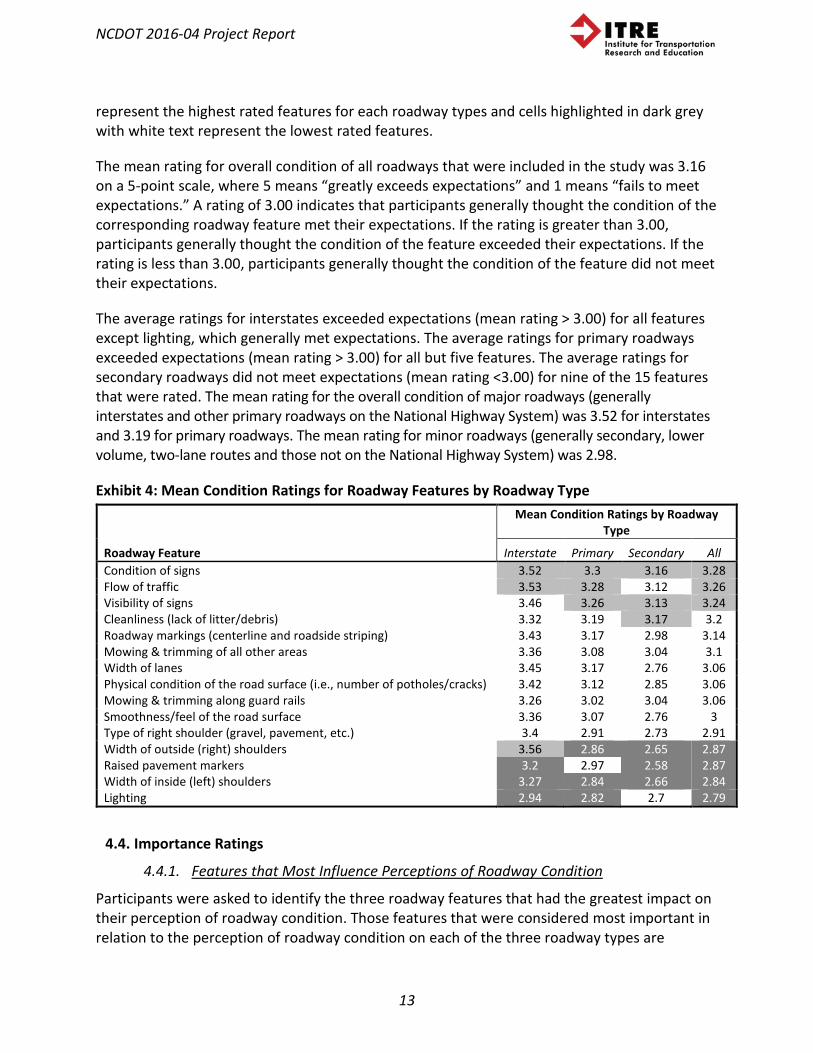
From the sample observations, the mean condition rating was calculated for each roadway feature presented in the survey. The mean condition ratings for roadway features on each of the three roadway types that were rated are provided in Exhibit 4. Cells highlighted in light grey
NCDOT 2016-04 Project Report
13
represent the highest rated features for each roadway types and cells highlighted in dark grey with white text represent the lowest rated features.
The mean rating for overall condition of all roadways that were included in the study was 3.16 on a 5-point scale, where 5 means “greatly exceeds expectations” and 1 means “fails to meet expectations.” A rating of 3.00 indicates that participants generally thought the condition of the corresponding roadway feature met their expectations. If the rating is greater than 3.00, participants generally thought the condition of the feature exceeded their expectations. If the rating is less than 3.00, participants generally thought the condition of the feature did not meet their expectations.
The average ratings for interstates exceeded expectations (mean rating > 3.00) for all features except lighting, which generally met expectations. The average ratings for primary roadways exceeded expectations (mean rating > 3.00) for all but five features. The average ratings for secondary roadways did not meet expectations (mean rating <3.00) for nine of the 15 features that were rated. The mean rating for the overall condition of major roadways (generally interstates and other primary roadways on the National Highway System) was 3.52 for interstates and 3.19 for primary roadways. The mean rating for minor roadways (generally secondary, lower volume, two-lane routes and those not on the National Highway System) was 2.98.
Exhibit 4: Mean Condition Ratings for Roadway Features by Roadway Type
Mean Condition Ratings by Roadway
Type
Roadway Feature Interstate Primary Secondary All Condition of signs 3.52 3.3 3.16 3.28 Flow of traffic 3.53 3.28 3.12 3.26 Visibility of signs 3.46 3.26 3.13 3.24 Cleanliness (lack of litter/debris) 3.32 3.19 3.17 3.2 Roadway markings (centerline and roadside striping) 3.43 3.17 2.98 3.14 Mowing & trimming of all other areas 3.36 3.08 3.04 3.1 Width of lanes 3.45 3.17 2.76 3.06 Physical condition of the road surface (i.e., number of potholes/cracks) 3.42 3.12 2.85 3.06 Mowing & trimming along guard rails 3.26 3.02 3.04 3.06 Smoothness/feel of the road surface 3.36 3.07 2.76 3 Type of right shoulder (gravel, pavement, etc.) 3.4 2.91 2.73 2.91 Width of outside (right) shoulders 3.56 2.86 2.65 2.87 Raised pavement markers 3.2 2.97 2.58 2.87 Width of inside (left) shoulders 3.27 2.84 2.66 2.84 Lighting 2.94 2.82 2.7 2.79
4.4. Importance Ratings
4.4.1. Features that Most Influence Perceptions of Roadway Condition
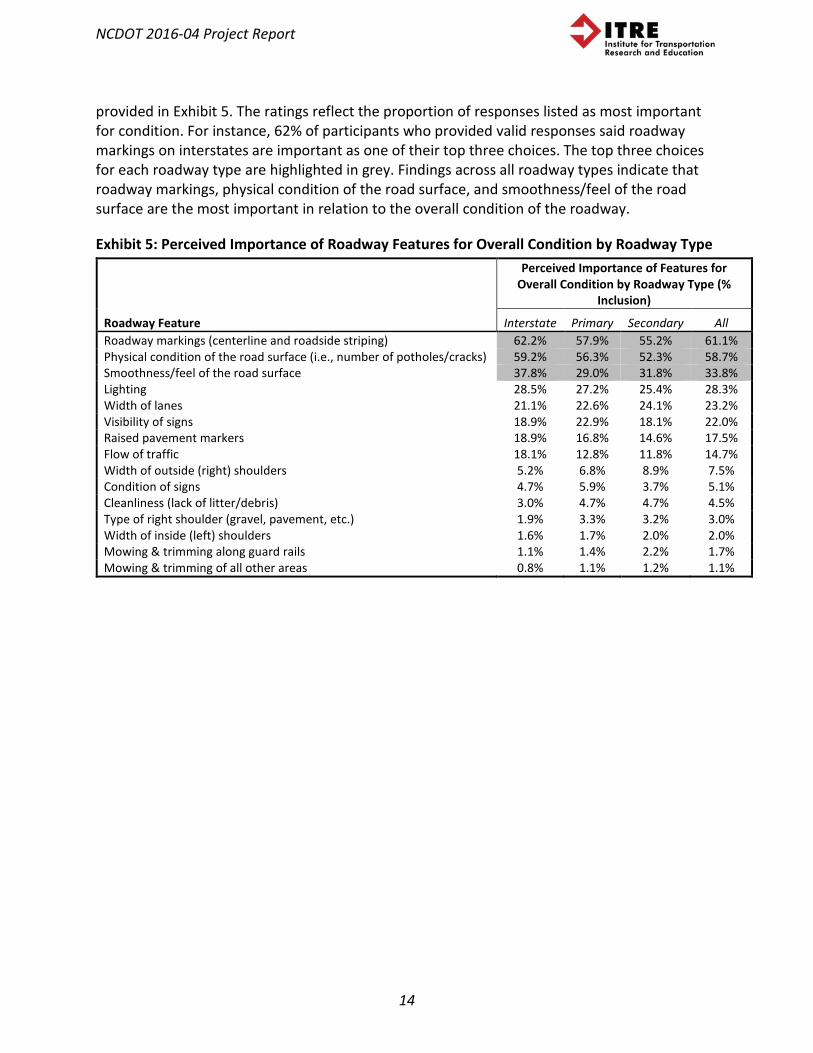
Participants were asked to identify the three roadway features that had the greatest impact on their perception of roadway condition. Those features that were considered most important in relation to the perception of roadway condition on each of the three roadway types are
NCDOT 2016-04 Project Report
14
provided in Exhibit 5. The ratings reflect the proportion of responses listed as most important for condition. For instance, 62% of participants who provided valid responses said roadway markings on interstates are important as one of their top three choices. The top three choices for each roadway type are highlighted in grey. Findings across all roadway types indicate that roadway markings, physical condition of the road surface, and smoothness/feel of the road surface are the most important in relation to the overall condition of the roadway.
Exhibit 5: Perceived Importance of Roadway Features for Overall Condition by Roadway Type
Perceived Importance of Features for Overall Condition by Roadway Type (%
Inclusion)
Roadway Feature Interstate Primary Secondary All Roadway markings (centerline and roadside striping) 62.2% 57.9% 55.2% 61.1% Physical condition of the road surface (i.e., number of potholes/cracks) 59.2% 56.3% 52.3% 58.7% Smoothness/feel of the road surface 37.8% 29.0% 31.8% 33.8% Lighting 28.5% 27.2% 25.4% 28.3% Width of lanes 21.1% 22.6% 24.1% 23.2% Visibility of signs 18.9% 22.9% 18.1% 22.0% Raised pavement markers 18.9% 16.8% 14.6% 17.5% Flow of traffic 18.1% 12.8% 11.8% 14.7% Width of outside (right) shoulders 5.2% 6.8% 8.9% 7.5% Condition of signs 4.7% 5.9% 3.7% 5.1% Cleanliness (lack of litter/debris) 3.0% 4.7% 4.7% 4.5% Type of right shoulder (gravel, pavement, etc.) 1.9% 3.3% 3.2% 3.0% Width of inside (left) shoulders 1.6% 1.7% 2.0% 2.0% Mowing & trimming along guard rails 1.1% 1.4% 2.2% 1.7% Mowing & trimming of all other areas 0.8% 1.1% 1.2% 1.1%
NCDOT 2016-04 Project Report
15
4.4.2. Features that Most Influence Perceptions of Safety
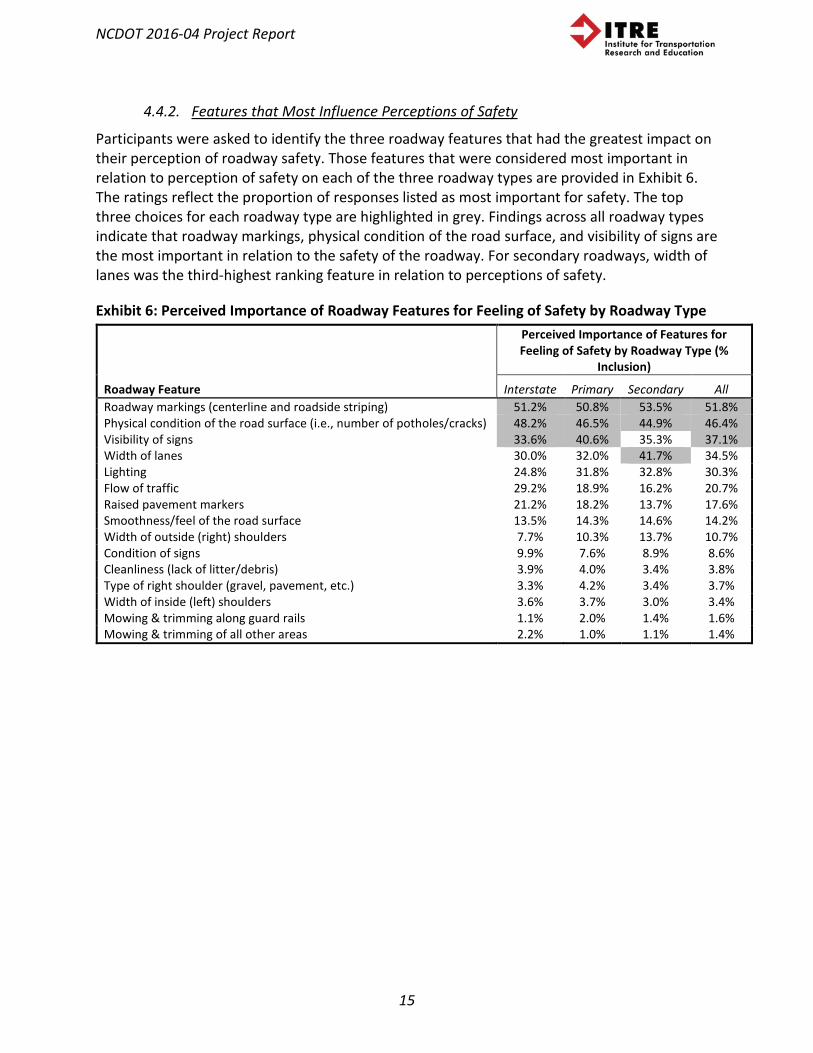
Participants were asked to identify the three roadway features that had the greatest impact on their perception of roadway safety. Those features that were considered most important in relation to perception of safety on each of the three roadway types are provided in Exhibit 6. The ratings reflect the proportion of responses listed as most important for safety. The top three choices for each roadway type are highlighted in grey. Findings across all roadway types indicate that roadway markings, physical condition of the road surface, and visibility of signs are the most important in relation to the safety of the roadway. For secondary roadways, width of lanes was the third-highest ranking feature in relation to perceptions of safety.
Exhibit 6: Perceived Importance of Roadway Features for Feeling of Safety by Roadway Type
Perceived Importance of Features for Feeling of Safety by Roadway Type (%
Inclusion)
Roadway Feature Interstate Primary Secondary All Roadway markings (centerline and roadside striping) 51.2% 50.8% 53.5% 51.8% Physical condition of the road surface (i.e., number of potholes/cracks) 48.2% 46.5% 44.9% 46.4% Visibility of signs 33.6% 40.6% 35.3% 37.1% Width of lanes 30.0% 32.0% 41.7% 34.5% Lighting 24.8% 31.8% 32.8% 30.3% Flow of traffic 29.2% 18.9% 16.2% 20.7% Raised pavement markers 21.2% 18.2% 13.7% 17.6% Smoothness/feel of the road surface 13.5% 14.3% 14.6% 14.2% Width of outside (right) shoulders 7.7% 10.3% 13.7% 10.7% Condition of signs 9.9% 7.6% 8.9% 8.6% Cleanliness (lack of litter/debris) 3.9% 4.0% 3.4% 3.8% Type of right shoulder (gravel, pavement, etc.) 3.3% 4.2% 3.4% 3.7% Width of inside (left) shoulders 3.6% 3.7% 3.0% 3.4% Mowing & trimming along guard rails 1.1% 2.0% 1.4% 1.6% Mowing & trimming of all other areas 2.2% 1.0% 1.1% 1.4%

NCDOT 2016-04 Project Report
16
4.4.3. Features that Most Influence Perceptions of Appearance
Participants were asked to identify the three roadway features that had the greatest impact on their perception of roadway appearance. Those features that were considered most important in relation to perception of appearance on each of the three roadway types are provided in Exhibit 7. The ratings reflect the proportion of responses listed as most important for appearance. The top three choices for each roadway type are highlighted in grey. Findings across all roadway types indicate that cleanliness, mowing and trimming of all other areas (other than along guard rails), and physical condition of the road surface are the most important in relation to the appearance of the roadway.
Exhibit 7: Perceived Importance of Roadway Features for Appearance by Roadway Type
Perceived Importance of Features for
Appearance by Roadway Type (% Inclusion)
Roadway Feature Interstate Primary Secondary All Cleanliness (lack of litter/debris) 45.1% 52.0% 45.8% 48.2% Mowing & trimming of all other areas 35.3% 34.5% 35.1% 34.9% Physical condition of the road surface (i.e., number of potholes/cracks) 33.6% 34.4% 34.4% 34.2% Roadway markings (centerline and roadside striping) 28.0% 29.4% 32.3% 29.9% Mowing & trimming along guard rails 28.9% 31.6% 24.3% 28.6% Visibility of signs 24.9% 22.5% 22.2% 23.0% Condition of signs 14.0% 18.0% 15.1% 16.0% Lighting 14.8% 13.5% 17.5% 15.1% Smoothness/feel of the road surface 15.1% 14.3% 16.0% 15.1% Width of lanes 10.1% 7.8% 10.1% 9.1% Type of right shoulder (gravel, pavement, etc.) 7.3% 7.3% 6.1% 6.9% Width of outside (right) shoulders 8.1% 4.3% 7.8% 6.4% Raised pavement markers 5.9% 5.4% 5.9% 5.7% Flow of traffic 5.6% 5.5% 5.4% 5.5% Width of inside (left) shoulders 3.9% 2.4% 5.0% 3.6%
NCDOT 2016-04 Project Report
17
4.5. Importance/Condition Matrices
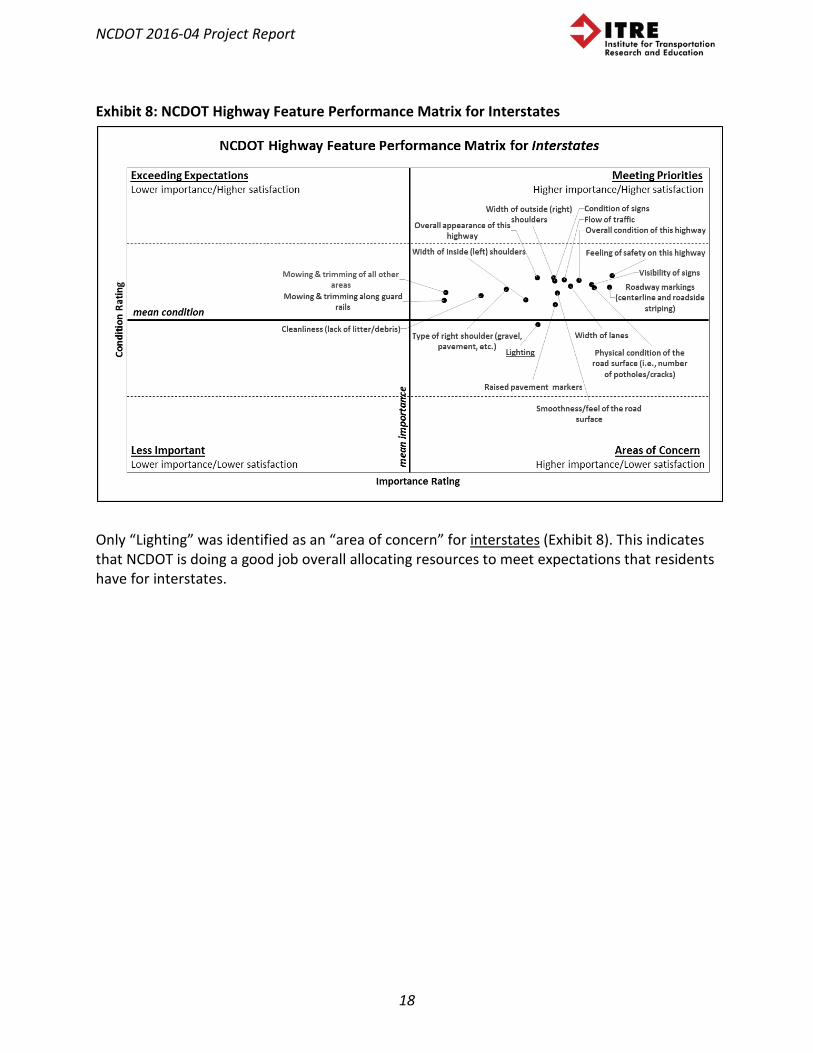
One method for identifying priorities for state roadway features involves plotting the importance and condition ratings on a four-quadrant matrix where the horizontal axis shows the relative importance of each feature with regard to the overall condition of a roadway and the vertical axis shows the relative condition ratings for each feature. The four quadrants are defined as follows:
• Meeting priorities: Features in the upper right corner of the matrix are those that are more important on average and have an average condition rating that exceeds expectations (>3.00).
• Exceeding Expectations: Features in the upper left corner of the matrix are those that are less important on average and have an average condition rating that exceeds expectations (>3.00).
• Less Important: Features in the lower left corner of the matrix are those that are less important on average and have an average condition rating that does not meet expectations (<3.00).
• Areas of Concern: Features in the lower right corner of the matrix are those that are more important on average and have an average condition rating that does not meet expectations (<3.00).
The following charts provide four-quadrant performance matrices derived from the survey ratings for each roadway type included in the study.
NCDOT 2016-04 Project Report
18
Exhibit 8: NCDOT Highway Feature Performance Matrix for Interstates
Only “Lighting” was identified as an “area of concern” for interstates (Exhibit 8). This indicates that NCDOT is doing a good job overall allocating resources to meet expectations that residents have for interstates.

NCDOT 2016-04 Project Report
19
Exhibit 9: NCDOT Highway Performance Matrix for Primary Roadways
To increase overall satisfaction with primary roadways (Exhibit 9), NCDOT could pursue strategies that emphasize improvements to the “Type of right shoulder,” “Width of inside shoulders,” “Width of outside shoulders,” “Lighting,” and “Raised pavement markers” as these features were identified as “areas of concern.”

NCDOT 2016-04 Project Report
20
Exhibit 10: NCDOT Highway Feature Performance Matrix for Secondary Roadways
To increase overall satisfaction with secondary roadways (Exhibit 10), NCDOT could pursue strategies that emphasize improvements to those features identified as “areas of concern” in the lower right corner of the matrix provided below. These include “Type of right shoulder,” “Width of inside shoulders,” “Width of outside shoulders,” “Raised pavement markers,” “Smoothness/feel of the road surface,” “Physical condition of the road surface,” “Width of lanes,” “Lighting,” and “Roadway markings.”
4.6. Summary of Areas of Concern
As mentioned, features that are categorized as “areas of concern” are those that are more important on average and have an average condition rating that does not meet expectations (<3.00). For the three roadway types, features that are highlighted as “areas of concern” include:
• Interstates: Lighting • Primary: Type of right shoulder, width of inside shoulders, width of outside shoulders,
lighting, and raised pavement markers • Secondary: Type of right shoulder, width of inside shoulders, width of outside
shoulders, raised pavement markers, smoothness/feel of road surface, physical condition of road surface, width of lanes, lighting, and roadway markings – in addition, this is the only roadway type where overall condition of and feeling of safety on the roadway were also highlighted as “areas of concern”

NCDOT 2016-04 Project Report
21
4.7. Determining Acceptable Conditions for Various Highway Features
NCDOT provided field-measured technical data for each of the roadway segments that were rated. To identify how public perceptions of roadways compare to the actual conditions of the roadways, expectation ratings provided by survey respondents were compared to the physical condition of individual features on each route as measured by NCDOT and federal standards. To identify acceptable roadway conditions, a comparison of participant ratings to field-measured conditions for each roadway segment were performed for each of the following features that were determined to be “areas of concern” in the importance/condition matrices: (1) pavement smoothness, (2) lane width, (3) shoulder type, (4) raised pavement markers (RPMs), and (5) litter. While data were available for other features highlighted as “areas of concern,” including physical condition of road, roadway markings, lighting, and signage, the resolution of the data made it difficult to objectively assess these features by relating the field-measured data to the surveys. For these features, an analysis of participant responses is provided.
Rather than examining the mean condition ratings derived from participant responses in relation to the field-measured technical data, ratings were reclassified from the 5-point scale into three ratings categories: (1) above basic expectations (4 and 5 ratings aggregated), (2) meets basic expectations (ratings of 3), and (3) below basic expectations (1 and 2 ratings aggregated). This allows for a more general understanding of the spread of responses for each roadway feature included for evaluation in the survey.
4.7.1. Pavement Smoothness
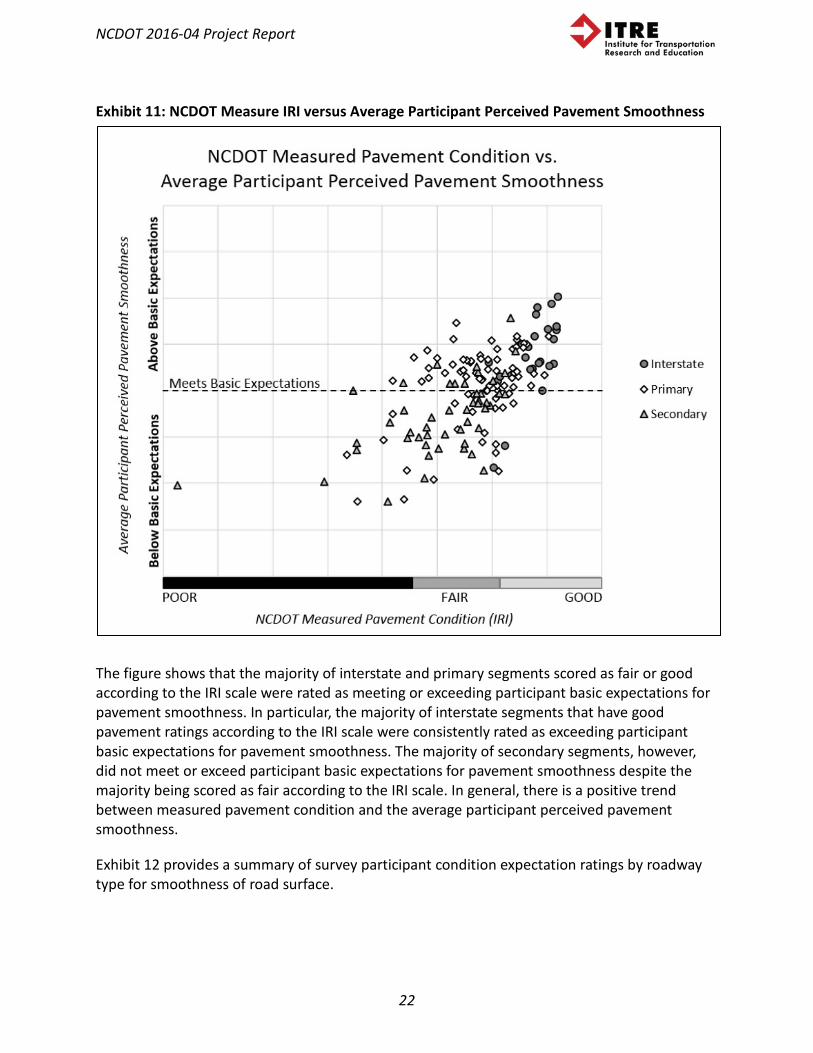
NCDOT-measured pavement condition (IRI) scores were used as the technical measurements to assess the acceptability of pavement smoothness for each roadway segment by roadway type. Exhibit 11 provides a summary of the comparison between the average participant expectation ratings for pavement smoothness to the NCDOT-measured pavement condition (IRI) scores – interstate segments are symbolized by circles, primary segments are symbolized by diamonds, and secondary segments are symbolized by triangles.
Each point on the plot represents an individual roadway segment that was rated by participants based on pavement smoothness expectation. A horizontal line was added to the plot to delineate the threshold between below and above basic expectation scores and to display how roadway segments that meet participant basic expectations of pavement smoothness align with NCDOT measured pavement condition (IRI) scores. The horizontal axis intervals are defined by IRI pavement rating thresholds: Poor (IRI score of 170 and above), Fair (IRI score of 95 – 170), and Good (IRI score below 95). The vertical axis intervals are defined by the survey scoring system, where a rating of 3.0 means a feature’s condition is perceived as meeting basic expectations, ratings below 3.0 mean a feature’s condition is perceived as below basic expectations, and ratings above 3.0 mean a feature’s condition is perceived as above basic expectations. The segment sample sizes are: interstate, 25 segments; primary, 75 segments; secondary, 49 segments. A breakdown of the segments by roadway type with their corresponding IRI scores is provided in Appendix A.
NCDOT 2016-04 Project Report
22
Exhibit 11: NCDOT Measure IRI versus Average Participant Perceived Pavement Smoothness
The figure shows that the majority of interstate and primary segments scored as fair or good according to the IRI scale were rated as meeting or exceeding participant basic expectations for pavement smoothness. In particular, the majority of interstate segments that have good pavement ratings according to the IRI scale were consistently rated as exceeding participant basic expectations for pavement smoothness. The majority of secondary segments, however, did not meet or exceed participant basic expectations for pavement smoothness despite the majority being scored as fair according to the IRI scale. In general, there is a positive trend between measured pavement condition and the average participant perceived pavement smoothness.
Exhibit 12 provides a summary of survey participant condition expectation ratings by roadway type for smoothness of road surface.
NCDOT 2016-04 Project Report
23
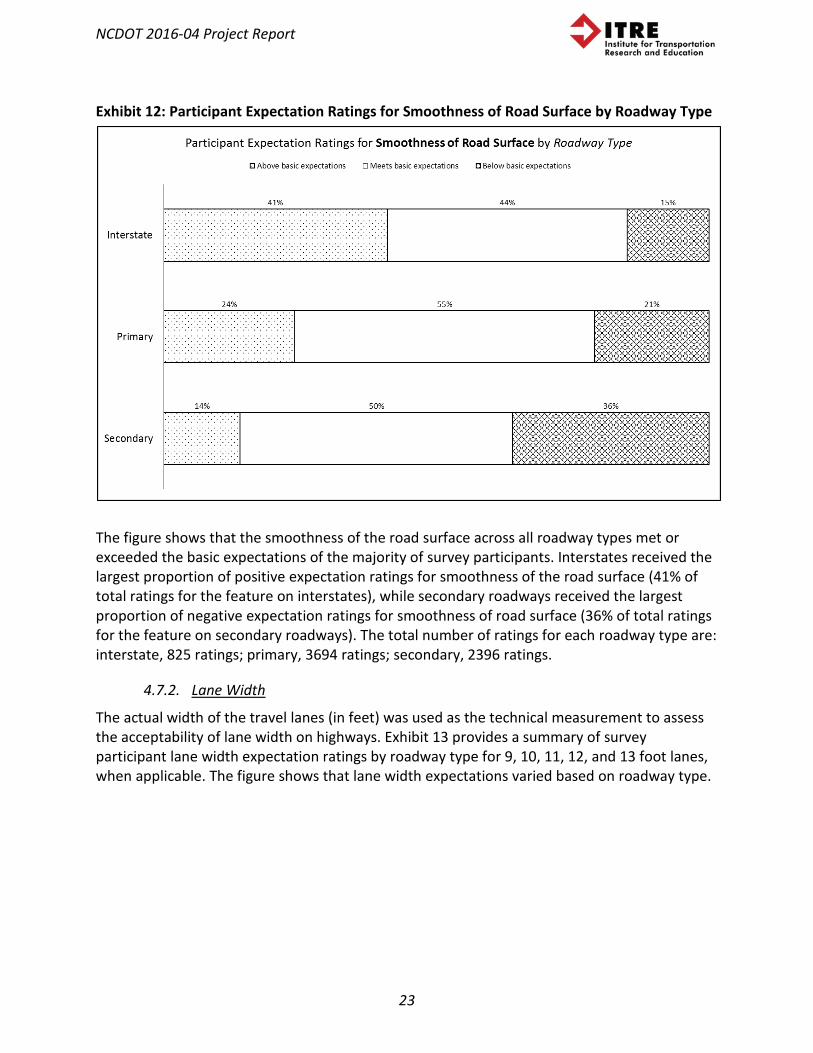
Exhibit 12: Participant Expectation Ratings for Smoothness of Road Surface by Roadway Type
The figure shows that the smoothness of the road surface across all roadway types met or exceeded the basic expectations of the majority of survey participants. Interstates received the largest proportion of positive expectation ratings for smoothness of the road surface (41% of total ratings for the feature on interstates), while secondary roadways received the largest proportion of negative expectation ratings for smoothness of road surface (36% of total ratings for the feature on secondary roadways). The total number of ratings for each roadway type are: interstate, 825 ratings; primary, 3694 ratings; secondary, 2396 ratings.
4.7.2. Lane Width
The actual width of the travel lanes (in feet) was used as the technical measurement to assess the acceptability of lane width on highways. Exhibit 13 provides a summary of survey participant lane width expectation ratings by roadway type for 9, 10, 11, 12, and 13 foot lanes, when applicable. The figure shows that lane width expectations varied based on roadway type.

NCDOT 2016-04 Project Report
24
Exhibit 13: Participant Expectation Ratings for Lane Width in Feet by Roadway Type
All interstates in the sample had lane widths of either 12 or 13 feet. These lane widths met or exceeded the basic expectations of nearly all survey participants.
Primary roadways in the sample had lane widths ranging from 9 to 12 feet. Lane widths from 10 to 12 feet met or exceeded the basic expectations of the majority of survey participants. Nine foot lane widths were below the basic expectations of the majority of survey participants (81% of total ratings for the feature on primary roadways).
Secondary roadways in the sample had lane widths ranging from 9 to 12 feet. Lane widths from 10 to 12 feet met or exceeded the basic expectations of the majority of survey participants. It should be noted that 10 foot lane widths were below the basic expectations of a large portion of survey participants (42% of total ratings for the feature on secondary roadways), while nine foot lane widths were below the basic expectations of the majority of survey participants (60% of total ratings for the feature on secondary roadways).
The total number of ratings for each roadway type are: interstate, 12 foot lane width, 796 ratings; interstate, 13 foot lane width, 39 ratings; primary, 9 foot lane width, 58 ratings; primary, 10 foot lane width, 293 ratings; primary, 11 foot lane width, 555 ratings; primary, 12 foot lane width, 2811 ratings; secondary, 9 foot lane width, 257 ratings; secondary, 10 foot lane width, 1173 ratings; secondary, 11 foot lane width, 308 ratings; secondary, 12 foot lane width, 567 ratings.
NCDOT 2016-04 Project Report
25
The segment sample sizes by lane width are: interstate, 12 foot lane width, 17 segments; interstate, 13 foot lane width, 1 segment; primary, 9 foot lane width, 1 segment; primary, 10 foot lane width, 7 segments; primary, 11 foot lane width, 14 segments; primary, 12 foot lane width, 56 segments; secondary, 9 foot lane width, 5 segments; secondary, 10 foot lane width, 25 segments; secondary, 11 foot lane width, 7 segments; secondary, 12 foot lane width, 12 segments.
4.7.3. Shoulder Type
The actual shoulder type (paved or unpaved) was used as the technical measurement to assess the acceptability of shoulder type on roadways. Exhibit 14 provides a summary of survey participant shoulder type expectation ratings by roadway type for paved and unpaved shoulders, when applicable. The figure shows that shoulder type expectations varied based on roadway type.
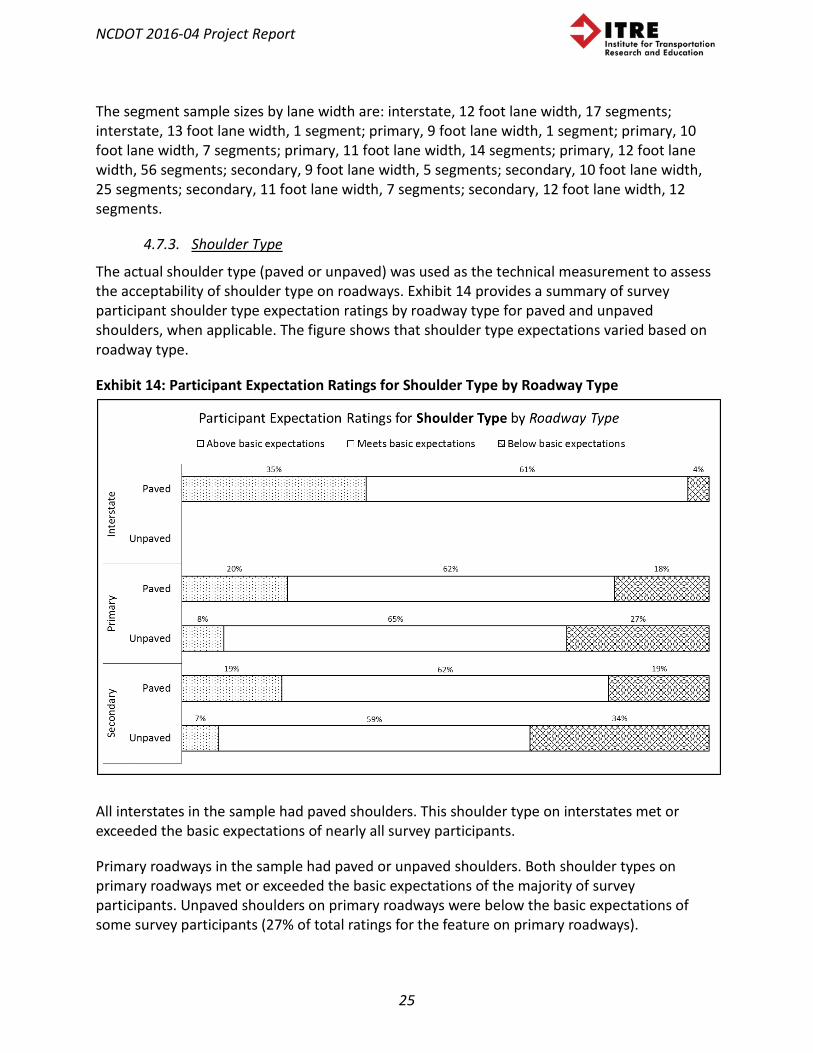
Exhibit 14: Participant Expectation Ratings for Shoulder Type by Roadway Type
All interstates in the sample had paved shoulders. This shoulder type on interstates met or exceeded the basic expectations of nearly all survey participants.
Primary roadways in the sample had paved or unpaved shoulders. Both shoulder types on primary roadways met or exceeded the basic expectations of the majority of survey participants. Unpaved shoulders on primary roadways were below the basic expectations of some survey participants (27% of total ratings for the feature on primary roadways).
NCDOT 2016-04 Project Report
26
Secondary roadways in the sample had paved or unpaved shoulders. Both shoulder types on secondary roadways met or exceeded the basic expectations of the majority of survey participants. However, unpaved shoulders were below the basic expectations of some survey participants (34% of total ratings for the feature on secondary roadways).
The total number of ratings for each roadway type are: interstate, paved shoulders, 799 ratings; primary, paved shoulders, 1189 ratings; primary, unpaved shoulders, 1471 ratings; secondary, paved shoulders, 124 ratings; secondary, unpaved shoulders, 1856 ratings.
The segment sample sizes by shoulder type are: interstate, paved shoulders, 18 segments; primary, paved shoulders, 25 segments; primary, unpaved shoulders, 36 segments; secondary, paved shoulders, 3 segments; secondary, unpaved shoulders, 44 segments.
4.7.4. Raised Pavement Markers (RPMs)
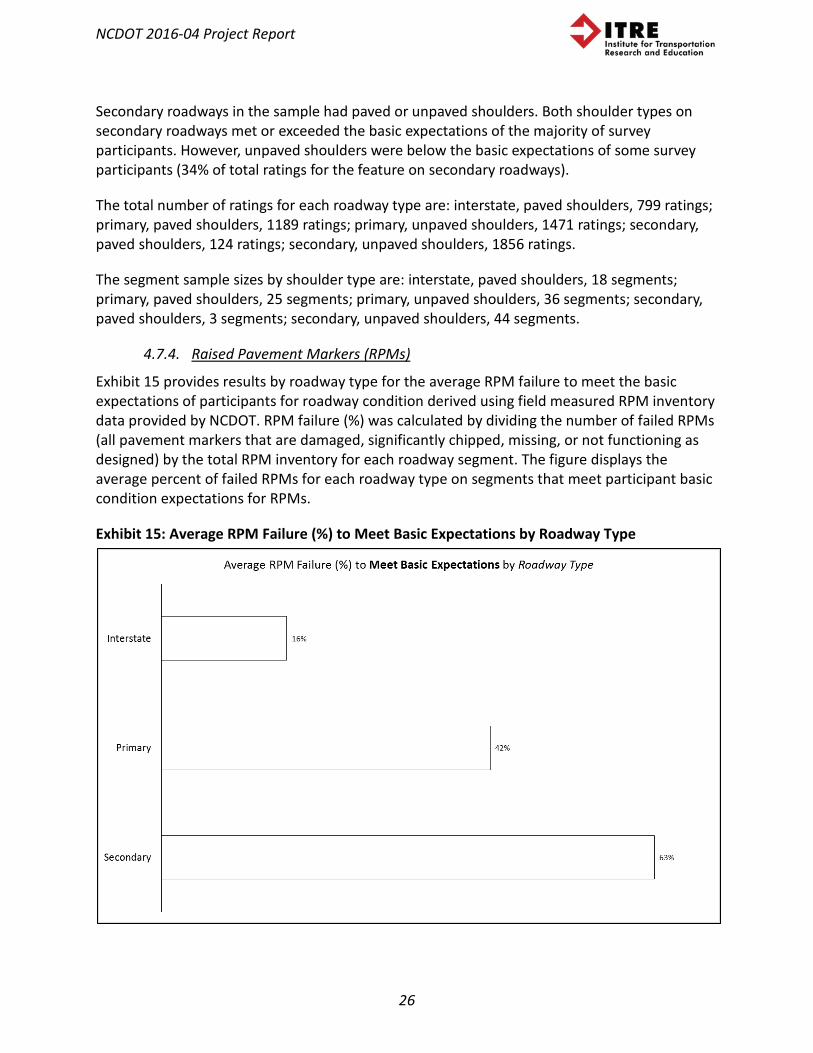
Exhibit 15 provides results by roadway type for the average RPM failure to meet the basic expectations of participants for roadway condition derived using field measured RPM inventory data provided by NCDOT. RPM failure (%) was calculated by dividing the number of failed RPMs (all pavement markers that are damaged, significantly chipped, missing, or not functioning as designed) by the total RPM inventory for each roadway segment. The figure displays the average percent of failed RPMs for each roadway type on segments that meet participant basic condition expectations for RPMs.
Exhibit 15: Average RPM Failure (%) to Meet Basic Expectations by Roadway Type

NCDOT 2016-04 Project Report
27
16% of RPMs on average are counted as failures on segments that meet participant basic condition expectations for RPMs on interstates. 42% of RPMs on average are counted as failures on segments that meet participant basic condition expectations for RPMs on primary roadways. 63% of RPMs on average are counted as failures on segments that meet participant basic condition expectations for RPMs on secondary roadways. These findings indicate that participants had a lower tolerance for RPM failure on interstates compared to primary and secondary roadways.
The total number of “meets basic expectations” ratings for each roadway type are: interstate, 429 ratings; primary, 1656 ratings; secondary, 485 ratings.
The sample sizes of segments with RPMs are: interstate, 18 segments; primary, 75 segments; secondary, 29 segments.
Exhibit 16: Participant Expectation Ratings for RPMs by Roadway Type
Exhibit 16 provides a summary of survey participant condition expectation ratings by roadway type for raised pavement markers (RPMs). The figure shows that RPMs across all roadway types met or exceeded the basic expectations of the majority of survey participants. Interstates received the largest proportion of positive expectation ratings for RPMs (31% of total ratings for the feature on interstates), while secondary roadways received the largest proportion of negative expectation ratings for RPMs (44% of total ratings for the feature on secondary roadways).

NCDOT 2016-04 Project Report
28
The total number of ratings for each roadway type are: interstate, 812 ratings; primary, 3227 ratings; secondary, 1992 ratings.
The sample sizes of segments with RPMs are: interstate, 18 segments; primary, 75 segments; secondary, 29 segments.
4.7.5. Litter
Exhibit 17 provides results for the average number of litter pieces by roadway type to meet basic expectations for roadway condition. The number of litter pieces on each segment was field measured and provided by NCDOT. The figure displays the average number of litter pieces for each roadway type on segments that meet participant basic condition expectations for litter.
Exhibit 17: Average Number of Litter Pieces to Meet Basic Expectations by Roadway Type
An average of 107 litter pieces were present on segments that meet participant basic condition expectations for litter on interstates. An average of 93 pieces of litter were present on segments that meet participant basic condition expectations for litter on primary roadways. An average of 40 pieces of litter were present on segments that meet participant basic condition expectations for litter on secondary roadways. These findings indicate that participants had a higher tolerance for litter on interstates and primary roadways compared to secondary roadways, although the research team acknowledges that higher travel speeds may impact perceptions of litter accumulation.

NCDOT 2016-04 Project Report
29
The total number of “meets basic expectations” ratings for each roadway type are: interstate, 430 ratings; primary, 2026 ratings; secondary, 1416 ratings.
The sample sizes of segments where litter was field measured are: interstate, 18 segments; primary, 78 segments; secondary, 50 segments.
Exhibit 18: Participant Expectation Ratings for Litter by Roadway Type
Exhibit 18 provides a summary of survey participant condition expectation ratings by roadway type for litter. The figure shows that litter on all roadway types met or exceeded the basic expectations of the majority of survey participants. Interstates, primary roadways, and secondary roadways received similar proportions of positive expectation ratings for litter (34% of total ratings for the feature on interstates; 29% of total ratings for the feature on primary roadways; 24% of total ratings for the feature on secondary roadways).
The total number of ratings for each roadway type are: interstate, 796 ratings; primary, 3538 ratings; secondary, 2236 ratings.

NCDOT 2016-04 Project Report
30
4.7.6. Physical Condition of Road
Exhibit 19 provides a summary of survey participant condition expectation ratings by roadway type for physical condition of road. The figure shows that the physical condition of road across all roadway types met or exceeded the basic expectations of the majority of survey participants. Interstates received the largest proportion of positive expectation ratings for smoothness of the road surface (44% of total ratings for the feature on Interstates), while secondary roadways received the largest proportion of negative expectation ratings for smoothness of road surface (30% of total ratings for the feature on secondary roads).
The total number of ratings for each roadway type are: interstate, 836 ratings; primary, 3720 ratings; secondary, 2390 ratings.
Exhibit 19: Expectation Ratings for Physical Condition of Road by Roadway Type
NCDOT 2016-04 Project Report
31
4.7.7. Roadway Markings
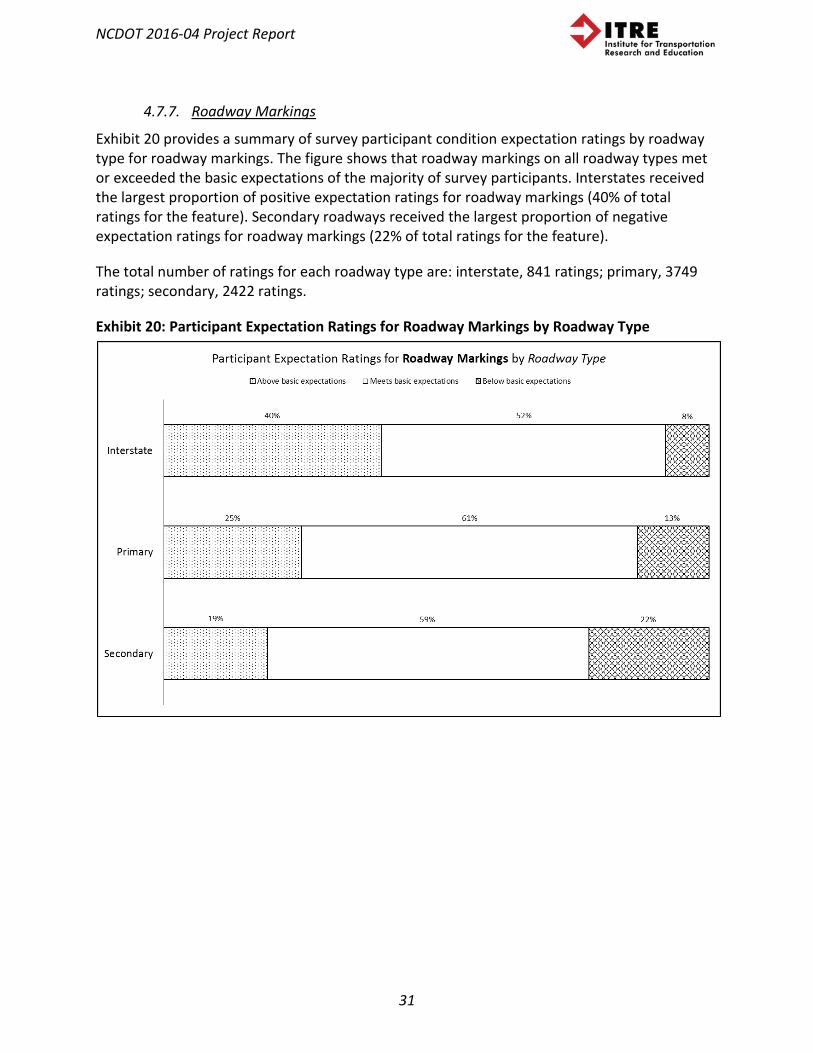
Exhibit 20 provides a summary of survey participant condition expectation ratings by roadway type for roadway markings. The figure shows that roadway markings on all roadway types met or exceeded the basic expectations of the majority of survey participants. Interstates received the largest proportion of positive expectation ratings for roadway markings (40% of total ratings for the feature). Secondary roadways received the largest proportion of negative expectation ratings for roadway markings (22% of total ratings for the feature).
The total number of ratings for each roadway type are: interstate, 841 ratings; primary, 3749 ratings; secondary, 2422 ratings.
Exhibit 20: Participant Expectation Ratings for Roadway Markings by Roadway Type

NCDOT 2016-04 Project Report
32
4.7.8. Lighting
Exhibit 21 provides a summary of survey participant condition expectation ratings by roadway type for lighting. The figure shows that lighting on all roadway types met or exceeded the basic expectations of the majority of survey participants. Primary and secondary roadways received similar proportions of negative expectation ratings for lighting (31% of total ratings for the feature on primary roads; 35% of total ratings for the feature on secondary roads). While representing only a small proportion of the overall expectation ratings for the roadway type, Interstates received the largest proportion of positive ratings for lighting (18% of total ratings for the feature).
The total number of ratings for each roadway type are: interstate, 703 ratings; primary, 3160 ratings; secondary, 2011 ratings.
Exhibit 21: Participant Expectation Ratings for Lighting by Roadway Type

NCDOT 2016-04 Project Report
33
4.7.9. Sign Visibility
Exhibit 22 provides a summary of survey participant condition expectation ratings by roadway type for sign visibility. The figure shows that sign visibility on all roadway types met or exceeded the basic expectations of the majority of survey participants. Interstates received the largest proportion of positive expectation ratings for roadway markings (40% of total ratings for the feature). Secondary roadways received the largest proportion of negative expectation ratings for roadway markings (14% of total ratings for the feature).
The total number of ratings for each roadway type are: interstate, 833 ratings; primary, 3651 ratings; secondary, 2124 ratings.
Exhibit 22: Participant Expectation Ratings for Sign Visibility by Roadway Type

NCDOT 2016-04 Project Report
34
4.7.10. Participant Expectation Ratings Sample Sizes Exhibit 23 provides a summary of the number of condition expectation ratings provided by survey participants for each roadway feature that was evaluated by roadway type. Exhibit 23: Participant Expectation Ratings Sample Sizes
Number of Participant Expectation Ratings by Roadway Type
Roadway Type
Pavement Smoothness
Raised Pavement Markers (RPMs)
Litter
Physical Condition
of Roadway
Roadway Markings Lighting Sign
Visibility
Secondary 2396 1992 2236 2390 2422 2011 2124 Primary 3694 3227 3538 3720 3749 3160 3651
Interstate 825 812 796 836 841 703 833
Roadway Type
Lane Width
9 foot 10 foot 11 foot 12 foot 13 foot
Interstate 0 0 0 796 39 Primary 58 293 555 2811 0
Secondary 257 1173 308 567 0
Roadway Type
Shoulder Type
Paved Unpaved Interstate 799 0 Primary 1471 1189
Secondary 1856 124
4.8. Focus Group Results
Focus groups were held concurrently with the roadway surveys at each study location. The purpose of the focus groups was to control for site conditions and better capture the “why” behind perceptions of roadway features. The focus groups provided the opportunity for follow-up questions, helped add context to the survey responses, and offered additional information about what is most important to citizens in relation to North Carolina’s roadways. A total of 55 people participated in the focus groups (Asheville: 8; Burlington: 7; Charlotte: 6; Jonesville: 13; Rocky Mount: 6; Wilmington: 15).
A major component of the focus groups was an evaluation of videos and pictures of a sample of roadway features, including signage, road surface, roadway striping, pavement markings, and mowing. Focus group participants were shown several examples of each of these features and were asked to mark the ones that they found to be acceptable. For example, six images of stop signs were shown. The condition of each stop sign varied from brand new to extremely deteriorated. Participants were asked to indicate which stop signs they found to be acceptable

NCDOT 2016-04 Project Report
35
by marking the corresponding fields on their worksheets. An example of a completed focus group worksheet is provided in Appendix G.
A summary of the roadway feature evaluation results is provided in Exhibit 24. Overall, the results meet expectations. Roadway features with little to no deterioration or defects received the majority of positive responses. The specific examples that were mostly frequently selected as acceptable are indicated in bold in Exhibit 24.

NCDOT 2016-04 Project Report
36
Exhibit 24: Focus Group Roadway Feature Evaluation Results
Description of Image
Percent Acceptable Responses
Signage – Stop Sign
1 (Clear letters, very faded almost pink, completely white at night, cannot see any letters at night) 20% 2 (Good condition, clear lettering, slightly discolored in one spot near the bottom, pole at a slant, clear letters at night, not very reflective) 91% 3 (Dirty, clear letters, clear letters at night, good reflection at night) 78% 4 (Cracked paint on letters, faded color, dull red, tape on left side possibly covering a crack, letters harder to read at night, not reflective, slightly covered by vegetation on the right side) 18% 5 (Dirty, faded color, closer to burnt orange than red, legible at night, color becomes more faded at night) 47% 6 (Very good condition, looks new, bright red color, clear letters during day and night, no scuff marks, reflective, majority of pole covered by vegetation but sign is not covered up) 87%
Road Surface
1 (Clear lines, pavement slightly faded no cracks or pot holes, partly pavement and grass shoulder) 91% 2 (Very faded color, very faded center yellow line, cracks going linearly down the middle and sides, cracks crossing horizontally across, grassy shoulder creeping onto pavement) 11% 3 (Multiple thin cracks present, most cracks are sealed, partially faded center yellow line, clear white side line) 47% 4 (Cracks and pot holes linearly down white dotted line, clear white dotted and double yellow lines, thin cracks crossing horizontally, no shoulder) 6% 5 (Coarse pavement texture, clear double yellow center and single white side lines, grassy shoulder, no cracks or pot holes) 89%
Striping
1 (Cracked and faded double yellow line, cracked right white side line, very faded left white side line) 13% 2 (Slightly cracked but still clear paint for the center yellow line and white side lines) 85% 3 (Clear center double yellow and white side lines, no cracks, no fading) 98% 4 (Extremely faded white dotted lines, cracked and faded yellow lines) 11%
Pavement Markings
1 (Cracked arrows, chipped, still clear and visible) 76% 2 (Cracked, faded, chipped, stem faded more than tip of arrow) 28% 3 (Clear markings, no cracks, no fading) 96% 4 (Small chips in markings, clear, no fading, no cracks) 83%
Mowing
1 (Overgrown grass and weeds, creeping onto pavement, as tall as height of guard rail, no litter) 26% 2 (Maintained trees and bushes, short grass, minimal litter) 98% 3 (Short grass, no litter, some rocks behind guard rail, some grass under and in from of guard rail) 78% 4 (Tall grass, overgrown, taller than guard rail, covering parts of guard rail, in front of and behind rail, no litter) 7%
The focus group results indicate that features with minimal deterioration and defects are found to be acceptable over those with wear such as discoloration, cracking, chipping, and fading. For mowing, maintained trees and bushes, short grass, and minimal litter was preferred.

NCDOT 2016-04 Project Report
37
Focus group participants were also asked to list the top three roadway features that are most important to them. Exhibit 25 provides a summary of the results. Overall, roadway markings, physical condition of the road surface, and visibility of signs were listed as important by the majority of participants (56%, 51%, and 22%, respectively). These features were also frequently ranked as most important by the roadway survey participants.
Exhibit 25: Roadway Features Listed as Important by Focus Groups Roadway Feature Listed As Important Percent of Participants
Marking and Visibility
Roadway markings (centerline and roadside striping) 56% Raised pavement markers 7% Lighting 15% General 11%
Road Surface and
Movement
Smoothness/feel of the road surface 7% Physical condition of the road surface (i.e., number of potholes/cracks) 51% Width of lanes 11% Flow of traffic 2% General 9%
Signage Visibility of signs 22% Condition of signs 2% General 36%
Shoulders
Width of outside (right) shoulders 9% Width of inside (left) shoulders 0% Type of right shoulder (gravel, pavement, etc.) 0% General 5%
Maintenance
Mowing & trimming along guard rails 7% Mowing & trimming of all other areas 11% Cleanliness (lack of litter/debris) 13% General 5%
Overall Experience
Overall condition of this highway 4% Overall appearance of this highway 0% Feeling of safety on this highway 9% General 2%

NCDOT 2016-04 Project Report
38
4.9. Overall Quality of Roadways in North Carolina
For the final discussion portion of the survey, participants were asked “What grade would you give to the overall quality of highways in North Carolina?” Exhibit 26 provides a summary of the responses. Options ranged from “Excellent” (A) to “Failing” (F).
Exhibit 26: Survey Results for Overall Quality of Roadways in North Carolina
What grade would you give to the overall quality of highways in NC?
Excellent (A) 8% Nearly half (46%) of participants gave an above average grade Good (B) 38%
Average (C) 42% Below Average (D) 10% Only 11% of participants gave a below average
grade Failing (F) 1%
The majority of survey participants (88%; 262 people) graded the overall quality of highways in North Carolina as “Average” (C) or higher. Nearly half of participants (46%; 137 people) gave an above average grade (“Excellent” (A) or “Good” (B)), 11% of participants (33 people) gave a “Below Average” (D) grade, and only three participants gave a “Failing” (F) grade. The three “Failing” (F) grades were recorded in Charlotte and Wilmington.
5. Conclusions
North Carolina residents were generally satisfied with the overall conditions of interstates and primary roadways, but were less satisfied with secondary roadways. On a 5-point scale with a 3.0 representing that basic expectations for roadway conditions are met, the mean ratings for interstate, primary, and secondary are 3.52, 3.19, and 2.98, respectively. Among all roadway facilities rated, the highest rated features were condition of signs, flow of traffic, and visibility of signs, while the lowest rated features were width of outside (right) shoulders, raised pavement markers, width of inside (left) shoulders, and lighting.
Along with using condition rating scales, participants identified the roadway features that they thought to be most important in influencing their perception of roadway condition, safety, and appearance. Roadway features considered most important for condition were roadway markings, physical condition of the road surface, and smoothness/feel of the road surface. Features considered most important for safety were roadway markings, physical condition of the road surface, and visibility of signs. Participants considered cleanliness, mowing and trimming of areas other than along the guard rails, and physical condition of the road surface to be the most important features in influencing their perception of roadway appearance.
Condition and importance ratings were analyzed collectively in a matrix to determine “areas of concern” that can inform NCDOT prioritization. To identify acceptable roadway conditions, a comparison of participant ratings to field-measured conditions for each roadway segment were performed for features that were determined to be “areas of concern” in the importance/condition matrices. Interpretable field-measured data was available for pavement

NCDOT 2016-04 Project Report
39
smoothness, lane width, shoulder type, raised pavement markers, and litter. An analysis of participant ratings was performed for features where field-measured data was not available or not interpretable. Standards that generally met the expectation of survey participants include:
• Pavement Smoothness: All Roadways (IRI score of 100 or less) • Lane Width: Interstates (12 and 13 feet); Primary and Secondary Roadways (10 to 12
feet) • Shoulder Type: Interstates (Paved); Primary (Paved and Unpaved); Secondary (Paved and
Unpaved) • Raised Pavement Markers: Interstates (Average RPM failure of 16% or less); Primary
Roadways (Average RPM failure of 42% or less); Secondary Roadways (Average RPM failure of 63% or less)
• Litter: Interstates (107 pieces of litter or less); Primary Roadways (93 pieces of litter or less); Secondary Roadways (40 pieces of litter or less)
Focus groups held concurrently with the van surveys at each study location provided context to and supported the survey results. Roadway features with little to no deterioration or defects received the majority of positive responses over those with wear such as discoloration, cracking, chipping, and fading. For mowing, maintained trees and bushes, short grass, and minimal litter was preferred.
Survey participants were also asked what grade they would give to the overall quality of highways in North Carolina. Over half of participants gave North Carolina roadways an above average grade. Nearly 90% of participants gave North Carolina roadways a grade of average or above.
6. Future Research
This study presents several opportunities for future research. The extensive study records maintained by ITRE researchers and NCDOT staff allow for the 2015 study results to be compared to any future NC Roadway Review study results. In addition, the findings of this research can be used to refine the questions in future costumer service surveys and to develop questions that target the assets that residents indicated were most important.
7. References
Guirao, B., García-Pastor, A., and López-Lambas, M.E. The Importance of Service Quality Attributes In Public Transportation: Narrowing The Gap Between Scientific Research and Practitioners' Needs. Transport Policy, Vol. 49, 2016, pp. 68-77.
Hu, K.C. Evaluating City Bus Service Based on Zone of Tolerance of Expectation and Normalized Importance. Transport Reviews, Vol. 30, No. 2, March 2010, pp. 195-217.
Wan, D., Kamga, C., Lui, J., Sugiura, A., and Beaton, E.B. Rider Perception of A “Light” Bus Rapid Transit System -The New York City Select Bus Service. Transport Policy, Vol. 49, 2016, pp. 41-55.
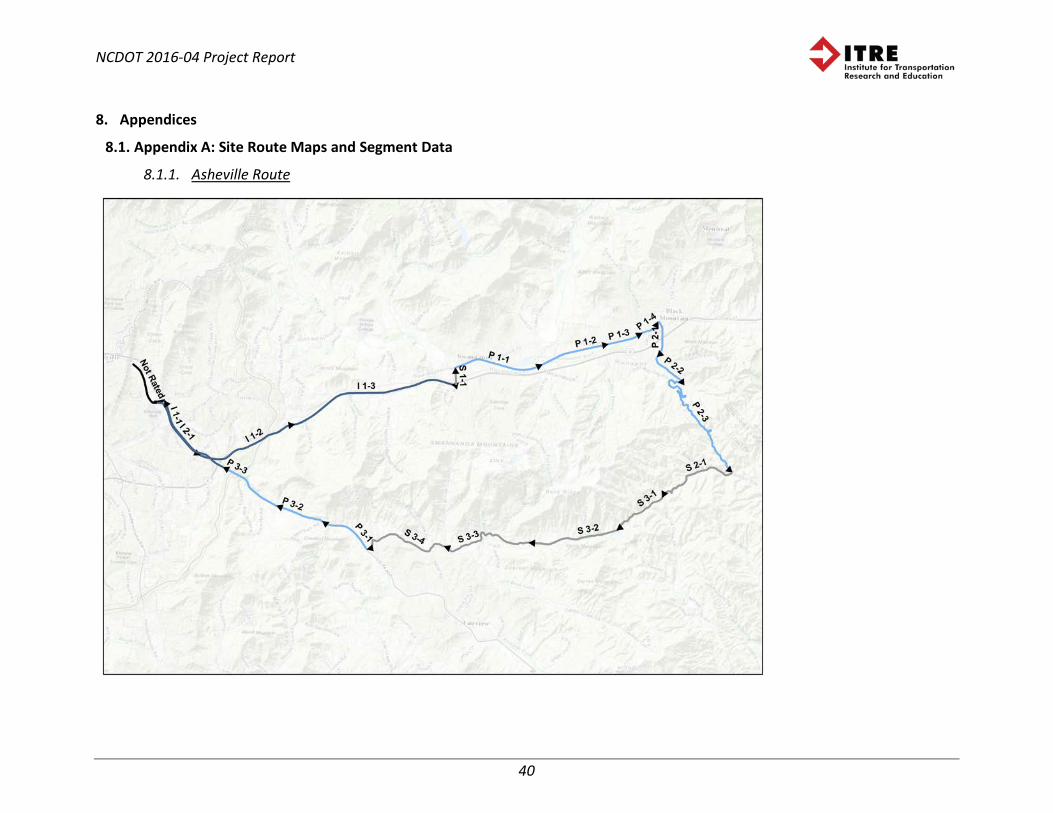
NCDOT 2016-04 Project Report
40
8. Appendices
8.1. Appendix A: Site Route Maps and Segment Data
8.1.1. Asheville Route

NCDOT 2016-04 Project Report
41
8.1.2. Burlington Route
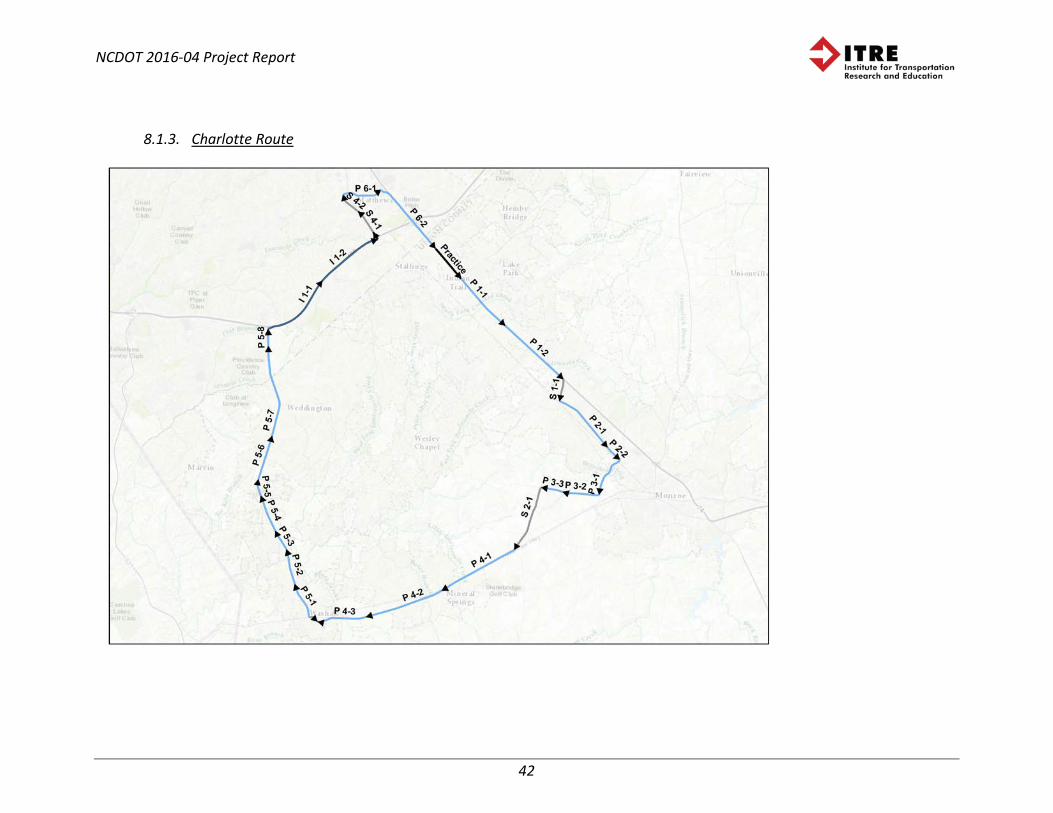
NCDOT 2016-04 Project Report
42
8.1.3. Charlotte Route
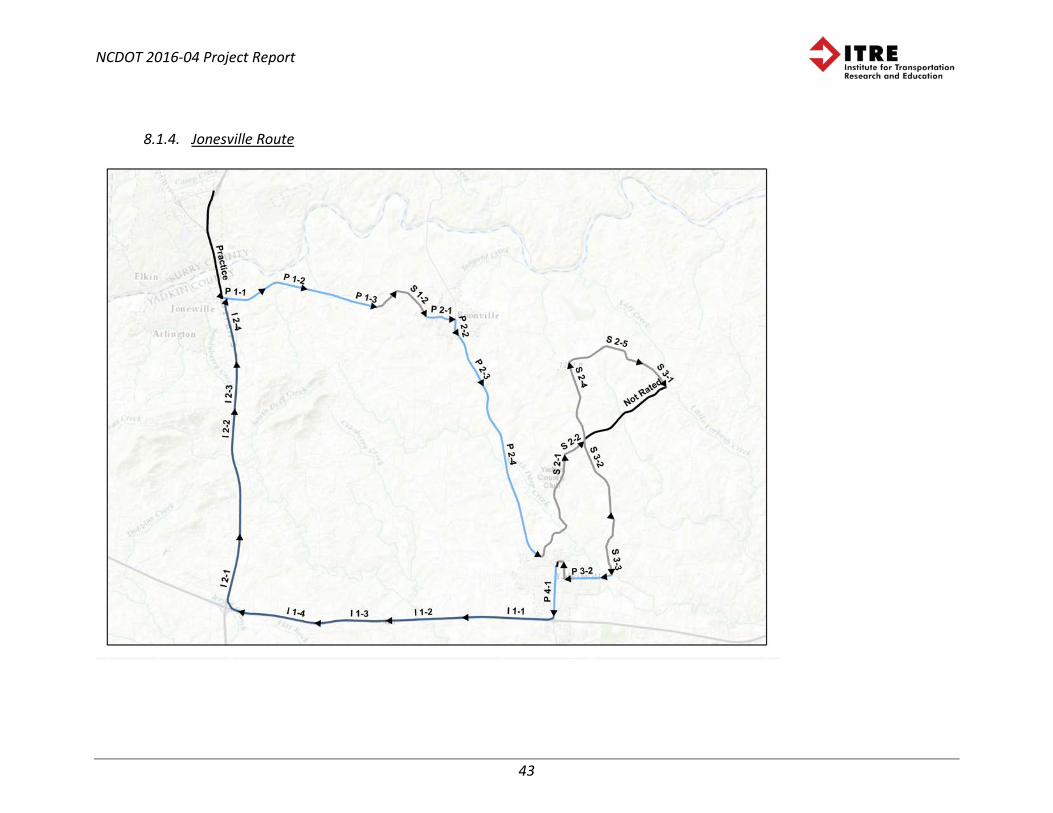
NCDOT 2016-04 Project Report
43
8.1.4. Jonesville Route

NCDOT 2016-04 Project Report
44
8.1.5. Rocky Mount Route

NCDOT 2016-04 Project Report
45
8.1.6. Wilmington Route
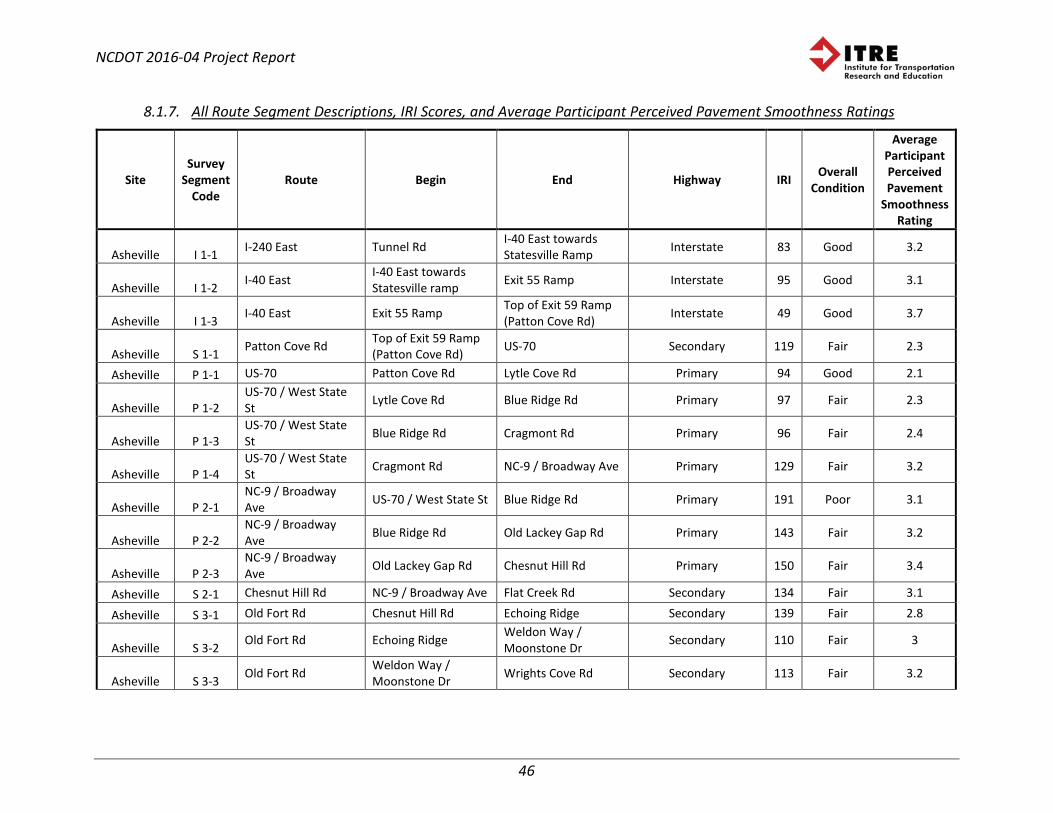
NCDOT 2016-04 Project Report
46
8.1.7. All Route Segment Descriptions, IRI Scores, and Average Participant Perceived Pavement Smoothness Ratings
Site Survey
Segment Code
Route Begin End Highway IRI Overall Condition
Average Participant Perceived Pavement
Smoothness Rating
Asheville I 1-1 I-240 East Tunnel Rd I-40 East towards Statesville Ramp Interstate 83 Good 3.2
Asheville I 1-2 I-40 East I-40 East towards Statesville ramp Exit 55 Ramp Interstate 95 Good 3.1
Asheville I 1-3 I-40 East Exit 55 Ramp Top of Exit 59 Ramp (Patton Cove Rd) Interstate 49 Good 3.7
Asheville S 1-1 Patton Cove Rd Top of Exit 59 Ramp (Patton Cove Rd) US-70 Secondary 119 Fair 2.3
Asheville P 1-1 US-70 Patton Cove Rd Lytle Cove Rd Primary 94 Good 2.1
Asheville P 1-2 US-70 / West State St Lytle Cove Rd Blue Ridge Rd Primary 97 Fair 2.3
Asheville P 1-3 US-70 / West State St Blue Ridge Rd Cragmont Rd Primary 96 Fair 2.4
Asheville P 1-4 US-70 / West State St Cragmont Rd NC-9 / Broadway Ave Primary 129 Fair 3.2
Asheville P 2-1 NC-9 / Broadway Ave US-70 / West State St Blue Ridge Rd Primary 191 Poor 3.1
Asheville P 2-2 NC-9 / Broadway Ave Blue Ridge Rd Old Lackey Gap Rd Primary 143 Fair 3.2
Asheville P 2-3 NC-9 / Broadway Ave Old Lackey Gap Rd Chesnut Hill Rd Primary 150 Fair 3.4
Asheville S 2-1 Chesnut Hill Rd NC-9 / Broadway Ave Flat Creek Rd Secondary 134 Fair 3.1
Asheville S 3-1 Old Fort Rd Chesnut Hill Rd Echoing Ridge Secondary 139 Fair 2.8
Asheville S 3-2 Old Fort Rd Echoing Ridge Weldon Way / Moonstone Dr Secondary 110 Fair 3
Asheville S 3-3 Old Fort Rd Weldon Way / Moonstone Dr Wrights Cove Rd Secondary 113 Fair 3.2

NCDOT 2016-04 Project Report
47
Asheville S 3-4 Old Fort Rd Wrights Cove Rd Alt 74 / Charlotte Highway Secondary 114 Fair 3.3
Asheville P 3-1 Alt 74 / Charlotte Highway Old Fort Rd Winding Ridge Rd Primary 111 Fair 3.4
Asheville P 3-2 Alt 74 / Charlotte Highway Winding Ridge Rd Cedar Ridge Dr Primary 49 Good 3.6
Asheville P 3-3 Alt 74 / Charlotte Highway Cedar Ridge Dr I-40 East towards
Statesville Ramp Primary 103 Fair 3.1
Asheville I 2-1 I-240 West I-40 East towards Statesville Ramp
Exit 7 top of Ramp to Tunnel Rd Interstate 103 Fair 3.3
Burlington I 1-1 I-40W/86 MM 139 NC-61 Interstate 42 Good 3.7
Burlington I 1-2 I-40W/87 NC-61 Rock Creek Diary Rd Interchange Interstate 44 Good 3.6
Burlington I 1-3 I-40W/88 Rock Creek Diary Rd Interchange
Mount Hope Church Rd Exit Interstate 56 Good 3.3
Burlington S 1-1 Mount Hope Church Rd
Mount Hope Church Rd Exit McConnell Rd Secondary 102 Fair 2.8
Burlington S 1-2 Mount Hope Church Rd McConnell Rd Cook-Stewart Rd Secondary 93 Good 3
Burlington S 1-3 Mount Hope Church Rd Cook-Stewart Rd Baseman Rd Secondary 114 Fair 3
Burlington S 1-4 Mount Hope Church Rd Baseman Rd Holts Store Rd Secondary 99 Fair 3.1
Burlington S 1-5 Holts Store Rd Mount Hope Church Rd NC-61 Secondary 117 Fair 2.9
Burlington P 1-1 NC-61 Holts Store Rd Herron Rd Primary 76 Good 3.2
Burlington P 1-2 NC-61 Herron Rd Homeview Rd Primary 89 Good 3.1
Burlington P 1-3 NC-61 Homeview Rd Konica Dr Primary 105 Fair 3
Burlington P 1-4 NC-61 Konica Dr Greeson Rd Primary 199 Poor 2.5
Burlington P 1-5 NC-61 Greeson Rd US-70 Primary 124 Fair 3.2
Burlington P 2-1 US-70 NC-61 Brightwood Church Rd Primary 105 Fair 3
Burlington P 2-2 US-70 Brightwood Church Rd Golf House Rd East Primary 85 Good 3
Burlington P 2-3 US-70 Golf House Rd East Tatton Church Rd Primary 115 Fair 3.2
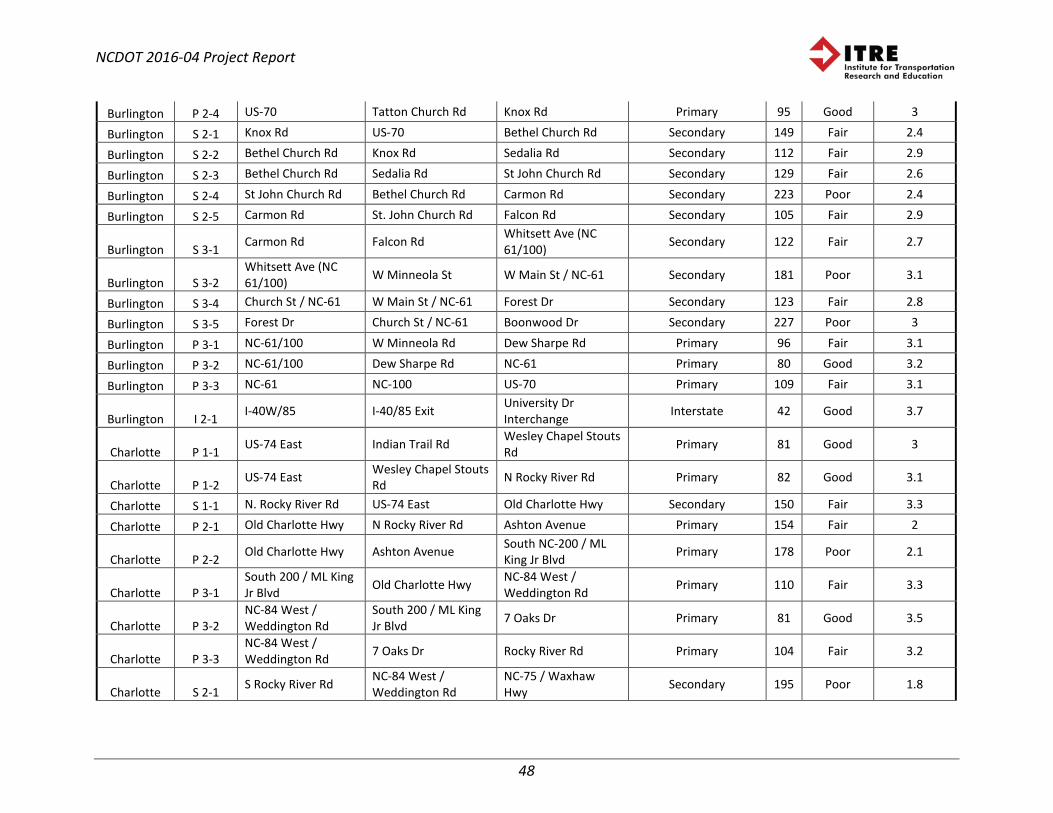
NCDOT 2016-04 Project Report
48
Burlington P 2-4 US-70 Tatton Church Rd Knox Rd Primary 95 Good 3
Burlington S 2-1 Knox Rd US-70 Bethel Church Rd Secondary 149 Fair 2.4
Burlington S 2-2 Bethel Church Rd Knox Rd Sedalia Rd Secondary 112 Fair 2.9
Burlington S 2-3 Bethel Church Rd Sedalia Rd St John Church Rd Secondary 129 Fair 2.6
Burlington S 2-4 St John Church Rd Bethel Church Rd Carmon Rd Secondary 223 Poor 2.4
Burlington S 2-5 Carmon Rd St. John Church Rd Falcon Rd Secondary 105 Fair 2.9
Burlington S 3-1 Carmon Rd Falcon Rd Whitsett Ave (NC 61/100) Secondary 122 Fair 2.7
Burlington S 3-2 Whitsett Ave (NC 61/100) W Minneola St W Main St / NC-61 Secondary 181 Poor 3.1
Burlington S 3-4 Church St / NC-61 W Main St / NC-61 Forest Dr Secondary 123 Fair 2.8
Burlington S 3-5 Forest Dr Church St / NC-61 Boonwood Dr Secondary 227 Poor 3
Burlington P 3-1 NC-61/100 W Minneola Rd Dew Sharpe Rd Primary 96 Fair 3.1
Burlington P 3-2 NC-61/100 Dew Sharpe Rd NC-61 Primary 80 Good 3.2
Burlington P 3-3 NC-61 NC-100 US-70 Primary 109 Fair 3.1
Burlington I 2-1 I-40W/85 I-40/85 Exit University Dr Interchange Interstate 42 Good 3.7
Charlotte P 1-1 US-74 East Indian Trail Rd Wesley Chapel Stouts Rd Primary 81 Good 3
Charlotte P 1-2 US-74 East Wesley Chapel Stouts Rd N Rocky River Rd Primary 82 Good 3.1
Charlotte S 1-1 N. Rocky River Rd US-74 East Old Charlotte Hwy Secondary 150 Fair 3.3
Charlotte P 2-1 Old Charlotte Hwy N Rocky River Rd Ashton Avenue Primary 154 Fair 2
Charlotte P 2-2 Old Charlotte Hwy Ashton Avenue South NC-200 / ML King Jr Blvd Primary 178 Poor 2.1
Charlotte P 3-1 South 200 / ML King Jr Blvd Old Charlotte Hwy NC-84 West /
Weddington Rd Primary 110 Fair 3.3
Charlotte P 3-2 NC-84 West / Weddington Rd
South 200 / ML King Jr Blvd 7 Oaks Dr Primary 81 Good 3.5
Charlotte P 3-3 NC-84 West / Weddington Rd 7 Oaks Dr Rocky River Rd Primary 104 Fair 3.2
Charlotte S 2-1 S Rocky River Rd NC-84 West / Weddington Rd
NC-75 / Waxhaw Hwy Secondary 195 Poor 1.8

NCDOT 2016-04 Project Report
49
Charlotte P 4-1 NC-75 / Waxhaw Hwy S Rocky River Rd Potter Rd Primary 132 Fair 2.6
Charlotte P 4-2 NC-75 / Waxhaw Hwy Potter Rd Collins Rd Primary 223 Poor 1.8
Charlotte P 4-3 NC-75 / Waxhaw Hwy Collins Rd McCain St / E South
Main St Primary 180 Poor 1.8
Charlotte S 3-1 E South Main St NC-75 / Waxhaw Hwy NC-16 North Secondary 155 Fair 2.7
Charlotte P 5-1 NC-16 North E South Main St Red Oaks Trail Primary 159 Fair 3.4
Charlotte P 5-2 NC-16 North Red Oaks Trail Cuthbertson Rd Primary 136 Fair 3.3
Charlotte P 5-3 NC-16 North Cuthbertson Rd Gray Byrum Rd Primary 158 Fair 3.1
Charlotte P 5-4 NC-16 North Gray Byrum Rd Avanti Dr Primary 120 Fair 3.3
Charlotte P 5-5 NC-16 North Avanti Dr New Town Rd Primary 164 Fair 3.1
Charlotte P 5-6 NC-16 North New Town Rd Chamberleyne Way Primary 122 Fair 3
Charlotte P 5-7 NC-16 North Chamberleyne Way Ardrey Kell Rd Primary 68 Good 3.5
Charlotte P 5-8 NC-16 North Ardrey Kell Rd Ramp to N I-485 Outer Primary 96 Fair 3.5
Charlotte I 1-1 N I-485 Outer NC-16 North MM 54.4 Interstate 46 Good 3.9
Charlotte I 1-2 N I-485 Outer MM 54.4 Top of Exit 52 Ramp Interstate 59 Good 3.9
Charlotte S 4-1 E John St Council Place Park Square Place Secondary 175 Poor 2.6
Charlotte S 4-2 E John St Park Square Pl NC-51 / Matthews Township Prkwy Secondary 159 Fair 2.5
Charlotte P 6-1 NC-51 / Matthews Township Prkwy E John St Ramp to US-74 East Primary 135 Fair 3.6
Charlotte P 6-2 US-74 East NC-51 / Matthews Township Prkwy Stallings Rd Primary 96 Fair 3.2
Jonesville P 1-1 NC-67 East I-77 Interchange Riverside Dr Primary 127 Fair 3.2
Jonesville P 1-2 NC-67 East Riverside Dr Vestal Rd Primary 71 Good 3.5
Jonesville P 1-3 NC-67 East Vestal Rd Wilhelm Rd Primary 78 Good 3.5
Jonesville S 1-1 Wilhelm Rd NC-67 Woodruff Rd Secondary 193 Poor 2.7
Jonesville S 1-2 Woodruff Rd Wilhelm Rd NC-67 Secondary 160 Fair 2.6
Jonesville P 2-1 NC-67 Woodruff Rd US-601 Primary 119 Fair 3.3
Jonesville P 2-2 US-601 NC-67 Marview Dr Primary 134 Fair 2.9

NCDOT 2016-04 Project Report
50
Jonesville P 2-3 US-601 Marview Dr Reece Rd Primary 81 Good 2.9
Jonesville P 2-4 US-601 Reece Rd Country Club Rd Primary 97 Fair 2.9
Jonesville S 2-1 Country Club Rd US-601 Rockford Rd Secondary 108 Fair 2.1
Jonesville S 2-2 Rockford Rd Country Club Rd Union Grove Church Rd Secondary 88 Good 3
Jonesville S 2-3 Rockford Rd Union Grove Church Rd Nebo Rd Secondary 83 Good 3.8
Jonesville S 2-4 Nebo Rd Rockford Rd Larry Rd Secondary 143 Fair 2.5
Jonesville S 2-5 Nebo Rd Larry Rd Union Grove Church Rd Secondary 167 Fair 2.5
Jonesville S 3-1 Union Grove Church Rd Nebo Rd Rockford Rd Secondary 139 Fair 3.1
Jonesville S 3-2 Sugartown Rd Rockford Rd Myers Rd Secondary 113 Fair 2.9
Jonesville S 3-3 Myers Rd Sugartown Rd Old US-421 Secondary 223 Poor 2.4
Jonesville P 3-1 Old US-421 / E. Main St Myers Rd UNFI Industrial Dr Secondary 158 Fair 3.2
Jonesville P 3-2 Old US-421 / E. Main St UNFI Industrial Dr Harrison St Secondary 123 Fair 3.3
Jonesville S 4-1 Harrison St Old US-421 / E. Main St Locust St Secondary 253 Poor 2
Jonesville S 4-2 Locust St Harrison St Tennessee St Secondary 387 Poor 2
Jonesville P 4-1 State St Tennessee St Entrance Ramp US-421 North Secondary 133 Fair 3.7
Jonesville I 1-1 US-421 North Entrance Ramp US-421 North
Reavis Rd/Bethel Church Rd Primary 73 Good 3.5
Jonesville I 1-2 US-421 North Reavis Rd/Bethel Church Rd Branon Church Rd Primary 70 Good 3.4
Jonesville I 1-3 US-421 North Branon Church Rd US-21 Interchange Primary 60 Good 3.8
Jonesville I 1-4 US-421 North US-21 Interchange Bottom of ramp to I-77 N Primary 93 Good 3.2
Jonesville I 2-1 I-77 N Bottom of ramp to I-77 N Mile Marker 76 Interstate 63 Good 3.2
Jonesville I 2-2 I-77 N Mile Marker 76 US-21 BUS Interchange Interstate 65 Good 3.2

NCDOT 2016-04 Project Report
51
Jonesville I 2-3 I-77 N US-21 BUS Interchange Center Rd Bridge Interstate 99 Fair 2.2
Jonesville I 2-4 I-77 N Center Rd Bridge Top of exit (85) ramp NC-268 / CC Camp Rd Interstate 88 Good 2.4
Rocky Mount I 2-3 US-64 East I-95 Interchange N Winstead Ave Primary 48 Good 3.3
Rocky Mount P 1-1 US-301 US-301 Exit (Top of
Ramp) Railroad crossing Primary 98 Fair 2.8
Rocky Mount P 1-2 US-301 Railroad crossing W Tarboro Rd Primary 52 Good 3.2
Rocky Mount P 1-3 US-301 W Tarboro Rd S Halifax Rd Primary 62 Good 3.2
Rocky Mount P 1-4 US-301 S Halifax Rd Stagecoach Rd Primary 65 Good 3.1
Rocky Mount S 1-1 South Parker St Stagecoach Rd W Main St Secondary 162 Fair 2.1
Rocky Mount S 1-2 W. Main St South Parker St Toisnot St Secondary 125 Fair 3.1
Rocky Mount S 2-1 Lake Wilson Rd W Wilson St Curve Rd Secondary 126 Fair 2.4
Rocky Mount S 2-2 Lake Wilson Rd Curve Rd London Church Rd Secondary 125 Fair 2.4
Rocky Mount S 2-3 London Church Rd Lake Wilson Rd Pridgen Rd Secondary 112 Fair 2.6
Rocky Mount S 2-4 London Church Rd Pridgen Rd William Chapel
Church Rd Secondary 88 Good 3.2
Rocky Mount S 2-5
William Chapel Church Rd London Church Rd NC-58 Secondary 161 Fair 2.4
Rocky Mount P 2-1 NC-58 William Chapel
Church Rd NC-97 Primary 77 Good 3.6
Rocky Mount P 2-2 NC-97 NC-58 I-95 Exit (Top of
Ramp) Primary 90 Good 2.8
Rocky Mount I 1-1 I-95 I-95 Exit (Top of
Ramp) West Mount Dr Exit (Top of Ramp) Interstate 55 Good 3
Rocky Mount S 3-1 West Mount Dr I-95 NC-58 Secondary 106 Fair 2.8

NCDOT 2016-04 Project Report
52
Rocky Mount P 3-1 NC-58 West Mount Dr Batchelor Rd Primary 78 Good 3.2
Rocky Mount P 4-4 South Barnes St W. Washington St West Cross St Secondary 104 Fair 3.3
Rocky Mount S 4-1 South Alston St West Cross St E Washington St/US-
64 Secondary 180 Poor 2.8
Rocky Mount P 3-2 NC-58 Batchelor Rd E Old Spring Hope Rd Primary 81 Good 3.3
Rocky Mount P 4-1 NC-58 E. Old Spring Hope
Rd Ward St Primary 95 Fair 3.3
Rocky Mount P 4-2 NC-58 Ward St US-64 Bus Primary 126 Fair 3.3
Rocky Mount P 4-3
E Washington St/US-64 NC-58 W Washington St
(Grass Median) Primary 171 Poor 3.4
Rocky Mount P 5-1 US-64 Bus NC-58 Nashville Commons
Dr Primary 110 Fair 3.1
Rocky Mount I 2-1 US-64 Nashville Commons
Dr Exit 463 Primary 44 Good 3.3
Rocky Mount I 2-2 US-64 Exit 463 I-95 Interchange Primary 57 Good 3.3
Wilmington P 1-1 US-17 BUS 3rd St US-74/76 Primary 191 Poor 2.8
Wilmington P 1-2 US-74/76 US-17 BUS US-17 Ramp Primary 112 Fair 3.1
Wilmington P 1-3 US-17 US-74/76 Rail Bridge Primary 117 Fair 3
Wilmington P 1-4 US-17 Rail Bridge Zion Ch Rd Primary 71 Good 3.5
Wilmington S 1-1 Town Creek Rd Zion Ch Rd Old Town Creek Rd Secondary 158 Fair 2.3
Wilmington S 1-2 Old Town Creek Rd Town Creek Rd Maco Rd Secondary 177 Poor 2.5
Wilmington S 1-3 Maco Rd Old Town Creek Rd Grace Pkwy Secondary 78 Good 3.4
Wilmington I 1-1 I-140 End of US-17 Ramp US-74/76 Interstate 40 Good 4
Wilmington P 2-1 US-74/76 US-140 Mercantile Dr Primary 77 Good 3.6
Wilmington P 2-2 US-74/76 Mercantile Dr US-17 Ramp Primary 109 Fair 2.5
Wilmington P 2-3 US-74/76 US-17 Ramp BUS 17 Split Primary 107 Fair 2.5
Wilmington P 2-4 US-74/76 US-74/76 Ramp I-140 Primary 118 Fair 2.8
Wilmington I 2-1 I-140 US-74/76 I-40 Ramp Interstate 67 Good 3.5

NCDOT 2016-04 Project Report
53
Wilmington I 2-2 I-40 I-40 Ramp US-117 / College Rd Interstate 61 Good 3.6
Wilmington P 3-1 US-117 / College Rd I-40 US-117 / Shipyard Blvd Primary 100 Fair 3.5
Wilmington P 4-1 US-17 BUS / Market St Independence Blvd 3rd St Primary 233 Poor 2.3
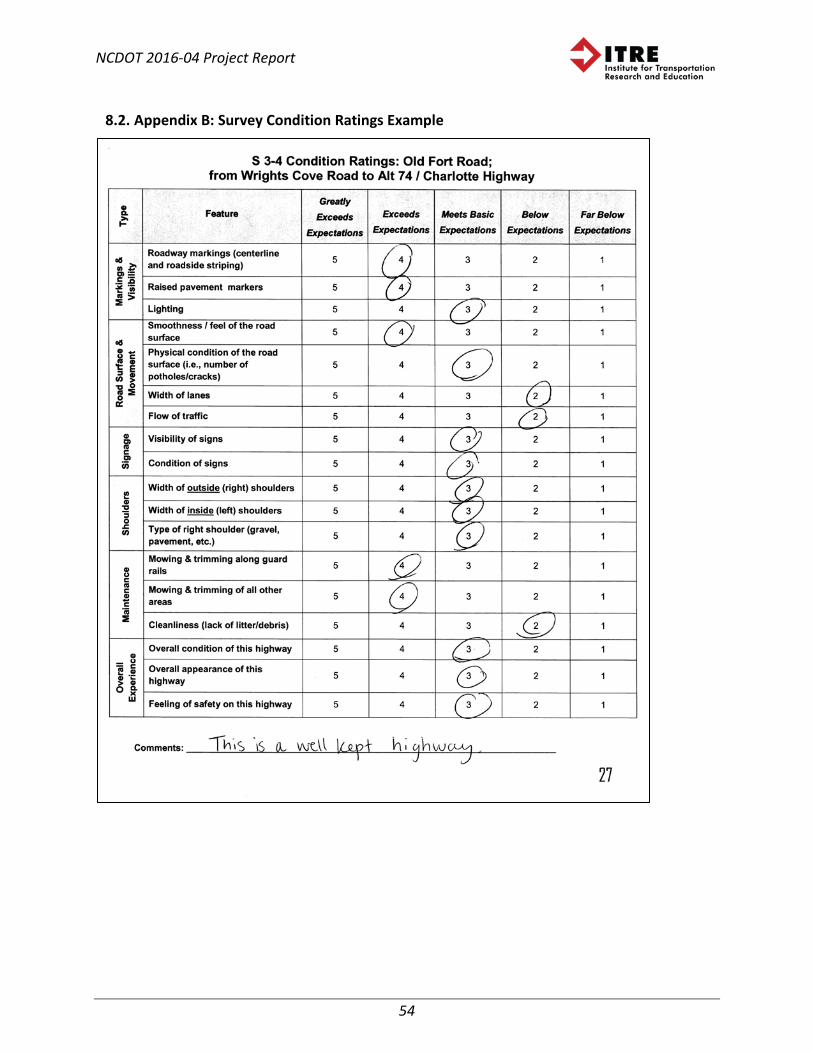
NCDOT 2016-04 Project Report
54
8.2. Appendix B: Survey Condition Ratings Example
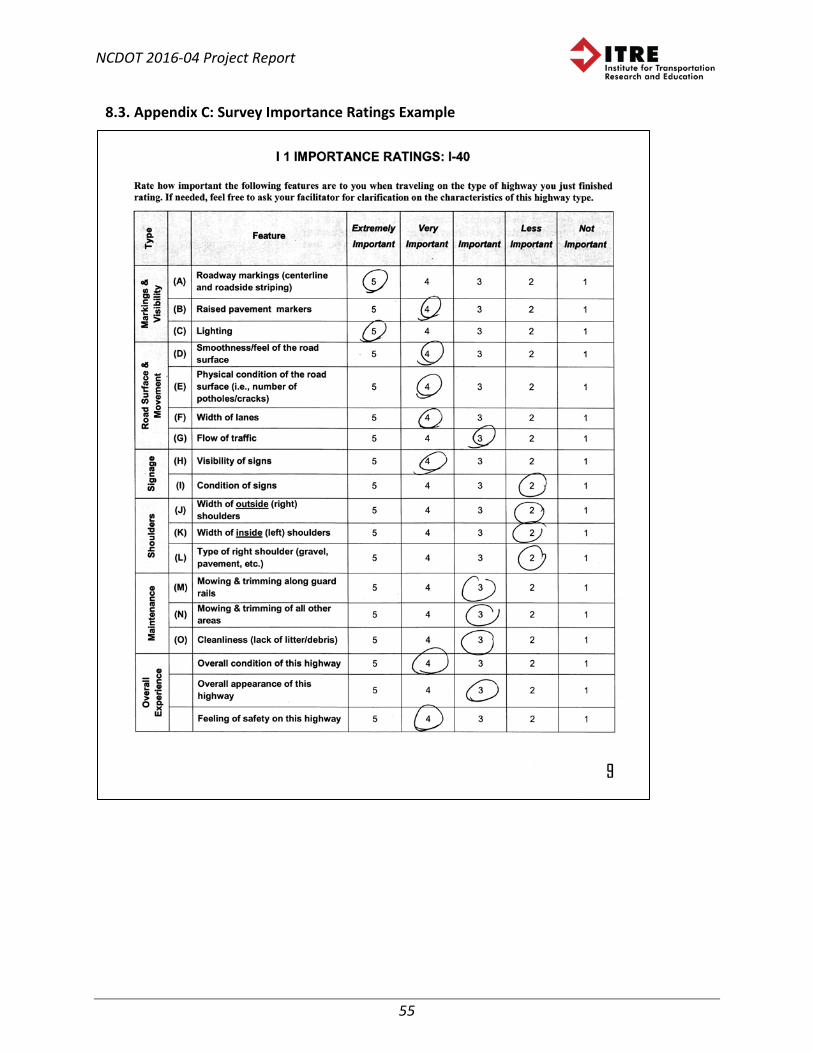
NCDOT 2016-04 Project Report
55
8.3. Appendix C: Survey Importance Ratings Example

NCDOT 2016-04 Project Report
56
8.4. Appendix D: Survey Importance Ratings Ranking Example

NCDOT 2016-04 Project Report
57
8.5. Appendix E: Survey Discussion Questions Section
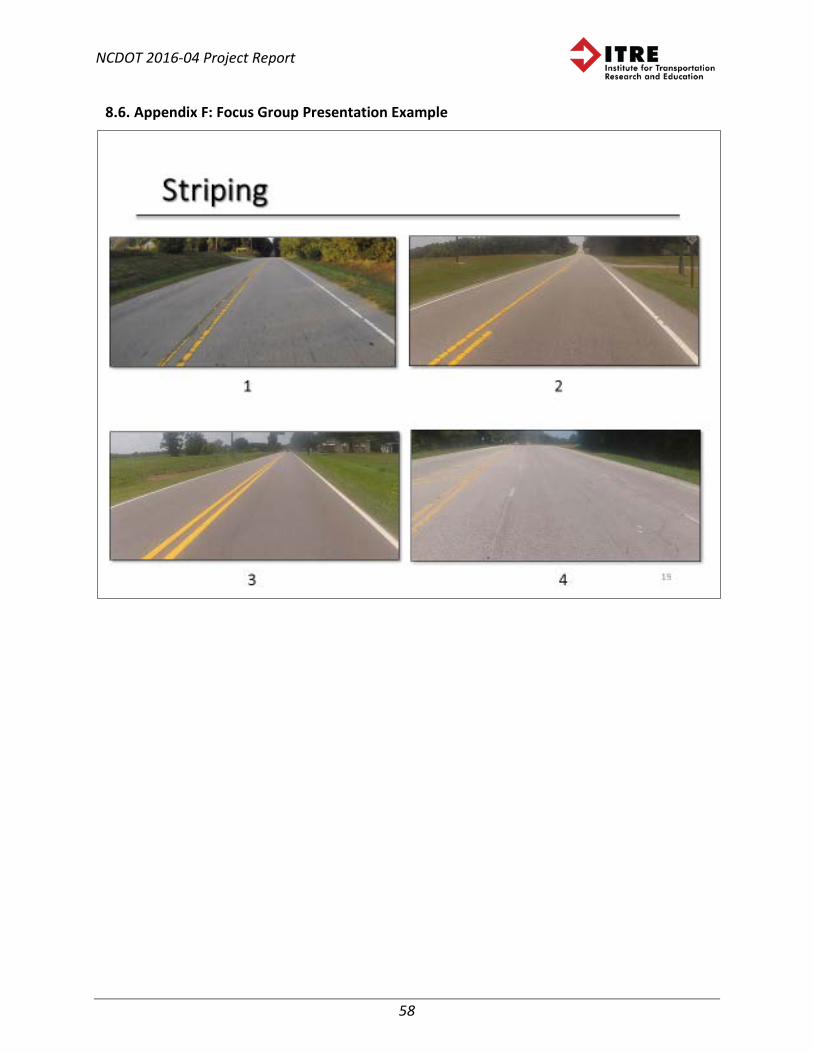
NCDOT 2016-04 Project Report
58
8.6. Appendix F: Focus Group Presentation Example

NCDOT 2016-04 Project Report
59
8.7. Appendix G: Focus Group Written Survey Example
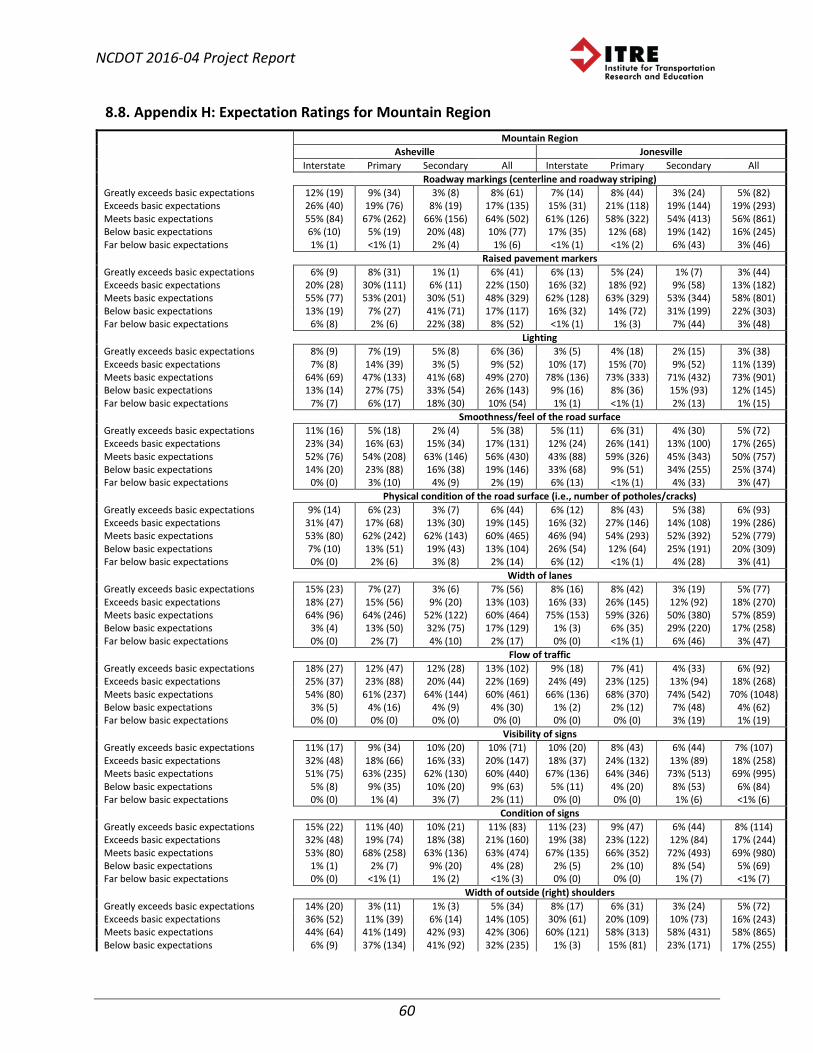
NCDOT 2016-04 Project Report
60
8.8. Appendix H: Expectation Ratings for Mountain Region Mountain Region Asheville Jonesville Interstate Primary Secondary All Interstate Primary Secondary All Roadway markings (centerline and roadway striping) Greatly exceeds basic expectations 12% (19) 9% (34) 3% (8) 8% (61) 7% (14) 8% (44) 3% (24) 5% (82) Exceeds basic expectations 26% (40) 19% (76) 8% (19) 17% (135) 15% (31) 21% (118) 19% (144) 19% (293) Meets basic expectations 55% (84) 67% (262) 66% (156) 64% (502) 61% (126) 58% (322) 54% (413) 56% (861) Below basic expectations 6% (10) 5% (19) 20% (48) 10% (77) 17% (35) 12% (68) 19% (142) 16% (245) Far below basic expectations 1% (1) <1% (1) 2% (4) 1% (6) <1% (1) <1% (2) 6% (43) 3% (46) Raised pavement markers Greatly exceeds basic expectations 6% (9) 8% (31) 1% (1) 6% (41) 6% (13) 5% (24) 1% (7) 3% (44) Exceeds basic expectations 20% (28) 30% (111) 6% (11) 22% (150) 16% (32) 18% (92) 9% (58) 13% (182) Meets basic expectations 55% (77) 53% (201) 30% (51) 48% (329) 62% (128) 63% (329) 53% (344) 58% (801) Below basic expectations 13% (19) 7% (27) 41% (71) 17% (117) 16% (32) 14% (72) 31% (199) 22% (303) Far below basic expectations 6% (8) 2% (6) 22% (38) 8% (52) <1% (1) 1% (3) 7% (44) 3% (48) Lighting Greatly exceeds basic expectations 8% (9) 7% (19) 5% (8) 6% (36) 3% (5) 4% (18) 2% (15) 3% (38) Exceeds basic expectations 7% (8) 14% (39) 3% (5) 9% (52) 10% (17) 15% (70) 9% (52) 11% (139) Meets basic expectations 64% (69) 47% (133) 41% (68) 49% (270) 78% (136) 73% (333) 71% (432) 73% (901) Below basic expectations 13% (14) 27% (75) 33% (54) 26% (143) 9% (16) 8% (36) 15% (93) 12% (145) Far below basic expectations 7% (7) 6% (17) 18% (30) 10% (54) 1% (1) <1% (1) 2% (13) 1% (15) Smoothness/feel of the road surface Greatly exceeds basic expectations 11% (16) 5% (18) 2% (4) 5% (38) 5% (11) 6% (31) 4% (30) 5% (72) Exceeds basic expectations 23% (34) 16% (63) 15% (34) 17% (131) 12% (24) 26% (141) 13% (100) 17% (265) Meets basic expectations 52% (76) 54% (208) 63% (146) 56% (430) 43% (88) 59% (326) 45% (343) 50% (757) Below basic expectations 14% (20) 23% (88) 16% (38) 19% (146) 33% (68) 9% (51) 34% (255) 25% (374) Far below basic expectations 0% (0) 3% (10) 4% (9) 2% (19) 6% (13) <1% (1) 4% (33) 3% (47) Physical condition of the road surface (i.e., number of potholes/cracks) Greatly exceeds basic expectations 9% (14) 6% (23) 3% (7) 6% (44) 6% (12) 8% (43) 5% (38) 6% (93) Exceeds basic expectations 31% (47) 17% (68) 13% (30) 19% (145) 16% (32) 27% (146) 14% (108) 19% (286) Meets basic expectations 53% (80) 62% (242) 62% (143) 60% (465) 46% (94) 54% (293) 52% (392) 52% (779) Below basic expectations 7% (10) 13% (51) 19% (43) 13% (104) 26% (54) 12% (64) 25% (191) 20% (309) Far below basic expectations 0% (0) 2% (6) 3% (8) 2% (14) 6% (12) <1% (1) 4% (28) 3% (41) Width of lanes Greatly exceeds basic expectations 15% (23) 7% (27) 3% (6) 7% (56) 8% (16) 8% (42) 3% (19) 5% (77) Exceeds basic expectations 18% (27) 15% (56) 9% (20) 13% (103) 16% (33) 26% (145) 12% (92) 18% (270) Meets basic expectations 64% (96) 64% (246) 52% (122) 60% (464) 75% (153) 59% (326) 50% (380) 57% (859) Below basic expectations 3% (4) 13% (50) 32% (75) 17% (129) 1% (3) 6% (35) 29% (220) 17% (258) Far below basic expectations 0% (0) 2% (7) 4% (10) 2% (17) 0% (0) <1% (1) 6% (46) 3% (47) Flow of traffic Greatly exceeds basic expectations 18% (27) 12% (47) 12% (28) 13% (102) 9% (18) 7% (41) 4% (33) 6% (92) Exceeds basic expectations 25% (37) 23% (88) 20% (44) 22% (169) 24% (49) 23% (125) 13% (94) 18% (268) Meets basic expectations 54% (80) 61% (237) 64% (144) 60% (461) 66% (136) 68% (370) 74% (542) 70% (1048) Below basic expectations 3% (5) 4% (16) 4% (9) 4% (30) 1% (2) 2% (12) 7% (48) 4% (62) Far below basic expectations 0% (0) 0% (0) 0% (0) 0% (0) 0% (0) 0% (0) 3% (19) 1% (19) Visibility of signs Greatly exceeds basic expectations 11% (17) 9% (34) 10% (20) 10% (71) 10% (20) 8% (43) 6% (44) 7% (107) Exceeds basic expectations 32% (48) 18% (66) 16% (33) 20% (147) 18% (37) 24% (132) 13% (89) 18% (258) Meets basic expectations 51% (75) 63% (235) 62% (130) 60% (440) 67% (136) 64% (346) 73% (513) 69% (995) Below basic expectations 5% (8) 9% (35) 10% (20) 9% (63) 5% (11) 4% (20) 8% (53) 6% (84) Far below basic expectations 0% (0) 1% (4) 3% (7) 2% (11) 0% (0) 0% (0) 1% (6) <1% (6) Condition of signs Greatly exceeds basic expectations 15% (22) 11% (40) 10% (21) 11% (83) 11% (23) 9% (47) 6% (44) 8% (114) Exceeds basic expectations 32% (48) 19% (74) 18% (38) 21% (160) 19% (38) 23% (122) 12% (84) 17% (244) Meets basic expectations 53% (80) 68% (258) 63% (136) 63% (474) 67% (135) 66% (352) 72% (493) 69% (980) Below basic expectations 1% (1) 2% (7) 9% (20) 4% (28) 2% (5) 2% (10) 8% (54) 5% (69) Far below basic expectations 0% (0) <1% (1) 1% (2) <1% (3) 0% (0) 0% (0) 1% (7) <1% (7) Width of outside (right) shoulders Greatly exceeds basic expectations 14% (20) 3% (11) 1% (3) 5% (34) 8% (17) 6% (31) 3% (24) 5% (72) Exceeds basic expectations 36% (52) 11% (39) 6% (14) 14% (105) 30% (61) 20% (109) 10% (73) 16% (243) Meets basic expectations 44% (64) 41% (149) 42% (93) 42% (306) 60% (121) 58% (313) 58% (431) 58% (865) Below basic expectations 6% (9) 37% (134) 41% (92) 32% (235) 1% (3) 15% (81) 23% (171) 17% (255)

NCDOT 2016-04 Project Report
61
Far below basic expectations 1% (1) 8% (29) 9% (21) 7% (51) 0% (0) 1% (6) 5% (40) 3% (46) Width of inside (left) shoulders Greatly exceeds basic expectations 8% (11) 5% (15) 1% (1) 4% (27) 8% (15) 5% (25) 3% (21) 5% (61) Exceeds basic expectations 25% (34) 9% (28) 6% (12) 11% (74) 22% (44) 18% (90) 11% (72) 16% (206) Meets basic expectations 47% (65) 52% (169) 48% (94) 50% (328) 61% (122) 60% (293) 59% (380) 60% (795) Below basic expectations 18% (25) 28% (92) 34% (67) 28% (184) 10% (19) 16% (79) 21% (135) 18% (233) Far below basic expectations 2% (3) 7% (24) 11% (22) 7% (49) 0% (0) 1% (3) 5% (31) 3% (34) Type of right shoulder (gravel, pavement, etc.) Greatly exceeds basic expectations 9% (12) 3% (9) 1% (3) 3% (24) 7% (15) 5% (28) 3% (20) 4% (63) Exceeds basic expectations 31% (44) 8% (26) 6% (13) 12% (83) 15% (31) 15% (76) 8% (55) 11% (162) Meets basic expectations 49% (69) 61% (212) 60% (125) 58% (406) 76% (153) 69% (356) 68% (479) 70% (988) Below basic expectations 11% (15) 23% (79) 26% (55) 21% (149) 1% (2) 10% (54) 17% (119) 12% (175) Far below basic expectations 1% (1) 6% (20) 6% (13) 5% (34) 0% (0) <1% (2) 4% (31) 2% (33) Mowing & trimming along guard rails Greatly exceeds basic expectations 8% (11) 5% (17) 4% (7) 5% (35) 10% (19) 8% (38) 9% (44) 8% (101) Exceeds basic expectations 27% (39) 15% (52) 6% (11) 15% (102) 10% (19) 18% (88) 14% (69) 15% (176) Meets basic expectations 54% (77) 53% (187) 66% (121) 57% (385) 65% (123) 59% (288) 71% (361) 65% (772) Below basic expectations 10% (14) 23% (79) 21% (38) 19% (131) 15% (28) 14% (70) 6% (30) 11% (128) Far below basic expectations 1% (1) 4% (15) 3% (5) 3% (21) 0% (0) 2% (8) 1% (5) 1% (13) Mowing & trimming of all other areas Greatly exceeds basic expectations 11% (16) 4% (15) 5% (10) 6% (41) 11% (21) 8% (40) 7% (44) 8% (105) Exceeds basic expectations 29% (41) 16% (59) 12% (26) 17% (126) 13% (24) 19% (99) 13% (89) 16% (212) Meets basic expectations 51% (73) 58% (217) 65% (140) 59% (430) 71% (135) 67% (341) 75% (500) 71% (976) Below basic expectations 8% (11) 20% (74) 17% (37) 17% (122) 5% (9) 5% (26) 4% (30) 5% (65) Far below basic expectations 1% (1) 3% (10) 2% (4) 2% (15) 0% (0) <1% (2) 1% (6) 1% (8) Cleanliness (lack of litter/debris) Greatly exceeds basic expectations 9% (13) 10% (37) 8% (19) 9% (69) 10% (19) 8% (41) 7% (51) 8% (111) Exceeds basic expectations 29% (42) 24% (92) 23% (52) 25% (186) 15% (30) 25% (133) 20% (144) 21% (307) Meets basic expectations 48% (69) 56% (212) 58% (130) 55% (411) 66% (128) 53% (284) 63% (447) 60% (859) Below basic expectations 14% (20) 9% (36) 10% (23) 11% (79) 9% (18) 13% (68) 8% (56) 10% (142) Far below basic expectations 0% (0) 1% (3) 1% (2) 1% (5) 0% (0) 1% (5) 1% (9) 1% (14) Overall condition of this highway Greatly exceeds basic expectations 12% (17) 7% (26) 3% (7) 7% (50) 7% (14) 7% (39) 5% (34) 6% (87) Exceeds basic expectations 35% (50) 18% (69) 13% (29) 20% (148) 20% (40) 29% (155) 17% (126) 22% (321) Meets basic expectations 51% (74) 64% (239) 68% (152) 63% (465) 57% (116) 59% (320) 59% (440) 59% (876) Below basic expectations 2% (3) 10% (38) 16% (35) 10% (76) 16% (32) 5% (26) 16% (117) 12% (175) Far below basic expectations 0% (0) 1% (3) 0% (0) <1% (3) 1% (2) <1% (1) 4% (28) 2% (31) Overall appearance of this highway Greatly exceeds basic expectations 11% (16) 8% (30) 6% (13) 8% (59) 9% (19) 8% (43) 6% (46) 7% (108) Exceeds basic expectations 37% (52) 23% (88) 17% (37) 24% (177) 20% (40) 29% (157) 17% (129) 22% (326) Meets basic expectations 51% (72) 60% (228) 68% (152) 61% (452) 59% (120) 58% (313) 61% (449) 59% (882) Below basic expectations 1% (2) 8% (31) 9% (21) 7% (54) 11% (22) 5% (28) 12% (90) 9% (140) Far below basic expectations 0% (0) 1% (4) 0% (0) 1% (4) 1% (2) <1% (1) 4% (26) 2% (29) Feeling of safety on this highway Greatly exceeds basic expectations 21% (31) 11% (42) 4% (8) 11% (81) 9% (17) 10% (54) 7% (52) 8% (123) Exceeds basic expectations 27% (39) 18% (66) 13% (29) 18% (134) 24% (47) 28% (150) 17% (125) 22% (322) Meets basic expectations 49% (71) 63% (237) 63% (141) 60% (449) 58% (116) 57% (309) 58% (426) 58% (851) Below basic expectations 3% (4) 8% (29) 17% (39) 10% (72) 9% (18) 4% (24) 14% (105) 10% (147) Far below basic expectations 0% (0) 1% (3) 3% (7) 1% (10) 1% (2) <1% (2) 3% (23) 2% (27)

NCDOT 2016-04 Project Report
62
8.9. Appendix I: Expectation Ratings for Piedmont Region Piedmont Region Burlington Charlotte Interstate Primary Secondary All Interstate Primary Secondary All Roadway markings (centerline and roadway striping) Greatly exceeds basic expectations 14% (21) 5% (24) 3% (15) 6% (60) 19% (20) 3% (31) 1% (2) 4% (53) Exceeds basic expectations 30% (45) 19% (82) 14% (69) 18% (196) 45% (46) 18% (174) 13% (32) 19% (252) Meets basic expectations 55% (83) 69% (307) 66% (319) 66% (709) 36% (37) 61% (609) 66% (165) 60% (811) Below basic expectations 1% (1) 7% (29) 15% (74) 10% (104) 0% (0) 15% (154) 19% (48) 15% (202) Far below basic expectations 0% (0) 0% (0) 2% (8) 1% (8) 0% (0) 3% (26) 1% (3) 2% (29) Raised pavement markers Greatly exceeds basic expectations 12% (17) 5% (23) 1% (5) 5% (45) 11% (10) 1% (7) 0% (0) 2% (17) Exceeds basic expectations 20% (30) 17% (71) 4% (18) 12% (119) 36% (34) 8% (56) 5% (9) 10% (99) Meets basic expectations 58% (85) 71% (299) 47% (201) 59% (585) 49% (47) 35% (244) 37% (63) 37% (354) Below basic expectations 10% (14) 6% (26) 40% (174) 21% (214) 3% (3) 42% (292) 46% (78) 39% (373) Far below basic expectations 1% (1) <1% (1) 8% (33) 4% (35) 1% (1) 14% (101) 12% (20) 13% (122) Lighting Greatly exceeds basic expectations 12% (17) 3% (14) 1% (4) 4% (35) 3% (2) 2% (18) 1% (2) 2% (22) Exceeds basic expectations 21% (30) 4% (18) 5% (21) 7% (69) 8% (6) 8% (63) 14% (28) 9% (97) Meets basic expectations 49% (69) 62% (251) 56% (249) 57% (569) 40% (31) 45% (355) 55% (112) 46% (498) Below basic expectations 15% (21) 26% (104) 33% (146) 27% (271) 31% (24) 35% (277) 22% (45) 32% (346) Far below basic expectations 4% (5) 5% (19) 6% (25) 5% (49) 19% (15) 10% (79) 7% (15) 10% (109) Smoothness/feel of the road surface Greatly exceeds basic expectations 15% (22) 4% (19) 2% (9) 5% (50) 19% (19) 4% (37) <1% (1) 4% (57) Exceeds basic expectations 32% (47) 11% (47) 9% (42) 13% (136) 54% (55) 19% (191) 9% (22) 20% (268) Meets basic expectations 48% (71) 69% (297) 58% (276) 61% (644) 27% (27) 51% (505) 45% (113) 48% (645) Below basic expectations 5% (8) 14% (62) 30% (143) 20% (213) 0% (0) 21% (209) 38% (94) 23% (303) Far below basic expectations 0% (0) 1% (5) 1% (5) 1% (10) 0% (0) 4% (40) 8% (19) 4% (59) Physical condition of the road surface (i.e., number of potholes/cracks) Greatly exceeds basic expectations 15% (23) 4% (18) 2% (10) 5% (51) 19% (20) 4% (39) 1% (2) 5% (61) Exceeds basic expectations 39% (58) 12% (51) 13% (62) 16% (171) 54% (56) 22% (215) 8% (20) 22% (291) Meets basic expectations 42% (63) 70% (303) 65% (311) 64% (677) 26% (27) 52% (521) 47% (117) 49% (665) Below basic expectations 4% (6) 13% (58) 19% (91) 15% (155) 0% (0) 19% (188) 37% (91) 21% (279) Far below basic expectations 0% (0) 1% (5) <1% (1) 1% (6) 0% (0) 3% (34) 7% (17) 4% (51) Width of lanes Greatly exceeds basic expectations 11% (16) 5% (20) 3% (14) 5% (50) 7% (7) 3% (31) 0% (0) 3% (38) Exceeds basic expectations 32% (47) 10% (42) 7% (35) 12% (124) 40% (41) 22% (216) 6% (14) 20% (271) Meets basic expectations 56% (83) 74% (326) 70% (334) 70% (743) 52% (53) 63% (631) 59% (146) 61% (830) Below basic expectations 2% (3) 11% (50) 20% (94) 14% (147) 1% (1) 12% (116) 32% (79) 14% (196) Far below basic expectations 0% (0) 0% (0) <1% (1) <1% (1) 0% (0) 1% (8) 4% (9) 1% (17) Flow of traffic Greatly exceeds basic expectations 15% (22) 4% (18) 3% (16) 5% (56) 10% (10) 2% (24) <1% (1) 3% (35) Exceeds basic expectations 27% (40) 13% (57) 13% (60) 15% (157) 36% (37) 23% (228) 14% (35) 22% (300) Meets basic expectations 57% (85) 79% (333) 77% (360) 75% (778) 45% (46) 65% (642) 62% (151) 63% (839) Below basic expectations 1% (1) 4% (15) 6% (30) 4% (46) 8% (8) 8% (83) 20% (50) 11% (141) Far below basic expectations 0% (0) 0% (0) 0% (0) 0% (0) 2% (2) 1% (11) 3% (8) 2% (21) Visibility of signs Greatly exceeds basic expectations 15% (22) 4% (19) 4% (21) 6% (62) 11% (11) 3% (27) <1% (1) 3% (39) Exceeds basic expectations 34% (52) 19% (81) 16% (77) 20% (210) 30% (31) 20% (189) 17% (37) 20% (257) Meets basic expectations 48% (73) 73% (313) 72% (342) 69% (728) 56% (57) 67% (642) 67% (146) 66% (845) Below basic expectations 3% (4) 4% (16) 8% (36) 5% (56) 3% (3) 10% (100) 14% (31) 10% (134) Far below basic expectations 0% (0) 0% (0) <1% (2) <1% (2) 0% (0) 1% (7) 1% (2) 1% (9) Condition of signs Greatly exceeds basic expectations 13% (20) 4% (18) 4% (21) 6% (59) 13% (13) 3% (28) <1% (1) 3% (42) Exceeds basic expectations 41% (62) 19% (82) 16% (73) 21% (217) 30% (29) 19% (179) 18% (36) 20% (244) Meets basic expectations 44% (66) 75% (321) 75% (349) 70% (736) 56% (54) 72% (668) 72% (145) 70% (867) Below basic expectations 2% (3) 2% (9) 5% (24) 3% (36) 1% (1) 5% (46) 8% (17) 5% (64) Far below basic expectations 0% (0) 0% (0) <1% (1) <1% (1) 0% (0) 1% (10) 1% (3) 1% (13) Width of outside (right) shoulders Greatly exceeds basic expectations 13% (20) 3% (12) 1% (6) 4% (38) 13% (13) 1% (12) 0% (0) 2% (25) Exceeds basic expectations 29% (43) 5% (22) 6% (27) 9% (92) 52% (53) 12% (109) 5% (10) 14% (172) Meets basic expectations 56% (83) 57% (240) 48% (211) 53% (534) 35% (35) 47% (440) 41% (89) 45% (564) Below basic expectations 2% (3) 35% (145) 43% (188) 33% (336) 0% (0) 34% (322) 42% (90) 33% (412)
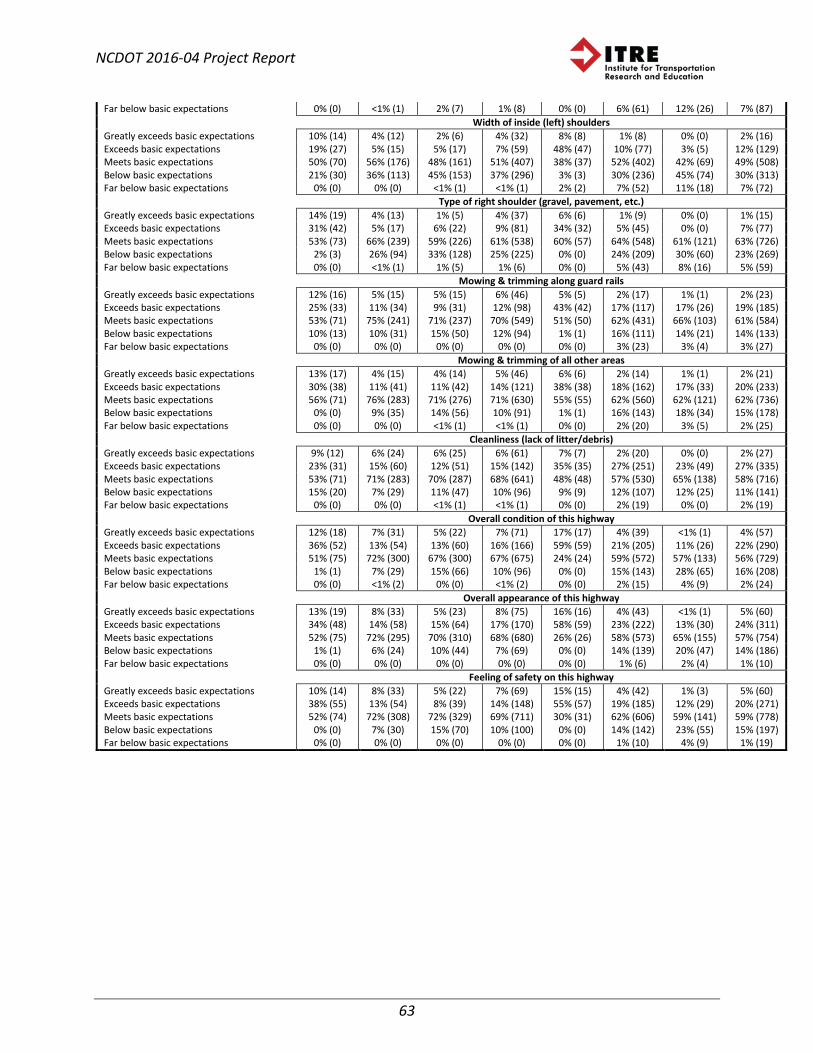
NCDOT 2016-04 Project Report
63
Far below basic expectations 0% (0) <1% (1) 2% (7) 1% (8) 0% (0) 6% (61) 12% (26) 7% (87) Width of inside (left) shoulders Greatly exceeds basic expectations 10% (14) 4% (12) 2% (6) 4% (32) 8% (8) 1% (8) 0% (0) 2% (16) Exceeds basic expectations 19% (27) 5% (15) 5% (17) 7% (59) 48% (47) 10% (77) 3% (5) 12% (129) Meets basic expectations 50% (70) 56% (176) 48% (161) 51% (407) 38% (37) 52% (402) 42% (69) 49% (508) Below basic expectations 21% (30) 36% (113) 45% (153) 37% (296) 3% (3) 30% (236) 45% (74) 30% (313) Far below basic expectations 0% (0) 0% (0) <1% (1) <1% (1) 2% (2) 7% (52) 11% (18) 7% (72) Type of right shoulder (gravel, pavement, etc.) Greatly exceeds basic expectations 14% (19) 4% (13) 1% (5) 4% (37) 6% (6) 1% (9) 0% (0) 1% (15) Exceeds basic expectations 31% (42) 5% (17) 6% (22) 9% (81) 34% (32) 5% (45) 0% (0) 7% (77) Meets basic expectations 53% (73) 66% (239) 59% (226) 61% (538) 60% (57) 64% (548) 61% (121) 63% (726) Below basic expectations 2% (3) 26% (94) 33% (128) 25% (225) 0% (0) 24% (209) 30% (60) 23% (269) Far below basic expectations 0% (0) <1% (1) 1% (5) 1% (6) 0% (0) 5% (43) 8% (16) 5% (59) Mowing & trimming along guard rails Greatly exceeds basic expectations 12% (16) 5% (15) 5% (15) 6% (46) 5% (5) 2% (17) 1% (1) 2% (23) Exceeds basic expectations 25% (33) 11% (34) 9% (31) 12% (98) 43% (42) 17% (117) 17% (26) 19% (185) Meets basic expectations 53% (71) 75% (241) 71% (237) 70% (549) 51% (50) 62% (431) 66% (103) 61% (584) Below basic expectations 10% (13) 10% (31) 15% (50) 12% (94) 1% (1) 16% (111) 14% (21) 14% (133) Far below basic expectations 0% (0) 0% (0) 0% (0) 0% (0) 0% (0) 3% (23) 3% (4) 3% (27) Mowing & trimming of all other areas Greatly exceeds basic expectations 13% (17) 4% (15) 4% (14) 5% (46) 6% (6) 2% (14) 1% (1) 2% (21) Exceeds basic expectations 30% (38) 11% (41) 11% (42) 14% (121) 38% (38) 18% (162) 17% (33) 20% (233) Meets basic expectations 56% (71) 76% (283) 71% (276) 71% (630) 55% (55) 62% (560) 62% (121) 62% (736) Below basic expectations 0% (0) 9% (35) 14% (56) 10% (91) 1% (1) 16% (143) 18% (34) 15% (178) Far below basic expectations 0% (0) 0% (0) <1% (1) <1% (1) 0% (0) 2% (20) 3% (5) 2% (25) Cleanliness (lack of litter/debris) Greatly exceeds basic expectations 9% (12) 6% (24) 6% (25) 6% (61) 7% (7) 2% (20) 0% (0) 2% (27) Exceeds basic expectations 23% (31) 15% (60) 12% (51) 15% (142) 35% (35) 27% (251) 23% (49) 27% (335) Meets basic expectations 53% (71) 71% (283) 70% (287) 68% (641) 48% (48) 57% (530) 65% (138) 58% (716) Below basic expectations 15% (20) 7% (29) 11% (47) 10% (96) 9% (9) 12% (107) 12% (25) 11% (141) Far below basic expectations 0% (0) 0% (0) <1% (1) <1% (1) 0% (0) 2% (19) 0% (0) 2% (19) Overall condition of this highway Greatly exceeds basic expectations 12% (18) 7% (31) 5% (22) 7% (71) 17% (17) 4% (39) <1% (1) 4% (57) Exceeds basic expectations 36% (52) 13% (54) 13% (60) 16% (166) 59% (59) 21% (205) 11% (26) 22% (290) Meets basic expectations 51% (75) 72% (300) 67% (300) 67% (675) 24% (24) 59% (572) 57% (133) 56% (729) Below basic expectations 1% (1) 7% (29) 15% (66) 10% (96) 0% (0) 15% (143) 28% (65) 16% (208) Far below basic expectations 0% (0) <1% (2) 0% (0) <1% (2) 0% (0) 2% (15) 4% (9) 2% (24) Overall appearance of this highway Greatly exceeds basic expectations 13% (19) 8% (33) 5% (23) 8% (75) 16% (16) 4% (43) <1% (1) 5% (60) Exceeds basic expectations 34% (48) 14% (58) 15% (64) 17% (170) 58% (59) 23% (222) 13% (30) 24% (311) Meets basic expectations 52% (75) 72% (295) 70% (310) 68% (680) 26% (26) 58% (573) 65% (155) 57% (754) Below basic expectations 1% (1) 6% (24) 10% (44) 7% (69) 0% (0) 14% (139) 20% (47) 14% (186) Far below basic expectations 0% (0) 0% (0) 0% (0) 0% (0) 0% (0) 1% (6) 2% (4) 1% (10) Feeling of safety on this highway Greatly exceeds basic expectations 10% (14) 8% (33) 5% (22) 7% (69) 15% (15) 4% (42) 1% (3) 5% (60) Exceeds basic expectations 38% (55) 13% (54) 8% (39) 14% (148) 55% (57) 19% (185) 12% (29) 20% (271) Meets basic expectations 52% (74) 72% (308) 72% (329) 69% (711) 30% (31) 62% (606) 59% (141) 59% (778) Below basic expectations 0% (0) 7% (30) 15% (70) 10% (100) 0% (0) 14% (142) 23% (55) 15% (197) Far below basic expectations 0% (0) 0% (0) 0% (0) 0% (0) 0% (0) 1% (10) 4% (9) 1% (19)
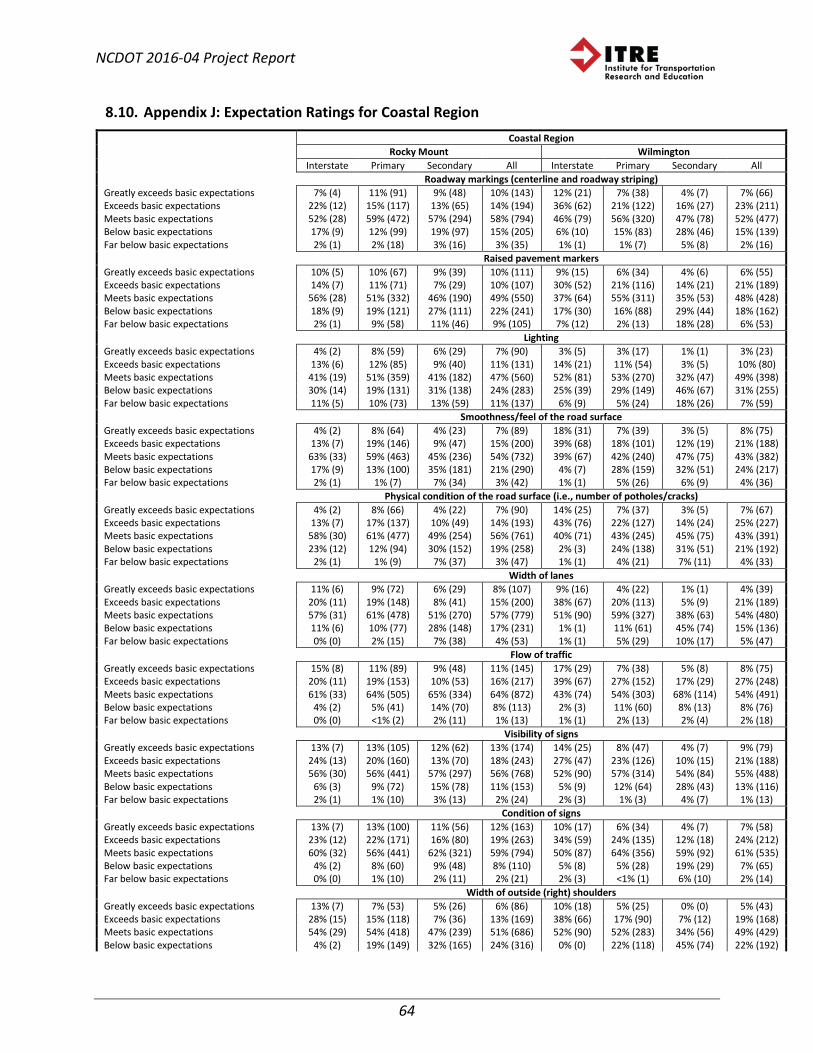
NCDOT 2016-04 Project Report
64
8.10. Appendix J: Expectation Ratings for Coastal Region Coastal Region Rocky Mount Wilmington Interstate Primary Secondary All Interstate Primary Secondary All Roadway markings (centerline and roadway striping) Greatly exceeds basic expectations 7% (4) 11% (91) 9% (48) 10% (143) 12% (21) 7% (38) 4% (7) 7% (66) Exceeds basic expectations 22% (12) 15% (117) 13% (65) 14% (194) 36% (62) 21% (122) 16% (27) 23% (211) Meets basic expectations 52% (28) 59% (472) 57% (294) 58% (794) 46% (79) 56% (320) 47% (78) 52% (477) Below basic expectations 17% (9) 12% (99) 19% (97) 15% (205) 6% (10) 15% (83) 28% (46) 15% (139) Far below basic expectations 2% (1) 2% (18) 3% (16) 3% (35) 1% (1) 1% (7) 5% (8) 2% (16) Raised pavement markers Greatly exceeds basic expectations 10% (5) 10% (67) 9% (39) 10% (111) 9% (15) 6% (34) 4% (6) 6% (55) Exceeds basic expectations 14% (7) 11% (71) 7% (29) 10% (107) 30% (52) 21% (116) 14% (21) 21% (189) Meets basic expectations 56% (28) 51% (332) 46% (190) 49% (550) 37% (64) 55% (311) 35% (53) 48% (428) Below basic expectations 18% (9) 19% (121) 27% (111) 22% (241) 17% (30) 16% (88) 29% (44) 18% (162) Far below basic expectations 2% (1) 9% (58) 11% (46) 9% (105) 7% (12) 2% (13) 18% (28) 6% (53) Lighting Greatly exceeds basic expectations 4% (2) 8% (59) 6% (29) 7% (90) 3% (5) 3% (17) 1% (1) 3% (23) Exceeds basic expectations 13% (6) 12% (85) 9% (40) 11% (131) 14% (21) 11% (54) 3% (5) 10% (80) Meets basic expectations 41% (19) 51% (359) 41% (182) 47% (560) 52% (81) 53% (270) 32% (47) 49% (398) Below basic expectations 30% (14) 19% (131) 31% (138) 24% (283) 25% (39) 29% (149) 46% (67) 31% (255) Far below basic expectations 11% (5) 10% (73) 13% (59) 11% (137) 6% (9) 5% (24) 18% (26) 7% (59) Smoothness/feel of the road surface Greatly exceeds basic expectations 4% (2) 8% (64) 4% (23) 7% (89) 18% (31) 7% (39) 3% (5) 8% (75) Exceeds basic expectations 13% (7) 19% (146) 9% (47) 15% (200) 39% (68) 18% (101) 12% (19) 21% (188) Meets basic expectations 63% (33) 59% (463) 45% (236) 54% (732) 39% (67) 42% (240) 47% (75) 43% (382) Below basic expectations 17% (9) 13% (100) 35% (181) 21% (290) 4% (7) 28% (159) 32% (51) 24% (217) Far below basic expectations 2% (1) 1% (7) 7% (34) 3% (42) 1% (1) 5% (26) 6% (9) 4% (36) Physical condition of the road surface (i.e., number of potholes/cracks) Greatly exceeds basic expectations 4% (2) 8% (66) 4% (22) 7% (90) 14% (25) 7% (37) 3% (5) 7% (67) Exceeds basic expectations 13% (7) 17% (137) 10% (49) 14% (193) 43% (76) 22% (127) 14% (24) 25% (227) Meets basic expectations 58% (30) 61% (477) 49% (254) 56% (761) 40% (71) 43% (245) 45% (75) 43% (391) Below basic expectations 23% (12) 12% (94) 30% (152) 19% (258) 2% (3) 24% (138) 31% (51) 21% (192) Far below basic expectations 2% (1) 1% (9) 7% (37) 3% (47) 1% (1) 4% (21) 7% (11) 4% (33) Width of lanes Greatly exceeds basic expectations 11% (6) 9% (72) 6% (29) 8% (107) 9% (16) 4% (22) 1% (1) 4% (39) Exceeds basic expectations 20% (11) 19% (148) 8% (41) 15% (200) 38% (67) 20% (113) 5% (9) 21% (189) Meets basic expectations 57% (31) 61% (478) 51% (270) 57% (779) 51% (90) 59% (327) 38% (63) 54% (480) Below basic expectations 11% (6) 10% (77) 28% (148) 17% (231) 1% (1) 11% (61) 45% (74) 15% (136) Far below basic expectations 0% (0) 2% (15) 7% (38) 4% (53) 1% (1) 5% (29) 10% (17) 5% (47) Flow of traffic Greatly exceeds basic expectations 15% (8) 11% (89) 9% (48) 11% (145) 17% (29) 7% (38) 5% (8) 8% (75) Exceeds basic expectations 20% (11) 19% (153) 10% (53) 16% (217) 39% (67) 27% (152) 17% (29) 27% (248) Meets basic expectations 61% (33) 64% (505) 65% (334) 64% (872) 43% (74) 54% (303) 68% (114) 54% (491) Below basic expectations 4% (2) 5% (41) 14% (70) 8% (113) 2% (3) 11% (60) 8% (13) 8% (76) Far below basic expectations 0% (0) <1% (2) 2% (11) 1% (13) 1% (1) 2% (13) 2% (4) 2% (18) Visibility of signs Greatly exceeds basic expectations 13% (7) 13% (105) 12% (62) 13% (174) 14% (25) 8% (47) 4% (7) 9% (79) Exceeds basic expectations 24% (13) 20% (160) 13% (70) 18% (243) 27% (47) 23% (126) 10% (15) 21% (188) Meets basic expectations 56% (30) 56% (441) 57% (297) 56% (768) 52% (90) 57% (314) 54% (84) 55% (488) Below basic expectations 6% (3) 9% (72) 15% (78) 11% (153) 5% (9) 12% (64) 28% (43) 13% (116) Far below basic expectations 2% (1) 1% (10) 3% (13) 2% (24) 2% (3) 1% (3) 4% (7) 1% (13) Condition of signs Greatly exceeds basic expectations 13% (7) 13% (100) 11% (56) 12% (163) 10% (17) 6% (34) 4% (7) 7% (58) Exceeds basic expectations 23% (12) 22% (171) 16% (80) 19% (263) 34% (59) 24% (135) 12% (18) 24% (212) Meets basic expectations 60% (32) 56% (441) 62% (321) 59% (794) 50% (87) 64% (356) 59% (92) 61% (535) Below basic expectations 4% (2) 8% (60) 9% (48) 8% (110) 5% (8) 5% (28) 19% (29) 7% (65) Far below basic expectations 0% (0) 1% (10) 2% (11) 2% (21) 2% (3) <1% (1) 6% (10) 2% (14) Width of outside (right) shoulders Greatly exceeds basic expectations 13% (7) 7% (53) 5% (26) 6% (86) 10% (18) 5% (25) 0% (0) 5% (43) Exceeds basic expectations 28% (15) 15% (118) 7% (36) 13% (169) 38% (66) 17% (90) 7% (12) 19% (168) Meets basic expectations 54% (29) 54% (418) 47% (239) 51% (686) 52% (90) 52% (283) 34% (56) 49% (429) Below basic expectations 4% (2) 19% (149) 32% (165) 24% (316) 0% (0) 22% (118) 45% (74) 22% (192)
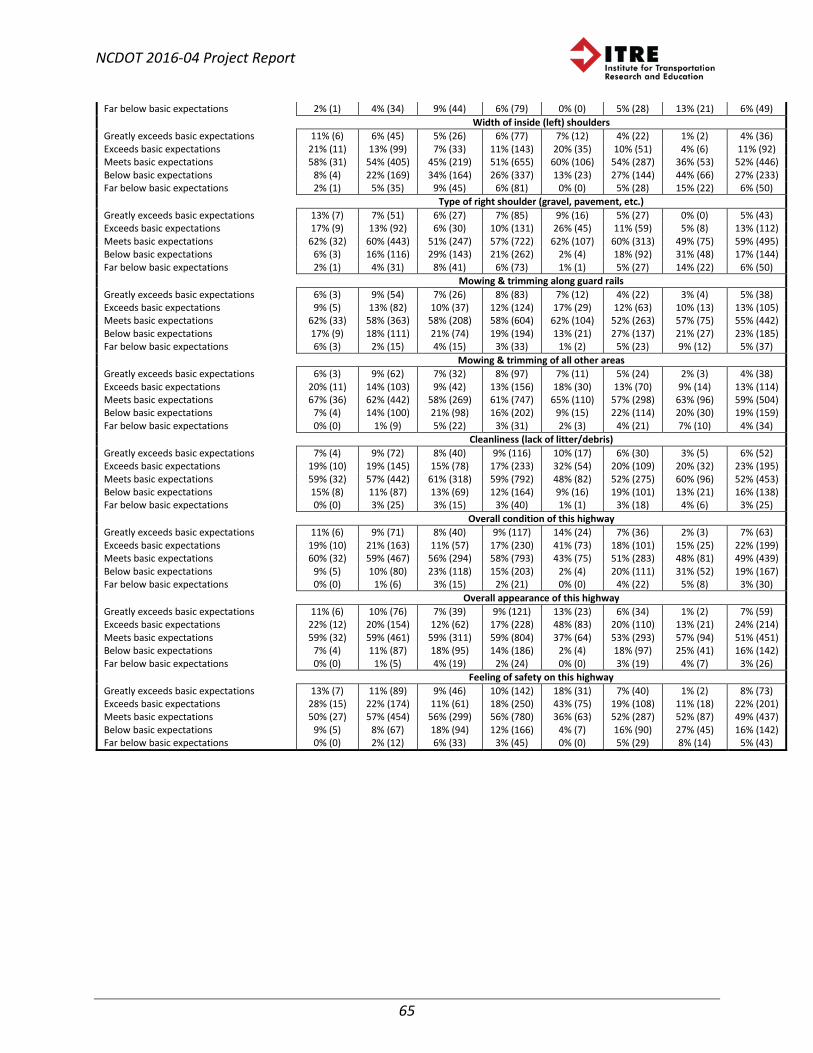
NCDOT 2016-04 Project Report
65
Far below basic expectations 2% (1) 4% (34) 9% (44) 6% (79) 0% (0) 5% (28) 13% (21) 6% (49) Width of inside (left) shoulders Greatly exceeds basic expectations 11% (6) 6% (45) 5% (26) 6% (77) 7% (12) 4% (22) 1% (2) 4% (36) Exceeds basic expectations 21% (11) 13% (99) 7% (33) 11% (143) 20% (35) 10% (51) 4% (6) 11% (92) Meets basic expectations 58% (31) 54% (405) 45% (219) 51% (655) 60% (106) 54% (287) 36% (53) 52% (446) Below basic expectations 8% (4) 22% (169) 34% (164) 26% (337) 13% (23) 27% (144) 44% (66) 27% (233) Far below basic expectations 2% (1) 5% (35) 9% (45) 6% (81) 0% (0) 5% (28) 15% (22) 6% (50) Type of right shoulder (gravel, pavement, etc.) Greatly exceeds basic expectations 13% (7) 7% (51) 6% (27) 7% (85) 9% (16) 5% (27) 0% (0) 5% (43) Exceeds basic expectations 17% (9) 13% (92) 6% (30) 10% (131) 26% (45) 11% (59) 5% (8) 13% (112) Meets basic expectations 62% (32) 60% (443) 51% (247) 57% (722) 62% (107) 60% (313) 49% (75) 59% (495) Below basic expectations 6% (3) 16% (116) 29% (143) 21% (262) 2% (4) 18% (92) 31% (48) 17% (144) Far below basic expectations 2% (1) 4% (31) 8% (41) 6% (73) 1% (1) 5% (27) 14% (22) 6% (50) Mowing & trimming along guard rails Greatly exceeds basic expectations 6% (3) 9% (54) 7% (26) 8% (83) 7% (12) 4% (22) 3% (4) 5% (38) Exceeds basic expectations 9% (5) 13% (82) 10% (37) 12% (124) 17% (29) 12% (63) 10% (13) 13% (105) Meets basic expectations 62% (33) 58% (363) 58% (208) 58% (604) 62% (104) 52% (263) 57% (75) 55% (442) Below basic expectations 17% (9) 18% (111) 21% (74) 19% (194) 13% (21) 27% (137) 21% (27) 23% (185) Far below basic expectations 6% (3) 2% (15) 4% (15) 3% (33) 1% (2) 5% (23) 9% (12) 5% (37) Mowing & trimming of all other areas Greatly exceeds basic expectations 6% (3) 9% (62) 7% (32) 8% (97) 7% (11) 5% (24) 2% (3) 4% (38) Exceeds basic expectations 20% (11) 14% (103) 9% (42) 13% (156) 18% (30) 13% (70) 9% (14) 13% (114) Meets basic expectations 67% (36) 62% (442) 58% (269) 61% (747) 65% (110) 57% (298) 63% (96) 59% (504) Below basic expectations 7% (4) 14% (100) 21% (98) 16% (202) 9% (15) 22% (114) 20% (30) 19% (159) Far below basic expectations 0% (0) 1% (9) 5% (22) 3% (31) 2% (3) 4% (21) 7% (10) 4% (34) Cleanliness (lack of litter/debris) Greatly exceeds basic expectations 7% (4) 9% (72) 8% (40) 9% (116) 10% (17) 6% (30) 3% (5) 6% (52) Exceeds basic expectations 19% (10) 19% (145) 15% (78) 17% (233) 32% (54) 20% (109) 20% (32) 23% (195) Meets basic expectations 59% (32) 57% (442) 61% (318) 59% (792) 48% (82) 52% (275) 60% (96) 52% (453) Below basic expectations 15% (8) 11% (87) 13% (69) 12% (164) 9% (16) 19% (101) 13% (21) 16% (138) Far below basic expectations 0% (0) 3% (25) 3% (15) 3% (40) 1% (1) 3% (18) 4% (6) 3% (25) Overall condition of this highway Greatly exceeds basic expectations 11% (6) 9% (71) 8% (40) 9% (117) 14% (24) 7% (36) 2% (3) 7% (63) Exceeds basic expectations 19% (10) 21% (163) 11% (57) 17% (230) 41% (73) 18% (101) 15% (25) 22% (199) Meets basic expectations 60% (32) 59% (467) 56% (294) 58% (793) 43% (75) 51% (283) 48% (81) 49% (439) Below basic expectations 9% (5) 10% (80) 23% (118) 15% (203) 2% (4) 20% (111) 31% (52) 19% (167) Far below basic expectations 0% (0) 1% (6) 3% (15) 2% (21) 0% (0) 4% (22) 5% (8) 3% (30) Overall appearance of this highway Greatly exceeds basic expectations 11% (6) 10% (76) 7% (39) 9% (121) 13% (23) 6% (34) 1% (2) 7% (59) Exceeds basic expectations 22% (12) 20% (154) 12% (62) 17% (228) 48% (83) 20% (110) 13% (21) 24% (214) Meets basic expectations 59% (32) 59% (461) 59% (311) 59% (804) 37% (64) 53% (293) 57% (94) 51% (451) Below basic expectations 7% (4) 11% (87) 18% (95) 14% (186) 2% (4) 18% (97) 25% (41) 16% (142) Far below basic expectations 0% (0) 1% (5) 4% (19) 2% (24) 0% (0) 3% (19) 4% (7) 3% (26) Feeling of safety on this highway Greatly exceeds basic expectations 13% (7) 11% (89) 9% (46) 10% (142) 18% (31) 7% (40) 1% (2) 8% (73) Exceeds basic expectations 28% (15) 22% (174) 11% (61) 18% (250) 43% (75) 19% (108) 11% (18) 22% (201) Meets basic expectations 50% (27) 57% (454) 56% (299) 56% (780) 36% (63) 52% (287) 52% (87) 49% (437) Below basic expectations 9% (5) 8% (67) 18% (94) 12% (166) 4% (7) 16% (90) 27% (45) 16% (142) Far below basic expectations 0% (0) 2% (12) 6% (33) 3% (45) 0% (0) 5% (29) 8% (14) 5% (43)
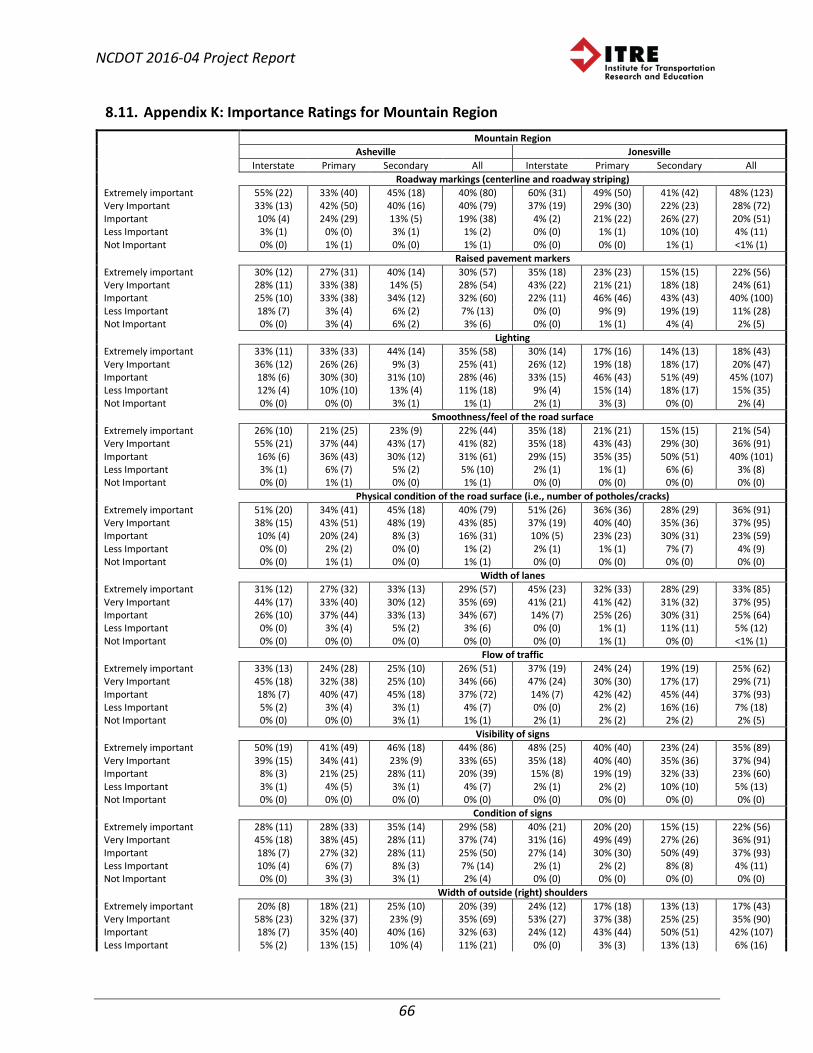
NCDOT 2016-04 Project Report
66
8.11. Appendix K: Importance Ratings for Mountain Region Mountain Region Asheville Jonesville Interstate Primary Secondary All Interstate Primary Secondary All Roadway markings (centerline and roadway striping) Extremely important 55% (22) 33% (40) 45% (18) 40% (80) 60% (31) 49% (50) 41% (42) 48% (123) Very Important 33% (13) 42% (50) 40% (16) 40% (79) 37% (19) 29% (30) 22% (23) 28% (72) Important 10% (4) 24% (29) 13% (5) 19% (38) 4% (2) 21% (22) 26% (27) 20% (51) Less Important 3% (1) 0% (0) 3% (1) 1% (2) 0% (0) 1% (1) 10% (10) 4% (11) Not Important 0% (0) 1% (1) 0% (0) 1% (1) 0% (0) 0% (0) 1% (1) <1% (1) Raised pavement markers Extremely important 30% (12) 27% (31) 40% (14) 30% (57) 35% (18) 23% (23) 15% (15) 22% (56) Very Important 28% (11) 33% (38) 14% (5) 28% (54) 43% (22) 21% (21) 18% (18) 24% (61) Important 25% (10) 33% (38) 34% (12) 32% (60) 22% (11) 46% (46) 43% (43) 40% (100) Less Important 18% (7) 3% (4) 6% (2) 7% (13) 0% (0) 9% (9) 19% (19) 11% (28) Not Important 0% (0) 3% (4) 6% (2) 3% (6) 0% (0) 1% (1) 4% (4) 2% (5) Lighting Extremely important 33% (11) 33% (33) 44% (14) 35% (58) 30% (14) 17% (16) 14% (13) 18% (43) Very Important 36% (12) 26% (26) 9% (3) 25% (41) 26% (12) 19% (18) 18% (17) 20% (47) Important 18% (6) 30% (30) 31% (10) 28% (46) 33% (15) 46% (43) 51% (49) 45% (107) Less Important 12% (4) 10% (10) 13% (4) 11% (18) 9% (4) 15% (14) 18% (17) 15% (35) Not Important 0% (0) 0% (0) 3% (1) 1% (1) 2% (1) 3% (3) 0% (0) 2% (4) Smoothness/feel of the road surface Extremely important 26% (10) 21% (25) 23% (9) 22% (44) 35% (18) 21% (21) 15% (15) 21% (54) Very Important 55% (21) 37% (44) 43% (17) 41% (82) 35% (18) 43% (43) 29% (30) 36% (91) Important 16% (6) 36% (43) 30% (12) 31% (61) 29% (15) 35% (35) 50% (51) 40% (101) Less Important 3% (1) 6% (7) 5% (2) 5% (10) 2% (1) 1% (1) 6% (6) 3% (8) Not Important 0% (0) 1% (1) 0% (0) 1% (1) 0% (0) 0% (0) 0% (0) 0% (0) Physical condition of the road surface (i.e., number of potholes/cracks) Extremely important 51% (20) 34% (41) 45% (18) 40% (79) 51% (26) 36% (36) 28% (29) 36% (91) Very Important 38% (15) 43% (51) 48% (19) 43% (85) 37% (19) 40% (40) 35% (36) 37% (95) Important 10% (4) 20% (24) 8% (3) 16% (31) 10% (5) 23% (23) 30% (31) 23% (59) Less Important 0% (0) 2% (2) 0% (0) 1% (2) 2% (1) 1% (1) 7% (7) 4% (9) Not Important 0% (0) 1% (1) 0% (0) 1% (1) 0% (0) 0% (0) 0% (0) 0% (0) Width of lanes Extremely important 31% (12) 27% (32) 33% (13) 29% (57) 45% (23) 32% (33) 28% (29) 33% (85) Very Important 44% (17) 33% (40) 30% (12) 35% (69) 41% (21) 41% (42) 31% (32) 37% (95) Important 26% (10) 37% (44) 33% (13) 34% (67) 14% (7) 25% (26) 30% (31) 25% (64) Less Important 0% (0) 3% (4) 5% (2) 3% (6) 0% (0) 1% (1) 11% (11) 5% (12) Not Important 0% (0) 0% (0) 0% (0) 0% (0) 0% (0) 1% (1) 0% (0) <1% (1) Flow of traffic Extremely important 33% (13) 24% (28) 25% (10) 26% (51) 37% (19) 24% (24) 19% (19) 25% (62) Very Important 45% (18) 32% (38) 25% (10) 34% (66) 47% (24) 30% (30) 17% (17) 29% (71) Important 18% (7) 40% (47) 45% (18) 37% (72) 14% (7) 42% (42) 45% (44) 37% (93) Less Important 5% (2) 3% (4) 3% (1) 4% (7) 0% (0) 2% (2) 16% (16) 7% (18) Not Important 0% (0) 0% (0) 3% (1) 1% (1) 2% (1) 2% (2) 2% (2) 2% (5) Visibility of signs Extremely important 50% (19) 41% (49) 46% (18) 44% (86) 48% (25) 40% (40) 23% (24) 35% (89) Very Important 39% (15) 34% (41) 23% (9) 33% (65) 35% (18) 40% (40) 35% (36) 37% (94) Important 8% (3) 21% (25) 28% (11) 20% (39) 15% (8) 19% (19) 32% (33) 23% (60) Less Important 3% (1) 4% (5) 3% (1) 4% (7) 2% (1) 2% (2) 10% (10) 5% (13) Not Important 0% (0) 0% (0) 0% (0) 0% (0) 0% (0) 0% (0) 0% (0) 0% (0) Condition of signs Extremely important 28% (11) 28% (33) 35% (14) 29% (58) 40% (21) 20% (20) 15% (15) 22% (56) Very Important 45% (18) 38% (45) 28% (11) 37% (74) 31% (16) 49% (49) 27% (26) 36% (91) Important 18% (7) 27% (32) 28% (11) 25% (50) 27% (14) 30% (30) 50% (49) 37% (93) Less Important 10% (4) 6% (7) 8% (3) 7% (14) 2% (1) 2% (2) 8% (8) 4% (11) Not Important 0% (0) 3% (3) 3% (1) 2% (4) 0% (0) 0% (0) 0% (0) 0% (0) Width of outside (right) shoulders Extremely important 20% (8) 18% (21) 25% (10) 20% (39) 24% (12) 17% (18) 13% (13) 17% (43) Very Important 58% (23) 32% (37) 23% (9) 35% (69) 53% (27) 37% (38) 25% (25) 35% (90) Important 18% (7) 35% (40) 40% (16) 32% (63) 24% (12) 43% (44) 50% (51) 42% (107) Less Important 5% (2) 13% (15) 10% (4) 11% (21) 0% (0) 3% (3) 13% (13) 6% (16)

NCDOT 2016-04 Project Report
67
Not Important 0% (0) 2% (2) 3% (1) 2% (3) 0% (0) 0% (0) 0% (0) 0% (0) Width of inside (left) shoulders Extremely important 11% (4) 15% (17) 23% (9) 16% (30) 20% (10) 14% (13) 11% (10) 14% (33) Very Important 57% (21) 30% (34) 28% (11) 35% (66) 48% (24) 32% (30) 23% (22) 32% (76) Important 19% (7) 38% (42) 33% (13) 33% (62) 30% (15) 42% (40) 49% (47) 43% (102) Less Important 14% (5) 13% (15) 10% (4) 13% (24) 2% (1) 11% (10) 17% (16) 11% (27) Not Important 0% (0) 4% (4) 5% (2) 3% (6) 0% (0) 2% (2) 0% (0) 1% (2) Type of right shoulder (gravel, pavement, etc.) Extremely important 23% (9) 14% (15) 21% (8) 17% (32) 18% (9) 8% (8) 8% (8) 10% (25) Very Important 31% (12) 24% (27) 21% (8) 25% (47) 33% (17) 25% (25) 20% (19) 25% (61) Important 28% (11) 39% (43) 34% (13) 36% (67) 43% (22) 53% (52) 55% (53) 51% (127) Less Important 13% (5) 20% (22) 18% (7) 18% (34) 6% (3) 13% (13) 16% (16) 13% (32) Not Important 5% (2) 4% (4) 5% (2) 4% (8) 0% (0) 1% (1) 1% (1) 1% (2) Mowing & trimming along guard rails Extremely important 3% (1) 6% (7) 13% (5) 7% (13) 8% (4) 8% (8) 7% (6) 8% (18) Very Important 21% (8) 14% (16) 13% (5) 15% (29) 21% (11) 18% (18) 11% (10) 16% (39) Important 46% (18) 56% (65) 50% (19) 53% (102) 52% (27) 46% (46) 53% (46) 50% (119) Less Important 21% (8) 21% (24) 16% (6) 20% (38) 19% (10) 29% (29) 25% (22) 25% (61) Not Important 10% (4) 3% (4) 8% (3) 6% (11) 0% (0) 0% (0) 3% (3) 1% (3) Mowing & trimming of all other areas Extremely important 5% (2) 5% (6) 10% (4) 6% (12) 8% (4) 7% (7) 7% (7) 7% (18) Very Important 24% (9) 16% (19) 15% (6) 18% (34) 22% (11) 25% (25) 10% (10) 18% (46) Important 37% (14) 54% (63) 54% (21) 51% (98) 55% (28) 47% (47) 55% (54) 52% (129) Less Important 29% (11) 20% (23) 13% (5) 20% (39) 16% (8) 22% (22) 27% (26) 22% (56) Not Important 5% (2) 5% (6) 8% (3) 6% (11) 0% (0) 0% (0) 1% (1) <1% (1) Cleanliness (lack of litter/debris) Extremely important 16% (6) 17% (19) 18% (7) 17% (32) 15% (8) 15% (15) 13% (13) 14% (36) Very Important 39% (15) 30% (35) 23% (9) 31% (59) 23% (12) 23% (23) 16% (16) 20% (51) Important 29% (11) 40% (46) 44% (17) 39% (74) 58% (30) 48% (48) 54% (55) 53% (133) Less Important 16% (6) 10% (12) 10% (4) 11% (22) 4% (2) 12% (12) 17% (17) 12% (31) Not Important 0% (0) 3% (3) 5% (2) 3% (5) 0% (0) 2% (2) 0% (0) 1% (2) Overall condition of this highway Extremely important 34% (13) 29% (33) 36% (14) 31% (60) 50% (26) 32% (32) 28% (29) 34% (87) Very Important 45% (17) 43% (49) 21% (8) 39% (74) 31% (16) 46% (46) 27% (28) 35% (90) Important 21% (8) 26% (30) 44% (17) 29% (55) 17% (9) 23% (23) 36% (37) 27% (69) Less Important 0% (0) 3% (3) 0% (0) 2% (3) 2% (1) 0% (0) 8% (8) 4% (9) Not Important 0% (0) 0% (0) 0% (0) 0% (0) 0% (0) 0% (0) 0% (0) 0% (0) Overall appearance of this highway Extremely important 13% (5) 17% (20) 20% (8) 17% (33) 23% (12) 15% (15) 22% (22) 19% (49) Very Important 58% (22) 29% (34) 23% (9) 34% (65) 35% (18) 39% (39) 23% (23) 32% (80) Important 29% (11) 49% (57) 48% (19) 45% (87) 37% (19) 43% (43) 42% (42) 41% (104) Less Important 0% (0) 4% (5) 10% (4) 5% (9) 6% (3) 4% (4) 11% (11) 7% (18) Not Important 0% (0) 0% (0) 0% (0) 0% (0) 0% (0) 0% (0) 1% (1) <1% (1) Feeling of safety on this highway Extremely important 57% (21) 43% (51) 51% (20) 47% (92) 65% (34) 48% (49) 41% (41) 49% (124) Very Important 32% (12) 33% (39) 26% (10) 31% (61) 23% (12) 36% (37) 23% (23) 28% (72) Important 11% (4) 23% (28) 23% (9) 21% (41) 10% (5) 15% (15) 27% (27) 18% (47) Less Important 0% (0) 1% (1) 0% (0) 1% (1) 2% (1) 1% (1) 9% (9) 4% (11) Not Important 0% (0) 1% (1) 0% (0) 1% (1) 0% (0) 0% (0) 1% (1) <1% (1)

NCDOT 2016-04 Project Report
68
8.12. Appendix L: Importance Ratings for Piedmont Region Piedmont Region Burlington Charlotte Interstate Primary Secondary All Interstate Primary Secondary All Roadway markings (centerline and roadway striping) Extremely important 48% (37) 35% (27) 25% (15) 37% (79) 42% (22) 45% (47) 32% (33) 40% (102) Very Important 39% (30) 39% (30) 37% (22) 38% (82) 52% (27) 38% (39) 46% (47) 44% (113) Important 12% (9) 26% (20) 34% (20) 23% (49) 6% (3) 13% (14) 21% (21) 15% (38) Less Important 1% (1) 0% (0) 3% (2) 1% (3) 0% (0) 4% (4) 1% (1) 2% (5) Not Important 0% (0) 0% (0) 0% (0) 0% (0) 0% (0) 0% (0) 0% (0) 0% (0) Raised pavement markers Extremely important 33% (25) 18% (13) 6% (3) 20% (41) 44% (22) 12% (11) 10% (9) 18% (42) Very Important 32% (24) 47% (35) 20% (11) 34% (70) 32% (16) 31% (29) 27% (25) 30% (70) Important 30% (23) 27% (20) 52% (28) 35% (71) 18% (9) 34% (32) 34% (31) 31% (72) Less Important 5% (4) 7% (5) 20% (11) 10% (20) 2% (1) 18% (17) 21% (19) 16% (37) Not Important 0% (0) 1% (1) 2% (1) 1% (2) 4% (2) 4% (4) 8% (7) 6% (13) Lighting Extremely important 25% (19) 7% (5) 4% (2) 13% (26) 27% (13) 27% (25) 25% (24) 26% (62) Very Important 42% (32) 34% (25) 35% (19) 37% (76) 27% (13) 32% (30) 28% (27) 29% (70) Important 32% (24) 37% (27) 31% (17) 33% (68) 27% (13) 29% (27) 30% (29) 29% (69) Less Important 1% (1) 18% (13) 26% (14) 14% (28) 17% (8) 11% (10) 16% (15) 14% (33) Not Important 0% (0) 4% (3) 4% (2) 2% (5) 2% (1) 2% (2) 1% (1) 2% (4) Smoothness/feel of the road surface Extremely important 26% (20) 7% (5) 13% (7) 15% (32) 33% (17) 17% (17) 14% (14) 19% (48) Very Important 44% (34) 37% (28) 27% (15) 37% (77) 42% (22) 35% (35) 38% (39) 38% (96) Important 29% (22) 53% (40) 48% (27) 43% (89) 25% (13) 43% (43) 43% (44) 39% (100) Less Important 1% (1) 4% (3) 13% (7) 5% (11) 0% (0) 5% (5) 6% (6) 4% (11) Not Important 0% (0) 0% (0) 0% (0) 0% (0) 0% (0) 0% (0) 0% (0) 0% (0) Physical condition of the road surface (i.e., number of potholes/cracks) Extremely important 37% (28) 19% (15) 17% (10) 25% (53) 44% (23) 27% (28) 23% (24) 29% (75) Very Important 46% (35) 52% (40) 38% (22) 46% (97) 44% (23) 44% (46) 45% (47) 45% (116) Important 16% (12) 26% (20) 41% (24) 27% (56) 12% (6) 24% (25) 28% (29) 23% (60) Less Important 1% (1) 3% (2) 3% (2) 2% (5) 0% (0) 5% (5) 4% (4) 3% (9) Not Important 0% (0) 0% (0) 0% (0) 0% (0) 0% (0) 0% (0) 0% (0) 0% (0) Width of lanes Extremely important 25% (19) 13% (10) 11% (6) 17% (35) 29% (15) 21% (22) 13% (14) 20% (51) Very Important 59% (44) 45% (34) 38% (21) 48% (99) 48% (25) 42% (43) 54% (56) 48% (124) Important 16% (12) 38% (29) 43% (24) 31% (65) 21% (11) 32% (33) 26% (27) 27% (71) Less Important 0% (0) 4% (3) 9% (5) 4% (8) 2% (1) 5% (5) 7% (7) 5% (13) Not Important 0% (0) 0% (0) 0% (0) 0% (0) 0% (0) 0% (0) 0% (0) 0% (0) Flow of traffic Extremely important 26% (19) 9% (7) 10% (6) 15% (32) 29% (15) 20% (21) 18% (19) 21% (55) Very Important 53% (39) 28% (21) 21% (12) 35% (72) 55% (28) 36% (37) 40% (41) 41% (106) Important 21% (15) 61% (46) 55% (32) 45% (93) 16% (8) 38% (40) 35% (36) 33% (84) Less Important 0% (0) 3% (2) 12% (7) 4% (9) 0% (0) 6% (6) 7% (7) 5% (13) Not Important 0% (0) 0% (0) 2% (1) <1% (1) 0% (0) 0% (0) 0% (0) 0% (0) Visibility of signs Extremely important 47% (36) 22% (17) 14% (8) 29% (61) 29% (15) 29% (30) 18% (19) 25% (64) Very Important 35% (27) 47% (36) 39% (22) 40% (85) 47% (24) 33% (34) 38% (40) 38% (98) Important 18% (14) 31% (24) 39% (22) 29% (60) 22% (11) 37% (38) 41% (43) 36% (92) Less Important 0% (0) 0% (0) 7% (4) 2% (4) 2% (1) 0% (0) 2% (2) 1% (3) Not Important 0% (0) 0% (0) 0% (0) 0% (0) 0% (0) 0% (0) 0% (0) 0% (0) Condition of signs Extremely important 26% (20) 14% (11) 14% (8) 18% (39) 18% (9) 17% (17) 13% (13) 15% (39) Very Important 48% (37) 45% (34) 43% (25) 45% (96) 43% (22) 27% (27) 17% (17) 26% (66) Important 25% (19) 41% (31) 38% (22) 34% (72) 33% (17) 44% (44) 60% (61) 48% (122) Less Important 1% (1) 0% (0) 5% (3) 2% (4) 6% (3) 13% (13) 10% (10) 10% (26) Not Important 0% (0) 0% (0) 0% (0) 0% (0) 0% (0) 0% (0) 0% (0) 0% (0) Width of outside (right) shoulders Extremely important 24% (18) 8% (6) 6% (3) 13% (27) 24% (12) 16% (16) 12% (12) 16% (40) Very Important 44% (33) 44% (33) 35% (19) 42% (85) 51% (26) 45% (46) 34% (34) 42% (106) Important 31% (23) 41% (31) 44% (24) 38% (78) 25% (13) 32% (33) 40% (40) 34% (86) Less Important 1% (1) 7% (5) 15% (8) 7% (14) 0% (0) 7% (7) 14% (14) 8% (21)

NCDOT 2016-04 Project Report
69
Not Important 0% (0) 0% (0) 0% (0) 0% (0) 0% (0) 0% (0) 1% (1) <1% (1) Width of inside (left) shoulders Extremely important 21% (16) 7% (5) 6% (3) 13% (24) 16% (8) 12% (11) 9% (8) 12% (27) Very Important 41% (31) 39% (26) 26% (13) 36% (70) 39% (19) 29% (27) 23% (20) 29% (66) Important 32% (24) 45% (30) 52% (26) 42% (80) 39% (19) 43% (40) 41% (36) 41% (95) Less Important 5% (4) 6% (4) 12% (6) 7% (14) 6% (3) 15% (14) 25% (22) 17% (39) Not Important 0% (0) 3% (2) 4% (2) 2% (4) 0% (0) 2% (2) 2% (2) 2% (4) Type of right shoulder (gravel, pavement, etc.) Extremely important 15% (11) 7% (5) 2% (1) 8% (17) 12% (6) 7% (7) 7% (7) 8% (20) Very Important 35% (26) 20% (15) 24% (13) 27% (54) 33% (16) 24% (24) 13% (12) 21% (52) Important 43% (32) 54% (40) 50% (27) 49% (99) 51% (25) 44% (44) 48% (46) 47% (115) Less Important 7% (5) 18% (13) 20% (11) 14% (29) 4% (2) 22% (22) 29% (28) 21% (52) Not Important 1% (1) 1% (1) 4% (2) 2% (4) 0% (0) 2% (2) 2% (2) 2% (4) Mowing & trimming along guard rails Extremely important 9% (7) 3% (2) 6% (3) 6% (12) 8% (4) 4% (4) 2% (2) 4% (10) Very Important 24% (18) 9% (7) 7% (4) 14% (29) 16% (8) 11% (11) 12% (12) 13% (31) Important 43% (33) 54% (41) 54% (29) 50% (103) 53% (27) 55% (53) 51% (50) 53% (130) Less Important 21% (16) 30% (23) 26% (14) 26% (53) 24% (12) 28% (27) 31% (31) 28% (70) Not Important 3% (2) 4% (3) 7% (4) 4% (9) 0% (0) 2% (2) 4% (4) 2% (6) Mowing & trimming of all other areas Extremely important 9% (7) 4% (3) 5% (3) 6% (13) 6% (3) 1% (1) 2% (2) 2% (6) Very Important 24% (18) 9% (7) 7% (4) 14% (29) 17% (9) 13% (13) 11% (11) 13% (33) Important 46% (35) 60% (46) 58% (32) 54% (113) 60% (31) 60% (61) 59% (58) 59% (150) Less Important 18% (14) 23% (18) 24% (13) 22% (45) 17% (9) 25% (25) 26% (26) 24% (60) Not Important 3% (2) 4% (3) 5% (3) 4% (8) 0% (0) 2% (2) 2% (2) 2% (4) Cleanliness (lack of litter/debris) Extremely important 16% (12) 6% (5) 12% (7) 11% (24) 8% (4) 8% (8) 7% (7) 7% (19) Very Important 20% (15) 14% (11) 12% (7) 16% (33) 19% (10) 15% (15) 18% (18) 17% (43) Important 52% (39) 61% (47) 56% (32) 56% (118) 63% (33) 57% (58) 60% (61) 60% (152) Less Important 11% (8) 14% (11) 18% (10) 14% (29) 10% (5) 19% (19) 15% (15) 15% (39) Not Important 1% (1) 4% (3) 2% (1) 2% (5) 0% (0) 2% (2) 0% (0) 1% (2) Overall condition of this highway Extremely important 27% (21) 15% (11) 18% (10) 20% (42) 37% (19) 22% (22) 16% (16) 23% (57) Very Important 48% (37) 43% (32) 40% (23) 44% (92) 49% (25) 44% (44) 45% (45) 45% (114) Important 25% (19) 39% (29) 39% (22) 33% (70) 14% (7) 30% (30) 34% (34) 28% (71) Less Important 0% (0) 3% (2) 4% (2) 2% (4) 0% (0) 4% (4) 5% (5) 4% (9) Not Important 0% (0) 1% (1) 0% (0) <1% (1) 0% (0) 0% (0) 0% (0) 0% (0) Overall appearance of this highway Extremely important 20% (15) 14% (11) 12% (7) 16% (33) 25% (13) 11% (11) 9% (9) 13% (33) Very Important 44% (33) 14% (11) 25% (14) 28% (58) 38% (20) 29% (29) 24% (24) 29% (73) Important 31% (23) 59% (45) 46% (26) 45% (94) 35% (18) 50% (50) 54% (55) 48% (123) Less Important 5% (4) 11% (8) 18% (10) 11% (22) 2% (1) 9% (9) 14% (14) 9% (24) Not Important 0% (0) 1% (1) 0% (0) <1% (1) 0% (0) 2% (2) 0% (0) 1% (2) Feeling of safety on this highway Extremely important 47% (36) 31% (24) 21% (12) 34% (72) 46% (24) 37% (38) 31% (31) 36% (93) Very Important 35% (27) 30% (23) 34% (20) 33% (70) 46% (24) 37% (38) 34% (34) 38% (96) Important 18% (14) 36% (28) 40% (23) 31% (65) 8% (4) 23% (24) 29% (29) 22% (57) Less Important 0% (0) 1% (1) 5% (3) 2% (4) 0% (0) 3% (3) 5% (5) 3% (8) Not Important 0% (0) 1% (1) 0% (0) <1% (1) 0% (0) 0% (0) 2% (2) 1% (2)
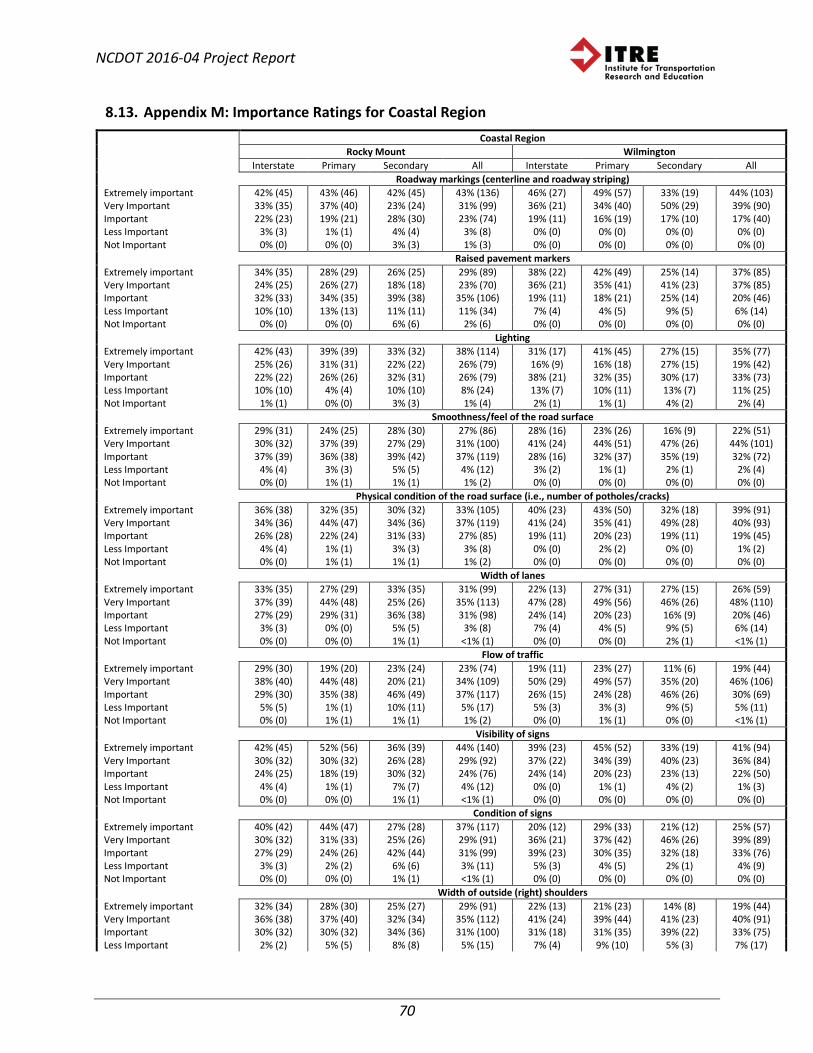
NCDOT 2016-04 Project Report
70
8.13. Appendix M: Importance Ratings for Coastal Region Coastal Region Rocky Mount Wilmington Interstate Primary Secondary All Interstate Primary Secondary All Roadway markings (centerline and roadway striping) Extremely important 42% (45) 43% (46) 42% (45) 43% (136) 46% (27) 49% (57) 33% (19) 44% (103) Very Important 33% (35) 37% (40) 23% (24) 31% (99) 36% (21) 34% (40) 50% (29) 39% (90) Important 22% (23) 19% (21) 28% (30) 23% (74) 19% (11) 16% (19) 17% (10) 17% (40) Less Important 3% (3) 1% (1) 4% (4) 3% (8) 0% (0) 0% (0) 0% (0) 0% (0) Not Important 0% (0) 0% (0) 3% (3) 1% (3) 0% (0) 0% (0) 0% (0) 0% (0) Raised pavement markers Extremely important 34% (35) 28% (29) 26% (25) 29% (89) 38% (22) 42% (49) 25% (14) 37% (85) Very Important 24% (25) 26% (27) 18% (18) 23% (70) 36% (21) 35% (41) 41% (23) 37% (85) Important 32% (33) 34% (35) 39% (38) 35% (106) 19% (11) 18% (21) 25% (14) 20% (46) Less Important 10% (10) 13% (13) 11% (11) 11% (34) 7% (4) 4% (5) 9% (5) 6% (14) Not Important 0% (0) 0% (0) 6% (6) 2% (6) 0% (0) 0% (0) 0% (0) 0% (0) Lighting Extremely important 42% (43) 39% (39) 33% (32) 38% (114) 31% (17) 41% (45) 27% (15) 35% (77) Very Important 25% (26) 31% (31) 22% (22) 26% (79) 16% (9) 16% (18) 27% (15) 19% (42) Important 22% (22) 26% (26) 32% (31) 26% (79) 38% (21) 32% (35) 30% (17) 33% (73) Less Important 10% (10) 4% (4) 10% (10) 8% (24) 13% (7) 10% (11) 13% (7) 11% (25) Not Important 1% (1) 0% (0) 3% (3) 1% (4) 2% (1) 1% (1) 4% (2) 2% (4) Smoothness/feel of the road surface Extremely important 29% (31) 24% (25) 28% (30) 27% (86) 28% (16) 23% (26) 16% (9) 22% (51) Very Important 30% (32) 37% (39) 27% (29) 31% (100) 41% (24) 44% (51) 47% (26) 44% (101) Important 37% (39) 36% (38) 39% (42) 37% (119) 28% (16) 32% (37) 35% (19) 32% (72) Less Important 4% (4) 3% (3) 5% (5) 4% (12) 3% (2) 1% (1) 2% (1) 2% (4) Not Important 0% (0) 1% (1) 1% (1) 1% (2) 0% (0) 0% (0) 0% (0) 0% (0) Physical condition of the road surface (i.e., number of potholes/cracks) Extremely important 36% (38) 32% (35) 30% (32) 33% (105) 40% (23) 43% (50) 32% (18) 39% (91) Very Important 34% (36) 44% (47) 34% (36) 37% (119) 41% (24) 35% (41) 49% (28) 40% (93) Important 26% (28) 22% (24) 31% (33) 27% (85) 19% (11) 20% (23) 19% (11) 19% (45) Less Important 4% (4) 1% (1) 3% (3) 3% (8) 0% (0) 2% (2) 0% (0) 1% (2) Not Important 0% (0) 1% (1) 1% (1) 1% (2) 0% (0) 0% (0) 0% (0) 0% (0) Width of lanes Extremely important 33% (35) 27% (29) 33% (35) 31% (99) 22% (13) 27% (31) 27% (15) 26% (59) Very Important 37% (39) 44% (48) 25% (26) 35% (113) 47% (28) 49% (56) 46% (26) 48% (110) Important 27% (29) 29% (31) 36% (38) 31% (98) 24% (14) 20% (23) 16% (9) 20% (46) Less Important 3% (3) 0% (0) 5% (5) 3% (8) 7% (4) 4% (5) 9% (5) 6% (14) Not Important 0% (0) 0% (0) 1% (1) <1% (1) 0% (0) 0% (0) 2% (1) <1% (1) Flow of traffic Extremely important 29% (30) 19% (20) 23% (24) 23% (74) 19% (11) 23% (27) 11% (6) 19% (44) Very Important 38% (40) 44% (48) 20% (21) 34% (109) 50% (29) 49% (57) 35% (20) 46% (106) Important 29% (30) 35% (38) 46% (49) 37% (117) 26% (15) 24% (28) 46% (26) 30% (69) Less Important 5% (5) 1% (1) 10% (11) 5% (17) 5% (3) 3% (3) 9% (5) 5% (11) Not Important 0% (0) 1% (1) 1% (1) 1% (2) 0% (0) 1% (1) 0% (0) <1% (1) Visibility of signs Extremely important 42% (45) 52% (56) 36% (39) 44% (140) 39% (23) 45% (52) 33% (19) 41% (94) Very Important 30% (32) 30% (32) 26% (28) 29% (92) 37% (22) 34% (39) 40% (23) 36% (84) Important 24% (25) 18% (19) 30% (32) 24% (76) 24% (14) 20% (23) 23% (13) 22% (50) Less Important 4% (4) 1% (1) 7% (7) 4% (12) 0% (0) 1% (1) 4% (2) 1% (3) Not Important 0% (0) 0% (0) 1% (1) <1% (1) 0% (0) 0% (0) 0% (0) 0% (0) Condition of signs Extremely important 40% (42) 44% (47) 27% (28) 37% (117) 20% (12) 29% (33) 21% (12) 25% (57) Very Important 30% (32) 31% (33) 25% (26) 29% (91) 36% (21) 37% (42) 46% (26) 39% (89) Important 27% (29) 24% (26) 42% (44) 31% (99) 39% (23) 30% (35) 32% (18) 33% (76) Less Important 3% (3) 2% (2) 6% (6) 3% (11) 5% (3) 4% (5) 2% (1) 4% (9) Not Important 0% (0) 0% (0) 1% (1) <1% (1) 0% (0) 0% (0) 0% (0) 0% (0) Width of outside (right) shoulders Extremely important 32% (34) 28% (30) 25% (27) 29% (91) 22% (13) 21% (23) 14% (8) 19% (44) Very Important 36% (38) 37% (40) 32% (34) 35% (112) 41% (24) 39% (44) 41% (23) 40% (91) Important 30% (32) 30% (32) 34% (36) 31% (100) 31% (18) 31% (35) 39% (22) 33% (75) Less Important 2% (2) 5% (5) 8% (8) 5% (15) 7% (4) 9% (10) 5% (3) 7% (17)

NCDOT 2016-04 Project Report
71
Not Important 0% (0) 0% (0) 1% (1) <1% (1) 0% (0) 0% (0) 0% (0) 0% (0) Width of inside (left) shoulders Extremely important 31% (33) 27% (29) 25% (26) 28% (88) 17% (10) 17% (19) 11% (6) 15% (35) Very Important 29% (31) 33% (35) 28% (29) 30% (95) 22% (13) 25% (29) 38% (20) 27% (62) Important 36% (38) 33% (35) 37% (38) 35% (111) 50% (29) 39% (45) 40% (21) 42% (95) Less Important 4% (4) 7% (7) 9% (9) 6% (20) 10% (6) 17% (20) 11% (6) 14% (32) Not Important 0% (0) 1% (1) 2% (2) 1% (3) 0% (0) 2% (2) 0% (0) 1% (2) Type of right shoulder (gravel, pavement, etc.) Extremely important 27% (29) 25% (26) 22% (23) 25% (78) 18% (10) 15% (17) 9% (5) 14% (32) Very Important 26% (28) 26% (28) 18% (19) 24% (75) 37% (21) 29% (33) 30% (17) 31% (71) Important 38% (40) 37% (39) 45% (47) 40% (126) 30% (17) 35% (40) 45% (25) 36% (82) Less Important 8% (9) 11% (12) 10% (10) 10% (31) 16% (9) 17% (19) 13% (7) 15% (35) Not Important 0% (0) 1% (1) 5% (5) 2% (6) 0% (0) 5% (6) 4% (2) 4% (8) Mowing & trimming along guard rails Extremely important 14% (15) 16% (17) 13% (12) 15% (44) 11% (6) 9% (11) 7% (4) 9% (21) Very Important 25% (26) 25% (26) 18% (16) 23% (68) 21% (12) 19% (22) 19% (11) 20% (45) Important 43% (45) 39% (41) 48% (43) 43% (129) 49% (28) 44% (51) 46% (26) 46% (105) Less Important 18% (19) 18% (19) 17% (15) 18% (53) 18% (10) 24% (28) 21% (12) 22% (50) Not Important 0% (0) 1% (1) 3% (3) 1% (4) 2% (1) 3% (4) 7% (4) 4% (9) Mowing & trimming of all other areas Extremely important 12% (13) 14% (15) 12% (12) 13% (40) 12% (7) 7% (8) 7% (4) 8% (19) Very Important 25% (26) 29% (31) 24% (24) 26% (81) 19% (11) 19% (22) 19% (11) 19% (44) Important 46% (49) 39% (42) 46% (47) 44% (138) 44% (25) 50% (58) 47% (27) 48% (110) Less Important 17% (18) 18% (19) 16% (16) 17% (53) 23% (13) 20% (23) 21% (12) 21% (48) Not Important 0% (0) 1% (1) 3% (3) 1% (4) 2% (1) 4% (5) 5% (3) 4% (9) Cleanliness (lack of litter/debris) Extremely important 19% (20) 22% (24) 17% (18) 19% (62) 13% (7) 18% (21) 13% (7) 15% (35) Very Important 22% (23) 32% (34) 23% (24) 25% (81) 32% (18) 28% (33) 23% (13) 28% (64) Important 46% (48) 35% (37) 45% (48) 42% (133) 45% (25) 42% (49) 54% (30) 46% (104) Less Important 13% (14) 10% (11) 14% (15) 13% (40) 11% (6) 10% (12) 9% (5) 10% (23) Not Important 0% (0) 1% (1) 1% (1) 1% (2) 0% (0) 1% (1) 2% (1) 1% (2) Overall condition of this highway Extremely important 37% (39) 34% (37) 28% (30) 33% (106) 24% (14) 37% (43) 19% (11) 29% (68) Very Important 38% (40) 40% (43) 27% (29) 35% (112) 52% (30) 41% (48) 53% (30) 47% (108) Important 22% (23) 22% (24) 37% (39) 27% (86) 22% (13) 22% (25) 25% (14) 23% (52) Less Important 4% (4) 3% (3) 6% (6) 4% (13) 2% (1) 0% (0) 2% (1) 1% (2) Not Important 0% (0) 1% (1) 2% (2) 1% (3) 0% (0) 0% (0) 2% (1) <1% (1) Overall appearance of this highway Extremely important 29% (31) 28% (30) 22% (23) 26% (84) 19% (11) 24% (27) 14% (8) 20% (46) Very Important 35% (37) 34% (36) 24% (25) 31% (98) 38% (22) 35% (40) 29% (17) 34% (79) Important 30% (32) 35% (37) 44% (47) 36% (116) 43% (25) 38% (43) 45% (26) 41% (94) Less Important 6% (6) 4% (4) 9% (10) 6% (20) 0% (0) 4% (4) 10% (6) 4% (10) Not Important 0% (0) 0% (0) 1% (1) <1% (1) 0% (0) 0% (0) 2% (1) <1% (1) Feeling of safety on this highway Extremely important 50% (53) 51% (55) 41% (44) 48% (152) 47% (27) 51% (59) 37% (21) 47% (107) Very Important 30% (32) 29% (31) 18% (19) 26% (82) 29% (17) 35% (40) 39% (22) 34% (79) Important 17% (18) 18% (19) 33% (35) 23% (72) 24% (14) 14% (16) 23% (13) 19% (43) Less Important 3% (3) 1% (1) 7% (8) 4% (12) 0% (0) 0% (0) 0% (0) 0% (0) Not Important 0% (0) 1% (1) 1% (1) 1% (2) 0% (0) 0% (0) 2% (1) <1% (1)