Embed Size (px)
Citation preview
265
ISSUES IN ACCOUNTING EDUCATIONVol. 24, No. 3August 2009pp. 265–298
Public Speaking Apprehension (PSA),Motivation, and Affect among AccountingMajors: A Proof-of-Concept Intervention
Tim C. Miller and Dan N. Stone
ABSTRACT: The importance of public speaking (PS) skills to professional accountingsuccess motivates improving students’ self-perceptions of these skills. In addition, ev-idence of higher levels of public speaking apprehension (PSA) among accounting ma-jors makes understanding and working with students’ affective (emotive) reactions toPS critical to their future success. In three studies, we design and implement an inter-vention based on principles from self-determination theory (SDT) and motivational in-terviewing (MI). Its purpose is to improve students’ PSA and PS motivation; it includessubstantive PS instruction, dialogues, nonjudgmental feedback, and interpersonal sup-port. The results of the three ‘‘proof-of-concept’’ interventions (Study 1, n � 23; Study2, n � 14; Study 3, n � 36) suggest improvements in students’ perceptions of theirPS cognition, motivation, and affect. Despite the limitations of self-reported measuresand exclusively graduate participants, the results suggest that (1) the interventions,described in appendices, may merit replication and extension, and (2) SDT- and MI-based interventions may prove useful in addressing aspects of accountancy pedagogythat induce student apprehension.
INTRODUCTION
Public speaking (PS) is an important determinant of professional accounting success.For example, practice analyses and surveys indicate that oral communication is a corefunction of professional accounting work (Albrecht and Sack 2000; National Center
for O*NET Development 2007; Siegel and Sorensen 1999). Accordingly, building com-munication skills is of essential import to accounting students and the accounting curricu-lum. In this paper, we focus on a subset of the communication skills needed for professionalsuccess in accounting. Specifically, we investigate whether an intervention based on moti-vational interviewing (MI) and self-determination theory (SDT) increases PS motivationand reduces PSA (public speaking apprehension).
Oral communication apprehension (OCA) includes four related fears: group discussion,meetings, interpersonal communication, and PS (McCroskey 1982; Aly and Islam 2003,2005; Gardner et al. 2005). The clinically diagnosable fear of PS, called glossophobia, isthe most common adult phobia (irrational fear). For example, Stein et al. (1996) surveyed
Tim C. Miller is a Ph.D. candidate, and Dan N. Stone is a Professor, both at the Universityof Kentucky.
The authors gratefully acknowledge the comments of Linda Rachula, John Hill, Red Medley, Candace Witherspoon,and two anonymous reviewers at the 2007 Accounting, Behavior, and Organizations (ABO) Conference; the com-ments of the editor, Kent St. Pierre, and two anonymous reviewers; and financial support of the Gatton College ofBusiness and Economics and the Von Allmen School of Accountancy. Data are available from the first author.
266 Miller and Stone
Issues in Accounting Education, August 2009
499 Canadian residents and found evidence of glossophobia among one-third of respon-dents. Evidence suggests that PS fear is more common than is the fear of death. Forexample, large sample survey data indicates that about 42 percent of respondents had PSAwhile only 19 percent feared death (Wallechinsky et al. 1977, 469–470). These data suggestthat Jerry Seinfeld’s quip that ‘‘the average person at a funeral would rather be in the casketthan doing the eulogy’’ may not be hyperbole (Wikipedia 2007). PS fear is not unique tothe untrained and uneducated; it is also common among senior managers (Anonymous2007; Huber 2005).
Learning is often complicated by students’ cognitive (e.g., distracting thoughts) andaffective (e.g., fear) anticipations of and responses to learning content and educationalenvironments. Reducing glossophobia and improving PS skills is difficult because of thecomplex interaction of cognitive, affective, and physiological anticipations and responsesto PS. Human and mammalian anticipations of and reactions to stressful events are oftenreferred to as the ‘‘fight or flight’’ response (Marmot and Wilkinson 2006). Glossophobiais a dysfunctional reaction to the fight or flight response; it is characterized by negativecognitions (e.g., ‘‘I’m going to fail.’’) and negative affect (e.g., feelings of fear and incom-petence). These mental changes are preceded, or triggered, by physiological and biologicalstress responses that include an increased heart rate and the release of cortisol into theblood stream, which increases blood pressure, blood sugar levels, and suppresses autoim-mune and immune system responses (al’Absi et al. 1997; Buchanan et al. 1999; Beatty andBehnke 1991).1 These complex mental and physiological changes increase PSA and reducePS motivation, i.e., one’s willingness to seek or accept opportunities to speak in public.
SDT provides a psychological theory, and MI a set of methods from counseling practicethat are, to our knowledge, unexplored but potentially efficacious in addressing the psy-chological and physiological impediments to reducing PSA and improving PS effectiveness.SDT and MI, when combined with concurrent PS instruction, may be useful in addressingthe complex nexus of affective, cognitive, motivational, and substantive learning impedi-ments to PS success. These methods are potential alternatives, or supplements, to existingmethods such as systematic desensitization (e.g., McCroskey et al. 1970; McCroskey et al.1983) that are efficacious in reducing PSA.
Herein, we report the results of three intervention variations based on SDT principlesand MI practices. The semester-long interventions are designed to develop PS skills andreduce PS anxiety. Although subject to a set of important limitations, our results suggestthat the interventions increased student confidence in, and reduced their anxiety about, PS.The results may justify replication and extension to other accounting curriculum applica-tions where affect, e.g., fears, impedes learning. For example, affective responses mayimpede the learning of ‘‘social’’ or ‘‘emotional’’ intelligence (Goleman 1995, 2000; Stoneet al. 2000) or impede preparation for the CPA examination.
Five sections follow this introduction: (1) ‘‘Motivation and Literature Review,’’ whichexplores evidence related to the importance of PS skills and PSA on professional accountingsuccess, (2) ‘‘Theory and Hypotheses,’’ which discusses the theory that underlies our in-terventions, hypotheses, and metrics, (3) ‘‘Research Method,’’ which discusses the inter-vention methods and differences, (4) ‘‘Results,’’ including benchmarking against our pre-vious results, and (5) ‘‘Limitations and Conclusions.’’
1 See also Weick (1983) for a general discussion of the importance, and deleterious effects of, stress in accountingwork.
Public Speaking Apprehension (PSA), Motivation, and Affect among Accounting Majors 267
Issues in Accounting Education, August 2009
MOTIVATION AND LITERATURE REVIEWPublic Speaking (PS) in Accountancy
Critical thinking, communication, and interpersonal skills are critical to professionalaccounting success (e.g., Albrecht and Sack 2000; Big 8 Accounting Firms 1989; NationalCenter for O*NET Development 2007; Siegel and Sorensen 1999).2 Recent research reem-phasizes the importance of communication skills to professional accountancy. For example,Blanthorne et al. (2005) surveyed 402 public accounting partners on the importance of sixskill sets (technical, communication, interpersonal, administrative, leadership, and practicedevelopment) in promotion decisions from staff to senior, senior to manager, and managerto partner. Communication was the second most important skill in promotions from seniorand manager and the third most important skill in promotions to partner.
Some curriculum efforts funded through the Accounting Education Change Commis-sion (AECC) included greater attention to the development of PS skills (Williams andSundem 1990; AECC 1992). For example, Johnson et al. (2003) found that, perhaps par-tially in response to the AECC, requirements for student presentations in introductory au-diting classes increased by 110 percent from 1987 to 2000 (from 20 to 42 percent). Ad-ditionally, Grace and Gilsdorf (2004) provide exercises designed to improve students’ PSconfidence and performance.
Accountancy majors may have higher levels of oral communication apprehension(OCA) and PSA than do other college majors. For example, Stanga and Ladd (hereafterSL) (1990) assessed the oral communication apprehension of 845 introductory accountingstudents at one university. Accounting majors had higher OCA and PSA compared to otherstudy participants. Simons et al. (1995) compared the OCA and PSA of 233 accountancymajors with that of four other business disciplines (n � 95, finance; n � 188, management;n � 103, marketing; and n � 91, other). Results indicated that accountancy majors hadhigher OCA and PSA than all other majors except management. Ruchala and Hill (hereafterRH) (1994) reported that the pre-intervention PSA of their accounting major participants(n � 43) is higher than both national norms and the accounting major (n � 161) datareported in SL. Accordingly, evidence from three samples suggests that higher levels ofOCA and PSA may exist among accounting majors than among other collegiate majors.3
Further, large-sample Department of Labor occupational data indicates that professionalaccountants are less confident in their communication abilities than are other professionals(see e.g., Chen et al. 2009). Speculative reasons for higher levels of OCA and PSA amongaccounting majors may include student self-selection of a college major (e.g., Albrecht andSack 2000) or a de-emphasis on the development of PS skills in accountancy compared toother curricula.
PSA InterventionsInterventions designed to reduce PSA show efficacy from some intervention aspects.
For example, Pittenger et al. (2004) provided classroom instruction in PS and taped ex-amples of outstanding student presentations. Compared with a pre-intervention cohort, pres-entations by students in the treatment group were rated higher by the instructor and anoutside professional evaluator. Sergenian and Pant (1998) implemented an intervention
2 The need for PS skills as an entry-level skill needed by public accountants is also discussed in Roy and MacNeill(1963, 1966, 1967); results of a survey published in 1967 of 1,890 participants finds that written and oralcommunication ranks first in importance to the beginning CPA compared to 52 other academic areas.
3 Additional relevant accounting literature includes May and May (1989), who surveyed 263 accountancy programsregarding current and planned efforts to improve communication skills, and Smythe and Nikolai’s (1996, 2002)qualitative studies of oral communication concerns among three accounting constituencies.
268 Miller and Stone
Issues in Accounting Education, August 2009
among students from disadvantaged socioeconomic backgrounds that was designed to im-prove four aspects of students’ professionalism: career knowledge, job search process, teamlearning, and communication skills. The PS intervention consisted of students presentingwith self- and peer-evaluations of the presentations. Comparison of pre- and post-measuresof self-evaluations of presentation and oral communication skills indicated improvementconsistent with intervention success. Smith and King (2004) examined student reactions tothe wording of critiques of their PS performance. Results indicated that more respectful,less pejorative critiques improved PS performance more than did less respectful, morepejorative critiques.
Alternatively, however, McCroskey and colleagues (for a summary, see McCroskey etal. 1983) provide evidence from 15 years of research that while systematic desensitizationtechniques reduce OCA and PSA, communication courses that do not include elements thatspecifically address the affective (emotional) components of PS are ineffective at reducingOCA and PSA. Consistent with McCroskey et al.’s (1983) findings, evidence suggests thataccounting education, in the absence of specific curriculum interventions, has no effect onOCA. For example, Aly and Islam (2003) administered the Personal Report of Communi-cations Apprehension (PRCA-24) instrument, which assesses OCA and PSA, to 151 first-year, 125 final-year, and 58 graduate students in accountancy. Results indicated no differ-ences in OCA among the three samples. Similar results are reported among non-U.S.samples of accounting students (Hassall et al. 2000; Gardner et al. 2005; Aly and Islam2005).
Based on a review of previous literature, SL (1990) recommended three interventionstrategies that they argued would be useful in reducing OCA: assertiveness training, sys-tematic desensitization, and cognitive restructuring. Assertiveness training and cognitiverestructuring are both cognitive approaches to reducing OCA. Assertiveness training ex-plicitly focuses on skill development, such as improving ‘‘eye contact, distance betweencommunicators, facial expression, gestures, and postures and body orientation.’’ Cognitiverestructuring consists of identifying ‘‘negative self-statements [that] represent irrational ov-ergeneralizations’’ (SL 1990, 190) and recasting these as positive statements. Students prac-tice rethinking and refuting negative self-statements in thought experiments and role-playingexercises. Systematic desensitization implementations attempt to reduce OCA through, pri-marily, inducing changes in affective responses. Interventions involve progressively imag-ining more stressful PS situations while maintaining a state of deep relaxation. This methodassociates the stressor event with a relaxed state, instead of the previous high-arousal,negative affective state.
We are aware of one accounting curriculum intervention that successfully reduced OCAamong accounting students. RH (1994) designed and implemented an intervention to reduceOCA that included assertiveness training, trust-building, and social support (see RH 1994,288–289) across four exercises: cold classroom calls, meetings and discussions with visitingprofessionals, office visits and interviews of professionals, and oral presentations. Interven-tion participants were students in an advanced managerial accounting class; control groupparticipants were Beta Alpha Psi members not enrolled in the class. Pre- to post-interventioncomparisons supported the intervention’s success in reducing OCA and PSA.
We next describe an alternative intervention based in differing core principles andmethods from that of RH (1994) that is designed to improve PS skills and motivation,and reduce PSA, among accountancy students. Our focus is on PSA, not OCA. To increaseinternal validity, e.g., to test for halo effects from the intervention, we also collect andreport measures of OCA.
Public Speaking Apprehension (PSA), Motivation, and Affect among Accounting Majors 269
Issues in Accounting Education, August 2009
THEORY AND HYPOTHESESA Self-Determination Theory (SDT) and Motivational Interviewing (MI)-BasedIntervention to Reduce PSA
SDT is rooted in a set of explicit assumptions about human nature and motivation (e.g.,Deci and Ryan 1985, 2008; Ryan and Deci 2000). Humans are inherently motivated togrow and achieve, and will fully commit to and engage in even uninteresting tasks whentheir meaning and value is understood. According to SDT, humans have three core psy-chological needs: competence, relatedness, and autonomy. Competence concerns the beliefthat one has the ability to influence important outcomes. Relatedness concerns the needto have satisfying and supportive social relationships. Finally, autonomy does not refer toindependence, but rather to the necessity of volitional choice of inter- or independence.
Satisfying human needs for autonomy, competence, and relatedness creates sustainable,enduring motivation and reduces negative, performance-related affect. Increasing self-perceived autonomy, competence, and relatedness increases productivity, creativity, andhappiness (Deci and Ryan 1985; Ryan and Deci 2000). For example, within education, anSDT-based intervention increased students’ interest and engagement in learning activities(Reeve et al. 2004) and improved student learning in medical school (Williams and Deci1998). Evidence also suggests that students who perceive their instructors as more suppor-tive become more autonomous in their own learning, which also increases self-perceivedcompetence (Williams and Deci 1996).
Self-determination theory (SDT) is closely aligned with a set of clinical psychologypractice methods called ‘‘motivational interviewing’’ (MI) (Vansteenkiste and Sheldon 2006;Markland et al. 2005). MI is a client-centered counseling style that assists clients in ad-dressing problematic behaviors that impede their success and happiness (Moyers 1998;Rollnick and Miller 1995). While the original application of MI was to alcoholism, MI hasfound increasing application in counseling and education (Miller and Rollnick 2002). Ac-cording to Miller et al. (1992), the core principles underlying MI are:
1. Express empathy. Teachers and counselors work to see the world through the students’or clients’ eyes and to understand the students’ or clients’ feelings and experiences.
2. Support self-efficacy. Teachers and counselors support students’ and clients’ realisticbeliefs that meaningful change is possible and achievable.
3. Roll with resistance. Expressions of skepticism and doubt are never challenged ordisputed, but are reacted to with empathy and encouragement.
4. Develop discrepancy. Meaningful change occurs when students or clients perceive dis-crepancy between current and desired behaviors. Teachers and counselors make salientthe discrepancy between students’ and clients’ current and desired behaviors.
Some argue that SDT lacks corresponding practical (i.e., clinical and pedagogical)methods while MI lacks an underlying theory. Because of the close linkages between SDTand MI, we applied and adapted constructs and methods from both sources. To our knowl-edge, SDT and MI have not been applied to improving self-perceived PS skills and reducingPSA. However, previous applications of SDT and MI to creating learning environmentsthat provide interpersonal and emotional support, along with substantive instruction (Blackand Deci 2000; Williams and Deci 1996, 1998) appear uniquely suited to addressing PSA.Both SDT and MI emphasize the creation of an environment that acknowledges and sup-ports individual feelings of autonomy, competence, and relatedness. We designed and im-plemented three variations of an SDT- and MI-based intervention as a ‘‘proof-of-concept’’
270 Miller and Stone
Issues in Accounting Education, August 2009
of the possibility of using SDT and MI principles to accomplish these goals. The interven-tions included methods intended to support core psychological needs, as well as providingsubstantive instruction in PS skills.
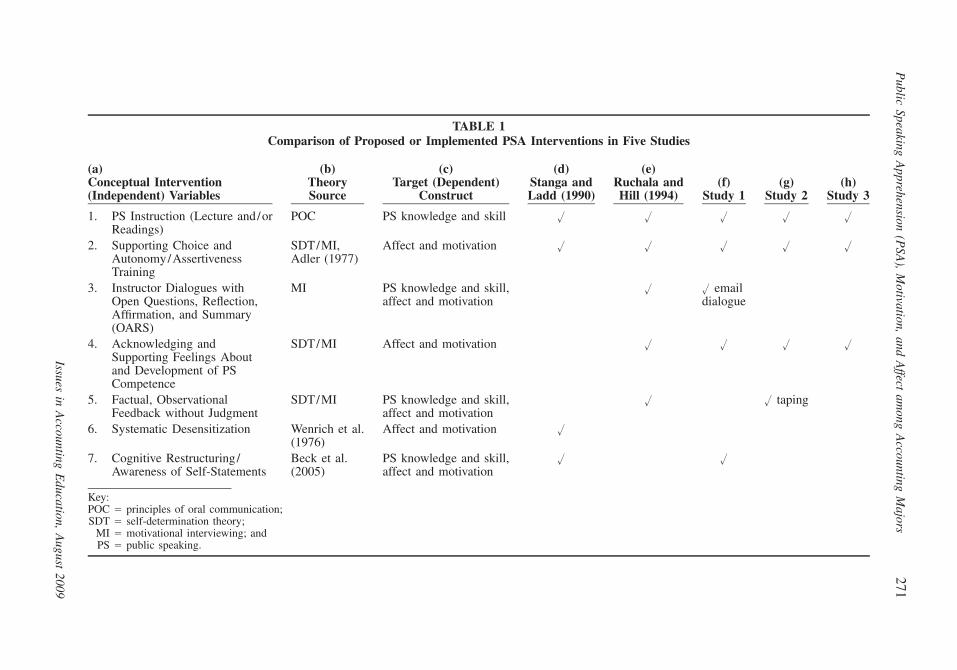
Herein, we report the results of the three studies. Compared with the Study 1 interven-tion, the Study 2 and Study 3 interventions were simpler; they reduce instructor effort.Table 1 compares the theories, conceptual principles, and target-dependent constructs thatunderlie these interventions with those implemented in RH (1994) and proposed in SL(1990).4 We identify seven possible ‘‘molar’’ intervention elements that might be includedin OCA or PS interventions (Table 1, Column a). Table 1, Column b, identifies the theo-retical source for the intervention, while Table 1, Column c, identifies the target (dependent)construct of the intervention element. The checked boxes in Table 1, Columns d, e, f, g,and h, identify which studies propose (SL, Column d) or implement these interventionelements, where Columns e, f, g, and h map to RH (Column e), Study 1 (Column f), Study2 (Column g), and Study 3 (Column h), respectively.
Of the seven molar intervention elements, five are common to RH’s and at least oneof our studies, while one, cognitive restructuring, is proposed in SL and implemented inour Study 1. One intervention with demonstrated previous efficacy in reducing PSA, sys-tematic desensitization, is not implemented in either RH’s or our interventions. Our andRH’s conceptual interventions (see Table 1) are similar. However, the theoretical principlesof our SDT- and MI-based approaches differ somewhat from that of RH, as do the actualintervention exercises and activities and many of the dependent measures. In addition, wefocus exclusively on PSA and PS skills; RH’s intervention concerns OCA.
We investigate the effectiveness of three slightly differing implementations of an ex-perimental intervention designed to reduce PSA and improve students’ affective, cognitive,and motivational responses to PS. We test H1 through H3 in all three studies; we test 12additional hypotheses in Studies 2 and 3 to reduce the extent of mono-measurement bias(cf., Shadish et al. 2002) and to enable direct comparison with previous research results.Tests of hypotheses contrast pre- with post-intervention measures.
We reduce the potential threats of mono-operation (i.e., implementation) bias andthe unreliability of treatment implementation (cf., Shadish et al. 2002) by implementing theintervention in slightly differing form with three cohort groups. Implementing the treatmentwith three cohort groups decreases the likelihood that the results can be attributed to sam-pling, random, or Beta error (Cohen 1969, 1988).
HypothesesHypotheses 1 through 3 (Tested in All Studies): PS Motivation and Positive andNegative Self-Statements (SS)
In all studies, we measure and test for improvements in two sets of measures:
1. PS motivation, with measures adapted from Ryan et al. (1999) and Kasser and Ryan(1993), and
2. PS positive and negative self-statements (SS), with measures adapted from Hofmannand DiBartolo (2000).
4 Table 1 provides a ‘‘molar,’’ not ‘‘molecular,’’ (see Shadish et al. 2002) analysis of possible PSA causal inter-ventions. Molar causation relates to naturally occurring treatments or causes that are not easily, commonly, orusefully separated into molecular causal agents. For example, the success of a classroom lecture might be attrib-uted to the quality of the presentation (a molar cause), or to the decibel levels and frequencies in the soundwaves that emanated from the instructor’s larynx and diaphragm, as disseminated through a mixed nitrogen andoxygen atmosphere (a molecular cause).
Public
SpeakingA
pprehension(P
SA),
Motivation,
andA
ffectam
ongA
ccountingM
ajors271
Issuesin
Accounting
Education,
August
2009
TABLE 1Comparison of Proposed or Implemented PSA Interventions in Five Studies
(a)Conceptual Intervention(Independent) Variables
(b)TheorySource
(c)Target (Dependent)
Construct
(d)Stanga andLadd (1990)
(e)Ruchala andHill (1994)
(f)Study 1
(g)Study 2
(h)Study 3
1. PS Instruction (Lecture and/orReadings)
POC PS knowledge and skill � � � � �
2. Supporting Choice andAutonomy/AssertivenessTraining
SDT/MI,Adler (1977)
Affect and motivation � � � � �
3. Instructor Dialogues withOpen Questions, Reflection,Affirmation, and Summary(OARS)
MI PS knowledge and skill,affect and motivation
� � emaildialogue
4. Acknowledging andSupporting Feelings Aboutand Development of PSCompetence
SDT/MI Affect and motivation � � � �
5. Factual, ObservationalFeedback without Judgment
SDT/MI PS knowledge and skill,affect and motivation
� � taping
6. Systematic Desensitization Wenrich et al.(1976)
Affect and motivation �
7. Cognitive Restructuring/Awareness of Self-Statements
Beck et al.(2005)
PS knowledge and skill,affect and motivation
� �
Key:POC � principles of oral communication;SDT � self-determination theory;
MI � motivational interviewing; andPS � public speaking.
272 Miller and Stone
Issues in Accounting Education, August 2009
Appendix A, Panel 1, presents these measures; we predict that the SDT- and MI-basedintervention will:
H1: Increase participants’ PS motivation.
H2: Increase participants’ positive PS SS.
H3: Decrease participants’ negative PS SS.
Measures and Hypotheses in Studies 2 and 3: OCA, PSA, Affect, and PS Sub-DomainSkill
In Studies 2 and 3, we add three sets of measures to reduce mono-measurement biasand enhance comparability with previous research: an assessment of OCA and PSA (PRCA-24) (Appendix A, Panel 3), a state (not trait) PS-related assessment of positive and negativeaffect (PANAS) (Appendix A, Panel 4) (Watson et al. 1988), and an assessment of PS self-perceived performance in six sub-domains (Appendix A, Panel 2).
OCA and PSA: Hypotheses 4 through 7Adding the PRCA-24 increases the comparability of our intervention to existing com-
munication and accounting research (e.g., Simons et al. 1995; Fordham and Gabbin 1996;Hassall et al. 2000; Gardner et al. 2005; Arquero et al. 2007; RH 2004; SL 1990). Inaddition, the PRCA-24 assesses both OCA and PSA. Since our interventions are targetedat PSA, collecting the PRCA-24 allows us to: (1) assess whether there are halo, i.e., cross-over improvements, from our intervention on three other oral communication dimensions:group discussion, meetings, and interpersonal communication, and (2) control for the pos-sibility that improvements in the treatment groups, if any, may be explained by effects thatare unrelated to intervention, e.g., group maturation or history (Shadish et al. 2002).
Hypotheses 4 through 6 predict that the intervention, which is designed to decreasePSA, will not impact the three dimensions of OCA that are unrelated to PSA: group dis-cussion, meetings, and interpersonal communication. Hypothesis 7 predicts that the inter-vention will decrease PSA. Specifically, we predict that the SDT- and MI-based interventionwill:
H4: Result in no pre- to post-intervention changes in OCA in the domain of meetings.
H5: Result in no pre- to post-intervention changes in OCA in the domain of groups.
H6: Result in no pre- to post-intervention changes in OCA in the domain of interper-sonal communication.
H7: Result in a decrease from pre- to post-intervention in the domain of PSA.
Affect: Hypotheses 8 and 9The PANAS assesses positive and negative affect (emotion); it has been validated and
extensively applied (Watson et al. 1988) including to PS (Mano 1991, 1992). As appliedin our study, the PANAS directly measures PS-related affect (cf., Mano 1991, 1992). In it,participants rate feeling states along two dimensions, using positive (dimension 1) andnegative (dimension 2) emotion-laden adjectives (see Appendix A, Panel 4, for instrument).Participants high in positive affect have high energy, strong concentration, and pleasurableengagement, whereas low positive affect is characterized by sadness and lethargy. Alter-natively, high negative affect indicates anger, contempt, disgust, or fear, whereas low neg-ative affect is characterized by calmness and serenity (Watson et al. 1988). We predict thatthe SDT- and MI-based intervention will:
Public Speaking Apprehension (PSA), Motivation, and Affect among Accounting Majors 273
Issues in Accounting Education, August 2009
H8: Increase PS positive affect from the initial to the final presentation assessment.
H9: Decrease PS negative affect from the initial to the final presentation assessment.
PS Sub-Domain Skill: Hypotheses 10 through 15Finally, we obtain pre-intervention and post-intervention measures of participants’ self-
perceptions of their skill in six specific aspects of PS performance: appearance, audience,structure, content, visual aids, and slides. We predict that students’ self-perceived PS skillswill improve in all measured aspects. Specifically, the SDT- and MI-based intervention will:
H10: Increase pre- to post-intervention self-perceived skill in the domain of appearance.
H11: Increase pre- to post-intervention self-perceived skill in the domain of audience.
H12: Increase pre- to post-intervention self-perceived skill in the domain of structure.
H13: Increase pre- to post-intervention self-perceived skill in the domain of slides.
H14: Increase pre- to post-intervention self-perceived skill in the domain of visual aids.
H15: Increase pre- to post-intervention self-perceived skill in the domain of content.
We next describe the research method of three studies.
RESEARCH METHODParticipants
Participants are from three cohorts of Masters of Accountancy classes in consecutiveyears. Studies 1, 2, and 3 included 23 (11 male, 12 female), 14 (five male, nine female),and 36 (17 male, 19 female) participants, respectively, for a total of 73 (33 male, 40 female)participants. To increase the statistical power (Cohen 1969, 1988) of the intervention andreduce the likelihood of Beta error, all participants were assigned to the treatment condi-tion—there was no within-study control group. To enhance experimental control and lessenpotential threats to validity, where possible, we compare our results with those of previousinvestigations that assess the same measures.
Intervention Development and DescriptionAppendix B describes the training undertaken in support of the development of the
intervention. Each intervention was implemented over a single, 15-week semester. Study 2and Study 3 changes in the intervention were designed to test whether decreasing someintervention aspects could be eliminated without diminishing its effectiveness. Therefore,the Study 1 intervention required the most instructor effort, which decreased in Study 2and decreased again in Study 3. The interventions in each of the studies were as follows.
Study 1 InterventionStudy 1 included the following interventions (see Appendix C for additional
description):
Week 1. Pre-intervention assessments were collected during the first week of the se-mester, prior to distribution of the class syllabus. The intervention began with the distri-bution of the class syllabus, which, consistent with SDT and MI principles, acknowledgedstudents’ fears about PS (i.e., support for relatedness, support desire for building compe-tence) and provided information about impediments to and strategies for developing PSskills.
274 Miller and Stone
Issues in Accounting Education, August 2009
Week 2 emphasized students’ choice (i.e., autonomy) to work on presentation skills ornot, and solicited their thoughts and feelings about this work (Miller and Rollnick 2002;Reeve 2002; Reeve et al. 2004). During this week, students completed an online instrumentthat asked whether they were committed to improving their presentation skills and wantedto read material related to improving their presentation skills. Participants who commit-ted to work on these skills (n � 56 across all studies) had higher pre-intervention positiveSS (p � .000) and motivation (p � .009) than participants who did not (n � 15).5 Theinstrument also asked students whether points found in the readings were consistent withtheir own experience and whether and how the readings were useful in improving their PSskills.
Week 3. Students received a personalized email from the instructor that summarizedthe students’ thoughts and feelings about PS that were expressed in the Week 2 activity.This exercise is aimed at facilitating dialogue, acknowledging and supporting feelings, andincreasing awareness of PS-related SS (Miller and Rollnick 2002).
Weeks 4 and 5. Students presented during Week 4. The intervention focused on sup-porting feelings of competence (Reeve 2002; Reeve et al. 2004) related to these presenta-tions. During Week 5, participants who committed to improving their presentation skillsreceived individualized feedback (by email) on 25 dimensions of PS skill (see Appen-dix D).
Week 8. Participants met with the instructor, in groups, regarding the semester projects.For students who committed to improving their presentation skills, these meetings includeda discussion of oral presentations and a brief, spontaneous presentation by each studentparticipant. Following each presentation, the instructor offered observations and supportivecomments based on MI principles (Miller and Rollnick 2002).
Week 16. Participants presented their semester projects. Post-intervention measures werecollected after the presentation but prior to receiving a presentation grade and summaryevaluation.
Study 2 InterventionWe modified two aspects of the Study 1 intervention for Study 2 (see Appendix E for
additional descriptions).Week 3. Writing and distributing the Week 3 email required �20 minutes per student.
To reduce the instructor time required by the intervention and to increase its feasibility inlarger-section classes, this aspect of the intervention was dropped.
Week 4. Consistent with suggestions in RH, the instructor obtained and used videorecording technology for the Week 4 student presentations. The instructor reviewed selectedportions of the videotape with students in Week 5, using nonjudgmental feedback principlesfrom MI training (Miller and Rollnick 2002). This intervention required less instructor timethan did the personalized email feedback completed in Study 1. Hence, the net instructoreffort required by the intervention in Study 2 was lower than that of Study 1.
Study 3 InterventionStudy 3 replicated Study 2, but eliminated the Week 4 videotaping. Hence, Study 3
required the least instructor effort of the interventions.
5 Similar results obtain for students who choose to read PS-related material.
Public Speaking Apprehension (PSA), Motivation, and Affect among Accounting Majors 275
Issues in Accounting Education, August 2009
Measure Timing and ReliabilityMeasures were assessed pre- and post-intervention. The three common measures (see
Appendix A, Panel 1) and the PRCA-24 (see Appendix A, Panel 3) were assessed, at pre-intervention, during the first week. Because they measure PS affect and PS-relatedself-perceptions, the ‘‘pre-intervention’’ PS PANAS (see Appendix A, Panel 4) and PS self-perception sub-domain (SPSD: see Appendix A, Panel 2) measures were assessed in Week4 immediately following the participants’ first presentations. Hence, our chances of findingeffects on the PANAS and SPSD measures are lessened since the ‘‘pre-test’’ assessmentsoccur in Week 4 of the intervention. Post-intervention measures were assessed after thefinal presentation but before students received a presentation grade and evaluation.
Appendix C presents construct reliability assessments for the Studies 1, 2, and 3, andthe aggregated data set. Reliability was adequate to good, with the exception of four con-struct measures in specific studies; three Study 2 measures: (1) negative self-statements, (2)PRCA-24 measure of meetings, and (3) content domain self-assessment, and one Study 3SPSD measure, visual aids. Given the smaller sample size and corresponding higher Betaerror likelihood in Study 2, it is unsurprising that construct validity is lower in Study 2than the other studies.
AbilityAs an experimental control, we obtained data from the university registrar on partici-
pants’ ability as measured by overall undergraduate grade point average (GPA), undergrad-uate accounting GPA, verbal/quantitative GMAT score, and GMAT analytical writing score(see Appendix A, Panel 5). Sample sizes for the ability measures were as follows: overallundergraduate GPA (n � 70), undergraduate accounting GPA (n � 34), GMAT scores (n� 70), and analytical writing (n � 28). An ANOVA to test for between-study differencesindicates no difference in undergraduate accounting GPA, verbal/quantitative GMAT score,or GMAT analytical writing score. However, we do find a difference in overall undergrad-uate GPA. Post hoc analyses (Bonferroni correction) indicates that the overall undergraduateGPA is lower among Study 1, compared with Study 3, participants (Study 1 mean � 3.41,Study 3 mean � 3.66; p � 0.003).
Study 3: PS Sub-Domain (SD) Skill Scale DifferencePS SD skills were measured on a 1–5 scale (1 � poor, 5 � good) in Study 2, and at
post-intervention in Study 3 (see Appendix A, Panel 2). However, due to a programmererror, the PS SD skills were measured on a 1–7 scale (1 � very poor, 7 � very good) atpre-intervention in Study 3. We followed suggestions in the scale development literature(Dawes 2002, 2008) to convert the seven-point scale used pre-intervention in Study 3 tothe five-point scale used in the other cases. Specifically, we converted the seven- to a five-point scale with the following equation: ((2/3) *((seven-point scale response) � 4) � 3).6
RESULTSWe present (1) correlational analysis, (2) tests of hypotheses and related analyses, and
(3) benchmark comparisons against prior studies. Tests of hypotheses were assessed usingrepeated-measure (i.e., intervention, which compares pre- with post-intervention) ANOVA
6 With this formula, the mapping of seven- to five-point scale values are [7, 5; 6, 4.3; 5, 3.7; 4, 3; 3, 2.3; 2, 1.7;1, 1].
276 Miller and Stone
Issues in Accounting Education, August 2009
with Study (levels � 1, 2, 3), and the joint effect of study and intervention (pre- to post-test) as predictor variables.7 We also compare between-study levels of the pre- andpost-intervention measures using a multivariate GLM. Finally, we provide benchmark com-parisons, using t-tests of our and (1) Hofmann and DiBartolo’s (2000) positive and negativeself-statement results, and (2) RH’s and national norm results for the PRCA-24.
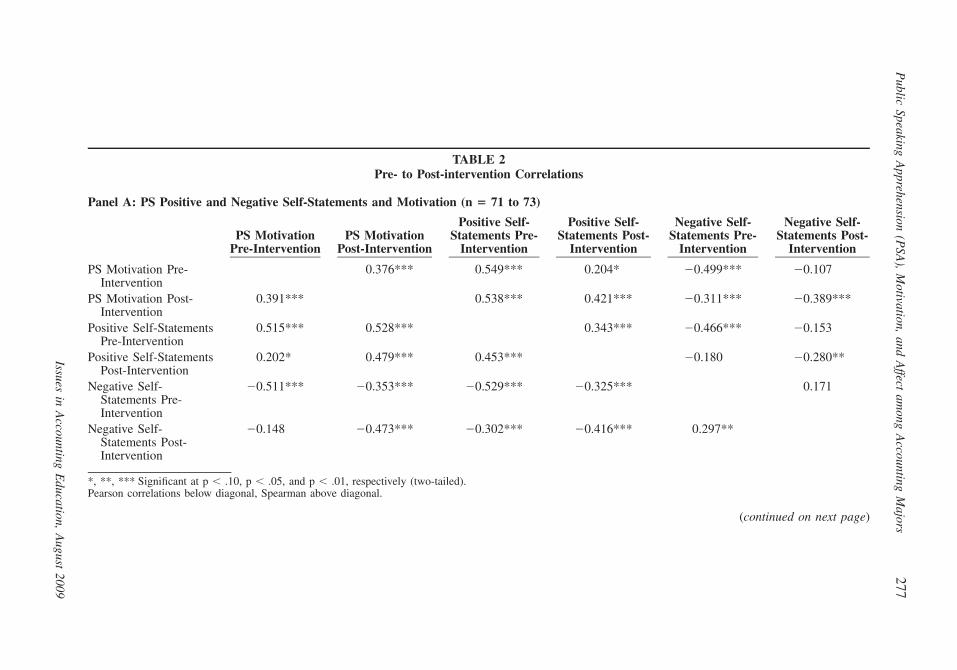
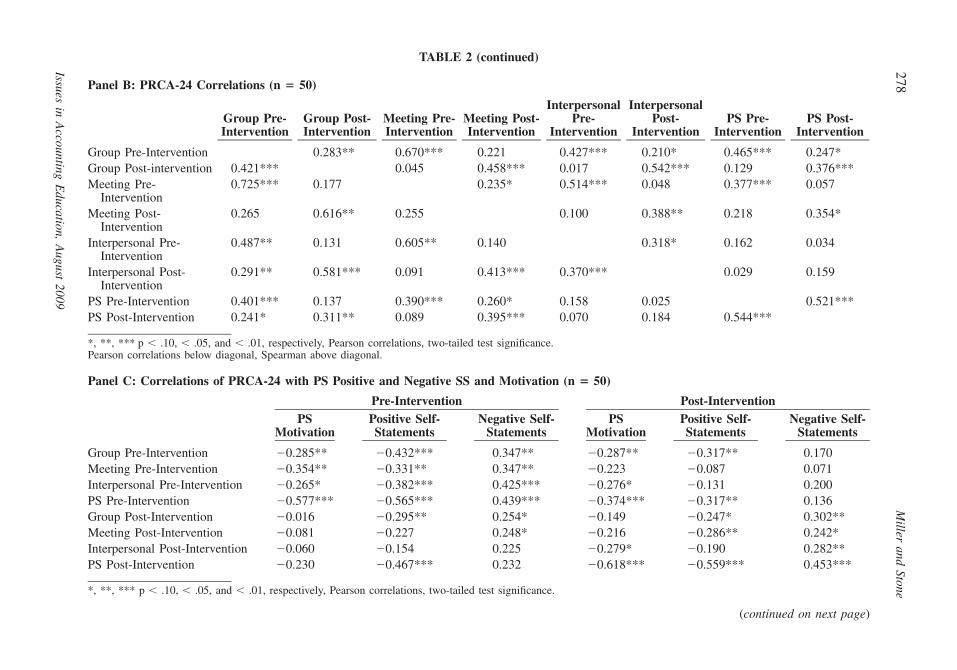
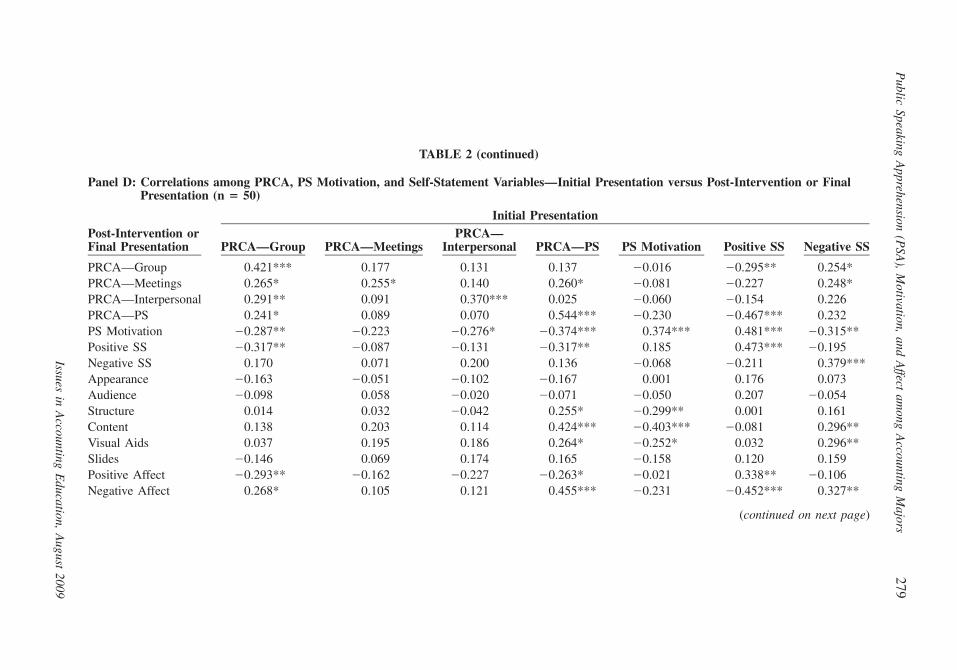
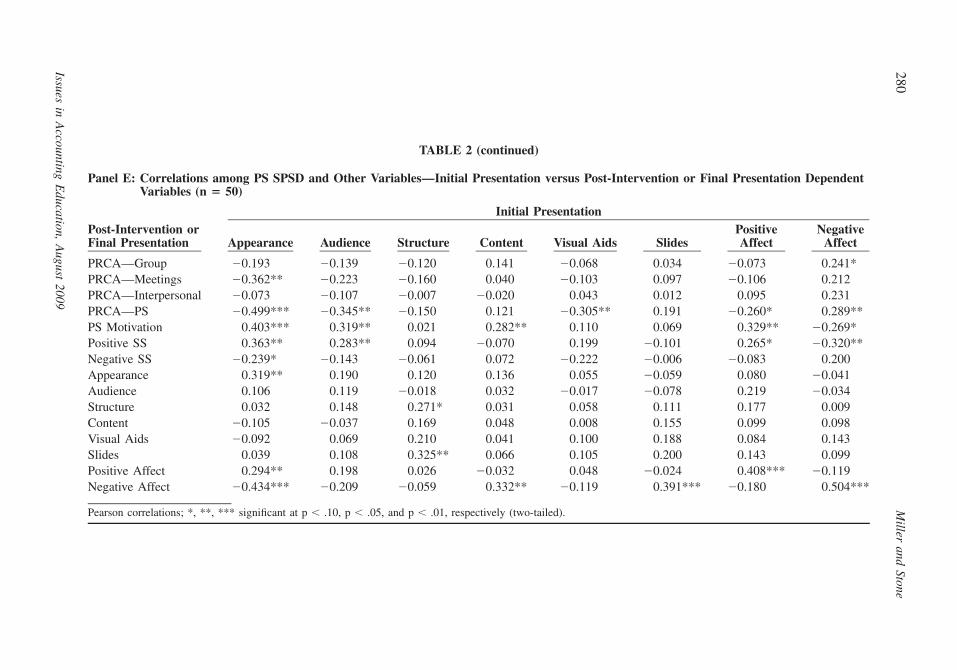
CorrelationsTable 2 presents correlation results; Spearman correlations appear above the diagonal;
Pearson correlations appear below the diagonal. Table 2, Panel A, presents pre- to post-intervention correlational results for metrics that are common across all three studies. Thesecorrelations suggest adequate discriminant validity among constructs (highest correlation�0.52).8 Table 2, Panels B through E, presents the correlations among the additional Study2 and Study 3 measures. Consistent with previous criticism of the PRCA-24 (e.g., Hofmannand DiBartolo 2000), there are some high correlations (�0.7) among subcomponents onthe PRCA-24 (see Table 2, Panel B).
Tests of Hypotheses and Related AnalysesRecall that data from all three studies are available for the tests of H1 through H3.
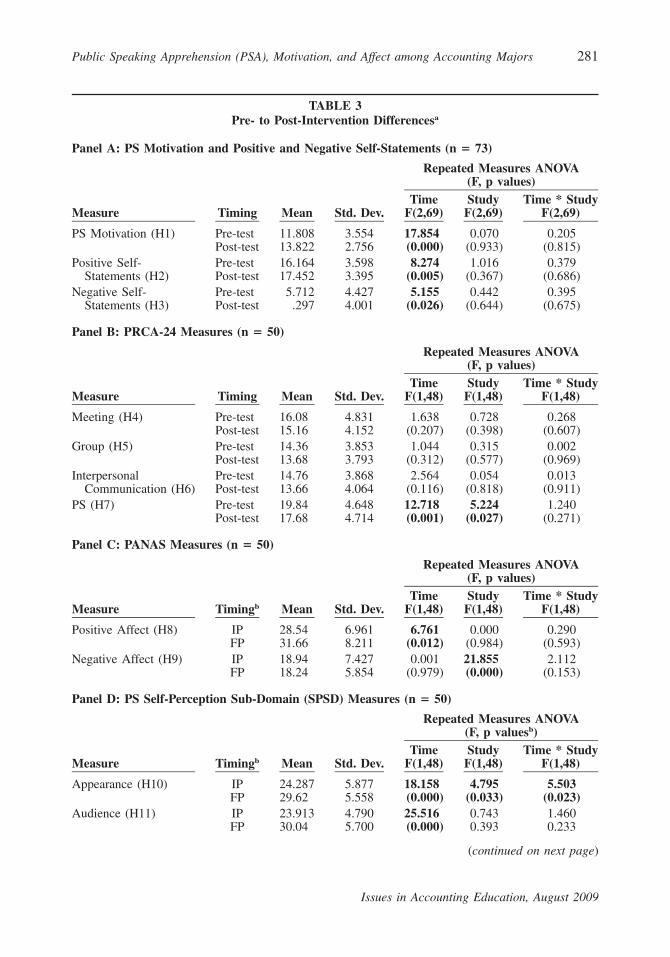
Hypotheses 1 and 2 predict increases in pre- to post-intervention PS motivation and positiveSS; H3 predicts a decrease in pre- to post-intervention PS negative SS. The results supportH1, H2, and H3 (PS motivation p � 0.000, positive SS p � 0.005, negative SS p � 0.026;see Table 3, Panel A). There are no effects due to study and no intervention by studyinteraction effects in the tests of H1 through H3.9
Recall that data from Studies 2 and 3, but not 1, are available for the tests of H4through H15. Hypotheses 4 through 6 predict no pre- to post-intervention differences inthe PRCA-24 domains of meetings, groups, and interpersonal communication; H7 predictspre- to post-intervention improvements in PSA. Hypotheses 4 through 7 are supported (seeTable 3, Panel B). Accordingly, these results provide some evidence of intervention successand discrimination, and lessen the likelihood that pre- to post-intervention changes can beexplained as resulting from internal validity confounds such as maturation or history (cf.,Shadish et al. 2002). There are no effects due to study and no intervention by study inter-action effects in the tests of H4 through H6. However, we find a significant study effectfor PSA (p � 0.027). To further investigate this effect, we ran a multivariate GLM todetermine whether these differences occur at pre-intervention, post-intervention, or both.Results indicate no between-study differences in pre-intervention PSA, but lower post-intervention PSA in Study 2 than in Study 3 (p � .013).
Hypothesis 8 predicts pre- to post-intervention increases in positive affect; H9 predictspre- to post-intervention decreases in negative affect. Consistent with H8, pre- to post-intervention positive affect increases (p � .012). However, in contrast to H9, negative affect
7 As a test of robustness, we reanalyzed these data using paired t-tests. The results better support the hypothesesbut fail to control for between-study differences.
8 Kline (2005) argues that correlations greater than 0.85 indicate a discriminant validity problem.9 We attempted to add ability as a covariate in our tests of Hypotheses 1 through 3, where we had the highest
statistical power; the results suggest that we have insufficient degrees of freedom, i.e., Beta error is unacceptablyhigh, for this analysis. For example, the realized statistical power for finding an effect due to the intervention,when omitting covariates, is 0.986, which is higher than the common suggestion of setting minimal statisticalpower � 0.80 (Cohen 1969, 1988). In contrast, when we add undergraduate GPA to the model to control forability, the statistical power for finding an effect due to the intervention drops to 0.095. Similarly unacceptablelow levels of statistical power obtain for all of the covariates that we collected and increase for the cases wherewe have data only in Studies 2 and 3.
Public
SpeakingA
pprehension(P
SA),
Motivation,
andA
ffectam
ongA
ccountingM
ajors277
Issuesin
Accounting
Education,
August
2009
TABLE 2Pre- to Post-intervention Correlations
Panel A: PS Positive and Negative Self-Statements and Motivation (n � 71 to 73)
PS MotivationPre-Intervention
PS MotivationPost-Intervention
Positive Self-Statements Pre-
Intervention
Positive Self-Statements Post-
Intervention
Negative Self-Statements Pre-
Intervention
Negative Self-Statements Post-
Intervention
PS Motivation Pre-Intervention
0.376*** 0.549*** 0.204* �0.499*** �0.107
PS Motivation Post-Intervention
0.391*** 0.538*** 0.421*** �0.311*** �0.389***
Positive Self-StatementsPre-Intervention
0.515*** 0.528*** 0.343*** �0.466*** �0.153
Positive Self-StatementsPost-Intervention
0.202* 0.479*** 0.453*** �0.180 �0.280**
Negative Self-Statements Pre-Intervention
�0.511*** �0.353*** �0.529*** �0.325*** 0.171
Negative Self-Statements Post-Intervention
�0.148 �0.473*** �0.302*** �0.416*** 0.297**
*, **, *** Significant at p � .10, p � .05, and p � .01, respectively (two-tailed).Pearson correlations below diagonal, Spearman above diagonal.
(continued on next page)
278M
illerand
Stone
Issuesin
Accounting
Education,
August
2009
TABLE 2 (continued)
Panel B: PRCA-24 Correlations (n � 50)
Group Pre-Intervention
Group Post-Intervention
Meeting Pre-Intervention
Meeting Post-Intervention
InterpersonalPre-
Intervention
InterpersonalPost-
InterventionPS Pre-
InterventionPS Post-
Intervention
Group Pre-Intervention 0.283** 0.670*** 0.221 0.427*** 0.210* 0.465*** 0.247*Group Post-intervention 0.421*** 0.045 0.458*** 0.017 0.542*** 0.129 0.376***Meeting Pre-
Intervention0.725*** 0.177 0.235* 0.514*** 0.048 0.377*** 0.057
Meeting Post-Intervention
0.265 0.616** 0.255 0.100 0.388** 0.218 0.354*
Interpersonal Pre-Intervention
0.487** 0.131 0.605** 0.140 0.318* 0.162 0.034
Interpersonal Post-Intervention
0.291** 0.581*** 0.091 0.413*** 0.370*** 0.029 0.159
PS Pre-Intervention 0.401*** 0.137 0.390*** 0.260* 0.158 0.025 0.521***PS Post-Intervention 0.241* 0.311** 0.089 0.395*** 0.070 0.184 0.544***
*, **, *** p � .10, � .05, and � .01, respectively, Pearson correlations, two-tailed test significance.Pearson correlations below diagonal, Spearman above diagonal.
Panel C: Correlations of PRCA-24 with PS Positive and Negative SS and Motivation (n � 50)
Pre-Intervention Post-InterventionPS
MotivationPositive Self-Statements
Negative Self-Statements
PSMotivation
Positive Self-Statements
Negative Self-Statements
Group Pre-Intervention �0.285** �0.432*** 0.347** �0.287** �0.317** 0.170Meeting Pre-Intervention �0.354** �0.331** 0.347** �0.223 �0.087 0.071Interpersonal Pre-Intervention �0.265* �0.382*** 0.425*** �0.276* �0.131 0.200PS Pre-Intervention �0.577*** �0.565*** 0.439*** �0.374*** �0.317** 0.136Group Post-Intervention �0.016 �0.295** 0.254* �0.149 �0.247* 0.302**Meeting Post-Intervention �0.081 �0.227 0.248* �0.216 �0.286** 0.242*Interpersonal Post-Intervention �0.060 �0.154 0.225 �0.279* �0.190 0.282**PS Post-Intervention �0.230 �0.467*** 0.232 �0.618*** �0.559*** 0.453***
*, **, *** p � .10, � .05, and � .01, respectively, Pearson correlations, two-tailed test significance.
(continued on next page)
Public
SpeakingA
pprehension(P
SA),
Motivation,
andA
ffectam
ongA
ccountingM
ajors279
Issuesin
Accounting
Education,
August
2009
TABLE 2 (continued)
Panel D: Correlations among PRCA, PS Motivation, and Self-Statement Variables—Initial Presentation versus Post-Intervention or FinalPresentation (n � 50)
Initial PresentationPost-Intervention orFinal Presentation PRCA—Group PRCA—Meetings
PRCA—Interpersonal PRCA—PS PS Motivation Positive SS Negative SS
PRCA—Group 0.421*** 0.177 0.131 0.137 �0.016 �0.295** 0.254*PRCA—Meetings 0.265* 0.255* 0.140 0.260* �0.081 �0.227 0.248*PRCA—Interpersonal 0.291** 0.091 0.370*** 0.025 �0.060 �0.154 0.226PRCA—PS 0.241* 0.089 0.070 0.544*** �0.230 �0.467*** 0.232PS Motivation �0.287** �0.223 �0.276* �0.374*** 0.374*** 0.481*** �0.315**Positive SS �0.317** �0.087 �0.131 �0.317** 0.185 0.473*** �0.195Negative SS 0.170 0.071 0.200 0.136 �0.068 �0.211 0.379***Appearance �0.163 �0.051 �0.102 �0.167 0.001 0.176 0.073Audience �0.098 0.058 �0.020 �0.071 �0.050 0.207 �0.054Structure 0.014 0.032 �0.042 0.255* �0.299** 0.001 0.161Content 0.138 0.203 0.114 0.424*** �0.403*** �0.081 0.296**Visual Aids 0.037 0.195 0.186 0.264* �0.252* 0.032 0.296**Slides �0.146 0.069 0.174 0.165 �0.158 0.120 0.159Positive Affect �0.293** �0.162 �0.227 �0.263* �0.021 0.338** �0.106Negative Affect 0.268* 0.105 0.121 0.455*** �0.231 �0.452*** 0.327**
(continued on next page)
280M
illerand
Stone
Issuesin
Accounting
Education,
August
2009
TABLE 2 (continued)
Panel E: Correlations among PS SPSD and Other Variables—Initial Presentation versus Post-Intervention or Final Presentation DependentVariables (n � 50)
Initial PresentationPost-Intervention orFinal Presentation Appearance Audience Structure Content Visual Aids Slides
PositiveAffect
NegativeAffect
PRCA—Group �0.193 �0.139 �0.120 0.141 �0.068 0.034 �0.073 0.241*PRCA—Meetings �0.362** �0.223 �0.160 0.040 �0.103 0.097 �0.106 0.212PRCA—Interpersonal �0.073 �0.107 �0.007 �0.020 0.043 0.012 0.095 0.231PRCA—PS �0.499*** �0.345** �0.150 0.121 �0.305** 0.191 �0.260* 0.289**PS Motivation 0.403*** 0.319** 0.021 0.282** 0.110 0.069 0.329** �0.269*Positive SS 0.363** 0.283** 0.094 �0.070 0.199 �0.101 0.265* �0.320**Negative SS �0.239* �0.143 �0.061 0.072 �0.222 �0.006 �0.083 0.200Appearance 0.319** 0.190 0.120 0.136 0.055 �0.059 0.080 �0.041Audience 0.106 0.119 �0.018 0.032 �0.017 �0.078 0.219 �0.034Structure 0.032 0.148 0.271* 0.031 0.058 0.111 0.177 0.009Content �0.105 �0.037 0.169 0.048 0.008 0.155 0.099 0.098Visual Aids �0.092 0.069 0.210 0.041 0.100 0.188 0.084 0.143Slides 0.039 0.108 0.325** 0.066 0.105 0.200 0.143 0.099Positive Affect 0.294** 0.198 0.026 �0.032 0.048 �0.024 0.408*** �0.119Negative Affect �0.434*** �0.209 �0.059 0.332** �0.119 0.391*** �0.180 0.504***
Pearson correlations; *, **, *** significant at p � .10, p � .05, and p � .01, respectively (two-tailed).
Public Speaking Apprehension (PSA), Motivation, and Affect among Accounting Majors 281
Issues in Accounting Education, August 2009
TABLE 3Pre- to Post-Intervention Differencesa
Panel A: PS Motivation and Positive and Negative Self-Statements (n � 73)
Measure Timing Mean Std. Dev.
Repeated Measures ANOVA(F, p values)
TimeF(2,69)
StudyF(2,69)
Time * StudyF(2,69)
PS Motivation (H1) Pre-test 11.808 3.554 17.854 0.070 0.205Post-test 13.822 2.756 (0.000) (0.933) (0.815)
Positive Self- Pre-test 16.164 3.598 8.274 1.016 0.379Statements (H2) Post-test 17.452 3.395 (0.005) (0.367) (0.686)
Negative Self- Pre-test 5.712 4.427 5.155 0.442 0.395Statements (H3) Post-test .297 4.001 (0.026) (0.644) (0.675)
Panel B: PRCA-24 Measures (n � 50)
Measure Timing Mean Std. Dev.
Repeated Measures ANOVA(F, p values)
TimeF(1,48)
StudyF(1,48)
Time * StudyF(1,48)
Meeting (H4) Pre-test 16.08 4.831 1.638 0.728 0.268Post-test 15.16 4.152 (0.207) (0.398) (0.607)
Group (H5) Pre-test 14.36 3.853 1.044 0.315 0.002Post-test 13.68 3.793 (0.312) (0.577) (0.969)
Interpersonal Pre-test 14.76 3.868 2.564 0.054 0.013Communication (H6) Post-test 13.66 4.064 (0.116) (0.818) (0.911)
PS (H7) Pre-test 19.84 4.648 12.718 5.224 1.240Post-test 17.68 4.714 (0.001) (0.027) (0.271)
Panel C: PANAS Measures (n � 50)
Measure Timingb Mean Std. Dev.
Repeated Measures ANOVA(F, p values)
TimeF(1,48)
StudyF(1,48)
Time * StudyF(1,48)
Positive Affect (H8) IP 28.54 6.961 6.761 0.000 0.290FP 31.66 8.211 (0.012) (0.984) (0.593)
Negative Affect (H9) IP 18.94 7.427 0.001 21.855 2.112FP 18.24 5.854 (0.979) (0.000) (0.153)
Panel D: PS Self-Perception Sub-Domain (SPSD) Measures (n � 50)
Measure Timingb Mean Std. Dev.
Repeated Measures ANOVA(F, p valuesb)
TimeF(1,48)
StudyF(1,48)
Time * StudyF(1,48)
Appearance (H10) IP 24.287 5.877 18.158 4.795 5.503FP 29.62 5.558 (0.000) (0.033) (0.023)
Audience (H11) IP 23.913 4.790 25.516 0.743 1.460FP 30.04 5.700 (0.000) 0.393 0.233
(continued on next page)
282 Miller and Stone
Issues in Accounting Education, August 2009
TABLE 3 (continued)
Measure Timingb Mean Std. Dev.
Repeated Measures ANOVA(F, p valuesb)
TimeF(1,48)
StudyF(1,48)
Time * StudyF(1,48)
Structure (H12) IP 7.333 1.750 29.382 0.051 0.020FP 8.78 1.266 (0.000) (0.823) (0.888)
Slides (H13) IP 7.32 1.372 30.677 10.356 8.244FP 8.48 1.542 (0.000) (0.002) (0.006)
Visual Aids (H14) IP 8.34 1.423 2.493 1.393 5.631FP 7.633 1.239 (0.121) (0.244) (0.022)
Content (H15) IP 17.42 2.509 48.474 24.662 18.526FP 20.46 3.196 (0.000) (0.000) (0.000)
a Significant results shown in bold.b IP � initial presentation; FP � final presentation.c Two-tailed p-values.
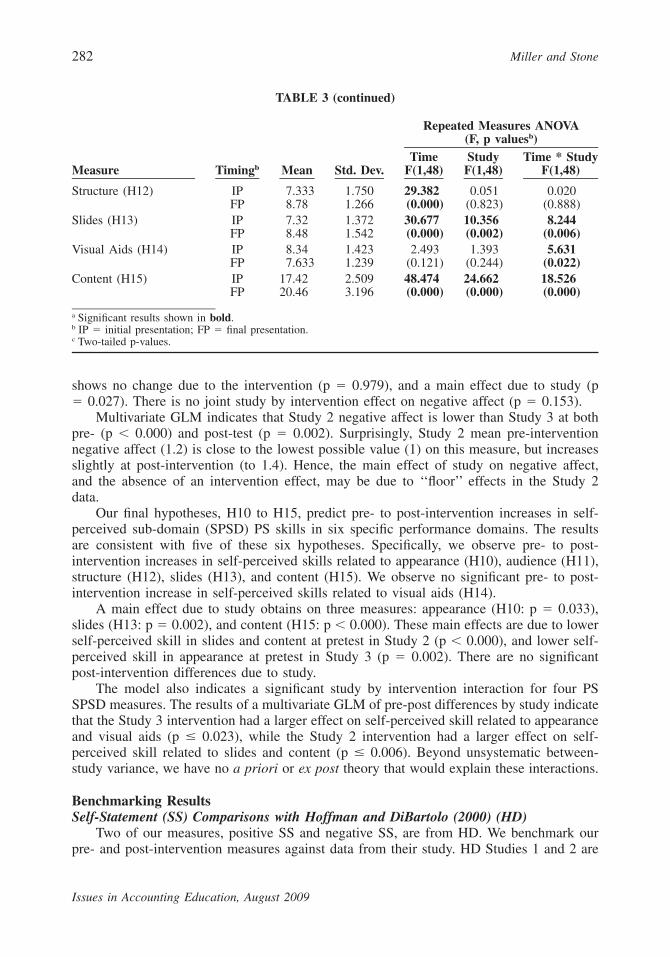
shows no change due to the intervention (p � 0.979), and a main effect due to study (p� 0.027). There is no joint study by intervention effect on negative affect (p � 0.153).
Multivariate GLM indicates that Study 2 negative affect is lower than Study 3 at bothpre- (p � 0.000) and post-test (p � 0.002). Surprisingly, Study 2 mean pre-interventionnegative affect (1.2) is close to the lowest possible value (1) on this measure, but increasesslightly at post-intervention (to 1.4). Hence, the main effect of study on negative affect,and the absence of an intervention effect, may be due to ‘‘floor’’ effects in the Study 2data.
Our final hypotheses, H10 to H15, predict pre- to post-intervention increases in self-perceived sub-domain (SPSD) PS skills in six specific performance domains. The resultsare consistent with five of these six hypotheses. Specifically, we observe pre- to post-intervention increases in self-perceived skills related to appearance (H10), audience (H11),structure (H12), slides (H13), and content (H15). We observe no significant pre- to post-intervention increase in self-perceived skills related to visual aids (H14).
A main effect due to study obtains on three measures: appearance (H10: p � 0.033),slides (H13: p � 0.002), and content (H15: p � 0.000). These main effects are due to lowerself-perceived skill in slides and content at pretest in Study 2 (p � 0.000), and lower self-perceived skill in appearance at pretest in Study 3 (p � 0.002). There are no significantpost-intervention differences due to study.
The model also indicates a significant study by intervention interaction for four PSSPSD measures. The results of a multivariate GLM of pre-post differences by study indicatethat the Study 3 intervention had a larger effect on self-perceived skill related to appearanceand visual aids (p � 0.023), while the Study 2 intervention had a larger effect on self-perceived skill related to slides and content (p � 0.006). Beyond unsystematic between-study variance, we have no a priori or ex post theory that would explain these interactions.
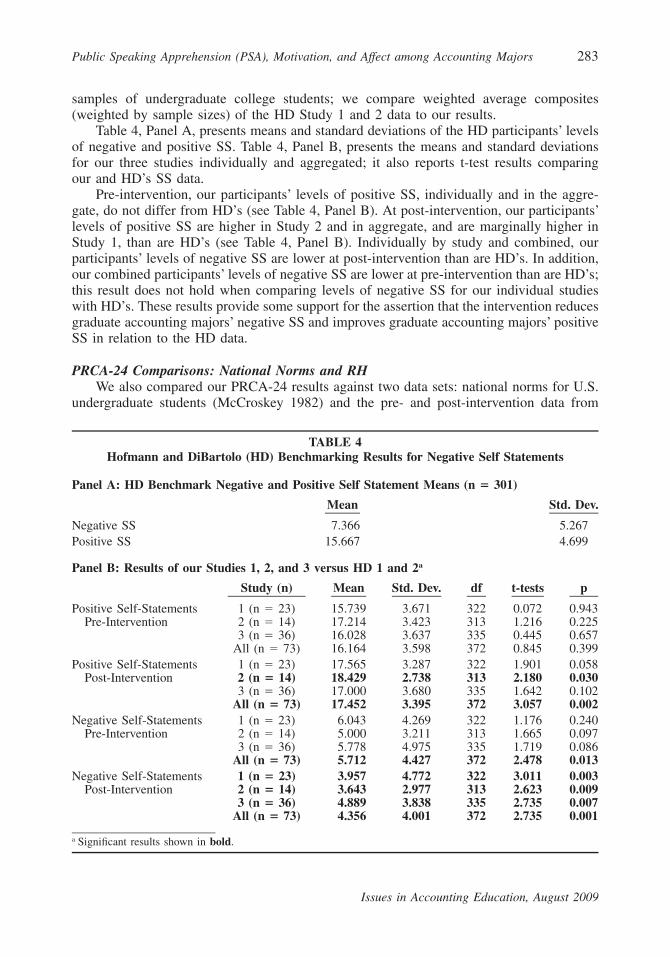
Benchmarking ResultsSelf-Statement (SS) Comparisons with Hoffman and DiBartolo (2000) (HD)
Two of our measures, positive SS and negative SS, are from HD. We benchmark ourpre- and post-intervention measures against data from their study. HD Studies 1 and 2 are
Public Speaking Apprehension (PSA), Motivation, and Affect among Accounting Majors 283
Issues in Accounting Education, August 2009
TABLE 4Hofmann and DiBartolo (HD) Benchmarking Results for Negative Self Statements
Panel A: HD Benchmark Negative and Positive Self Statement Means (n � 301)
Mean Std. Dev.
Negative SS 7.366 5.267Positive SS 15.667 4.699
Panel B: Results of our Studies 1, 2, and 3 versus HD 1 and 2a
Study (n) Mean Std. Dev. df t-tests p
Positive Self-Statements 1 (n � 23) 15.739 3.671 322 0.072 0.943Pre-Intervention 2 (n � 14) 17.214 3.423 313 1.216 0.225
3 (n � 36) 16.028 3.637 335 0.445 0.657All (n � 73) 16.164 3.598 372 0.845 0.399
Positive Self-Statements 1 (n � 23) 17.565 3.287 322 1.901 0.058Post-Intervention 2 (n � 14) 18.429 2.738 313 2.180 0.030
3 (n � 36) 17.000 3.680 335 1.642 0.102All (n � 73) 17.452 3.395 372 3.057 0.002
Negative Self-Statements 1 (n � 23) 6.043 4.269 322 1.176 0.240Pre-Intervention 2 (n � 14) 5.000 3.211 313 1.665 0.097
3 (n � 36) 5.778 4.975 335 1.719 0.086All (n � 73) 5.712 4.427 372 2.478 0.013
Negative Self-Statements 1 (n � 23) 3.957 4.772 322 3.011 0.003Post-Intervention 2 (n � 14) 3.643 2.977 313 2.623 0.009
3 (n � 36) 4.889 3.838 335 2.735 0.007All (n � 73) 4.356 4.001 372 2.735 0.001
a Significant results shown in bold.
samples of undergraduate college students; we compare weighted average composites(weighted by sample sizes) of the HD Study 1 and 2 data to our results.
Table 4, Panel A, presents means and standard deviations of the HD participants’ levelsof negative and positive SS. Table 4, Panel B, presents the means and standard deviationsfor our three studies individually and aggregated; it also reports t-test results comparingour and HD’s SS data.
Pre-intervention, our participants’ levels of positive SS, individually and in the aggre-gate, do not differ from HD’s (see Table 4, Panel B). At post-intervention, our participants’levels of positive SS are higher in Study 2 and in aggregate, and are marginally higher inStudy 1, than are HD’s (see Table 4, Panel B). Individually by study and combined, ourparticipants’ levels of negative SS are lower at post-intervention than are HD’s. In addition,our combined participants’ levels of negative SS are lower at pre-intervention than are HD’s;this result does not hold when comparing levels of negative SS for our individual studieswith HD’s. These results provide some support for the assertion that the intervention reducesgraduate accounting majors’ negative SS and improves graduate accounting majors’ positiveSS in relation to the HD data.
PRCA-24 Comparisons: National Norms and RHWe also compared our PRCA-24 results against two data sets: national norms for U.S.
undergraduate students (McCroskey 1982) and the pre- and post-intervention data from
284 Miller and Stone
Issues in Accounting Education, August 2009
RH’s (1994) study of OCA among accountancy students. We expect to find no differencebetween national norms and our pre-intervention data; we expect lower levels of PSA inour post-intervention data than in the national undergraduate norms, but no differencein PSA in our and RH’s post-intervention data.
The results are generally consistent with these expectations. Our pre-intervention scoresare statistically equivalent to national norms and RH’s participants at pre-intervention (re-sults not shown; p � 0.133). In addition, our participants’ post-intervention PSA scores arelower than national U.S. undergraduate norms (McCroskey 1982) (t(12,466) � 3.072, p� 0.002). However, contrary to our expectations, our post-intervention PSA scores arehigher than are RH’s post-intervention scores (t(70) � 2.25, p � 0.027).
To understand why our post-intervention PSA scores are higher than are RH’spost-intervention scores, we separately compared our Study 2 and Study 3 pre- and post-intervention PSA scores with those of RH. The pre- (t(34) � 0.207, p � 0.796) andpost-(t(34) � 0.199, p � 0.844) intervention PSA scores of our Study 2 and RH’s partic-ipants do not differ. However, our Study 3 participants have marginally higher pre-intervention PSA scores (t(56) � 1.815, p � 0.075) and higher post-intervention PSA scores(t(56) � 2.837, p � 0.006) than do RH’s participants. Hence, differences in our and RH’sresults occur in Study 3 but not Study 2. The post-intervention differences in our Study 3and RH’s study may obtain because of either the: (1) initially marginally higher PSA levelsamong our Study 3 participants, or (2) because the reduced intervention activity in Study3 may have reduced intervention effectiveness.
PRCA-24 Comparisons: High OCA Base RatesMcCroskey suggests that students who are one standard deviation or above national
norms on total PRCA-24 score are ‘‘high’’ OCA. Using this benchmark, RH and SL reportapproximately 7.5 percent and 19 percent high OCA participants, respectively. In our sam-ples, six students (6/50 or 12 percent) are high OCA at pre-intervention, while three stu-dents (3/50 or 6 percent) have high OCA at post-intervention. The SL sample is of intro-ductory accounting classes, while the RH and our sample are of upper division and graduateaccounting students, respectively.
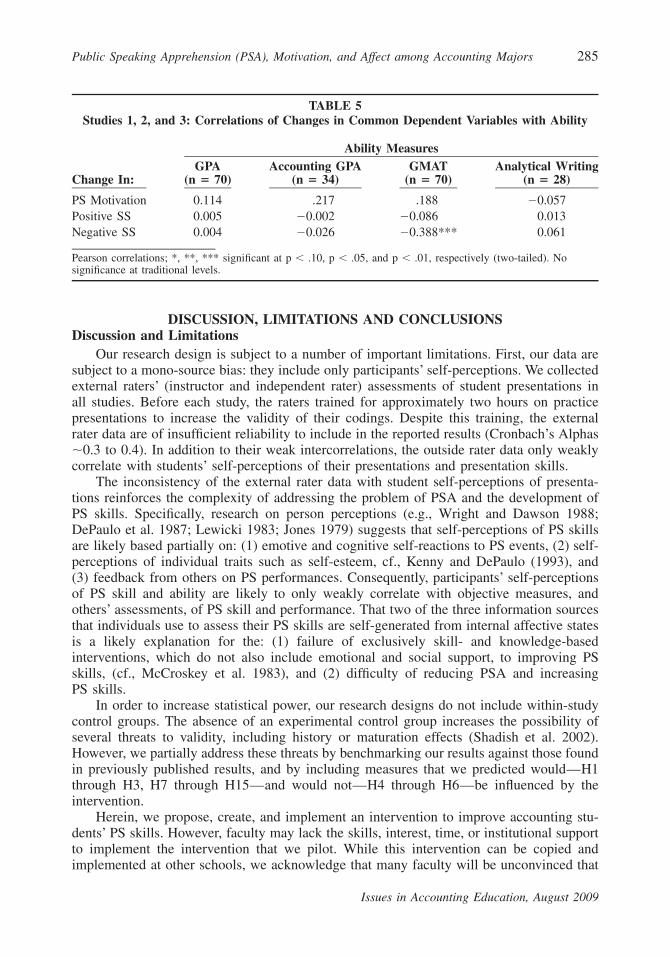
Do Changes in PS Motivation, and Positive and Negative SS, Correlate with Ability?RH found that students with higher standardized test scores, i.e., students of higher
ability, benefited less from their intervention than did students with lower standardized testscores. This suggests that the effectiveness of the RH intervention was greater for studentsof lower rather than higher ability. We tested whether changes in the PS measures (PSmotivation; positive and negative SS) that are common in Studies 1, 2, and 3 correlatedwith ability (see Table 5). Specifically, we correlated changes in these measures with fourmeasures of ability: (1) overall undergraduate GPA, (2) undergraduate accounting GPA, (3)GMAT total (verbal and quantitative) score, and (4) GMAT analytical writing score.
Only one of the 12 correlations is significant: a negative correlation of GMAT totalscore with the change in negative SS; this result means that students of higher ability (withhigher GMAT scores) evidence greater intervention benefits in negative SS comparedwith students of lower ability. This result is the opposite of RH’s. We offer three speculativeexplanations for these differing results: (1) sampling (random) error in one or all of ourstudies or RH’s study, (2) the differing interventions in the present versus RH studies leadto an opposite relationship between intervention efficacy and student ability, and (3) sys-tematic, though unidentified, sample differences in our and RH’s studies. These speculationsawait future investigation.
Public Speaking Apprehension (PSA), Motivation, and Affect among Accounting Majors 285
Issues in Accounting Education, August 2009
TABLE 5Studies 1, 2, and 3: Correlations of Changes in Common Dependent Variables with Ability
Change In:
Ability MeasuresGPA
(n � 70)Accounting GPA
(n � 34)GMAT
(n � 70)Analytical Writing
(n � 28)
PS Motivation 0.114 .217 .188 �0.057Positive SS 0.005 �0.002 �0.086 0.013Negative SS 0.004 �0.026 �0.388*** 0.061
Pearson correlations; *, **, *** significant at p � .10, p � .05, and p � .01, respectively (two-tailed). Nosignificance at traditional levels.
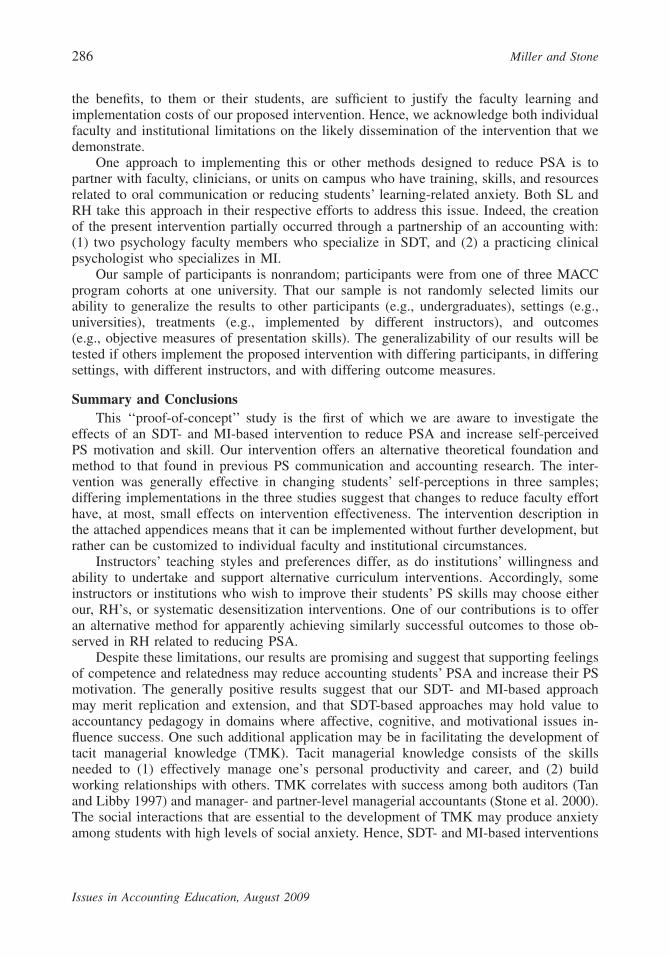
DISCUSSION, LIMITATIONS AND CONCLUSIONSDiscussion and Limitations
Our research design is subject to a number of important limitations. First, our data aresubject to a mono-source bias: they include only participants’ self-perceptions. We collectedexternal raters’ (instructor and independent rater) assessments of student presentations inall studies. Before each study, the raters trained for approximately two hours on practicepresentations to increase the validity of their codings. Despite this training, the externalrater data are of insufficient reliability to include in the reported results (Cronbach’s Alphas�0.3 to 0.4). In addition to their weak intercorrelations, the outside rater data only weaklycorrelate with students’ self-perceptions of their presentations and presentation skills.
The inconsistency of the external rater data with student self-perceptions of presenta-tions reinforces the complexity of addressing the problem of PSA and the development ofPS skills. Specifically, research on person perceptions (e.g., Wright and Dawson 1988;DePaulo et al. 1987; Lewicki 1983; Jones 1979) suggests that self-perceptions of PS skillsare likely based partially on: (1) emotive and cognitive self-reactions to PS events, (2) self-perceptions of individual traits such as self-esteem, cf., Kenny and DePaulo (1993), and(3) feedback from others on PS performances. Consequently, participants’ self-perceptionsof PS skill and ability are likely to only weakly correlate with objective measures, andothers’ assessments, of PS skill and performance. That two of the three information sourcesthat individuals use to assess their PS skills are self-generated from internal affective statesis a likely explanation for the: (1) failure of exclusively skill- and knowledge-basedinterventions, which do not also include emotional and social support, to improving PSskills, (cf., McCroskey et al. 1983), and (2) difficulty of reducing PSA and increasingPS skills.
In order to increase statistical power, our research designs do not include within-studycontrol groups. The absence of an experimental control group increases the possibility ofseveral threats to validity, including history or maturation effects (Shadish et al. 2002).However, we partially address these threats by benchmarking our results against those foundin previously published results, and by including measures that we predicted would—H1through H3, H7 through H15—and would not—H4 through H6—be influenced by theintervention.
Herein, we propose, create, and implement an intervention to improve accounting stu-dents’ PS skills. However, faculty may lack the skills, interest, time, or institutional supportto implement the intervention that we pilot. While this intervention can be copied andimplemented at other schools, we acknowledge that many faculty will be unconvinced that
286 Miller and Stone
Issues in Accounting Education, August 2009
the benefits, to them or their students, are sufficient to justify the faculty learning andimplementation costs of our proposed intervention. Hence, we acknowledge both individualfaculty and institutional limitations on the likely dissemination of the intervention that wedemonstrate.
One approach to implementing this or other methods designed to reduce PSA is topartner with faculty, clinicians, or units on campus who have training, skills, and resourcesrelated to oral communication or reducing students’ learning-related anxiety. Both SL andRH take this approach in their respective efforts to address this issue. Indeed, the creationof the present intervention partially occurred through a partnership of an accounting with:(1) two psychology faculty members who specialize in SDT, and (2) a practicing clinicalpsychologist who specializes in MI.
Our sample of participants is nonrandom; participants were from one of three MACCprogram cohorts at one university. That our sample is not randomly selected limits ourability to generalize the results to other participants (e.g., undergraduates), settings (e.g.,universities), treatments (e.g., implemented by different instructors), and outcomes(e.g., objective measures of presentation skills). The generalizability of our results will betested if others implement the proposed intervention with differing participants, in differingsettings, with different instructors, and with differing outcome measures.
Summary and ConclusionsThis ‘‘proof-of-concept’’ study is the first of which we are aware to investigate the
effects of an SDT- and MI-based intervention to reduce PSA and increase self-perceivedPS motivation and skill. Our intervention offers an alternative theoretical foundation andmethod to that found in previous PS communication and accounting research. The inter-vention was generally effective in changing students’ self-perceptions in three samples;differing implementations in the three studies suggest that changes to reduce faculty efforthave, at most, small effects on intervention effectiveness. The intervention description inthe attached appendices means that it can be implemented without further development, butrather can be customized to individual faculty and institutional circumstances.
Instructors’ teaching styles and preferences differ, as do institutions’ willingness andability to undertake and support alternative curriculum interventions. Accordingly, someinstructors or institutions who wish to improve their students’ PS skills may choose eitherour, RH’s, or systematic desensitization interventions. One of our contributions is to offeran alternative method for apparently achieving similarly successful outcomes to those ob-served in RH related to reducing PSA.
Despite these limitations, our results are promising and suggest that supporting feelingsof competence and relatedness may reduce accounting students’ PSA and increase their PSmotivation. The generally positive results suggest that our SDT- and MI-based approachmay merit replication and extension, and that SDT-based approaches may hold value toaccountancy pedagogy in domains where affective, cognitive, and motivational issues in-fluence success. One such additional application may be in facilitating the development oftacit managerial knowledge (TMK). Tacit managerial knowledge consists of the skillsneeded to (1) effectively manage one’s personal productivity and career, and (2) buildworking relationships with others. TMK correlates with success among both auditors (Tanand Libby 1997) and manager- and partner-level managerial accountants (Stone et al. 2000).The social interactions that are essential to the development of TMK may produce anxietyamong students with high levels of social anxiety. Hence, SDT- and MI-based interventions
Public Speaking Apprehension (PSA), Motivation, and Affect among Accounting Majors 287
Issues in Accounting Education, August 2009
may be useful in reducing students’ social anxiety and, partially as a consequence, increas-ing students’ TMK. CPA exam preparation also evokes high levels of learning-related anx-iety among students. Hence, SDT- and MI-based interventions may also be useful in re-ducing students’ anxiety and enhancing feelings of competence related to CPA exampreparation.
The possibilities for applying SDT and MI principles and methods to the accountancycurriculum offer the opportunity to contribute to both basic and applied research. Ourresearch effort herein has elements of both basic and applied research. Our basic researchcontribution is conceptualizing, implementing, and delivering a ‘‘proof-of-concept’’ inter-vention that operationalizes SDT theory and MI principles in a new application (PSA) andsetting (accounting instruction). Our applied contribution is to offer the possibility of a newset of techniques and exercises that may be useful to some in combating a major impedi-ment to student success: PSA.
APPENDIX AStudy Constructs and Measures
Panel 1: Common Measures in All Studies: PS Motivation andSelf-Statements
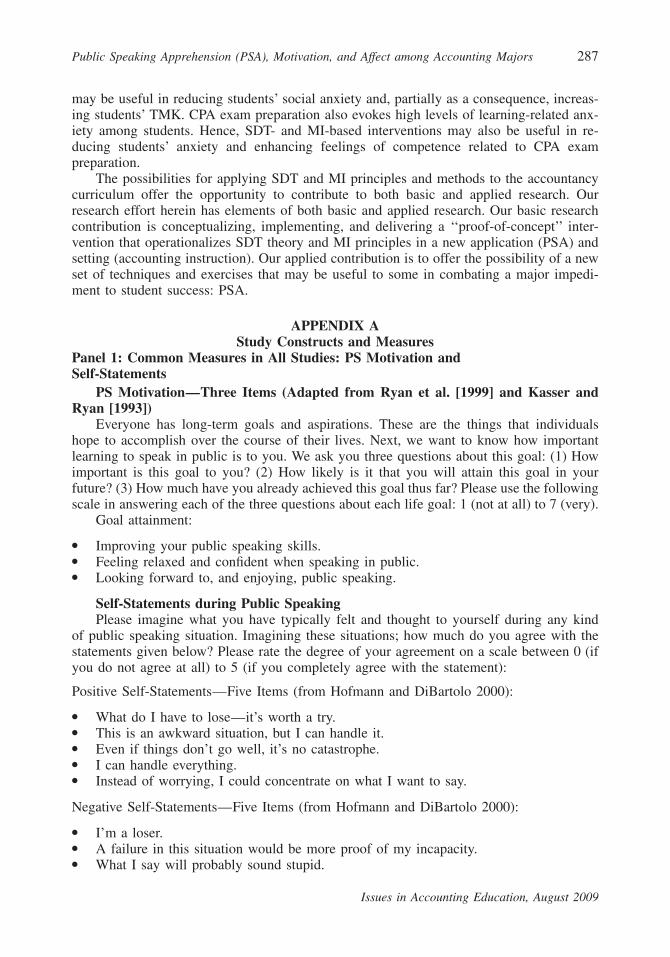
PS Motivation—Three Items (Adapted from Ryan et al. [1999] and Kasser andRyan [1993])
Everyone has long-term goals and aspirations. These are the things that individualshope to accomplish over the course of their lives. Next, we want to know how importantlearning to speak in public is to you. We ask you three questions about this goal: (1) Howimportant is this goal to you? (2) How likely is it that you will attain this goal in yourfuture? (3) How much have you already achieved this goal thus far? Please use the followingscale in answering each of the three questions about each life goal: 1 (not at all) to 7 (very).
Goal attainment:
● Improving your public speaking skills.● Feeling relaxed and confident when speaking in public.● Looking forward to, and enjoying, public speaking.
Self-Statements during Public SpeakingPlease imagine what you have typically felt and thought to yourself during any kind
of public speaking situation. Imagining these situations; how much do you agree with thestatements given below? Please rate the degree of your agreement on a scale between 0 (ifyou do not agree at all) to 5 (if you completely agree with the statement):
Positive Self-Statements—Five Items (from Hofmann and DiBartolo 2000):
● What do I have to lose—it’s worth a try.● This is an awkward situation, but I can handle it.● Even if things don’t go well, it’s no catastrophe.● I can handle everything.● Instead of worrying, I could concentrate on what I want to say.
Negative Self-Statements—Five Items (from Hofmann and DiBartolo 2000):
● I’m a loser.● A failure in this situation would be more proof of my incapacity.● What I say will probably sound stupid.
288 Miller and Stone
Issues in Accounting Education, August 2009
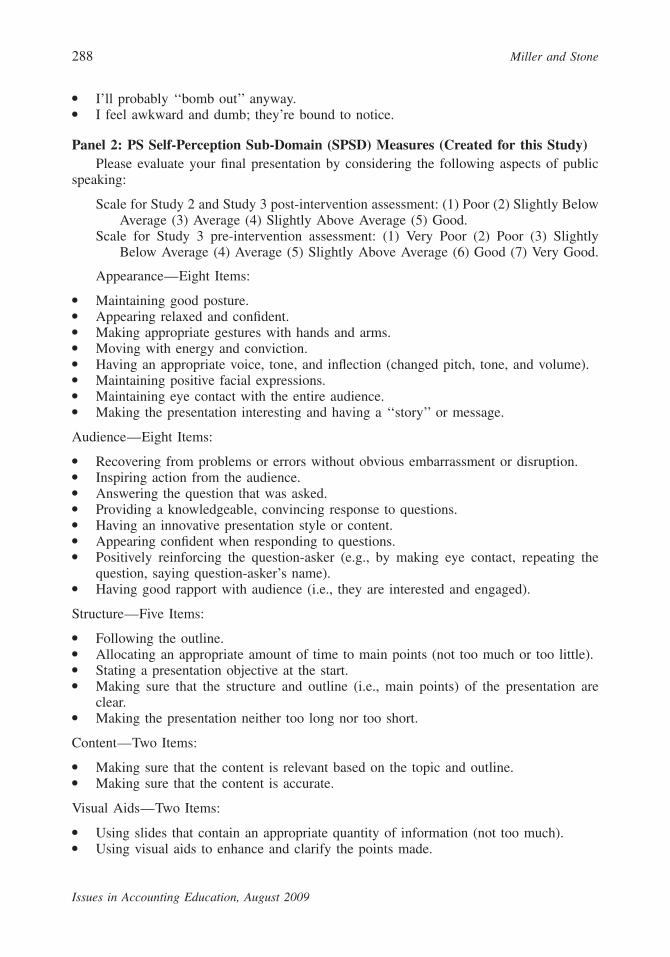
● I’ll probably ‘‘bomb out’’ anyway.● I feel awkward and dumb; they’re bound to notice.
Panel 2: PS Self-Perception Sub-Domain (SPSD) Measures (Created for this Study)Please evaluate your final presentation by considering the following aspects of public
speaking:
Scale for Study 2 and Study 3 post-intervention assessment: (1) Poor (2) Slightly BelowAverage (3) Average (4) Slightly Above Average (5) Good.
Scale for Study 3 pre-intervention assessment: (1) Very Poor (2) Poor (3) SlightlyBelow Average (4) Average (5) Slightly Above Average (6) Good (7) Very Good.
Appearance—Eight Items:
● Maintaining good posture.● Appearing relaxed and confident.● Making appropriate gestures with hands and arms.● Moving with energy and conviction.● Having an appropriate voice, tone, and inflection (changed pitch, tone, and volume).● Maintaining positive facial expressions.● Maintaining eye contact with the entire audience.● Making the presentation interesting and having a ‘‘story’’ or message.
Audience—Eight Items:
● Recovering from problems or errors without obvious embarrassment or disruption.● Inspiring action from the audience.● Answering the question that was asked.● Providing a knowledgeable, convincing response to questions.● Having an innovative presentation style or content.● Appearing confident when responding to questions.● Positively reinforcing the question-asker (e.g., by making eye contact, repeating the
question, saying question-asker’s name).● Having good rapport with audience (i.e., they are interested and engaged).
Structure—Five Items:
● Following the outline.● Allocating an appropriate amount of time to main points (not too much or too little).● Stating a presentation objective at the start.● Making sure that the structure and outline (i.e., main points) of the presentation are
clear.● Making the presentation neither too long nor too short.
Content—Two Items:
● Making sure that the content is relevant based on the topic and outline.● Making sure that the content is accurate.
Visual Aids—Two Items:
● Using slides that contain an appropriate quantity of information (not too much).● Using visual aids to enhance and clarify the points made.
Public Speaking Apprehension (PSA), Motivation, and Affect among Accounting Majors 289
Issues in Accounting Education, August 2009
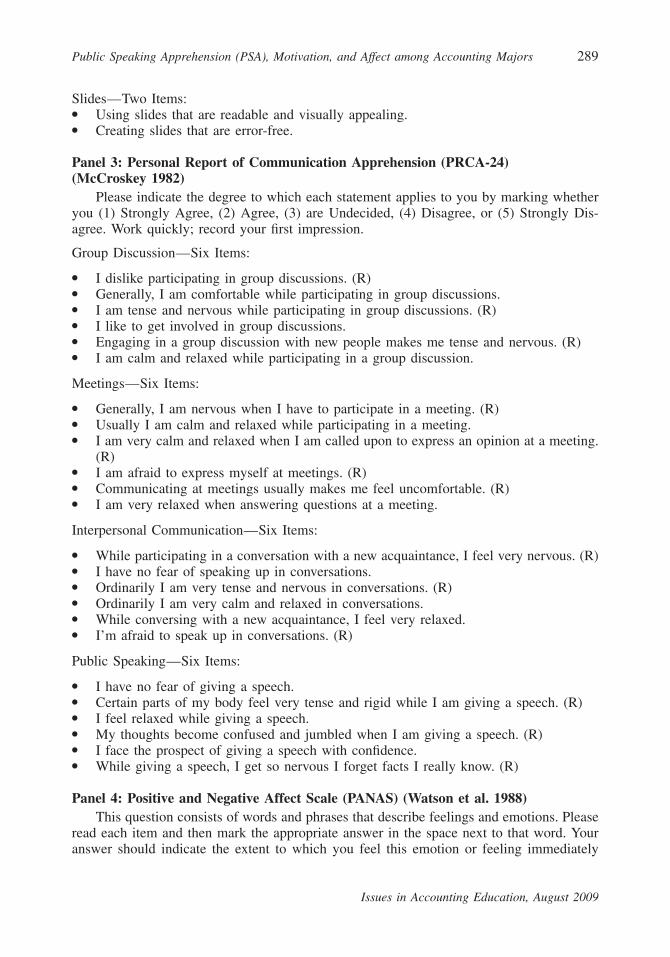
Slides—Two Items:● Using slides that are readable and visually appealing.● Creating slides that are error-free.
Panel 3: Personal Report of Communication Apprehension (PRCA-24)(McCroskey 1982)
Please indicate the degree to which each statement applies to you by marking whetheryou (1) Strongly Agree, (2) Agree, (3) are Undecided, (4) Disagree, or (5) Strongly Dis-agree. Work quickly; record your first impression.
Group Discussion—Six Items:
● I dislike participating in group discussions. (R)● Generally, I am comfortable while participating in group discussions.● I am tense and nervous while participating in group discussions. (R)● I like to get involved in group discussions.● Engaging in a group discussion with new people makes me tense and nervous. (R)● I am calm and relaxed while participating in a group discussion.
Meetings—Six Items:
● Generally, I am nervous when I have to participate in a meeting. (R)● Usually I am calm and relaxed while participating in a meeting.● I am very calm and relaxed when I am called upon to express an opinion at a meeting.
(R)● I am afraid to express myself at meetings. (R)● Communicating at meetings usually makes me feel uncomfortable. (R)● I am very relaxed when answering questions at a meeting.
Interpersonal Communication—Six Items:
● While participating in a conversation with a new acquaintance, I feel very nervous. (R)● I have no fear of speaking up in conversations.● Ordinarily I am very tense and nervous in conversations. (R)● Ordinarily I am very calm and relaxed in conversations.● While conversing with a new acquaintance, I feel very relaxed.● I’m afraid to speak up in conversations. (R)
Public Speaking—Six Items:
● I have no fear of giving a speech.● Certain parts of my body feel very tense and rigid while I am giving a speech. (R)● I feel relaxed while giving a speech.● My thoughts become confused and jumbled when I am giving a speech. (R)● I face the prospect of giving a speech with confidence.● While giving a speech, I get so nervous I forget facts I really know. (R)
Panel 4: Positive and Negative Affect Scale (PANAS) (Watson et al. 1988)This question consists of words and phrases that describe feelings and emotions. Please
read each item and then mark the appropriate answer in the space next to that word. Youranswer should indicate the extent to which you feel this emotion or feeling immediately
290 Miller and Stone
Issues in Accounting Education, August 2009
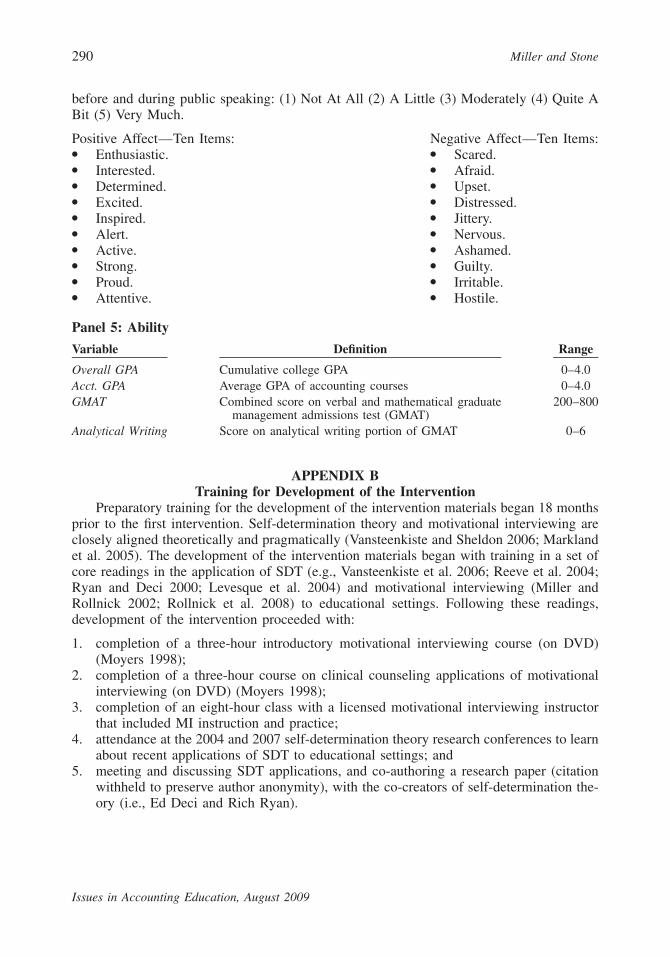
before and during public speaking: (1) Not At All (2) A Little (3) Moderately (4) Quite ABit (5) Very Much.
Positive Affect—Ten Items:● Enthusiastic.● Interested.● Determined.● Excited.● Inspired.● Alert.● Active.● Strong.● Proud.● Attentive.
Negative Affect—Ten Items:● Scared.● Afraid.● Upset.● Distressed.● Jittery.● Nervous.● Ashamed.● Guilty.● Irritable.● Hostile.
Panel 5: Ability
Variable Definition Range
Overall GPA Cumulative college GPA 0–4.0Acct. GPA Average GPA of accounting courses 0–4.0GMAT Combined score on verbal and mathematical graduate
management admissions test (GMAT)200–800
Analytical Writing Score on analytical writing portion of GMAT 0–6
APPENDIX BTraining for Development of the Intervention
Preparatory training for the development of the intervention materials began 18 monthsprior to the first intervention. Self-determination theory and motivational interviewing areclosely aligned theoretically and pragmatically (Vansteenkiste and Sheldon 2006; Marklandet al. 2005). The development of the intervention materials began with training in a set ofcore readings in the application of SDT (e.g., Vansteenkiste et al. 2006; Reeve et al. 2004;Ryan and Deci 2000; Levesque et al. 2004) and motivational interviewing (Miller andRollnick 2002; Rollnick et al. 2008) to educational settings. Following these readings,development of the intervention proceeded with:
1. completion of a three-hour introductory motivational interviewing course (on DVD)(Moyers 1998);
2. completion of a three-hour course on clinical counseling applications of motivationalinterviewing (on DVD) (Moyers 1998);
3. completion of an eight-hour class with a licensed motivational interviewing instructorthat included MI instruction and practice;
4. attendance at the 2004 and 2007 self-determination theory research conferences to learnabout recent applications of SDT to educational settings; and
5. meeting and discussing SDT applications, and co-authoring a research paper (citationwithheld to preserve author anonymity), with the co-creators of self-determination the-ory (i.e., Ed Deci and Rich Ryan).
Public Speaking Apprehension (PSA), Motivation, and Affect among Accounting Majors 291
Issues in Accounting Education, August 2009
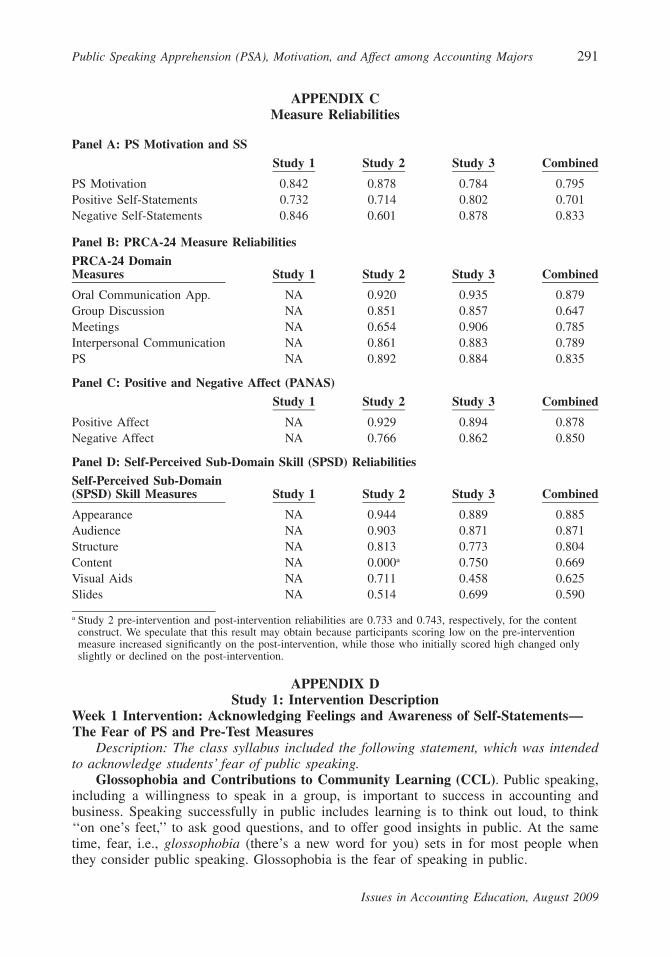
APPENDIX CMeasure Reliabilities
Panel A: PS Motivation and SS
Study 1 Study 2 Study 3 Combined
PS Motivation 0.842 0.878 0.784 0.795Positive Self-Statements 0.732 0.714 0.802 0.701Negative Self-Statements 0.846 0.601 0.878 0.833
Panel B: PRCA-24 Measure Reliabilities
PRCA-24 DomainMeasures Study 1 Study 2 Study 3 Combined
Oral Communication App. NA 0.920 0.935 0.879Group Discussion NA 0.851 0.857 0.647Meetings NA 0.654 0.906 0.785Interpersonal Communication NA 0.861 0.883 0.789PS NA 0.892 0.884 0.835
Panel C: Positive and Negative Affect (PANAS)
Study 1 Study 2 Study 3 Combined
Positive Affect NA 0.929 0.894 0.878Negative Affect NA 0.766 0.862 0.850
Panel D: Self-Perceived Sub-Domain Skill (SPSD) Reliabilities
Self-Perceived Sub-Domain(SPSD) Skill Measures Study 1 Study 2 Study 3 Combined
Appearance NA 0.944 0.889 0.885Audience NA 0.903 0.871 0.871Structure NA 0.813 0.773 0.804Content NA 0.000a 0.750 0.669Visual Aids NA 0.711 0.458 0.625Slides NA 0.514 0.699 0.590
a Study 2 pre-intervention and post-intervention reliabilities are 0.733 and 0.743, respectively, for the contentconstruct. We speculate that this result may obtain because participants scoring low on the pre-interventionmeasure increased significantly on the post-intervention, while those who initially scored high changed onlyslightly or declined on the post-intervention.
APPENDIX DStudy 1: Intervention Description
Week 1 Intervention: Acknowledging Feelings and Awareness of Self-Statements—The Fear of PS and Pre-Test Measures
Description: The class syllabus included the following statement, which was intendedto acknowledge students’ fear of public speaking.
Glossophobia and Contributions to Community Learning (CCL). Public speaking,including a willingness to speak in a group, is important to success in accounting andbusiness. Speaking successfully in public includes learning is to think out loud, to think‘‘on one’s feet,’’ to ask good questions, and to offer good insights in public. At the sametime, fear, i.e., glossophobia (there’s a new word for you) sets in for most people whenthey consider public speaking. Glossophobia is the fear of speaking in public.
292 Miller and Stone
Issues in Accounting Education, August 2009
More about glossophobia:● Here are a few fun facts about a scary subject: glossophobia (from Wikipedia—the free
online encyclopedia):1. The fear of public speaking ranks higher than the fear of death for most people.
Now that’s fear!2. Most people (�75 percent of those surveyed) suffer from moderate to acute
glossophobia.3. The good news is that, if you want to, you can lessen your fear of public speaking.
Here are a few resources (available at: http: / /www.stop-public-speaking-fear.com/articles/ index.htm) for working with glossophobia. In addition, I can help youdevelop your public speaking skills, and, your confidence in your public speakingskills. I want to help if you want help.
Week 2 Intervention: Invitation to Work on PS Skills and ReadingsDescription: Class participants who chose to do so completed a web-based instrument
that included a reading on public speaking skills. They were also directed to additionalreadings which consisted of links at the class on public speaking skill importance to pro-fessional accounting, and techniques for improving public speaking skills.
Talking in public can be difficult for some people. In addition, talking in public maynot be something that you want to work on at this point in your career. I respect yourjudgment about what you want to give your attention to this semester. Is feeling moreconfident about talking in public something that you want to work on this semester? (Note:your response to this question will not affect your grade.) Yes No
Description: Participants responding no (n � 2) were told, ‘‘I respect your choice.’’and thanked for answering this question.
Description: Participants responding yes (n � 21) were:
● asked, ‘‘Would you like to read a short article, and answer a couple of quick questions,about how to become a more confident public speaker now?’’ if they would like to reada short article.
● participants responding yes read a short article on public speaking and answered somequestions about how this reading was, or was not, relevant to their experience in publicspeaking.i. What did you think of the article? The article mentions ‘‘Eleven Hidden Causes of
Public Speaking Stress.’’ These are: (1) Thinking that public speaking is inherentlystressful (it’s not). (2) Thinking you need to be brilliant or perfect to succeed (youdon’t). (3) Trying to impart too much information or cover too many points in ashort presentation. (4) Having the wrong purpose in mind (to get rather thanto give/contribute). (5) Trying to please everyone (this is unrealistic). (6) Trying toemulate other speakers (very difficult) rather than simply being yourself (very easy).(7) Failing to be personally revealing and humble. (8) Being fearful of potentialnegative outcomes (they almost never occur, and even when they do, you can usethem to your advantage). (9) Trying to control the wrong things (e.g., the behaviorof your audience). (10) Spending too much time over-preparing (instead of devel-oping confidence and trust in your natural ability to succeed). (11) Thinking youraudience will be as critical of your performance as you might be. Do any of theseseem true in your experience of public speaking?
ii. The article also mentions ‘‘10 Key Principles to Always Keep in Mind’’ These are:(1) Speaking in Public is NOT Inherently Stressful. (2) You Don’t Have to be
Public Speaking Apprehension (PSA), Motivation, and Affect among Accounting Majors 293
Issues in Accounting Education, August 2009
Brilliant or Perfect to Succeed. (3) All You Need is Two or Three Main Points. (4)You also Need a Purpose That is Right for the Task. (5) The Best Way to Succeedis NOT to Consider Yourself a Public Speaker! (6) Humility and Humor Can Goa Long Way. (7) When You Speak in Public, Nothing ‘‘Bad’’ Can Ever Happen!(8) You Don’t Have to Control the Behavior of Your Audience. (9) In General, theMore You Prepare, the Worse You Will Do. (10) Your Audience Truly Wants Youto Succeed. Do any of these seem like they might be helpful to you? If so, whichones? Why might they be helpful?
● directed to the class website links on public speaking.
Description: The class website also included links, which the instructor mentioned in class,to presentation resources (e.g., Harvard Business School Tips on Preparing Slides, availableat: http:/ /www.hsph.harvard.edu/administrative-offices/faculty-affairs/files/visual aids.pdf).
Week 3 Intervention: Individualized Email that Reflects Feelings Back to, andIncreases Awareness of, Self-Statements
Example correspondence with student:
Hi �student’s first name�,I hope that you are doing well. Tomorrow is the first presentation day in �this class�.I wanted to respond to your comments on the first contribution to class learning (CCL)report that you submitted.
You mentioned that you worried about ‘‘messing up’’ when public speaking, includingfears that you might get sick or not be able to answer a question. You mentioned thatyou don’t think of yourself as being good at ‘‘thinking on your feet.’’ You also saidthat it might be helpful to remind yourself that your audience (and your class in-structor!) want to see you succeed.
Is that an accurate summary? Does that cover what you are thinking about this issue?
I hope that this summary is helpful to you. I appreciate and respect the attention thatyou are devoting to thinking about this important issue.
Best,
�class instructor�
Week 4 Intervention: PresentationsParticipants, organized into groups, made presentations about selected (assigned) por-
tions of the Sarbanes-Oxley legislation.
Week 5 Intervention: Feedback on PS SkillsParticipants received a grade and summary evaluation of their Week 4 presentations
from the course instructor. In addition, participants who requested it (n � 21) receivedindividual feedback about 25 aspects of their presentations. Feedback was provided on thefollowing dimensions:
1. Includes an introduction that motivates interest in the topic or issue.2. Structure and outline (i.e., main points) of the presentation are clear.3. Uses examples (i.e., evidence) to illustrate important points.4. Presenter demonstrates innovation in presentation style or content.
294 Miller and Stone
Issues in Accounting Education, August 2009
5. Presentation is interesting and contains a ‘‘story’’ or message.6. Voice, tone, and inflection (changed pitch, tone, and volume).7. Avoids fillers (e.g., ‘‘um,’’ ‘‘er,’’ ‘‘you know,’’ etc.).8. Uses appropriate humor.9. Appears relaxed and confident.
10. Maintains eye contact with audience.11. Maintains positive facial expressions.12. Gestured with hands and arms.13. Maintained good posture.14. Moves with energy and conviction.15. Followed the outline.16. Has good rapport with audience.17. Uses notes (if any) appropriately.18. Confident in responding to questions.19. Repeated or restated question to clarify.20. Provides knowledgeable response to questions.21. Visual aids enhance and clarify the points made.22. Slides contain appropriate quantity of information (not too much).23. Slides are readable and visually appealing.24. Used media to review main points.25. Summarizes no more than three key points.
Week 8 Intervention: Project Meetings, Coaching, and Awareness of Self-StatementsParticipants met with the instructor regarding the semester projects. These meetings
included, if desired by the participants, a discussion of oral presentations and, for somestudents, a brief, spontaneous presentation. Following each presentation, the instructor of-fered comments and suggestions that were based in dialogue principles and methods frommotivational interviewing and self-determination theory.
Week 16 Intervention: Final Presentations and Post-Test MeasuresParticipants made presentations on a topic of their choice in the same groups as the
presentations in Week 4. All participants received a grade and summary evaluation of theirWeek 4 presentations. After the presentations but before receipt of their grade, participantscompleted the post-test measures.
APPENDIX EStudy 2 and Study 3 Intervention Differences from Study 1
Week 1: Additional MeasuresBoth studies: In addition to Study 1 description and measures, assessed new PRCA-24
measures.
Week 3 Intervention: Email that Reflects Feelings Back to StudentBoth studies: Omitted due to time required of instructor (�15 minutes per student).
Week 4 Intervention: PresentationsStudy 2 only: In addition to Study 1 description, videotaped student presentations and
assessed PS self-perceived sub-domain skill and PANAS measures following presentations.
Public Speaking Apprehension (PSA), Motivation, and Affect among Accounting Majors 295
Issues in Accounting Education, August 2009
Week 5 Intervention: Feedback on PS SkillsStudy 2 only: In addition to Study 1 description, reviewed videotaped student presen-
tations. Instructor discussed students’ presentation problems and strengths within groups.
Week 16 Measures: PresentationsBoth studies: Assessed PS self-perceived sub-domain, PRCA-24, and PANAS measures
following presentations.
REFERENCESAccounting Education Change Commission (AECC). 1992. Grants awarded to two-year colleges for
implementing improvements in accounting education. Issues in Accounting Education 7 (2):241–248.
Adler, R. B. 1977. Confidence in Communication: A Guide to Assertive and Social Skills. New York,NY: Holt, Rinehart and Winston.
al’Absi, M., S. Bongard, T. Buchanan, G. A. Pincomb, J. Licinio, and W. R. Lovallo. 1997. Cardio-vascular and neuroendocrine adjustment to public speaking and mental arithmetic stressors.Psychophysiology 34: 266–275.
Albrecht, W. S., and R. J. Sack. 2000. Accounting Education: Charting the Course through a PerilousFuture. Accounting Education Series, Vol. 16. Sarasota, FL: American Accounting Association.
Aly, I., and M. Islam. 2003. Audit of accounting program on oral communications apprehension: Acomparative study among accounting students. Managerial Auditing Journal 18 (9): 751–760.
———, and ———. 2005. Factors affecting oral communication apprehension among business stu-dents: An empirical study. Journal of American Academy of Business, Cambridge 6 (2): 98–103.
Anonymous. 2007. Careers and lifestyle. Accountancy 140 (1367): 63.Arquero, J. L., T. Hassall, J. Joyce, and J. A. Donoso. 2007. Accounting students and communication
apprehension: A study of Spanish and U.K. students. European Accounting Review 16 (2): 299–322.
Beatty, M. J., and R. R. Behnke. 1991. Effects of public speaking trait anxiety and intensity ofspeaking task on heart rate during performance. Human Communication Research 18 (2): 147–176.
Beck, A. T., G. Emery, and R. L. Greenberg. 2005. Anxiety Disorders and Phobias: A CognitivePerspective. 15th anniversary edition. Cambridge, MA: Basic Books.
Big 8 Accounting Firms. 1989. Perspectives on Education: Capabilities for Success in the AccountingProfession. New York, NY: Arthur Andersen and Co., Arthur Young, Coopers and Lybrand,Deloitte Haskins and Sells, Ernst & Whinney, Peat Marwick Main and Co., Price Waterhouse,and Touche Ross (The Big Eight).
Black, A. E., and E. L. Deci. 2000. The effects of instructors’ autonomy support and students’ auton-omous motivation on learning organic chemistry: A self-determination theory perspective. Sci-ence Education 84: 740–756.
Blanthorne, C., S. Bhamornsiri, and R. E. Guinn. 2005. Are technical skills still important? The CPAJournal 75 (3): 64–65.
Buchanan, T. W., M. al’Absi, and W. R. Lovallo. 1999. Cortisol fluctuates with increases and decreasesin negative affect. Psychoneuroendocrinology 24: 227–241.
Chen, C., K. Jones, A. Scarlata, and D. Stone. 2009. Is accounting an ‘‘outlier’’ profession? A com-parative analysis of professional law, healthcare, engineering, and accounting. Working paper,University of Michigan.
Cohen, J. 1969. Statistical Power for the Behavioral Sciences. San Diego, CA: Academic Press.———. 1988. Statistical Power for the Behavioral Sciences. 2nd edition. San Diego, CA: Academic
Press.
296 Miller and Stone
Issues in Accounting Education, August 2009
Dawes, J. 2002. Five-point vs. eleven-point scales—Does it make a difference to data characteristics?Australasian Journal of Market Research 10 (1): 1–27.
———. 2008. Do data characteristics change according to the number of scale points used? Anexperiment using 5-point, 7-point, and 10-point scales. International Journal of Market Research50 (1): 61–104.
Deci, E. L., and R. M. Ryan 1985. Intrinsic Motivation and Self-Determination in Human Behavior.New York, NY: Plenum.
———, and ———. 2008. Self determination theory: An approach to human motivation and per-sonality. Available at: http: / /www.psych.rochester.edu/SDT/index.php.
DePaulo, B. M., D. A. Kenny, C. W. Hoover, W. Webb, and P. V. Oliver. 1987. Accuracy of personperception: Do people know what kinds of impressions they convey? Journal of Personalityand Social Psychology 52 (2): 303–315.
Fordham, D. R., and A. L. Gabbin. 1996. Skills versus apprehension: Empirical evidence on oralcommunication. Business Communication Quarterly 59 (3): 88–98.
Gardner, C. T., M. J. Milne, C. P. Stringer, and R. H. Whiting. 2005. Oral and written communicationapprehension in accounting students: Curriculum impacts and impacts on academic perform-ance. Accounting Education 14 (3): 313–336.
Goleman, D. 1995. Emotional Intelligence. New York, NY: Bantam Books.———. 2000. Working with Emotional Intelligence. New York, NY: Bantam Books.Grace, D. M., and J. W. Gilsdorf. 2004. Classroom strategies for improving students’ oral commu-
nication skills. Journal of Accounting Education 22 (2): 165–172.Hassall, T., J. Joyce, R. Ottewill, J. Arquero, and J. Donoso. 2000. Communication apprehension in
U.K. and Spanish business and accounting students. Education and Training 42 (2–3): 93–100.Hofmann, S. G., and P. M. DiBartolo. 2000. An instrument to assess self-statements during public
speaking: Scale development and preliminary psychometric properties. Behavior Therapy 31(3): 499–515.
Huber, N. 2005. Most senior managers fear public speaking. Computer Weekly: 20.Johnson, E. N., J. Baird, P. Caster, W. N. Dilla, C. E. Earley, and T. J. Louwers. 2003. Challenges to
audit education for the 21st century: A survey of curricula, course content, and delivery methods.Issues in Accounting Education 18 (3): 241–263.
Jones, E. E. 1979. Person perception. PsycCRITIQUES 24 (12): 1054.Kasser, T., and R. M. Ryan. 1993. A dark side of the American dream: Correlates of financial success
as a central life aspiration. Journal of Personality and Social Psychology 65 (2): 410–422.Kenny, D. A., and B. M. DePaulo. 1993. Do people know how others view them? An empirical and
theoretical account. Psychological Bulletin 114 (1): 145–161.Kline, R. B. 2005. Principles and Practices of Structural Equation Modeling. 2nd edition. New York,
NY: The Guilford Press.Levesque, C., A. Zuehlke, L. R. Stanek, and R. M. Ryan. 2004. Autonomy and competence in German
and American university students: A comparative study based on self-determination theory.Journal of Educational Psychology 96 (1): 68–84.
Lewicki, P. 1983. Self-image bias in person perception. Journal of Personality and Social Psychology45 (2): 384–393.
Mano, H. 1991. The structure and intensity of emotional experiences: Method and context conver-gence. Multivariate Behavioral Research 26 (3): 389–411.
———. 1992. Judgments under distress: Assessing the role of unpleasantness and arousal in judgmentformation. Organizational Behavior and Human Decision Processes 52: 216–245.
Markland, D., R. M. Ryan, V. J. Tobin, and S. Rollnick. 2005. Motivational interviewing and self-determination theory. Journal of Social and Clinical Psychology 24 (6): 811–831.
Marmot, M. G., and R. G. Wilkinson. 2006. Social Determinants of Health. 2nd edition. New York,NY: Oxford University Press.
May, G. S., and C. B. May. 1989. Communication instruction: What is being done to develop thecommunication skills of accounting students? Journal of Accounting Education 7 (2): 233–244.
Public Speaking Apprehension (PSA), Motivation, and Affect among Accounting Majors 297
Issues in Accounting Education, August 2009
McCroskey, J. C., D. C. Ralph, and J. E. Barrick. 1970. The effect of systematic desensitization onspeech anxiety. The Speech Teacher 19 (1): 32–36.
———. 1982. An introduction to rhetorical communication. In Measures of Personality and SocialPsychological Attitudes, edited by J. P. Robinson, P. R. Shaver, and L. S. Wrightsman. SanDiego, CA: Academic Press, Inc.
———, V. P. Richmond, B. A. Berger, and J. H. Baldwin. 1983. How to make a good thing worse:A comparison of approaches to helping students overcome communication apprehension. Com-munication Education 12 (1): 213–219.
Miller, W. R., A. Zweben, C. C. DiClemente, and R. G. Rychtarik. 1992. Motivational EnhancementTherapy Manual: A Clinical Research Guide for Therapists Treating Individuals with AlcoholAbuse and Dependence. Rockville, MD: National Institute on Alcohol Abuse and Alcoholism.
———, and S. Rollnick. 2002. Motivational Interviewing: Preparing People for Change. 2nd edition.New York, NY: Guilford Press.
Moyers, T. B. 1998. Motivational interviewing. In Professional Training Series. Albuquerque, NM:UNM/CASAA.
National Center for O*NET Development. 2007. Production Database—O*NET� 12.0. Raleigh, NC:North Carolina Employment Security Commission. Available at: http: / /www.onetcenter.org/ .
Pittenger, K., M. C. Miller, and J. Mott. 2004. Using real-world standards to enhance students’ pre-sentation skills. Innovative Assignments 67 (3): 327–336.
Reeve, J. 2002. Self-determination theory applied to educational settings. In Handbook on Self-Determination Research, edited by E. L. Deci, and R. M. Ryan. Rochester, NY: University ofRochester Press.
———, H. Jang, D. Carrell, S. Jeon, and J. Barch. 2004. Enhancing students’ engagement by in-creasing teachers’ autonomy support. Motivation and Emotion 28 (2): 147–169.
Rollnick, S., and W. R. Miller. 1995. What is motivational interviewing? Behavioral and CognitivePsychotherapy 23: 325–334.
———, ———, and C. Butler. 2008. Motivational Interviewing in Health Care: Helping PatientsChange Behavior (Applications of Motivational Interviewing). New York, NY: Guilford Press.
Roy, R. H., and J. H. MacNeill. 1963. Study of the common body of knowledge for CPAs. Journalof Accountancy 116 (6): 55–58.
———, and ———. 1966. Horizons for a profession: The common body of knowledge for CPAs.Journal of Accountancy 122 (3): 38–50.
———, ———, Carnegie Corporation of New York, and the American Institute of Certified PublicAccountants (AICPA). 1967. Horizons for a Profession: The Common Body of Knowledge forCertified Public Accountants. New York, NY: AICPA.
Ruchala, L. V., and J. W. Hill. 1994. Reducing accounting students’ oral communication apprehension:Empirical evidence. Journal of Accounting Education 12 (4): 283–303.
Ryan, R. M., V. I. Chirkov, T. D. Little, K. M. Sheldon, E. Timoshina, and E. L. Deci. 1999. TheAmerican dream in Russia: Extrinsic aspirations and well-being in two cultures. Personalityand Social Psychology Bulletin 25 (12): 1509–1524.
———, and E. L. Deci. 2000. Self-determination theory and the facilitation of intrinsic motivation,social development, and well-being. American Psychologist 55 (1): 68–78.
Sergenian, G. K., and L. W. Pant. 1998. Increasing students’ professionalism: A careers project foraccounting majors. Issues in Accounting Education 13 (2): 429–442.
Shadish, W. R., T. D. Cook, and D. T. Campbell. 2002. Experimental and Quasi-Experimental Designsfor Generalized Causal Inference. Boston, MA: Houghton Mifflin.
Siegel, G., and J. E. Sorensen. 1999. Counting More, Counting Less: Transformations in the Man-agement Accounting Profession. Montvale, NJ: Institute of Management Accountants.
Simons, K., M. Higgins, and D. Lowe. 1995. A profile of communication apprehension in accountingmajors: Implications for teaching and curriculum revision. Journal of Accounting Education 13(2): 159–176.
Smith, C. D., and P. E. King. 2004. Student feedback sensitivity and the efficacy of feedback inter-ventions in public speaking improvement. Communication Education 53 (3): 203–216.
298 Miller and Stone
Issues in Accounting Education, August 2009
Smythe, M. J., and L. A. Nikolai. 1996. Communication concerns across different accounting con-stituencies. Journal of Accounting Education 14: 435–451.
———, and ———. 2002. A thematic analysis of oral communication concerns with implicationsfor curriculum design. Journal of Accounting Education 20 (3): 163–181.
Stanga, K. G., and R. T. Ladd. 1990. Oral communication apprehension in beginning accountingmajors: An exploratory study. Issues in Accounting Education 5 (2): 180–194.
Stein, M. B., J. R. Walker, and D. R. Forde. 1996. Public speaking fears in a community sample:Prevalence, impact on functioning, and diagnostic classification. Archives of General Psychiatry53: 169–174.
Stone, D., J. Hunton, and B. Wier. 2000. Succeeding in managerial accounting, part 1: Knowledge,ability, and rank. Accounting, Organizations and Society 25 (7): 697–715.
Tan, H. T., and R. Libby. 1997. Tacit managerial versus technical knowledge as determinants of auditexpertise in the field. Journal of Accounting Research 35 (1): 97–113.
Vansteenkiste, M., and K. M. Sheldon. 2006. There’s nothing more practical than a good theory:Integrating motivational interviewing and self-determination theory. British Journal of ClinicalPsychology 45 (1): 63–82.
———, W. Lens, and E. L. Deci. 2006. Intrinsic versus extrinsic goal contents in self-determinationtheory: Another look at the quality of academic motivation. Educational Psychologist 41 (1):19–31.
Wallechinsky, D., I. Wallace, and A. Wallace. 1977. The People’s Almanac Presents the Book of Lists.New York, NY: Morrow.
Watson, D., L. A. Clark, and A. Tellegen. 1988. Development and validation of brief measures ofpositive and negative affect: The PANAS scales. Journal of Personality and Social Psychology54 (6): 1063–1070.
Weick, K. E. 1983. Stress in accounting systems. The Accounting Review 58 (2): 350–374.Wenrich, W. W., H. H. Dawley, and D. General. 1976. Self-Directed Systematic Desensitization: A
Guide for the Student, Client, and Therapist. Kalamazoo, MI: Behaviordelia.Wikipedia. 2007. Public Speaking. Available at: http: / /en.wikipedia.org/wiki /Public speaking.Williams, D. Z., and G. L. Sundem. 1990. Grants awarded for implementing improvements in ac-
counting education. Issues in Accounting Education 5 (2): 313–329.Williams, G. C., and E. Deci. 1996. Internalization of biopsychosocial values by medical students: A
test of self-determination theory. Journal of Personality and Social Psychology 70 (4): 767–779.
———, and ———. 1998. The importance of supporting autonomy in medical education. Academiaand Clinic 129 (4): 303–308.
Wright, J. C., and V. L. Dawson. 1988. Person perception and the bounded rationality of socialjudgment. Journal of Personality and Social Psychology 55 (5): 780–794.