Embed Size (px)
Citation preview
Public transport network planning: a guide to best practice in NZ cities
March 2010 P Mees Royal Melbourne Institute of Technology (RMIT), Australia J Stone GAMUT Centre, University of Melbourne, Australia M Imran Massey University, New Zealand G Nielson Institute of Transport Economics, Oslo, Norway New Zealand Transport Agency research report 396

ISBN 978-0-478-35291-7 (print)
ISBN 978-0-478-35290-0 (electronic)
ISSN 1173-3756 (print)
ISSN 1173-3764 (electronic)
NZ Transport Agency
Private Bag 6995, Wellington 6141, New Zealand
Telephone 64 4 894 5400; facsimile 64 4 894 6100
www.nzta.govt.nz
Mees, P, J Stone, M Imran and G Nielsen (2010) Public transport network planning: a guide to best
practice in NZ cities. NZ Transport Agency research report 396. 72pp.
This publication is copyright © NZ Transport Agency 2009. Material in it may be reproduced for
personal or in-house use without formal permission or charge, provided suitable acknowledgement is
made to this publication and the NZ Transport Agency as the source. Requests and enquiries about the
reproduction of material in this publication for any other purpose should be made to the Research
Programme Manager, Programmes, Funding and Assessment, National Office, NZ Transport Agency,
Private Bag 6995, Wellington 6141.
Keywords: Cost recovery, mode share, network planning, non-work trips, public transport, transfers
An important note for the reader
The NZ Transport Agency is a Crown entity established under the Land Transport Management Act
2003. The objective of the Agency is to undertake its functions in a way that contributes to an
affordable, integrated, safe, responsive and sustainable land transport system. Each year, the NZ
Transport Agency funds innovative and relevant research that contributes to this objective.
The views expressed in research reports are the outcomes of the independent research, and should not
be regarded as being the opinion or responsibility of the NZ Transport Agency. The material contained
in the reports should not be construed in any way as policy adopted by the NZ Transport Agency or
indeed any agency of the NZ Government. The reports may, however, be used by NZ Government
agencies as a reference in the development of policy.
While research reports are believed to be correct at the time of their preparation, the NZ Transport
Agency and agents involved in their preparation and publication do not accept any liability for use of
the research. People using the research, whether directly or indirectly, should apply and rely on their
own skill and judgment. They should not rely on the contents of the research reports in isolation from
other sources of advice and information. If necessary, they should seek appropriate legal or other
expert advice.
Acknowledgements
The project team acknowledge the financial assistance provided by the NZ Transport Agency (NZTA),
without which this research project could not have been undertaken.
We appreciate the enthusiasm and interest shown by the members of the steering committee – Anthony
James (ARTA), Doug Weir (GW), Shannon Ussher (ECan) and Rachel Gibson (NZTA) – and thank them for
the insights and information they have provided about the current practice of public transport planning
in New Zealand. We would like to thank those who organised and participated in the various workshops
held during the project.
Finally, we thank the three external peer reviewers – Professor Robin Keans (University of Auckland),
Anne Redgrave (Horizon Regional Council) and Dr Ian Radbone (University of South Australia) – for their
constructive comments.
Abbreviations and acronyms
ARTA Auckland Regional Transport Authority
CBD central business district
CCC Christchurch City Council
ECan Environment Canterbury
GPS government policy statement
GW Greater Wellington Regional Council
NZ New Zealand
NZTA New Zealand Transport Agency
VKT vehicle kilometres travelled
ZVV Zürcher Verkehrsverbund (Zürich Regional Public Transport Agency)
5
Contents
Executive summary....................................................................................................................................................7
Abstract........................................................................................................................................................................10
1 Introduction...................................................................................................................................................11
2 The network approach: meeting many objectives.......................................................................13
2.1 Introduction .......................................................................................................... 13
2.2 Objectives for urban public transport.................................................................... 13
2.3 Network planning.................................................................................................. 14
2.4 Elements of network planning ............................................................................... 18
2.5 Does network planning deliver?............................................................................. 21
2.6 How change happens ............................................................................................ 22
2.7 Conclusion ............................................................................................................ 24
3 Benchmarking public transport in New Zealand cities..............................................................25
3.1 Selecting cities for comparison.............................................................................. 25
3.1.1 The city regions selected for comparison.................................................. 25
3.2 Benchmarking data ............................................................................................... 26
3.2.1 Notes on sources and interpretation of benchmarking data ..................... 27
3.3 What the data revealed.......................................................................................... 28
3.3.1 Comparing Auckland and Vancouver ........................................................ 29
3.3.2 Comparing Wellington and Zurich............................................................. 31
3.3.3 Comparing Christchurch and Schaffhausen .............................................. 33
3.4 Institutions and policies for public transport ......................................................... 35
3.5 Service supply and public subsidies ...................................................................... 36
3.6 Conclusion ............................................................................................................ 36
4 Current public transport planning practice in New Zealand cities......................................38
4.1 Introduction .......................................................................................................... 38
4.2 Auckland............................................................................................................... 38
4.2.1 Institutions ............................................................................................... 38
4.2.2 Service standards...................................................................................... 38
4.2.3 The Northern Busway................................................................................ 40
4.2.4 Circulation within the CBD ........................................................................ 40
4.2.5 Orbital routes ........................................................................................... 40
4.2.6 Ticketing .................................................................................................. 40
4.3 Wellington............................................................................................................. 40
4.3.1 Institutions ............................................................................................... 40
4.3.2 Service patterns ........................................................................................ 41
4.3.3 Bus–rail competition on trunk routes ........................................................ 41
4.3.4 Design of groups of local suburban bus lines ........................................... 41
4.3.5 Service planning ....................................................................................... 42
4.3.6 ‘Orbital’ routes ......................................................................................... 42
4.3.7 Circulation within the CBD ........................................................................ 42
4.3.8 Ticketing .................................................................................................. 43

Public transport network planning: a guide to best practice in NZ cities
6
4.4 Christchurch.......................................................................................................... 43
4.4.1 Institutions ............................................................................................... 43
4.4.2 ‘Core’ and ‘community’ services ............................................................... 43
4.4.3 Timetables on common route sections ..................................................... 44
4.4.4 Circulation within the CBD ........................................................................ 44
4.4.5 Ticketing .................................................................................................. 44
5 The potential for improved network planning in New Zealand cities................................ 45
5.1 Introduction .......................................................................................................... 45
5.2 Institutions and public processes .......................................................................... 45
5.3 Network structure ................................................................................................. 46
5.4 Network operations............................................................................................... 48
5.4.1 A simple and direct network of lines......................................................... 48
5.4.2 Speed and reliability ................................................................................. 54
5.4.3 Frequency and appropriate service density in weaker markets.................. 55
5.4.4 Location and access to stops .................................................................... 56
5.4.5 Marketing the network.............................................................................. 56
6 The policy environment for network planning ............................................................................. 58
6.1 Land-use planning and public transport network planning ................................... 58
6.2 Restraints on car access to the CBD: parking, environment for pedestrians........... 59
6.3 Processes for assessment under development planning laws ................................ 60
6.4 Responses to patronage growth related to petrol price rises ................................. 60
6.5 Current priorities................................................................................................... 61
6.6 Conclusion ............................................................................................................ 62
7 Conclusions................................................................................................................................................... 63
8 Recommendations...................................................................................................................................... 65
9 References ..................................................................................................................................................... 66
10 Appendices.................................................................................................................................................... 68
Appendix A: List of participants in consultative workshops ............................................. 68
A1 Auckland, 11 February 2009..................................................................... 68
A2 Wellington, 17 February 2009................................................................... 69
A3 Christchurch, 19 February 2009 ............................................................... 70
Appendix B: List of participants in implementation workshops........................................ 71
B1 Christchurch, 28 September 2009 ............................................................ 71
B2 Wellington, 2 October 2009...................................................................... 72
7
Executive summary
The purpose of this research was to explore the potential for implementing the ‘network-planning’
approach to the design of public transport services, to significantly improve both patronage and
efficiency in the use of public subsidies in the urban regions of Auckland, Wellington and Christchurch.
The research was carried out between September 2008 and October 2009.
The challenge for public transport seems daunting. To achieve environmental and social objectives,
public transport must cater for travellers with very different needs, ranging from peak-period access to
the CBD to all-day access to local shops and community centres. It must provide attractive service
frequencies and operating hours to a wide range of destinations, while also maintaining high
occupancy rates. Many observers have argued that the trade-offs present an insoluble problem – but
there is evidence to counter this assertion.
Successful public transport systems in Europe and North America have managed to serve commuters,
shoppers and car-less people, while also combining high service levels with good cost recovery. Some
features of European cities, such as high population densities and limited space for cars, have made it
easier for them to achieve these outcomes, but service planning philosophies and strategies are also
critical to success. This report explores an essential element of service planning, which has come to be
called the ‘network approach’, or network planning.
One approach to diverse, ‘anywhere-to-anywhere’ travel patterns is to provide ‘tailor-made’ services
for different travel markets: express buses and trains for peak commuters; regular buses for local trips
along busy corridors; and services (such as ‘dial-a-bus’) without fixed schedules for low-demand
corridors and times. The problem with this approach is that the more public transport is tailor-made,
the more it surrenders its environmental and economic advantages.
The alternative is networks. Instead of having tailor-made public transport, the introduction of
transfers can enable provision of a ‘ready-made’ service. This approach enables ‘anywhere-to-
anywhere’ travel with high occupancy rates by carrying different kinds of travellers on the same
services. By being organised around transfers, a public transport system can offer access to a large
number of potential destinations at an affordable cost to the operator. Traditional public transport
planning has treated transfers as an inconvenience to be avoided at all costs, but the network approach
makes them the building blocks of a multidestinational system. While transfers present many new
travel opportunities, they also impose inconvenience. Creating effective transfer-based public
transport systems requires careful planning to ensure that the inconvenience is minimised.
There is clear evidence that impressive results have been achieved though network planning for public
transport services in many European and North American cities. Patronage levels have grown
considerably, while efficiency in the use of the public subsidy has improved.
To provide examples of ‘best practice’ in public transport service design, we selected three overseas
cities that had similar characteristics to each of the New Zealand cities in terms of urban form,
demographics and public transport infrastructure. The intention was to reveal, as far as possible, the
impact of the approach to public transport service design on patronage levels and efficiency in the use
of resources.
The comparator pairs chosen for this research were Auckland and Vancouver; Wellington and Zurich;
and Christchurch and the Swiss town of Schaffhausen. The choice of a comparator for Christchurch was
the most difficult. Although there are cities of comparable size with successful public transport, such
as Freiburg in Germany, these have well-developed heavy- and light-rail systems. In the absence of a
Public transport network planning: a guide to best practice in NZ cities
8
good comparator, we have included possibly the most successful all-bus urban transport system in
Western Europe.
Comparisons were based on population, residential density across the urban region, jobs in the CBD,
mode share for the journey to work, public transport boardings, public transport service-km, and the
level of public subsidy required per public transport boarding.
The comparisons revealed that New Zealand’s three largest urban regions have considerable potential
to build on the increases in public transport patronage and mode share that have been achieved during
the last decade. Encouragingly, the greatest potential for improvement seemed to lie with ‘non-
traditional’ trip types, which could be accommodated without imposing commensurate increases in
capital and operating costs.
The research also investigated current public transport operating practices in Auckland, Wellington and
Christchurch, and found that these practices reflected the broad history of decisions made in transport
planning in each city over recent decades.
Because of its smaller size and relative coherence in the institutional history of public transport service
planning and delivery, Christchurch had been able to develop or preserve a number of important
features of the network-planning approach, most notably a ticketing system that did not penalise
passengers who made transfers. Its cross-town ‘Orbiter’ line, introduced in 2000 at the same time as
common bus liveries and the unifying ‘Metro’ brand, had achieved a level of transfers that exceeded
the expectations of local planners. However, in both Auckland and Wellington, we found that the ability
of private operators to run ‘commercial’ services at will had hampered efforts to coordinate services
and had allowed perverse competition between different public transport modes to continue. In
Auckland, particularly, obvious opportunities to significantly reduce journey times through better
coordination of rail and bus timetables had been overlooked.
Practical experience in the international comparator cities and elsewhere suggests three key areas of
change that would improve public transport service planning in New Zealand cities:
1 Appropriate institutions and public processes:
Establish a public agency to plan the network across the whole urban region.
Redirect private-sector competition into producing best-value tenders for the delivery of part,
or all, of a publicly planned system.
Use well-designed public education and consultation programmes to manage changes.
Provide a simple fare system that avoids the imposition of penalties for transfers.
2 Network structure:
Provide a simple and stable network of lines throughout the day.
Base mode choice for different lines in the network on required capacity, comfort and speed.
Consider locations for suburban interchanges on the basis of predicted travel patterns and
efficient vehicle operations.
3 Network operations
Simplicity and directness:
- Organise the network on the principle of ‘one section – one line’.
- Avoid deviations in the physical routes chosen for bus services.

Executive summary
9
- Provide pendulum lines through key activity centres and interchanges.
Speed and reliability:
- Aim for travel speeds comparable to, or faster than, door-to-door travel times that can be
achieved by car.
- Provide on-road signal and traffic-lane priority to allow buses to meet connections.
- Aim to have vehicles stopping only as required to pick up and drop off passengers.
Frequency:
- Establish ’forget-the-timetable’ headways (10 minutes or less) in key travel corridors.
- Set up integrated timetables outside high-frequency areas.
Location of stops and access to services:
- Carefully plan the location of stops to minimise the number of stops and ensure their
optimal location in relation to major trip attractors, intersecting lines and pedestrian
accessways.
- Locate stops in car-free precincts close to important destinations, to give public transport
a significant competitive advantage.
- Change current access to ‘trunk’ services from ‘park-and-ride’ facilities to access by
walking, bicycle, or feeder bus, in order to cater for long-term growth in patronage.
- Ensure that walking distances between services in interchanges are very short: preferably
no more than 10 metres.
Marketing for first-time and occasional users:
- Create a simple line structure that makes the network easy to understand.
- Use maps, on-line information, vehicle livery and on-board displays to reinforce
understanding of the line layout and transfer opportunities.
While regional land-use planning in New Zealand cities has been increasingly recognising the need to
promote transit-supportive urban forms, in particular by discouraging scattered and very low-density
development, these policies cannot, on their own, ensure that public transport will improve. However,
when coupled with the network approach to the design and delivery of public transport service,
important gains could be made.
Although further research is needed to quantify the specific benefits, it is clear from the directions
outlined in this report that considerable potential exists to improve public transport at an affordable
cost and in ways that can significantly contribute to the government’s strong economic growth agenda.
Public transport network planning: a guide to best practice in NZ cities
10
Abstract
This research explores the potential for the ‘network-planning’ approach to the design of public
transport to improve patronage of public transport services in Auckland, Wellington and Christchurch.
Network planning, which mimics the ‘go-anywhere’ convenience of the car by enabling passengers to
transfer between services on a simple pattern of lines, has achieved impressive results in some
European and North American cities, where patronage levels have grown considerably and public
subsidies are used more efficiently.
Three overseas cities provided examples of ‘best practice’ in public transport service design to
compare with services in Auckland, Wellington and Christchurch. The comparisons revealed that
New Zealand’s three largest urban regions had considerable potential to build on the increases in
public transport patronage and mode share that have been achieved during the last decade.
Current public transport operating practices in Auckland, Wellington and Christchurch were assessed
and key areas were identified in which public transport planning could be improved – namely:
A public institution is required to plan a network across the whole urban region, to let best-value
tenders for the delivery of part or all of this system, and to manage the political processes of
change.
Successful network operations require simple and direct lines; ‘forget-the-timetable’ frequency in
key corridors; and marketing that targets new and occasional users.
1 Introduction
11
1 Introduction
This report presents the findings of research carried out between September 2008 and October 2009
for the NZTA 2008/09 research programme.
The purpose of this research was to contribute to improvements in the planning and design of public
transport services in New Zealand cities, particularly in Auckland, Wellington and Christchurch.
Current passenger transport systems in New Zealand cities are overwhelmingly reliant on private cars.
The future risks of this dependence on cars – increased social and economic costs and environmental
impacts – mean that cost-effective and less-polluting alternatives must be found to efficiently serve
the urban transport task. Faster and more convenient travel by public transport is needed to replace
longer urban journeys and to maximise the efficient use of existing roads.
Because of their relatively small populations and dispersed patterns of settlement, New Zealand cities
face significant challenges in creating high-quality public transport services that are a viable alternative
to the car. Complementary policies in urban planning, infrastructure investment and transport demand
management are required to increase patronage of public transport modes. Recent research suggests
that ‘network planning’ is the critical element in making public transport successful in small-to-
medium-sized cities.
In the more successful European and Canadian urban public transport systems, network planning is
central to designing public transport services that can offer a competitive alternative to the car for
urban travel. Network planning creates maximum flexibility for travellers by making it easy for them to
transfer between different services or modes.
This report begins with a review of existing international literature in which the principles of network
planning are described, and the evidence for achievements in increased patronage and more efficient
use of public subsidies is assessed (section 2).
Section 3 then establishes the potential for achieving similar benefits in New Zealand through a process
of benchmarking Auckland, Wellington and Christchurch against international comparators on a range
of parameters covering urban form and public transport performance. The purpose of these
comparisons is not to suggest that precise imitation of public transport policies is possible or
desirable, but rather to establish that an opportunity exists to improve considerably on current
performance. The comparator cities were chosen because of their similarities to the New Zealand cities
on a range of factors known to influence public transport performance, and on the availability of useful
data on travel patterns and operating conditions.
Section 4 presents a summary of current public transport operating practices in Auckland, Wellington
and Christchurch. These practices reflect the outcomes of the various competing forces in transport
planning in recent decades in each city.
The major findings of the research are presented in section 5. Here, we describe the practical
application of the ‘network-planning’ approach to the specific conditions found in New Zealand cities.
Issues included in this analysis are:
institutions and public processes
network structure
network operations
- simplicity and directness
Public transport network planning: a guide to best practice in NZ cities
12
- speed and reliability
- frequency
- attention to location of stops and access to services
- marketing – providing good information for first-time and occasional users.
The policy framework, at regional and national levels, is crucial to the future implementation of an
effective public transport network. Section 6 provides a summary of current policies in effect across the
whole transport system in New Zealand, pointing out those that are supportive and others that tend to
act against the goal of achieving improved patronage and efficiency in the operation of public transport
in New Zealand cities.
In the final section, we present our recommendations – that the development of detailed plans for
networked public transport services in Auckland, Wellington and Christchurch would provide a strong
basis for future government expenditure in public transport. Developing such plans would require the
allocation of significant resources from public transport agencies and governments, with the benefits
of ensuring cost-effective operations that maximise short-and medium-term growth in patronage, and
identifying long-term requirements for future capital investment in new rolling stock and
infrastructure.

2 The network approach
13
2 The network approach: meeting many objectives
2.1 Introduction
Public transport is increasingly required to serve a range of objectives – from providing mobility to the
disadvantaged through to alleviating traffic congestion – while also making efficient use of financial
resources. These different objectives often conflict. For example, commuters to city centres prefer fast
radial services, while disadvantaged people without cars often want access to destinations in their local
areas; reducing congestion and environmental problems suggest a focus on increasing peak-period
patronage, but this may lead to poor financial outcomes by leaving staff and vehicles underutilised at
other times.
Many cities in Europe, and some in North America, have successfully met these challenges, providing
public transport that serves the needs of local travellers as well as city-centre commuters, and
combining environmental benefits with modest public subsidies and high cost-recovery ratios. Of
course, European cities, with historic city centres and high population densities, are very different from
those of New Zealand and Australia. It is often assumed that these differences provide a complete
explanation of the much greater role played by public transport in such places.
Relatively little attention has been paid to the public transport planning philosophies and practices
underlying successful systems in Europe and North America. This report explores the central element
of those operating philosophies: the ‘network-planning approach’. It suggests that the network
approach can be used in smaller, lower-density cities as well as in large, dense metropolitan cores. It
draws on the European Union’s HiTrans project1 (which applies network planning to smaller cities and
towns in Europe) and extends the approach to include New Zealand’s three largest cities. It seeks to
evaluate the potential for network planning to produce public transport systems that more effectively
serve region-wide travel needs, while ensuring efficient utilisation of resources.
2.2 Objectives for urban public transport
The historic function of public transport has been to provide mobility for people without access to cars.
Fifty years ago this meant the great majority of New Zealand urban dwellers, but by the 2006 census,
only 8% of New Zealand’s households were without cars.2 However, this still amounted to 113,000
households nationally, most of which were in major cities, and to this number must be added people
living in households that have cars but who are unable to drive because of age, disability or other
reasons. Many of these people are not in the workforce, and their travel needs are focused on access to
education, shopping and community facilities. This gives rise to spatially and temporally diffuse travel
patterns that, when combined with the relatively small number of carless households, mean that the
travel needs of the carless can be difficult to serve economically with traditional public transport
systems.
1 HiTrans is an EU-funded cooperative research project involving city and transport agencies in the UK and
Scandinavia. It produced five best-practice guides on various public transport planning themes (www.hitrans.org).
2 Statistics New Zealand: 2006 Census Regional Summary Tables, table 14 (‘not elsewhere included’ subtracted
from total).
Public transport network planning: a guide to best practice in NZ cities
14
In most cities, public transport plays a role in alleviating traffic congestion, parking difficulties and the
environmental impacts of commuting by automobile. These problems are most serious in central
business districts (CBDs), and commuter public transport has historically focused on the CBD market.
Commuter services have provided direct access to the CBD in peak periods, with minimal or no service
in off-peak periods or to non-central locations. Commuter transit suffers from underutilisation of
staff, infrastructure and vehicles – many buses or trains make only one full return trip per day, making
it difficult to cover the costs.
In many cities, public transport is essential to the economic viability of the CBD. The vital commercial
hearts of New York or London could not function without public transport, which carries the great
majority of workers, shoppers and other visitors. In the 1960s and 1970s it became fashionable to
argue that smaller cities, such as those in New Zealand, did not require traditional CBDs, and that
retailing, entertainment and much employment should be decentralised to suburban centres. However,
since the 1990s, urban economists have realised the importance of ‘agglomeration benefits’ in
supporting economic growth in an ‘information economy’. This has led to a renewed focus on
prosperous CBDs and subcentres, and the effective public transport systems needed to support them
(Abusah and de Bruyn 2007). To contribute to productivity in this way, public transport needs to move
beyond the traditional commuter role, and also serve shoppers, tourists and business visitors.
Finally, there is the problem of sustainable development, highlighted by the twin challenges of climate
change and insecure oil supplies. As noted by the New Zealand government, the availability of public
transport can help mitigate the effects on households of volatile oil prices (Government of New Zealand
2009, p17). Public transport is more environmentally efficient than car travel – provided occupancies
are sufficiently high – and it can indirectly promote walking (Mees 2010). The environmental challenge
dovetails with economic efficiency, which also requires adequate occupancy rates. Empty trains and
buses do not generate sufficient revenue to cover a reasonable share of their costs; nor do they
produce better environmental results than the private car.
The challenge for public transport seems daunting. Serving all the different objectives noted above
involves catering for travellers with very different needs, ranging from peak-period access to the CBD
to all-day access to local shops and community centres. It also involves providing attractive service
frequencies and operating hours to a wide range of destinations, while also maintaining high
occupancy rates. Many observers have argued that the trade-offs present an insoluble problem – but
there is evidence to counter this assertion.
Successful public transport systems in Europe and North America have managed to serve commuters,
shoppers and people who don’t have cars, and also combine high service levels with good cost
recovery. Some features of European cities, such as high population densities and limited space for
cars, have made it easier for them to achieve these outcomes, but service-planning philosophies and
strategies are also critical to success. This report explores an essential element of service planning that
has come to be called the ‘network approach’, or network planning.
2.3 Network planning
The essential purpose of public transport is to carry people with different trip origins and destinations
in the same vehicle. These travellers can be transported with lower economic and environmental costs
than if they travelled separately. However, as homes and workplaces become more and more
dispersed, public transport faces an increasing challenge regarding the range of trip origins and
destinations.
2 The network approach
15
One approach to having diverse, ‘anywhere-to-anywhere’ travel patterns is to provide ‘tailor-made’
services for different travel markets: express buses and trains for peak commuters; regular buses for
local trips along busy corridors; and car-like paratransit3 for low-demand corridors and times. The
problem with this approach is that the more public transport is tailor-made, the more it surrenders its
environmental and economic advantages. A public transport system offering a direct service between
every origin and destination would have low frequencies, low occupancies, high costs and high
greenhouse gas emissions per passenger. Taxis already provide this kind of service in most cities, and
while an important part of urban life, they are not cheap and, without changes to the fuel source, do
not reduce greenhouse gas emissions or fossil-fuel consumption.
The alternative is networks. Instead of having tailor-made public transport, the introduction of
transfers can enable the provision of a ‘ready-made’ service. This approach enables ‘anywhere-to-
anywhere’ travel, with high occupancy rates, by carrying different kinds of travellers on the same
services. Visitors to Paris soon learn that this is how the city’s Metro works: nearly every trip requires a
transfer, but transfers are free and high frequencies ensure minimal waiting. Even in the dense urban
setting of Paris, it is not economically feasible to provide high-quality, transfer-free services; in
dispersed environments, the difficulties are even greater.
The difference between the ‘tailor-made’ and ‘ready-made’ approaches is illustrated in figure 1.1. The
idea behind the ‘ready-made’ model is to provide a stable network of routes, or ‘lines’, that operates
consistently and at high standards throughout the day and week, catering for as many different trip
types as possible with as few different lines as possible.
3 Modes of public transport (for example, dial-a-bus) that do not follow fixed routes or schedules.
Public transport network planning: a guide to best practice in NZ cities
16
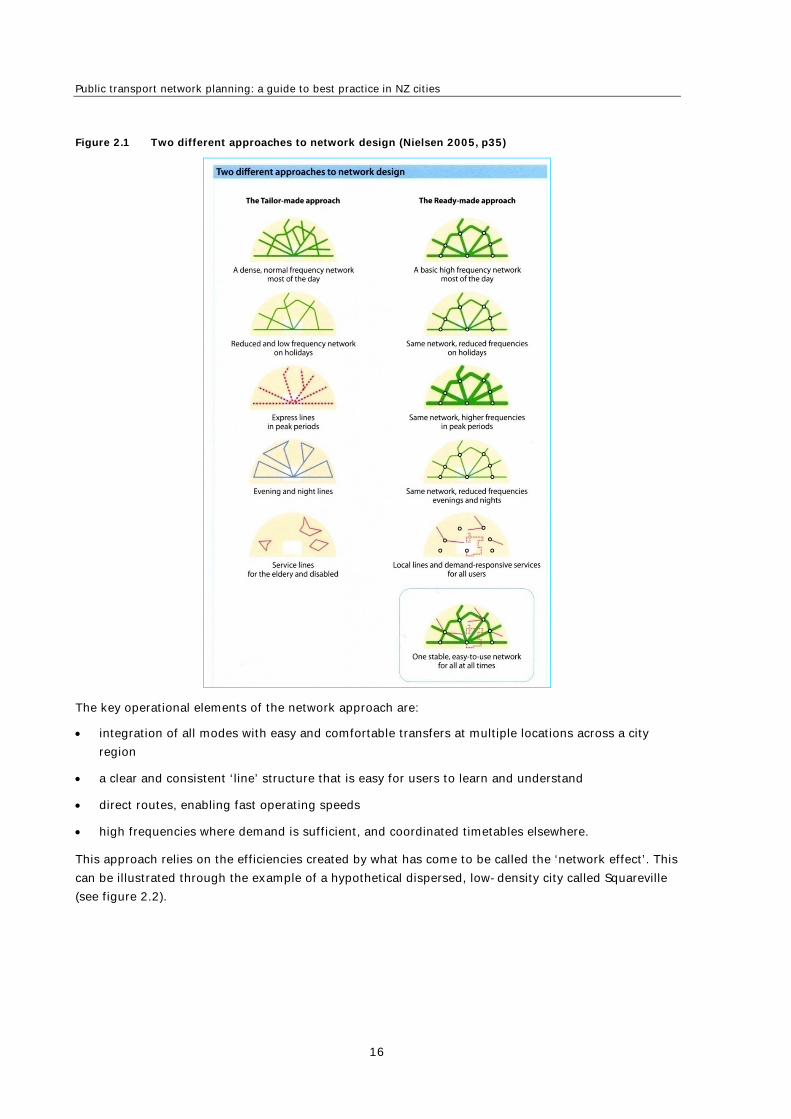
Figure 2.1 Two different approaches to network design (Nielsen 2005, p35)
The key operational elements of the network approach are:
integration of all modes with easy and comfortable transfers at multiple locations across a city
region
a clear and consistent ‘line’ structure that is easy for users to learn and understand
direct routes, enabling fast operating speeds
high frequencies where demand is sufficient, and coordinated timetables elsewhere.
This approach relies on the efficiencies created by what has come to be called the ‘network effect’. This
can be illustrated through the example of a hypothetical dispersed, low-density city called Squareville
(see figure 2.2).
2 The network approach
17
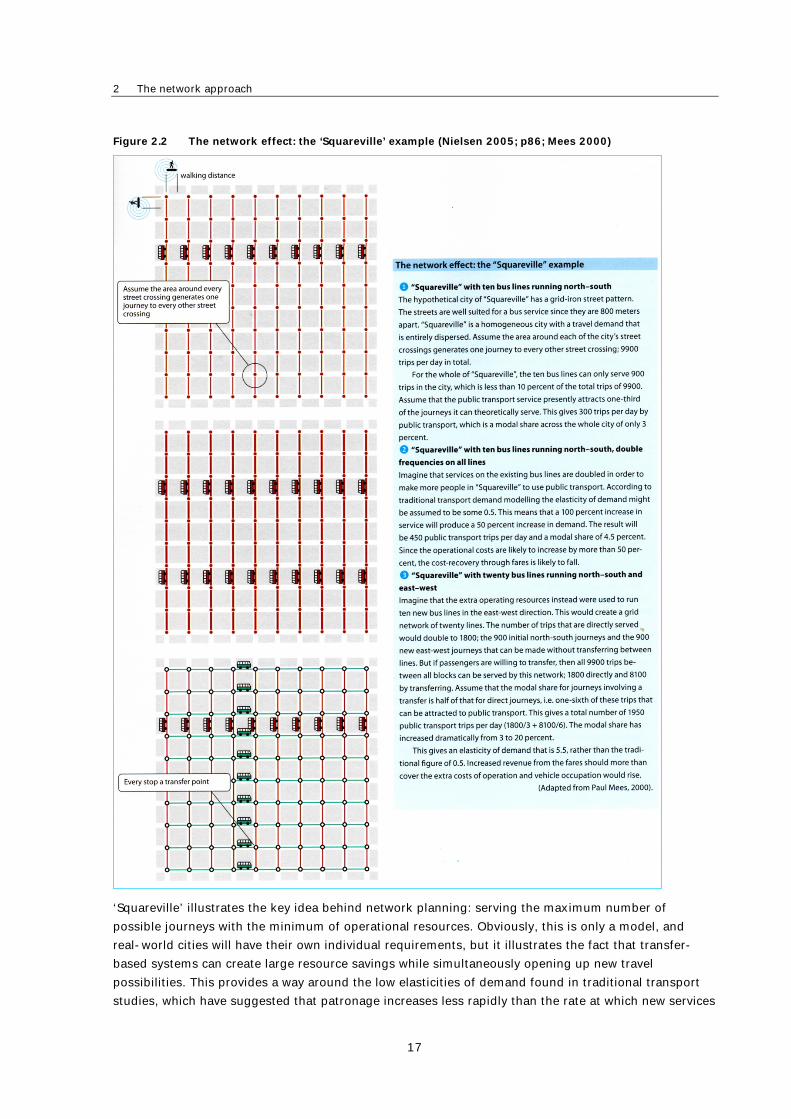
Figure 2.2 The network effect: the ‘Squareville’ example (Nielsen 2005; p86; Mees 2000)
‘Squareville’ illustrates the key idea behind network planning: serving the maximum number of
possible journeys with the minimum of operational resources. Obviously, this is only a model, and
real-world cities will have their own individual requirements, but it illustrates the fact that transfer-
based systems can create large resource savings while simultaneously opening up new travel
possibilities. This provides a way around the low elasticities of demand found in traditional transport
studies, which have suggested that patronage increases less rapidly than the rate at which new services
Public transport network planning: a guide to best practice in NZ cities
18
are added, leading to steadily decreasing occupancy rates. The network effect enables services to be
added in ways that increase demand at faster rates than those at which resources are added.
Transfers are the key to the network effect. As the Squareville model illustrates, transfers are integral
to a public transport system that offers access to a large number of potential destinations at an
affordable cost to the operator. Traditional public transport planning has treated transfers as an
inconvenience to be avoided at all costs, but the network approach makes them the building blocks of
a multidestinational system.
Two US researchers have commented on the importance of transfers:
Surveys asking what passengers like and dislike about transit find that transferring is at
or near the top of the list of dislikes. Passengers prefer a direct trip from their home to
their job or other destinations. The express bus in some radial systems takes this finding
to heart by designing systems based on direct routes from suburbs to CBDs. Transfers are
avoided, but at the cost of limiting opportunities for travel to non-CBD destinations. In
contrast, the multidestinational approach uses transfers to open travel paths to and from
non-CBD destinations that are reachable in radial systems only by lengthy and circuitous
travel. The intent is to induce new ridership through the provision of new travel
opportunities created by transfers in the belief that the induced non-CBD patronage will
exceed any CBD patronage that may be lost due to an added transfer.
…The differing views on transferring lead to differing views of suburban bus lines. In the
multidestinational approach, suburban bus routes are neither parallel routes to the CBD
nor specialized ‘feeder routes’ to trunk lines running to the CBD. Rather, they are treated
as general purpose routes that interlock with each other through transfers to make
intrasuburban mobility possible, while also feeding passengers onto trunk routes or
dispersing passengers from trunk routes. It is as accurate to say that a rail or bus
regional trunk line is a feeder to suburban bus lines as it is to say that bus lines feed the
trunk line, or that suburban bus lines feed other suburban buses (Thompson and Matoff
2003, p298).
While transfers present many new travel opportunities, they also impose inconvenience. Creating
effective transfer-based public transport systems requires careful planning to ensure that the
inconvenience is minimised as much as possible.
Empirical evidence for the success of public transport agencies in some cities to ‘sell’ this model of
public transport service provision to their communities, and the conditions under which this success
was achieved, are discussed in sections 2.5 and 2.6, and in the international comparisons with
New Zealand cities in section 3.
2.4 Elements of network planning
The basic idea is to transform a traditional public transport system, consisting mainly, or entirely, of
low-quality routes, into an integrated network of high-quality services.
2 The network approach
19
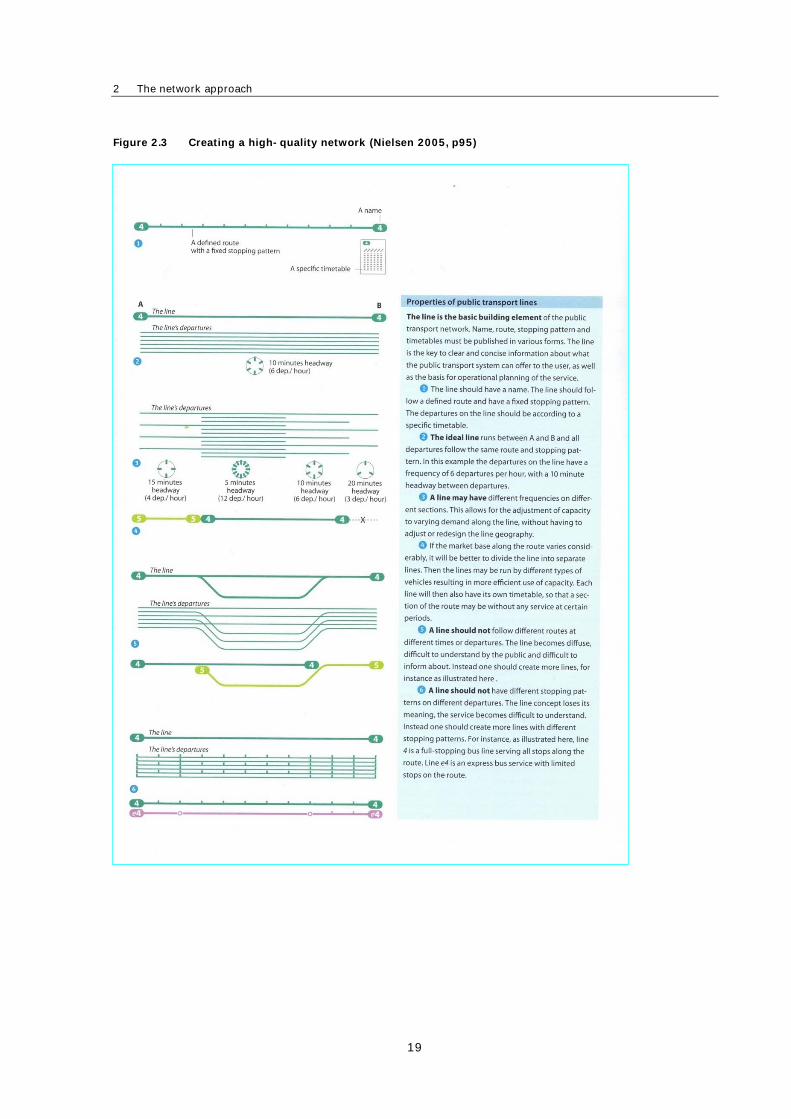
Figure 2.3 Creating a high-quality network (Nielsen 2005, p95)
Public transport network planning: a guide to best practice in NZ cities
20
Four key elements of network planning underpin the creation of high-quality, transfer-based networks.
A simple line structure
The HiTrans best practice guide to network planning (Nielsen 2005) distinguishes between ‘routes’
and ‘lines’, as illustrated in figure 2.3. A route is defined (as in the standard usage of the word) as
‘the physical path traversed by a public transport vehicle’. However, it useful, particularly in
discussion of the planning and operation of bus services, to have a separate term, ‘line’, as an
operational element in a public transport system. Therefore, in a planned network, a bus ‘line’
would have a defined and unchanging physical route with a fixed stopping pattern, a specific
timetable, and a unique name and number. The idea, in part, is to give bus services something of
the coherence and permanence of train and tram lines.
Simplicity offers two important benefits: it makes the network easier for passengers to understand,
and it reduces resource requirements by limiting the number of lines that an operator must
provide. Although there are some occasions in weaker markets where multiple lines might operate
in a single corridor, creating simple structures generally means using only one line in a corridor:
the Paris Metro provides an excellent illustration of this concept in operation.
Stable line and operating patterns
As well as being simple, a network must also be stable. As figure 2.1 illustrates, the idea is to
provide a consistent, high-quality service across the network all day, rather than operating
different service types in peak, off-peak, night and weekend time periods. Where additional
services are required to cope with peak demands, this is done by intensifying the basic service
frequencies, rather than by introducing new lines or disrupting the stopping patterns on existing
lines. Under this model, the addition of express services might be achieved by adding a new ‘line’
with the same route as the all-stops line, but with a different stopping pattern. The express may
be given a name or number that indicates its relationship to the standard line.
Convenient transfers
Easy transferring requires attention to timetables and physical facilities. ‘Random’ transfers are
possible when all lines serving an interchange point operate frequently, generally every 10 minutes
(six departures per hour) or better. ‘Timed’ transfers are needed when services are less frequent,
and the timetables for connecting lines must be coordinated.
Coordinated timetables require common service frequencies and hours of operation. If frequencies
are the same on all lines, then it is possible to coordinate all arrivals and departures at an
interchange to produce a ‘pulse timetable’. Typically, this involves all the bus lines to a station
arriving shortly before the connecting train, and then leaving soon after the train departs. This
allows transfers to be made in all directions, not just to or from the CBD (Mees 2010, chapter 8;
Nielsen 2005).
The physical layout of transfer points is also crucial. Short walking distances, clear signage, and
protection from the weather and from anti-social behaviour are the key elements (Nielsen 2005,
pp100–101).
Appropriate institutions and fare systems
Transfer-based networks require transfer-friendly fare systems. This generally means that patrons
pay for the distance travelled rather than the number of transfers made, typically through a zone-
and time-based fare system. However, it is extremely difficult to arrange systems of this kind when
different public transport operators retain their own fare revenue. The division of fares among
2 The network approach
21
different operators is problematic, because in a genuine network, ‘weak’ lines are cross-subsidised
by ‘strong’ ones in order that the same service frequencies can be provided on all lines serving an
interchange. Network planning requires a system for pooling fare revenues to allow cross-subsidy.
The pooling of fare revenues to allow cross-subsidy and free transfers, and the planning of lines
on a whole-of-system basis, point to the need for a single agency to take responsibility for
planning and funding the network. The European Union’s HiTrans project concluded that a regional
public transport agency is an essential requirement for an effective network.
Under such a system, individual operators compete for the market, rather than in the market, by
tendering for the right to operate lines, or groups of lines, forming part of the network. Such a
system is perfectly consistent with the New Zealand Ministry of Transport’s objective of ‘healthy
and fair competition for contracted public transport services’ (NZ MoT 2009, p10), since, as the
HiTrans manual points out:
Planning and competition are not necessarily contradictory. It is more a question of
appropriate allocation of the roles of the two approaches in the institutional setup (p11).
The combination of region-wide planning by a public agency and competitive tendering for
services is becoming increasingly popular in Europe, having achieved positive results in London,
Copenhagen and Swedish cities. It is also being introduced for buses in Singapore, under that
country’s most recent land transport strategy (Land Transport Authority of Singapore 2008, pp38–
39).
In Australia, these institutional arrangements are in place in Perth, where public transport
patronage has grown steadily since the early 1990s (Stone 2009), and in Adelaide, where political
support is emerging for service improvements that have good potential to improve patronage
levels.
2.5 Does network planning deliver?
The first comprehensive comparison made between network planning and the more traditional
approaches was Mees’ analysis of public transport in Melbourne and Toronto in 2000. This
demonstrated that two cities with similar populations, incomes and urban forms had experienced very
different public transport outcomes. Per-capita public transport usage in Toronto was at least twice as
high as in Melbourne, despite a much smaller rail system and significantly lower public subsidies.
Toronto’s superior performance was the result of network planning by a single public agency that
offered travellers frequent and direct bus services, as well as easy physical connections at subway
stations and with other buses at street corners. Melbourne’s poor performance was due to indirect,
infrequent and poorly connected services – these were the consequence of unproductive competition
between two public agencies with separate responsibilities for train and tram services and a plethora of
private bus companies (Mees 2000).
Subsequent analysis of a group of US cities has confirmed the benefits of network planning. Thompson
and Matoff (2003) investigated changes in public transport service levels and patronage between 1983
and 1998 in nine growing urban regions. They found that cities that adopted a network-planning
approach significantly outperformed those that adopted a radial/direct-route approach: the ‘network’
cities recorded higher patronage increases and lower rises in subsidy levels. It is worth noting that all
nine cities appeared to have lower urban population densities and higher car-ownership rates than
Auckland, Wellington or Christchurch.
Public transport network planning: a guide to best practice in NZ cities
22
Many transport analysts regard Zurich as the ‘benchmark’ city for public transport. Although its
residents are among the wealthiest city-dwellers in the world, they use public transport at very high
rates, and importantly, usage rates have been increasing at the expense of the car for at least two
decades. The Canton (or State) of Zurich, covering Zurich City, its suburbs and surrounding rural areas,
has a similar population to the Auckland region, at around 1.3 million. However, Canton Zurich’s
residents made 542 million public transport trips in 2007, compared with the 52 million trips made in
Auckland (ARTA 2008, p15; Zurcher Verkehrsverbund 2008, p14). In the City of Zurich, 63% of
residents travelled to work by public transport at the last census in 2000, while 25% went by car (the
remainder walked or cycled); the canton-wide shares were 41% and 47% respectively. In both cases, the
public transport share had increased since the previous census in 1990. For trips to school and
university across the canton, 31% were by public transport and only 3% by car – the other two-thirds of
students walked or cycled (data from the Swiss census reported in Mees 2010, chapter 8).
While Zurich has a substantial inner-city tram system and an extensive suburban rail network, this
infrastructure is not remarkable by European standards. Nielsen and other observers agree that the
critical factor behind Zurich’s superior performance is the very comprehensive network planning
covering the city and canton. Excellent services are provided not just for CBD commuters, but for off-
peak, cross-city and inter-suburban travellers as well:
The main key to market success is the network qualities of the public transport system. It
is the integrated, high frequency network with many interchanges, and the stable and
reliable operation through several decades that makes the difference (Nielsen 2005,
pp89–93).
And, like most other relatively successful European and North American cities, the ‘offer’ to Zurich
citizens of an attractive public transport network is supported by restrictive policies for such measures
as parking and road space allocation for cars, which add to the comparative advantage of public
transport over car travel for many trips. (For a more general discussion of the need for a coordinated
package of incentives for public transport and disincentives for car travel, see Vuchic 1999.) The
relative influence the public transport service can have in shifting travel mode preferences away from
the car is reinforced in the example of Schaffhausen, described in section 3. This small town has
achieved significant public transport patronage, without imposing major obstacles for car users,
through the exceptional quality of its public transport network.
Significantly, while Zurich City has a typically European high population density, the suburbs and rural
areas are actually more spacious than the suburbs of New Zealand cities, with many residents living in
small villages dispersed through farmland and forest. Zurich has found a way of extending network
planning to areas with extremely low population densities.
2.6 How change happens
One common feature of success stories in public transport network planning is the role of the public in
bringing about change. Zurich is the most celebrated example. In the 1960s and early 1970s,
policymakers sought to replace the city’s trams with an expensive underground ‘metro’ system, but the
proposal was twice defeated at referendums. A third referendum, initiated by citizen’s groups,
proposed upgrading the existing tram and bus lines to provide metro-style services. It was finally
passed in the mid-1970s, and the turnaround in the city’s public transport fortunes dates from that
time. A second successful referendum in the 1980s, this time initiated by the cantonal government,
laid the foundations for extending networked public transport to suburban and rural areas (Mees 2010,
chapter 8).
2 The network approach
23
These days, general acceptance of environmental and social objectives for transport policy means that
citizens’ action is no longer necessary to get public transport onto the political agenda. However,
public involvement in the planning of service changes is critically important, because there will always
be winners and losers in any restructuring of a public transport network. The losers will be those
existing travellers for whom current timetables and line structures are convenient; many of the winners
will be new patrons whose travel needs are currently not met at all. Unless network restructuring is
handled sensitively, with robust community engagement, the beneficiaries of improved services will not
have the opportunity to have their say, and the negative reactions of those who find the current
arrangements more convenient will dominate discussions.
Many restructurings of substantial networks, such as the US examples discussed by Thomson and
Matoff in section 2.5 above, were implemented at the same time as the opening of new rail lines. The
attractiveness of a new rail service can provide an excellent context in which to gain support for
changes that require transfers.
A good example of this was the recasting of bus services in the southern suburbs of Perth in December
2007, at the same time as opening the Mandurah rail line. The rail line replaced a bus lane along the
Kwinana Freeway, which had allowed direct commuter services between the southern suburbs and the
CBD. With the opening of the new rail line, direct bus services to the CBD were withdrawn and replaced
with feeder lines that doubled as cross-city links.
This reorganisation has significantly improved access to Murdoch University. The campus is about a
kilometre to the west of the Kwinana Freeway, and used to be difficult to reach from the east as most
bus services from that direction turned north at the freeway and continued to the CBD. Now, bus routes
from the east drop passengers at Murdoch Railway Station and continue to the university. The
inconvenience of the transfer to and from trains for CBD passengers has been minimised by a well-
designed interchange, a multimodal fare system, frequent train services, coordinated timetables, and
the fact that the train trip to the CBD is much faster than the previous bus trip. 2009 figures showed
that 59% of passengers boarding trains at Murdoch Railway Station arrived by bus (36% used park-and-
ride facilities, and only 5% walked), and the railway station was the busiest in suburban Perth, with
nearly 7000 daily boardings (Martinovich 2009).
These network changes were planned through a consultative process that ran in tandem with the
construction of the rail line. The result has been wide community support and substantial increases in
patronage for both city and cross-suburban trips.
Examples of successful network restructurings of all-bus systems are less common. It is often
tempting to use the capacity of new facilities, such as busways, to add additional direct services. The
busway network in Brisbane provides a current example of this: in each corridor, dozens of low-
frequency (half-hourly to hourly) routes run directly from suburban areas to the city centre. Overall
patronage carried on the busways is not spectacular by international standards, and the service pattern
leads to low occupancies, high subsidies, and confusion and congestion at busway stations. The most
successful busway systems – such as those in Ottawa (Canada), Curitiba (Brazil) and Bogota (Columbia)
– use larger vehicles for trunk services, and operate like a rail service.
A relatively recent example of a successful all-bus network restructuring is provided by the express
trunk bus services in Vancouver. First introduced in 1996, these bus rapid-transit services, branded as
B-Line, featured fewer stops and upgraded boarding and interchange facilities. They were provided
along heavily trafficked corridors that were ultimately intended for conversion to light rail. The
operating costs saved by the restructuring were redeployed to improve service levels on local routes.
Public transport network planning: a guide to best practice in NZ cities
24
A specific example was the change to services between Richmond, a district in Vancouver’s southern
suburbs, and Vancouver’s CBD. Prior to 2001, a large number of low-frequency routes, many operating
in peak periods only, ran from different points in Richmond to the CBD, with express sections in the
inner city. In 2001, this pattern was replaced with a single, high-frequency, full-time express service
(the #98 B-Line). All other bus lines were altered to form feeder or cross-suburban links that
connected with #98 at specially designed interchange ‘stations’. The B-Line service was operated with
articulated buses; local lines were served with conventional vehicles and minibuses.
The trade-off for needing to transfer was a dramatically increased level of service on local sections of
line – for example, the line to Vancouver Airport, which previously operated at 30–60 minute intervals,
changed to operate every 7–15 minutes. The introduction of the new network was preceded by two
years of extensive community involvement, which reduced, but did not eliminate, complaints from
passengers who had previously enjoyed direct services to the CBD. However, substantial rises in
patronage followed the network changes – daily trips in the Richmond corridor rose from 14,000 (on
the entire collection of routes operating in the corridor) to 18,000, and have since increased to more
than 20,000. This increase finally settled any remaining controversy. The largest increases in patronage
were in reverse-commuting and in local and cross-suburban travel, reflecting the new travel
opportunities opened up by the integrated network (IBI Group 2003). Route #98 was replaced by the
Canada Line, a new light-rail service, in August 2009.
The lessons from these successful changes are as follows:
Restructuring of public transport networks requires extensive community involvement at all stages
of the process.
Travellers are more likely to accept additional transfers where clear benefits are gained in terms of
speed and frequency.
It may be easier to introduce change through substantial network overhauls than through
piecemeal changes to individual routes or lines.
2.7 Conclusion
The network-planning approach to public transport has produced impressive results in many European
and North American cities, with improved patronage being achieved without unduly increasing
operating expenses. This approach may, therefore, offer potential improvements for public transport in
New Zealand’s largest cities. The next section of this report explores this possibility.
3 Benchmarking public transport in New Zealand cities
25
3 Benchmarking public transport in New Zealand cities
3.1 Selecting cities for comparison
City regions in Europe and North America have successfully employed the network approach to public
transport, to produce services that cater for a wide range of travel needs at an affordable cost in terms
of public subsidies. This report explores the possibility that a similar approach could produce
significant benefits in New Zealand cities. In order to establish the potential for improvement In
New Zealand, this section benchmarks public transport in New Zealand’s three largest cities against
overseas comparators.
No two cities are exactly comparable, even within the same country. The purpose of the following
comparison is not to suggest that, for example, Wellington should adopt precisely the same public
transport planning approach as Zurich; or that it could achieve exactly the same patronage or subsidy
outcomes. Rather, the purpose is to establish that an opportunity exists to improve considerably on
current performance.
Auckland, Wellington and Christchurch are very different urban regions, reflecting the influence of their
different histories, topography and economic structures. Wellington, as the national capital, has a
strong CBD underpinned by a large base of government jobs. Auckland’s transport patterns are
significantly affected by the region’s location on two harbours and a volcanic field. The management of
public transport in Christchurch reflects the different approach that was taken by city and regional
political leaders in response to the 1989 deregulation of bus services. Because of these differences, the
approach adopted in this report has been to benchmark each New Zealand city against an overseas
comparator, rather than to compare them with one another.
Some basic similarities between the overseas and New Zealand cities were required to ensure
comparability, such as high incomes that enabled near-universal car ownership, and the absence of
explicit demand-management policies such as congestion pricing. Another important criterion was the
availability of useful data on travel patterns and public transport operating conditions. Where possible,
this data was sourced from census authorities and public transport operators; in other cases we
employed the Millennium database for sustainable transport, compiled by Professor Jeff Kenworthy
and other colleagues from Murdoch University (now at Curtin University, also in Perth) for the UITP
(International Union of Public Transport). The Millennium Database contains information for 1995/6
(Kenworthy and Laube 2001). As Auckland and Christchurch were not included in this database, we
added data for those cities that was prepared as part of the same project and reported in Indicators of
urban transport efficiency in New Zealand’s main cities (Bachels et al 1999).
3.1.1 The city regions selected for comparison
3.1.1.1 Auckland – Vancouver
Vancouver is a large urban region and, like Auckland, spreads at relatively low densities across a
visually spectacular landscape. Both cities have relatively weak CBDs in terms of employment, reflecting
the fact that neither is a capital. In each case, the CBD is remote from the demographic centre of the
region and water crossings are required to connect it to other parts of the city. One other important
similarity is that until recently, buses dominated public transport in both cities. Vancouver’s first
elevated light-rail line, the Skytrain, opened in 1986, and although the network is currently being
extended, at the time of writing most passengers were still being transported by bus.
Public transport network planning: a guide to best practice in NZ cities
26
3.1.1.2 Wellington – Zurich
Zurich has a strong CBD, although it is less dominant than Wellington’s (the CBD employment share for
Zurich in table 3.1 is an understatement, as Zurich’s CBD has spread beyond the boundaries of the
historic city centre). Like Wellington, Zurich contains a relatively high-density city centre linked to
peripheral settlements by an extensive regional rail system. The mountainous terrain strongly
influences the settlement and movement patterns of both regions, with major transport corridors
following valleys. The City of Zurich has a population of around 360,000, about 10% less than the
entire Wellington region (450,000); the Canton (or State) of Zurich, which includes suburban and rural
areas, has 1.3 million residents.
3.1.1.3 Christchurch – Schaffhausen
A good comparator could not be found for the urban region of Christchurch. Although there are cities
of comparable size that have successful public transport systems (eg Freiburg in Germany), these have
well-developed heavy- and light-rail systems. We could not find a city with a successful all-bus
system. We originally considered using the Canadian capital, Ottawa, but its extensive segregated
busway network, which functions like a rail system, made comparison with Christchurch difficult.
In the absence of a good comparator, we chose the Swiss town of Schaffhausen – possibly the most
successful all-bus urban transport system in Western Europe. Located some 53 kilometres north of
Zurich in the canton of the same name, Schaffhausen has been served by buses since trams were
removed in the 1960s (the busiest line is served by electric trolleybuses). Schaffhausen is much smaller
than Christchurch (350,000) – the entire canton has 75,000 residents, of whom around 43,500 live in
the capital (including the adjoining municipality of Neuhausen, which has the same public transport
operator) – but its urban public transport system carries a similar volume of passengers. Although the
two cities are not closely comparable, we felt there would be useful lessons to learn from
Schaffhausen’s success.
3.2 Benchmarking data
Data was assembled for the three pairs of cities on a range of indicators covering factors of
demography and public transport performance.
This data is set out in table 3.1, followed by a summary of sources and a discussion of various issues
in the collection and interpretation of the data.
3 Benchmarking public transport in New Zealand cities
27
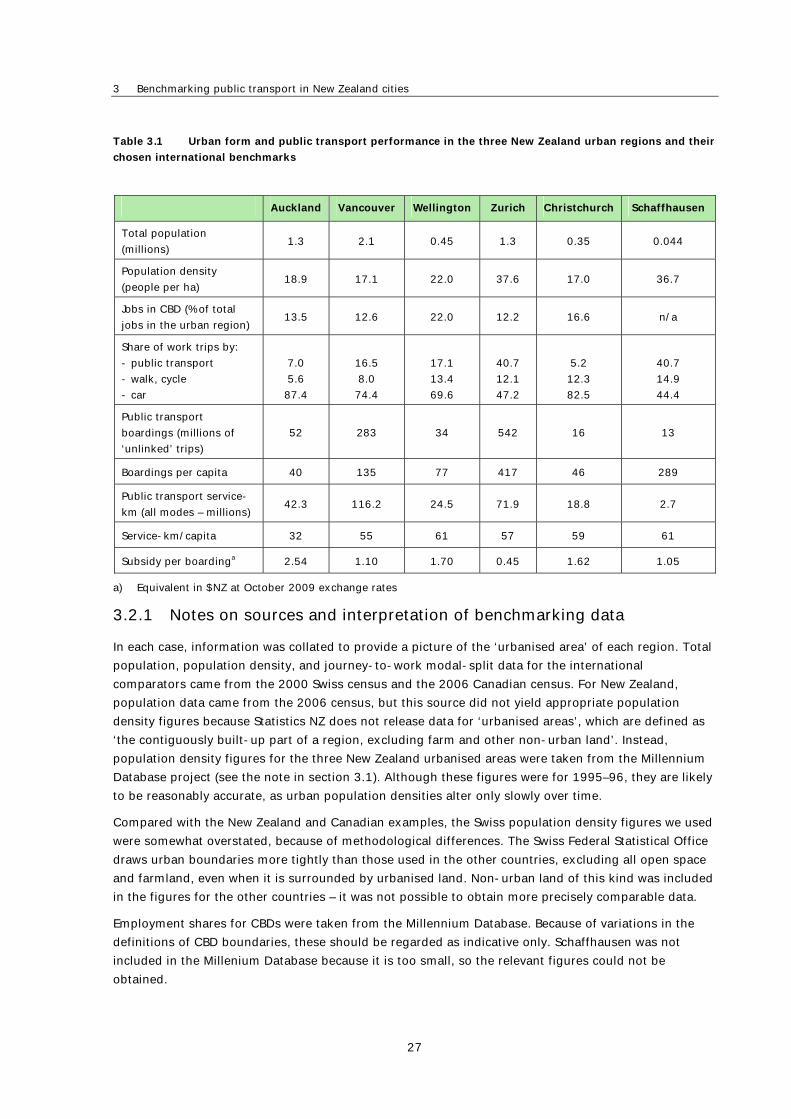
Table 3.1 Urban form and public transport performance in the three New Zealand urban regions and their
chosen international benchmarks
a) Equivalent in $NZ at October 2009 exchange rates
3.2.1 Notes on sources and interpretation of benchmarking data
In each case, information was collated to provide a picture of the ‘urbanised area’ of each region. Total
population, population density, and journey-to-work modal-split data for the international
comparators came from the 2000 Swiss census and the 2006 Canadian census. For New Zealand,
population data came from the 2006 census, but this source did not yield appropriate population
density figures because Statistics NZ does not release data for ‘urbanised areas’, which are defined as
‘the contiguously built-up part of a region, excluding farm and other non-urban land’. Instead,
population density figures for the three New Zealand urbanised areas were taken from the Millennium
Database project (see the note in section 3.1). Although these figures were for 1995–96, they are likely
to be reasonably accurate, as urban population densities alter only slowly over time.
Compared with the New Zealand and Canadian examples, the Swiss population density figures we used
were somewhat overstated, because of methodological differences. The Swiss Federal Statistical Office
draws urban boundaries more tightly than those used in the other countries, excluding all open space
and farmland, even when it is surrounded by urbanised land. Non-urban land of this kind was included
in the figures for the other countries – it was not possible to obtain more precisely comparable data.
Employment shares for CBDs were taken from the Millennium Database. Because of variations in the
definitions of CBD boundaries, these should be regarded as indicative only. Schaffhausen was not
included in the Millenium Database because it is too small, so the relevant figures could not be
obtained.
Auckland Vancouver Wellington Zurich Christchurch Schaffhausen
Total population
(millions) 1.3 2.1 0.45 1.3 0.35 0.044
Population density
(people per ha) 18.9 17.1 22.0 37.6 17.0 36.7
Jobs in CBD (% of total
jobs in the urban region) 13.5 12.6 22.0 12.2 16.6 n/a
Share of work trips by:
- public transport
- walk, cycle
- car
7.0
5.6
87.4
16.5
8.0
74.4
17.1
13.4
69.6
40.7
12.1
47.2
5.2
12.3
82.5
40.7
14.9
44.4
Public transport
boardings (millions of
‘unlinked’ trips)
52 283 34 542 16 13
Boardings per capita 40 135 77 417 46 289
Public transport service-
km (all modes – millions) 42.3 116.2 24.5 71.9 18.8 2.7
Service-km/capita 32 55 61 57 59 61
Subsidy per boardinga 2.54 1.10 1.70 0.45 1.62 1.05
Public transport network planning: a guide to best practice in NZ cities
28
Data for public transport performance in the international examples came from the annual reports of
regional transport agencies for 2007 and 2008, supplemented by personal communications with staff.
These agencies, and the area for which they provide public transport services, were as follows:
Zurich – ZVV, covering an area slightly larger than the canton
Schaffhausen – VBSh, covering Schaffhausen and Neuhausen
Vancouver – Translink, approximately the same area as the Census Metropolitan Area.
Auckland and Wellington public transport performance data came from annual reports for the Auckland
Regional Transport Authority (ARTA) and Greater Wellington Regional Council, which oversee public
transport services across the respective urbanised areas and into some small regional centres beyond
the urban boundaries. Christchurch figures were provided by the regional authority, Environment
Canterbury (ECan), for travel in the City of Christchurch, which since amalgamations in 2006, covers
the entire urban area.
We found some significant differences between countries in the way public transport trip-making data
was recorded. New Zealand authorities recorded ‘unlinked’ trips – that is, each leg of a single journey
that uses a different mode counted as a separate trip. In contrast, Vancouver authorities reported
‘linked’ trips, in which a single journey counted as one trip no matter how many transfers were made.
In order to make sensible comparisons, we reported all the international trip-making data as ‘unlinked’
trips. Readers should take care when comparing these figures with other published trip-making data
(particularly for Vancouver), which typically quote figures for ‘linked’ trips.
Interpretation of the service-supply data also requires some caution. For the four cities with trains, rail
service was measured in units of train-km, but within and between these cities, the capacity of these
trains varied considerably.
The information on subsidy levels for the international cities came from operators’ annual reports for
2007 and 2008. New Zealand data was for the 2007/08 financial year and was supplied by Alex
Campbell from Greater Wellington Regional Council, based on information supplied to him from other
agencies. It included bus, rail and ferry contract payments; concessionary fare payments; and kick-
start funding of services. Care is needed in interpreting these comparisons because of the volatile
exchange rate movements of the past year or more, which have led to a significant decline in the value
of the New Zealand dollar against most major currencies, and a substantial appreciation of the Swiss
franc.
3.3 What the data revealed
As would be expected, public transport’s share of work trips and per-capita trip-making rates were
much higher in the comparator cities than in the New Zealand case studies. However, it is noteworthy
that the difference in per-capita trip-making was greater than the difference in mode share for work
trips: for example, mode share for work trips was 2.5 times higher in Zurich than in Wellington, but
trip-making was more than five times higher. The difference reflected the greater ability of networked
public transport to serve dispersed non-work trips.
The case studies had one common feature: public transport mode share and trip-making rates were
increasing in all six cities. A range of factors, including rising petrol prices, was driving the increases in
New Zealand cities, but the increases had actually begun at the 1996 census, well before petrol prices
began to rise. Although a revival of employment growth in the CBDs of all three New Zealand cities was
doubtless an influence, the improvements to public transport services initiated by the three regional

3 Benchmarking public transport in New Zealand cities
29
councils and ARTA, which was set up in 2004 as a statutory organisation accountable to the Auckland
Regional Council, have also played a part.
The fact that patronage was much higher (and continues to increase) in the comparator cities was good
news for New Zealand, as it suggested that considerable scope remains to build on the improvements
of the last decade. The fact that the difference was more pronounced for non-work trips than for travel
to and from work was also good news – it suggested that potential patronage increases could be
greatest in the off-peak, local and cross-city markets, which could be served without substantially
increasing capacity costs.
In the comparisons that follow, schematic maps of settlement patterns and public transport services
are provided for the international cities. For the New Zealand cities, only Christchurch has a public
transport system map that is easy to reproduce in this report.
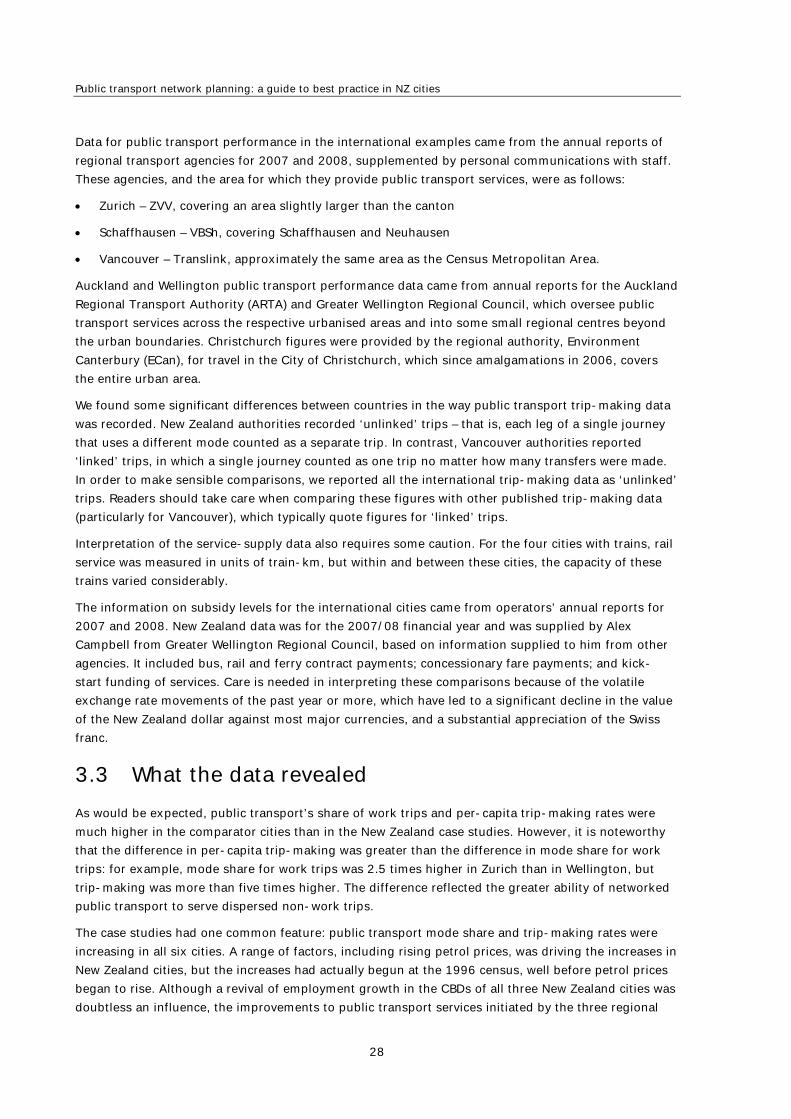
3.3.1 Comparing Auckland and Vancouver
The urban form of these two cities is remarkably similar, with comparable population densities and
shares of employment in the CBD. There is some spectacular high-rise housing in and near the
Vancouver CBD, which features prominently in many aerial photos of the city, but this accounts for only
a small share of the regional population and has little influence on the regional population density
figures. As has already been mentioned, the topography of both cities creates physical barriers to
travel.
As shown in figure 3.1, Vancouver’s urban rail infrastructure is comparable to that of Auckland.
Vancouver has two elevated light-rail SkyTrain lines (with a third opened in September 2009) and one
diesel-hauled peak commuter rail service; Auckland has two main rail corridors and the Northern
Busway. One critical difference is that Vancouver has no radial freeways: its freeway system is confined
to two outer-suburban links near the US border to the south, and the Trans-Canada Highway, which
crosses the suburbs to the north. By contrast, Auckland has three major radial freeways that converge
in a large ‘spaghetti junction’ that has no equivalent in British Columbia.
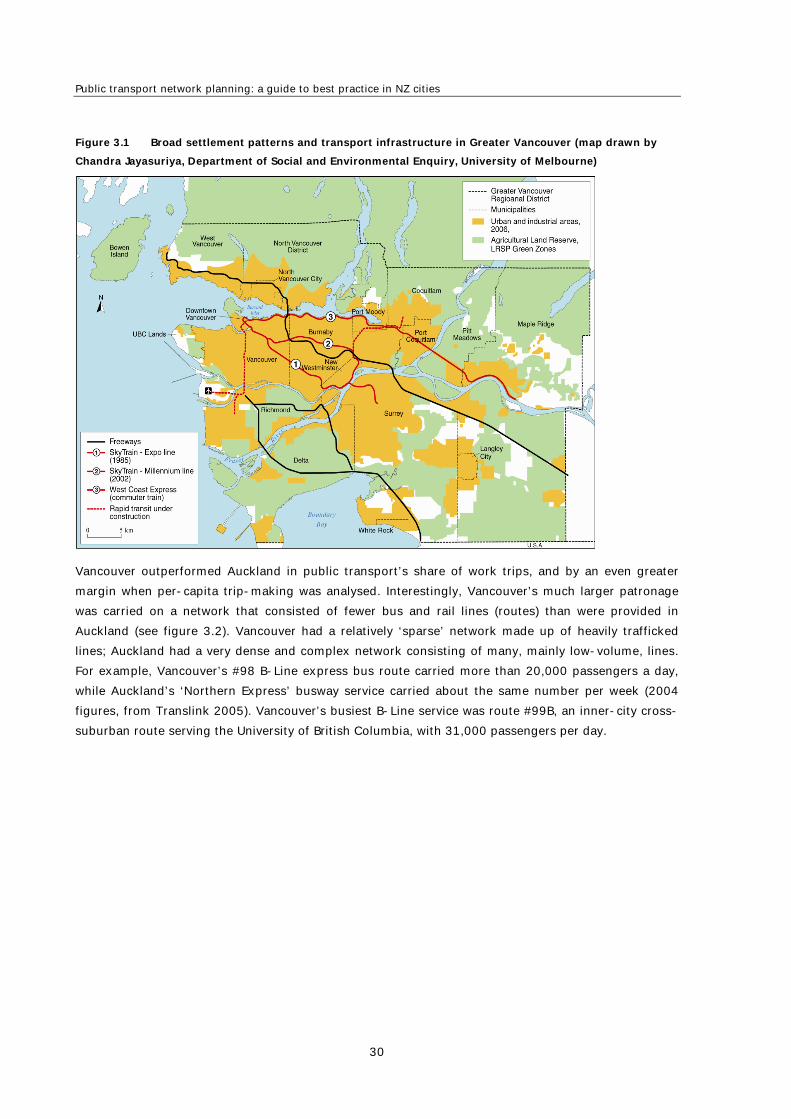
Public transport network planning: a guide to best practice in NZ cities
30
Figure 3.1 Broad settlement patterns and transport infrastructure in Greater Vancouver (map drawn by
Chandra Jayasuriya, Department of Social and Environmental Enquiry, University of Melbourne)
Vancouver outperformed Auckland in public transport’s share of work trips, and by an even greater
margin when per-capita trip-making was analysed. Interestingly, Vancouver’s much larger patronage
was carried on a network that consisted of fewer bus and rail lines (routes) than were provided in
Auckland (see figure 3.2). Vancouver had a relatively ‘sparse’ network made up of heavily trafficked
lines; Auckland had a very dense and complex network consisting of many, mainly low-volume, lines.
For example, Vancouver’s #98 B-Line express bus route carried more than 20,000 passengers a day,
while Auckland’s ‘Northern Express’ busway service carried about the same number per week (2004
figures, from Translink 2005). Vancouver’s busiest B-Line service was route #99B, an inner-city cross-
suburban route serving the University of British Columbia, with 31,000 passengers per day.
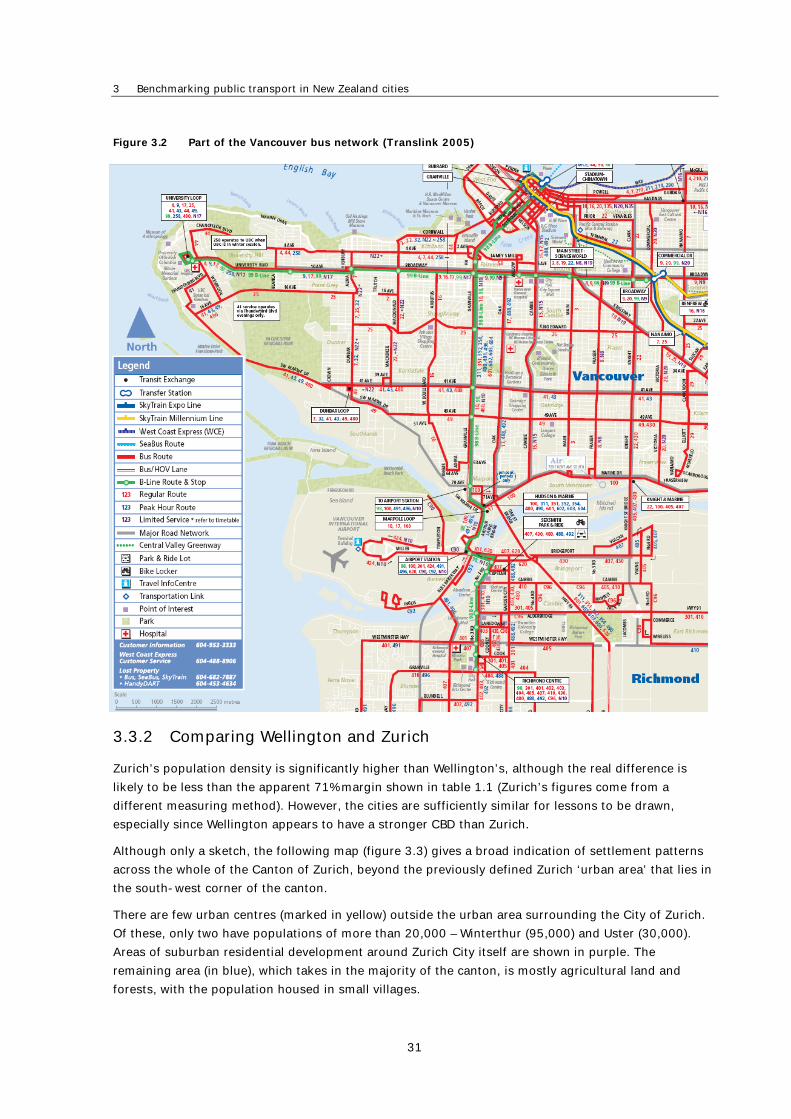
3 Benchmarking public transport in New Zealand cities
31
Figure 3.2 Part of the Vancouver bus network (Translink 2005)
3.3.2 Comparing Wellington and Zurich
Zurich’s population density is significantly higher than Wellington’s, although the real difference is
likely to be less than the apparent 71% margin shown in table 1.1 (Zurich’s figures come from a
different measuring method). However, the cities are sufficiently similar for lessons to be drawn,
especially since Wellington appears to have a stronger CBD than Zurich.
Although only a sketch, the following map (figure 3.3) gives a broad indication of settlement patterns
across the whole of the Canton of Zurich, beyond the previously defined Zurich ‘urban area’ that lies in
the south-west corner of the canton.
There are few urban centres (marked in yellow) outside the urban area surrounding the City of Zurich.
Of these, only two have populations of more than 20,000 – Winterthur (95,000) and Uster (30,000).
Areas of suburban residential development around Zurich City itself are shown in purple. The
remaining area (in blue), which takes in the majority of the canton, is mostly agricultural land and
forests, with the population housed in small villages.
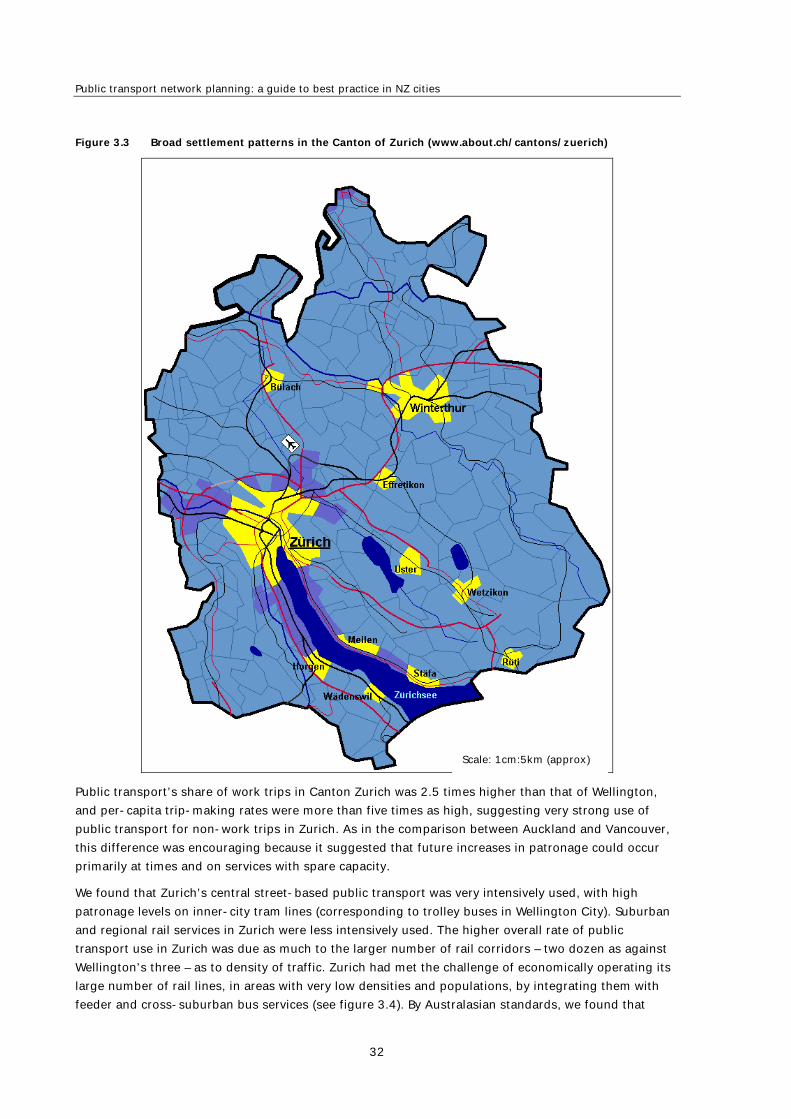
Public transport network planning: a guide to best practice in NZ cities
32
Figure 3.3 Broad settlement patterns in the Canton of Zurich (www.about.ch/cantons/zuerich)
Public transport’s share of work trips in Canton Zurich was 2.5 times higher than that of Wellington,
and per-capita trip-making rates were more than five times as high, suggesting very strong use of
public transport for non-work trips in Zurich. As in the comparison between Auckland and Vancouver,
this difference was encouraging because it suggested that future increases in patronage could occur
primarily at times and on services with spare capacity.
We found that Zurich’s central street-based public transport was very intensively used, with high
patronage levels on inner-city tram lines (corresponding to trolley buses in Wellington City). Suburban
and regional rail services in Zurich were less intensively used. The higher overall rate of public
transport use in Zurich was due as much to the larger number of rail corridors – two dozen as against
Wellington’s three – as to density of traffic. Zurich had met the challenge of economically operating its
large number of rail lines, in areas with very low densities and populations, by integrating them with
feeder and cross-suburban bus services (see figure 3.4). By Australasian standards, we found that
Scale: 1cm:5km (approx)
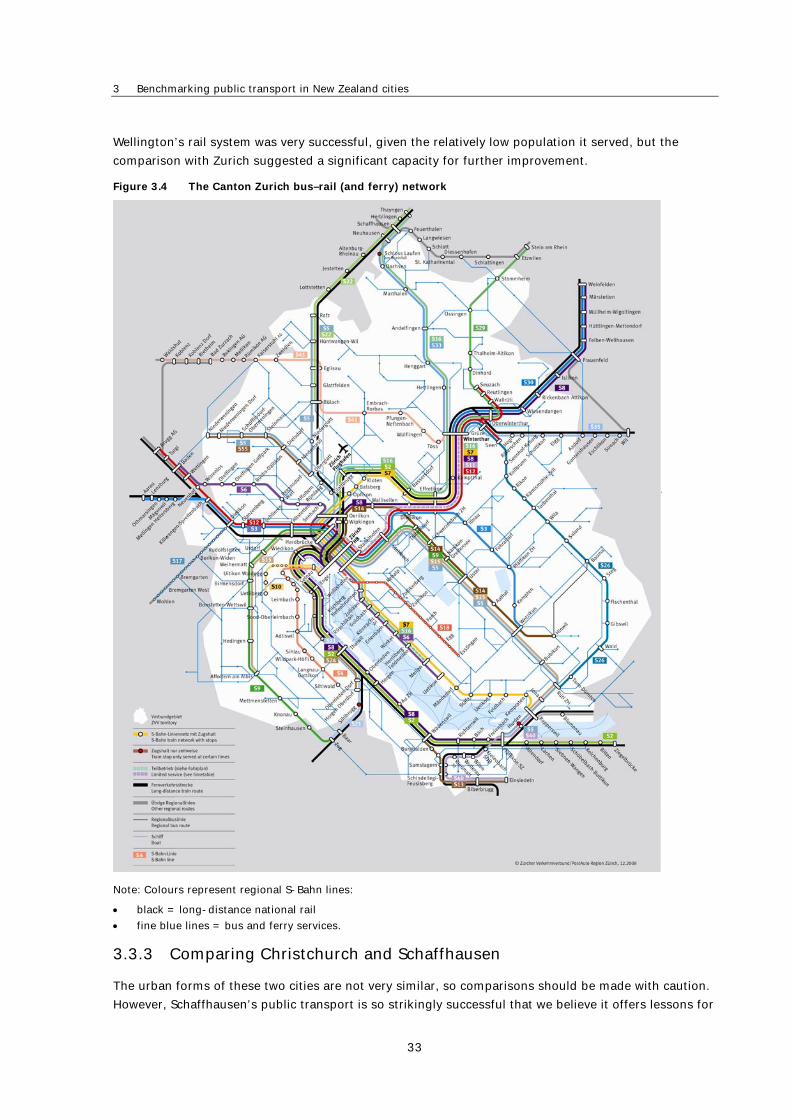
3 Benchmarking public transport in New Zealand cities
33
Wellington’s rail system was very successful, given the relatively low population it served, but the
comparison with Zurich suggested a significant capacity for further improvement.
Figure 3.4 The Canton Zurich bus–rail (and ferry) network
Note: Colours represent regional S-Bahn lines:
black = long-distance national rail
fine blue lines = bus and ferry services.
3.3.3 Comparing Christchurch and Schaffhausen
The urban forms of these two cities are not very similar, so comparisons should be made with caution.
However, Schaffhausen’s public transport is so strikingly successful that we believe it offers lessons for
Public transport network planning: a guide to best practice in NZ cities
34
Christchurch and other New Zealand cities – particularly because Schaffhausen is a small city without a
medieval core: roads and parking are relatively plentiful and there are few explicit demand-
management policies in place.
Public transport’s share of work trips was very high in Schaffhausen, at some eight times the level for
Christchurch. However, it is important to note that around a quarter of workers who travelled by public
transport did so by train to destinations outside the Canton of Schaffhausen – mainly in the suburbs
and City of Zurich. When only buses were counted, the difference was around 6:1, similar to the
difference in per-capita trip-making rates.
Public transport in Christchurch was different from that in Auckland and Wellington, with a more even
spread of patronage between work and non-work trips. Although the share of work trips by public
transport was considerably lower in Christchurch than in Auckland, per-capita trip-making rates were
somewhat higher, reflecting the fact that Christchurch already employed some features of network
planning, such as multimodal fares and the successful Orbiter bus line. However, the comparison with
Schaffhausen suggested the potential for further improvement. It was noteworthy that Schaffhausen’s
13 million annual public transport passengers were carried on only six bus lines (see figure 3.5),
reflecting a similar pattern to that found in Vancouver and the City of Zurich.
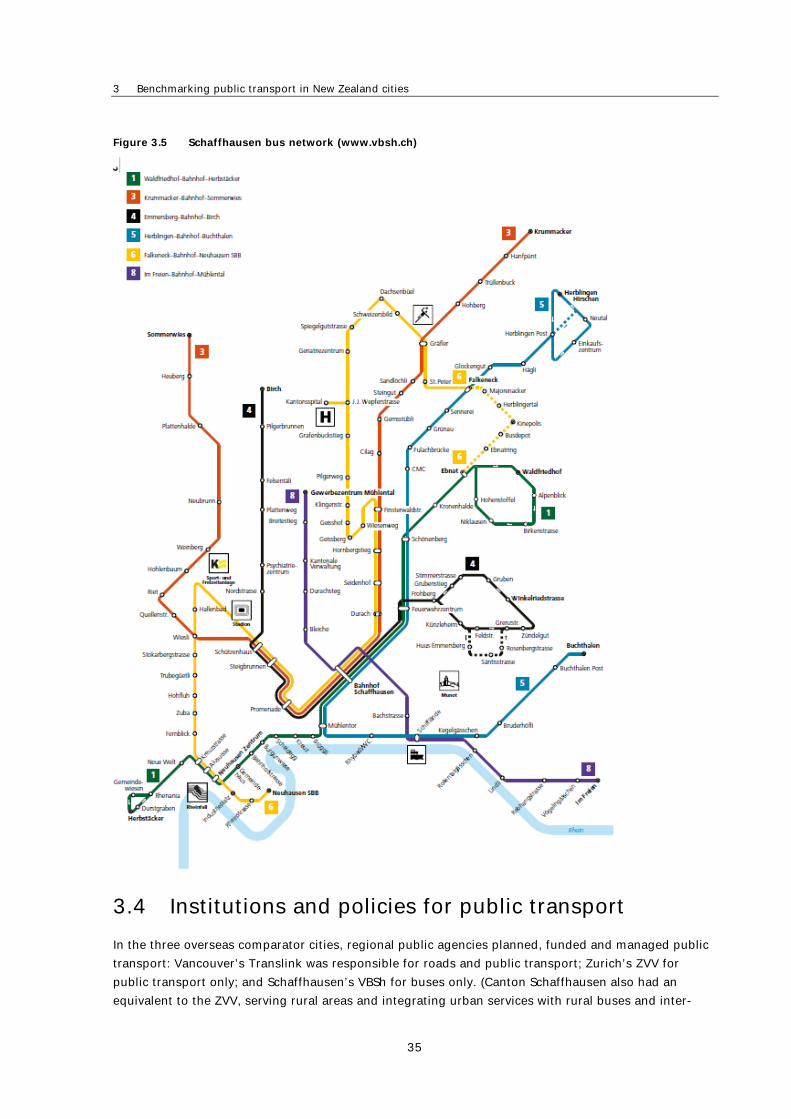
3 Benchmarking public transport in New Zealand cities
35
Figure 3.5 Schaffhausen bus network (www.vbsh.ch)
3.4 Institutions and policies for public transport
In the three overseas comparator cities, regional public agencies planned, funded and managed public
transport: Vancouver’s Translink was responsible for roads and public transport; Zurich’s ZVV for
public transport only; and Schaffhausen’s VBSh for buses only. (Canton Schaffhausen also had an
equivalent to the ZVV, serving rural areas and integrating urban services with rural buses and inter-
Public transport network planning: a guide to best practice in NZ cities
36
cantonal rail lines.) The Zurich and Vancouver agencies subcontracted some or all of their service
offerings to public and private sector bodies, but to the passenger, the overall network appeared to be
directly operated by the regional agency (as was the case in Schaffhausen). Fares and timetables were
integrated, and the system was marketed as a whole.
As a result of the deregulation of bus services in 1989, the situation in New Zealand cities was
different. Until 1 January in that year, regional councils could exercise planning functions in relation to
‘contracted’ services, but had little ability to influence ‘commercial’ services provided by private bus
firms, even though those services received government subsidies in the form of ‘concession
recoupment’. In Auckland, in particular, this prevented the development of a multimodal fare system
and the recasting of bus services in rail corridors to act as feeders rather than competitors. In
Christchurch, a more cooperative relationship between planning agencies and bus operators, and the
smaller role of commercial services, enabled a greater degree of public planning and control. This
allowed the introduction of a multimodal fare system with free transfers. In Wellington, a significant
share of the public transport services were commercially provided. This created problems similar to
those seen in Auckland.
Another important difference between the overseas and New Zealand cities was the much higher
degree of prominence given to public transport by regional and higher-level governments in the
comparator cities. The upgrades to public transport in Vancouver, Zurich and Schaffhausen had come
as the result of region-wide debates about transport policy that began in the 1970s. Public transport
was seen as the priority mode for urban travel, rather than just a supplement to the automobile. This
focus on public transport being the preferred mode for urban travel generally reinforced the network
approach, which was designed to provide convenient service for the full range of trip types.
Until recently, public transport in New Zealand has been treated as a ‘back-up’ mode to the
automobile, for the disadvantaged and city-centre commuters. There are signs of a shift in philosophy
in the largest New Zealand cities, beginning in Christchurch and now extending to the North Island.
However, we found that the public transport infrastructure and operating patterns in all three New
Zealand cities still showed the impact of the long period of relative neglect.
3.5 Service supply and public subsidies
As the data in table 3.1 shows, the much higher rates of public transport trip-making in the
benchmarking cities were achieved without the need for proportionately larger ‘quantities’ of service
supply. Although the figures were not directly comparable because of differences in vehicle sizes and
modes used, it was evident that the New Zealand cities and their international comparators provided a
similar order of per-capita public transport service supply.
The big difference was in how this supply was assembled. The attention to network planning in the
benchmarking cities was the key to the higher levels of use. By using resources more productively to
create a network that delivered higher average boardings per vehicle, the benchmarking cities required
significantly lower public subsidies per boarding.
3.6 Conclusion
The comparison with examples of ‘best practice’ in comparable overseas cities suggested that
New Zealand’s three largest urban regions have considerable potential to build on the increases in
public transport patronage and mode share achieved over the last decade. Encouragingly, the greatest

3 Benchmarking public transport in New Zealand cities
37
potential for improvement seems to lie with ‘non-traditional’ trip types that could be accommodated
without imposing a commensurate increase in capital and operating costs. The next chapter of this
report considers the three New Zealand cities in more detail, to assess the potential for network
planning to improve current operating practices.
Public transport network planning: a guide to best practice in NZ cities
38
4 Current public transport planning practice in New Zealand cities
4.1 Introduction
This section presents a summary of current operating practices in Auckland, Wellington and
Christchurch.4 It provides a basis for our later assessment of the potential to adapt current practices
towards the network-planning model, particularly in ways that do not involve substantial additional
expenditure.
We found that current operating practices reflected the broader history of decisions made in transport
planning over recent decades in each city, and thus represented the outcomes of various competing
forces.
4.2 Auckland
4.2.1 Institutions
The impact of the New Zealand government’s 1989 deregulation of public transport was most obvious
in the Auckland region, where we noted that several private bus companies were operating services
that directly competed with each other and with the rail services.
Rail services and some bus services were planned and subsidised by ARTA and delivered by private
contractors. Outside this framework, other bus routes were delivered as ‘commercial’ services, for
which operators received fare revenues and a payment from ARTA to offset concession fares. The
MAXX brand was used as a coordinating mechanism, but many services operated in the liveries of the
private operators.
Through its public transport strategies, ARTA was attempting to coordinate the activities of the private
operators and the six local councils in the region.
4.2.2 Service standards
Despite some positive changes associated with the establishment of the Northern Busway, public
transport in Auckland did not have a clearly defined network structure.
The train system provided the skeleton of trunk service in the southern and western corridors that,
even with current diesel operations, offered competitive travel times when compared with buses.
Buses operated in direct competition with the trains. Services were chiefly oriented around city-bound
commuter markets, with low frequencies during off-peak periods and in counter-peak travel
directions.
Many bus services competed directly with trains for travel into the city centre despite trains holding a
significant competitive travel-time advantage – for example, peak-period express buses from New
Lynn took 50 minutes to reach Britomart, compared with 33 minutes by train; Papakura to Britomart
took 80 minutes by peak express bus, compared with 53 minutes by a stopping-all-stations train and
38 minutes by express train. Other counter-productive competition between rail and bus was seen in
4 Timetables used in this analysis were those in operation during the last quarter of 2008.
4 Current planning practice in New Zealand
39
the parallel services offered along rail corridors in the outer suburbs – for example, between Swanson
and Henderson in the west, and between Otahuhu and Manurewa in the southern corridor. There was
also a price penalty for using the slower buses – for example, the three-stage journey by GoWest bus
from New Lynn to Britomart was $4.30 for a single trip, while the same journey by train was only
$3.80.
This competition between bus and train could be partly explained by the poor location of the central
rail station relative to employment and retail opportunities in the CBD – a situation that was even worse
before the opening of the Britomart terminal.
Outside the Northern Busway, bus services were designed to avoid transfers: a multiplicity of indirect
lines were used to link likely origins and destinations. At some locations, timetables referred to
transfers and interchanges, but connections with trains were seldom well designed or encouraged. For
example:
Bus–rail to and from the airport. The only service that made a direct link between the rail line and
the airport (#380) operated on 30-minute headways5, while the Southern Line train stopped at
Papatoetoe station every 15 minutes outside peak periods. This complementary pattern should
have enabled effective transfers, but, in both directions, the timetabled arrival of the bus at the
station was the same as the train departure. This guaranteed a 15-minute addition to the
scheduled 52 minutes in-vehicle time for the trip from the domestic air terminal to Britomart. In
peak periods, during which train frequencies were greater, there were some good bus–train
connections, but these were given no special recognition in the bus timetable.
Manurewa station was a designated ‘interchange’, but bus–train coordination was extremely poor
for the #455 and #456 ‘feeder’ bus lines. Bus services to the station were timetabled to arrive at
the same time as the train departed and, for the reverse journey, to leave one minute before the
train arrived.
Bus timetables in the south and west encouraged users to transfer to other bus services rather than
to the faster train. This was seen in the south at Papakura, and in the west at New Lynn.
Bus-bus coordination was managed slightly better than bus–train connections, but only where lines
were operated by the same company. For example, timed transfers were available for a grouping of
several lines at Botany Town Centre in the eastern suburbs away from the rail corridor. This
coordination was important, as the typical frequency of suburban distributor buses was two per hour,
or less.
Most bus services followed very indirect routes, which had a negative impact on patronage levels.
Where the bus services followed more direct routes, such as the lines operating along Dominion Road
in central Auckland, which largely followed the routes of the old tram services, patronage was
significantly higher – more than could be attributed to the minimal differences in adjacent land use.
In addition to the bus and train services, a number of ferry services operated on different Auckland
waterways. These carried around 8% of the total for all modes of public transport patronage in
2007/08 (ARTA 2008, p156), compared with rail’s share of 12%. Because of our research team’s lack of
familiarity with ferry operations, and the relatively low rate of growth in ferry patronage compared with
rail, ferry services were not included in this analysis – however, customers wishing to combine a ferry
trip with other public transport services also experienced problems of timetable coordination.
5 ‘Headway’ is the time interval between services.
6 Patronage in this data included school bus passengers (around 2% of the total).
Public transport network planning: a guide to best practice in NZ cities
40
4.2.3 The Northern Busway
The Northern Busway offered a trunk service with weekday headways of around 5 minutes in the peak
and 10 minutes in the inter-peak and early evening, although services were relatively sparse after
8.30pm. Travel time to the CBD was 30 to 40 minutes, depending on the degree of congestion on the
city approaches.
The design of interchanges at busway stops was conducive to easy transfers, and the routes of some
local bus lines had been altered to take advantage of the improved travel times offered by the Busway.
However, other bus lines (such as #891 and #891X) ran in competition with the Busway, taking
passengers all the way to the CBD, but at slower speeds.
4.2.4 Circulation within the CBD
The concentration of many lines within the central city was major source of delays, particularly as
buses competed for street space with private cars and had little effective signal priority. Around
Britomart, and along Queen St from the waterfront to the Town Hall, the complex layout of stops for
different lines created confusion for passengers. There seemed to be little focus in bus route designs
to facilitate the distribution of passengers from stations at Mt Eden and Boston Road to destinations in
the southern end of the CBD.
4.2.5 Orbital routes
The LinkBus line around the CBD followed an indirect route and had a relatively slow speed because of
competition with cars for road space, the midblock location of stops, and an absence of priority at
traffic signals. However, its distinctive livery made it comprehensible to users, compared with the
opaque routes and confusingly complex layout of stops common to other buses operating in the CBD,
and users appeared to be willing to overlook those service defects.
4.2.6 Ticketing
There was a bewildering array of tickets available for travel on public transport in Auckland. Veolia
issued one set of tickets solely for train travel, and nine separate sets of bus tickets were offered by
the various private operators. Free transfers between services were generally limited to those run by a
single operator. Almost all fares were based on distance, with up to eight fare stages, except for the
Northern Busway, which offered time-based tickets. Most tickets were paper, although some ‘smart’
tickets were available – chiefly as means to store value for multiple trips on the services of a single
operator.
4.3 Wellington
4.3.1 Institutions
As in Auckland, ‘commercial’ operations supplied a significant share (around 20%) of the public
transport services, and took the following three forms:
commercial services ‘peppered’ amongst contracted services on regular routes – including routes
for which peak services (and associated fares) were commercial, while the public agency delivered
the less-profitable off-peak services, and even some for which the commercial operation
comprised only selected services during the morning peak
commercial peak-only express services

4 Current planning practice in New Zealand
41
fully commercial routes (including the Airport Flyer).
As in Auckland, the public transport system had a common brand – Metlink information services,
maintained by the Greater Wellington Regional Council (GW), which has largely maintained control over
some important strategic directions for the regional public transport system. Compared with Auckland,
Wellington’s smaller scale simplified relations between GW and the eight local councils in the region,
although problems of inter-agency coordination did add complexities for transport planners.
There were two large private bus operators and a number of small operators. The New Zealand
government (through the New Zealand Railways Corporation) had recently taken ownership of the
suburban rail operator Tranzmetro, formerly a subsidiary of Toll Holdings.
4.3.2 Service patterns
The published map for Wellington’s public transport system revealed some sound elements of network
planning in service patterns: trunk routes in the main travel corridors, with feeder services and 10
identified suburban interchanges.
4.3.3 Bus–rail competition on trunk routes
As in Auckland, bus services competed with rail on the trunk routes and, although the train services
were generally much faster than the buses, this was not always the case.
For example, in the Hutt Valley corridor, the Airport Flyer and a number of other bus services, some
operating peak-only schedules, directly competed with rail for passengers travelling to the Wellington
CBD. However, the trip on the Airport Flyer was slower and more expensive than the trip by train:
Upper Hutt to Wellington Station took 50 to 55 minutes by bus and the cash fare was $11.00; the
corresponding train trip took 45 minutes (40 minutes for expresses) and was, at most, $8.00.
In the Porirua corridor, the train trip to the CBD (20 minutes express) was less than half the time taken
by the #60 bus. However, the bus played a role in the wider network by providing a connection to
Johnsonville – from Johnsonville to the CBD, the bus was faster than trains on the circuitous
Johnsonville line (15 minutes on #60, compared with 21 minutes by train).
Many published timetables provided information about rail–bus connections, although these advertised
transfers commonly involved waiting times of 10 minutes or more. These long waiting times could be a
conscious response to problems with service reliability, but they tended to reinforce the preferences of
commuters for the numerous ‘peak-only’ bus services.
4.3.4 Design of groups of local suburban bus lines
Suburban development in the Wellington region is typically located in relatively isolated valleys and
along coastal strips. To serve these developments, local and feeder bus services in the two major
corridors north of Wellington City were organised in groups. In the past, some of these groupings (eg
in the Wainuiomata area and in Stokes Valley) had very convoluted route layouts with closely spaced
stops, which led to long travel times. Compared with these historic layouts, the route patterns
observed in this study were more direct and had fewer stops, but were not changed to the extent that
GW planners had originally proposed. Current patterns were established as a compromise, brokered by
regional councillors, between the planners and users of the old services.
Coverage for local bus lines was typically around 16 to 17 hours (from around 6.30am to 11.00 or
11.30pm) with off-peak frequencies of between 15 and 30 minutes, although there were some lines
(eg #65 north of Porirua) that ceased operation in the early evening and had hourly off-peak headways.

Public transport network planning: a guide to best practice in NZ cities
42
Such lines offered relatively poor service but were nonetheless designated as ‘full-service’ lines on the
Metlink network map. (To be considered less than ‘full service’, a line needed to operate less than
hourly, Monday to Friday.)
4.3.5 Service planning
Regular reviews of routes and timetables had been held in order to adapt the service patterns to the
changing needs of users. The outcomes of the 2008 review of services in the suburbs north and east of
Johnsonville (described below) illustrated the standoff between planners in the public agencies and the
operators of the private bus companies. The review was said to have resulted in ‘More direct bus routes
to and from Wellington at peak times, and new routes to make services easier to understand and use’
(GW 2008), but the actual outcomes were not as much of an improvement as had been hoped.
The major changes were as follows:
Creation of new peak-only services
To the east of the Porirua Motorway, three lines would now leave from three distinct suburban
termini in the peak period. These three lines would merge to follow a single route for most of the
journey to the Wellington CBD. None of these lines would operate in the off-peak.
Reorganisation of off-peak services
Before the review, suburban destinations near Johnsonville were served in the off-peak period by
two services with indirect routes – one of these travelled all the way to the CBD, and the other
linked by a timed transfer (timetabled as a 5-minute wait). The review prompted the establishment
of a single line (#52), originating in Johnsonville, which eliminated a 2km diversion but included 27
minutes of travel on suburban streets. In contrast, before the review, the direct peak service from
Johnsonville (#56) ran on suburban streets for only 12 minutes.
These changes had been driven largely by the operators and only reluctantly accepted by the GW
planners in return for other contract concessions relating to fare collection.
4.3.6 ‘Orbital’ routes
There were no services linking the Hutt Valley to the Porirua corridor without transfers close to the city
centre. This was partly because of the absence of road links, but that was not the whole story –
previous attempts to provide such services appeared to have been erratic. The private company, NZ
Bus, had conducted a short-lived trial of an orbital route from Lower Hutt to Karori, which was
abandoned because of low patronage – but this could have been due to minimal publicity and
unrealistic expectations.7
4.3.7 Circulation within the CBD
There were more than 20 bus and trolley lines serving Wellington’s inner southern and western
suburbs. Almost all these lines, together with the growing number of bus lines from the northern
corridors, shared the crowded streets of the CBD between Wellington Station and Courtney Place. The
problems that this congestion caused regarding efficient operations and public understanding of the
system were well understood by local planners.
7 In February 2009, NZ Bus managers told researchers in Wellington that they were surprised at the low numbers of
passengers travelling the full length of the line.

4 Current planning practice in New Zealand
43
4.3.8 Ticketing
Each service operator issued a variety of different tickets. Within single trips, many transfers required
an additional ticket. Within the contiguous suburban development of Greater Wellington, there were 10
fare zones, with a further four zones for travel to regional centres.
Day-trip tickets, which allowed multiple journeys and transfers, were available separately for bus and
train travel. A combined ticket was also available, but the price was the same as that for bus and train
day passes that were purchased singly.
4.4 Christchurch
4.4.1 Institutions
Since 1998, directions for planning have been set by a Public Transport Strategy that was prepared
jointly by the regional council, Environment Canterbury (ECan), and the Christchurch City Council
(CCC), with input from an advisory committee comprising bus operators, user representatives and
other interest groups.
The Metro unifying brand and bus livery was introduced in 2000. Under that logo, ECan has contracted
services from three bus operators, the largest being Red Bus Ltd, which evolved from the Christchurch
Transport Board and remained under the ownership of the City Council.
The only ‘commercial’ services in this area were the two lines operating to the airport, which were
made viable by charging higher cash fares.
4.4.2 ‘Core’ and ‘community’ services
There were nine core lines in Christchurch’s bus-based public transport system. These services had
minimum headways of 15 minutes during the day and 30 minutes in the evenings and weekends. In
addition, a free central-city shuttle ran along a 1.5km stretch of the main north-south arterial
(Colombo St), with turning circles to take in the Casino and the Christchurch Institute of Technology.
This service was operated by Red Bus and funded by the City Council.
There were two cross-town lines, one being a full orbital, and the other (Metrostar) taking an east-west
route passing through the inner northern suburbs. The ‘Orbiter’ operated at 10-minute headways
between 6.00am and 7.00pm on weekdays, and half-hourly from 9.00pm, with the last bus
terminating at 12.45am. It took a circular route about 3–5km from the central city, with identified
transfer points at six suburban shopping centres. Since the full circle route was put in place in 2000,
planners have reported a level of transfers exceeding their initial expectations.
The other ‘core’ lines were radial. Five of these turned around in the central city and two operated in
pendulum fashion (ie the routes started at one suburban terminus and ran through the CBD to another
suburban terminus). Thus, nine radial corridors had ‘core’ services. The routes taken by these lines
were, for the most part, reasonably direct – at least in the middle and inner suburbs. The exception
was #60, serving the suburban Burwood Hospital from New Brighton, which took a rather indirect route
to the central city. (A recent service review has foreshadowed changes to make this route more direct.)
Travel speeds on the radial routes were typically around 24kph in the peak and 30kph at night (using
the example of the western leg of line #5). The Orbiter had an average speed of around 21kph.
The remaining lines, called ‘community services’, operated at frequencies of 20–60 minutes during
weekdays, and less often in the evenings and at weekends. These services operated on indirect, often
Public transport network planning: a guide to best practice in NZ cities
44
overlapping, radial routes in the gaps between the core lines. There were 26 community lines, (12
being through-routed services), and there were more planned for late 2009, to create pendulum
services.
In addition, six shuttle services linked satellite towns beyond the Christchurch urban boundary to
suburban centres, operating, at best, at hourly frequencies.
4.4.3 Timetables on common route sections
Most lines shared a common route section with another line: there were as many as nine lines on the
western approach to the central city along Riccarton Ave.
There was some coordination of timetables on common sections. For example, three lines (#10, #66
and #67) shared a common section at the south end of Colombo St in the southern suburbs. Each of
these lines operated only hourly in the inter-peak period, but timetables were coordinated to provide
regular 20-minute headways on the common section. Unfortunately, this coordinated scheduling broke
down further north in Colombo St, where a further four lines merged. North of Brougham St, 14
services per hour ran in the inter-peak. However, in any one hour, passengers faced two gaps of 14
minutes between city-bound buses, and there were two six-minute periods during which five buses
arrived.
4.4.4 Circulation within the CBD
A total of 47 radial routes (served by 33 lines) converged on the central city. Circulation patterns in the
central city were complex. For example, non-pendulum lines turned around via circuits of city blocks
on the ‘far’ side of the CBD. The planners were intending to simplify this by creating more through-
routed lines. However, with only one exception, all city-bound lines passed through the City Bus
Exchange. About half these lines used roadside stops in Colombo St; the others used platforms inside
the exchange. Delays in entering and leaving the exchange added to travel times, but the impact on
passengers appeared to be ameliorated to some extent by the amenity of the bus exchange, which
featured airport-like seating and TV monitors, and successfully separated waiting passengers from the
noise and fumes of the buses.
4.4.5 Ticketing
Three fare zones covered the Greater Christchurch region. Most services operating inside Christchurch
City were in Zone 1.
Substantial discounts and transfer opportunities were available for passengers who used the ‘smart’
MetroCard rather than cash. Within Zone 1, a single trip with a cash fare cost $2.80 and included one
free transfer within 2 hours; with a MetroCard, the single trip fare was only $2.10 and included
unlimited free transfers within 2 hours. All-day travel with unlimited transfers cost $4.20 using a
MetroCard. A more expensive ‘all-day’ cash option ($10.00) was available for travel only on routes
operated by Red Bus, which covered about 75% of Zone 1 services, but did not operate on the Orbiter.
5 The potential for improved network planning in New Zealand
45
5 The potential for improved network planning in New Zealand cities
5.1 Introduction
In section 2, we identified the elements of public transport planning that are required to create the
high-quality, transfer-based networks that could enable an increase in public transport trip-making at
an affordable cost to operators. It is clear from the observations made in section 4 that the design of
some key aspects of public transport services in Auckland, Wellington and Christchurch were based on
a different planning rationale from that which underpins the ‘network’ approach.
This chapter explores some specific opportunities for changes to public transport services in
New Zealand cities that would follow from the adoption of the network-planning rationale. It provides,
in effect, a checklist of the key requirements for networked public transport in New Zealand cities, and
should be read in conjunction with the HiTrans best practice guide (2005), which further elaborates the
underlying principles.
Although this project was not intended to provide detailed operational plans, we hope it provides
sufficient direction for the appropriate agencies to take this forward. This has already occurred in
Wellington, where ideas raised in project workshops in February 2009 for the reorganisation of bus and
trolley lines in the heart of the CBD’s commercial and retail precinct (the so-called ‘Golden Mile’ along
Lambton Quay) have been referred to consultants as options for operational changes.
5.2 Institutions and public processes
At the time of writing, the institutions that coordinated public transport services in Auckland,
Wellington and Christchurch were chiefly part of regional governments, which have the skills and
structures necessary to plan networked public transport services. However, in Auckland and
Wellington, a new relationship would be required between the regional transport planning agency and
the private operators, based on recognition of the mutual benefits that would flow from the increased
patronage that could be achieved through a planned network.
The institutional environment for successful implementation of ‘networked’ public transport
requires:
a public agency to plan the network across the whole city region
understanding that the appropriate place for private-sector competition in the provision of
public transport services is not in a contest between operators for customers on the busiest
routes, but in producing best-value tenders for the delivery of part, or all, of a publicly planned
system
well-designed public education and consultation programmes to effectively manage change
a fare system that is simple to understand and that avoids the imposition of penalties for
transfers – the technology used to sell tickets should be secondary to the design of the system.
Public transport network planning: a guide to best practice in NZ cities
46
‘Gross-cost’ contracts with private operators, where farebox revenues are kept by the tendering
authority, would be appropriate for the delivery of networked public transport – we would be in
agreement with their adoption under existing or reformed procurement legislation.
New public processes would be required to build community support for reorganisation of existing
public transport services into a functional network. In both Wellington and Auckland, recent upgrades
to rail systems have provided a useful context into which operational changes could be presented to
the community. The composition of Christchurch’s strategic advisory committee (the Passenger
Transport Advisory Group) could provide a good model for a framework within which these public
consultations could be organised.
In the renegotiation of the relationships between public and private institutions that must accompany a
shift to the network approach to public transport service delivery, it would be essential, in both
Auckland and Wellington, to create a fare system that:
provides a mechanism for cross-subsidies for lower-patronised services that supply important
network connectivity
removes the financial penalty for making transfers between lines and modes
reduces the numbers of zones, to make the system easier to understand and market.
5.3 Network structure
From our study, it was clear that the ‘tailor-made’ approach has dominated the design of public
transport in New Zealand cities, particularly in Auckland and Wellington. This approach (in contrast to
the ‘ready-made’ approach that we have argued is more effective) is characterised by changing
patterns of services for different users at different times of the day. Typically, commuters are offered a
plethora of express bus services, running only a few trips each day in peak times, from all points of the
compass. Separate services, with different routes, are provided at night and for local ‘community’ trips.
This approach (in Auckland especially) often puts bus services in competition with the train, even
though travel times by bus are much slower because of traffic congestion. So, for example, even
though works were being done to upgrade the New Lynn bus–train interchange in the western suburbs
of Auckland, the full potential of such expenditure would not be achieved without reconfiguring bus
services to act as feeders, with the train providing fast services over longer distances.
As discussed in section 3, the alternative ‘network’ approach to service design could lead to greater
efficiencies in the deployment of vehicles and drivers by increasing the rate of boardings per service-
km.
The key elements in the design of an effective network structure are:
use of the ‘ready-made’ approach – ie a simple and stable network of lines throughout the day
with frequency and vehicle sizes adjusted to match capacity requirements in the most- and
least-busy times
mode choice for different lines in the network based on required capacity, comfort and speed
careful consideration of locations for suburban interchanges, based on predicted travel patterns
and efficient vehicle operations.

5 The potential for improved network planning in New Zealand
47
Decisions about the location of key suburban interchanges for a public transport network would largely
follow from land-use planning decisions, although it would be necessary to take an iterative approach,
recognising that decisions about the location of high-quality public transport routes and interchanges
would drive locational choices for developers. The HiTrans best practice guide (Nielson 2005, p41)
gives a useful outline of the basic steps in such a process. A theoretical strategic public transport
network for Wellington is illustrated in figure 5.1.
Figure 5.1 A theoretical strategic network for Wellington
U pper Hutt
Ma ster ton
Ca rter ton
F eath er st on
S ilve rs tre am
S to ke s V a lle y
Taita
W ain u io m ata
E as tbo u rn e
O tak i
Wa ika nae
Par aparau mu
C hu rt on Park
N ew la nd s
Tita hi B ay
W aitan gir ua
Wh itb y
P or ir ua
C ou rte nay P lace
N e w to w n
K aro r i
B ro ok lyn
M t C o ok
Is lan d B ay
M airan g i
K ing s to n
K elb ur n
L yall B ay
M ira mar sho ps Ki lb ir n ie
H ou g hto n B ay
S tr ath mo re
Se ato un
M ir am ar
W elling ton C BD
J ohnsonvi ll e
L in co lnsh ire Far m s
M ano r P ark H ayw ard s H ill
H utt
Pe to ne
Wa terlo o
P lim mer to n
Public transport network planning: a guide to best practice in NZ cities
48
A similar strategic network, shown earlier in figure 3.4 (section 3), was used by planners in Zurich as
the basis for their successful route layout.
5.4 Network operations
Once decisions have been made about the basic structure for the network, the details of the operations
of each component line would need to be considered in a way that allowed stable and reliable
performance. Efficient and effective operation of the individual lines in a network would depend on a
number of interrelated factors:
simplicity and directness
speed and reliability
frequency
attention to location of stops and access to services
marketing to provide good information for first-time and occasional users.
These factors are explored in detail in chapter 3 of the European HiTrans best practice guide (Nielson
2005), and specific comments about their use in the New Zealand cities are made below. Issues such as
comfort, cleanliness and safety for passengers are also important, but fall into a slightly different
category of operational responsibility to the ‘network’ factors described here.
5.4.1 A simple and direct network of lines
Reflecting the ‘tailor-made’ design approach, most bus services in the New Zealand cities, even those
in high-volume travel corridors, have followed indirect routes – even though, in many cases, a much
more direct route could have been taken while still keeping the great majority of potential passengers
within a 400m walking catchment. Even on Auckland’s north shore, with its complex topography and
poor road connectivity, practical redesigns of bus routes to create more direct services could be made.
Simplicity for both users and operators requires:
coverage of any section of the network to be organised on the principle of ‘one section – one
line’ (see figure 5.2 for the effect of the alternative organising principle of ‘direct connections –
no transfers’)
avoiding deviations in the physical routes chosen for both orbital and radial lines
providing pendulum lines through key activity centres and interchanges (see figure 5.3 for
details of the effects of this).
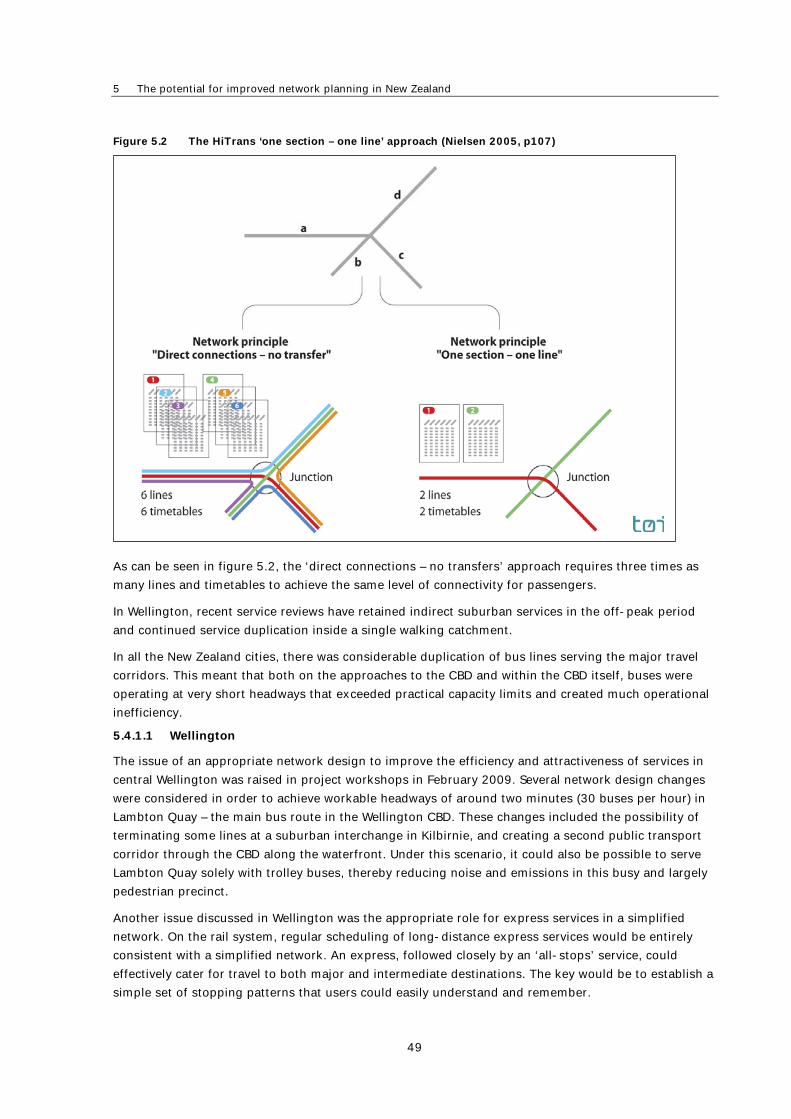
5 The potential for improved network planning in New Zealand
49
Figure 5.2 The HiTrans ‘one section – one line’ approach (Nielsen 2005, p107)
As can be seen in figure 5.2, the ‘direct connections – no transfers’ approach requires three times as
many lines and timetables to achieve the same level of connectivity for passengers.
In Wellington, recent service reviews have retained indirect suburban services in the off-peak period
and continued service duplication inside a single walking catchment.
In all the New Zealand cities, there was considerable duplication of bus lines serving the major travel
corridors. This meant that both on the approaches to the CBD and within the CBD itself, buses were
operating at very short headways that exceeded practical capacity limits and created much operational
inefficiency.
5.4.1.1 Wellington
The issue of an appropriate network design to improve the efficiency and attractiveness of services in
central Wellington was raised in project workshops in February 2009. Several network design changes
were considered in order to achieve workable headways of around two minutes (30 buses per hour) in
Lambton Quay – the main bus route in the Wellington CBD. These changes included the possibility of
terminating some lines at a suburban interchange in Kilbirnie, and creating a second public transport
corridor through the CBD along the waterfront. Under this scenario, it could also be possible to serve
Lambton Quay solely with trolley buses, thereby reducing noise and emissions in this busy and largely
pedestrian precinct.
Another issue discussed in Wellington was the appropriate role for express services in a simplified
network. On the rail system, regular scheduling of long-distance express services would be entirely
consistent with a simplified network. An express, followed closely by an ‘all-stops’ service, could
effectively cater for travel to both major and intermediate destinations. The key would be to establish a
simple set of stopping patterns that users could easily understand and remember.
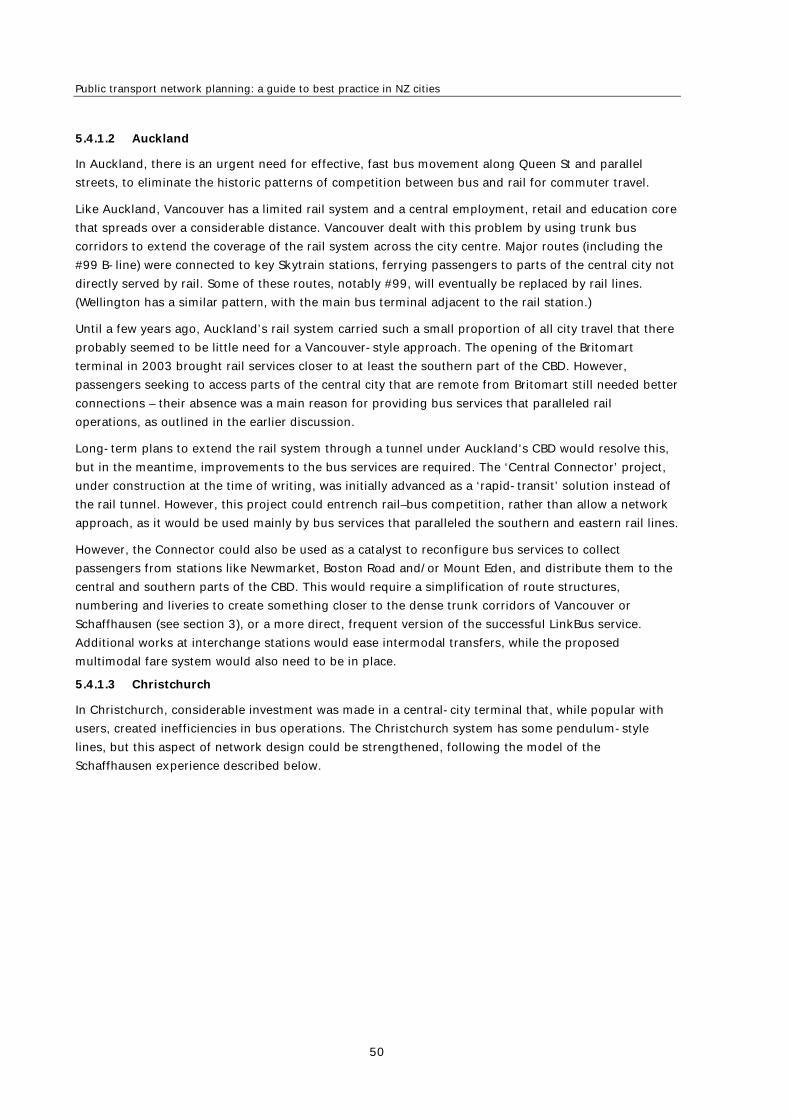
Public transport network planning: a guide to best practice in NZ cities
50
5.4.1.2 Auckland
In Auckland, there is an urgent need for effective, fast bus movement along Queen St and parallel
streets, to eliminate the historic patterns of competition between bus and rail for commuter travel.
Like Auckland, Vancouver has a limited rail system and a central employment, retail and education core
that spreads over a considerable distance. Vancouver dealt with this problem by using trunk bus
corridors to extend the coverage of the rail system across the city centre. Major routes (including the
#99 B-line) were connected to key Skytrain stations, ferrying passengers to parts of the central city not
directly served by rail. Some of these routes, notably #99, will eventually be replaced by rail lines.
(Wellington has a similar pattern, with the main bus terminal adjacent to the rail station.)
Until a few years ago, Auckland’s rail system carried such a small proportion of all city travel that there
probably seemed to be little need for a Vancouver-style approach. The opening of the Britomart
terminal in 2003 brought rail services closer to at least the southern part of the CBD. However,
passengers seeking to access parts of the central city that are remote from Britomart still needed better
connections – their absence was a main reason for providing bus services that paralleled rail
operations, as outlined in the earlier discussion.
Long-term plans to extend the rail system through a tunnel under Auckland’s CBD would resolve this,
but in the meantime, improvements to the bus services are required. The ‘Central Connector’ project,
under construction at the time of writing, was initially advanced as a ‘rapid-transit’ solution instead of
the rail tunnel. However, this project could entrench rail–bus competition, rather than allow a network
approach, as it would be used mainly by bus services that paralleled the southern and eastern rail lines.
However, the Connector could also be used as a catalyst to reconfigure bus services to collect
passengers from stations like Newmarket, Boston Road and/or Mount Eden, and distribute them to the
central and southern parts of the CBD. This would require a simplification of route structures,
numbering and liveries to create something closer to the dense trunk corridors of Vancouver or
Schaffhausen (see section 3), or a more direct, frequent version of the successful LinkBus service.
Additional works at interchange stations would ease intermodal transfers, while the proposed
multimodal fare system would also need to be in place.
5.4.1.3 Christchurch
In Christchurch, considerable investment was made in a central-city terminal that, while popular with
users, created inefficiencies in bus operations. The Christchurch system has some pendulum-style
lines, but this aspect of network design could be strengthened, following the model of the
Schaffhausen experience described below.
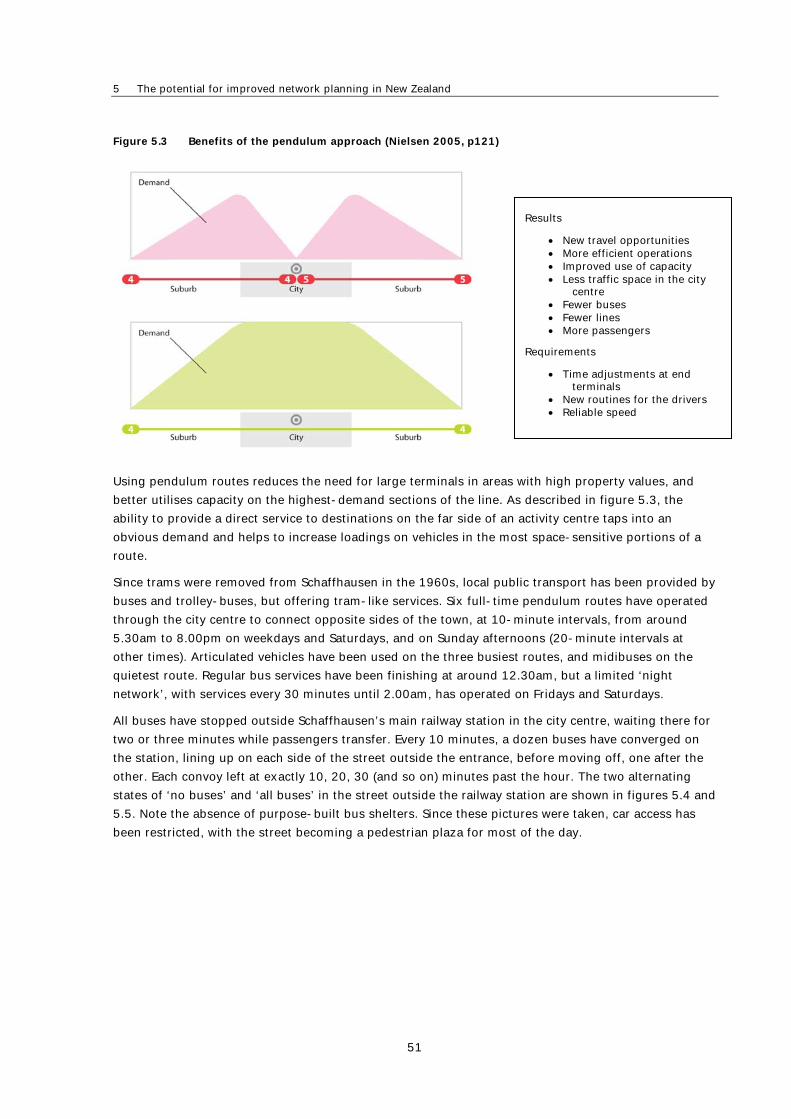
5 The potential for improved network planning in New Zealand
51
Figure 5.3 Benefits of the pendulum approach (Nielsen 2005, p121)
Using pendulum routes reduces the need for large terminals in areas with high property values, and
better utilises capacity on the highest-demand sections of the line. As described in figure 5.3, the
ability to provide a direct service to destinations on the far side of an activity centre taps into an
obvious demand and helps to increase loadings on vehicles in the most space-sensitive portions of a
route.
Since trams were removed from Schaffhausen in the 1960s, local public transport has been provided by
buses and trolley-buses, but offering tram-like services. Six full-time pendulum routes have operated
through the city centre to connect opposite sides of the town, at 10-minute intervals, from around
5.30am to 8.00pm on weekdays and Saturdays, and on Sunday afternoons (20-minute intervals at
other times). Articulated vehicles have been used on the three busiest routes, and midibuses on the
quietest route. Regular bus services have been finishing at around 12.30am, but a limited ‘night
network’, with services every 30 minutes until 2.00am, has operated on Fridays and Saturdays.
All buses have stopped outside Schaffhausen’s main railway station in the city centre, waiting there for
two or three minutes while passengers transfer. Every 10 minutes, a dozen buses have converged on
the station, lining up on each side of the street outside the entrance, before moving off, one after the
other. Each convoy left at exactly 10, 20, 30 (and so on) minutes past the hour. The two alternating
states of ‘no buses’ and ‘all buses’ in the street outside the railway station are shown in figures 5.4 and
5.5. Note the absence of purpose-built bus shelters. Since these pictures were taken, car access has
been restricted, with the street becoming a pedestrian plaza for most of the day.
Results
New travel opportunities More efficient operations Improved use of capacity Less traffic space in the city
centre Fewer buses Fewer lines More passengers
Requirements
Time adjustments at end terminals
New routines for the drivers Reliable speed

Public transport network planning: a guide to best practice in NZ cities
52
Figure 5.4 At most times, the street outside the Schaffhausen railway station is empty of buses. (Photo:
Gustav Nielsen)
Figure 5.5 Six times in each hour, 12 buses arrive at the same time and depart at the same time.
(Photo: Gustav Nielsen)
With services this frequent, there has been no need to specifically coordinate the bus and train
schedules, although the last night-buses have been timed to meet the 1:00am ‘S-Bahn’ train from
Zurich. Transfers have been free, and the city’s fares have been integrated with those of the regional
buses serving the 30,000 residents of rural parts of Schaffhausen Canton. Heavily discounted season
tickets (or ‘periodicals’) have been available, with a monthly ticket costing only twice as much as a
weekly ticket. Despite this, cost-recovery rates have been respectable, assisted by strong off-peak
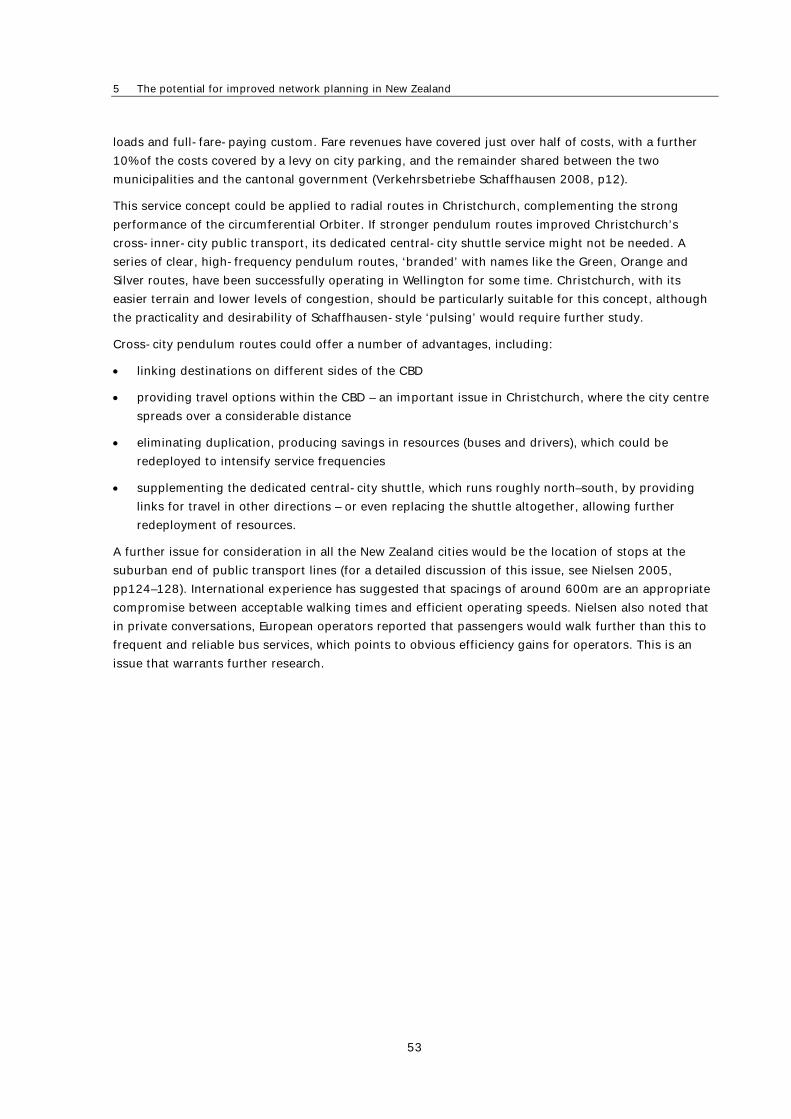
5 The potential for improved network planning in New Zealand
53
loads and full-fare-paying custom. Fare revenues have covered just over half of costs, with a further
10% of the costs covered by a levy on city parking, and the remainder shared between the two
municipalities and the cantonal government (Verkehrsbetriebe Schaffhausen 2008, p12).
This service concept could be applied to radial routes in Christchurch, complementing the strong
performance of the circumferential Orbiter. If stronger pendulum routes improved Christchurch’s
cross-inner-city public transport, its dedicated central-city shuttle service might not be needed. A
series of clear, high-frequency pendulum routes, ‘branded’ with names like the Green, Orange and
Silver routes, have been successfully operating in Wellington for some time. Christchurch, with its
easier terrain and lower levels of congestion, should be particularly suitable for this concept, although
the practicality and desirability of Schaffhausen-style ‘pulsing’ would require further study.
Cross-city pendulum routes could offer a number of advantages, including:
linking destinations on different sides of the CBD
providing travel options within the CBD – an important issue in Christchurch, where the city centre
spreads over a considerable distance
eliminating duplication, producing savings in resources (buses and drivers), which could be
redeployed to intensify service frequencies
supplementing the dedicated central-city shuttle, which runs roughly north–south, by providing
links for travel in other directions – or even replacing the shuttle altogether, allowing further
redeployment of resources.
A further issue for consideration in all the New Zealand cities would be the location of stops at the
suburban end of public transport lines (for a detailed discussion of this issue, see Nielsen 2005,
pp124–128). International experience has suggested that spacings of around 600m are an appropriate
compromise between acceptable walking times and efficient operating speeds. Nielsen also noted that
in private conversations, European operators reported that passengers would walk further than this to
frequent and reliable bus services, which points to obvious efficiency gains for operators. This is an
issue that warrants further research.
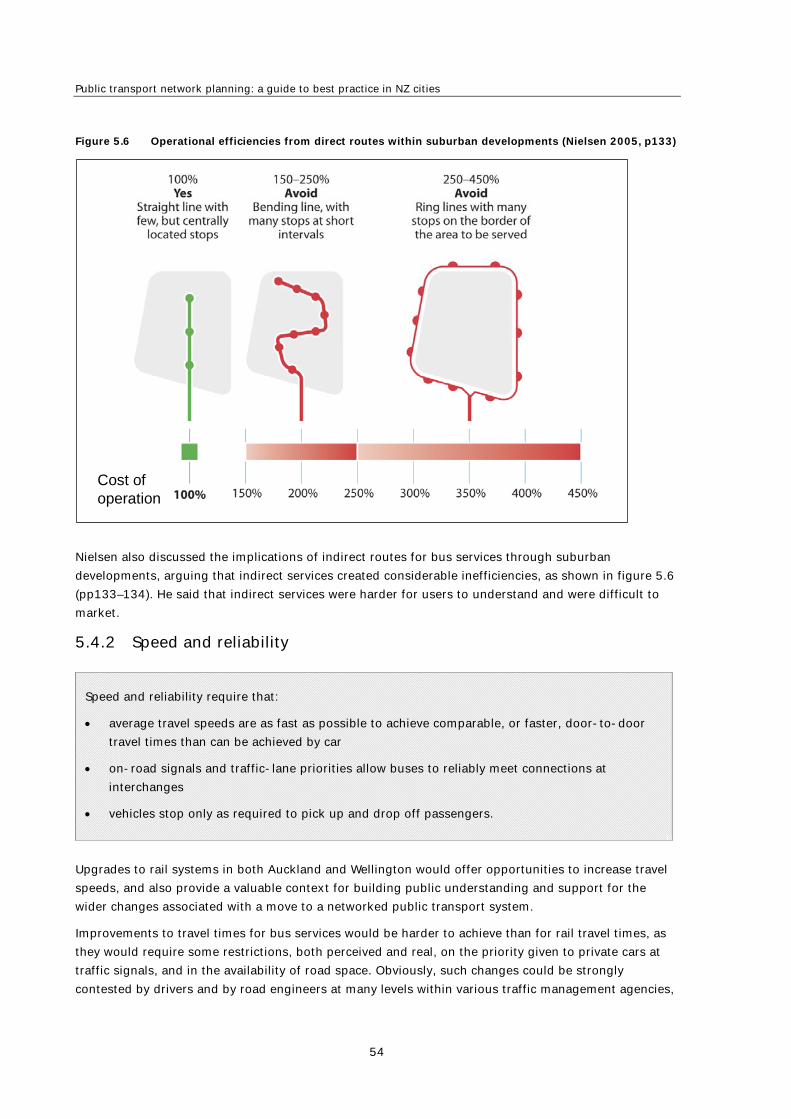
Public transport network planning: a guide to best practice in NZ cities
54
Figure 5.6 Operational efficiencies from direct routes within suburban developments (Nielsen 2005, p133)
Nielsen also discussed the implications of indirect routes for bus services through suburban
developments, arguing that indirect services created considerable inefficiencies, as shown in figure 5.6
(pp133–134). He said that indirect services were harder for users to understand and were difficult to
market.
5.4.2 Speed and reliability
Upgrades to rail systems in both Auckland and Wellington would offer opportunities to increase travel
speeds, and also provide a valuable context for building public understanding and support for the
wider changes associated with a move to a networked public transport system.
Improvements to travel times for bus services would be harder to achieve than for rail travel times, as
they would require some restrictions, both perceived and real, on the priority given to private cars at
traffic signals, and in the availability of road space. Obviously, such changes could be strongly
contested by drivers and by road engineers at many levels within various traffic management agencies,
Speed and reliability require that:
average travel speeds are as fast as possible to achieve comparable, or faster, door-to-door
travel times than can be achieved by car
on-road signals and traffic-lane priorities allow buses to reliably meet connections at
interchanges
vehicles stop only as required to pick up and drop off passengers.
Cost ofoperation
5 The potential for improved network planning in New Zealand
55
and would require a reversal of a longstanding political consensus. To achieve this change, public
transport agencies and elected officials would need to actively engage in internal and public processes.
The network approach would strengthen the arguments for providing on-road priority for public
transport. It would be much easier to argue that a particular bus should be given signal priority at an
intersection to help it reliably meet a crucial network connection, than if the same bus was following an
existing timetable that, to all practical purposes, operated independently from the rest of the system.
5.4.3 Frequency and appropriate service density in weaker markets
Experience from the benchmark cities suggested that political and community support for public
transport would grow with increasing patronage. As success could be demonstrated, more measures to
give priority to public transport vehicles would be professionally and politically acceptable.
In many travel corridors in all three New Zealand cities, frequencies in off-peak periods have been well
below the 10-minute interval that the literature suggests is required to operate a viable
multidirectional alternative to the car without coordinated timetables. The marginal costs of increased
off-peak frequencies would typically be much lower than the costs associated with increased peak
frequencies, because sufficient vehicles would be available from the existing fleet. This lower cost and
the likely returns from increased fare revenue would mean that increasing off-peak frequencies offered
better value for money than increasing peak frequencies
There were many examples, especially in Auckland, of adjacent bus and train services that operated on
‘clock face’ timetables (ie operating at the same times in each hour) and with matching headways.
These services could have easily provided very efficient transfers at key parts of a network (eg for the
trip between the airport and the CBD), but timetables had not been prepared in ways to minimise
waiting times.
In these examples, the failure to adjust bus timetables to create an attractive transfer, even though
there have been no practical impediments to doing so, reflected a number of interrelated problems:
an absence of consensus on the design rationale for the public transport system
a lack of clear accountability of the public agency for design of a network
the relative autonomy of the private operators.
Service density requires:
optimal ‘forget-the-timetable’ headways (10 minutes or less) in key travel corridors
integrated timetables outside high-frequency areas
demand-responsive services to supplement scheduled services.
Public transport network planning: a guide to best practice in NZ cities
56
5.4.4 Location and access to stops
Any proposal to change the spacing of bus stops on existing routes would inevitably lead to a negative
reaction from existing users, so this should be part of a wider package of measures transparently
offering a substantial improvement in public transport service quality.
The recent experience in establishing ‘park-and-ride’ facilities on the Auckland Northern Busway
provided a good illustration of the limitations of this means of access to public transport – most
carparks were filled with cars well before the capacity of the buses was reached. Also, even when
Busway stops were located on freeway slip lanes, a long way from any other urban activity, a significant
number of passengers still arrived on foot.
From our brief observations during this project, the bus interchanges on the Northern Busway
appeared to be designed to enable easy transfers, with only short walking distances and adequate
directional signage.
5.4.5 Marketing the network
As discussed earlier, the unique information and branding associated with Auckland’s Link Bus inner-
city orbital line appeared to be a significant factor in its relative success. Information and marketing
were also probably important factors in the positive record achieved by the Christchurch Orbiter and
Metrostar.
In general, the highest priority should be given to bus livery and signage that reinforces public
understanding of the bus route and its place in the overall public transport network. We noticed that
Location of stops:
To optimise travel speeds without creating excessive walking times, stop locations should be
carefully planned to minimise the number of stops, and to ensure their optimal location in
relation to major trip attractors, intersecting lines and pedestrian accessways.
Stops located in car-free precincts close to important destinations give public transport a
significant competitive advantage.
Access to stops:
While ‘park-and-ride’ will remain an essential means of access to major public transport lines
in outer suburban areas, there are clear limits to this option because parking is a low-value
and alienating use of premium land. To cater for long-term growth in patronage, passengers
should be able to walk, cycle, or use feeder bus services to reach public transport ‘trunk’
services.
In a well-designed interchange, walking distances between services should be very short –
preferably no more than 10 metres.
A simple line structure makes it easy to understand, market and use public transport.
Information in maps, on-line materials, vehicle livery and on-board displays should reinforce
public understanding of the line structure and transfer opportunities.

5 The potential for improved network planning in New Zealand
57
advertising that simply aimed to bring the operators a small financial gain could entirely obscure the
fact that a particular bus was part of the city fleet.
An example of combining useful public transport information with marketing in Christchurch would be
the provision of a schematic map of the core radial and orbital bus routes. This map could easily be
updated and expanded as other bus routes were re-designed and upgraded as part of a network-
planning exercise.
Public transport network planning: a guide to best practice in NZ cities
58
6 The policy environment for network planning
There is potential for the improvements to network planning for public transport in New Zealand cities
to be enhanced by supportive policies and practices across the whole transport and land-use planning
system. This chapter discusses the current transport policy environments in Auckland, Wellington and
Christchurch.
6.1 Land-use planning and public transport network planning
In Auckland, the relationship between planning decisions and the public transport network has been
captured in three main documents: the Auckland Urban Design Framework (ACC 2007), the Auckland
Growth Management Strategy (ACC 2003) and its evaluation in Growing smarter (ACC 2007).
The Auckland Growth Management Strategy stressed the value of building a compact city, with growth
focused on increasing the density of development around town centres to support passenger transport
services, which in turn would support a growing population.
This was echoed in the Auckland Urban Design Framework, which saw urban design’s main
contribution to sustainability as promoting higher-density, quality, compact, mixed-use communities
‘served by better public transport, which will reduce the need to travel long distances’ (p7). Two urban
design objectives in the Framework stressed the relationship between land use and public transport:
Objective 2.1 sought to promote increased density and intensity of land use in and around urban
centres ‘and along major public transportation corridors’ (p17).
Objective 3.1 advocated improvements in public transport provision to ‘improve connections and
choice, and help to regain public space’ (p19).
However, the evaluation of the Auckland Growth Management Strategy noted that ‘the opportunities to
demonstrate high-quality urban design and sustainable building, to support key centres, and to
provide enhanced community access (by foot or public transport) remain a challenge’ (p97).
In Wellington, GW’s Regional Strategy has provided land-use planning guidance and coordination at the
regional level and below, with the Strategy being given effect through the Regional Policy Statement
and Regional Land Transport Strategy. Greater Wellington has a long history of integrating transport
and land use, with its linear development corridors following rail lines. The 2009 Proposed Regional
Policy Statement for the Wellington region sought to reinforce this pattern and restrain scattered
development.
Wellington City Council's 2006 Urban Development Strategy aimed to contain urban development
within the established edges of the city, to minimise transport distances and make public transport
more viable by providing sufficient people and activities to support public transport (p7).
The 2008 Canterbury Regional Land Transport Strategy (ECan 2008) supported the provision of new
housing primarily within, or adjacent to, existing urban areas that were highly accessible by public
transport, cycling or walking (p48). The document identified higher-density housing as providing more
potential for increased patronage and therefore reduced service costs, meaning frequency could be
improved, making public transport services more attractive. The strategy aimed to ‘future proof’
subdivisions by making them supportive of public transport (p109). Likewise, the 2007 Greater
6 The policy environment for network planning
59
Christchurch Urban Development Strategy and Action Plan (CCC 2007) sought to integrate land-use
development with transport planning, to minimise the need to travel and to support sustainable travel
such as public transport (p118).
Across the three cities, it could be concluded that regional land-use planning has increasingly
recognised the need to promote transit-supportive urban forms, in particular by discouraging
scattered and very low-density development. Such policies would make it easier to upgrade public
transport through network planning.
6.2 Restraints on car access to the CBD: parking, environment for pedestrians
According to the 2005 Auckland City District Plan – Central Area section:
long-term parking within the CBD would be constrained at existing levels, to keep traffic volumes
within the capacity of the arterial road network feeding the central area
privately supplied short-stay parking would be encouraged in appropriate Central Area locations
further tightening of constraints on long-stay parking would only take place within the context of a
regional parking policy and significant passenger transport improvements (Auckland City – Central
Area Parking Policy 1999).
However, the Auckland City Council also aimed to provide high-quality walking connections to and
between destinations within the CBD, including passenger transport stops and stations. Conflicts
between pedestrians and vehicles would be removed by infrastructure such as overbridges, and by
exploring opportunities to provide pedestrian links between the CBD and the surrounding suburbs
(Auckland City District Plan – Central Area Access Strategy 1999).
In Wellington, the City Council’s 2007 Parking Policy noted that the city had a high level of provision
for parking, when compared with other cities of similar size (p2), but claimed to have limited influence
on the total parking system because most of the off-street parking was not owned or managed by the
Council. However, the Council stated that demand for parking should be influenced by facilitating
‘sustainable transport solutions, such as public transport, walking and cycling’ (p6). In this context, the
so-called ‘Golden Mile’ along Lambton Quay could be a corridor for sustainable transport that would
support its place as the city’s key retail and commercial sector (p10).
The 2003 Christchurch Parking Strategy (CCC 2003) made it clear that parking should be considered
within the broad context of providing a sustainable and safe transport system for the city (p9). In
particular, Policy 4H aimed to ensure that parking did not adversely affect cycling or pedestrian activity,
and that cyclists’ and pedestrians’ needs for road space were given priority over on-street parking
(p11). Policy 4I aimed to ensure that the public transport system had priority over on-street parking
regarding road space, and that parking spaces could be removed to ensure safe and efficient access for
buses and taxis (p11).
In addition, the 2008 Christchurch Sustainable Energy Strategy proposed to use the precedent set by
the Swedish city, Malmo, to support the use of fuel-efficient vehicles (eg hybrid and electric cars) by
providing free parking spaces for them around the city.
In general, the parking policies for the three New Zealand cities have been less supportive of public
transport than policies relating to regional land use and population density. Although there have been
tentative suggestions of limits on long-stay parking, all three cities have continued to encourage the

Public transport network planning: a guide to best practice in NZ cities
60
expansion of short-stay parking, on the assumption that public transport was only really competitive
for peak-period work trips. This view has underestimated the critical role that high-quality, networked
public transport could play in securing the economic vitality of city centres, by transporting shoppers
and visitors, not just workers.
6.3 Processes for assessment under development planning laws
The 2007 national Integrated Approach to Planning (IAP) noted that separated funding systems for
public transport and infrastructure did not always promote integration (p5). Land-use planning and
urban design could be used to facilitate easy access to public transport, walking and cycling. This
would require:
strong national and regional transport and land-use support
implementation by district councils at the time of development
ongoing support and management by regional councils, in the form of interagency agreements
such as long-term council community plans (p18).
The IAP concluded that a ‘national vision … for integrated land use and transport is needed’ (p28),
such as a national policy statement to provide guidance, strengthen responses and reduce bad
practice. The IAP also argued that this national vision would require a leadership role from both the
Ministry for the Environment and the Ministry of Transport (p28). Furthermore, it suggested that
regional councils would need to deal with cross-boundary issues in a more effective manner because
‘individual cities are too small to properly integrate transport and land use’ (p29). It noted that there
was no monitoring, that no performance indicators existed to determine whether goals and targets
were being met, and there was little enforcement or use of rewards for good practice (p29).
ARTA’s 2007 Guidance for achieving multi-modal developments suggested that:
For any development that is located where significant public transport infrastructure and
routes is or will be established, it is expected that the public transport mode share will be
higher than the regional average, particularly during peak commuter periods (p58).
While the process of making integrated assessments is still in its infancy, we believe that it has the
potential to work in favour of improved public transport planning and provision.
6.4 Responses to patronage growth related to petrol price rises
According to the Ministry for the Environment, the recent rise in transport fuel prices peaked in July
2008 and led to the following drop in total vehicle kilometres travelled (VKT), reductions in traffic
volumes, and changes in use of public transport:
In Auckland, average rail patronage for the 12 months to July 2008 increased by 20%. Train
passenger numbers in July 2008 were 32% higher than in July 2007.
Average boardings for Auckland buses increased by 3.5% in the 12 months to July 2008. The
opening of the Northern Busway in February 2008 encouraged significant numbers of people to
switch to public transport, which was the main factor responsible for a 6% drop in traffic volume on
the Auckland Harbour Bridge in 2008.
6 The policy environment for network planning
61
In Wellington, train patronage increased by 3.4% in the 12 months to June 2008, and bus
patronage increased by 0.7%.
National traffic volumes were down by 7.5% in August 2008 compared with the previous year.
Nationally, there was a 4% growth in public transport boardings for the year to June 2008
compared with the previous year.
(http://www.mfe.govt.nz/environmental-reporting/transport/vehicle-km-travelled/total-
vkt/case-study.html)
In 2008, an ARTA media release (20 August) stated that:
While we welcome the increase in patronage and had planned for growth, the additional
demand we are now seeing due to petrol price increases has meant some operational
challenges for us and our operator Veolia.
Since then, ARTA’s monthly business reports have continued to report increased patronage eg 20.6%
(830,747 boardings) higher in March 2009 than in March 2008 (ARTA 2009).
6.5 Current priorities
The 2008 New Zealand Transport Strategy had a goal of increasing the use of public transport to 7% of
all trips by 2040, from 111 million boardings in 2006/7 to more than 525 million boardings by 2040
(p54). The Strategy also suggested that the effects of congestion on Auckland’s economic potential
were costing the national economy $750–$900 million per annum. It held that a focus on continuing to
improve public transport (with developments such as the Northern Busway and upgrading the
metropolitan rail network, including electrification) and managing travel demand would ‘help address
congestion and contribute to improving the competitiveness of Auckland as an international hub and
world-class city’ (p57).
Evidence was cited that the agglomeration effects of concentrated economic activity would generate
more economic growth, and that agglomeration could be supported by integrating land-use and
transport planning (p57).
However, the amended 2009 Government policy statement on land transport funding showed a change
in priorities, due in part to the global financial crisis. It stated that the:
GPS closely reflects the modal choices that are realistically available to New Zealanders.
Approximately … 84% of people go to work by car, truck or motorbike, so we need good
roads to move freight and people. The government supports some mode shift over time,
especially in our major cities of Wellington, Auckland and Christchurch, but considers that
this should not be accelerated to the point where outcomes are economically inefficient
(p1).
This shift in priorities poses a challenge for public transport, but one that can be met. As indicated in
the earlier sections of this report, network planning is designed to improve both services and
efficiency, by raising occupancy levels and serving a wider array of trips. And networked public
transport can promote urban economic growth not just by alleviating peak-period traffic congestion,
but also by supporting the growth of strong central business districts and subcentres.
Public transport network planning: a guide to best practice in NZ cities
62
6.6 Conclusion
Public transport in New Zealand’s major cities has benefited from supportive regional and local land-
use planning policies, something that has not necessarily been the case in other countries. Many cities
in North America and even Europe have lacked effective regional planning structures and policies, as
the European Environment Agency noted in its report Urban sprawl in Europe: the ignored challenge
(EEA 2006). At the time of writing, the Australian city-region of Brisbane had a metropolitan density
only half that of New Zealand cities, owing to a long history of weak regional planning. Vancouver was
less densely populated than Auckland and Wellington (see table 3.1), and while Zurich’s population
density was higher, its metropolitan area also had increasing problems with scattered semi-rural fringe
development.
We found that New Zealand’s policies on car parking were less public transport-friendly than those for
our international comparator cities. In part, this reflected past attitudes that treated public transport as
a back-up mode to the car, mainly for peak-period commuters. The challenge for the future is to
integrate parking and public transport policies so that it is feasible to reduce parking requirements in
centres as improved public transport alternatives became available.
Overall, this research has made it clear that there is considerable potential to improve public transport
at an affordable cost and in ways that can contribute to the New Zealand government’s strong
economic growth agenda.
7 Conclusions
63
7 Conclusions
There is clear evidence that the network-planning approach to public transport service provision has
produced impressive results in many European and North American cities. Patronage levels have grown
considerably, while efficiency in the use of the public subsidy required by public transport operators
has improved.
Three overseas comparator cities, approximately comparable in terms of urban form, demographics
and public transport infrastructure, were selected to illustrate some best-practice examples of public
transport service design that improved patronage levels and efficiency in the use of resources.
These comparisons have shown that New Zealand’s three largest urban regions have considerable
potential to build on the increases in public transport patronage and mode share that have been
achieved during the last decade. Encouragingly, the greatest potential for improvement seems to lie
with ‘non-traditional’ trip types, which could be accommodated without imposing commensurate
increases in capital and operating costs.
We noted that the current situation regarding public transport operating practices in Auckland,
Wellington and Christchurch reflected the broad history of decisions made in transport planning in
each city over recent decades. Because of its smaller size and relative coherence in the institutional
history of public transport service planning and delivery, Christchurch had been able to develop or
preserve a number of important features of the network-planning approach, most notably a ticketing
system that did not penalise passengers who made transfers. Its cross-town ‘Orbiter’ line, introduced
in 2000 at the same time as common bus liveries and the unifying ‘Metro’ brand, had achieved a level
of transfers that exceeded the expectations of local planners. However, in both Auckland and
Wellington, we found that the ability of private operators to run ‘commercial’ services at will had
hampered efforts to coordinate services and had allowed perverse competition between different public
transport modes to continue. In Auckland, particularly, obvious opportunities to significantly reduce
journey times through better coordination of rail and bus timetables had been overlooked.
Practical experience in the international comparator cities and elsewhere suggests three key areas of
change that could improve public transport service planning in New Zealand cities.
1 Appropriate institutions and public processes:
Establish a public agency to plan the network across the whole urban region.
Redirect competition between private companies to the production of best-value tenders for
the delivery of part, or all, of a publicly planned system.
Use well-designed public education and consultation programmes to manage changes.
Provide a simple fare system that avoids the imposition of penalties for transfers.
2 Network structure:
Provide a simple and stable network of lines throughout the day.
Base mode choice for different lines in the network on required capacity, comfort and speed.
Consider locations for suburban interchanges on the basis of predicted travel patterns and
efficient vehicle operations.
Public transport network planning: a guide to best practice in NZ cities
64
3 Network operations
Simplicity and directness:
- Organise the network on the principle of ‘one section – one line’.
- Avoid deviations in the physical routes chosen for bus services.
- Provide pendulum lines through key activity centres and interchanges.
Speed and reliability:
- Aim for travel speeds comparable to, or faster than, door-to-door travel times that can be
achieved by car.
- Provide on-road signal and traffic-lane priority to allow buses to meet connections.
- Aim to have vehicles stopping only as required to pick up and drop off passengers.
Frequency:
- Establish ‘forget-the-timetable’ headways (10 minutes or less) in key travel corridors.
- Set up integrated timetables outside high-frequency areas.
Location of stops and access to services:
- Carefully plan the location of stops to minimise the number of stops and ensure their
optimal location in relation to major trip attractors, intersecting lines and pedestrian
accessways.
- Locate stops in car-free precincts close to important destinations, to give public transport
a significant competitive advantage.
- Change current access to ‘trunk’ services from ‘park-and-ride’ facilities to access by
walking, bicycle, or feeder bus, in order to cater for long-term growth in patronage.
- Ensure that walking distances between services in interchanges are very short: preferably
no more than 10 metres.
Marketing for first-time and occasional users:
- Create a simple line structure that makes the network easy to understand.
- Use maps, on-line information, vehicle livery and on-board displays to reinforce
understanding of the line layout and transfer opportunities.
While regional land-use planning in New Zealand cities has been increasingly recognising the need to
promote transit-supportive urban forms, in particular by discouraging scattered and very low-density
development, these policies cannot, on their own, ensure that public transport will improve. However,
when coupled with the network approach to the design and delivery of public transport service,
important gains could be made.
Although further research is needed to quantify the specific benefits, it is clear from the directions
outlined in this report that considerable potential exists to improve public transport at an affordable
cost and in ways that can significantly contribute to the government’s strong economic growth agenda.
8 Recommendations
65
8 Recommendations
The research undertaken for this project has confirmed that considerable potential exists to adopt
international best practices in public transport network planning in Auckland, Wellington and
Christchurch to:
• improve the cost effectiveness of local public transport
• accelerate current trends in growth in patronage
• identify long-term requirements for future capital investment in new rolling stock and
infrastructure.
On this basis, we recommend that:
• public transport agencies and governments direct significant resources to the development of
detailed plans for networked public transport services, to direct future government recurrent and
capital expenditure in public transport
• because the changes to existing services that will be required to implement a robust public
transport network will inevitably result in public controversy, a well-designed and well-resourced
process of public engagement is an essential part of the development of plans for networked
public transport services
• in the development and implementation of such plans, the role of private operators in the design
and delivery of public transport services will require clarification – while there can be operational
efficiencies in having services delivered by private operators, coordination of service patterns and
timetabling is best done by a public agency, which can put out to tender the day-to-day operation
of different components of an over-arching network
• given the central government’s strong focus on economic efficiency and growth, further research
to quantify in more detail the economic benefits of the network approach, and to develop tools for
comparing the efficiency of different network options, would be valuable.
Public transport network planning: a guide to best practice in NZ cities
66
9 References
Abusah, S and C de Bruyn (2007) Getting Auckland on track: public transport and New Zealand’s
economic transformation. Working paper, Ministry of Economic Development, Wellington.
Auckland City Council (ACC) (1999) Central area access strategy. Accessed 23 February 2010.
www.aucklandcity.govt.nz/council/documents/access/summary.asp
Auckland City Council (ACC) (1999) Central area parking policy. Accessed 23 February 2010.
www.aucklandcity.govt.nz/council/documents/parkingpolicy/default.asp
Auckland City Council (ACC) (2003) Growing smarter: an evaluation of the Auckland regional growth
strategy 1999 (technical report). Auckland: Auckland Regional Growth Forum.
Auckland City Council (ACC) (2003) Growth management strategy. Auckland: Auckland City Council.
Auckland City Council (ACC) (2005) Auckland City district plan: central area section. Auckland:
Auckland City Council.
Auckland City Council (ACC) (2007) Designing great places for our people: a framework for achieving
high quality urban design in Auckland. Auckland: Auckland City Council.
Auckland Regional Transport Authority (ARTA) (2007) ARTA guidance note for achieving multi-modal
developments: May 2007. Supplementary document two in Integrated transport assessment:
guidelines & supplementary documents. Auckland: Auckland Regional Transport Authority.
Auckland Regional Transport Authority (ARTA) (2008) Annual report 2008. Auckland: Auckland
Regional Transport Authority.
Auckland Regional Transport Authority (ARTA) (2008) Annual patronage figures show shift to public
transport (media release 20 August). Accessed 24 February 2010.
www.arta.co.nz/newsroom/media-releases.html?releaseid=dd675001-f206-b719-3d33-
d9dc5f5eb46a%5D
Auckland Regional Transport Authority (ARTA) (2009) Monthly business report. Auckland: ARTA.
Bachels, M, P Newman and J Kenworthy (1999) Indicators of urban transport efficiency in
New Zealand’s main cities. Perth: Institute for Sustainability and Technology Policy (ISTP), Murdoch
University.
Christchurch City Council (CCC) (2003) Parking strategy. Christchurch: Christchurch City Council.
Christchurch City Council (CCC) (2008) Sustainable energy strategy for Christchurch 2008–2018.
Christchurch: Christchurch City Council.
Christchurch City Council, Environment Canterbury, Transit NZ, Selwyn District Council and Waimakariri
District Council (2007) Greater Christchurch urban development strategy and action plan 2007.
Christchurch.
Environment Canterbury (ECan) (2008) Canterbury regional land transport strategy 2008–2018.
Christchurch: Environment Canterbury.
European Environment Agency (EEA) (2006) Urban sprawl in Europe: the ignored challenge. EEA Report
no. 10/2006. 60pp.
Government of New Zealand (2009) Government policy statement on land transport funding 2009/10–
2018/19. Wellington.
9 References
67
Greater Wellington Regional Council (GW) (2007) Wellington regional land transport strategy 2007–2016. Wellington: Greater Wellington Regional Council.
Greater Wellington Regional Council (GW) (2008) Metlink News. Accessed 15 May 2009. www.metlink.org.nz/assets/Home-Page/Publications/Metlink-News-November-2008.pdf
Greater Wellington Regional Council (GW) (2009) Proposed regional policy statement. Wellington: Greater Wellington Regional Council.
IBI Group (2003) 98 B-line rapid transit evaluation study. Ottawa: Transport Canada.
Kenworthy, J and F Laube (2001) The millennium cities database for sustainable transport. Brussels:
UITP.
Land Transport Authority of Singapore (2008) Land transport master plan: a people-centred land
transport system. Singapore: Land Transport Authority of Singapore.
Martinovich, P (2009) Application of a commuter railway to low density settlement. Canberra: Bureau of
Transport and Regional Economics colloquium.
Mees, P (2000) A very public solution: transport in the dispersed city. Melbourne: Melbourne University
Press.
Mees, P (2010) Transport for suburbia: beyond the automobile age. London: Earthscan Ltd.
Ministry for the Environment (MfE 2009) Are fuel prices changing the way we travel? Accessed 24 February 2010. www.mfe.govt.nz/environmental-reporting/transport/vehicle-km-travelled/total-vkt/case-study.html
Ministry of Transport (MoT) (2008) New Zealand transport strategy. Wellington: NZ Government.
Ministry of Transport (MoT) (2009) Government policy statement on land transport funding 2009/10–2018/19. Wellington: NZ Government.
Ministry of Transport (MoT) (2009) Statement of intent 2009–2012. Wellington: Ministry of Transport.
New Zealand Government (2007) Better integration of land use and transport: integrated approach to planning phase 1 report (draft). Wellington: Transport Sector Strategic Directions Document 2006–09.
Nielsen, G. 2005. HiTrans best practice guide 2: public transport – planning the networks. Stavanger, Norway: European Union, Interreg IIIB. 176pp.
Stone, J (2009) Contrasts in reform: how the Cain and Burke years shaped public transport in
Melbourne and Perth. Urban Policy and Research 27, no.4: 419–434.
Thompson, G and T Matoff (2003) Keeping up with the Joneses: radial vs. multidestinational transit in
decentralizing regions. Journal of the American Planning Association 69, no.3: 296–312.
Translink (2005) Vancouver-UBC Transit Plan, ridership statistics appendix. Vancouver: Translink.
Verkehrsbetriebe Schaffhausen (2008) Annual report 2007 [in German]. Schaffhausen.
Vuchic, VR (1999) Transportation for livable cities. New Brunswick, NJ: Rutgers University Press.
Wellington City Council (WCC) (2006) Urban development strategy. Wellington: Wellington City Council.
Wellington City Council (WCC) (2007) Wellington City Council parking policy. Wellington: Wellington
City Council.
Zurcher Verkehrsverbund (ZVV) (2008) Annual report for 2007 [in German]. Zurich.
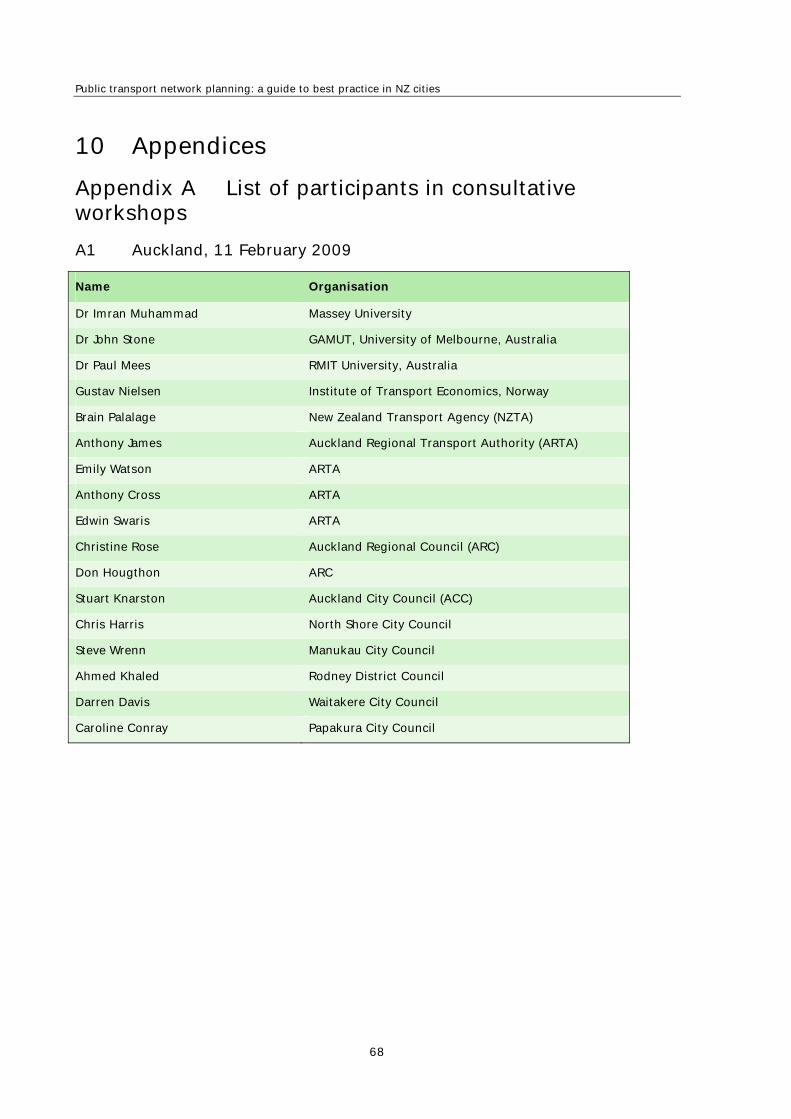
Public transport network planning: a guide to best practice in NZ cities
68
10 Appendices
Appendix A List of participants in consultative workshops
A1 Auckland, 11 February 2009
Name Organisation
Dr Imran Muhammad Massey University
Dr John Stone GAMUT, University of Melbourne, Australia
Dr Paul Mees RMIT University, Australia
Gustav Nielsen Institute of Transport Economics, Norway
Brain Palalage New Zealand Transport Agency (NZTA)
Anthony James Auckland Regional Transport Authority (ARTA)
Emily Watson ARTA
Anthony Cross ARTA
Edwin Swaris ARTA
Christine Rose Auckland Regional Council (ARC)
Don Hougthon ARC
Stuart Knarston Auckland City Council (ACC)
Chris Harris North Shore City Council
Steve Wrenn Manukau City Council
Ahmed Khaled Rodney District Council
Darren Davis Waitakere City Council
Caroline Conray Papakura City Council

10 Appendices
69
A2 Wellington, 17 February 2009
Name Organisation
Dr Imran Muhammad Massey University
Dr John Stone GAMUT, University of Melbourne, Australia
Gustav Nielsen Institute of Transport Economics, Norway
Jeremy Traylen New Zealand Transport Agency (NZTA)
Deborah Hume NZTA
Brian Baxter Greater Wellington Regional Council (GW)
Doug Weir GW
Adam Lawrence GW
Natasha Hayes GW – Transport Strategy
Victoria McGregor GW – Wellington Regional Strategy Office
Joe Hewitt GW
Mike Vincent GW
Wayne Hastie GW
Angus Gabara GW
David Lewry GW
Paul Bruce GW
Steve Spence Wellington City Council (WCC)
Luke Troy WCC
Paul Kos WCC
Stephen Hawte WCC
Ian Bainghen NZBUS
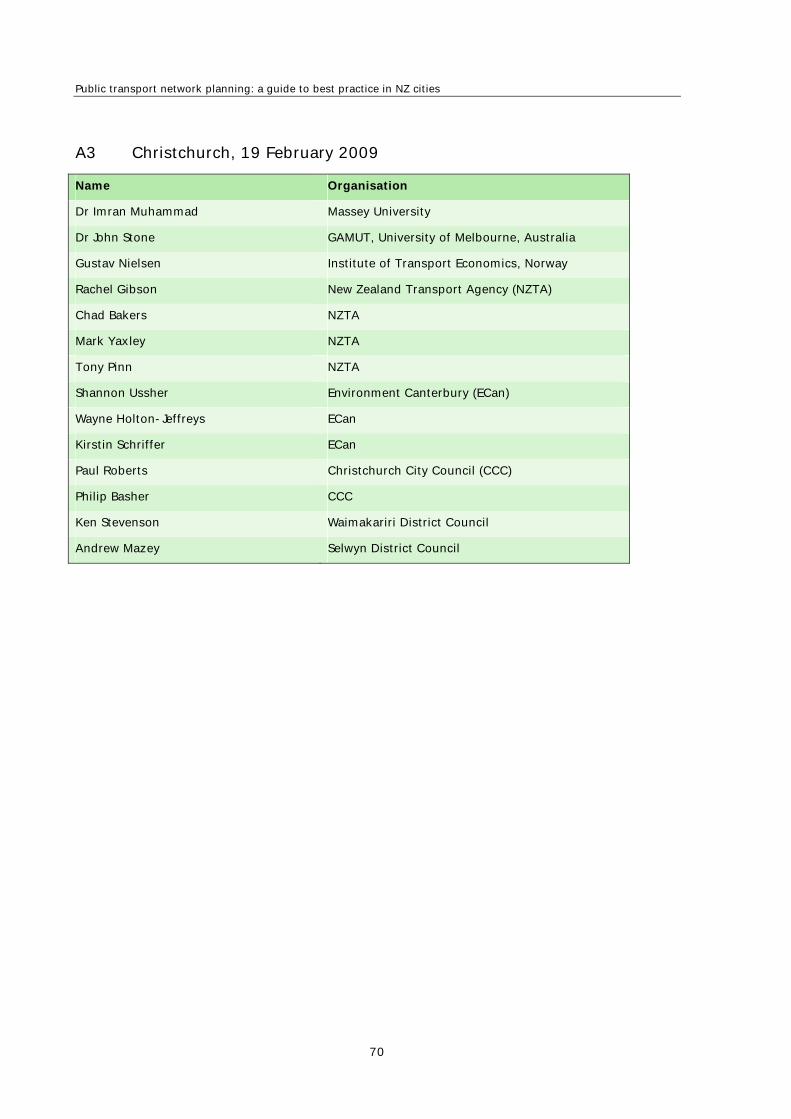
Public transport network planning: a guide to best practice in NZ cities
70
A3 Christchurch, 19 February 2009
Name Organisation
Dr Imran Muhammad Massey University
Dr John Stone GAMUT, University of Melbourne, Australia
Gustav Nielsen Institute of Transport Economics, Norway
Rachel Gibson New Zealand Transport Agency (NZTA)
Chad Bakers NZTA
Mark Yaxley NZTA
Tony Pinn NZTA
Shannon Ussher Environment Canterbury (ECan)
Wayne Holton-Jeffreys ECan
Kirstin Schriffer ECan
Paul Roberts Christchurch City Council (CCC)
Philip Basher CCC
Ken Stevenson Waimakariri District Council
Andrew Mazey Selwyn District Council
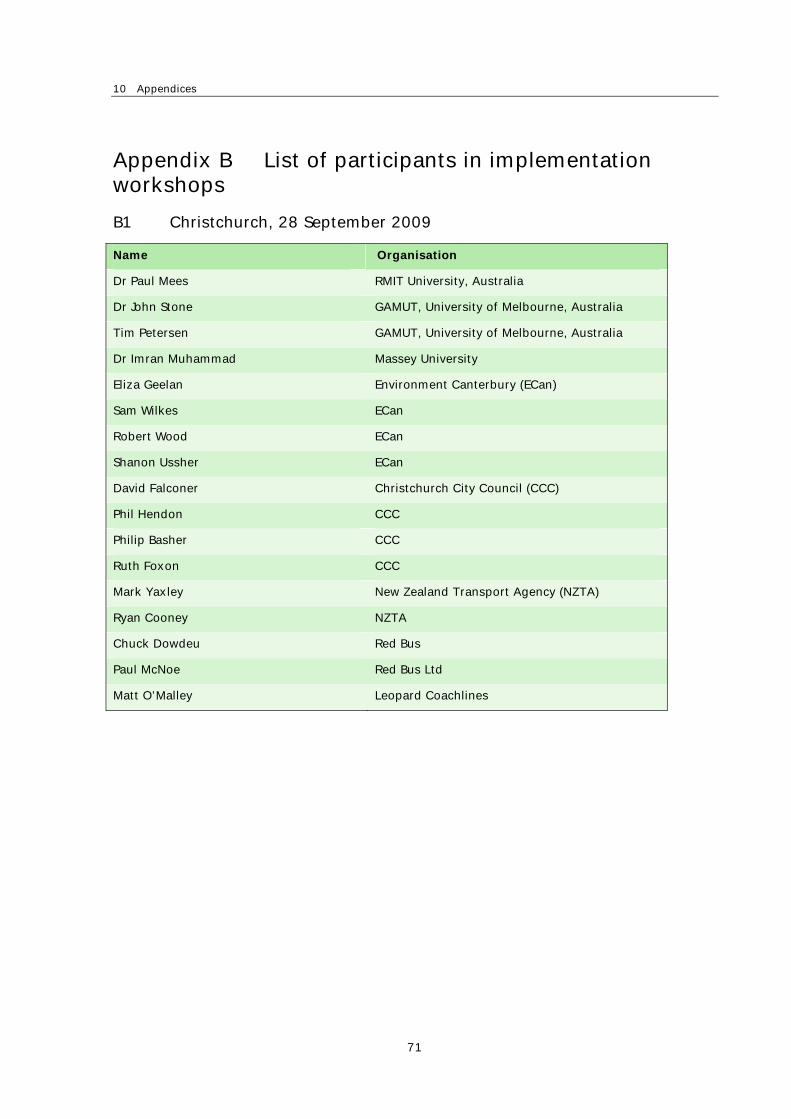
10 Appendices
71
Appendix B List of participants in implementation workshops
B1 Christchurch, 28 September 2009
Name Organisation
Dr Paul Mees RMIT University, Australia
Dr John Stone GAMUT, University of Melbourne, Australia
Tim Petersen GAMUT, University of Melbourne, Australia
Dr Imran Muhammad Massey University
Eliza Geelan Environment Canterbury (ECan)
Sam Wilkes ECan
Robert Wood ECan
Shanon Ussher ECan
David Falconer Christchurch City Council (CCC)
Phil Hendon CCC
Philip Basher CCC
Ruth Foxon CCC
Mark Yaxley New Zealand Transport Agency (NZTA)
Ryan Cooney NZTA
Chuck Dowdeu Red Bus
Paul McNoe Red Bus Ltd
Matt O’Malley Leopard Coachlines
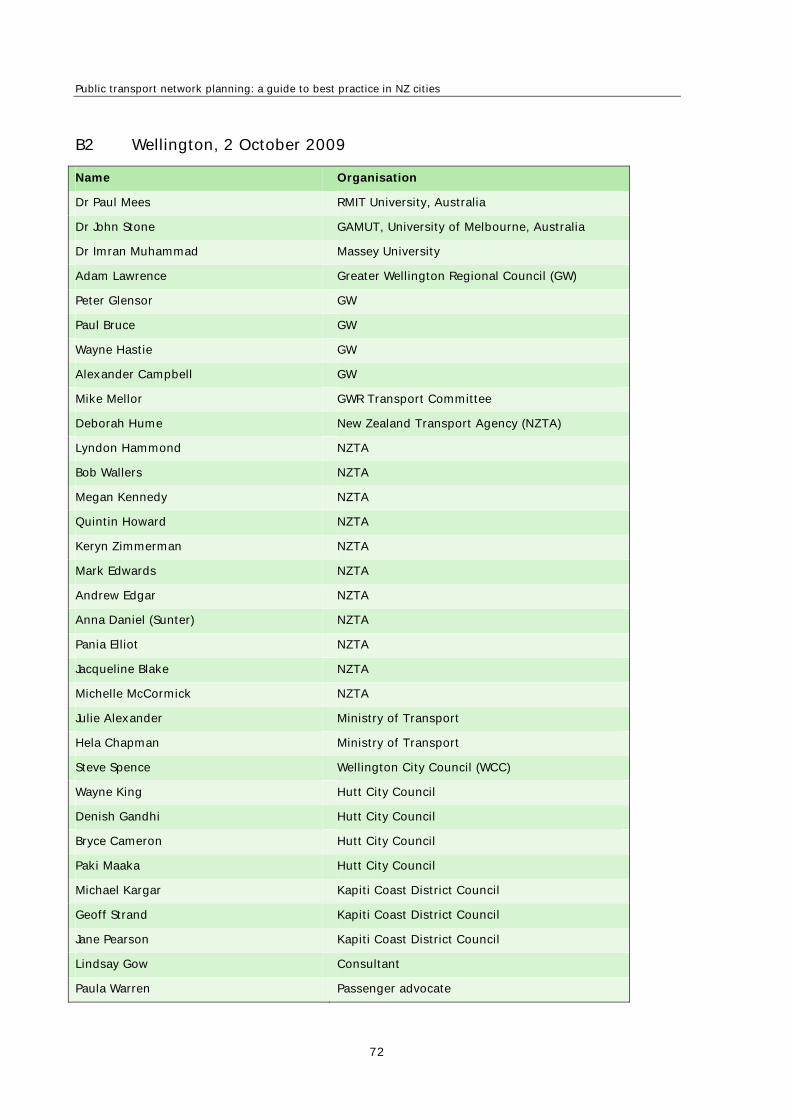
Public transport network planning: a guide to best practice in NZ cities
72
B2 Wellington, 2 October 2009
Name Organisation
Dr Paul Mees RMIT University, Australia
Dr John Stone GAMUT, University of Melbourne, Australia
Dr Imran Muhammad Massey University
Adam Lawrence Greater Wellington Regional Council (GW)
Peter Glensor GW
Paul Bruce GW
Wayne Hastie GW
Alexander Campbell GW
Mike Mellor GWR Transport Committee
Deborah Hume New Zealand Transport Agency (NZTA)
Lyndon Hammond NZTA
Bob Wallers NZTA
Megan Kennedy NZTA
Quintin Howard NZTA
Keryn Zimmerman NZTA
Mark Edwards NZTA
Andrew Edgar NZTA
Anna Daniel (Sunter) NZTA
Pania Elliot NZTA
Jacqueline Blake NZTA
Michelle McCormick NZTA
Julie Alexander Ministry of Transport
Hela Chapman Ministry of Transport
Steve Spence Wellington City Council (WCC)
Wayne King Hutt City Council
Denish Gandhi Hutt City Council
Bryce Cameron Hutt City Council
Paki Maaka Hutt City Council
Michael Kargar Kapiti Coast District Council
Geoff Strand Kapiti Coast District Council
Jane Pearson Kapiti Coast District Council
Lindsay Gow Consultant
Paula Warren Passenger advocate

10 Appendices
73