Embed Size (px)
Citation preview
Public Transport Quality Survey
Photographer: Keshav Thapa/CEN
Suman Udas
2012
II
Acknowledgments
This study was conducted by Clean Air Network Nepal (CANN) and Clean Energy Nepal (CEN). The study
would not have been possible without the support of staffs of CEN and CANN. CANN/CEN highly
appreciates the valuable support Mr. Stefan Henkelmann provided throughout the study. Mr.
Henkelmann worked as intern of CANN for the time period of study and was instrumental for analysis of
data. We highly appreciate the support and guidance of Ms. Anjila Manandhar, Network Coordinator of
CANN provided throughout the study.
We would like to acknowledge a number of other individuals for their strong support, varied assistance
and useful suggestions. We would like to acknowledge the surveyors: Ms. Hisila Sujakhu, Mr. Ram
Chandra Subedi, Mr. Sujan Ghimire, Mr. Diwakar Shrestha, Mr. Shankar Prasad Sharma, Ms. Kahani
Bhatta, Ms. Kopila Luitel, Mr. Dipendra Basnet, Mr. Keshar Raj Joshi, Mr. Dhruba Acharya, Ms. Susmita
Dhakal, Ms. Dristy Shrestha and Ms. Anismit Eunal for their valuable contribution. The assistance of Mr.
Zafach Andriato, Ms. Pabitra Basnet, Ms. Sushimita Dhakal and Ms. Dristy Shrestha, for data entry, was
very important and is very much appreciated. Finally, we would like to extend our gratitude to all the
respondents who have provided with their valuable time for the survey.
III
Abstract
Rapid population growth, urban sprawl, and increasing motorization in Kathmandu valley are creating
complexity of traffic congestion, poor public transport system, pedestrian and vehicular conflict, and
poor air quality. In past 10 years, the number of registered vehicles in Kathmandu valley increased 3.75
times to reach 570,145 till 2010/2011. The composition of motorcycle is highest with 73.2% among
registered vehicles in Kathmandu valley followed by car/ jeep/ van with share of 18.5%.1 Public
transport constitutes only 2.5% of total passenger vehicles in Kathmandu valley.
The main objective of public transport user survey was to provide detailed picture of public transport
quality and some elements of travel characteristics. The study is only focused on two type of services i.e.
routes in core city area and outskirts of city area within Kathmandu valley. The survey area comprises of
only traffic centers within the 27 Km ring road of Kathmandu valley. The structured questionnaire
focusing on public transport quality and transport characteristics was designed and administered to
public transport users at survey locations. The total of 420 questionnaire response was received. 379
responses were received through personal interview with respondents and 41 responses were received
from online survey form.
Majority of the trips are destined for workplace and school/college. About 38.64% of trips are destined
to workplace, 34.3% of trips are destined for school/college, 14.90% are destined for business purposes,
7.83% are destined for personal visits and 4.29% of trips are for the purpose of shopping. The top trip
origin area was found to be Koteshwor with 6.54% of passenger originating from the area, followed by
Kalanki with 5.57%. The city core area account for the topmost position with 32.2% passengers destined
for the area. The topmost transit was found to be City Core Area with 29.73% passenger passing through
this transit which is followed by Lagankhel for second most used transit with 22.97% passenger.
The survey shows that there is rise in percentage of people who have to wait for longer than 10 minutes
during evening peak hours compared to morning peak hours. 30.5 % of people wait for longer than 10
minutes during morning peak hour. About 57.7% of passengers were not happy with the total in-vehicle
time while 42.3% were fine with in-vehicle time. Exceedingly long travel time faced by passengers is
more of tendency of transport operators to occupy more passengers than its capacity during trip by
waiting long time in stops, rather than of traffic congestion. About 46% of people think current public
transport as affordable; 50.6% believes it to be expensive while 2.7% feels it to be very expensive. About
53.3% public transport users who believed fare to be expensive were willing to pay minimum of Rs 8 for
0-4 Km and maximum of Rs 15 for above 19 Km for current public transport service.
Comparatively, the occupancy seems to increase during evening peak hours than morning peak hours.
During evening peak hours, 79% of respondents travelling in microbus find mostly passenger standing,
82.3% of passenger in minibus find people standing most of the time, and 45.5% find people in tempo
find passengers mostly standing. The accessibility of public transport during evening/night hours varies
greatly depending on routes and season (winter or summer). About 31% of people find the public
transportation neither frequently nor infrequently accessible; 28.7% find infrequently accessible while
10.8% find it not accessible at all during evening/night hours.
IV
One of indicators for quality of public transport includes comfort during the ride, both in terms of
(seating) space and smooth acceleration/deceleration behavior of driver. Around 34.2% passengers feel
uncomfortable with seating space in public transportation, 6.1% feel very uncomfortable while 34.5%
are neither comfortable nor uncomfortable. When, perception regarding comfort of women and
children with the space in public transport was surveyed, majority about 61.7% of female respondents
were uncomfortable with the space in public transport as it’s overcrowded. Majority of passengers
about 69.1% agreed that the most of the public transport drivers practice reckless driving making travel
uncomfortable. Cleanliness, hygiene and maintenance condition is also of utmost importance and
should be considered for quality public transport. However, 67.3% of passengers find public
transportation unhygienic and ill maintained and 12.4% find it very unhygienic and ill maintained.
68.3% passenger thinks behaviors of some driver/conductors are polite and some are rude, 11.1% feel
they are rude, 10.7% feel they are unresponsive while 3.4% feel driver/conductor being abusive. About
76% of passengers agreed that drivers largely tend to follow rules on presence of traffic officers only
while 16.1% think they do not follow traffic rules at all at any time. One of vital factor determining
quality transport services is reliability, i.e. how dependable is the public transportation for daily usage
such as going to work, school/college, shopping, etc. About 49% of passengers find public transportation
fairly reliable, 24% find it neither reliable nor unreliable, while 19.6% find it fairly unreliable and 5.3%
find it very unreliable. The percentage of people feeling public transport fairly reliable is quiet high than
expected and compared to perception on other parameters such as frequency, fare, seating space, etc
which can be attributed to adjustment made by users to existing public transport service. The opinion
regarding overall experience with the public transport was inquired to passenger to evaluate the rating
of public transport service and 57.6% experienced public transport service to be average, 29.7%
discovered it to be unpleasant while 3.2% experienced it as very unpleasant.
The survey shows current public transport service is unreliable and undependable on different aspects:
in-vehicle time, frequency of service, availability of service during anti-social time, and level of comfort
by overcrowding and recklessness in driving. A primary objective of government should be to ensure
the reliability and comfort of public transport service.
V
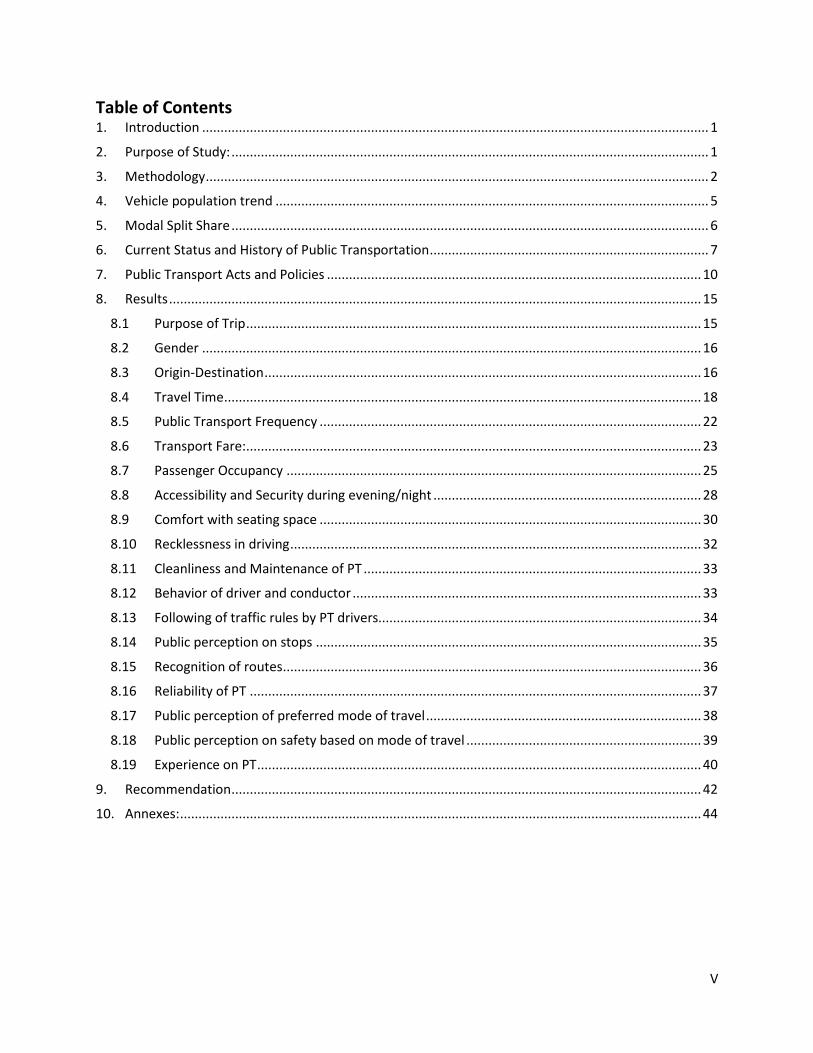
Table of Contents
1. Introduction .......................................................................................................................................... 1
2. Purpose of Study: .................................................................................................................................. 1
3. Methodology ......................................................................................................................................... 2
4. Vehicle population trend ...................................................................................................................... 5
5. Modal Split Share .................................................................................................................................. 6
6. Current Status and History of Public Transportation ............................................................................ 7
7. Public Transport Acts and Policies ...................................................................................................... 10
8. Results ................................................................................................................................................. 15
8.1 Purpose of Trip ............................................................................................................................ 15
8.2 Gender ........................................................................................................................................ 16
8.3 Origin-Destination ....................................................................................................................... 16
8.4 Travel Time .................................................................................................................................. 18
8.5 Public Transport Frequency ........................................................................................................ 22
8.6 Transport Fare: ............................................................................................................................ 23
8.7 Passenger Occupancy ................................................................................................................. 25
8.8 Accessibility and Security during evening/night ......................................................................... 28
8.9 Comfort with seating space ........................................................................................................ 30
8.10 Recklessness in driving ................................................................................................................ 32
8.11 Cleanliness and Maintenance of PT ............................................................................................ 33
8.12 Behavior of driver and conductor ............................................................................................... 33
8.13 Following of traffic rules by PT drivers........................................................................................ 34
8.14 Public perception on stops ......................................................................................................... 35
8.15 Recognition of routes .................................................................................................................. 36
8.16 Reliability of PT ........................................................................................................................... 37
8.17 Public perception of preferred mode of travel ........................................................................... 38
8.18 Public perception on safety based on mode of travel ................................................................ 39
8.19 Experience on PT ......................................................................................................................... 40
9. Recommendation ................................................................................................................................ 42
10. Annexes: .............................................................................................................................................. 44
VI
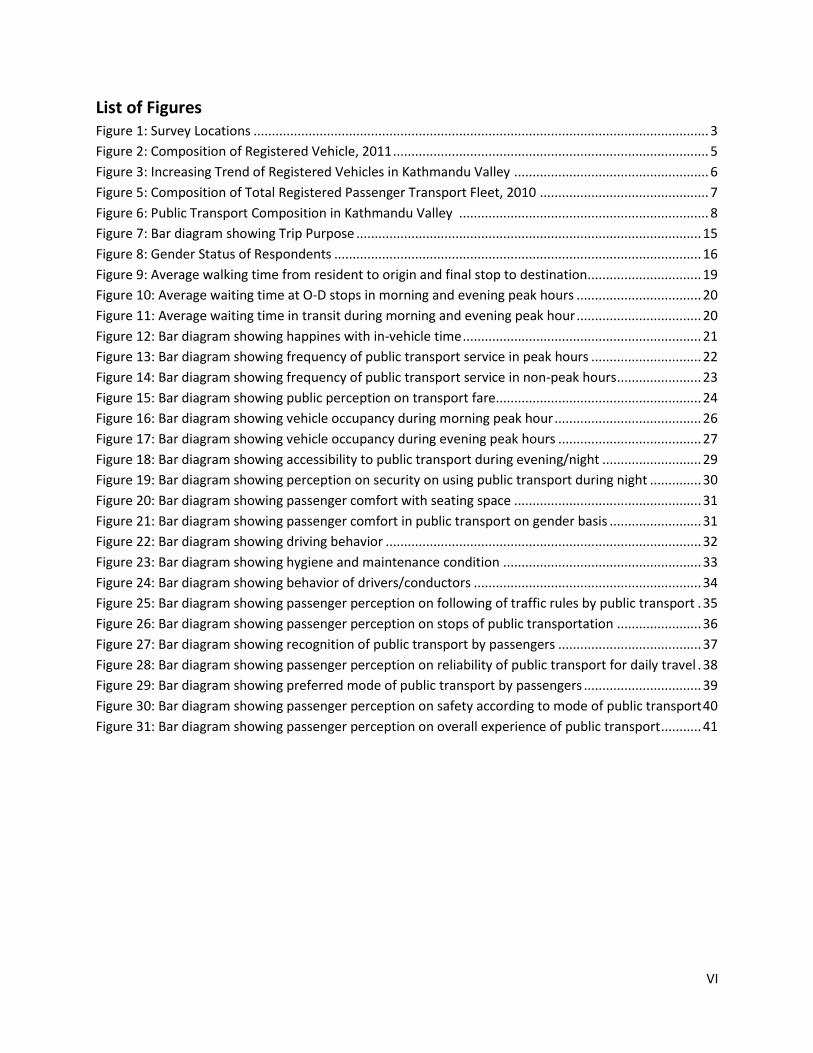
List of Figures Figure 1: Survey Locations ............................................................................................................................ 3
Figure 2: Composition of Registered Vehicle, 2011 ...................................................................................... 5
Figure 3: Increasing Trend of Registered Vehicles in Kathmandu Valley ..................................................... 6
Figure 5: Composition of Total Registered Passenger Transport Fleet, 2010 .............................................. 7
Figure 6: Public Transport Composition in Kathmandu Valley .................................................................... 8
Figure 7: Bar diagram showing Trip Purpose .............................................................................................. 15
Figure 8: Gender Status of Respondents .................................................................................................... 16
Figure 9: Average walking time from resident to origin and final stop to destination............................... 19
Figure 10: Average waiting time at O-D stops in morning and evening peak hours .................................. 20
Figure 11: Average waiting time in transit during morning and evening peak hour .................................. 20
Figure 12: Bar diagram showing happines with in-vehicle time ................................................................. 21
Figure 13: Bar diagram showing frequency of public transport service in peak hours .............................. 22
Figure 14: Bar diagram showing frequency of public transport service in non-peak hours ....................... 23
Figure 15: Bar diagram showing public perception on transport fare........................................................ 24
Figure 16: Bar diagram showing vehicle occupancy during morning peak hour ........................................ 26
Figure 17: Bar diagram showing vehicle occupancy during evening peak hours ....................................... 27
Figure 18: Bar diagram showing accessibility to public transport during evening/night ........................... 29
Figure 19: Bar diagram showing perception on security on using public transport during night .............. 30
Figure 20: Bar diagram showing passenger comfort with seating space ................................................... 31
Figure 21: Bar diagram showing passenger comfort in public transport on gender basis ......................... 31
Figure 22: Bar diagram showing driving behavior ...................................................................................... 32
Figure 23: Bar diagram showing hygiene and maintenance condition ...................................................... 33
Figure 24: Bar diagram showing behavior of drivers/conductors .............................................................. 34
Figure 25: Bar diagram showing passenger perception on following of traffic rules by public transport . 35
Figure 26: Bar diagram showing passenger perception on stops of public transportation ....................... 36
Figure 27: Bar diagram showing recognition of public transport by passengers ....................................... 37
Figure 28: Bar diagram showing passenger perception on reliability of public transport for daily travel . 38
Figure 29: Bar diagram showing preferred mode of public transport by passengers ................................ 39
Figure 30: Bar diagram showing passenger perception on safety according to mode of public transport 40
Figure 31: Bar diagram showing passenger perception on overall experience of public transport ........... 41
VII
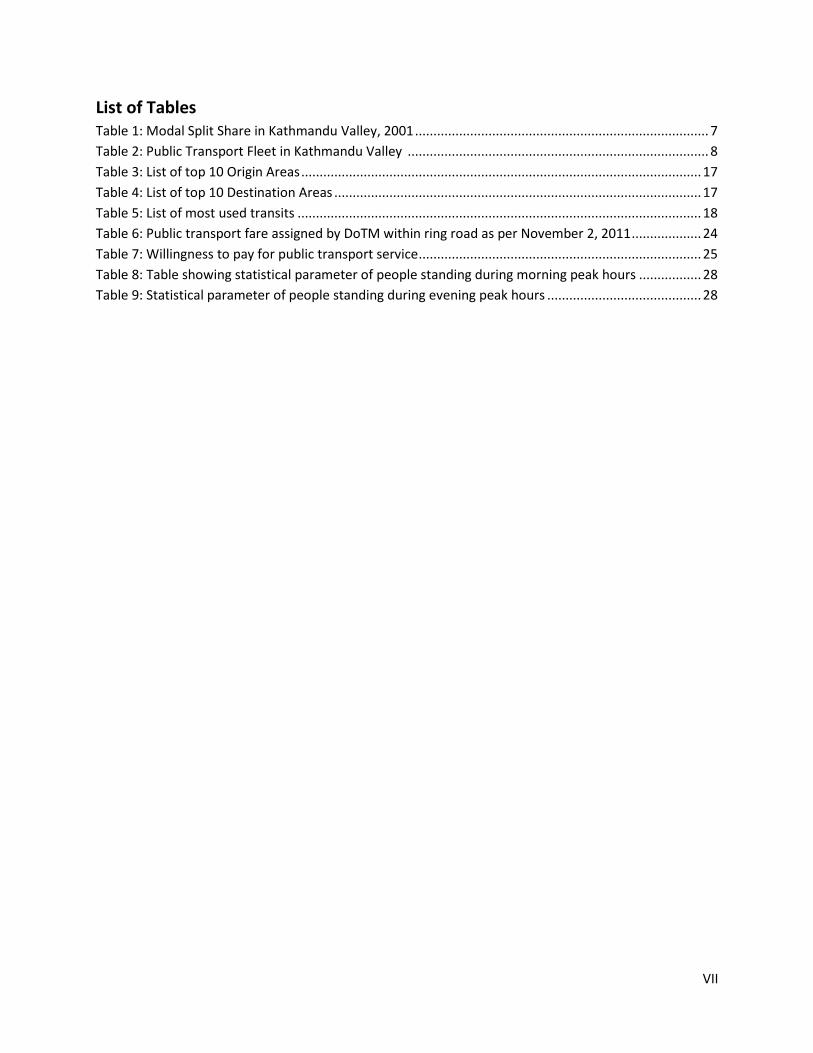
List of Tables Table 1: Modal Split Share in Kathmandu Valley, 2001 ................................................................................ 7
Table 2: Public Transport Fleet in Kathmandu Valley .................................................................................. 8
Table 3: List of top 10 Origin Areas ............................................................................................................. 17
Table 4: List of top 10 Destination Areas .................................................................................................... 17
Table 5: List of most used transits .............................................................................................................. 18
Table 6: Public transport fare assigned by DoTM within ring road as per November 2, 2011 ................... 24
Table 7: Willingness to pay for public transport service ............................................................................. 25
Table 8: Table showing statistical parameter of people standing during morning peak hours ................. 28
Table 9: Statistical parameter of people standing during evening peak hours .......................................... 28
VIII
List of Abbreviations
ADB Asian Development Bank
DoTM Department of Transport Management
GHG Greenhouse Gas
KMC Kathmandu Metropolitan City
KSUT Kathmandu Sustainable Urban Transport
LPG Liquid Petroleum Gas
MoPPW Ministry of Physical Planning and Works
PT Public Transport
1
1. Introduction
Rapid population growth, urban sprawl, and increasing motorization in Kathmandu valley are creating
complexity of traffic congestion, poor public transport system, pedestrian and vehicular conflict, and
poor air quality. Local public transport in the Kathmandu valley includes micro bus, minibuses, tempos,
bus, rickshaws and taxis with and without meters.
There is increasing trend of private vehicles on the streets of Kathmandu. Public transportation such as
micro buses, minibuses and buses are normally very crowded, comparatively expensive, and
uncomfortable to stand as well as to sit in. The public transport does not have well defined travel time
schedule and proper bus stops. These factors are prompting the public to opt for private transport.
Reliability of public transportation is falling day by day. The level of dissatisfaction with public transport
is very high. It is essential to develop a system now so that the public is encouraged to use public
transport. From user’s perspective, four factors are vital in determining public satisfaction from
transport services: Time, cost, dependability or predictability, and comfortable service. In order to
address public demand of reliable public transport, The key urban transport requirements for planners
perspective in Kathmandu valley are management of travel demand by modes of transport along with
fair allocation of road space, in favor of pedestrians and public transport; an upgraded public transport
network and facilities with improved operations and enhance traffic management. However it is
essential to follow low carbon development path while fulfilling and managing the transport demand.
So, the promotion of low-carbon vehicles needs to be under priority for sustainable transport
development.
2. Purpose of Study:
The purpose of Public Transport user survey was to provide detailed picture of public transport quality.
Common indicators of public transport quality include:
availability of service nearby the locations of initial origin and final destination
Waiting time
In-vehicle time which must be short without any loss of time
Comfort during the ride both in terms of seating space and passenger occupancy, and
smooth acceleration/deceleration behavior of the vehicle’s driver
Goodwill behavior from driver and conductor
Feeling of safety(emulated by the drivers’ behavior) and
Security(i.e. no threats or intimidation from third parties)during trip specially in night time
Ease of boarding and leaving the PT vehicle
Availability of frequent service during evening/night time
The survey also intended to include elements of travel pattern i.e. trip origin and destination and mode
of choices. The study was also focused on the review of existing acts, policies and institutional
arrangement with respect to existing public transport system.
2
3. Methodology
Survey Area:
Broadly there are three categories of routes in Kathmandu valley. First one may be referred as “core city
services” which largely operate within the built up area of Kathmandu, generally within 27 Km ring road.
The second type of service may be referred as “valley service” which are potentially services of up to 60
minutes in length travelling beyond the built up area to towns and villages mostly within the Kathmandu
valley such as Bhaktapur, Nagarkot, Tokha, Budhanilkantha, Dakshinkali, Khokhana, lubu, Lele, Kirtipur,
Thankot, etc. The third type of service are long distance services to towns and villages throughout Nepal
and majority of this services do not penetrate within the ring road using Balaju Bus Park Terminal and
Kalanki on the north-western section of ring road. However a number of these types of services to
destinations such as Tatopani, Banepa, Jiri (mostly routes of Araniko Highway) use the old bus park in
the city centre.
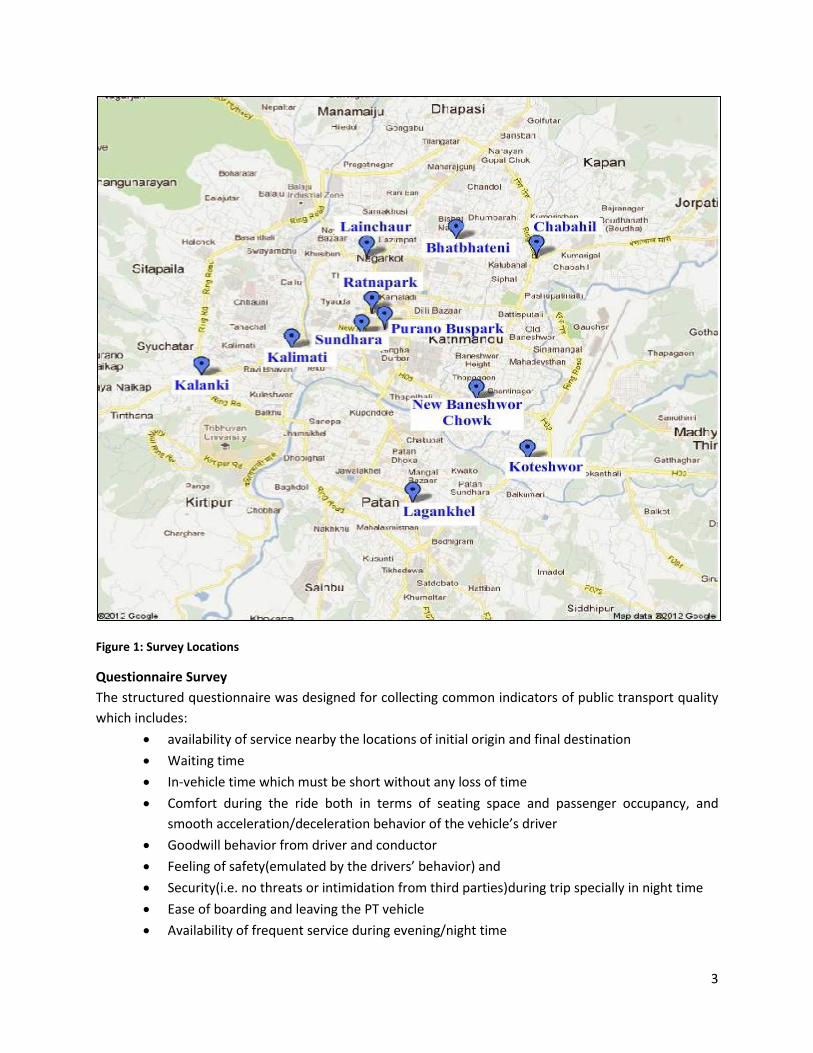
The study is only focused on first two type of services i.e. routes in core city area and outskirts of city
area within Kathmandu valley which may be referred to as urban public transport route network. One of
significant feature of urban public transport route network is that large number of routes terminates at
various points in the central core city area such as Old Bus Park, Ratna Park, and NAC. Based on this
feature, Ratna Park, Purano Bus Park and NAC were selected. Lagankhel, New Baneshwor, and Kalimati
area were selected, based on the fact that these areas are rapidly establishing as important urban
center. The minor stops comprising inner road network in city area such as Sorhakhutte and Bhatbahteni
were also selected for the study. Koteshwor, Chabahil and Kalanki were selected as major transport
centers in the ring road. The locations are selected on the basis of importance of traffic center,
passenger flow and characteristic of public transport route network passing through this center. The
survey area comprises of only traffic centers within the 27 Km ring road of Kathmandu valley. The list of
locations selected for survey is presented below in the map:
3
Figure 1: Survey Locations
Questionnaire Survey
The structured questionnaire was designed for collecting common indicators of public transport quality
which includes:
availability of service nearby the locations of initial origin and final destination
Waiting time
In-vehicle time which must be short without any loss of time
Comfort during the ride both in terms of seating space and passenger occupancy, and
smooth acceleration/deceleration behavior of the vehicle’s driver
Goodwill behavior from driver and conductor
Feeling of safety(emulated by the drivers’ behavior) and
Security(i.e. no threats or intimidation from third parties)during trip specially in night time
Ease of boarding and leaving the PT vehicle
Availability of frequent service during evening/night time
4
The other question in survey was designed to collect information about origin and destination, trip
purpose, characteristic and travel mode choices made by public transport users and socio-economic
profile. The survey questionnaire was designed only in focus with public transport mode such as Tempo,
microbus, bus and minibus. The unconventional mode of public transport such as taxi and rickshaw were
excluded from survey.
The training and orientation to surveyors was conducted on November 17, 2011. Five teams with 3
surveyors in each team were mobilized for survey, during weekday in study sites from November 20-22,
2011. The survey was conducted during morning hour (9:00-11:00 am) and evening hour (4:00-6:00 am)
to encompass the passengers travelling in peak period of travel. Along with field survey, the online user
friendly survey questionnaire was also developed with the help of “Google docs” and promoted using
social media.
Sample Size
The sampling unit is a public transport user.
Required sample size is calculated from the following formula:
SS = p (1-p)* (Z/E) 2
Where:
SS = Sample Size, or the number of responses required to be sure that the answers truly reflect the
population.
p = Sample Proportion, or the percentage of the sample that uses public transport. The worst case is
50%, and that should be used to determine the level of accuracy for a sample.
Z = Z-value (e.g. 1.96 at the 95% confidence level)
E = Margin of Error, or a measure of the variation within the data. The smaller this value is the more
uniform the data is.
Confidence level = A percentage representing the how often the true percentage of the population who
would pick an answer would lie in the confidence interval.
Assuming a confidence level of 95%, a margin of error 5% and a Sample Proportion of 0.5, a sample size
of 384 would be required to be sure that each answer truly reflects the population. The total of 420
questionnaire response was received. 379 responses were received through personal interview with
respondents and 41 responses were received from online survey form.
5
4. Vehicle population trend
The traffic situation in Kathmandu valley is dominated by an enormous increase of motorized vehicles.
About 46.2% of the total vehicles registered in the country are registered in the Bagmati zone.1 The
annual average growth rate of the total registered vehicles in the Valley from 1990-2011 is 14.32%. In
past 10 years, the number of registered vehicles increased 3.75 times to reach 570,145 till 2010/2011.
All vehicles registered in the Bagmati Zone are assumed to be used in Kathmandu valley which is a
reasonable assumption because other districts in this zone are hilly areas and largely un-motorable.2
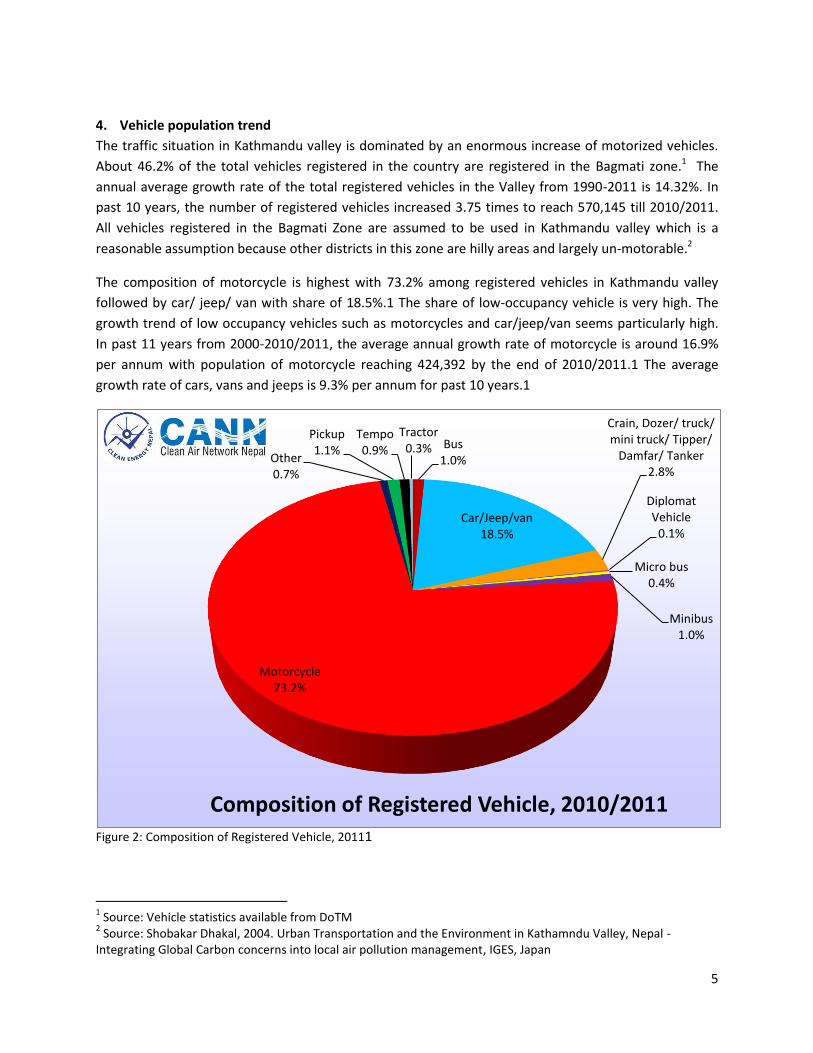
The composition of motorcycle is highest with 73.2% among registered vehicles in Kathmandu valley
followed by car/ jeep/ van with share of 18.5%.1 The share of low-occupancy vehicle is very high. The
growth trend of low occupancy vehicles such as motorcycles and car/jeep/van seems particularly high.
In past 11 years from 2000-2010/2011, the average annual growth rate of motorcycle is around 16.9%
per annum with population of motorcycle reaching 424,392 by the end of 2010/2011.1 The average
growth rate of cars, vans and jeeps is 9.3% per annum for past 10 years.1
Figure 2: Composition of Registered Vehicle, 20111
1 Source: Vehicle statistics available from DoTM
2 Source: Shobakar Dhakal, 2004. Urban Transportation and the Environment in Kathamndu Valley, Nepal -
Integrating Global Carbon concerns into local air pollution management, IGES, Japan
Bus 1.0%
Car/Jeep/van 18.5%
Crain, Dozer/ truck/ mini truck/ Tipper/
Damfar/ Tanker 2.8%
Diplomat Vehicle
0.1%
Micro bus 0.4%
Minibus 1.0%
Motorcycle 73.2%
Other 0.7%
Pickup 1.1%
Tempo 0.9%
Tractor 0.3%
Composition of Registered Vehicle, 2010/2011
6
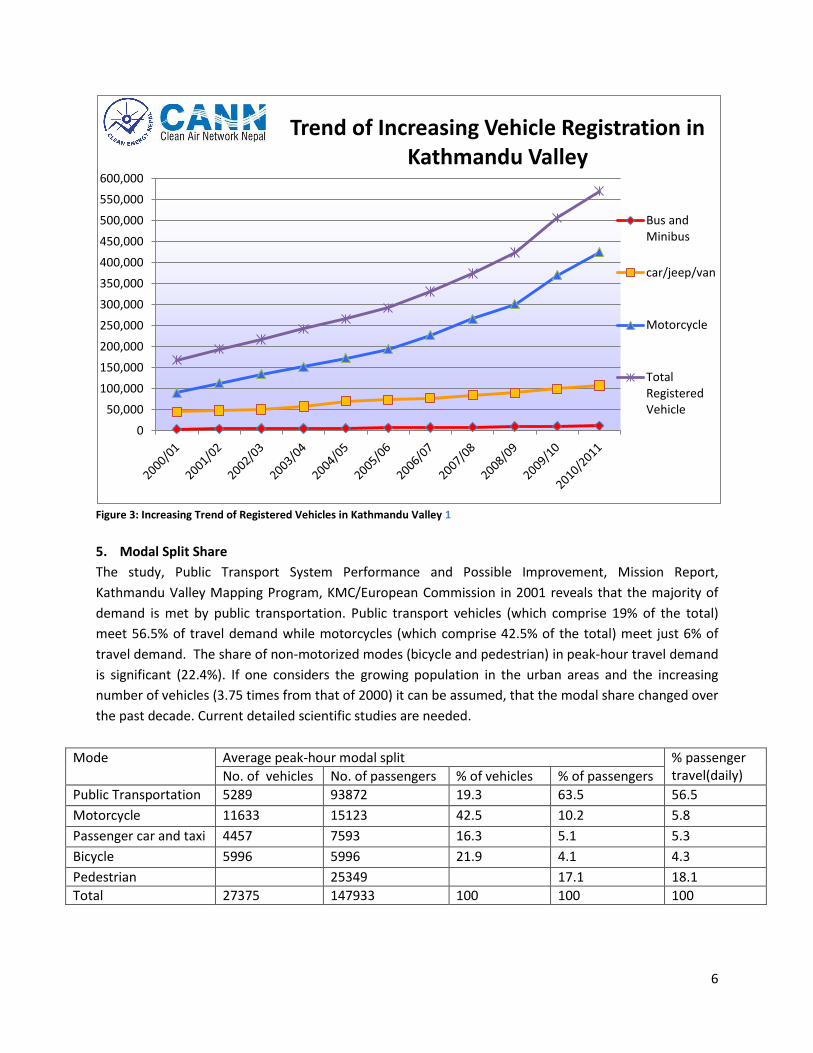
Figure 3: Increasing Trend of Registered Vehicles in Kathmandu Valley 1
5. Modal Split Share
The study, Public Transport System Performance and Possible Improvement, Mission Report,
Kathmandu Valley Mapping Program, KMC/European Commission in 2001 reveals that the majority of
demand is met by public transportation. Public transport vehicles (which comprise 19% of the total)
meet 56.5% of travel demand while motorcycles (which comprise 42.5% of the total) meet just 6% of
travel demand. The share of non-motorized modes (bicycle and pedestrian) in peak-hour travel demand
is significant (22.4%). If one considers the growing population in the urban areas and the increasing
number of vehicles (3.75 times from that of 2000) it can be assumed, that the modal share changed over
the past decade. Current detailed scientific studies are needed.
Mode Average peak-hour modal split % passenger travel(daily) No. of vehicles No. of passengers % of vehicles % of passengers
Public Transportation 5289 93872 19.3 63.5 56.5
Motorcycle 11633 15123 42.5 10.2 5.8
Passenger car and taxi 4457 7593 16.3 5.1 5.3
Bicycle 5996 5996 21.9 4.1 4.3
Pedestrian 25349 17.1 18.1
Total 27375 147933 100 100 100
0
50,000
100,000
150,000
200,000
250,000
300,000
350,000
400,000
450,000
500,000
550,000
600,000
Trend of Increasing Vehicle Registration in Kathmandu Valley
Bus andMinibus
car/jeep/van
Motorcycle
TotalRegisteredVehicle
7
Table 1: Modal Split Share in Kathmandu Valley, 20013
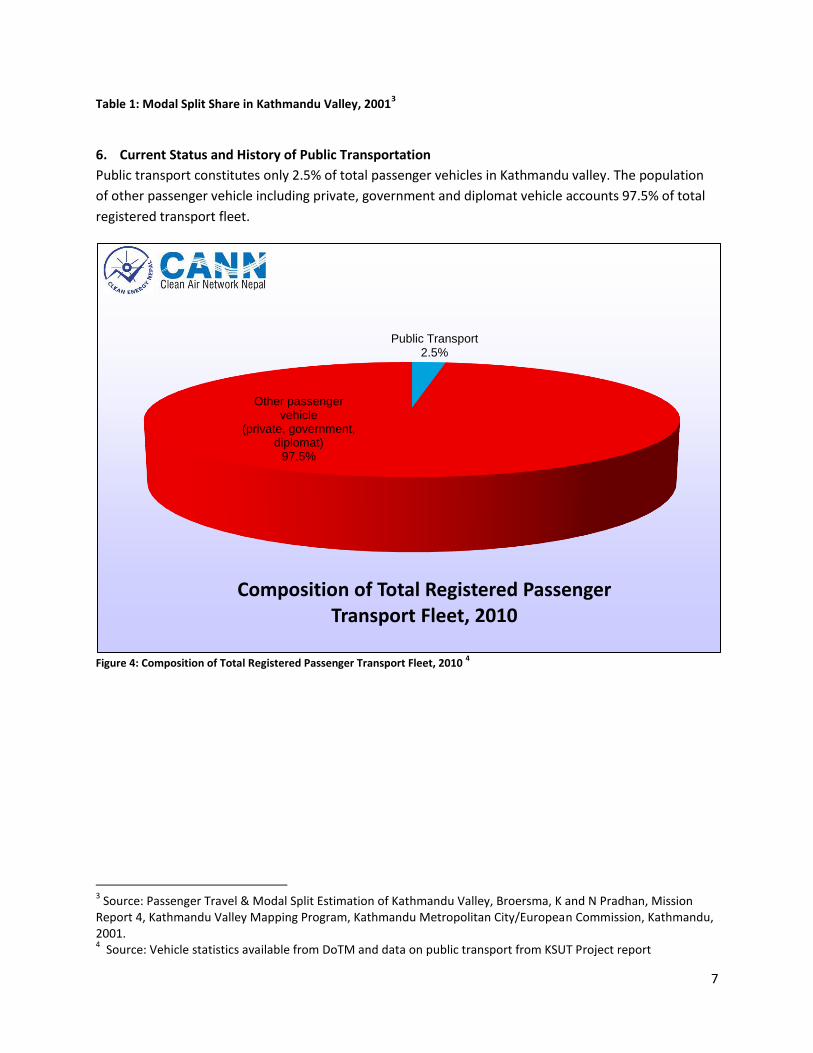
6. Current Status and History of Public Transportation
Public transport constitutes only 2.5% of total passenger vehicles in Kathmandu valley. The population
of other passenger vehicle including private, government and diplomat vehicle accounts 97.5% of total
registered transport fleet.
Figure 4: Composition of Total Registered Passenger Transport Fleet, 2010
4
3 Source: Passenger Travel & Modal Split Estimation of Kathmandu Valley, Broersma, K and N Pradhan, Mission
Report 4, Kathmandu Valley Mapping Program, Kathmandu Metropolitan City/European Commission, Kathmandu, 2001. 4 Source: Vehicle statistics available from DoTM and data on public transport from KSUT Project report
Public Transport 2.5%
Other passenger vehicle
(private, government, diplomat)
97.5%
Composition of Total Registered Passenger Transport Fleet, 2010
8
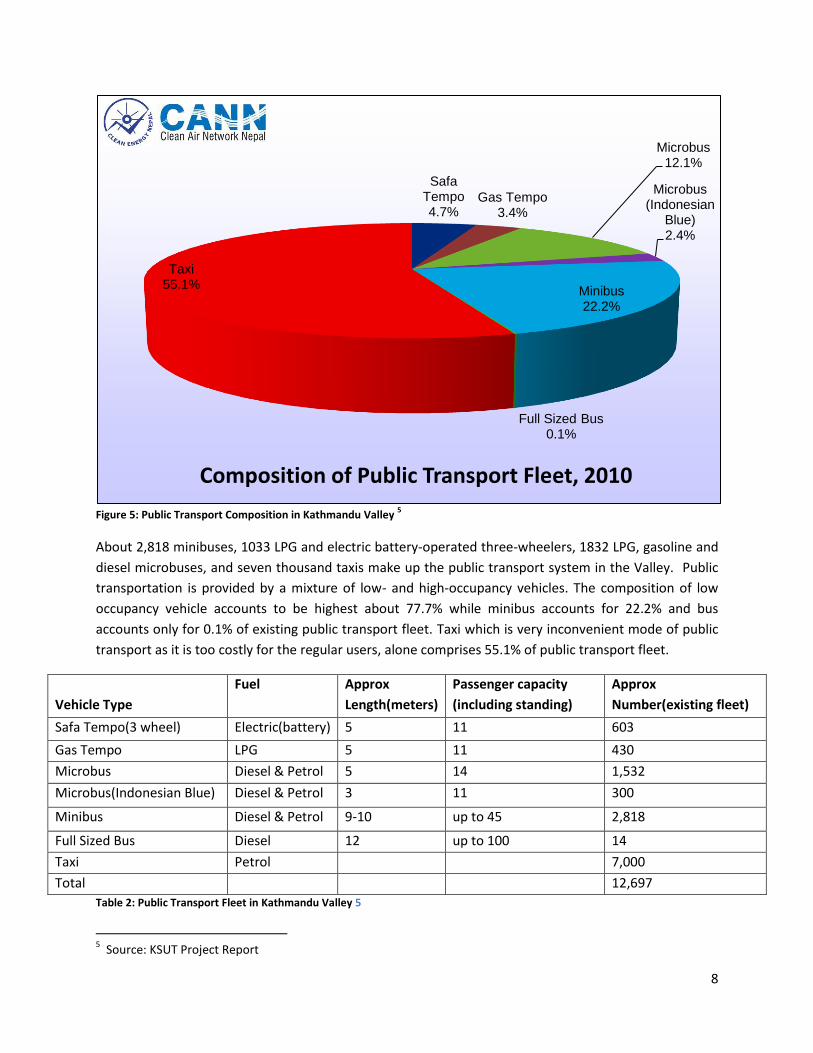
Figure 5: Public Transport Composition in Kathmandu Valley
5
About 2,818 minibuses, 1033 LPG and electric battery-operated three-wheelers, 1832 LPG, gasoline and
diesel microbuses, and seven thousand taxis make up the public transport system in the Valley. Public
transportation is provided by a mixture of low- and high-occupancy vehicles. The composition of low
occupancy vehicle accounts to be highest about 77.7% while minibus accounts for 22.2% and bus
accounts only for 0.1% of existing public transport fleet. Taxi which is very inconvenient mode of public
transport as it is too costly for the regular users, alone comprises 55.1% of public transport fleet.
Vehicle Type
Fuel Approx
Length(meters)
Passenger capacity
(including standing)
Approx
Number(existing fleet)
Safa Tempo(3 wheel) Electric(battery) 5 11 603
Gas Tempo LPG 5 11 430
Microbus Diesel & Petrol 5 14 1,532
Microbus(Indonesian Blue) Diesel & Petrol 3 11 300
Minibus Diesel & Petrol 9-10 up to 45 2,818
Full Sized Bus Diesel 12 up to 100 14
Taxi Petrol 7,000
Total 12,697
Table 2: Public Transport Fleet in Kathmandu Valley 5
5 Source: KSUT Project Report
Safa Tempo 4.7%
Gas Tempo 3.4%
Microbus 12.1%
Microbus (Indonesian
Blue) 2.4%
Minibus 22.2%
Full Sized Bus 0.1%
Taxi 55.1%
Composition of Public Transport Fleet, 2010
9
There is a basic network of about 25 routes, with most routes having several variations—almost 20 in
one case.5 Public transport needs to be registered and re-register annually while paying the vehicle tax.
Public transport operators need to obtain and renew a route license and must pay a route license tax or
fee. DoTM handles the registration, licensing and taxation. No government authority has up-to-date
information regarding the routes operated, even though the DOTM is responsible for issuing route
permits. However there is no specific agency with specific responsibility for planning routes and the
route network has developed largely on the initiative of the numerous operators’ association.5
All public transportation is provided by the private sector. The state-owned Sajha Yatayat and electric
trolleybuses has already collapsed due to management problems. Sajha Yatayat is being revamped once
again under cooperative model without government control and will be functional in 2012.6 It has been
dysfunctional since 2007 due to political bickering by successive governments and mismanagement.
Registered under the Cooperative Act, Sajha Yatayat was controlled by the government majority, though
it has a total of 233 members. Sajha Yatayat, a 50-year old organization that started mass transport
service in Nepal but failed to retain its past glory post 1990 movement, era in which private sector
started coming aggressively in mass transportation sector. Consequently government lost its grip over
public transportation, and gradually syndicate system in transport sector flourished overall Nepal. The
privatization of public transport in Nepal was meant to bring more improved service to public; however
it got more and more deteriorated with time as a result of syndicate system and inefficiency of
government.
Opened on 28 December 1975, 13 Km long electric trolley bus system from Tripureshwor to Surya
Binayak was a gift to Nepal from Chinese government.7 In the initial days, the trolleys operated quite
successfully and were providing services to over 80% of the people travelling between Bhaktapur and
Kathmandu.8 The buses were making substantial profits till 1990. After that, however, the system
became a victim of political interference, over staffing, mismanagement and low employee morale. The
operational losses of the unit, which was Rs. 3.85 million in 1996/97, reached 13.13 million in 2000/01
(almost four fold increase in four years).8 Operation was suspended completely for almost two years,
from 19 December 2001 until 1 September 2003, because of maintenance, financial and political issues.7
When service was reinstated in 2003, KMC took over the management of the service and was operating
a 5-km-long route from Tripureshwor to Koteshwor at downtown Kathmandu city and did not cover the
route's outer half, to Surya Binayak.7 Operations on the system were suspended again, and for the final
time, in late November 2008, and the system was formally closed in November 2009.7
6 Source: Binod Ghimire(2011). Revival of Sajha Yatayat: Sajha buses to ply Valley roads in four months. The
Kathmandu Post. Posted on 2011/12/20. Retrieved from http://www.ekantipur.com/the-kathmandu-
post/2011/12/19/development/revival-of-sajha-yatayat-sajha-buses-to-ply-valley-roads-in-four-
months/229481.html
7 Source: Trolley bus in Kathmandu. Wikipedia, the free Encyclopedia. Retrieved from
http://en.wikipedia.org/wiki/Trolleybuses_in_Kathmandu#cite_note-box-tm292-2
8 Source: Bhusan Tuladhar. 2003. Electric Vehicles in Kathmandu. Clean Energy Nepal’s Factsheet#3. Kathmandu,
Nepal. Retrieved from http://www.cen.org.np/uploaded/EV%20fact%20sheet.pdf
10
Meanwhile, the government is planning to bring back trolley buses in the Kathmandu Valley under the
Kathmandu Sustainable Urban Transport (KSUT) project funded by the Asian Development Bank (ADB).
According to the MoPPW, the project would introduce trolley buses most likely on the Ring Road, the
Bishnumati Link Road and the Bhaktapur-Kathmandu route under the second phase of the KSUT that is
scheduled to start in 2013. The project plans to operate electric vehicles on the Budhanilkantha-
Lagankhel and Thankot-Kalanki-Bhaktapur routes in the first phase.
7. Public Transport Acts and Policies
Five Year Plans
Nepal’s policy is based on the five years plans, which sets the frameworks for the country’s development
strategy. Nepal started its planned development works in mid-fifties with the introduction of first Five-
Year Development Plan (1956-61). It was only in the fourth plan period that Trolley Bus development
linking Bhaktapur to Kathmandu in Kathmandu valley was initiated without any specific mention on the
promotion of cleaner vehicles for the reduction of air pollution. Till Fifth Five-Year Development Plan,
largely policies were only focused on the development of road network infrastructures and other
transport infrastructures such as ropeways, railway, etc. The trolley bus service, operated with electric
power, was initiated in the fiscal year 1975/76 during the Fifth Plan. Until sixth plan nothing was
mentioned on traffic and transport management.
Sixth Plan (1980-1995)
The sixth plan had little focus on policy to improve the service standard of public transport in the urban
areas with steps taken to develop bus routes, bus terminals and bus stops in a systematic way and mire
attention devoted devising measures to attract private sector investment in this area. The long-term
objective was gradually basing the transportation system on electricity instead of petroleum products,
whose prices are on the upswing, with feasibilities studies conducted on the development of trolley bus,
trolley truck, railways and ropeways and improvements to be made upon the rapid transit system of
urban areas like Kathmandu. The sixth plan included program of improving the Kathmandu-Bhaktapur
trolley bus service where necessary, and extending to some more places. Concerning the expansion of
electric powered trolley bus services, the target was to carry out necessary improvement on the 12.73
km Kathmandu-Bhaktapur trolley bus route and extend the bus route from Surya Binayak of Bhaktpur to
Shahidgate-Ratna Park and Tribhuvan University in Kirtipur; but during the plan period only some
arrangements were made to initiate works on Tripureshwar-Shahidgate section. Concerning the
development of urban transportation system, bus terminals and waiting stands were constructed in
Kathmandu during the period.
Seventh Plan (1985-1990)
Some of key policies regarding public transport in seventh plan were as follow:
In order to reduce the costly import of petroleum products which are largely used for
transportation purposes, the policy of gradually developing and expanding electric power based
transportation system such as ropeway, trolley bus services and others will be continued.
Rules concerning public transportation system will be reviewed in order to unify the service
conditions of the public transportation system and ensure better service and safety to the
11
public. Private sector will be encouraged to play more active role in this regard. The role of
Nepal Transport Corporation will be gradually restricted.
The achievement of seventh planning was moreover focused on road infrastructure. There was plan to
extend Kathmandu- Bhaktapur trolley bus line in Kathmandu valley from Tripureshwor to Shahidgate,
Tinkune-Chabahil- Thapathali to Patan gate during the Seventh Plan period which was not succeeded.
Eighth Plan (1992-1997)
The eighth plan included some of key policies regarding public transport which were as follow:
Public transport services to be made more comfortable, safe and regular. Necessary
organizational improvements to be made in this regard.
To attract private and foreign investors in organizing driving schools and workshops for repairs
and maintenance and to effect necessary reforms in rules and regulations to systematically
operate the public transport services.
To extend Trolley-bus services to reduce air pollution by the public transport services.
To initiate an institutional system in connection with the control and inspection of the means of
transport in order to reduce the air pollution to the least by the public transport and other
services being operated in big or medium sized cities. Agencies related to it will be made
effective.
Eighth plan included a program of development of Trolley Bus Services. With a view to minimize the
imported fuel consumption, there was a plan of extending trolley bus services from Tripureshwor-
Kirtipur and Thappthali-Patan Gate-pulchowk during the Eighth Plan period. 15 km. trolley- bus service
operation in Teenkune-Chabahil-Maharajgunj sector was also under the Eighth plan. None of the plan
regarding trolley bus succeeded during the period. The Vehicle Transport Management Act (1993) and
Vehicle Transport Management Rule (1994) were also enacted within the 8th plan period.
Ninth Plan (1997-2002)
The 9th plan in the transport sector set a 20 years target for the promotion of electrical vehicles
particularly trolley and electric trains. The sector policy emphasized on the expansion of trolley bus
services and battery operated vehicles in the Kathmandu valley to reduce air pollution. However, the
transport sectors target of the 9th plan remained in paper only. It is in this plan period that the
operating trolley Bus Service between Bhaktapur and Kathmandu came into halt through the
government decision. The National Transport Policy 2001, the other policy document endorsed in the
9th plan was focused more on the infrastructure development. Regarding traffic and transport
management, the ninth plan had plans of Institutional Development of Department of Transport
Management to systematize and consolidate traffic and transport management thereby rendering
qualitative increase of services by making transport services reliable, safer, pollution free and people
service oriented, to be undertaken in order to make its administrative and technical components
capable, resourceful and more effective. For this purpose following projects were to be implemented:
Physical facilities for Department of Transport Management
Computerization Department of Transport Management to execute all the functions to be
accomplished by them such as vehicle registration, vehicle inspection, route license, and renewal,
12
transfer of ownership, driving license issue, and pollution test, etc helping in systematic record
keeping of vehicle registration, route license, vehicle License issue, and revenue collection, to
inspect and control the activities related to transport management by Department of Transport
Management, and in traffic and transport planning, transportation system planning etc.
Establishment of Traffic Engineering Unit within Department of Transport Management to
undertake functions such as finding remedial measures through regular study- research of existing
traffic engineering problems and traffic norms, regular study of axle load, transverse distribution
etc.
Traffic and Transport Study and Implementation to consolidate traffic and transport management
throughout the country including Kathmandu valley and other urban areas, with detailed study to be
done and a 20 years transport management master plan for road transport and accordingly short-
term plan formulated and implemented. In addition, a master plan for the construction of
infrastructure of urban transport to be formulated with role of municipalities in construction,
maintenance and repair of urban roads, construction of roads to be improved under urban
development programme, footpath, bicycle lane, bus-stop, parking area, subway, fly over and over
bridge, and the development of public transportation system reducing environmental pollution
included. Remedial measures for problems of passengers, transport professionals, transport labour
and pedestrians will be found out. For this purpose, following projects to be implemented:
Tenth Plan (2002-2008)
During the Tenth Plan period, the vehicle transport management guideline was implemented. In the
context of institutional strengthening of the transport system, construction of a building for the
Department of Transport Management was completed. In order to update rules and regulations related
to vehicle and transport management, initiation was taken to introduce necessary amendments.
Three year interim plan (2011-2014)
The objective of 3 years interim plan is to develop the transport system so as to make it less expensive,
safe, non-polluting, and equipped with facilities, competitive and self dependent and to make the
transport sector efficient, transparent, service-oriented and effective. The policies of 3 year plan have
special priority on public transport along with focus institutional strengthening and coordination among
different agencies. Some of key policies in three year interim plan are as follow:
Institutional improvement will be carried out for effective development and management of the
transport sector; and by establishing an autonomous National Transport Board, partnership and
cooperation with the private sector will be strengthened.
By operating vehicles in a competitive environment, certainty, cost effectiveness and economic
capability will be achieved in transport service, and the syndicate system will be abolished.
Priority will be given to public transportation system.
By involving the private sector in transport, making it competitive, attractive and responsible,
the transport system will be strengthened. In addition, polluting vehicles will be phased out.
By computerizing the archive system related to transport management, prompt and reliable
service will be provided. National network of vehicle and transport service will be built.
13
For pollution control, necessary mechanism will be established in urban areas including the
Kathmandu Valley, and public awareness on this issue will be enhanced.
Effective coordination will be established among the concerned agencies involved in transport
management.
Office of Transport Management will be constructed and renovated, and will be made
resourceful.
By carrying out a study on road accidents, possible causes and the regions of accidents will be
identified, and necessary precautions will be taken.
Travel cost in vehicles will be subsidized for senior citizens and persons with disability on the
basis of identity cards.
Some of key working policy adopted by 3 year interim plan regarding traffic and transport management
in urban areas is as follow:
In Kathmandu valley mass commuting vehicles will be encouraged and public transport service will
be made easy, safe, comfortable, accessible, reliable and effective.
Transport management in the Valley will be systematized by adopting Global Positioning System.
Environment friendly means of transportation will be encouraged along with the use of bio-fuel.
Terminals along with necessary parking lots for passenger and vehicles in Kathmandu Valley and
other urban areas will be built and operated based on the concept of public private partnership.
Government, local government bodies and cooperative institutions will be involved in public
transport service as per necessity.
National Transport Policy 2001
It has been decade since Nepal transport policy 2001 was formulated. This policy was formulated in
order to promote the transportation services in the remotest areas of Nepal with minimum resources as
soon as possible, to make the existing transport infrastructure more reliable and to establish an
environmental friendly transportation system in the rural and urban areas. National transport policy
2001 included some key announcement regarding improvement of public transport. Special attention
shall be given to improving 'the comfort, reliability, safety, frequency, availability and affordability of
public transport and to reducing harmful emissions arising from public transport operations and to
achieve this goal provisions for maintenance and route permission and standard shall be maintained and
specified which is one of promising policy initiatives. To achieve this goal, there is an action plan of
making provisions for maintenance and route permission and standard. DoTM is responsible issuing
route permits, however there is no agency with specific responsibility for planning routes, and the
network has developed largely on the initiative of numerous operators’ association.
Development of transport infrastructure of the urban area in accordance with the master plan prepared
for the urban development is also one of key policy initiative which tends to address local context with
empowerment of local authority. The central level shall perform the role of supporter in the work to be
done from the local level, but, functionally speaking, key responsibilities that affect transportation
infrastructure and urban environmental management decisions still lie with the national government.
14
National transport policy 2001 included some key action for transport management in urban context
which includes:
To restrict motorized vehicles in prescribed core areas.
To operate bus, tram and other vehicles powered by gas, electricity and solar power.
Not to allow more motor vehicles than the certain density. For this purpose, the means of
controlling vehicle ownership and city parking fee shall be taken up.
Arrangement shall be made as to not allowing parking except in specified places.
Sound and air polluting vehicles shall be restricted. To manage separate standard for the
vehicles operating in the urban area.
The infrastructure and services of transport shall be developed and expanded according to the
long term planning of Kathmandu Valley.
However, National Transport Policy 2001 is mainly focused mainly on infrastructures i.e. road network
rather than holistic approach focusing on other aspects of transportation.
Local Self Governance Act 1999
Local Self-Governance Act was passed in 1999 to provide a legal basis for decentralized self-rule by
locally elected bodies such as municipalities and village and district development committees (VDCs and
DDCs). City authorities are gradually assuming a greater role and building their capacities, but,
functionally speaking, key responsibilities that affect transportation infrastructure and urban
environmental management decisions still lie with the national government.
Vehicle and Transport Management Act 2049 and Regulation 2054
The Vehicle Transport Management Act (1993) and Vehicle Transport Management Rule (1994) were
also enacted within the 8th plan period (1992 - 1997). Under Transport Management, it is more focused
on: Driver’s license, Conductor license, number plates mandatory on both side, road permit, fitness test.
This act talks to prevent pollution of noise and smoke emitted from a vehicle, empowers to prescribe
standards for the examination of vehicles, empowers to refuse to register vehicles, prohibits smoking in
public vehicles, and empowered authority to punish those who violate traffic and transport rules.
Public Transport Code of Conduct, 2067
The main objective of public transport code of conduct, 2067 is to ensure safe, easy and convenient ride
especially for women, children, differently able people and all transport users in public transport
vehicles. There is a provision for implementation and monitoring of code of conduct by Central
Committee for implementation and monitoring of Code of Conduct and Regional Committee for
implementation and monitoring of code of conduct. However both the Central and Regional Committee
for implementation and monitoring of code of conduct are not active.
15
8. Results
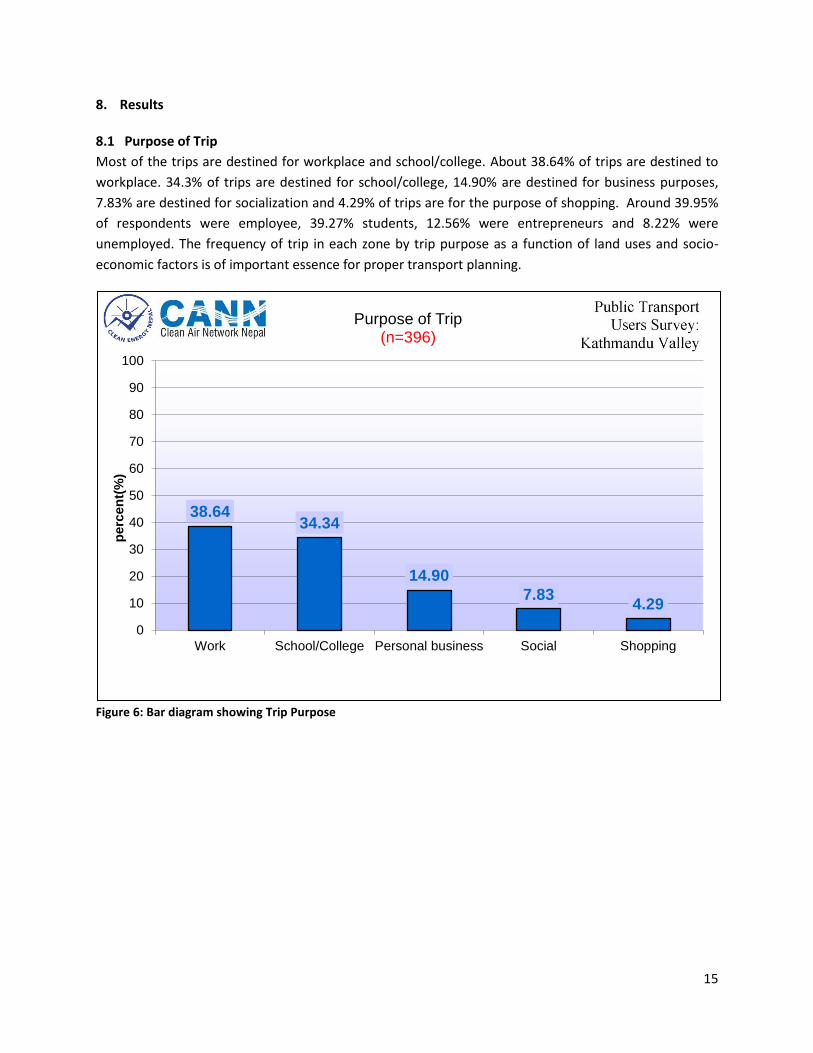
8.1 Purpose of Trip
Most of the trips are destined for workplace and school/college. About 38.64% of trips are destined to
workplace. 34.3% of trips are destined for school/college, 14.90% are destined for business purposes,
7.83% are destined for socialization and 4.29% of trips are for the purpose of shopping. Around 39.95%
of respondents were employee, 39.27% students, 12.56% were entrepreneurs and 8.22% were
unemployed. The frequency of trip in each zone by trip purpose as a function of land uses and socio-
economic factors is of important essence for proper transport planning.
Figure 6: Bar diagram showing Trip Purpose
38.64 34.34
14.90
7.83 4.29
0
10
20
30
40
50
60
70
80
90
100
Work School/College Personal business Social Shopping
perc
en
t(%
)
Purpose of Trip (n=396)
16
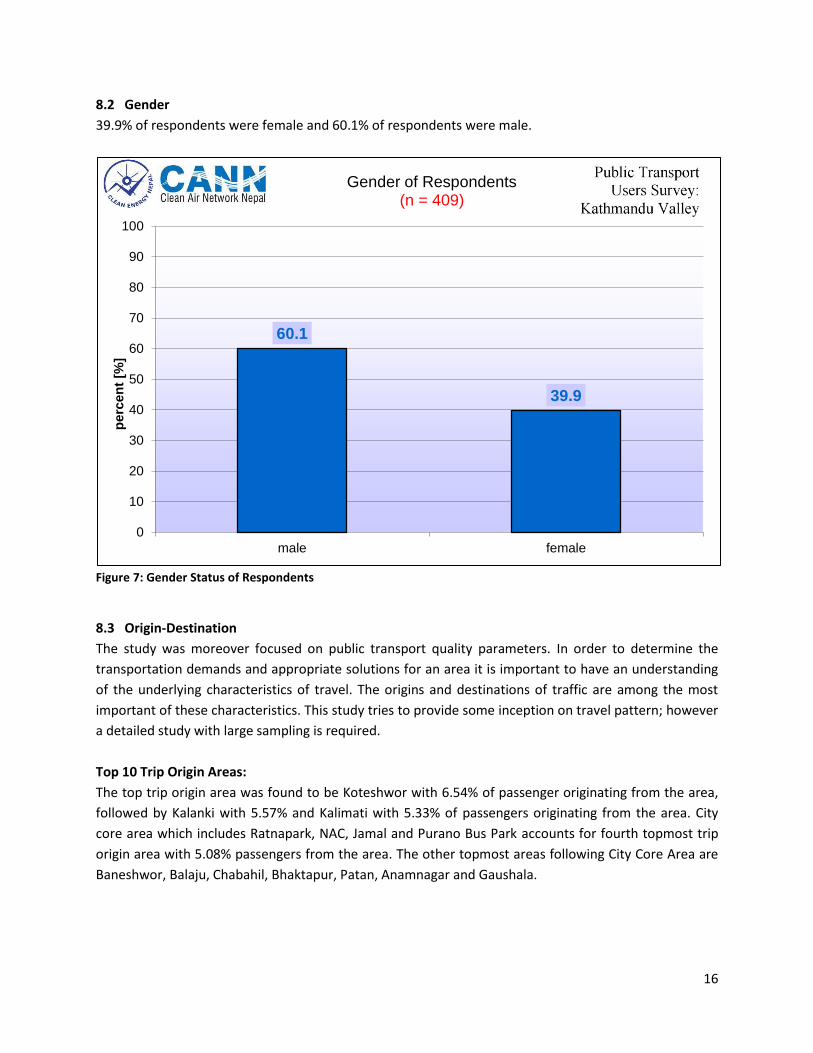
8.2 Gender
39.9% of respondents were female and 60.1% of respondents were male.
Figure 7: Gender Status of Respondents
8.3 Origin-Destination
The study was moreover focused on public transport quality parameters. In order to determine the
transportation demands and appropriate solutions for an area it is important to have an understanding
of the underlying characteristics of travel. The origins and destinations of traffic are among the most
important of these characteristics. This study tries to provide some inception on travel pattern; however
a detailed study with large sampling is required.
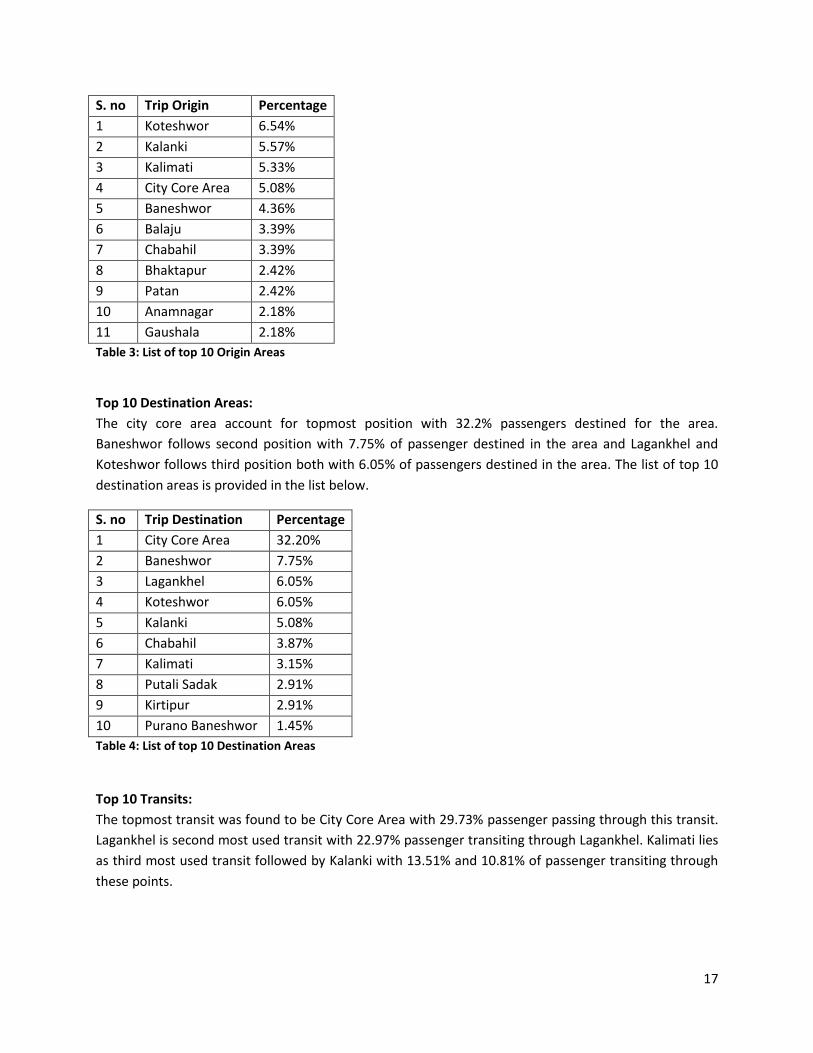
Top 10 Trip Origin Areas:
The top trip origin area was found to be Koteshwor with 6.54% of passenger originating from the area,
followed by Kalanki with 5.57% and Kalimati with 5.33% of passengers originating from the area. City
core area which includes Ratnapark, NAC, Jamal and Purano Bus Park accounts for fourth topmost trip
origin area with 5.08% passengers from the area. The other topmost areas following City Core Area are
Baneshwor, Balaju, Chabahil, Bhaktapur, Patan, Anamnagar and Gaushala.
60.1
39.9
0
10
20
30
40
50
60
70
80
90
100
male female
perc
en
t [%
]
Gender of Respondents (n = 409)
17
S. no Trip Origin Percentage
1 Koteshwor 6.54%
2 Kalanki 5.57%
3 Kalimati 5.33%
4 City Core Area 5.08%
5 Baneshwor 4.36%
6 Balaju 3.39%
7 Chabahil 3.39%
8 Bhaktapur 2.42%
9 Patan 2.42%
10 Anamnagar 2.18%
11 Gaushala 2.18%
Table 3: List of top 10 Origin Areas
Top 10 Destination Areas:
The city core area account for topmost position with 32.2% passengers destined for the area.
Baneshwor follows second position with 7.75% of passenger destined in the area and Lagankhel and
Koteshwor follows third position both with 6.05% of passengers destined in the area. The list of top 10
destination areas is provided in the list below.
S. no Trip Destination Percentage
1 City Core Area 32.20%
2 Baneshwor 7.75%
3 Lagankhel 6.05%
4 Koteshwor 6.05%
5 Kalanki 5.08%
6 Chabahil 3.87%
7 Kalimati 3.15%
8 Putali Sadak 2.91%
9 Kirtipur 2.91%
10 Purano Baneshwor 1.45%
Table 4: List of top 10 Destination Areas
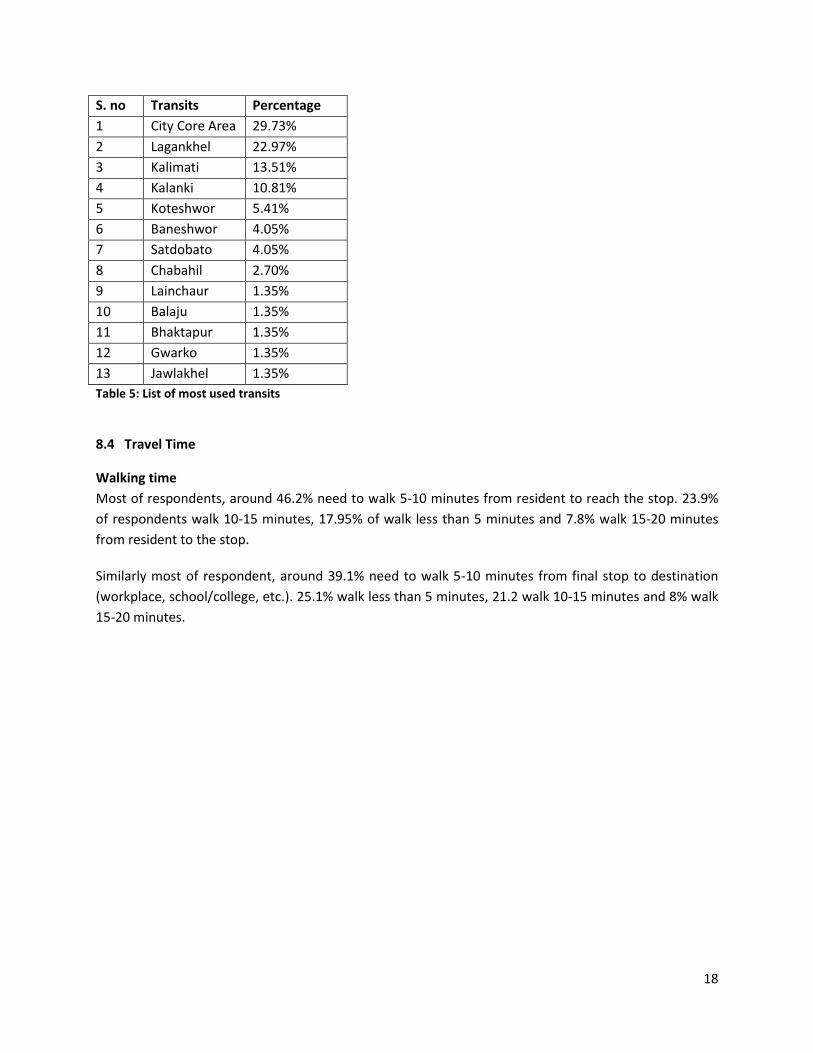
Top 10 Transits:
The topmost transit was found to be City Core Area with 29.73% passenger passing through this transit.
Lagankhel is second most used transit with 22.97% passenger transiting through Lagankhel. Kalimati lies
as third most used transit followed by Kalanki with 13.51% and 10.81% of passenger transiting through
these points.
18
S. no Transits Percentage
1 City Core Area 29.73%
2 Lagankhel 22.97%
3 Kalimati 13.51%
4 Kalanki 10.81%
5 Koteshwor 5.41%
6 Baneshwor 4.05%
7 Satdobato 4.05%
8 Chabahil 2.70%
9 Lainchaur 1.35%
10 Balaju 1.35%
11 Bhaktapur 1.35%
12 Gwarko 1.35%
13 Jawlakhel 1.35%
Table 5: List of most used transits
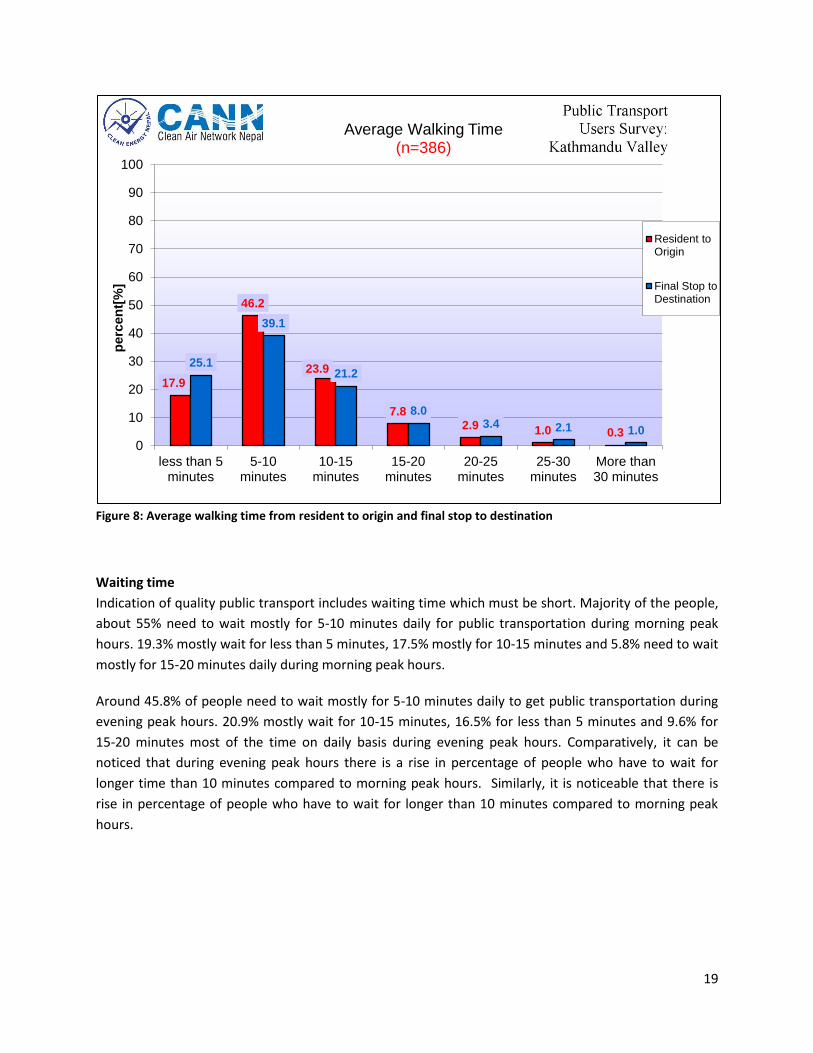
8.4 Travel Time
Walking time
Most of respondents, around 46.2% need to walk 5-10 minutes from resident to reach the stop. 23.9%
of respondents walk 10-15 minutes, 17.95% of walk less than 5 minutes and 7.8% walk 15-20 minutes
from resident to the stop.
Similarly most of respondent, around 39.1% need to walk 5-10 minutes from final stop to destination
(workplace, school/college, etc.). 25.1% walk less than 5 minutes, 21.2 walk 10-15 minutes and 8% walk
15-20 minutes.
19
Figure 8: Average walking time from resident to origin and final stop to destination
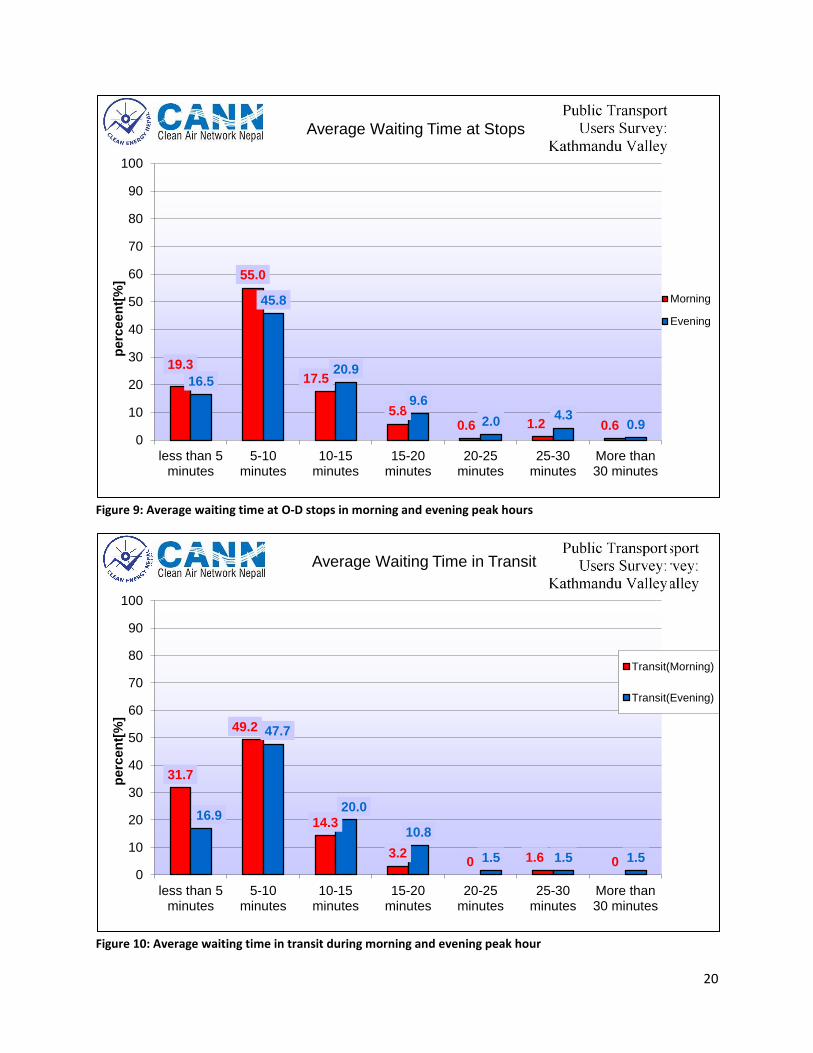
Waiting time
Indication of quality public transport includes waiting time which must be short. Majority of the people,
about 55% need to wait mostly for 5-10 minutes daily for public transportation during morning peak
hours. 19.3% mostly wait for less than 5 minutes, 17.5% mostly for 10-15 minutes and 5.8% need to wait
mostly for 15-20 minutes daily during morning peak hours.
Around 45.8% of people need to wait mostly for 5-10 minutes daily to get public transportation during
evening peak hours. 20.9% mostly wait for 10-15 minutes, 16.5% for less than 5 minutes and 9.6% for
15-20 minutes most of the time on daily basis during evening peak hours. Comparatively, it can be
noticed that during evening peak hours there is a rise in percentage of people who have to wait for
longer time than 10 minutes compared to morning peak hours. Similarly, it is noticeable that there is
rise in percentage of people who have to wait for longer than 10 minutes compared to morning peak
hours.
17.9
46.2
23.9
7.8 2.9 1.0 0.3
25.1
39.1
21.2
8.0 3.4 2.1 1.0
0
10
20
30
40
50
60
70
80
90
100
less than 5minutes
5-10minutes
10-15minutes
15-20minutes
20-25minutes
25-30minutes
More than30 minutes
perc
en
t[%
] Average Walking Time
(n=386)
Resident toOrigin
Final Stop toDestination
20
Figure 9: Average waiting time at O-D stops in morning and evening peak hours
Figure 10: Average waiting time in transit during morning and evening peak hour
19.3
55.0
17.5
5.8 0.6 1.2 0.6
16.5
45.8
20.9
9.6
2.0 4.3
0.9 0
10
20
30
40
50
60
70
80
90
100
less than 5minutes
5-10minutes
10-15minutes
15-20minutes
20-25minutes
25-30minutes
More than30 minutes
perc
een
t[%
] Average Waiting Time at Stops
Morning
Evening
31.7
49.2
14.3
3.2 0 1.6 0
16.9
47.7
20.0
10.8
1.5 1.5 1.5
0
10
20
30
40
50
60
70
80
90
100
less than 5minutes
5-10minutes
10-15minutes
15-20minutes
20-25minutes
25-30minutes
More than30 minutes
perc
en
t[%
]
Average Waiting Time in Transit
Transit(Morning)
Transit(Evening)
21
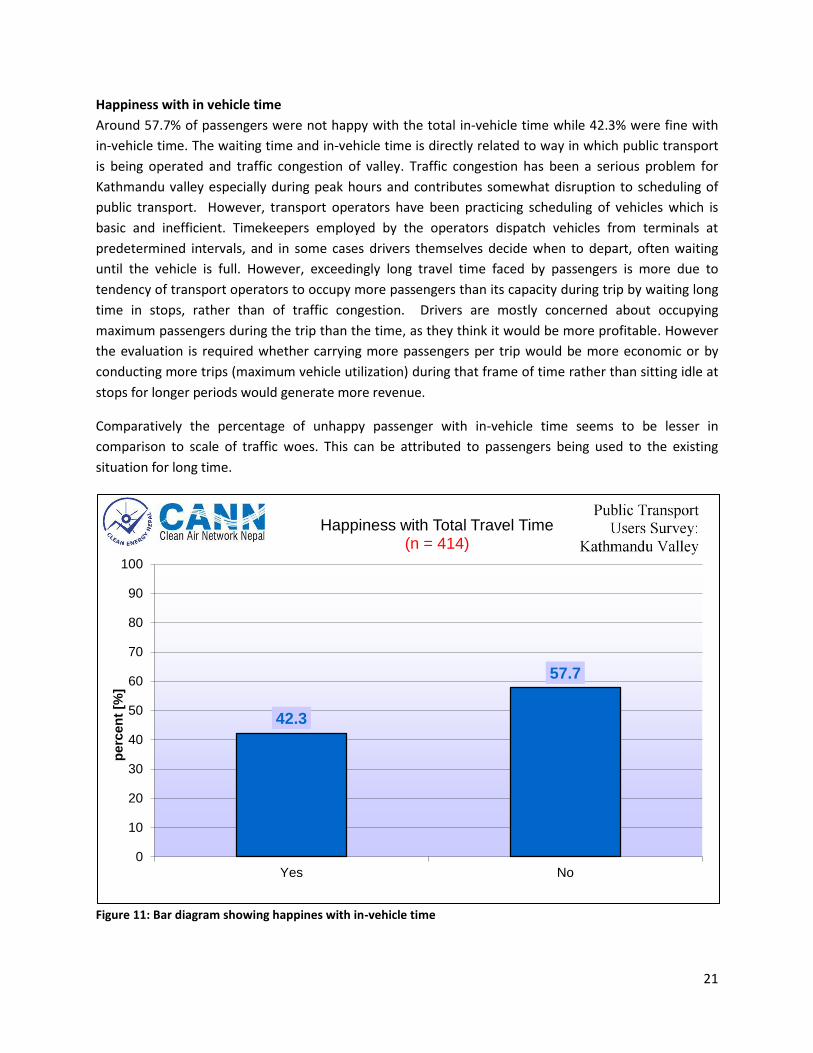
Happiness with in vehicle time
Around 57.7% of passengers were not happy with the total in-vehicle time while 42.3% were fine with
in-vehicle time. The waiting time and in-vehicle time is directly related to way in which public transport
is being operated and traffic congestion of valley. Traffic congestion has been a serious problem for
Kathmandu valley especially during peak hours and contributes somewhat disruption to scheduling of
public transport. However, transport operators have been practicing scheduling of vehicles which is
basic and inefficient. Timekeepers employed by the operators dispatch vehicles from terminals at
predetermined intervals, and in some cases drivers themselves decide when to depart, often waiting
until the vehicle is full. However, exceedingly long travel time faced by passengers is more due to
tendency of transport operators to occupy more passengers than its capacity during trip by waiting long
time in stops, rather than of traffic congestion. Drivers are mostly concerned about occupying
maximum passengers during the trip than the time, as they think it would be more profitable. However
the evaluation is required whether carrying more passengers per trip would be more economic or by
conducting more trips (maximum vehicle utilization) during that frame of time rather than sitting idle at
stops for longer periods would generate more revenue.
Comparatively the percentage of unhappy passenger with in-vehicle time seems to be lesser in
comparison to scale of traffic woes. This can be attributed to passengers being used to the existing
situation for long time.
Figure 11: Bar diagram showing happines with in-vehicle time
42.3
57.7
0
10
20
30
40
50
60
70
80
90
100
Yes No
perc
en
t [%
]
Happiness with Total Travel Time (n = 414)
22
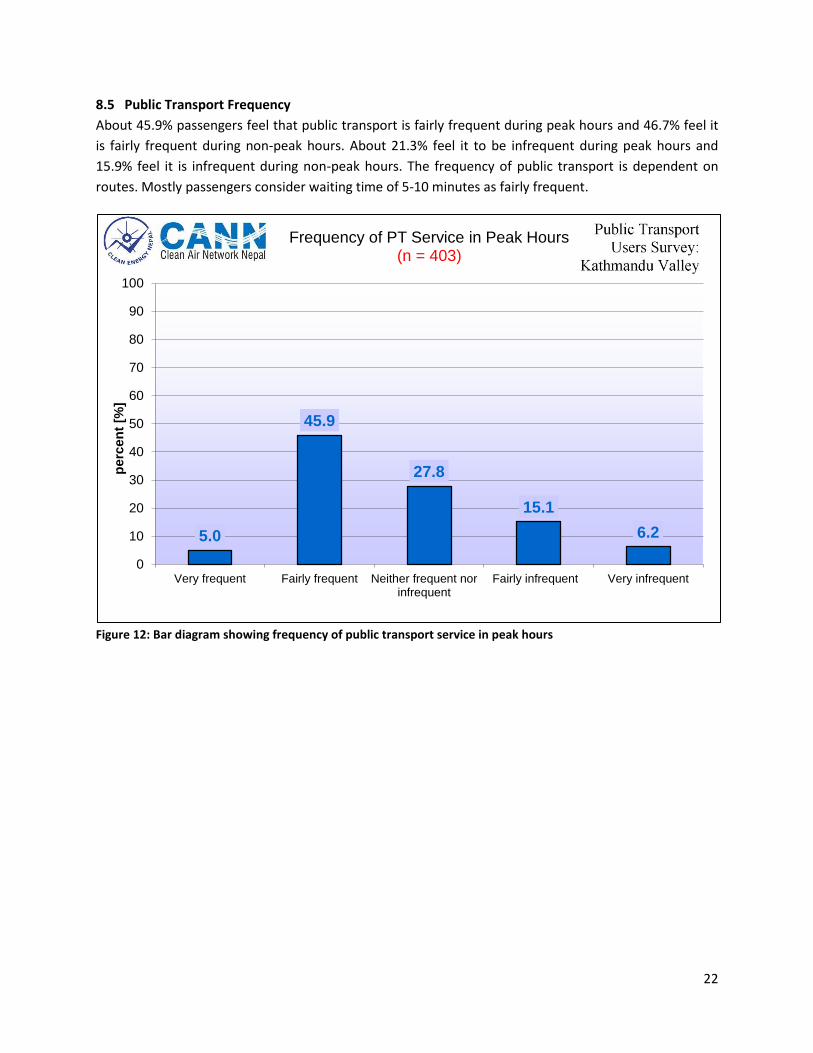
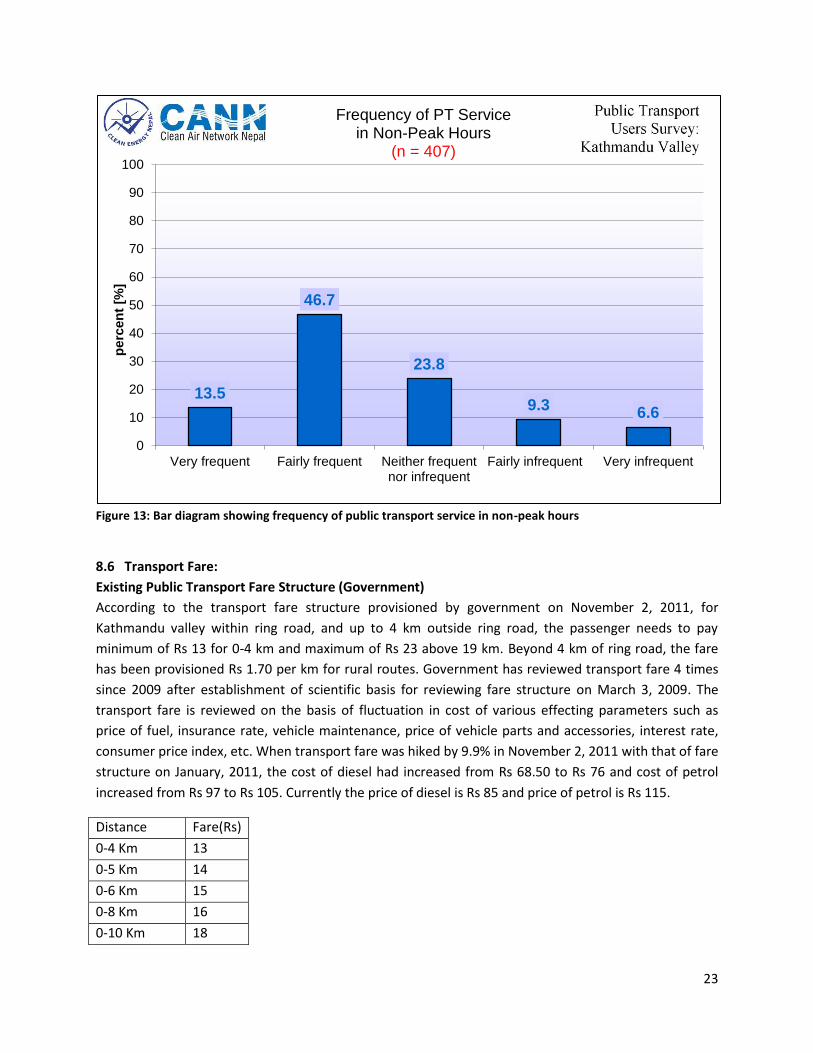
8.5 Public Transport Frequency
About 45.9% passengers feel that public transport is fairly frequent during peak hours and 46.7% feel it
is fairly frequent during non-peak hours. About 21.3% feel it to be infrequent during peak hours and
15.9% feel it is infrequent during non-peak hours. The frequency of public transport is dependent on
routes. Mostly passengers consider waiting time of 5-10 minutes as fairly frequent.
Figure 12: Bar diagram showing frequency of public transport service in peak hours
5.0
45.9
27.8
15.1
6.2
0
10
20
30
40
50
60
70
80
90
100
Very frequent Fairly frequent Neither frequent norinfrequent
Fairly infrequent Very infrequent
perc
en
t [%
]
Frequency of PT Service in Peak Hours (n = 403)
23
Figure 13: Bar diagram showing frequency of public transport service in non-peak hours
8.6 Transport Fare:
Existing Public Transport Fare Structure (Government)
According to the transport fare structure provisioned by government on November 2, 2011, for
Kathmandu valley within ring road, and up to 4 km outside ring road, the passenger needs to pay
minimum of Rs 13 for 0-4 km and maximum of Rs 23 above 19 km. Beyond 4 km of ring road, the fare
has been provisioned Rs 1.70 per km for rural routes. Government has reviewed transport fare 4 times
since 2009 after establishment of scientific basis for reviewing fare structure on March 3, 2009. The
transport fare is reviewed on the basis of fluctuation in cost of various effecting parameters such as
price of fuel, insurance rate, vehicle maintenance, price of vehicle parts and accessories, interest rate,
consumer price index, etc. When transport fare was hiked by 9.9% in November 2, 2011 with that of fare
structure on January, 2011, the cost of diesel had increased from Rs 68.50 to Rs 76 and cost of petrol
increased from Rs 97 to Rs 105. Currently the price of diesel is Rs 85 and price of petrol is Rs 115.
13.5
46.7
23.8
9.3 6.6
0
10
20
30
40
50
60
70
80
90
100
Very frequent Fairly frequent Neither frequentnor infrequent
Fairly infrequent Very infrequent
perc
en
t [%
] Frequency of PT Service
in Non-Peak Hours (n = 407)
Distance Fare(Rs)
0-4 Km 13
0-5 Km 14
0-6 Km 15
0-8 Km 16
0-10 Km 18
24
Table 6: Public transport fare assigned by DoTM within ring road as per November 2, 2011
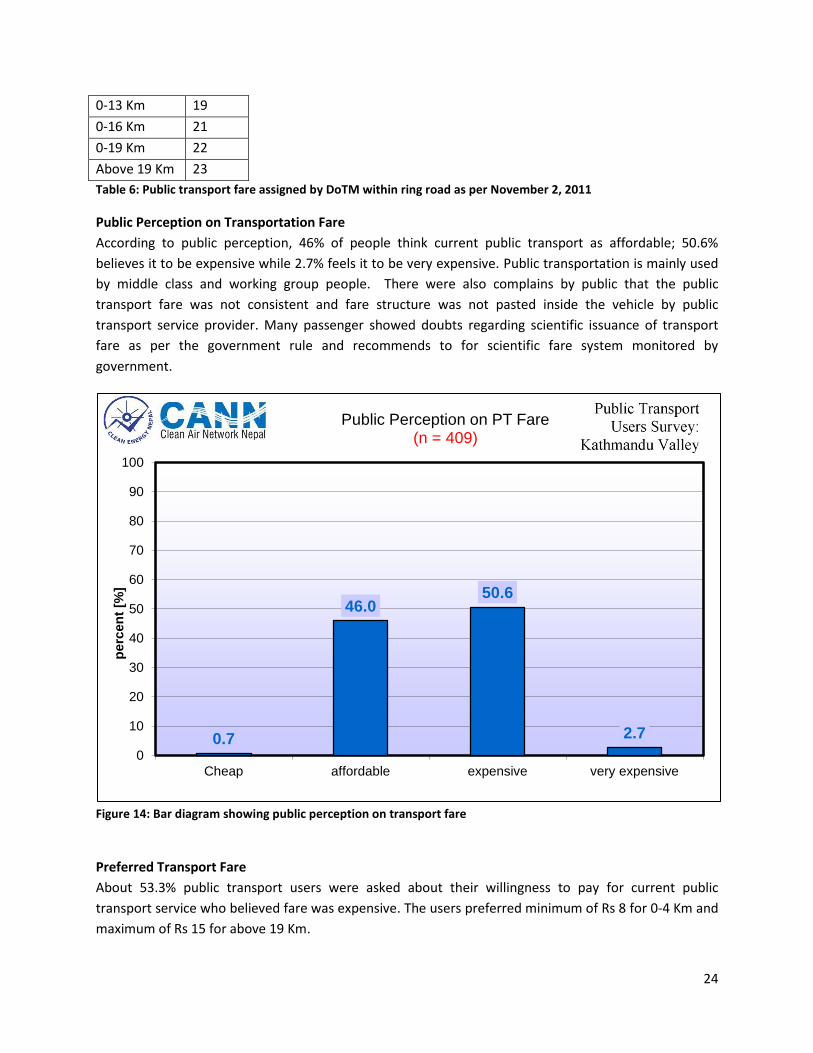
Public Perception on Transportation Fare
According to public perception, 46% of people think current public transport as affordable; 50.6%
believes it to be expensive while 2.7% feels it to be very expensive. Public transportation is mainly used
by middle class and working group people. There were also complains by public that the public
transport fare was not consistent and fare structure was not pasted inside the vehicle by public
transport service provider. Many passenger showed doubts regarding scientific issuance of transport
fare as per the government rule and recommends to for scientific fare system monitored by
government.
Figure 14: Bar diagram showing public perception on transport fare
Preferred Transport Fare
About 53.3% public transport users were asked about their willingness to pay for current public
transport service who believed fare was expensive. The users preferred minimum of Rs 8 for 0-4 Km and
maximum of Rs 15 for above 19 Km.
0.7
46.0 50.6
2.7
0
10
20
30
40
50
60
70
80
90
100
Cheap affordable expensive very expensive
perc
en
t [%
]
Public Perception on PT Fare (n = 409)
0-13 Km 19
0-16 Km 21
0-19 Km 22
Above 19 Km 23
25
Distance Willingness to Pay for Service
Current Fare
0-4 Km 8 13
4-5 Km 10 14
5-6 Km 11 15
6-8 Km 11 16
8-10 Km 12 18
13-16 Km 14 21
Above 19 Km 15 23
Table 7: Willingness to pay for public transport service
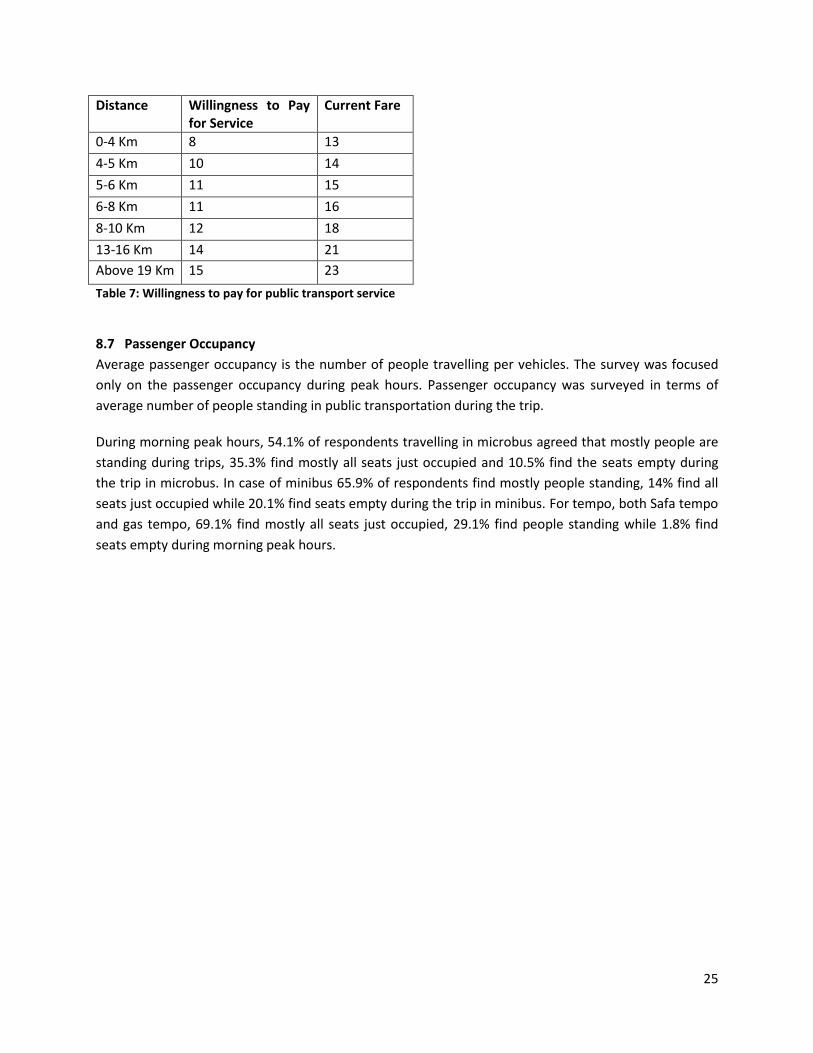
8.7 Passenger Occupancy
Average passenger occupancy is the number of people travelling per vehicles. The survey was focused
only on the passenger occupancy during peak hours. Passenger occupancy was surveyed in terms of
average number of people standing in public transportation during the trip.
During morning peak hours, 54.1% of respondents travelling in microbus agreed that mostly people are
standing during trips, 35.3% find mostly all seats just occupied and 10.5% find the seats empty during
the trip in microbus. In case of minibus 65.9% of respondents find mostly people standing, 14% find all
seats just occupied while 20.1% find seats empty during the trip in minibus. For tempo, both Safa tempo
and gas tempo, 69.1% find mostly all seats just occupied, 29.1% find people standing while 1.8% find
seats empty during morning peak hours.
26
Figure 15: Bar diagram showing vehicle occupancy during morning peak hour
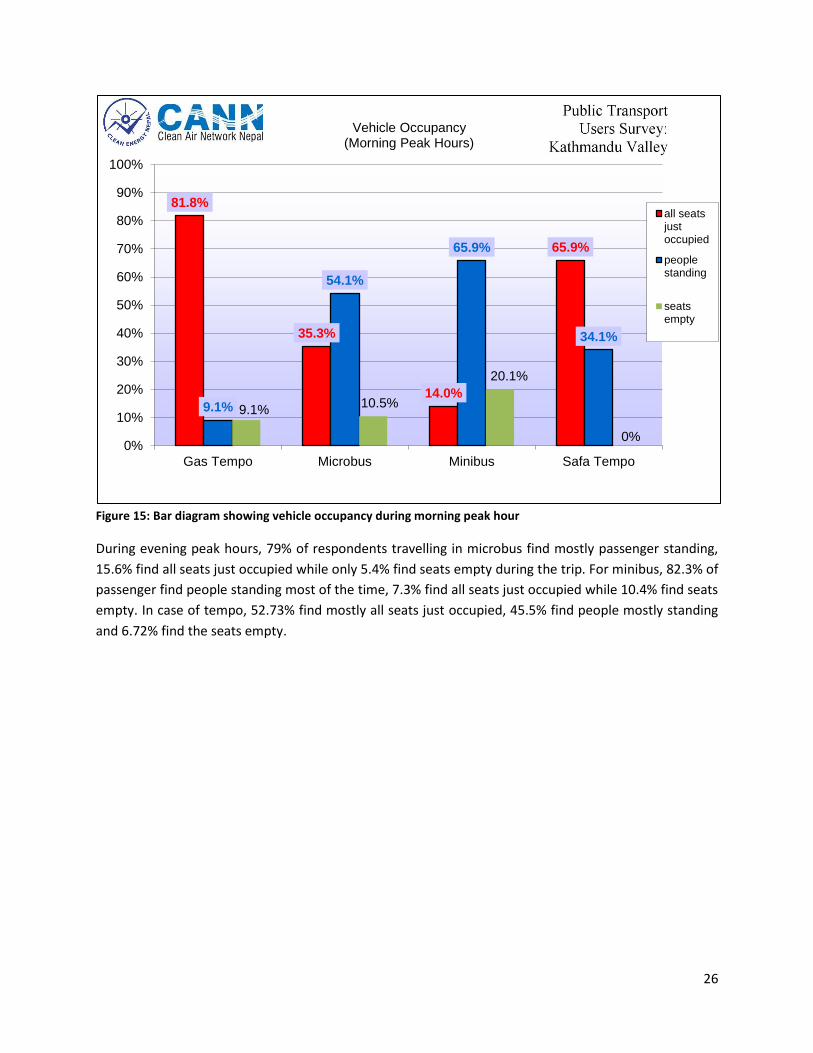
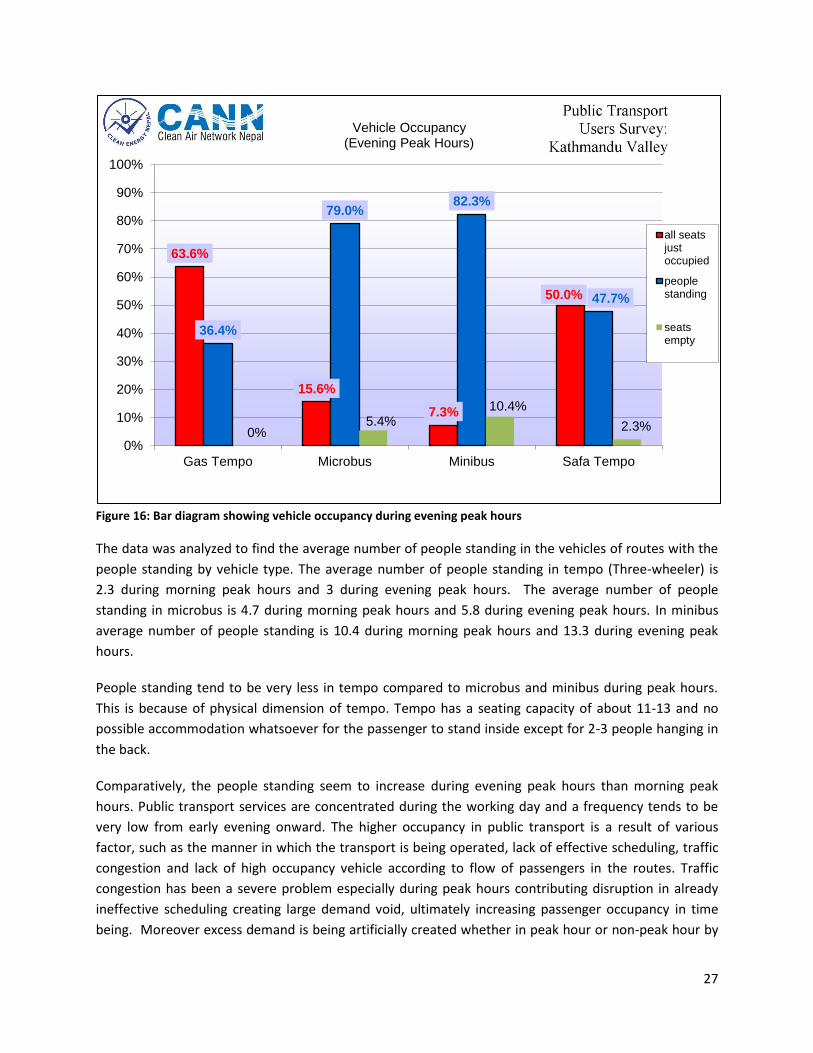
During evening peak hours, 79% of respondents travelling in microbus find mostly passenger standing,
15.6% find all seats just occupied while only 5.4% find seats empty during the trip. For minibus, 82.3% of
passenger find people standing most of the time, 7.3% find all seats just occupied while 10.4% find seats
empty. In case of tempo, 52.73% find mostly all seats just occupied, 45.5% find people mostly standing
and 6.72% find the seats empty.
81.8%
35.3%
14.0%
65.9%
9.1%
54.1%
65.9%
34.1%
9.1% 10.5%
20.1%
0% 0%
10%
20%
30%
40%
50%
60%
70%
80%
90%
100%
Gas Tempo Microbus Minibus Safa Tempo
Vehicle Occupancy (Morning Peak Hours)
all seatsjustoccupied
peoplestanding
seatsempty
27
Figure 16: Bar diagram showing vehicle occupancy during evening peak hours
The data was analyzed to find the average number of people standing in the vehicles of routes with the
people standing by vehicle type. The average number of people standing in tempo (Three-wheeler) is
2.3 during morning peak hours and 3 during evening peak hours. The average number of people
standing in microbus is 4.7 during morning peak hours and 5.8 during evening peak hours. In minibus
average number of people standing is 10.4 during morning peak hours and 13.3 during evening peak
hours.
People standing tend to be very less in tempo compared to microbus and minibus during peak hours.
This is because of physical dimension of tempo. Tempo has a seating capacity of about 11-13 and no
possible accommodation whatsoever for the passenger to stand inside except for 2-3 people hanging in
the back.
Comparatively, the people standing seem to increase during evening peak hours than morning peak
hours. Public transport services are concentrated during the working day and a frequency tends to be
very low from early evening onward. The higher occupancy in public transport is a result of various
factor, such as the manner in which the transport is being operated, lack of effective scheduling, traffic
congestion and lack of high occupancy vehicle according to flow of passengers in the routes. Traffic
congestion has been a severe problem especially during peak hours contributing disruption in already
ineffective scheduling creating large demand void, ultimately increasing passenger occupancy in time
being. Moreover excess demand is being artificially created whether in peak hour or non-peak hour by
63.6%
15.6%
7.3%
50.0%
36.4%
79.0% 82.3%
47.7%
0% 5.4%
10.4%
2.3%
0%
10%
20%
30%
40%
50%
60%
70%
80%
90%
100%
Gas Tempo Microbus Minibus Safa Tempo
Vehicle Occupancy (Evening Peak Hours)
all seatsjustoccupied
peoplestanding
seatsempty
28
drivers as irrespective of scheduling; drivers themselves decide when to depart often waiting until the
vehicle is fully occupied double its capacity in most cases. The other considerable factor is lack of high
occupancy vehicle in high demanding routes to accommodate high demand.
The issue of women and children subjected to sexual harassment in over crowded public transport
should also be of great concern for the authorities. Sexual harassment against fairer sex in public
transport is growing, says a research entitled “Women and Cities: Examining the gender impact of
violence and urbanization” conducted in five countries – Nepal, Ethopia, Cambodia, Liberia and
Uganda.9 According to the report, out of 100 females who use public transport on a daily basis, a
majority stated that they felt very uncomfortable to travel in buses and micro vans, yet they had no
choice claiming that such harassments have become rampant due to overcrowding. According to Public
Transport Code of Conduct, 2067, drivers and conductors are not allowed to exceed the capacity of
vehicle. There is urgent need of addressing overcrowding in public transport system and system for
controlling such violence.
Mode Seating capacity People Standing(Morning Peak Hours)
Average Minimum Maximum Standard deviation
Microbus 14-16 4.7 1.0 15.0 2.5
Minibus 25-30 10.4 1.0 25.0 6.7
Tempo 11-14 2.3 1.0 4.0 0.9
Table 8: Table showing statistical parameter of people standing during morning peak hours
Mode Seating capacity People Standing(Evening Peak Hours)
Average Minimum Maximum Standard deviation
Microbus 14-16 5.8 1.0 14.0 2.5
Minibus 25-30 13.3 2.0 30.0 5.7
Tempo 11-14 3.0 1.0 5.0 1.4
Table 9: Statistical parameter of people standing during evening peak hours
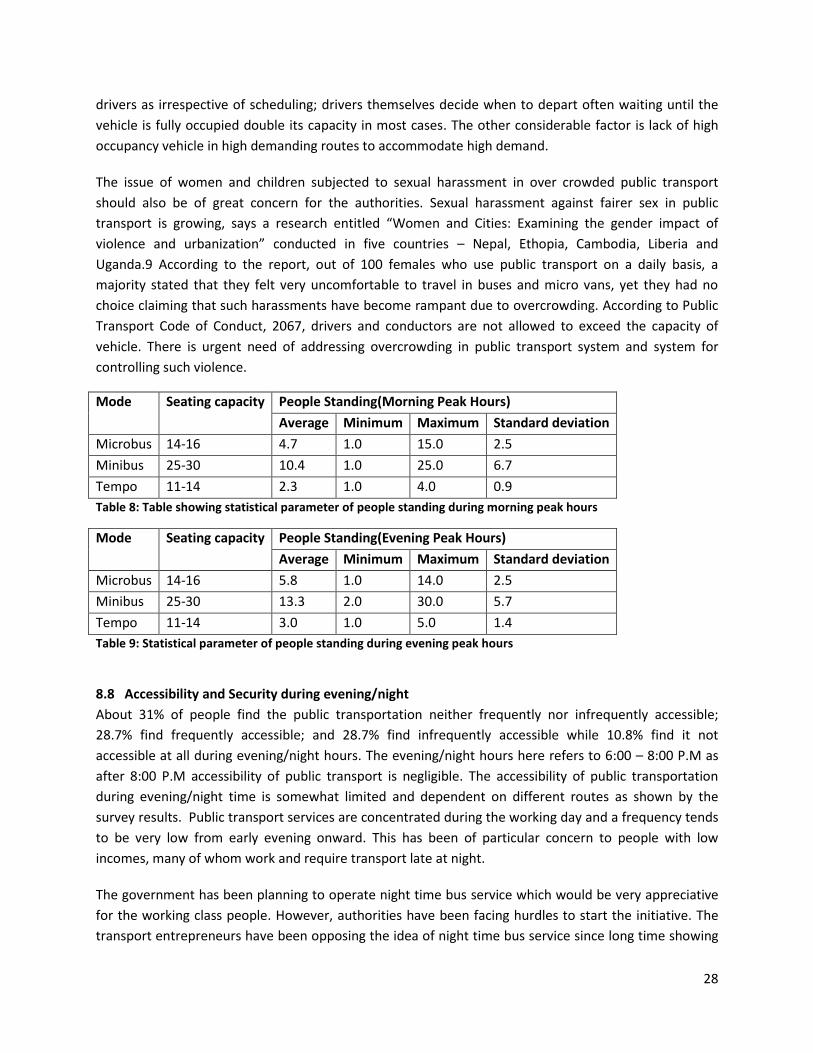
8.8 Accessibility and Security during evening/night
About 31% of people find the public transportation neither frequently nor infrequently accessible;
28.7% find frequently accessible; and 28.7% find infrequently accessible while 10.8% find it not
accessible at all during evening/night hours. The evening/night hours here refers to 6:00 – 8:00 P.M as
after 8:00 P.M accessibility of public transport is negligible. The accessibility of public transportation
during evening/night time is somewhat limited and dependent on different routes as shown by the
survey results. Public transport services are concentrated during the working day and a frequency tends
to be very low from early evening onward. This has been of particular concern to people with low
incomes, many of whom work and require transport late at night.
The government has been planning to operate night time bus service which would be very appreciative
for the working class people. However, authorities have been facing hurdles to start the initiative. The
transport entrepreneurs have been opposing the idea of night time bus service since long time showing
29
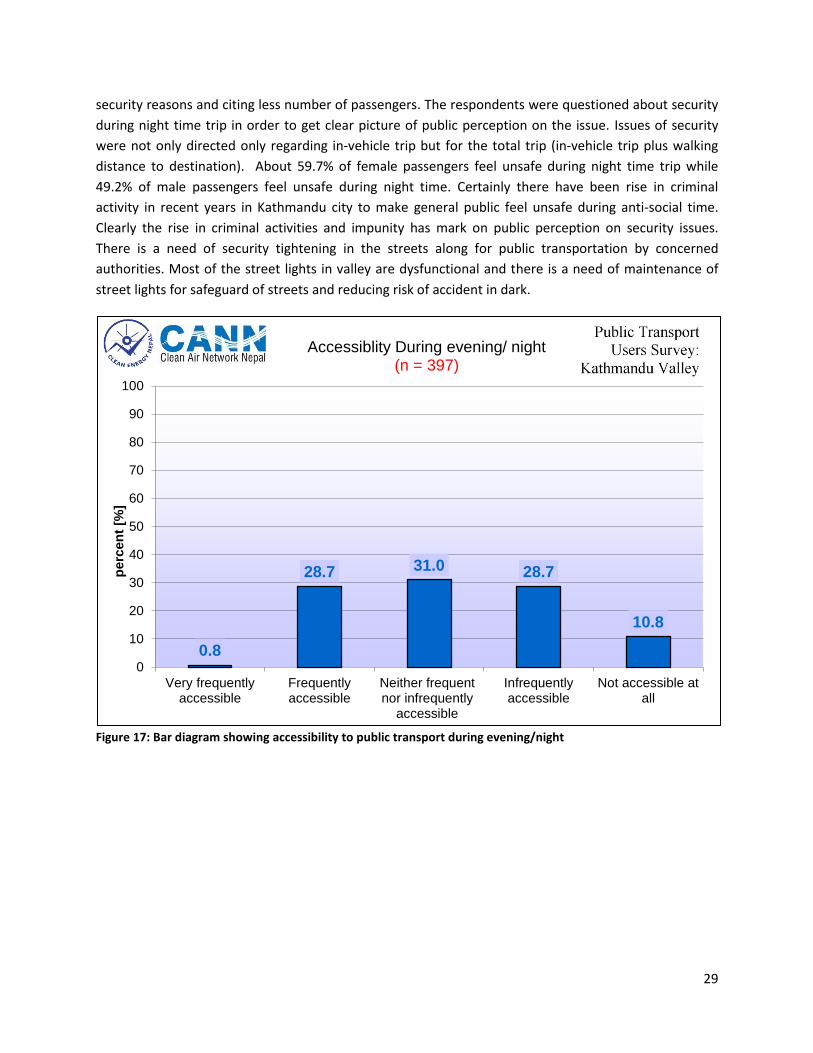
security reasons and citing less number of passengers. The respondents were questioned about security
during night time trip in order to get clear picture of public perception on the issue. Issues of security
were not only directed only regarding in-vehicle trip but for the total trip (in-vehicle trip plus walking
distance to destination). About 59.7% of female passengers feel unsafe during night time trip while
49.2% of male passengers feel unsafe during night time. Certainly there have been rise in criminal
activity in recent years in Kathmandu city to make general public feel unsafe during anti-social time.
Clearly the rise in criminal activities and impunity has mark on public perception on security issues.
There is a need of security tightening in the streets along for public transportation by concerned
authorities. Most of the street lights in valley are dysfunctional and there is a need of maintenance of
street lights for safeguard of streets and reducing risk of accident in dark.
Figure 17: Bar diagram showing accessibility to public transport during evening/night
0.8
28.7 31.0 28.7
10.8
0
10
20
30
40
50
60
70
80
90
100
Very frequentlyaccessible
Frequentlyaccessible
Neither frequentnor infrequently
accessible
Infrequentlyaccessible
Not accessible atall
perc
en
t [%
]
Accessiblity During evening/ night (n = 397)
30
Figure 18: Bar diagram showing perception on security on using public transport during night
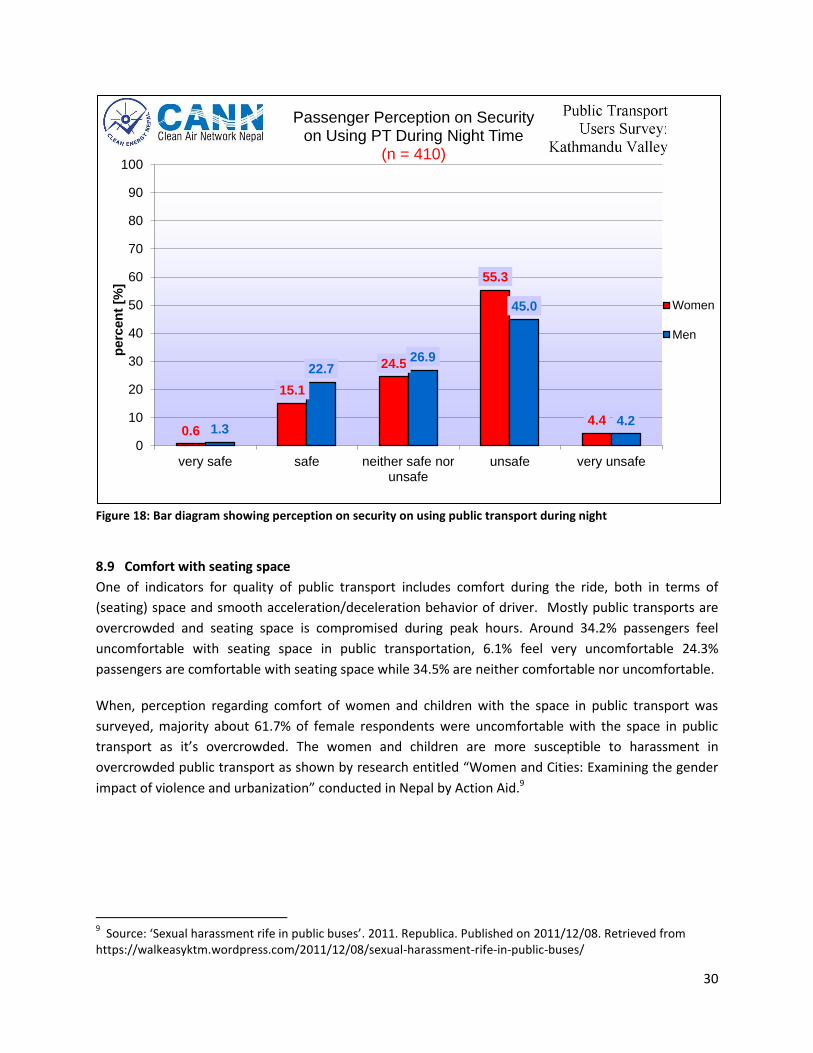
8.9 Comfort with seating space
One of indicators for quality of public transport includes comfort during the ride, both in terms of
(seating) space and smooth acceleration/deceleration behavior of driver. Mostly public transports are
overcrowded and seating space is compromised during peak hours. Around 34.2% passengers feel
uncomfortable with seating space in public transportation, 6.1% feel very uncomfortable 24.3%
passengers are comfortable with seating space while 34.5% are neither comfortable nor uncomfortable.
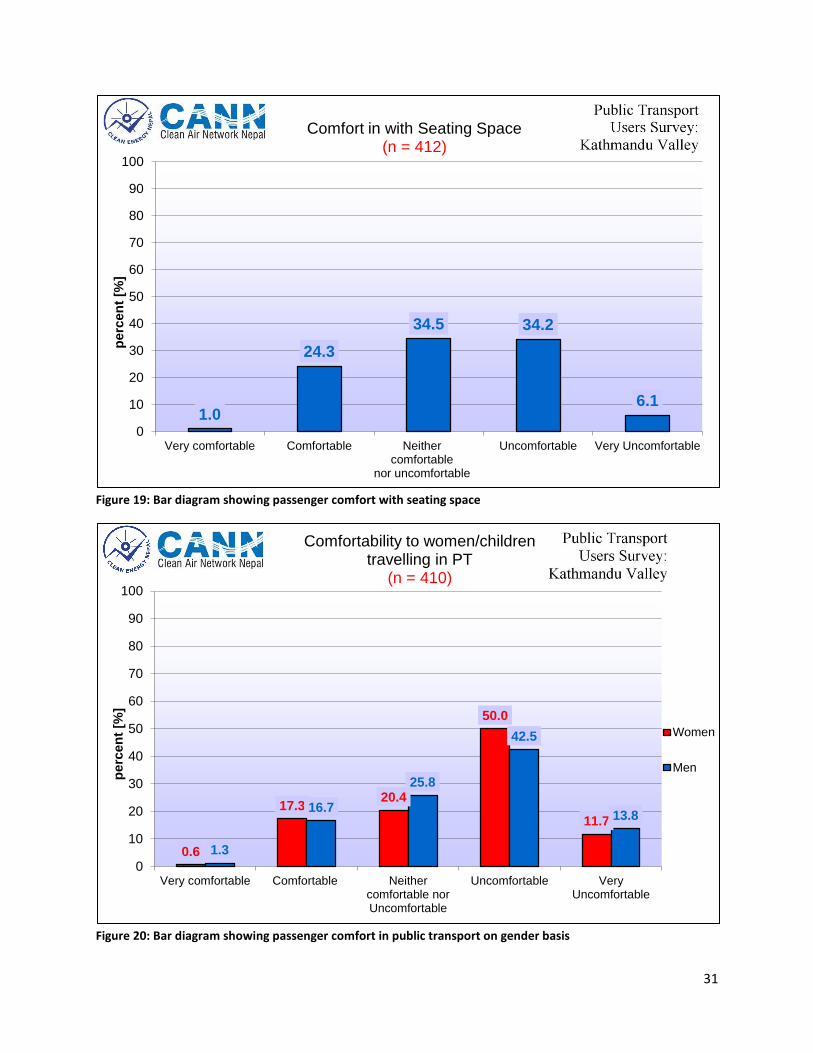
When, perception regarding comfort of women and children with the space in public transport was
surveyed, majority about 61.7% of female respondents were uncomfortable with the space in public
transport as it’s overcrowded. The women and children are more susceptible to harassment in
overcrowded public transport as shown by research entitled “Women and Cities: Examining the gender
impact of violence and urbanization” conducted in Nepal by Action Aid.9
9 Source: ‘Sexual harassment rife in public buses’. 2011. Republica. Published on 2011/12/08. Retrieved from
https://walkeasyktm.wordpress.com/2011/12/08/sexual-harassment-rife-in-public-buses/
0.6
15.1
24.5
55.3
4.4 1.3
22.7 26.9
45.0
4.2
0
10
20
30
40
50
60
70
80
90
100
very safe safe neither safe norunsafe
unsafe very unsafe
perc
en
t [%
] Passenger Perception on Security
on Using PT During Night Time (n = 410)
Women
Men
31
Figure 19: Bar diagram showing passenger comfort with seating space
Figure 20: Bar diagram showing passenger comfort in public transport on gender basis
1.0
24.3
34.5 34.2
6.1
0
10
20
30
40
50
60
70
80
90
100
Very comfortable Comfortable Neithercomfortable
nor uncomfortable
Uncomfortable Very Uncomfortable
perc
en
t [%
] Comfort in with Seating Space
(n = 412)
0.6
17.3 20.4
50.0
11.7
1.3
16.7
25.8
42.5
13.8
0
10
20
30
40
50
60
70
80
90
100
Very comfortable Comfortable Neithercomfortable norUncomfortable
Uncomfortable VeryUncomfortable
perc
en
t [%
]
Comfortability to women/children travelling in PT
(n = 410)
Women
Men
32
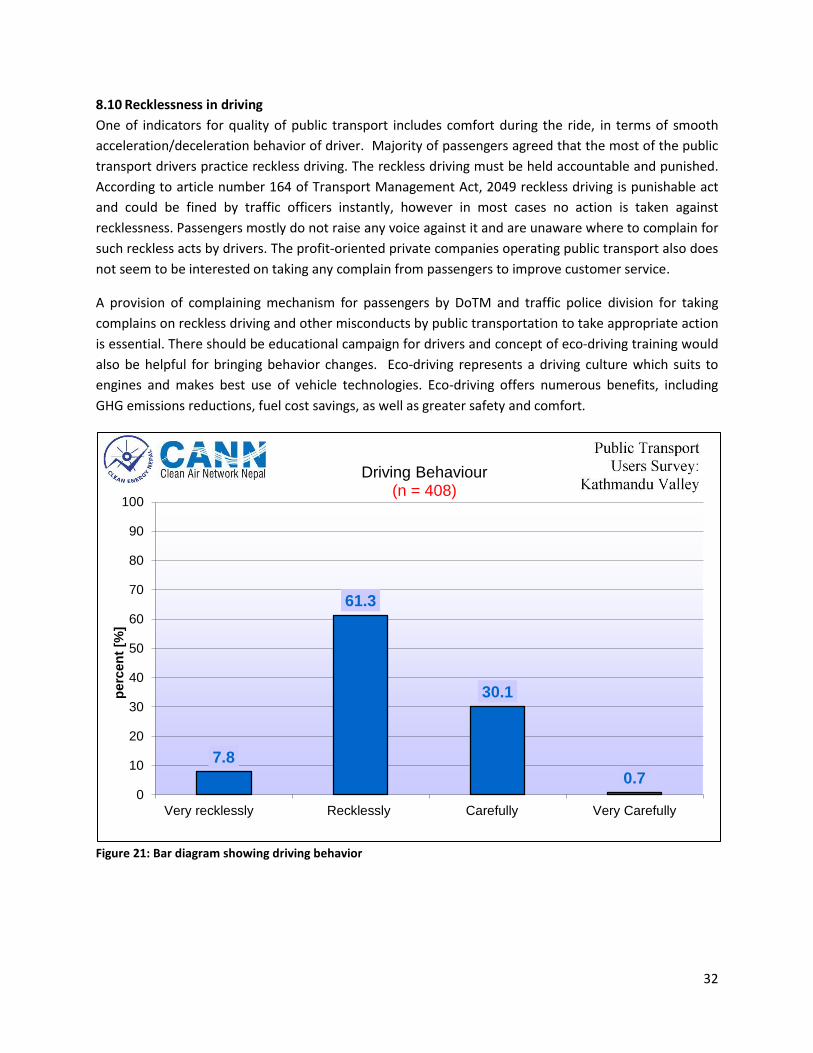
8.10 Recklessness in driving
One of indicators for quality of public transport includes comfort during the ride, in terms of smooth
acceleration/deceleration behavior of driver. Majority of passengers agreed that the most of the public
transport drivers practice reckless driving. The reckless driving must be held accountable and punished.
According to article number 164 of Transport Management Act, 2049 reckless driving is punishable act
and could be fined by traffic officers instantly, however in most cases no action is taken against
recklessness. Passengers mostly do not raise any voice against it and are unaware where to complain for
such reckless acts by drivers. The profit-oriented private companies operating public transport also does
not seem to be interested on taking any complain from passengers to improve customer service.
A provision of complaining mechanism for passengers by DoTM and traffic police division for taking
complains on reckless driving and other misconducts by public transportation to take appropriate action
is essential. There should be educational campaign for drivers and concept of eco-driving training would
also be helpful for bringing behavior changes. Eco-driving represents a driving culture which suits to
engines and makes best use of vehicle technologies. Eco-driving offers numerous benefits, including
GHG emissions reductions, fuel cost savings, as well as greater safety and comfort.
Figure 21: Bar diagram showing driving behavior
7.8
61.3
30.1
0.7 0
10
20
30
40
50
60
70
80
90
100
Very recklessly Recklessly Carefully Very Carefully
perc
en
t [%
]
Driving Behaviour (n = 408)
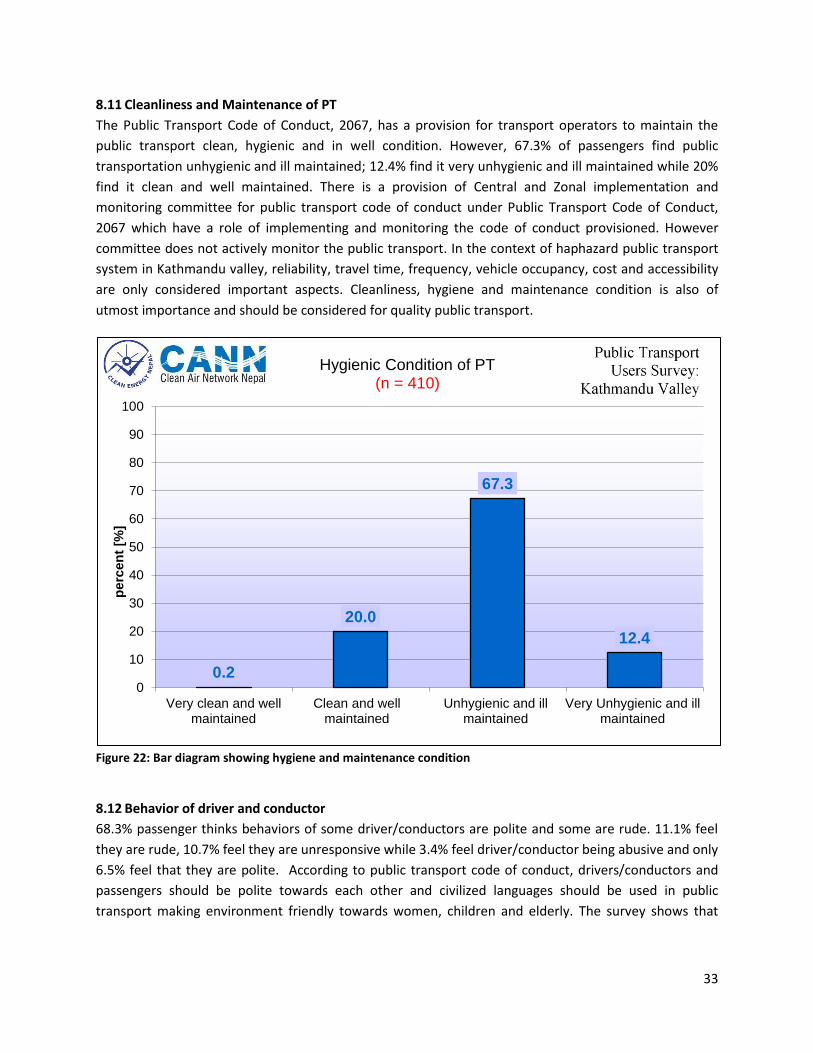
33
8.11 Cleanliness and Maintenance of PT
The Public Transport Code of Conduct, 2067, has a provision for transport operators to maintain the
public transport clean, hygienic and in well condition. However, 67.3% of passengers find public
transportation unhygienic and ill maintained; 12.4% find it very unhygienic and ill maintained while 20%
find it clean and well maintained. There is a provision of Central and Zonal implementation and
monitoring committee for public transport code of conduct under Public Transport Code of Conduct,
2067 which have a role of implementing and monitoring the code of conduct provisioned. However
committee does not actively monitor the public transport. In the context of haphazard public transport
system in Kathmandu valley, reliability, travel time, frequency, vehicle occupancy, cost and accessibility
are only considered important aspects. Cleanliness, hygiene and maintenance condition is also of
utmost importance and should be considered for quality public transport.
Figure 22: Bar diagram showing hygiene and maintenance condition
8.12 Behavior of driver and conductor
68.3% passenger thinks behaviors of some driver/conductors are polite and some are rude. 11.1% feel
they are rude, 10.7% feel they are unresponsive while 3.4% feel driver/conductor being abusive and only
6.5% feel that they are polite. According to public transport code of conduct, drivers/conductors and
passengers should be polite towards each other and civilized languages should be used in public
transport making environment friendly towards women, children and elderly. The survey shows that
0.2
20.0
67.3
12.4
0
10
20
30
40
50
60
70
80
90
100
Very clean and wellmaintained
Clean and wellmaintained
Unhygienic and illmaintained
Very Unhygienic and illmaintained
perc
en
t [%
]
Hygienic Condition of PT (n = 410)
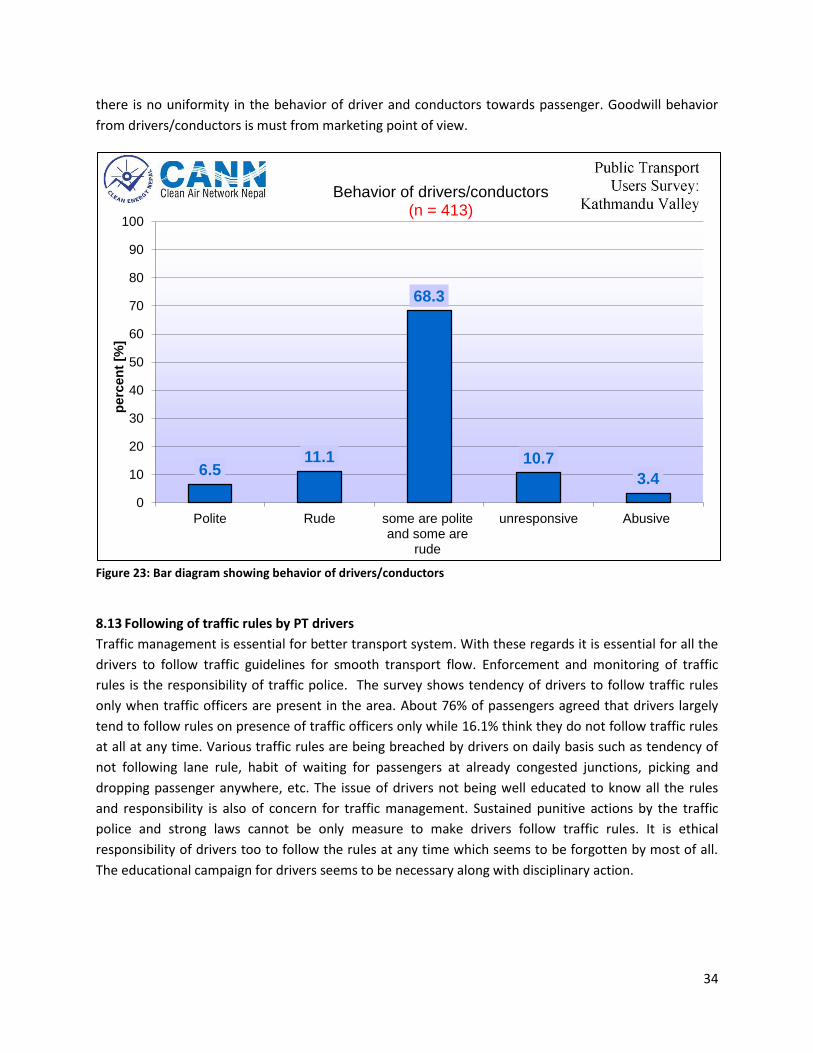
34
there is no uniformity in the behavior of driver and conductors towards passenger. Goodwill behavior
from drivers/conductors is must from marketing point of view.
Figure 23: Bar diagram showing behavior of drivers/conductors
8.13 Following of traffic rules by PT drivers
Traffic management is essential for better transport system. With these regards it is essential for all the
drivers to follow traffic guidelines for smooth transport flow. Enforcement and monitoring of traffic
rules is the responsibility of traffic police. The survey shows tendency of drivers to follow traffic rules
only when traffic officers are present in the area. About 76% of passengers agreed that drivers largely
tend to follow rules on presence of traffic officers only while 16.1% think they do not follow traffic rules
at all at any time. Various traffic rules are being breached by drivers on daily basis such as tendency of
not following lane rule, habit of waiting for passengers at already congested junctions, picking and
dropping passenger anywhere, etc. The issue of drivers not being well educated to know all the rules
and responsibility is also of concern for traffic management. Sustained punitive actions by the traffic
police and strong laws cannot be only measure to make drivers follow traffic rules. It is ethical
responsibility of drivers too to follow the rules at any time which seems to be forgotten by most of all.
The educational campaign for drivers seems to be necessary along with disciplinary action.
6.5 11.1
68.3
10.7
3.4
0
10
20
30
40
50
60
70
80
90
100
Polite Rude some are politeand some are
rude
unresponsive Abusive
perc
en
t [%
]
Behavior of drivers/conductors (n = 413)
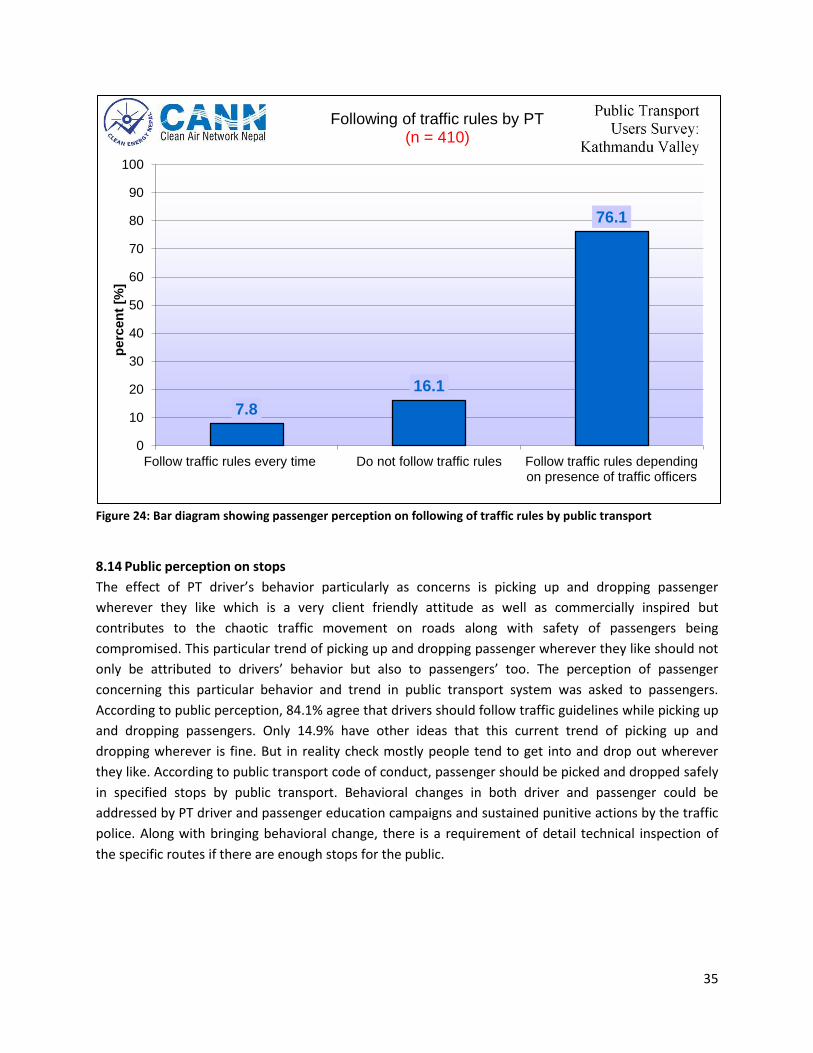
35
Figure 24: Bar diagram showing passenger perception on following of traffic rules by public transport
8.14 Public perception on stops
The effect of PT driver’s behavior particularly as concerns is picking up and dropping passenger
wherever they like which is a very client friendly attitude as well as commercially inspired but
contributes to the chaotic traffic movement on roads along with safety of passengers being
compromised. This particular trend of picking up and dropping passenger wherever they like should not
only be attributed to drivers’ behavior but also to passengers’ too. The perception of passenger
concerning this particular behavior and trend in public transport system was asked to passengers.
According to public perception, 84.1% agree that drivers should follow traffic guidelines while picking up
and dropping passengers. Only 14.9% have other ideas that this current trend of picking up and
dropping wherever is fine. But in reality check mostly people tend to get into and drop out wherever
they like. According to public transport code of conduct, passenger should be picked and dropped safely
in specified stops by public transport. Behavioral changes in both driver and passenger could be
addressed by PT driver and passenger education campaigns and sustained punitive actions by the traffic
police. Along with bringing behavioral change, there is a requirement of detail technical inspection of
the specific routes if there are enough stops for the public.
7.8
16.1
76.1
0
10
20
30
40
50
60
70
80
90
100
Follow traffic rules every time Do not follow traffic rules Follow traffic rules dependingon presence of traffic officers
perc
en
t [%
] Following of traffic rules by PT
(n = 410)
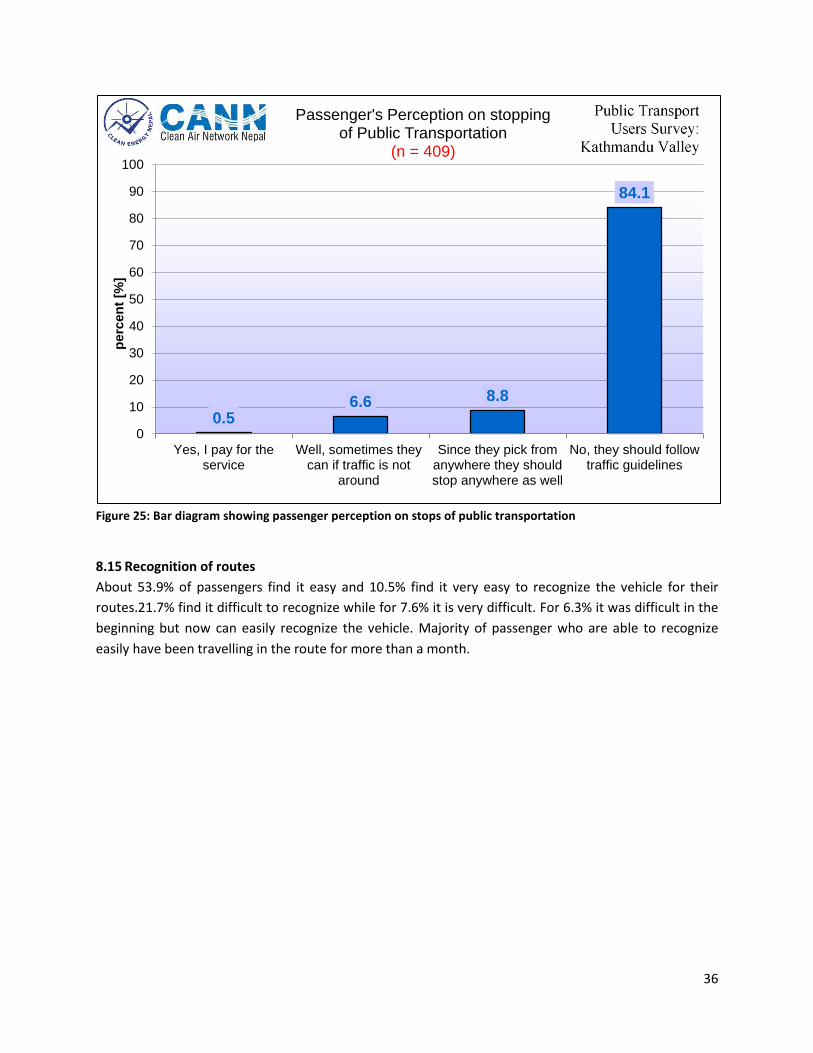
36
Figure 25: Bar diagram showing passenger perception on stops of public transportation
8.15 Recognition of routes
About 53.9% of passengers find it easy and 10.5% find it very easy to recognize the vehicle for their
routes.21.7% find it difficult to recognize while for 7.6% it is very difficult. For 6.3% it was difficult in the
beginning but now can easily recognize the vehicle. Majority of passenger who are able to recognize
easily have been travelling in the route for more than a month.
0.5 6.6 8.8
84.1
0
10
20
30
40
50
60
70
80
90
100
Yes, I pay for theservice
Well, sometimes theycan if traffic is not
around
Since they pick fromanywhere they shouldstop anywhere as well
No, they should followtraffic guidelines
perc
en
t [%
] Passenger's Perception on stopping
of Public Transportation (n = 409)
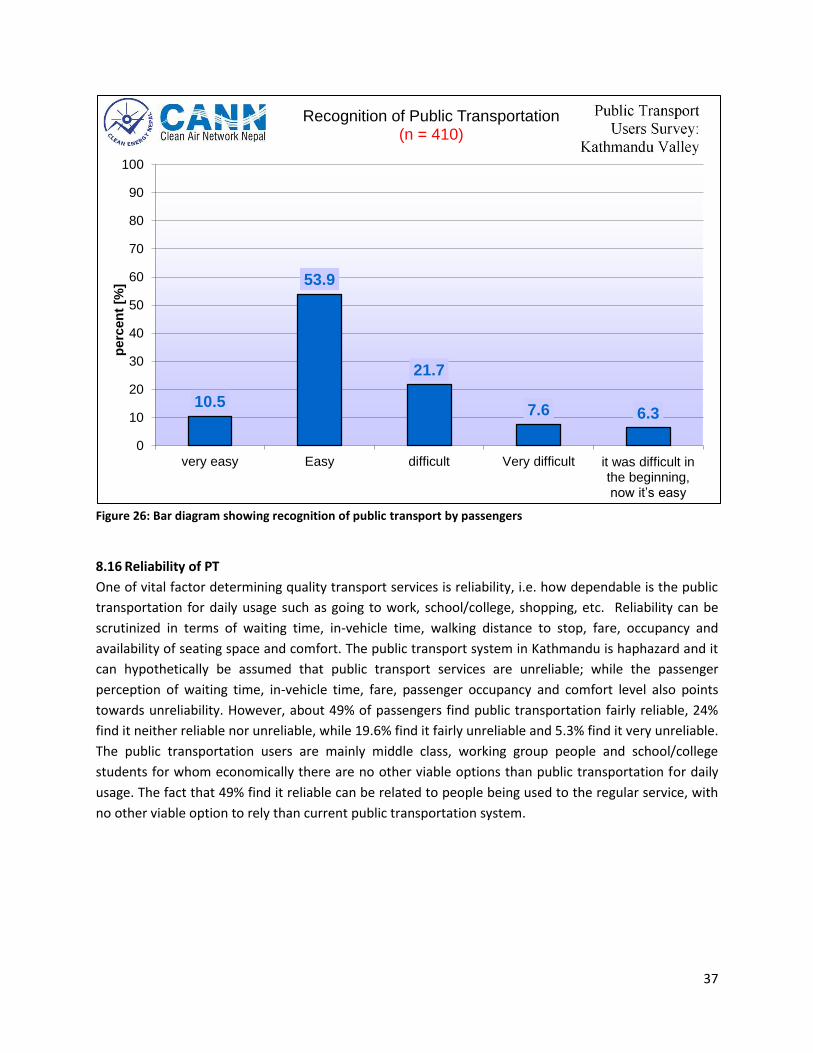
37
Figure 26: Bar diagram showing recognition of public transport by passengers
8.16 Reliability of PT
One of vital factor determining quality transport services is reliability, i.e. how dependable is the public
transportation for daily usage such as going to work, school/college, shopping, etc. Reliability can be
scrutinized in terms of waiting time, in-vehicle time, walking distance to stop, fare, occupancy and
availability of seating space and comfort. The public transport system in Kathmandu is haphazard and it
can hypothetically be assumed that public transport services are unreliable; while the passenger
perception of waiting time, in-vehicle time, fare, passenger occupancy and comfort level also points
towards unreliability. However, about 49% of passengers find public transportation fairly reliable, 24%
find it neither reliable nor unreliable, while 19.6% find it fairly unreliable and 5.3% find it very unreliable.
The public transportation users are mainly middle class, working group people and school/college
students for whom economically there are no other viable options than public transportation for daily
usage. The fact that 49% find it reliable can be related to people being used to the regular service, with
no other viable option to rely than current public transportation system.
10.5
53.9
21.7
7.6 6.3
0
10
20
30
40
50
60
70
80
90
100
very easy Easy difficult Very difficult it was difficult in the beginning, now it’s easy
perc
en
t [%
] Recognition of Public Transportation
(n = 410)
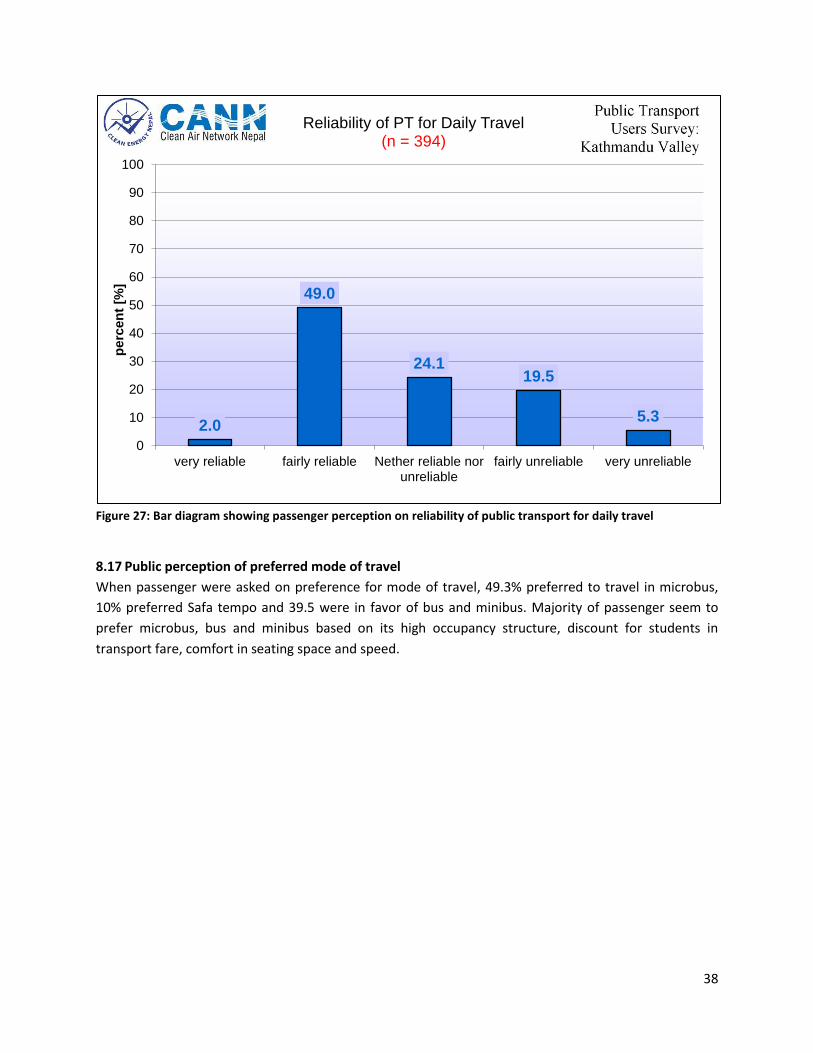
38
Figure 27: Bar diagram showing passenger perception on reliability of public transport for daily travel
8.17 Public perception of preferred mode of travel
When passenger were asked on preference for mode of travel, 49.3% preferred to travel in microbus,
10% preferred Safa tempo and 39.5 were in favor of bus and minibus. Majority of passenger seem to
prefer microbus, bus and minibus based on its high occupancy structure, discount for students in
transport fare, comfort in seating space and speed.
2.0
49.0
24.1 19.5
5.3
0
10
20
30
40
50
60
70
80
90
100
very reliable fairly reliable Nether reliable norunreliable
fairly unreliable very unreliable
perc
en
t [%
] Reliability of PT for Daily Travel
(n = 394)
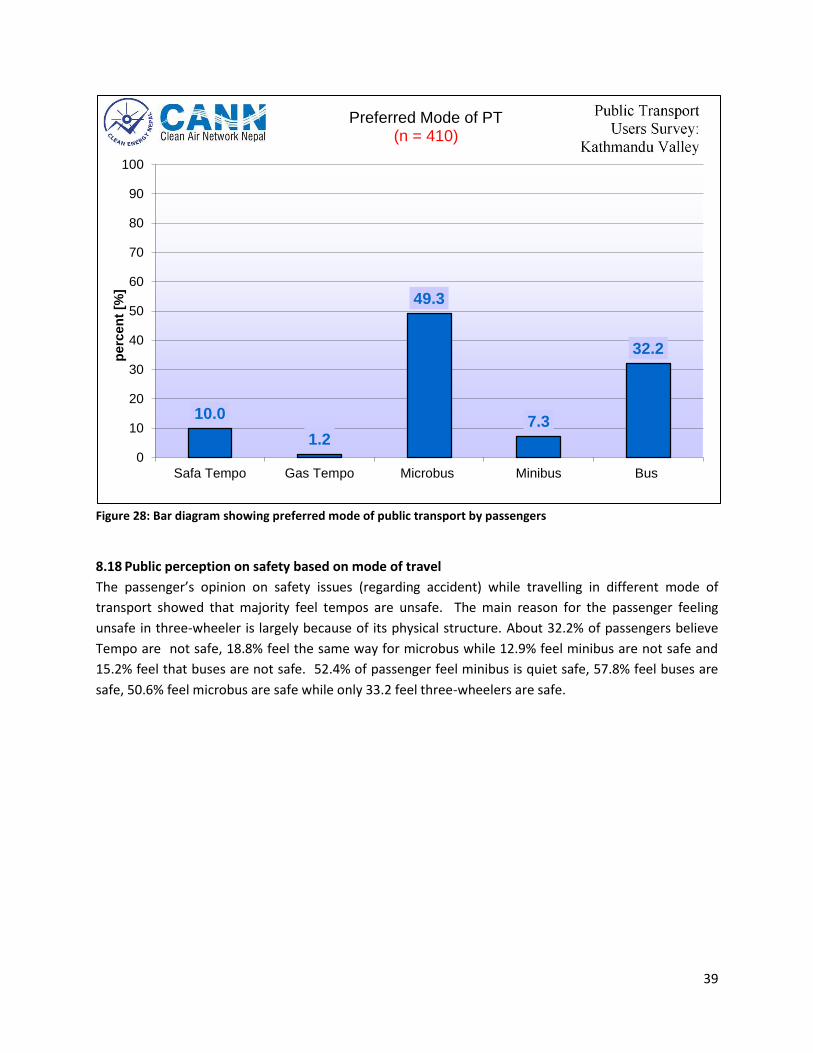
39
Figure 28: Bar diagram showing preferred mode of public transport by passengers
8.18 Public perception on safety based on mode of travel
The passenger’s opinion on safety issues (regarding accident) while travelling in different mode of
transport showed that majority feel tempos are unsafe. The main reason for the passenger feeling
unsafe in three-wheeler is largely because of its physical structure. About 32.2% of passengers believe
Tempo are not safe, 18.8% feel the same way for microbus while 12.9% feel minibus are not safe and
15.2% feel that buses are not safe. 52.4% of passenger feel minibus is quiet safe, 57.8% feel buses are
safe, 50.6% feel microbus are safe while only 33.2 feel three-wheelers are safe.
10.0
1.2
49.3
7.3
32.2
0
10
20
30
40
50
60
70
80
90
100
Safa Tempo Gas Tempo Microbus Minibus Bus
perc
en
t [%
] Preferred Mode of PT
(n = 410)
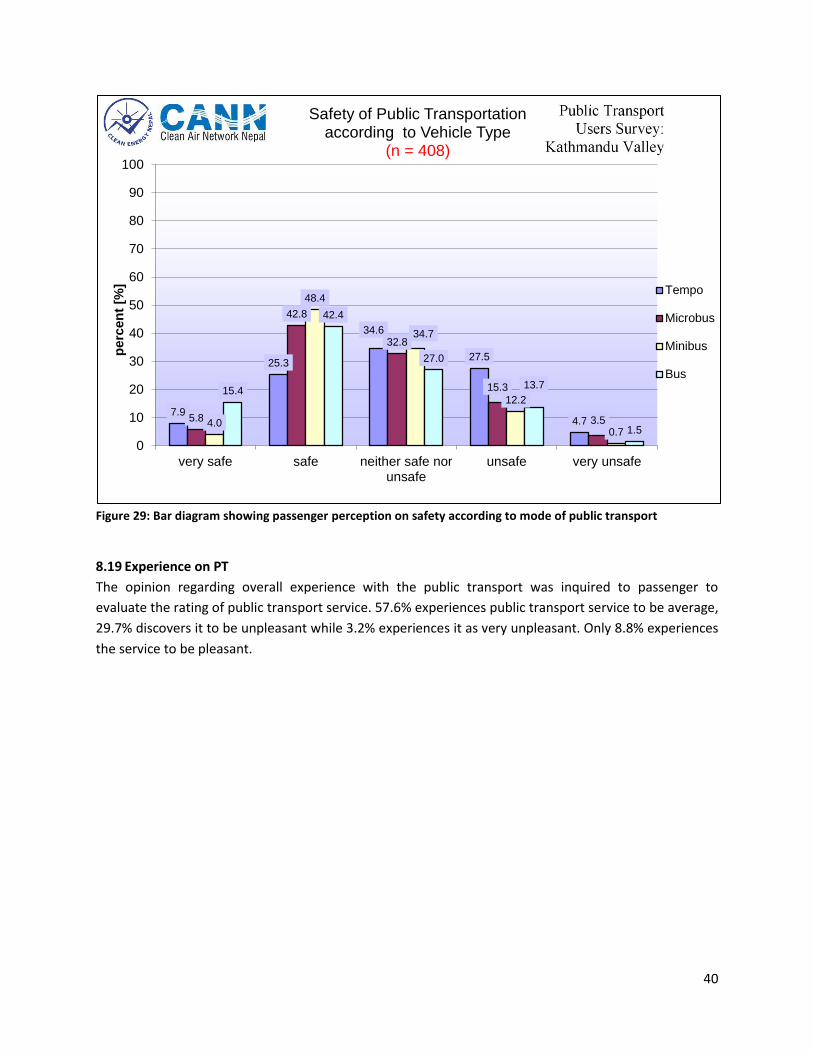
40
Figure 29: Bar diagram showing passenger perception on safety according to mode of public transport
8.19 Experience on PT
The opinion regarding overall experience with the public transport was inquired to passenger to
evaluate the rating of public transport service. 57.6% experiences public transport service to be average,
29.7% discovers it to be unpleasant while 3.2% experiences it as very unpleasant. Only 8.8% experiences
the service to be pleasant.
7.9
25.3
34.6
27.5
4.7 5.8
42.8
32.8
15.3
3.5 4.0
48.4
34.7
12.2
0.7
15.4
42.4
27.0
13.7
1.5
0
10
20
30
40
50
60
70
80
90
100
very safe safe neither safe norunsafe
unsafe very unsafe
perc
en
t [%
] Safety of Public Transportation
according to Vehicle Type (n = 408)
Tempo
Microbus
Minibus
Bus
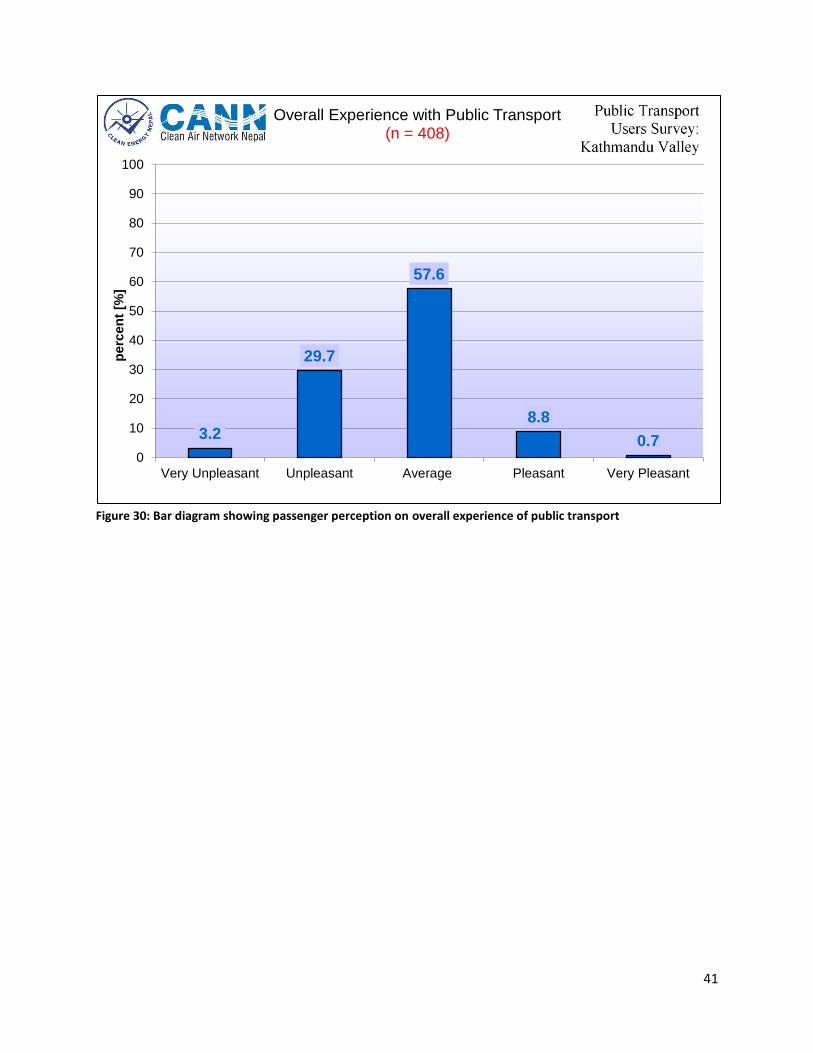
41
Figure 30: Bar diagram showing passenger perception on overall experience of public transport
3.2
29.7
57.6
8.8
0.7 0
10
20
30
40
50
60
70
80
90
100
Very Unpleasant Unpleasant Average Pleasant Very Pleasant
perc
en
t [%
] Overall Experience with Public Transport
(n = 408)
42
9. Recommendation
The current public transport service is unreliable and undependable on different aspects: in-vehicle
time, frequency of service, availability of service during anti-social time, and level of comfort by
overcrowding and recklessness in driving. A primary objective should be to ensure the reliability and
comfort of public transport service by various initiatives.
1. Improve the frequency and in-vehicle time
Public transport operators being mostly concerned about occupying maximum passengers than the time
schedule, for more profit makes the public transport frequency. The time schedule of transport
operators also seems to be non scientific and ineffective along with manipulation of traffic congestion.
The proper evaluation study is required whether carrying more passengers per trip would be more
economic or by conducting more trips (maximum vehicle utilization) during that frame of time rather
than sitting idle at stops for longer periods would generate more revenue. Based on detailed study
effective time schedule should be implemented by public transport operators to improve frequency of
their service.
2. Reduce overcrowding in Public Transport
The public transport is mostly overcrowded and makes passenger uncomfortable and unsafe especially
for women and children with the rise of sexual harassment. There is no effective monitoring by
authorities regarding overcrowding of public transport although the Public Transport Code of Conduct,
2067 does not allow exceeding the capacity of public transport. The problem of overcrowding is also as a
result of frequency of public transport not meeting the travel demand along with the size of the vehicles
being insufficient. Various steps can be sought to reduce overcrowding. As suggested in KSUT, the small
vehicles need to be replaced by big buses to solve the problem of both overcrowding and traffic
congestion. The effective scheduling of public transport can also contribute to reduce overcrowding. For
reducing the overcrowding during morning and evening peak hours, the effective change in time
schedule of different offices and schools can be option in the area for reducing overcrowding. The
effective monitoring by authorities and provision of fine and punishment for operators exceeding
passenger capacity is required to crack down on operators who loads
3. Availability of service during night time:
The night time public transport should be operated in order to provide safe and sound service to the
people with low incomes, many of whom work and require transport late evening and at night. The
government has been planning to operate night time bus service which would be very appreciative for
the working class people however this plan is still to be implemented till date.
4. Uniformity in public transport fare:
The survey shows passenger complains regarding public transport fare not being consistent and fare
structure not pasted inside the vehicle by operator. The operators should paste fare structure inside
vehicle for providing information to passenger. The government should effectively monitor scientific
issuance of transport fare by operators as per the government rule.
43
5. Monitoring of reckless driving:
The reckless driving making passenger unsafe and uncomfortable should be brought under the book of
justice as per Vehicle and Transport Management Act, 2049 and Public Transport code of conduct, 2067.
There should also be mechanism developed by both government and transport operators for accepting
complain from the passenger and take necessary action against recklessness by public transport.
6. Uniformity in behavior of driver and conductors:
The survey shows lack of uniformity in behavior of driver and conductor. There should be provision for
awareness education and courses for drivers and conductors regarding proper attitude and behavior
towards the passengers. Along with it there should be proper and effective implementation and
monitoring of Public Transport Code of Conduct, 2067, according to which drivers/conductors and
passengers should be polite towards each other and civilized languages should be used in public
transport making environment friendly towards women, children and elderly. Goodwill behavior from
drivers/conductors is must from marketing point of view however only one transport service option for
people due to uncompetitive syndicate system, makes it non-mandatory for the operators. The
complain mechanism needs to be formulated and provision of punishment for non-civilized attitude and
behavior by driver, conductor and other passengers needs to be clear.
7. Clean, hygienic and well maintained public transport:
The survey shows that most of public transports are unhygienic and not well maintained. There should
be regular and effective monitoring regarding hygiene and maintenance condition of the public
transports as provisioned by Public Transport Code of Conduct, 2067.
8. Route Management:
There is a basic network of about 25 routes, with most routes having several variations—almost 20 in
one caseKSUT. The existing route network seems to be very complicated and developed without any
assessment. Most of the routes are developed on the initiation of transport operators rather than DoTM
who has this responsibility. There should be detail origin-destination study along with feasibility study of
overall Kathmandu valley and issuing of routes needs to be done based on this study by DoTM.
9. Establishment of Ministry of Transport and Investment on Public Transport:
The Department of Transport Management is more like revenue generating office and understaffed to
fulfill its responsibility. The absence proper disintegration of responsibilities among different agencies,
absence of coordination and lack of government investment in public transport are also the main factors
for the poor transport quality in the country. Establishment of Ministry of Transport with sufficient
resource to look at the transport sector solely and more government investment in public transport
would be the starting point for the solution.
10. Eradication of syndicate system in public transport service:
The syndicate system in public transport service is one of the reasons for lack of healthy competition
resulting in poor transport quality. There needs to be eradication of syndicate system in public transport
sector by government in order to attract investment through competitive market and improve public
transport quality.
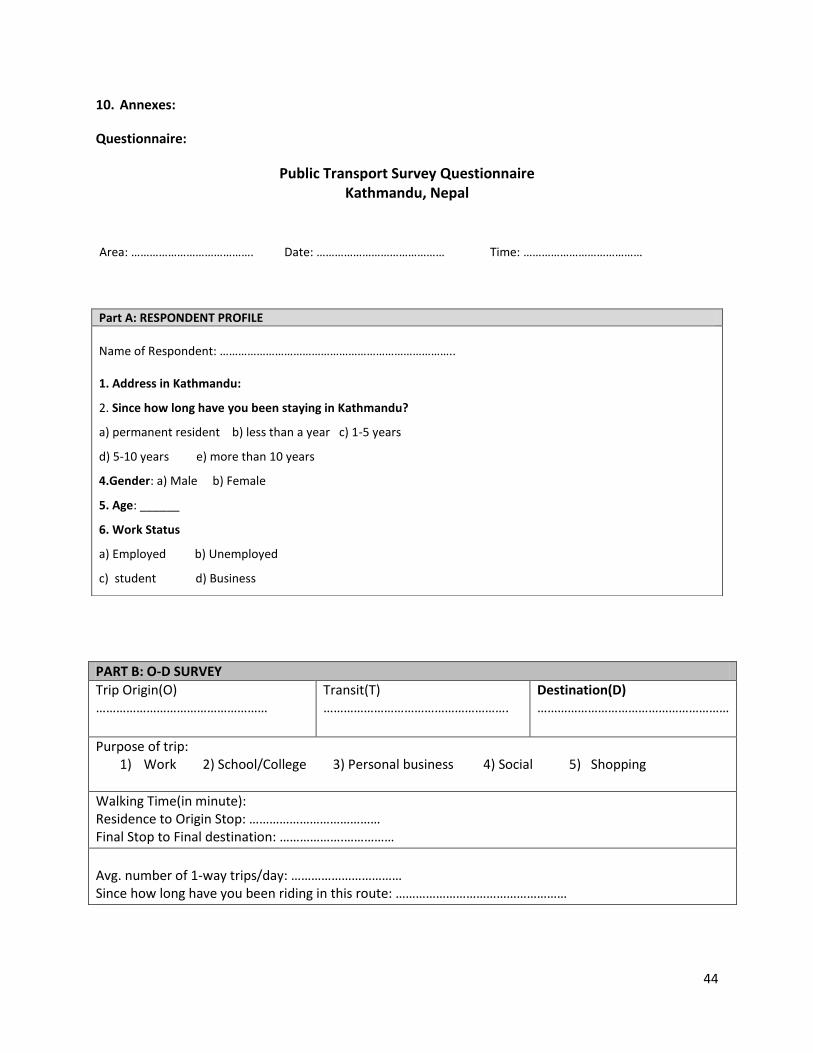
44
10. Annexes:
Questionnaire:
Public Transport Survey Questionnaire Kathmandu, Nepal
PART B: O-D SURVEY
Trip Origin(O) ……………………………………………
Transit(T) ……………………………………………….
Destination(D) …………………………………………………
Purpose of trip: 1) Work 2) School/College 3) Personal business 4) Social 5) Shopping
Walking Time(in minute): Residence to Origin Stop: ………………………………… Final Stop to Final destination: ……………….……………
Avg. number of 1-way trips/day: …………………………… Since how long have you been riding in this route: ……………………………………………
Part A: RESPONDENT PROFILE
Name of Respondent: ………………………………………………………………….. 1. Address in Kathmandu:
2. Since how long have you been staying in Kathmandu?
a) permanent resident b) less than a year c) 1-5 years
d) 5-10 years e) more than 10 years
4.Gender: a) Male b) Female
5. Age: ______
6. Work Status
a) Employed b) Unemployed
c) student d) Business
Area: …………………………………. Date: …………………………………… Time: …………………………………
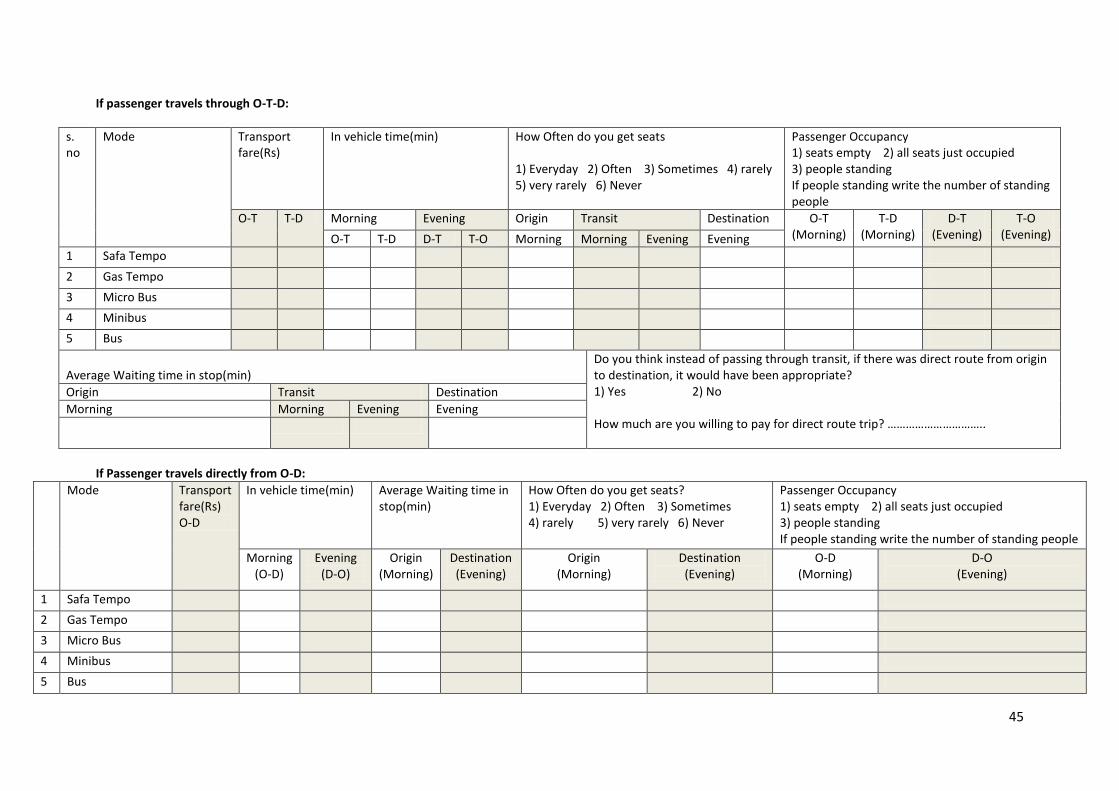
45
If passenger travels through O-T-D:
s. no
Mode Transport fare(Rs)
In vehicle time(min) How Often do you get seats 1) Everyday 2) Often 3) Sometimes 4) rarely 5) very rarely 6) Never
Passenger Occupancy 1) seats empty 2) all seats just occupied 3) people standing If people standing write the number of standing people
O-T T-D Morning Evening Origin Transit Destination O-T (Morning)
T-D (Morning)
D-T (Evening)
T-O (Evening) O-T T-D D-T T-O Morning Morning Evening Evening
1 Safa Tempo
2 Gas Tempo
3 Micro Bus
4 Minibus
5 Bus
Average Waiting time in stop(min)
Do you think instead of passing through transit, if there was direct route from origin to destination, it would have been appropriate? 1) Yes 2) No How much are you willing to pay for direct route trip? …………………………..
Origin Transit Destination
Morning Morning Evening Evening
If Passenger travels directly from O-D:
Mode Transport fare(Rs) O-D
In vehicle time(min) Average Waiting time in stop(min)
How Often do you get seats? 1) Everyday 2) Often 3) Sometimes 4) rarely 5) very rarely 6) Never
Passenger Occupancy 1) seats empty 2) all seats just occupied 3) people standing If people standing write the number of standing people
Morning (O-D)
Evening (D-O)
Origin (Morning)
Destination (Evening)
Origin (Morning)
Destination (Evening)
O-D (Morning)
D-O (Evening)
1 Safa Tempo
2 Gas Tempo
3 Micro Bus
4 Minibus
5 Bus
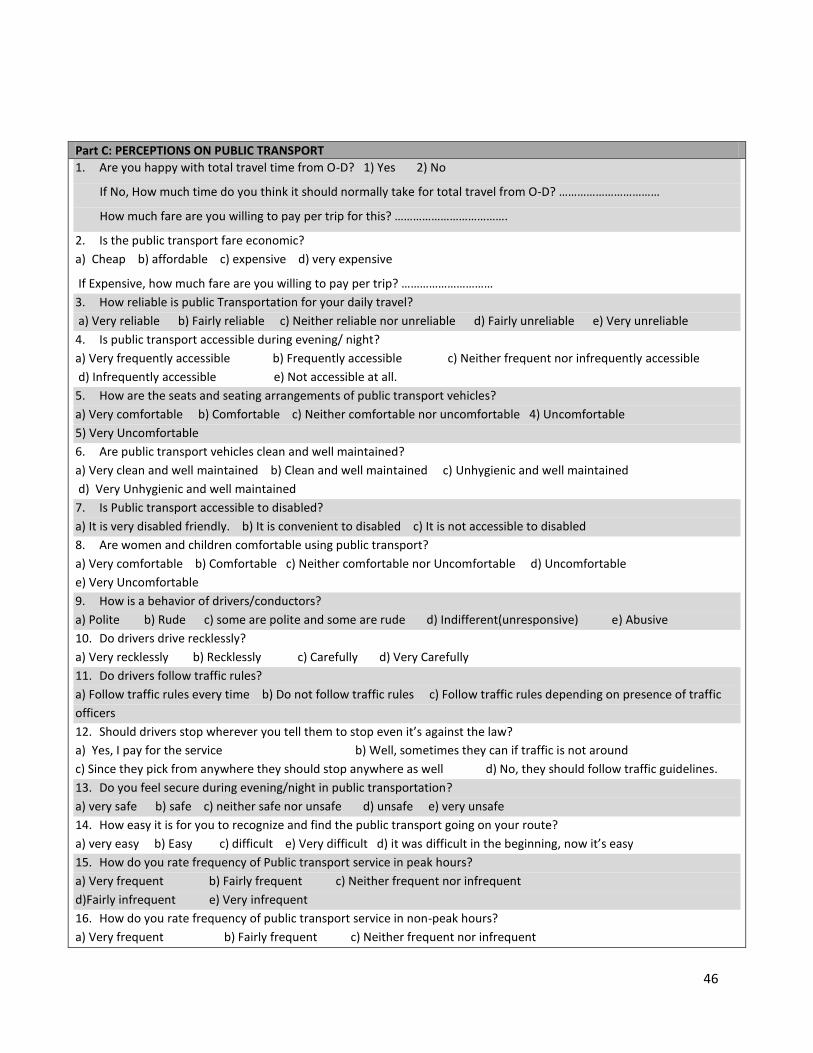
46
Part C: PERCEPTIONS ON PUBLIC TRANSPORT
1. Are you happy with total travel time from O-D? 1) Yes 2) No
If No, How much time do you think it should normally take for total travel from O-D? ……………………………
How much fare are you willing to pay per trip for this? ……………………………….
2. Is the public transport fare economic?
a) Cheap b) affordable c) expensive d) very expensive
If Expensive, how much fare are you willing to pay per trip? …………………………
3. How reliable is public Transportation for your daily travel?
a) Very reliable b) Fairly reliable c) Neither reliable nor unreliable d) Fairly unreliable e) Very unreliable
4. Is public transport accessible during evening/ night?
a) Very frequently accessible b) Frequently accessible c) Neither frequent nor infrequently accessible
d) Infrequently accessible e) Not accessible at all.
5. How are the seats and seating arrangements of public transport vehicles?
a) Very comfortable b) Comfortable c) Neither comfortable nor uncomfortable 4) Uncomfortable
5) Very Uncomfortable
6. Are public transport vehicles clean and well maintained?
a) Very clean and well maintained b) Clean and well maintained c) Unhygienic and well maintained
d) Very Unhygienic and well maintained
7. Is Public transport accessible to disabled?
a) It is very disabled friendly. b) It is convenient to disabled c) It is not accessible to disabled
8. Are women and children comfortable using public transport?
a) Very comfortable b) Comfortable c) Neither comfortable nor Uncomfortable d) Uncomfortable
e) Very Uncomfortable
9. How is a behavior of drivers/conductors?
a) Polite b) Rude c) some are polite and some are rude d) Indifferent(unresponsive) e) Abusive
10. Do drivers drive recklessly?
a) Very recklessly b) Recklessly c) Carefully d) Very Carefully
11. Do drivers follow traffic rules?
a) Follow traffic rules every time b) Do not follow traffic rules c) Follow traffic rules depending on presence of traffic
officers
12. Should drivers stop wherever you tell them to stop even it’s against the law?
a) Yes, I pay for the service b) Well, sometimes they can if traffic is not around
c) Since they pick from anywhere they should stop anywhere as well d) No, they should follow traffic guidelines.
13. Do you feel secure during evening/night in public transportation?
a) very safe b) safe c) neither safe nor unsafe d) unsafe e) very unsafe
14. How easy it is for you to recognize and find the public transport going on your route?
a) very easy b) Easy c) difficult e) Very difficult d) it was difficult in the beginning, now it’s easy
15. How do you rate frequency of Public transport service in peak hours?
a) Very frequent b) Fairly frequent c) Neither frequent nor infrequent
d)Fairly infrequent e) Very infrequent
16. How do you rate frequency of public transport service in non-peak hours?
a) Very frequent b) Fairly frequent c) Neither frequent nor infrequent
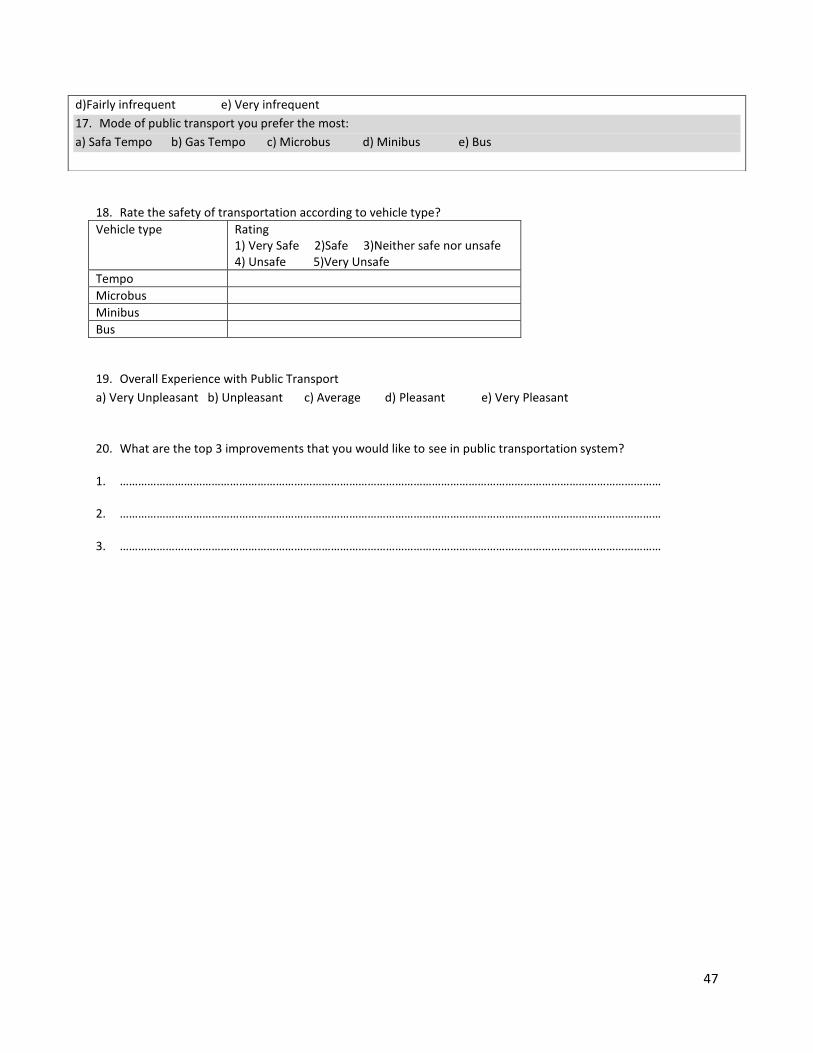
47
18. Rate the safety of transportation according to vehicle type?
Vehicle type Rating 1) Very Safe 2)Safe 3)Neither safe nor unsafe 4) Unsafe 5)Very Unsafe
Tempo
Microbus
Minibus
Bus
19. Overall Experience with Public Transport
a) Very Unpleasant b) Unpleasant c) Average d) Pleasant e) Very Pleasant
20. What are the top 3 improvements that you would like to see in public transportation system? 1. ……………………………………………………………………………………………………………………………………………………………
2. ……………………………………………………………………………………………………………………………………………………………
3. ……………………………………………………………………………………………………………………………………………………………
d)Fairly infrequent e) Very infrequent
17. Mode of public transport you prefer the most:
a) Safa Tempo b) Gas Tempo c) Microbus d) Minibus e) Bus
48
References:
Shobakar Dhakal (2004), Urban Transportation and the Environment in Kathamndu Valley, Nepal - Integrating Global Carbon concerns into local air pollution management, IGES, Japan
Passenger Travel & Modal Split Estimation of Kathmandu Valley, Broersma, K and N Pradhan, Mission Report 4, Kathmandu Valley Mapping Program, Kathmandu Metropolitan City/European Commission, Kathmandu, 2001.
Vehicle statistics (2011), Department of Transport Management, Kathmandu, Nepal. Retrieved from www.dotm.gov.np
Binod Ghimire(2011). Revival of Sajha Yatayat: Sajha buses to ply Valley roads in four months. The Kathmandu Post. Posted on 2011/12/20. Retrieved from http://www.ekantipur.com/the-kathmandu-post/2011/12/19/development/revival-of-sajha-yatayat-sajha-buses-to-ply-valley-roads-in-four-months/229481.html
Trolley bus in Kathmandu, Wikipedia, the free Encyclopedia. Retrieved from http://en.wikipedia.org/wiki/Trolleybuses_in_Kathmandu#cite_note-box-tm292-2
Bhusan Tuladhar. 2003. Electric Vehicles in Kathmandu. Clean Energy Nepal’s Factsheet#3. Kathmandu, Nepal. Retrieved from http://www.cen.org.np/uploaded/EV%20fact%20sheet.pdf
;fj{hlgs oftfoft cfrf/ ;+lxtf(2011), Ministry of Labor and Transport, Department of Transport Management, Katmandu, Nepal. Retrieved from www.dotm.gov.np
oftfoft Joj:yf ljefu Pjd\ sfof{{nox?af6 ;DkGg ul/g] sfo{{x?sf] sfo{ljlw lgb]{lzsf @)^), Ministry of Labor and Transport, Department of Transport Management, Katmandu, Nepal. Retrieved from www.dotm.gov.np
1994 Origin & Destination Survey, Lane Transit District, 1994
2005 Origin-Destination Survey Summary of Results - National Capital Region, TRANS Committee, iTRANS Consulting Inc., 1565 Carling Avenue, Suite 608, Ottawa, ON K1Z 8R1, 2006
Origin / Destination Survey Results, Department of Conservation and Recreation, Massachussets, 2006
FINAL REPORT (2010), Kathmandu Sustainable Urban Transport Project: ADB TA-7243.
FINAL REPORT ANNEXES (2010), Kathmandu Sustainable Urban Transport Project, Ministry of Physical Planning and Works, Nepal/Asian Development Bank R-PPTA7243-REG
Three Years Plan (2067/068-2069/070), National Planning Commission, Kathmandu, Nepal, 2011. Retrieved from http://www.npc.gov.np/uploads/plans/20110902104225.pdf
Chapter 18: Transport Management, Three Years Plan (2064/065-2066/067), National Planning Commission, Kathmandu, Nepal, Retrieved from http://www.npc.gov.np/uploads/plans/20081228114821.pdf
Proceedings of Kathmandu Sustainable Urban Transport Forum, Clean Air Network Nepal, Clean Energy Nepal, 140 Bulbule Marga, Thapagaon, Kathmandu, 2011
49
Final Report ANALYSIS OF HMG POLICIES AND REGULATIONS AFFECTING ELECTRICAL VEHICLES (2003), Kathmandu Electric Vehicle Alliance, KEVA Secretariat C/o Winrock International, 103/68 Devkota Marg, Baneshwor, Kathmandu, Nepal
Chapter: 18, Road Transportation, Tenth Plan (2059-2064), National Planning Commission, Kathmandu, Nepal, Retrieved from http://www.npc.gov.np/uploads/plans/20081228122849.pdf
Part 12.3: Transport, Ninth Plan (1997-2002), National Planning Commission, Kathmandu, Nepal, Retrieved from http://www.npc.gov.np/uploads/plans/20081228124000.pdf
Chapter 18: Road and Other Transport, Eighth Plan (1992-1997), National Planning Commission, Kathmandu, Nepal, Retrieved from www.npc.gov.np/uploads/plans/20081228124938.5%20Road%20and%20Other%20Transport
Chapter 28: Road Transportation, Seventh Plan(1985-1990), National Planning Commission, Kathmandu, Nepal, Retrieved from http://www.npc.gov.np/uploads/plans/20090222105229.pdf
Chapter 9: A. Road Transport, Sixth Plan (1980-1985), National Planning Commission, Kathmandu, Nepal, Retrieved from http://www.npc.gov.np/uploads/plans/20100720141712.pdf
Chapter 17: Road and Transport, Fifth Plan (1975-1980), National Planning Commission, Kathmandu, Nepal, Retrieved from http://www.npc.gov.np/uploads/plans/20100720135525.pdf
Chapter 10: Transport, Fourth Plan (1970-1975), National Planning Commission, Kathmandu, Nepal, Retrieved from http://www.npc.gov.np/uploads/plans/20100720133533.pdf
Chapter 20: Transport, Third (1965-1970), National Planning Commission, Kathmandu, Nepal, Retrieved from http://www.npc.gov.np/uploads/plans/20100720132056.pdf
Public Transport Code of Conduct, Government of Nepal, Department of Transport Management, Kotheshwor, Kathmandu, 2011
Vehicle and Transport Management Act, Government of Nepal, 1992
Motor Vehicles and Transport Management Rules, Government of Nepal, 1997
National Transport Policy, Government of Nepal, Ministry of Physical Planning and Works, Approved by the 27th Meeting of the Council of Ministers, 2001