Embed Size (px)
Citation preview
ii
iii

Published on web by National University of Educational Planning and Administration, New Delhi on behalf of Department of School Education and Literacy,Ministry of Human Resource Development, Government of India.2014
PROJECT TEAMThis publication is the outcome of the collaborative activities of the Department of School Education and Literacy , MHRD, National University ofEducational Planning and Administration (NUEPA), MIS Unit at the Technical Support Group and State and District level MIS Units. The key officialsinvolved in the collection and implementation of the DISE activities are as under:
State EMIS Unit In-charges
State/Union Territory MIS In-charge E-mailArunachal Pradesh Mr. Taphe Kena [email protected] & Nicobar Islands Mr. Y Sajeevan [email protected] Pradesh Mr. K Narayan Reddy [email protected] Pradesh Ms. Poonam Malakondaiah, SPD [email protected] Mr. Rajarshee Saikia [email protected] Mr. Ibrahim Nafis Islam [email protected] Dr. Ravi Shankar Singh [email protected] Bihar Mr. Deepak Tiwary [email protected] Chandigarh Mr. Dinesh Kumar [email protected] Mr. Shailendra Singh Verma [email protected] Mr. Deepak Dubey [email protected] & Nagar Haveli State Project Director [email protected] and Diu Mr. Vavia Ravindra K [email protected] Mr. R. M. Mohala [email protected] Mr. Asif D.Savant [email protected] Mr. Deepak Chauhan [email protected] State Project Director [email protected] Dr. Bal Krishan Yadav [email protected] Pradesh Mr. Satish Kaushal [email protected] Pradesh Mr. Satish Kaushal [email protected] & Kashmir Mr. Murtaza Hussain [email protected] Mr. Sachin Kumar [email protected] Mr. Sachin Kumar [email protected] Mr. T.Chandran [email protected] Mr. Purushotham Kumar /Mr. Nagesh HC [email protected] Mr. L. Larryhardin [email protected] Mr. Shrinivas Murgod [email protected] Mr. Franklin Jose [email protected] Pradesh Mr. Deepak Verma [email protected] Pradesh Mr. Deepak Verma [email protected] Mr. Gajanan S. Patil [email protected] Mr. S. Ranbir Singh [email protected] MrJohn Shabong [email protected] Mr. Lalzarzova Khiangte [email protected] Mr. I Akum Aier [email protected] Maharashtra Mr. Unmesh Girgaonkar [email protected] Mr.Pravat Kumar Mishra [email protected] Mr. R Ramakrishnan [email protected] Mr. Rajvir [email protected] Mr. Sunil Giri [email protected] Mr. Ajay Gupta [email protected] Nadu Mr. A.Thalavai Muthu [email protected] Ms. Nirupama Talapatra [email protected] Nadu Mr. K. Ramakrishnan [email protected] Pradesh Mr. Sanjay Singh [email protected] Pradesh Mr. Rajiv Mehra [email protected] Mr. K.S.Rawat [email protected] Mr. M. C. Pant, SPD [email protected] Bengal Mr. Arup Kumar Biswas [email protected]
Ministry of Human Resource Development (MHRD), New DelhiMs. Vrinda Sarup, Additional Secretary, Department of School Education & Literacy, MHRD, New DelhiMs. M. Kaur Dwivedi, Director, Department of School Education & Literacy, MHRD, New Delhi
Technical Support Group (Educational Consultants India Limited), New DelhiMs. Alka Mishra, Chief Consultant, MIS
NUEPA, New DelhiDr. Arun C. Mehta, Professor & Head, Department of Educational Management Information SystemMr. Naveen Bhatia, Systems AnalystMs. Shakun Sethi, Project ConsultantMs. Aparna Mookerjee, Project ConsultantMr. Arun Joshi, Project Consultant (Publication)Ms. Aseela M, Project Assistant
Contact Information: [email protected]: http://www.dise.in
http://www.schoolreportcards.inhttp://www.nuepa.org
Software Development Supported by UNICEF, Delhi
Design, Layout and PrintingDepartment of EMIS, NUEPA, New Delhi.
Hkkjr ljdkjHkkjr ljdkjHkkjr ljdkjHkkjr ljdkjHkkjr ljdkjekuo lalk/ku fodkl ea=ky;ekuo lalk/ku fodkl ea=ky;ekuo lalk/ku fodkl ea=ky;ekuo lalk/ku fodkl ea=ky;ekuo lalk/ku fodkl ea=ky;Ldwy fk{kk vkSj lk{kjrk foHkkxLdwy fk{kk vkSj lk{kjrk foHkkxLdwy fk{kk vkSj lk{kjrk foHkkxLdwy fk{kk vkSj lk{kjrk foHkkxLdwy fk{kk vkSj lk{kjrk foHkkx
ubZ fnYyh & 110 001ubZ fnYyh & 110 001ubZ fnYyh & 110 001ubZ fnYyh & 110 001ubZ fnYyh & 110 001Government of India
Ministry of Human Resource DevelopmentDepartment of School Education & Literacy
124 ‘C’ Wing, Shastri Bhavan, New Delhi –110 001Tel.: 23382587, 23381104, Fax: 23387859
E-mail: [email protected]
ForewordDevelopment of a robust information system is critical for successful planning, monitoring and implementationof any programme, particularly in the social sector. It has always been our endeavour to strengthen EducationalManagement Information System (EMIS). Sarva Shiksha Abhiyan (SSA) was launched in 2001. EMIShas been accorded top priority from the very beginning of the SSA programme. District Information Systemfor Education (DISE) was developed by the National University of Educational Planning and Administration(NUEPA), New Delhi and has been extended to all S tates/UTs and districts of the country . The depth ofDISE coverage has increased over the years.
In the light of the recommendations of the Expert Group on Creation of Unified System of Data Collectionfor School Education Statistics, efforts for a unified school data collection system was made in 2012-13,covering elementary & secondary schools. The present publication is outcome of this massive exercise.
I am happy to note that DISE has become a regular source of information on all aspects of elementaryeducation. NUEPA brings out annually a set of eight publications including 'District and State Report Cards',web-enabled 'Elementary Education in Rural and Urban India', 'DISE Flash Statistics including EducationalDevelopment Index', and 'Elementary Education in India: Progress towards Universal Elementary Education(UEE), Analytical Reports & Tables', which data users and researchers have found useful. School-specificDISE raw data is also being made available to users many of whom are extensively working on DISE data.I am hopeful that U-DISE would be equally well received.
I thank Prof. R. Govinda, Vice Chancellor, NUEPA, Dr. Arun C Mehta, Professor and Head, Departmentof EMIS and the entire DISE team, for bringing out the present publication.
(Rajarshi Bhattacharya)
jkt"khZ Hkêkpk;Zjkt"khZ Hkêkpk;Zjkt"khZ Hkêkpk;Zjkt"khZ Hkêkpk;Zjkt"khZ Hkêkpk;Zlfpolfpolfpolfpolfpo
Rajarshi BhattacharyaSECRETARY
From the Vice-Chancellor's DeskThe country has witnessed phenomenal expansion of school education system in recent years. Effectivemonitoring of such a vast system spread over diverse conditions that characterize different states andregions of the country demands comprehensive data base. NUEPA has been pursuing the goal of creatinga reliable system of statistics on school education during the last two decades through the DistrictInformation System for Education (DISE) which provides the basis for assessing the progress underSSA and on status of implementation of the Right to Education Act. The importance of this has furtherincreased with efforts to extend the policy of universal education to cover secondary education stage ofschooling also. Keeping this in view DISE is making a concerted effort to provide a unified system ofschool education statistics for all levels of schooling from elementary to higher secondary education. Thepresent publication is outcome of this effort through which information from about 1.5 million schools havebeen collected.
It is, indeed, a great pleasure for me to present a summary data base on elementary education in Indiathrough present publication. Including this publication, NUEPA brings out on annual basis eight publicationsexclusively based on DISE data under the following titles: (a) DISE Flash Statistics: Elementary Educationin India, Progress towards UEE: (b) Elementary Education in India: Where Do We Stand; District & StateReport Cards; (c) Analytical Report & Analytical Tables; and (d) Elementary Education in Rural & UrbanIndia all of which are available at www.dise.in for the last eight years.
I take this opportunity to congratulate Prof. Arun C. Mehta and his team for their commitment and hardwork in producing the various publications and sustaining that effort over the years.
I hope that researchers, policy makers, administrators and planners will find the publication both informativeand useful.
(R Govinda)
jk”Vªh; 'kSf{kd ;kstuk ,oa iz'kklu fo'ofo|ky;jk”Vªh; 'kSf{kd ;kstuk ,oa iz'kklu fo'ofo|ky;jk”Vªh; 'kSf{kd ;kstuk ,oa iz'kklu fo'ofo|ky;jk”Vªh; 'kSf{kd ;kstuk ,oa iz'kklu fo'ofo|ky;jk”Vªh; 'kSf{kd ;kstuk ,oa iz'kklu fo'ofo|ky;¼Hkkjr ljdkj }kjk fo'ofo|ky; vuqnku vk;ksx ds vf/kfu;e 1956 dh /kkjk 3 ds varxZr ?kksf"kr½
17&ch] Jh vjfoan ekxZ] ubZ fnYyh&110016National University of Educational Planing and Administration
(Declared by the Govt. of India under Section 3 of the UGC Act, 1956)
17-B, Sri Aurobindo Marg, New Delhi-110016Tel.; Off.; 26515472, 26853038
Fax : 91-011-26861882 E-mail : [email protected] Website www.nuepa.orgR GovindaVice-Chancellor
For the last several years, NUEPA has been actively involved in strengthening the EducationalManagement Information System (EMIS) in the country. The State Report Cards: ElementaryEducation in India: Progress towards UEE is based on the data received from all the States & UTs ofthe country for the year 2012-13. The publication presents not only state-specific indicators but alsobrings in many new dimensions of elementary education into focus. It incorporates key indicators onall aspects of universalisation of elementary education in case of all the States & UTs of the country.The State Report Cards: 2012-13 is based on the data received from as many as 1.43 million schoolsspread over 662 districts across 35 States & UTs.
The study of this magnitude cannot be completed without the active involvement and participation ofthe EMIS professionals at the national and sub-national levels. I am extremely thankful to all the StateProject Directors, the state level EMIS coordinators and district level programmers and data entryoperators for timely supply of data. I take this opportunity to thank UNICEF, Delhi, in particular MsUrmila Sarkar, Chief (Education) for consistently supporting EMIS activities ever since the inceptionof DISE and Ms Vrinda Sarup, Additonal Secretary and Ms M. Kaur Dwivedi, Director, Departmentof School Education & Literacy, Government of India, who played a crucial role in facilitating theimplementation of DISE in various states.
I am thankful to Prof R Govinda, Vice-Chancellor, NUEPA, for his consistent encouragement andguidance. I take this opportunity and thank NUEPA faculty for their support.
The contribution of Shri Naveen Bhatia, System Analyst, NUEPA and Ms Alka Mishra, ChiefConsultant, Technical Support Group, Ed. CIL, in database management, is gratefully acknowledged.I am thankful to Ms Shakun Sethi, Project Consultant (DISE Project) and Ms Aseela M for computingindicators that have been presented in the document. I am also thankful to Ms Aparna Mookerjee,DISE Project and colleagues in the Publication Unit especially Shri Pramod Rawat, Deputy PublicationOfficer andMr Arun Joshi, Project Publication Officer and colleagues in the DISE Project for timely bringing outthe publication.
I hope that this publication will be of value to education planners, policy formulators and researchers.Suggestions for improvement are most welcome.
Arun C. Mehta [email protected]
Acknowledgements
New DelhiMarch, 2014
viii
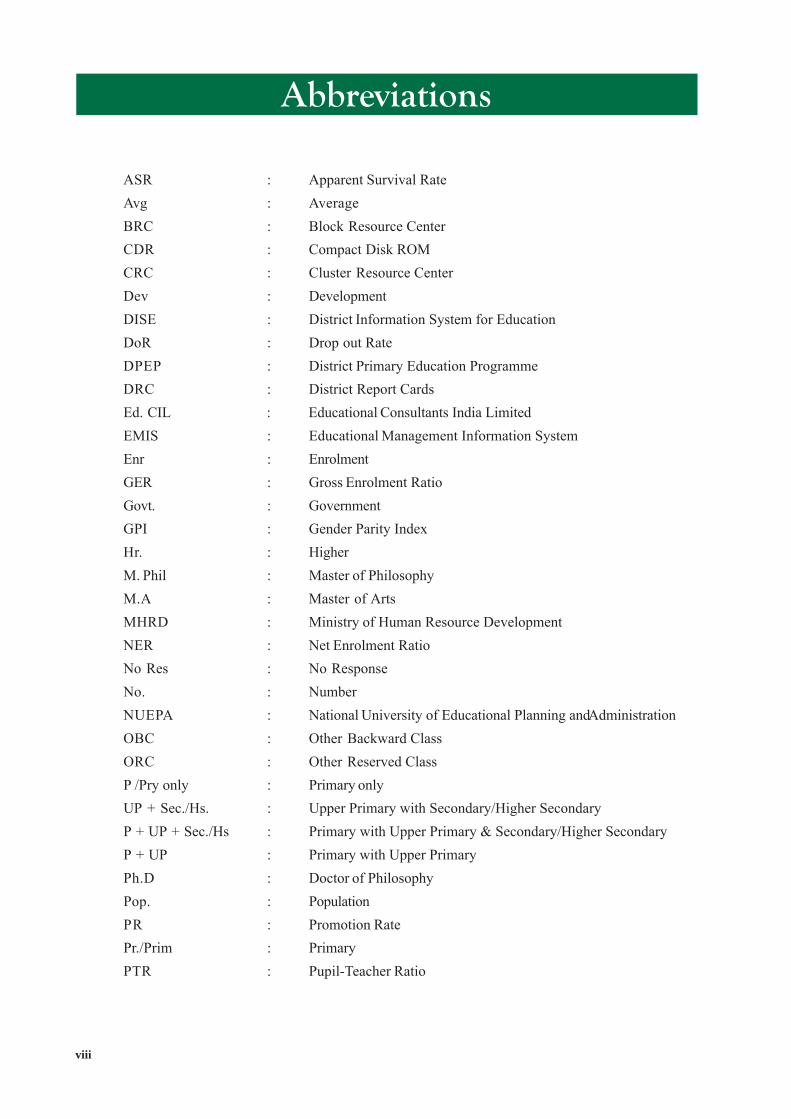
Abbreviations
ASR : Apparent Survival RateAvg : AverageBRC : Block Resource CenterCDR : Compact Disk ROMCRC : Cluster Resource CenterDev : DevelopmentDISE : District Information System for EducationDoR : Drop out RateDPEP : District Primary Education ProgrammeDRC : District Report CardsEd. CIL : Educational Consultants India LimitedEMIS : Educational Management Information SystemEnr : EnrolmentGER : Gross Enrolment RatioGovt. : GovernmentGPI : Gender Parity IndexHr. : HigherM. Phil : Master of PhilosophyM.A : Master of ArtsMHRD : Ministry of Human Resource DevelopmentNER : Net Enrolment RatioNo Res : No ResponseNo. : NumberNUEPA : National University of Educational Planning and AdministrationOBC : Other Backward ClassORC : Other Reserved ClassP /Pry only : Primary onlyUP + Sec./Hs. : Upper Primary with Secondary/Higher SecondaryP + UP + Sec./Hs : Primary with Upper Primary & Secondary/Higher SecondaryP + UP : Primary with Upper PrimaryPh.D : Doctor of PhilosophyPop. : PopulationPR : Promotion RatePr./Prim : PrimaryPTR : Pupil-Teacher Ratio
ix
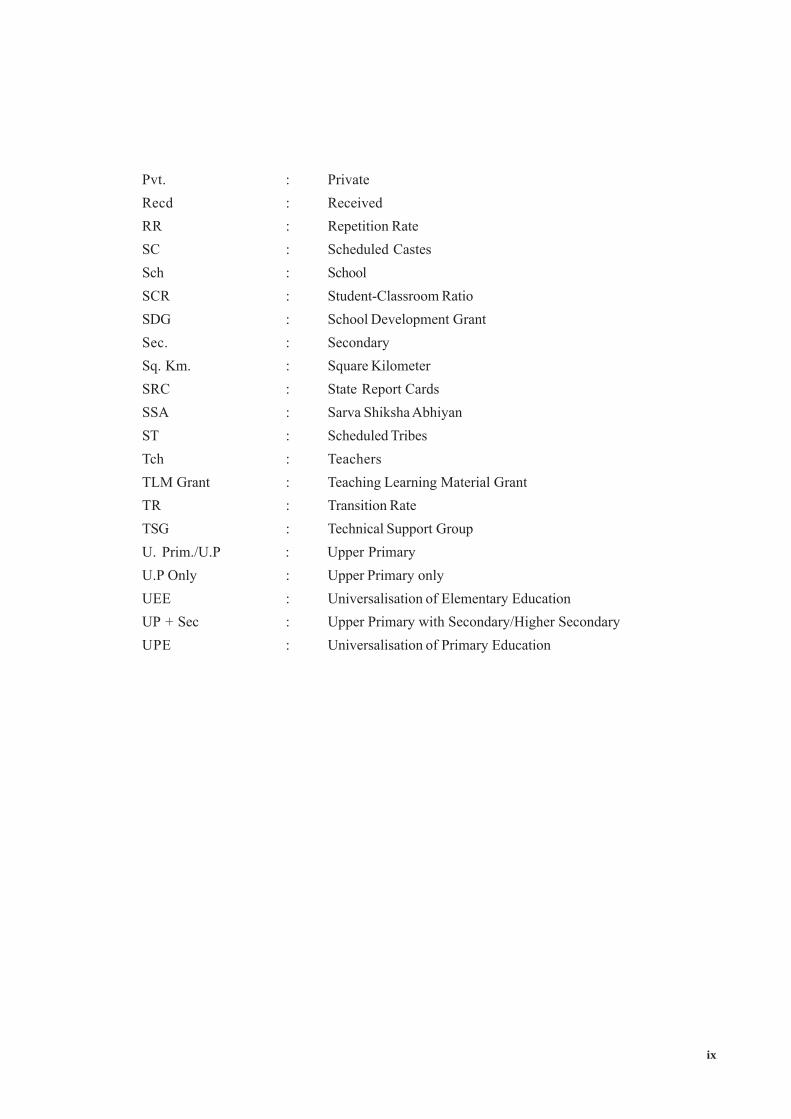
Pvt. : PrivateRecd : ReceivedRR : Repetition RateSC : Scheduled CastesSch : SchoolSCR : Student-Classroom RatioSDG : School Development GrantSec. : SecondarySq. Km. : Square KilometerSRC : State Report CardsSSA : Sarva Shiksha AbhiyanST : Scheduled TribesTch : TeachersTLM Grant : Teaching Learning Material GrantTR : Transition RateTSG : Technical Support GroupU. Prim./U.P : Upper PrimaryU.P Only : Upper Primary onlyUEE : Universalisation of Elementary EducationUP + Sec : Upper Primary with Secondary/Higher SecondaryUPE : Universalisation of Primary Education
x
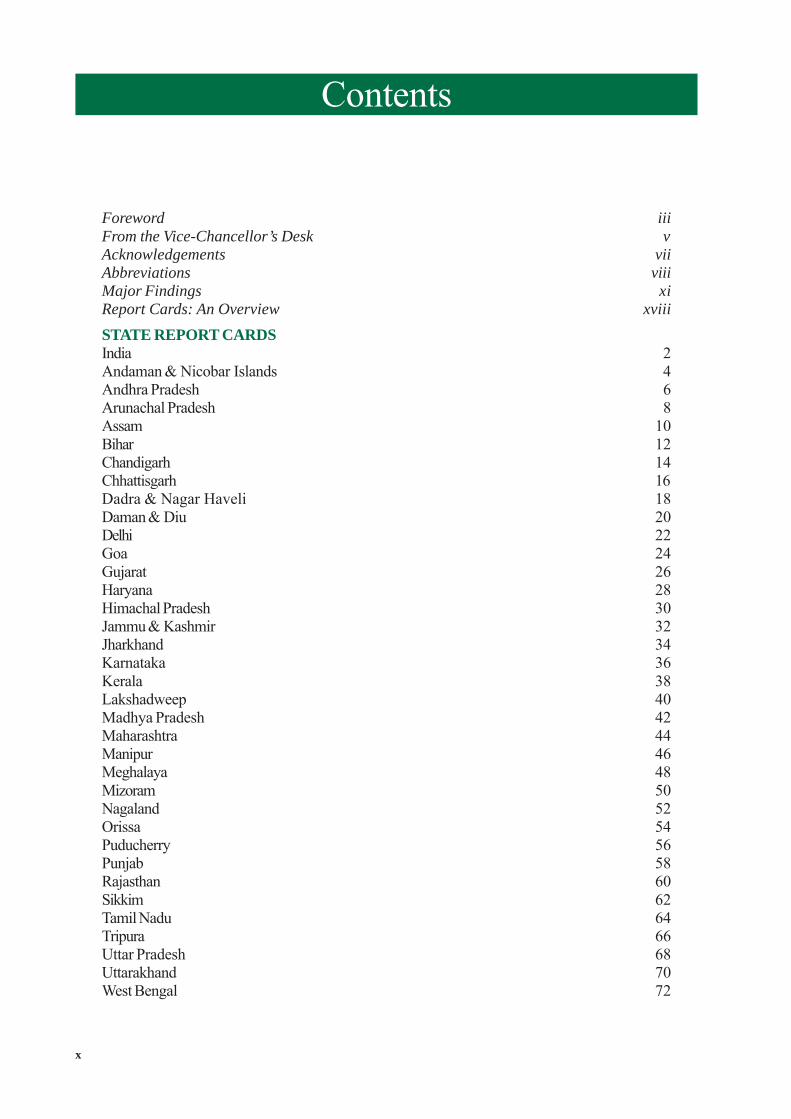
Foreword iiiFrom the Vice-Chancellor’s Desk vAcknowledgements viiAbbreviations viiiMajor Findings xiReport Cards: An Overview xviiiSTATE REPORT CARDSIndia 2Andaman & Nicobar Islands 4Andhra Pradesh 6Arunachal Pradesh 8Assam 10Bihar 12Chandigarh 14Chhattisgarh 16Dadra & Nagar Haveli 18Daman & Diu 20Delhi 22Goa 24Gujarat 26Haryana 28Himachal Pradesh 30Jammu & Kashmir 32Jharkhand 34Karnataka 36Kerala 38Lakshadweep 40Madhya Pradesh 42Maharashtra 44Manipur 46Meghalaya 48Mizoram 50Nagaland 52Orissa 54Puducherry 56Punjab 58Rajasthan 60Sikkim 62Tamil Nadu 64Tripura 66Uttar Pradesh 68Uttarakhand 70West Bengal 72
Contents
xi
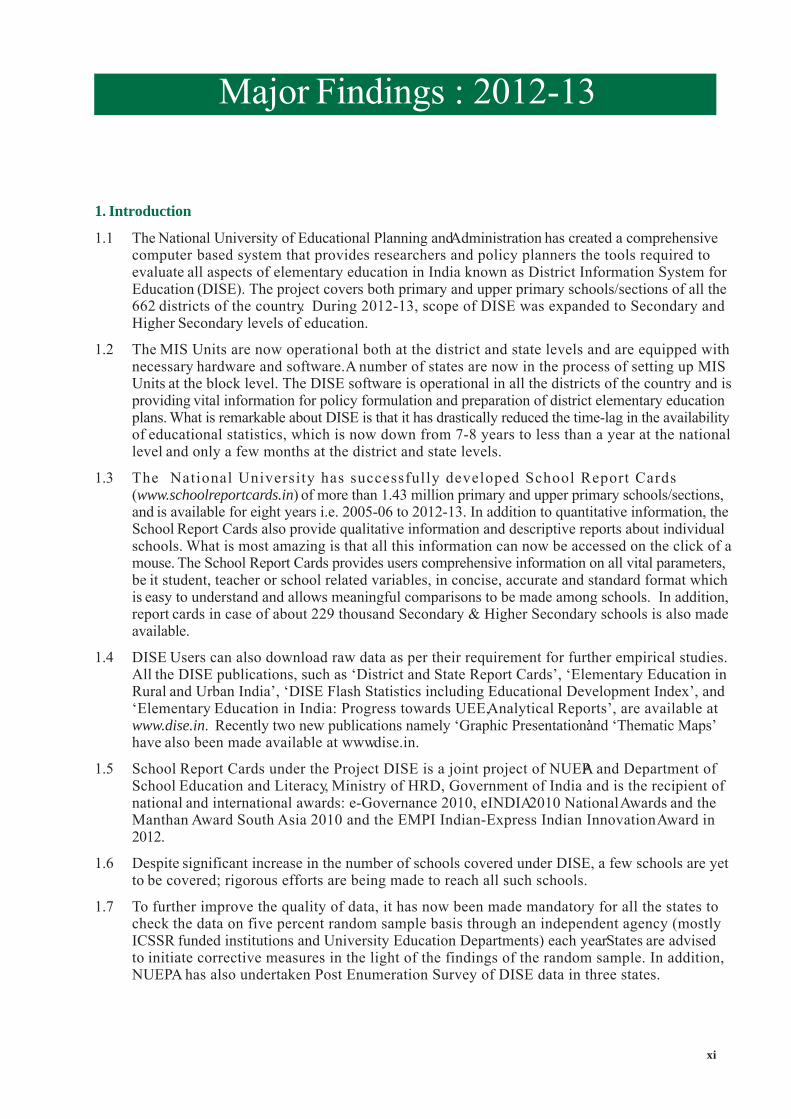
1. Introduction
1.1 The National University of Educational Planning and Administration has created a comprehensivecomputer based system that provides researchers and policy planners the tools required toevaluate all aspects of elementary education in India known as District Information System forEducation (DISE). The project covers both primary and upper primary schools/sections of all the662 districts of the country. During 2012-13, scope of DISE was expanded to Secondary andHigher Secondary levels of education.
1.2 The MIS Units are now operational both at the district and state levels and are equipped withnecessary hardware and software. A number of states are now in the process of setting up MISUnits at the block level. The DISE software is operational in all the districts of the country and isproviding vital information for policy formulation and preparation of district elementary educationplans. What is remarkable about DISE is that it has drastically reduced the time-lag in the availabilityof educational statistics, which is now down from 7-8 years to less than a year at the nationallevel and only a few months at the district and state levels.
1.3 The National University has successfully developed School Report Cards(www.schoolreportcards.in) of more than 1.43 million primary and upper primary schools/sections,and is available for eight years i.e. 2005-06 to 2012-13. In addition to quantitative information, theSchool Report Cards also provide qualitative information and descriptive reports about individualschools. What is most amazing is that all this information can now be accessed on the click of amouse. The School Report Cards provides users comprehensive information on all vital parameters,be it student, teacher or school related variables, in concise, accurate and standard format whichis easy to understand and allows meaningful comparisons to be made among schools. In addition,report cards in case of about 229 thousand Secondary & Higher Secondary schools is also madeavailable.
1.4 DISE Users can also download raw data as per their requirement for further empirical studies.All the DISE publications, such as ‘District and State Report Cards’, ‘Elementary Education inRural and Urban India’, ‘DISE Flash Statistics including Educational Development Index’, and‘Elementary Education in India: Progress towards UEE, Analytical Reports’, are available atwww.dise.in. Recently two new publications namely ‘Graphic Presentation’ and ‘Thematic Maps’have also been made available at www.dise.in.
1.5 School Report Cards under the Project DISE is a joint project of NUEPA and Department ofSchool Education and Literacy, Ministry of HRD, Government of India and is the recipient ofnational and international awards: e-Governance 2010, eINDIA 2010 National Awards and theManthan Award South Asia 2010 and the EMPI Indian-Express Indian Innovation Award in2012.
1.6 Despite significant increase in the number of schools covered under DISE, a few schools are yetto be covered; rigorous efforts are being made to reach all such schools.
1.7 To further improve the quality of data, it has now been made mandatory for all the states tocheck the data on five percent random sample basis through an independent agency (mostlyICSSR funded institutions and University Education Departments) each year. States are advisedto initiate corrective measures in the light of the findings of the random sample. In addition,NUEPA has also undertaken Post Enumeration Survey of DISE data in three states.
Major Findings : 2012-13
xii
1.8 DISE is user-friendly, menu-driven and constantly evolving software. Every effort is being madeto further improve the software. The Data Capture Format is reviewed every year and hasbecome important in view of the Right to Education Act.
2. The Present Publication
2.1 To produce meaningful information, data collected from all the 35 states during the year 2012-13has been summarized in the form of reports. These reports help us in accessing the true health ofthe prevalent education system in our country. A variety of school and school related variablesencompassing school infrastructure, facilities, enrolment, and teachers are summarized by schoolcategory in easy to use reports.
2.2 The major highlights of Elementary Education in India: Progress towards UEE, 2012-13 is givenin the following sections. Different Sections containing reports are categorised under the followingcategories: School and Facility indicators, Enrolment-Based indicators and Teacher-Relatedindicators.
3. School-Based Indicators
3.1 With the improved coverage, the number of schools/sections imparting elementary educationcovered under DISE increased many-fold. From 8,53,601 schools in 2002-03, their number hasincreased to 11,96,663 schools in 2006--07, to 12,50,775 in 2007-08, 12,85,576 in 2008-09, 13,03,812in 2009-10, 13,62,324 in 2010-11 and to 14,12,178 in 2011-12 and to 14,31,702 in 2012-13. Of thetotal schools, about 85.99 percent schools are located in the rural areas. During the same period,the number of primary schools increased from 6,01,866 to 8,53,870. Category-wise distribution ofschools reveals that majority of the schools (59.64 percent) are independent primary schools.
3.2 The increase in the number of schools is also reflected in the ratio of primary to upper primaryschools/sections which clearly shows the impact of Sarva Shiksha Abhiyan under which alarge number of schools have been opened in the recent past. This ratio for the year 2012-13 isone upper primary school/section for every 2.06 primary schools/sections. When this figure iscompared over time, one can notice a steady decline in the ratio of primary to upper primaryschools/sections. The ratio stood at 2.41 in 2007-08, 2.45 in 2006-07, 2.27 in 2008-09, 2.23 in2009-10, 2.12 in 2010-11 and 2.07 in 2011-12. The data also suggests that in about 16 states, theratio of primary to upper primary schools/sections is better than the national average of 2.06.Many of the states have the ratio equivalent to almost two, all of which suggests that by and largeschooling facilities have been created and are available across the country. States like Chandigarh(1.06), Mizoram (1.32), Gujarat (1.33), Daman & Diu (1.34), Lakshadweep (1.35), Haryana(1.39), Puducherry (1.45), Punjab (1.61), Nagaland (1.67), Rajasthan (1.70), Delhi (1.75),Karnataka (1.75), Kerala (1.80), Maharashtra (1.83), Odisha (1.85) and Uttar Pradesh (1.96)have a ratio of below 2. Despite significant improvement, there are a few states, such as WestBengal (4.54), Arunachal Pradesh (3.04), Assam (3.10), Dadra and Nagar Haveli (2.34), Goa(2.67) and Meghalaya (2.53) where the ratio still needs to be further improved significantly.
3.3 Obtaining data from all the private schools is a challenging task. Concerted efforts made by theNational University have resulted in a significant increase in the number of such schools coveredunder DISE over a period of time. This is important to assess the true picture of universalisationof elementary education in the country. There were as many as 68,202 and 2,39,776 schools in2012-13 being managed by the Private Aided and Private Unaided managements respectively.DISE data also suggests that majority of the private schools are unaided schools (77.85 percent).The percentage of government and government aided schools is as high as 80.66 which showthat eight out of every ten schools imparting elementary education in the country is funded by thegovernment. From 2010-11 onwards DISE has extended its coverage to unrecognized schoolsand madarsas also. This covers unrecognized schools, recognized madarsas and unrecognizedmadarsas imparting formal education. In 2010-11 the coverage was 26,377 (unrecognized schools),4,473 (recognized madarsas) and 2,167 (unrecognized madarsas). In 201 1-12 it is 25,898(unrecognized schools), 5,797 (recognized madarsas) and 2,392 (unrecognized madarsas). In2012-13, it is 26,005 (unrecognized schools), 8,235 (recognized madarsas) and 2,764 (unrecognized
xiii
madarsas). The three together contributes to 2.58 percent of the total elementary schools in2012-13.
3.4 A significant achievement is seen in most of the new schools that have opened in the recent pastis the presence of a school building. As many as 3,39,024 new schools have been opened since2002-03, majority of which are located in the rural areas and 96 percent of these schools have aschool building. During the period 2002-03 to 2012-13, as many as 1,98,113 primary schools havebeen opened which is 23.20 percent of the total primary schools in the country. More than 95percent of such schools have a building.
3.5 Not only has the number of schools and schools with buildings increased but also the averagenumber of instructional rooms has increased across the country which is essential for smoothteaching-learning transaction. Irrespective of the school type, schools imparting elementaryeducation across the 662 districts in 2012-13 has an average of 4.6 classrooms, compared to 3.8in 2005-06. However, a significant difference is noticed in the average number of instructionalrooms; in primary schools located in rural areas (3.3 classrooms) and urban areas (5.3 classrooms)and also in government (3.1 classrooms) and private (3.8 classrooms) managed schools. About77 percent classrooms in primary schools are in good condition while the remaining 23 percentneed either minor or major repairs.
3.6 Schools imparting elementary education across the country vary in size. There are about 9.92and 18.22 percent schools respectively which have enrolment between 1-25 and 26-50. Thereare a large number of small schools, which suggests that there is a need to have separateprogramme for these schools. In view of the large number of such schools (about 27.54 percentof 1. 43 million schools), the National University has undertaken a research study, exclusivelybased on the DISE data. It is hoped that the outcome of the study may help in developing abetter planning methodology for small schools.
3.6 Some of the salient highlights with regard to other school-based indicators are as follows:
3.6.1 The percentage of single-classroom schools during 2004-05 to 2008-09 declined from10.39 percent to 6.56 percent and has stabilized to 5.28 in 2012-13. However , thepercentage of such primary schools is 7.86 percent. Despite the decline in percentageof single-classroom schools, their number in absolute terms is significant, which needsimmediate intervention.
3.6.2 Over a period of time, the student-classroom ratio has shown steady improvement. Onan average, about 29 students are sitting in one classroom in primary schools comparedto 30 in 2011-12 and 39 in 2005-06. States like Bihar which has a SCR of 65 down from79 in 2011-12, Chandigarh 43 from 41 in 2011-12, West Bengal 37 from 41 in 2011-12and Dadra & Nagar Haveli 35 from 40 in 2011-12, show high SCR. Every effort mustbe made to build more classrooms in these states. Number of districts where SCR isgreater than 30 has declined from 239 (2010-11) to 203 in 2012-13. Primary schoolswith SCR greater than 30 was 33.53 compared to 38.66 in 2010-11 and 40.63 in 2009-10. Similar is the case for upper primary schools with SCR greater than 35. A marginalimprovement is seen, from 33.17 in 2009-10 to 31.44 in 2010-11 and 32.18 in 2012-13.
4. Facility Indicators
4.1 Like number of schools, instructional rooms, ratio of primary to upper primary sections/schoolsand other indicators, facilities in schools have also improved significantly which is true for physical,ancillary and teaching-learning facilities. Availability of basic facilities in schools may not onlyattract more children but also help in improving retention rate.
4.2 About 95 percent schools in 2012-13 had drinking water compared to 94 percent in 2011-12 and83 percent in 2005-06. About 52.55 percent of the total schools had water hand-pumps, and25.86 percent had tap-water facility. The percentage of schools with boys’ toilet is 67.07 comparedto 88.32 percent such schools with girls’ toilet.
xiv
4.3 Some of the other major facilities available in schools are:
4.3.1 During the period 2004-05 to 2012-13, the number of schools with computers increasedsubstantially from 8.99 to 22.09 percent. As many as 3,16,306 (2,89,978 the previousyear) schools reported to have a computer . In absolute terms, Maharashtra has thehighest number of schools (45,168 i.e. 47.43 percent) with computers followed by AndhraPradesh (30,624, 28.59 percent) and Tamil Nadu (30,036, 53.13). In percentage terms,Lakshadweep (97.73), Chandigarh (96.28), Puducherry (97.74), Delhi (77.88) followedby Kerala (90.29) are the states where schools with computers is higher than 70 percent.The percentage of primary schools with computers is 8.69 percent compared to 41.96percent in case of upper primary schools.
4.3.2 The percentage of schools with ramps increased significantly from 11.49 percent in 200405 to 55.09 percent in 2012-13. This signifies that schools have been able to attract morephysically challenged children. There were 2.35 million disabled children enrolled in 201213. Together with enrolment by nature of disability, DISE is perhaps the only source thatprovides comprehensive information about physically challenged children in schools.
4.3.3 Providing nutritious food to all children under the mid-day meal scheme is one of theambitious programmes of the government. For the first time, a variable on availability ofkitchen-shed in school was added to DISE during 2006-07. In 2006-07, 29 percent ofschools managed by the government (including aided schools) had kitchen-shed in schoolcompared to 60 percent in 2012-13. The percentage of such schools is 62.62 and 37.77respectively in the rural and urban areas.
4.3.4 The percentage of primary schools/sections having attached pre-primary section stood at14.27 in 2002-03, compared to 18.13 in 2012-13.
4.3.5 Over a period of time, the number of schools receiving school development and TLMgrants increased substantially. Compared to 7,24,682 schools that received schooldevelopment grant in 2003-04, the corresponding figure in 2007-08 was 8,82,745 schools(79.67 percent), reaching a high of 9,47,511 (67.40) in 2011-12. The number of schoolsthat received TLM grant increased from 9,26,317 (68.00 percent) in 2010-11 to 9,43,806(67.14 percent) in 2011-12 to 9,91,136 (69.23 percent) in 2012-13. Majority of the stateshave utilised more than 80 percent of these funds.
5. Enrolment-Based Indicators
5.1 With the increased coverage of schools under DISE, enrolment both at the primary and upperprimary level of education has also increased significantly. The enrolment in primary classesincreased from 101.16 million in 2002-03 to 131.85 million in 2006-07 and further to 133.41 millionin 2009-10, 135.21 million in 2010-11 and 137.10 million in 2011-12 and but declined to 134.7 in2012-13. The GER & NER are 105.98 & 90.78 and 82.50 & 64.24 respectively at Primary andUpper Primary levels of education.
5.2 Ratio of girls to boys enrolment and percentage of girls’ enrolment in primary and upper primaryclasses reveal that there is consistent improvement both in ratio of girls to boys enrolment andgirls’ share in enrolment. The average of 662 districts in 2012-13 indicates a ratio of girls toboys enrolment of 0.94 in primary classes and 0.95 in upper primary classes remains same in2012-13.
5.3 The improvement in girls’ enrolment is also reflected in girls share to total enrolment. In primaryclasses, the share of girls’ enrolment in 2012-13 was 48.36 percent compared to 48.22 percent in2007-08. Girls share in total enrolment at upper primary level was 48.77 percent compared to46.99 percent in 2007-08. The data indicates a steady increase in girls’ enrolment over the years.The percentage of girls’ enrolment in government managed schools was found to be higher thanin private managed schools for both primary and upper primary enrolment.
5.4 At the primary level, the share of SC and ST enrolment with respect to total enrolment in 201213 works out to 20.24 and 11.28 percent respectively. At the upper primary level, it was 19.38percent and 9.8 percent respectively. Notably, at all levels, government schools are the main
xv
providers of educational needs of both SC and ST children. SC and ST enrolment together had ashare of 37.60 and 35.29 percent respectively of the total enrolment in government run primaryand upper primary schools. The share of OBC enrolment in the primary and upper primaryclasses in schools across the country was 42.91 and 43.66 percent respectively.
5.5 During 2006-07 DISE data collection, an attempt was made to collect information on enrolmentof Muslim children for the first time. In 2012-13, the percentage of Muslim enrolment at primarylevel is reported to be 14.20 (13.31 in 2011-12) against 12.11 (11.65 in 2011-12) at upper primarylevel. The percentage of Muslim girls’ enrolment is as high as 49.22 and 51.48 (GPI, 0.97) atprimary and upper primary levels. Preliminary analysis of data suggests that there are about 78districts in the country which have 25 percent or more Muslim students in primary classes. Mostof these districts are from the states of Assam (14), Jammu & Kashmir (7), Lakshadweep (1),Kerala (6), West Bengal (10) and Uttar Pradesh (10).
5.6 A lot of emphasis is given to include and integrate children with special needs into the educationsystem. The percentage enrolment of such children was 1.18 at the primary level and 0.90 at theupper primary level. DISE is perhaps the only source that collects information on disabled childrenin elementary classes on regular basis by nature of disability. In 2012-13, about 2.35 million(overall GPI of 0.74) disabled children were enrolled in elementary classes across the country, ofwhich 1.64 million (GPI 0.72) were in primary and 0.70 million (GPI 0.80) in upper primaryclasses. More programs need to be undertaken to match the gender parity Index of disabledchildren to overall GPI level of the nation.
5.7 One of the essential requirements to achieve UEE is to retain students in the education system.The ratio of Grade V to Grade I improved to 88 percent in 2012-13 compared to 86 percent in2011-12. This is also reflected in the retention rate at primary level which is estimated to be 80percent.
5.8 With improvement in the number of schools, facilities in schools and enrolment, the dropout ratefor 2011-12 indicates an average rate of 5.6 compared to 6.5 percent the previous year in primarygrades. A few states have almost achieved the goal of universal retention at primary level.
5.9 One of the other important indicators that are essential to achieve UEE is a high transition fromprimary level to upper primary level of education. It has improved significantly from 64.48 percentin 2002-03 to 86.74 percent in 2011-12 but declined slightly to 81.13 percent in 2006-07. BothBoys and Girls have a transition rate of about 86 and 87 percent respectively.
6. Teacher-Related Indicators
6.1 Availability of teachers in schools is an important variable for quality education. The total numberof teachers in 2012-13 suggests that about 7.35 million (6.7 million, the previous year) teachersare engaged in teaching in schools imparting elementary education in the country. The data alsoshows appointment of a large number of teachers across the country consequent to the SSAinterventions. All the schools in the country now have an average of 3 and more teachers. Theall-India average reveals that, on an average, there were 5.1 teachers in a school in 2012-13 thatimparts elementary education compared to an average of 3.1 teachers per primary school.
6.2 About 46 percent of the total teachers in 2012-13 are female teachers across the country. Datafrom 2005-06 suggests that the number of female teachers were steadily increasing from 40.33percent, it stood at 46.27 in 2012-13.Urban areas had higher percentage of female teachers atalmost 66.1 percent compared to rural areas at 40 percent. Irrespective of school types, asignificant difference is also noticed in case of female teachers in schools under private (almost55 percent) and government managements (almost 41 percent).
6.3 Increase in the number of teachers is also reflected in the pupil-teacher ratio which has shownconsistent improvement. Overall PTR was hovering around 30, it has reduced significantly from36 in 2005-06. During 2012-13, at the primary level, it was 28 students per teacher while at theupper primary level it was 25. Number of districts where PTR was above 30 was 175 comparedto 225 during 2011-12 and 243 in 2010-11. The concentration is mostly in Bihar, Gujarat, Jharkhand,Madhya Pradesh, Maharashtra, Uttar Pradesh and West Bengal. Similarly, percentage of schools

xvi
with PTR greater than 30 at the primary level has shown significant improvement, from 40.84 in2011-12 to 37.02 in 2012-13. States like Bihar at 85.12, Dadra & Nagar Haveli (48.24), Delhi(53.73), and Jharkhand (60.72) shows more than 40 percent of Primary schools having PTRabove 30. At the upper primary level, percentage of schools having PTR above 35 is decreasedto 27.46 compared to 30.77 for the previous year. States like Bihar (82.42), Jharkhand (60.63)and Uttar Pradesh (43.26) shows more than 40 percent of Upper Primary schools having PTRabove 35. In Bihar, not only is pupil-teacher ratio high but also the student-classroom ratio. It is65 in 2012-13 compared to 79 in 2011-12 and 83 in 2010-11.
6.4 The percentage of teachers in Government schools was 61.47 percent. It was 64.13 in 2011-12and 69.14 in 2006-07. The percent teachers’ in aided schools was 9.06 and 8.06 in the previousyear showing a decline since 2006-07, when it was 11.25 percent. Percentage teachers in unaidedschools was 26.54 from 24.69 the previous year and 19.52 in 2006-07. Percentage of teachers inunrecognized schools and madarsas increased from 2.76 in 2011 to 2.83 in 2012-13.
6.5 Percentage of teachers receiving in service training is 25.75 in 2012-13. The percentage was40.21 in 2010-11 and it is decreased to 34.23 in 2011-12. In case of teachers in governmentschools, the value increased from 40.21 in 2010-11 to 47.01 in 2011-12 and then decreased to36.77 in 2012-13. In aided schools, the percentage is showing an increasing trend, it stood at39.15 compared to 26.25 percent in 2006-07 and to 25.32 in 2012-13. The story is altogetherdifferent in unaided schools, where teacher training shows a declining trend from 2.51 percent in2006-07 to 1.83 in 2010-11, however, it increased to 3.26 in 2011-12 and again decreased to 2.92in 2012-13.
6.6 There are about 538 thousand contractual-teachers in 2012-13, constituting 7.20 percent of thetotal teachers. Percentage of contract teachers in government schools was 9.61 compared to14.59 (2011-12), 13.09 (2010-11) and 14.98 percent (2009-10). The government managementshave the largest number of contract teachers. In aided schools, a decreasing trend was seen,1.45 percent teachers (2012-13) were contract teachers compared to 2.73 percent in 2011-12.Unaided schools were also showing an increase in contract teachers from 2.14 in 2008-09 to2.58 in 2009-10 and 7.96 percent in 2010-11, but it decreased to 7.69 in 2011-12 and 3.6 in 201213. The percentage of professionally trained regular teachers was at 78.58 percent in 2012-13,the same for contractual-teachers is 54.01.
6.7 The average age of teachers across states suggests that majority of the teachers in primaryschools are between 26--45 years, which is true for all types of schools. The percentage ofteachers in the age group 18-25 years across school types has been decreased from 17.54 to8.05. In Government schools, 8.94 percent, in aided schools 8.72 percentage and in unaided 3.94percentage teachers are above the age of 55. Exactly 7.5 percent of the total teachers impartingelementary education are expected to retire during the next 2 to 3 years. The process of recruitmentneeds to be initiated well in advance to fill-up these soon to be vacant positions.
6.8 The percentage of teachers involved in non-teaching assignments is as low as 5.49 percent,which shows that the majority of teachers were not involved in non-teaching assignments. Thepercent has been decreasing from 18.14 percent in 2004-05 to 8.59 in 2008-09 reaching a high of9.55 in 2009-10 and declining to 9.06 in 2010-11 then increased to 10.13 in 2011-12. On anaverage, a teacher was involved in non-teaching assignments for about 16 days from 19 days inthe previous year. In 2010-11, the figure stood at a high of 17 days. In rural areas, teachersinvolved in such assignments was for 15 days compared to 19 days in urban areas.
7. DISE- Marching Ahead
7.1 India’s education policy lays emphasis on Universalisation of Elementary Education (UEE). Therole of education in facilitating social and economic progress is well recognized. Improvementsin education will not only enhance efficiency but also increase the overall quality of life.Empowering the youth with skills, knowledge and access to productive employment in future is acentral instrument for achieving rapid and all inclusive growth. System/Sector Analysis plays acrucial role in examining the functioning of the education system, identifying major issues, challengesand opportunities. Year on year DISE has been collecting data which plays a crucial role in

xvii
examining and analyzing the system functions and the various contextual factors with respect to theenvironment of the education system.
7.2 DISE collects school wise information with respect to various variables. The DISE Data CaptureFormat (DCF) is updated annually to include new variables in consultation with the stategovernment. DISE has become more important in the light of the Right to Education Act 2009.It has included various RTE parameters in its DCF. Given the shift in the focus of planning fromthe national, state, district level to the school level DISE data on RTE can prove useful.
7.2.1 Given the diversity of the country, issues and challenges need to be focus based. Longterm, medium-term and annual plans that focuses emphasis or targets issues and challengesat the micro level like girls’ education (bridging the gender gap), education for schedulescasts, scheduled tribes and other backward classes as well as resource allocation.
7.2.2 Analysis of Pupil-Teacher Ratio, Student-Classroom Ratio, number of contractual-teachers,teachers’ training, teacher’s educational and professional qualifications can be used toaccess whether teachers fulfill the minimum qualification that can be used as a baselinefor accessing teachers quality and identification of teachers’ needs.
7.2.3 DISE data is available over a period of time. If certain issued and challenges are identifiedthen a comprehensive trend based as well as focus contextual analysis can be undertaken.
7.2.4 With the inclusion of the local community in the school management, localised problem canbe easily identified and resources mobilized to solve problems at the habitation level.

xviii
1. Introduction
The Sarva Shiksha Abhiyan (SSA) envisages achieving goal of universal elementaryeducation. In order to operationalise this premise into reality, considerable amount of educationaland allied data is required. It was in this context that the District Information System for Education(DISE) was designed to provide district and sub- district level school data for planning, monitoringand review of various project interventions. The DISE data received from schools are computerisedat the district level and disseminated up to the school level in various ways. The data captureformats; definitions and concepts used for data collection are available at www.dise.in which isbeing followed uniformly across states.
2. State Report Cards
The State Report Cards are based on the data received from about 1.43 million schoolsspread over 662 districts across the 35 States and UTs of the country. The State ReportCards: 2012-13 incorporate information on the following important areas of elementaryeducation:
a) Basic data on area, population, decadal growth rate, urban population, 0-6 population,SC & ST population, male & female literacy rate and sex ratio and number of districts,blocks, villages, clusters and schools from which data is reported.
b) Key data on elementary education in terms of number of schools, enrolment and teachersclassified by school-category and school management (Government, Private, unrecognised &madrasas). Details of schools and enrolment in rural areas are also made available category-wise and management-wise.
c) Grade, level and gender-wise enrolment along with percentage of over-age and underage children at primary and upper primary levels of education in each state.
d) Classrooms categorised into good condition, requiring minor and major repairs by schoolcategory.
e) Distribution of regular and contractual-teachers by educational and professionalqualifications and by school category.
f) Sex-wise enrolment of children with disabilities in primary and upper primary classesand class-wise enrolment of childrens by type of disability.
g) Enrolment by mediums of instruction and by school category.
h) Sex-wise number of students benefited by various incentive schemes at primary andupper primary levels.
j) Ratio of enrolment in Grade V to Grade I in primary grades, transition from primary toupper primary level and retention rate at the primary level. Transition rate is presentedin case of states having at least 2 years data and retention in case of districts in a statehaving 4/5 years DISE data.
k) Performance indicators in terms of school category, enrolment distribution: total,Scheduled Castes, Scheduled Tribes, Other Backward Classes, Muslim Minority,percentage of girls enrolment and schools with enrolment 50 and below, classrooms,single teacher schools, no female teacher schools, schools with attached pre-primaryclasses etc.
l) Quality indicators according to category of schools, pupil-teacher ratio, average number
Report Cards : An Overview
xix
of teachers, availability of female teachers, school buildings, student-classroom ratio,common toilets, girl’s toilets, kitchen-shed, average number of instructional days, averagenumber of days spent on non-teaching assignments during the previous academic yearetc.
m) Number of schools received and utilized school development and teaching learningmaterial grant by school category; and
n) A number of RTE releated indicators including schools with SRC and PTR above 30 atPrimary level and above 35 at Upper Primery level.
3. Methodology and Sources of Data
The Report Cards are based on the school level data provided by the State Project/MissionDirectors to the Department of School Education and Literacy of the MHRD. The data are firstcross-checked and validated at the district and then at the state level. After the state is satisfiedwith the quality and reporting of the data, it is submitted to the national level for analysis, disseminationand reporting to various project management agencies.
3.1 Indicators and their Formulation
The Report Cards contain both absolute data and percentage on selected indicators. For thepurpose of presentation and ease of understanding and interpretation, certain classificatory variablesare regrouped. The following paragraphs provide information on the variables where regroupinghas been done for the purpose of presentation in the Report Cards:
a) School management: The State Report Cards present data on management in terms ofGovernment, Private and unrecognised catagory. The Government category includes allschools under the management of the Government (Central/State), Tribal and Social WelfareDepartments and Local Bodies. The private category includes schools classified as PrivateAided and PrivateUnaided. Unrecognized catagory includes unrecognised schools andrecognised and unrecognised madrasas.
b) School buildings: The classification of schools is also presented in terms of the numberof school buildings and their type. Schools having more than one type of buildingstructures are counted under the category of ‘Multiple Type Building’.
c) Teachers in position: The distribution of teachers in terms of educational qualificationshas been presented separately for regular teachers and contractual-teachers. In addition,teachers received in-service training during the previous academic year is also presentedwhich includes both regular as well as contractual-teachers.
d) Medium of instruction: The State Report Cards present the number of children studyingthrough various medium of instruction by category of schools. The data for four majormedium of instruction are presented in the Report Cards and if a state has more thanfour mediums of instruction, these have been presented under the category, ‘Others’.However, under reporting of enrolment by medium of instruction is observed in afew districts across states. Hence, the same may not present the true picture ofenrolment by mediums of instruction and be treated as incomplete and is applicableto schools those who have reported information and not to all the schools in thestate.
e) Schools, villages, districts, blocks and clusters: The number of districts, blocks,villages and schools is based on the initialized entities in the DISE software. The list ofdistricts, blocks, villages and schools is created at the time of DISE implementation andis updated annually. The number of clusters refers to the mapped entities with theblocks. Some states have often reorganized clusters. Towns and municipalities havebeen classified as separate blocks.
The main indicators presented in the State Report Cards have been derived by using thefollowing illustrative formulae. The derivations are given for schools in primary categoryonly. The same method is applied for other categories and classificatory groups.
xx
Primary schools having single classroom1. % Single-classroom schools = x 100
Total primary schools
Primary schools with single teacher in position2. % Single-teacher schools = x 100
Total primary schools
Primary schools having pre-primary sections3. % Schools with pre-primary = x 100
sections Total primary schools
Primary schools having common toilet4. % Schools with common = x 100
toilet Total primary schools
Primary schools having girls toilet5. % Schools with girl’s toilet = x 100
Total primary schools
Enrolment in primary schools having EducationDepartment, Local Body, Tribal Welfare
Department, Central Government & Others as school management6. % Enrolment in Government = x 100
Schools Total enrolment in primary schools
Enrolment in primary schools having Private Aided and Private Unaided as school management
7. % Enrolment in Private = x 100Schools Total enrolment in primary schools
Enrolment in primary schools having single teacher8. % Enrolment in single-teacher = x 100
schools Enrolment in total number of schoolshaving primary category
Primary schools having teacher ≥ 2but no female teacher
9. % No female teacher schools = x 100(teacher ≥ 2) Total primary schools
Enrolment in Grades I-V below ‘6’ & above ‘11’ years10. % Under-age & over-age children = x 100
Total enrolment in Grades I-V

xxi
Enrolment of SC in primary classes11. % SC enrolment = x 100
Total enrolment in primary classes
Enrolment of SC girls in primary classes12. % SC girls to SC enrolment = x 100
SC enrolment in primary classes
Enrolment of ST in primary classes13. % ST enrolment = x 100
Total enrolment in primary classes
Enrolment of ST girls in primary classes14. % ST girls to ST enrolment = x 100
ST enrolment in primary classes
Total enrolment in schools of primary category15. Pupil Teacher Ratio =
(PTR) Total teachers in primary schools category
(Contractual-teachers have been included while calculating PTR)
Total enrolment in primary schools16. Student-Classroom Ratio =
(SCR) Total classrooms in primary schools
Number of primary schools havingenrolment ≤ 50 in Grades I – IV/V
17. % Schools with ≤ 50 = x 100students in Grades I – IV/V Total primary schools
Total female teachers in primary schools18. % Female Teachers = x 100
Total teachers in primary schools
(Contractual-teachers have been included while calculating this indicator)
Total Primery schools established since 200119. % of schools established Since 2001 = x 100
Total primary schools
(The denominator excludes the schools for which year of establishment is not given)

xxii
20. Flow Rates
(a) Promotion RatePg+1
t+1
Promotion Rate (ptg) = x 100
Egt
where
Pg+1t+1 = Number of students promoted to grade ‘g+1’ in year ‘t+1’ and
Etg = Total number of students in grade ‘g’ in year ‘t’
(b) Repetition Rate
Rg t+1
(rtg) = x 100
Egt
where
Rg t+1 = Number of repeaters in grade ‘g’ in year ‘t+1’
(c) Dropout Rate
Dgt
( Dtg ) = x 100
Egt
where
Dgt = Number of students dropping out from grade ‘g’ in year ‘t’
(d) Transition Rate (TR)
E g+1 t +1
TR = x 100E g
t
where
E g+1 t +1 = New entrants into Grade V/VI in year ‘t+1’ and
E g t = Enrolment in Grade IV/V in year ‘t’
xxiii
(e) Retention Rate (RR)
Enrolment in Grade IV/V in year ‘t’ – Repeaters in GradeIV/V in year ‘t’
RR = x 100Enrolment in Grade I in year ‘t – 3’/’t – 4’
21. Average Promotion, Repetition and Dropout rates present average of these rates in Primary Classesand is calculated by using the standard methods based on common schools.
Girl’s enrolment in Primary Grades in year ‘t’22. Ratio for Girls' to Boys' Enrolment=
Boy’s enrolment in Primary Grades in year ‘t’
23. Ratio of Primary to Upper Primary Schools/SectionsTotal number of Primary Schools/Sections in year ‘t’
= Total number of Upper Primary Schools/Sections in year ‘t’
Total enrolment in Grades I-V24. Gross Enrolment Ratio (GER) = x 100
Population of age 6-11 years
Enrolment, I-V/6-11 age group25. Net Enrolment Ratio (NER) = x 100
Population of age 6-11 years
26. In-service Training, School Development & TLM Grants received, Incentives in terms of number ofbeneficiaries etc. are presented for the previous academic year.
27. Percentage of teachers in different age-groups is presented only for teachers under Governmentmanagements
28. Average number of days teachers spent on non-teaching assignments is applicable to only those teacherswho were assigned non-teaching assignments and not to all the teachers.
4. Coverage: Some Facts
Record date : 30th September 2012
Grades covered : 1 to 8
Total states : 35
Total districts : 662 (including bifurcated districts)
Total schools : 14,31,702
Total students : 199.71 million
Total teachers : 7.35 million (including contractual-teachers)
Total contractual-teachers : 5,38,606
Number of repeaters : 3.76 million
Number of students with disabilities : 2.35 million
xxiv
5. Limitations of the DataRaw data presented in the document or used for calculating indicators are essentiallybased on data provided by the State Project Offices through annual data collection underSSA, (DISE) and the correctness of data reported is not checked by NUEPA. NUEPA iscommitted to provide professional and software support to all States and UTs as well asfor dissemination and analysis of data. In no way, it is involved in data collection as suchand therefore the accuracy and truthfulness of the data rest with the States/UTs. Further,the State Project Directors have certified that data is free from errors & inconsistenciesand hence the same may be merged into the national database maintained at NUEPA,New Delhi.Procedures for the data validation and verification of sample data capture formats at thedistrict level have been prescribed, and the districts reported the steps taken by them toensure quality and reliability of data collection. The DISE software also checks for internalinconsistencies in the data and generates reports for verification by the District Project Office.The State Project Office while transferring the data from the district to the state databaseensures that the data received from the district is complete and free from any inconsistency.Most of the states have engaged an independent agency for sample checking of data. At thenational level, data from the State Project Office is received to ensure compliance withvarious quality control measures. Despite these efforts, some inconsistencies and missingdata are observed at the national level. In some cases data on key elements is found missing.In view of these problems, data presented in the Report Cards may not exactly match. Insome cases, the discrepancies could not be resolved at the national level. For these reasons,data on such variables is not reported in a few districts.Needless to mention that the percentages, rates and ratios presented in the report cards arebased on the schools that have responded to a particular question and hence may not beapplicable to the entire district. Thus, schools by management, their location in rural andurban areas, type of schools, schools by category, enrolment (General, SC, ST, OBC, Muslimand by medium of instructions), pupil-teacher ratio, student-classroom ratio, percentage ofgirls in primary and upper primary classes and other such indicators should therefore beviewed in the light of these limitations.Over a period of time, the number of schools covered under DISE increased significantly.During 2012-13, data has been collected from more than 1.43 million schools, with acomprehensive profile of more than 7.35 million teachers, also being maintained by DISE.Despite best efforts, it is still possible that the field agencies might have not covered all therecognised schools imparting elementary education supposed to be covered under DISE whichis specifically true for schools under private managements. A few districts have collecteddata from these schools while others might not have covered all such schools. Despitesignificant increase in number of private schools covered under DISE (307.9 thousand in2012-13), field level functionaries reported that data from a few private un-aided schoolscouldn’t be obtained for the one or the other reason. We are trying to reach all such schoolsand are hopeful that these efforts will be reflected in the following year.It has also been observed that a few schools did not report age and grade matrix which iscrucial in knowing the status of elementary education. A few districts even did not reportenrolment of Grade VIII. Therefore, enrolment in upper primary classes does not presentthe complete picture in Grades VI-VIII; thus GER and NER may not give correct portrayalof universalisation in such districts and the same may be considered as percentage of childrenof an age-group enrolled in schools that reported data under DISE. The remaining childrenmay be out-of-school children. Education Guarantee Schools (EGS), non-formal educationcenters and other learning centers not covered under DISE. Irrespective of the schoolstructure, enrolment ratio at the Primary level is based on Grades I-V and of the UpperPrimary level, Grades VI-VIII.The state–specific actual single-age 2011 population provided by the Office of the RegistrarGeneral of India is used to obtain 6-11 and 11-14 year child population in the current year at
xxv
the state level which is used to compute GER and NER. The states should feel free to reviseenrolment ratio in the light of more recent estimates of child population, if available throughthe household survey.An attempt has been made to compute flow rates in case of all the States and UTs which isbased on two years DISE data. While analysing the flow rates, it is noticed that in somecases the data is inconsistent. Indicators in case of such districts have not been reported.Districts are advised to run consistency module of the DISE software to identify and removeinconsistencies in the data. In addition, the CRC Coordinators have been made accountableto ensure complete coverage as well as also to ensure that data is consistent and there areno missing values in the filled-in formats of the schools falling under his/her jurisdiction.
6. Random Checking of DataWith an aim to further improve the quality and reliability of data, it has been made mandatoryfor all the States & UTs to get the DISE data sample checked by an independent agencyfrom the year 2006-07 onwards, for which NUEPA suggested the sampling methodology anddeveloped a special data capture format for post enumeration survey. It is heartening tonote that many states initiated random sample checking of data in its very first year, most ofwhich were conducted by the monitoring institutions (mostly ICSSR funded institutions andeducation department in the universities) identified for the states. In addition, NUEPA hasalso launched PES of DISE data initially in three states, namely Andhra Pradesh, HimachalPradesh and Maharashtra. All these efforts would not only help in further improving thequality of data but would also help in ensuring complete coverage.
xxvi
Sl. No.
State/UT
1 Andaman & Nicobar Islands I-V VI-VIII 3 2 3 3 32 Andhra Pradesh I-V VI-VIII 23 23 23 23 233 Arunachal Pradesh I-V VI-VIII 16 15 16 16 164 Assam I-IV V-VII 27 23 27 27 275 Bihar I-V VI-VIII 38 37 38 38 386 Chandigarh I-V VI-VIII 1 1 1 1 17 Chhattisgarh I-V VI-VIII 18 16 16 16 278 Dadra & Nagar Haveli I-IV V-VII 1 1 1 1 19 Daman & Diu I-IV V-VII 2 2 2 2 210 Delhi I-V VI-VIII 9 9 9 9 911 Goa I-IV V-VII 2 2 2 2 212 Gujarat I-IV V-VII 26 25 26 26 2613 Haryana I-V VI-VIII 21 19 22 22 2114 Himachal Pradesh I-V VI-VIII 12 12 12 12 1215 Jammu & Kashmir I-V VI-VIII 22 14 22 22 2216 Jharkhand I-V VI-VIII 24 22 24 24 2417 Karnataka I-IV V-VII 30 27 33 34 3418 Kerala I-IV V-VII 14 14 14 14 1419 Lakshadweep I-IV V-VII 1 1 1 1 120 Madhya Pradesh I-V VI-VIII 50 48 50 50 5021 Maharashtra I-IV V-VII 35 35 35 35 3522 Manipur I-V VI-VIII 9 9 9 9 923 Meghalaya I-IV V-VII 7 7 7 7 724 Mizoram I-IV V-VII 8 8 8 8 825 Nagaland I-V VI-VIII 11 8 11 11 1126 Odisha I-V VI-VII 30 30 30 30 3027 Puducherry I-V VI-VIII 4 4 4 4 428 Punjab I-V VI-VIII 20 17 20 20 2229 Rajasthan I-V VI-VIII 33 32 33 33 3330 Sikkim I-V VI-VIII 4 4 4 4 431 Tamil Nadu I-V VI-VIII 32 30 30 30 3032 Tripura I-V VI-VIII 4 4 4 4 833 Uttar Pradesh I-V VI-VIII 71 70 71 71 7534 Uttarakhand I-V VI-VIII 13 13 13 13 1335 West Bengal I-IV V-VIII 19 20 20 20 20 Total Districts – – 640 604 637 644 662Note: * : Including bifurcated districts.
Number of Districts Reported Data *School Structure
Primary UpperPrimary
2011Census
DISE
2005-06 2010-11 2011-12 2012-13
DISE 2012-13 : Coverage
xxvii
Raw data presented in the document or usedfor calculating indicators are essentially basedon data provided by the S tates and UTsthrough annual data collection (as on 30 th
September 2012) under DISE. NUEP A iscommitted to provide professional andsoftware support to all States and UTs as wellas for dissemination and analysis of data as itis provided by the individual States and UTs.
In no way , NUEPA is involved in datacollection as such and therefore the accuracyand truthfulness of the data rest with theStates/UTs. The State Project Directors havecertified that data is free from errors andinconsistencies and hence may be merged intothe national database maintained at NUEPA,New Delhi.
DDDDDisclaimerisclaimerisclaimerisclaimerisclaimer
Elementary Education in India: Where do we stand ?
2
% Sch. with Pre-Pry.
Total Districts CoveredUpper primary cycle Ratio of P. to U.P. schools/sections 2.06
6621 - 5 6 - 8
Total States 35Primary cycleData reported from
Basic data : 2011
Decadal growth rateOverall literacy rate
Blocks/taluks
17.6
74.0
Primaryonly
All Schools
Pry. withU. Pry
UP withSec/H Sec & Sec
Pry. with UP UP withSec
Pry. with UP & Sec/H Sec Other Cat.
No Res. &Total
Sch. with drinking water Sch. providing MDMSch. with electricity Sch. with computers
Sch. with kitchen-shedSch. Estd. since 2001
#
Sch. with ramp
Sch aproachable by all roadSch. with play groundSch. with boundary wallSch. with girls toilets
Single-teacher schoolsSingle-classroom schools
Sch. with boys toilets
96.140.08.7
55.526.262.6
12-13
11.885.449.851.3
7.9
85.362.193.7
37.560.018.0
92.6
44.8
11-12
60.675.5
1.1100.0
0.8
83.087.397.3
65.7
11-12
0.3
36.016.861.149.255.4
93.2
33.515.058.548.0
89.1
15.1
11-12 12-13
63.850.3
1.8
50.7
13.5100.0
1.8
64.7
12.791.9
89.473.174.779.593.591.4
12-13 11-12
0.8
12-13 11-12
0.9
12-13
6.90.4
100.081.089.193.293.198.566.386.368.936.322.740.7
99.0
92.578.337.526.030.9
12-13
93.985.592.9
0.80.8
98.489.1
55.6
40.358.919.562.2
12-13
88.662.075.7
0.71.1
93.674.197.796.767.236.3
7.6
25.253.3
93.9
46.5
48.949.8
100.0
9.011.1
65.478.193.1
11-12
1.7
40.216.7
87.2
25.4
11-12
1.0100.079.377.6
0.8
88.286.797.8
87.766.4
Total Schools (Cur. Year) 853870 269794 34359 147339 847
Total Schools
Madrasas & Unreco. Sch.
Private schools
Private schools: Rural
Total Enrolment
Govt. schools: Rural
(2011-12)
719,257
112,087
22526
673,883
76,644
82,190,019
842481
23,072
112,563
22,620
15,945,765
991
146129
119,138
27,210
13,118
17,947,494
1998
50642
4,369
27,992
2,847
271527
178,557
82,868
8369
161,778
46,860
61,666,654
6457
791
53
3
85
37
369,401
Total Enrolment in Govt. sch.
Enrolment in Pvt. sch.
Enr. in Madrasas & Unreco.
Enr. in Govt. sch. : Rural
Enr. in Pvt. sch. : Rural
Total Teachers
Private teachers
Government teachers
Tch. in Madrasas & Unreco.
59,041,230
18,590,728
1864274
53,436,517
11,585,558
2620050
2,009,713
569,536
76814
P + UP P+UP+Sec/HS UP only UP + Sec/HS P+UP+Sec U.P. + Sec
11,618,415
3,841,178
3,153,076
10,736,494
527929
400,846
135,891
103012
5681
1,951,168
12,562,640
4,962,782
898,192
655493
101,377
512,251
646217
28122
37,441,152
19,141,854
1522976
33,115,135
9,651,459
1875981
1,155,599
667,749
61702
349,994
903,052
4554
250,706
518,103
21394
632
167
6
Primary only Performance Indicators (in %)
Government schools
57264
94942
33,635
557
27,554
13,983
20,934,257
8,976,529
6,061,762
207515
6,841,301
3,416,662
987136
560,743
336,970
8019
1431702
1412178
1,086,719
307978
37005
1,006,229
195,108
199053590
125,059,229
69,747,073
4,904,941
110,154,538
37,805,629
6,687,983
4,527,747
2,618,098
208,306
5.8 5.38.3 8.6
100.0 87.556.1 56.658.2 59.572.2 88.3
81.15 67.194.4 94.992.3 94.847.1 49.920.5 22.153.4 55.125.6 26.641.1 60.4
11-12 12-13
1.095.477.183.594.568.797.8
0.6
87.292.573.748.718.145.9
90.273.284.596.082.598.087.1
91.872.777.091.468.396.491.5
78.260.136.126.562.1
81.255.638.212.745.5
NATIONAL ELEMENTARY EDUCATION REPORT CARD : 2012-13
1,431,702
Female literacy rate
13.1
8.665.5
%ST pop
%0-6 Population
Schools7,219
Total population in (000's)
Sex ratio82.1
% SC population
%Urban population
83,517 VillagesClusters
210193.4
940Male literacy rate 3287240
Area (Sq. Km)
INDIA
Key Data
0 0
10517 20455
19166 15530
2054 5079607 17912
10661 11185
0 0
2665175 3015566
5610662 3035197
479778 76615
2388396 2487797
2833031 1684958
0 0
102568 196269
233990 161544
23346 4616
(2011-12)
(2011-12)
Pupil-teacher ratio% Sch. having SMC
Student-classroom ratio Average tch per schoolFemale teachersEnr. in single-tch schools
Girls enrolmentEnr. in Govt. schools
273.1
46.56.8
74.3
89.4
49.3
30336.9
47.90.9
64.647.5
70.633
293.6
31.610.073.352.1
71.130
273.7
31.69.5
74.7
91.8
52.4
2958.3
2726
12.962.80.4
21.744.6
12.9
54.1
44.5
2433
18.764.70.5
317.0
48.10.7
64.4
92.2
48.0
31303.1
46.36.3
76.049.3
68.931
2810.440.20.4
58.148.5
58.221 27
28.4 29.868.3 88.6
3030 294.7 5.1
46.3 46.43.8 3.8
65.3 62.648.4 48.5
78.31738
15.840.40.5
58.948.0
65.6 66.82430
11.352.00.5
30.444.5
17349.9
35.30.6
49.249.7
% Sch. with <=50 students 38.3 40.5 7.0 8.5 3.8 5.5 25.8 27.3 16.5 10.7 4.9 20.5#
Upper Primary Level 41636129 33.5 32.2 27.5
84126650Primary Level
Facilities Text books
8.7 14.3 22.1 88 Residential
% Enr. in Pre-Pry.
23.5Sch with No female tch. 26.1 25.5 18.2 17.0 12.2 8.9 33.6 33.3 17.7 13.6 24.4
37.0
% Sch with SCR > % Sch with PTR >Ratio of Grade V to Grade I
17.7 Primary Upper Primary 86.7
30 at Pr. 35 at U.P. 30 at Pr.
Pry. level Total Grossness Transition Rate (Prim. to Upper Prim.)
@ =Govt. only # =Govt. + Aided NR=Not Reported *Some totals may not match due to no response in classificatory data items
14.6 22.4
31737 36492
U.Pry.only
348033
528970
TransportStationary
51992607
2309337914243868
24036063
AttendanceUniform
7564386
2916999
762364
540189
35 at U.P.(2011-12)
593,064
31.2
16.6
Elementary Education : State Report Cards
3
Enrolment by medium of instructions*
Enrolment* 2012-13
Classrooms/Other rooms
% Teachers recd. in-service training (previous year)
Ratio of girls to Boys Enr: Grades I to V 80.07 INDIA0.94 Retention rate (Prim.)
% Grants utilized%Teachers by Age
2.62
Grade Total
I
II
III
IV
V
VI
VII
VIII
Pry (I-V)
% Sch. received
@
SD Grant
TLM SD Grant
95.3 91.1
% ProfessionallyTrained teachers
Regular Private
All Teachers
Female
Male
Contract
79.9
80.6
80.3
49.1
44.9
52.7
82.5
82.2
82.4
160,700
36,025
19,201
8,810
24,666
10,013
6,784
Female
11
3
3
5
4
0
1
No res
225,360
130,227
23,166
52,121
77,739
20,535
SC teachers
Male
153,971
92,638
27,056
21,241
45,940
13,351
Female
ST teachers
187,724
97,396
11,264
46,962
22,544
19,006
15,376
Male Female
TLM
75.7
64.9
9.2
70.557.5
27.1
56.7
U.Pry.
Avg. CLS
School category
Pry. only
Pry + U.Pry
U. Pry. only
U.P. + Sec
P + U.P. + Sec
U.P. + Sec
%majorrepair
%minorrepair
14.28
10.28
2.67
13.36
9.68
%goodcond.
76.91
83.37
96.41
78.89
84.53
Enrolment by nature of disability
7.0
13.5
3.9
7.1
4.9
9.2
3.5
89.57
75.95
6.70
13.81
8.81
6.35
0.93
7.75
5.79
3.73
10.24
P + UP+Sec/HS
59-60
28,671,045
27,323,785
27,198,823
26,327,465
25,263,442
22,506,687
21,696,581
20,723,415
134,784,560
64,926,683
outCWSN20.2
U. Pry.Primary GER Primaryrate % SC enr. GER U. Pry.
5.79
3.36
4.18
% SC girls
% ST enr.
% ST girls
NER Primary
% TeachersinvolvedNumber ofdays involved
NER U. Pry.
Non-Tch assignment3.86 43.7% OBC enr.
11.23 % OBC
1.13 girls
1.29 % Muslim 14.2 12.1enr.
5.61 % Muslim Pr. level
224
Average Instructional days
16
90.8
5.5
64.2
U. Pr. level
226
TotalRepe-aters
1,083,162
500,543
433,708
423,262
431,807
315,685
292,243
282,853
2,872,482girls890,781
5.84
106.085.2
Drop SC/ST/OBC enrolment Enrolment ratio
Total CLSrooms
2,953,921
1,883,787
463,457
577,598
404,086
292,601
178,286
V VIIIVIIVI
5.7
IVI II IIINature of Disability
48.4
11.348.4
42.9
48.7
49.2 51.5
48.9
48.89.8
48.8
19.4
13,54228,080
106,548
64,893
11,199
23,590
11,943
13,013
7,174
76.3
65.2
8.9
72.257.3
26.4
52.8
Girlsenrolment13,756,994
13,176,573
13,189,005
12,793,212
12,260,913
10,966,071
10,599,036
10,101,579
65,176,697
31,666,686
188,377
187,409
205,925
195,992
177,260
148,050
130,205
113,807
954,963
392,062
Boys133,701
135,672
147,779
140,430
130,237
111,382
111,425
90,994
687,819
313,801
Girls
Blind
Low-vision
Hearing
Speach
Loco-motor
MentallyRetarded
Learning
CerebralPalsy
Autism
Multiple
0.85
0.33
0.60
2741377
4576651
131260
121031753684
239427
1553342
Marathi Gujarati
749638
6233183
571129
8961827723
150731
20560
57-58
1.79
0.83
1.34
55 - 56
2.50
1.54
2.05
Otherrooms
-titionrate
2.10
1.49
1.39
1.44
1.69
1.61
1.58
1.77
3.66
Repe-
928,876
524,618
188,373
213,914
239,829
113,296
128,701
1.44
4.6
Government
30.1
10.3
7.6
20.5
12.2
8.0
1.3
1.0
3.1
5.4
27.4
10.9
9.4
19.2
13.3
9.1
1.4
0.5
3.3
5.6
24.6
10.9
9.8
19.1
14.8
9.7
1.5
0.6
3.4
4.7
19.6
10.9
9.3
18.3
18.6
11.7
1.9
0.7
4.2
3.8
15.2
12.2
10.3
17.3
20.6
13.2
2.0
0.8
4.6
4.0
12.9
11.6
10.9
19.1
20.8
12.7
2.2
0.8
4.9
3.6
12.5
11.2
12.1
17.1
21.7
12.0
2.8
1.0
6.0
10.5
12.5
12.1
17.0
21.9
9.1
3.9
1.1
7.3
Teachers by Edu. qualification (other than contract teachers)*
U.P. + Sec
Pry + U.Pry
U. Pry. only
U.P. + Sec
P + U.P. + Sec
Contract
Primary only
Primary + U.Pry
P + UP+Sec/HS
Upper Pry. only
U.P. + Sec/HS
P+ U.P. + Sec
U.P. + Sec/HS
School category
School category
Primary only
Primary with Upper Primary
Primary with UP. Pri. and Sec/HS
Upper Primary onlyUpper Primary with Sec/HS
Primary with UP. & Sec
Upper Primary with Sec
Male
Female
All Tch.
35.2
32.1
33.7
32.0
30.6
31.3
26.3
28.1
26.6
4.8
4.7
4.8
P. only P + UP P+UP+Sec/HS UP only
15.5
15.9
16.9
UP+Sec/HS P+UP+Sec UP+Sec
P + UP+Sec/HS
641,750
542,417
905,732
359,904
362,429
2,656,059
Total
1,885,050 917,425
208,923
354,783
508,279
162,871
225,923
Male
1,251,985
Regular teachers
162,738
341,429
177,299
121,231
Female
1,073,051
871,560
396,131
4,125
8,451
5,661
11,536
1,437
1,706
No res
8,208 162,104
55,912
9,041
10,420
19,818
8,284
6,784
Male
Contract teachers
Pry. only 3.0
School category Grad.Below
Sec. Sec.Hr.
Sec.PostGrad.
M Phil PostDoc.
7.7 18.7
5.4 19.2
6.5 18.8
26112665
4421390
120584712863875
3593306
1279858
Hindi
46310770 5097500
6052431
8424696
3257821910885
3089092
778094
English
177545
4110969897214
216917
337684
6725011
Bengali
834079
/ Ph D
3.2
2.5
2.0
0.6
3.2
1.1
1.7
15.3
15.7
4.0
5.2
3.9
6.3
6.5
29.0
27.8
10.7
19.4
6.9
16.6
9.7
34.3
0.0
0.0
0.0
0.0
0.0
0.0
0.017.7
35.8
39.5
39.5
37.3
47.2
51.4
16.6
40.5
33.1
47.0
25.5
30.0
0.7
0.9
2.7
0.8
4.3
1.2
1.1
0.0
NoRes.
0.1
0.1
0.1
0.0
0.0
0.0
0.05.9 26.9 46.0 18.8 0.00.7
Gender
(In years)
Teachers by gender & caste
Elementary Education in India: Where do we stand ?
4
% Sch. with Pre-Pry.
Dist. covered State codeUpper primary cycle Ratio of P. to U.P. schools/sections 2.51
3 3531 - 5 6 - 8
Total districtsPrimary cycleData reported from
Basic data : 2011
Decadal growth rateOverall literacy rate
Blocks/taluks
6.7
86.3
Primaryonly
All Schools
Pry. withU. Pry
UP withSec/H Sec & Sec
Pry. with UP UP withSec
Pry. with UP & Sec/H Sec Other Cat.
No Res. &Total
Sch. with drinking water Sch. providing MDMSch. with electricity Sch. with computers
Sch. with kitchen-shedSch. Estd. since 2001
#
Sch. with ramp
Sch aproachable by all roadSch. with play groundSch. with boundary wallSch. with girls toilets
Single-teacher schoolsSingle-classroom schools
Sch. with boys toilets
89.280.731.111.128.918.0
12-13
18.286.445.747.9
11.1
87.562.997.5
80.026.79.3
96.8
31.8
11-12
61.338.7
0.0100.0
2.7
90.792.093.3
93.3
11-12
100.0100.0
0.00.0
66.7
11-12 12-13
66.766.7
0.00.0
100.0
100.0100.0100.0100.0
12-13 11-12
0.0
12-13 11-12 12-13
100.0
100.097.122.95.7
24.1
12-13
94.388.674.3
0.00.0
100.0100.0
89.7
78.221.89.0
37.9
12-13
92.371.838.5
2.60.0
94.988.598.798.592.380.1
38.6
22.717.9
95.5
17.5
51.851.4
100.0
3.24.8
72.980.597.2
11-12
0.0
28.44.9
90.2
30.4
11-12
0.0100.069.649.0
0.0
98.098.099.0
96.195.1
Total Schools (Cur. Year) 280 78 35 3 0
Total Schools
Madrasas & Unreco. Sch.
Private schools
Private schools: Rural
Total Enrolment
Govt. schools: Rural
(2011-12)
194
86
0
183
57
11,895
251
0
3
0
0
0
0
3
0
3
0
0
0
27
8
18
75
66
12
0
63
10
10,653
0
0
0
0
0
0
0
Total Enrolment in Govt. sch.
Enrolment in Pvt. sch.
Enr. in Madrasas & Unreco.
Enr. in Govt. sch. : Rural
Enr. in Pvt. sch. : Rural
Total Teachers
Private teachers
Government teachers
Tch. in Madrasas & Unreco.
8,738
2,853
0
7,294
1,988
1158
744
419
0
P + UP P+UP+Sec/HS UP only UP + Sec/HS P+UP+Sec U.P. + Sec
1,043
0
0
1,043
0
95
0
0
0
12,139
5,408
2,206
5,755
0
1,347
317
0
0
8,053
2,289
0
7,724
1,408
929
809
148
0
1,219
0
0
1,219
0
0
0
0
0
Primary only Performance Indicators (in %)
Government schools
19
102
19
0
17
0
30,784
3,075
0
0
2,217
0
3287
530
0
0
451
428
340
111
310
74
53332
40,469
11,928
29,465
6,673
5,374
4,246
982
2.3 7.32.8 11.3
100.0 88.957.7 55.048.6 49.082.0 91.1
86.65 74.097.0 98.294.3 92.186.2 86.759.3 52.822.0 15.516.1 21.123.8 23.4
11-12 12-13
0.089.542.136.8
100.089.5
100.0
0.0
89.5100.094.726.315.815.8
94.463.961.197.294.4
100.0100.0100.097.225.05.6
25.8
STATE ELEMENTARY EDUCATION REPORT CARD : 2012-13
451
Female literacy rate
10.4
7.581.8
%ST pop
%0-6 Population
Schools
0.0
35.7
2019
Total population in (000's)
Sex ratio90.1
% SC population
%Urban population
37 VillagesClusters
379.9
878Male literacy rate 8249
Area (Sq. Km)
A & N ISLANDS
Key Data
0 0
31 0
5 0
0 026 0
4 0
0 0
6202 0
1378 0
0 0
4213 0
1071 0
0 0
721 0
98 0
0 0
(2011-12)
(2011-12)
Pupil-teacher ratio% Sch. having SMC
Student-classroom ratio Average tch per schoolFemale teachersEnr. in single-tch schools
Girls enrolmentEnr. in Govt. schools
114.2
67.86.0
75.4
93.8
47.8
1016
12.461.80.0
78.147.9
90.511
2931.740.00.0
100.0
100.0
48.8
11
69.2
89.7
49.0
1134
47.560.50.0
1612.361.10.0
77.9
98.5
48.1
11114.6
65.41.2
78.548.2
85.910
1632.257.30.0
80.349.1
89.19 10
48.4 51.487.7 94.7
1015 19
12.6 11.659.8 61.20.3 1.2
79.5 77.248.7 48.6
94.76
2827.946.00.0
100.049.1
96.89
2222.865.60.0
81.849.5
% Sch. with <=50 students 75.3 76.4 13.3 15.4 2.9 0.0 7.8 10.5 8.3#
Upper Primary Level 15727 9.1 14.0 0.0
21329Primary Level
Facilities Text books
28.6 14.2 25.1
Residential% Enr. in Pre-Pry.
9.5Sch with No female tch. 19.1 13.6 6.7 6.4 0.0 0.0 1.0 0.0 12.6
1.6
% Sch with SCR > % Sch with PTR >Ratio of Grade V to Grade I
48.7 Primary Upper Primary 99.9
30 at Pr. 35 at U.P. 30 at Pr.
Pry. level Total Grossness Transition Rate (Prim. to Upper Prim.)
*
@ =Govt. only # =Govt. + Aided NR=Not Reported *Some totals may not match due to no response in classificatory data items
0.0
36 0
U.Pry.only
0
43
TransportStationary
18851
13641981
1713
AttendanceUniform
9478
6553
0
226
35 at U.P.(2011-12)

Elementary Education : State Report Cards
5
Retention rate (Prim.)
0.16
% Grants utilized%Teachers by Age (In years)
98.05
Enrolment* 2012-13 Ratio of Girl's to Boy's Enr: Grades I to V
Grade Total
I
II
III
IV
V
VI
VII
VIII
Pry (I-V)
U.P. + Sec
Pry + U.Pry
U. Pry. only
0
U.P. + Sec
P + U.P. + Sec
Contract
Primary only
Primary + U.Pry
P + UP+Sec/HS
Upper Pry. only
U.P. + Sec/HS
P+ U.P. + Sec
U.P. + Sec/HS
Teachers by gender & casteSchool category
School category
Primary only
Primary with Upper Primary
Primary with UP. Pri. and Sec/HS
Upper Primary onlyUpper Primary with Sec/HS
Primary with UP. & Sec
Upper Primary with Sec % Teachers recd. in-service training (previous year)
% Sch. received
A & N ISLANDS
@
SD Grant
% ProfessionallyTrained teachers
Regular Private
Male
Female
All Tch.
All Teachers
Female
Male
Contract
94.7
93.8
98.1
100.0
100.0
100.0
99.5
99.7
99.9
61.8
35.0
43.6
54.0
49.6
51.3
14.0
7.9
11.6
19.7
18.8
17.3
P+UP+Sec/HS UP only
28.3
27.9
27.5
P + UP+Sec/HS
9
14
0
0
5
0
14
36
2
6
32
0
5
284
22
37
257
0
139 177
0
301
151
31
544 634
29
247
158
0
196
79
5
27
13
0
10
1
0
0
0
0
0
0
0
0
0
0
1,664
95
530
819
0
1,163
Total
957
Enrolment by medium of instructions*
324
644
56
269
277
0
Male
335
Regular teachers
33
199
489
0
Female
583
530
948
0
0
0
0
0
0
No res
0 206
55
58
5
45
48
0
Female
39
48
14
1
17
5
0
Male
Contractual teachers
0
0
0
0
0
0
0
No res
0
2
4
0
0
2
SC teachers
Male
1
1
1
0
0
0
Female
ST teachers
37
33
40
2
34
35
0
Male Female
TLM
56.4
78.2
74.3
100.073.7
83.3
21 320 339 156 9 0 0
U.Pry.
Avg. CLS
School category
Pry. only
Pry + U.Pry
U. Pry. only
U.P. + Sec
P + U.P. + Sec
U.P. + Sec
%Majorrepair
%Minorrepair
17.98
19.57
12.29
13.89
22.38
%Goodcond.
71.83
70.26
82.04
86.11
69.93
Pry. only
Enrolment by nature of disability
8.1
14.6
12.0
5.8
0.0
9.8
3.8
70.57 18.86
Otherrooms
10.19
10.17
5.67
0.00
7.69
Teachers by Edu. qualification (other than contract teachers)*
Classrooms/Other rooms
10.57
P + UP+Sec/HS
17 42 568 200 89 2 0 0
School category Grad.Below
Sec. Sec.Hr.
Sec.PostGrad.
MPhil/ PhD
PostDoc.
NoRes.
47.5
38.9
41.9 0.0
6,428
6,486
6,314
6,499
6,506
6,609
6,794
6,761
32,233
20,164
outCWSN0.0
U. Pry.Primary GER Primaryrate % SC enr. GER U. Pry.
0.68
0.02
% SC girls
% ST enr.
% ST girls
NER Primary
% TeachersinvolvedNumber ofdays involved
NER U. Pry.
Non-Tch assignment15.2% OBC enr.
% OBC
1.58 girls
1.90 % Muslim 8.6 7.5enr.
% Muslim Pr. level
215
Average Instructional days
11
92.0
17.4
74.9
U. Pr. level
216
-titionTotalRepe-aters
rate66
20
20
21
12
15
12
6
139girls33
0.43
0.08
0.17
0.22
0.18
0.32
0.31
0.32
1.00
2.13
107.2100.1
Repe- Drop SC/ST/OBC enrolment Enrolment ratio0.95
Total CLSrooms
1,077
629
510
36
111
352
0
533
308
435
26
201
294
0
V
0
5
5
5
19
4
1
23
VIIIVII
13
VI
15
1 0 0
7 4 6
6 9 12
5 6 7
2017 19
0 0 0
0 1 0
11 3 7 3 2 2 2 1
33 25 11 31
IVI II IIINature of Disability
0 1 0 1
1 2 3 4
6 7 9 9
5 9 7 5
14 1015 21
1 1 2
0 0 0
1
0
20 220 1 2 1 1
26
0.0
0.0
8.148.0
13.7
50.6
50.1 50.3
51.3
48.37.2
0.0
00
66
39
37
0
33
53
0
57.1
78.2
68.6
100.073.7
83.3
Girlsenrolment
3,103
3,151
3,133
3,152
3,129
3,238
3,286
3,334
15,668
9,858
59
32
28
40
40
28
32
44
199
104
Boys33
31
23
36
28
23
26
27
151
76
Girls
Blind
Low-vision
Hearing
Speach
Loco-motor
MentallyRetarded
Learning
CerebralPalsy
Autism
Multiple
0.05
0.03
0.04
4191
12935
01524
3124
38172
English
6558 2796
2763
2173
136727
3099
768
Hindi
875
178904
1689
3009
1907
Bengali
6626
263
171
175
0339
215
313
Telugu Tamil
67
208
575
358
267
557
3.15
1.56
2.18
4.58
2.59
3.37
Government
93.1 93.9
UP+Sec/HS P+UP+Sec UP+SecP + UPP. only 55 - 56 57-58 59-60 TLM SD Grant
Gender
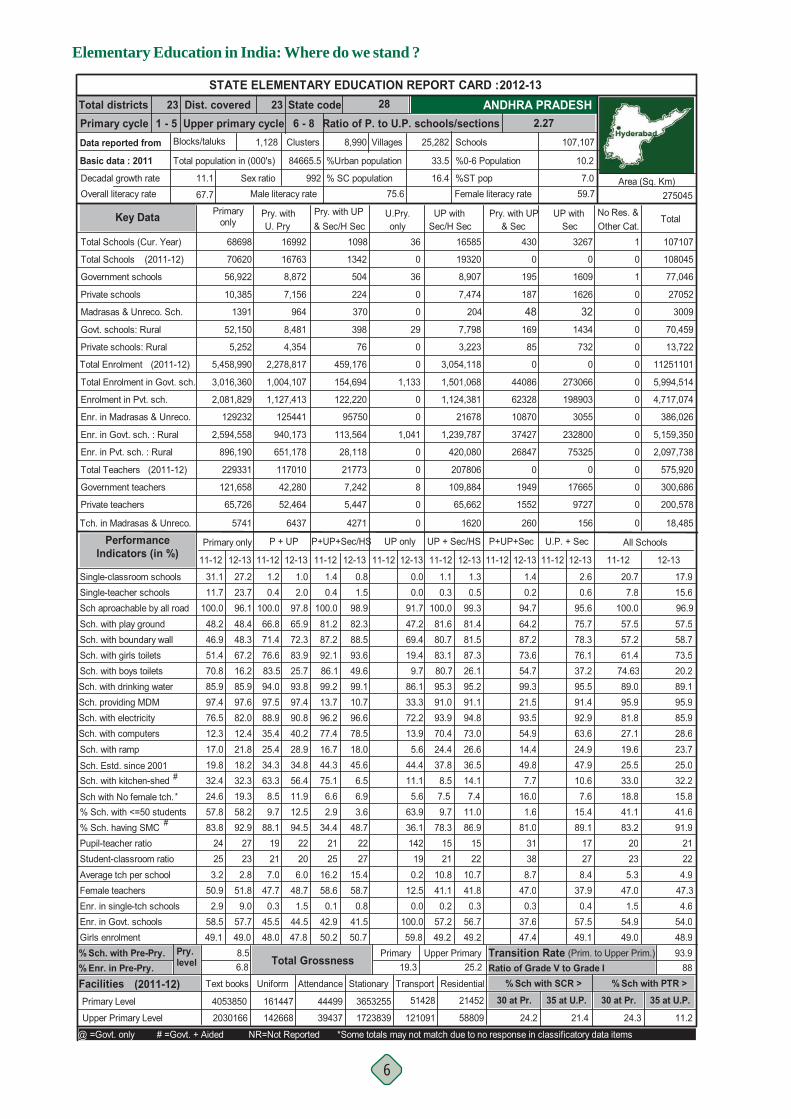
Elementary Education in India: Where do we stand ?
6
% Sch. with Pre-Pry.
Dist. covered State codeUpper primary cycle Ratio of P. to U.P. schools/sections 2.27
23 28231 - 5 6 - 8
Total districtsPrimary cycleData reported from
Basic data : 2011
Decadal growth rateOverall literacy rate
Blocks/taluks
11.1
67.7
Primaryonly
All Schools
Pry. withU. Pry
UP withSec/H Sec & Sec
Pry. with UP UP withSec
Pry. with UP & Sec/H Sec Other Cat.
No Res. &Total
Sch. with drinking water Sch. providing MDMSch. with electricity Sch. with computers
Sch. with kitchen-shedSch. Estd. since 2001
#
Sch. with ramp
Sch aproachable by all roadSch. with play groundSch. with boundary wallSch. with girls toilets
Single-teacher schoolsSingle-classroom schools
Sch. with boys toilets
97.682.012.421.818.232.3
12-13
23.796.148.448.3
27.2
67.216.285.9
35.425.434.3
97.5
63.3
11-12
66.871.4
0.4100.0
1.2
76.683.594.0
88.9
11-12
1.4
72.213.95.6
44.411.1
11-12 12-13
47.269.4
0.00.0
91.7
19.49.7
86.133.3
12-13 11-12
1.4
12-13 11-12
0.6
12-13
2.60.4
100.081.287.292.186.199.213.796.277.416.744.375.1
99.1
96.678.518.045.66.5
12-13
98.982.388.5
0.81.5
93.649.6
10.7
40.228.934.856.4
12-13
97.865.972.3
1.02.0
83.925.793.897.490.876.5
12.3
19.817.0
97.4
32.4
48.246.9
100.0
31.111.7
51.470.885.9
11-12
1.3
24.437.8
91.0
8.5
11-12
0.3100.081.680.7
1.1
83.180.795.3
93.970.4
Total Schools (Cur. Year) 68698 16992 1098 36 1
Total Schools
Madrasas & Unreco. Sch.
Private schools
Private schools: Rural
Total Enrolment
Govt. schools: Rural
(2011-12)
56,922
10,385
1391
52,150
5,252
5,458,990
70620
7,474
29
0
0
0
0
36
0
76
459,176
370
1342
504
224
398
16763
8,872
7,156
964
8,481
4,354
2,278,817
0
1
0
0
0
0
0
Total Enrolment in Govt. sch.
Enrolment in Pvt. sch.
Enr. in Madrasas & Unreco.
Enr. in Govt. sch. : Rural
Enr. in Pvt. sch. : Rural
Total Teachers
Private teachers
Government teachers
Tch. in Madrasas & Unreco.
3,016,360
2,081,829
129232
2,594,558
896,190
229331
121,658
65,726
5741
P + UP P+UP+Sec/HS UP only UP + Sec/HS P+UP+Sec U.P. + Sec
1,133
0
0
1,041
0
8
0
0
0
154,694
122,220
28,118
113,564
21773
7,242
5,447
95750
4271
1,004,107
1,127,413
125441
940,173
651,178
117010
42,280
52,464
6437
0
0
0
0
0
0
0
0
0
Primary only Performance Indicators (in %)
Government schools
16585
19320
8,907
204
7,798
3,223
3,054,118
1,501,068
1,124,381
21678
1,239,787
420,080
207806
109,884
65,662
1620
107107
108045
77,046
27052
3009
70,459
13,722
11251101
5,994,514
4,717,074
386,026
5,159,350
2,097,738
575,920
300,686
200,578
18,485
20.7 17.97.8 15.6
100.0 96.957.5 57.557.2 58.761.4 73.5
74.63 20.289.0 89.195.9 95.981.8 85.927.1 28.619.6 23.725.5 25.033.0 32.2
11-12 12-13
0.599.381.481.587.326.195.2
0.2
91.194.873.026.636.514.1
94.764.287.273.654.799.321.5
95.675.778.376.137.295.591.4
93.554.914.449.87.7
92.963.624.947.910.6
STATE ELEMENTARY EDUCATION REPORT CARD : 2012-13
107,107
Female literacy rate
10.2
7.059.7
%ST pop
%0-6 Population
Schools
16.4
33.5
25,2821,128
Total population in (000's)
Sex ratio75.6
% SC population
%Urban population
8,990 VillagesClusters
84665.5
992Male literacy rate 275045
Area (Sq. Km)
ANDHRA PRADESH
Key Data
0 0
195 1609
187 1626
48 32169 1434
85 732
0 0
44086 273066
62328 198903
10870 3055
37427 232800
26847 75325
0 0
1949 17665
1552 9727
260 156
(2011-12)
(2011-12)
Pupil-teacher ratio% Sch. having SMC
Student-classroom ratio Average tch per schoolFemale teachersEnr. in single-tch schools
Girls enrolmentEnr. in Govt. schools
232.8
51.89.0
57.7
92.9
49.0
27217.0
47.70.3
45.548.0
88.119
190.2
12.50.0
100.0
36.1
59.8
14234.4
2125
16.258.60.1
42.950.2
41.5
48.7
50.7
2227
15.458.70.8
206.0
48.71.5
44.5
94.5
47.8
22253.2
50.92.9
58.549.1
83.824
2110.841.10.2
57.249.2
78.315 21
41.1 41.683.2 91.9
2023 225.3 4.9
47.0 47.31.5 4.6
54.9 54.049.0 48.9
86.91522
10.741.80.3
56.749.2
81.0 89.131388.7
47.00.3
37.647.4
17278.4
37.90.4
57.549.1
% Sch. with <=50 students 57.8 58.2 9.7 12.5 2.9 3.6 63.9 9.7 11.0 1.6 15.4#
Upper Primary Level 2030166 24.2 21.4 11.2
4053850Primary Level
Facilities Text books
6.8 19.3 25.2 88 Residential
% Enr. in Pre-Pry.
15.8Sch with No female tch. 24.6 19.3 8.5 11.9 6.6 6.9 5.6 7.5 7.4 18.8
24.3
% Sch with SCR > % Sch with PTR >Ratio of Grade V to Grade I
8.5 Primary Upper Primary 93.9
30 at Pr. 35 at U.P. 30 at Pr.
Pry. level Total Grossness Transition Rate (Prim. to Upper Prim.)
*
@ =Govt. only # =Govt. + Aided NR=Not Reported *Some totals may not match due to no response in classificatory data items
16.0 7.6
430 3267
U.Pry.only
51428
121091
TransportStationary
3653255
172383939437
44499
AttendanceUniform
161447
142668
21452
58809
35 at U.P.(2011-12)

Elementary Education : State Report Cards
7
Retention rate (Prim.)
4.790.42
% Grants utilized%Teachers by Age (In years)
84.77
Enrolment* 2012-13 Ratio of Girl's to Boy's Enr: Grades I to V
Grade Total
I
II
III
IV
V
VI
VII
VIII
Pry (I-V)
U.P. + Sec
Pry + U.Pry
U. Pry. only
0
U.P. + Sec
P + U.P. + Sec
Contract
Primary only
Primary + U.Pry
P + UP+Sec/HS
Upper Pry. only
U.P. + Sec/HS
P+ U.P. + Sec
U.P. + Sec/HS
Teachers by gender & casteSchool category
School category
Primary only
Primary with Upper Primary
Primary with UP. Pri. and Sec/HS
Upper Primary onlyUpper Primary with Sec/HS
Primary with UP. & Sec
Upper Primary with Sec % Teachers recd. in-service training (previous year)
% Sch. received
ANDHRA PRADESH
@
SD Grant
% ProfessionallyTrained teachers
Regular Private
Male
Female
All Tch.
All Teachers
Female
Male
Contract
91.4
89.4
94.1
92.7
92.8
92.3
99.9
100.0
100.0
55.3
35.7
45.1
31.2
22.5
27.0
0.0
0.0
0.0
0.8
0.9
1.2
P+UP+Sec/HS UP only
18.2
16.6
14.5
P + UP+Sec/HS
3
0
0
4
0
1
6
550
0
3,360
134
430
1,531
602
0
6,803
288
1,084
2,500 11,309
13,686
1,498
87,866
5
5,415 6,437
3
71,617
1,169
11,292
5,128
339
0
2,206
47
312
183
0
0
0
0
0
0
0
0
0
0
0
16,960
8
177,166
3,761
27,548
193,124
Total
101,181
Enrolment by medium of instructions*
50,300
5,592
7
102,222
1,670
16,991
Male
90,317
Regular teachers
1
69,633
1,466
9,788
Female
96,241
47,058
7,750
9
1
0
1
0
26
No res
18 3,860
2,180
2,200
0
4,470
302
656
Female
2,687
1,633
1,417
0
840
323
87
Male
Contractual teachers
1
1
0
0
0
0
0
No res
13,783
7,281
1,076
0
12,606
187
SC teachers
Male
14,362
7,232
1,351
0
9,372
190
Female
ST teachers
10,458
3,493
536
0
4,900
734
655
Male Female
TLM
76.7
51.2
15.9
16.746.2
29.1
40.2
3,373 11,236 59,853 22,187 714 1 0
U.Pry.
Avg. CLS
School category
Pry. only
Pry + U.Pry
U. Pry. only
U.P. + Sec
P + U.P. + Sec
U.P. + Sec
%Majorrepair
%Minorrepair
13.09
8.55
4.05
21.67
7.35
%Goodcond.
79.50
87.05
94.97
76.67
89.30
Pry. only
Enrolment by nature of disability
6.7
12.7
1.7
7.2
5.4
7.2
3.3
92.54
88.39
5.71
7.16
Otherrooms
7.42
4.41
0.98
1.67
3.35
Teachers by Edu. qualification (other than contract teachers)*
Classrooms/Other rooms
1.75
4.46
P + UP+Sec/HS
12 7,154 26,018 110,770 41,690 931 1 0
School category Grad.Below
Sec. Sec.Hr.
Sec.PostGrad.
MPhil/ PhD
PostDoc.
NoRes.
9.7 18.0
4.8 16.1
7.4 17.3
1,552,215
1,454,579
1,454,561
1,410,646
1,371,391
1,323,429
1,315,971
1,214,822
7,243,392
3,854,222
outCWSN18.8
U. Pry.Primary GER Primaryrate % SC enr. GER U. Pry.
10.23
4.46
4.99
% SC girls
% ST enr.
% ST girls
NER Primary
% TeachersinvolvedNumber ofdays involved
NER U. Pry.
Non-Tch assignment2.36 47.6% OBC enr.
5.64 % OBC
2.12 girls
7.87 % Muslim 10.3 9.0enr.
5.65 % Muslim Pr. level
222
Average Instructional days
13
81.8
1.8
60.1
U. Pr. level
224
-titionTotalRepe-aters
rate10,635
6,096
5,776
5,477
5,509
5,847
5,368
4,740
33,493girls15,955
0.45
0.41
0.41
0.43
0.39
0.39
0.39
0.40
0.65
4.38
101.380.4
Repe- Drop SC/ST/OBC enrolment Enrolment ratio0.95
Total CLSrooms
227,293
113,727
13,893
60
119,840
3,101
17,769
44,741
21,989
6,462
0
54,774
1,235
6,822
V
726
3896
3133
3184
3949
3221
169
1376
VIIIVII
2425
VI
2063
719 639 622
3904 4207 4098
2236 2207 1711
1770 1783 1268
20512328 2445
1471 1409 1035
135 106 77
2240 1870 1614 1344 1397 637 595 431
6489 6248 6346 5098
IVI II IIINature of Disability
729 625 645 647
2771 3187 3418 3289
2855 3018 3190 2790
3972 3992 3894 3404
3937 36734168 3502
2234 3142 3627
224 181 199
3643
144
693723 4752700 1981 1565 1245 1346
5073
49.0
10.948.4
46.3
48.6
50.0 51.7
49.5
48.08.1
49.6
18.8
1,5552,332
4,715
1,731
317
0
2,896
369
371
80.6
52.5
20.0
13.948.9
34.4
42.7
Girlsenrolment
746,922
706,236
708,622
689,731
669,529
649,674
650,395
601,821
3,521,040
1,901,890
16,249
15,563
15,631
14,052
14,416
8,610
8,417
6,725
75,911
23,752
Boys12,133
12,618
12,540
11,054
11,678
7,738
7,730
6,419
60,023
21,887
Girls
Blind
Low-vision
Hearing
Speach
Loco-motor
MentallyRetarded
Learning
CerebralPalsy
Autism
Multiple
0.04
0.03
0.04
1238111
51426
10311404025
35606
255398
Telugu
3244846 1766011
945770
317931
01191724
80388
206982
English
1290
43760102
2926
62779
198594
Urdu
11287
5548
3998
0
01732
7109
155
Kannada Oriya
4702
3436
0
02468
3390
69
0.09
0.07
0.08
1.52
0.76
1.16
Government
98.0 89.3
UP+Sec/HS P+UP+Sec UP+SecP + UPP. only 55 - 56 57-58 59-60 TLM SD Grant
Gender
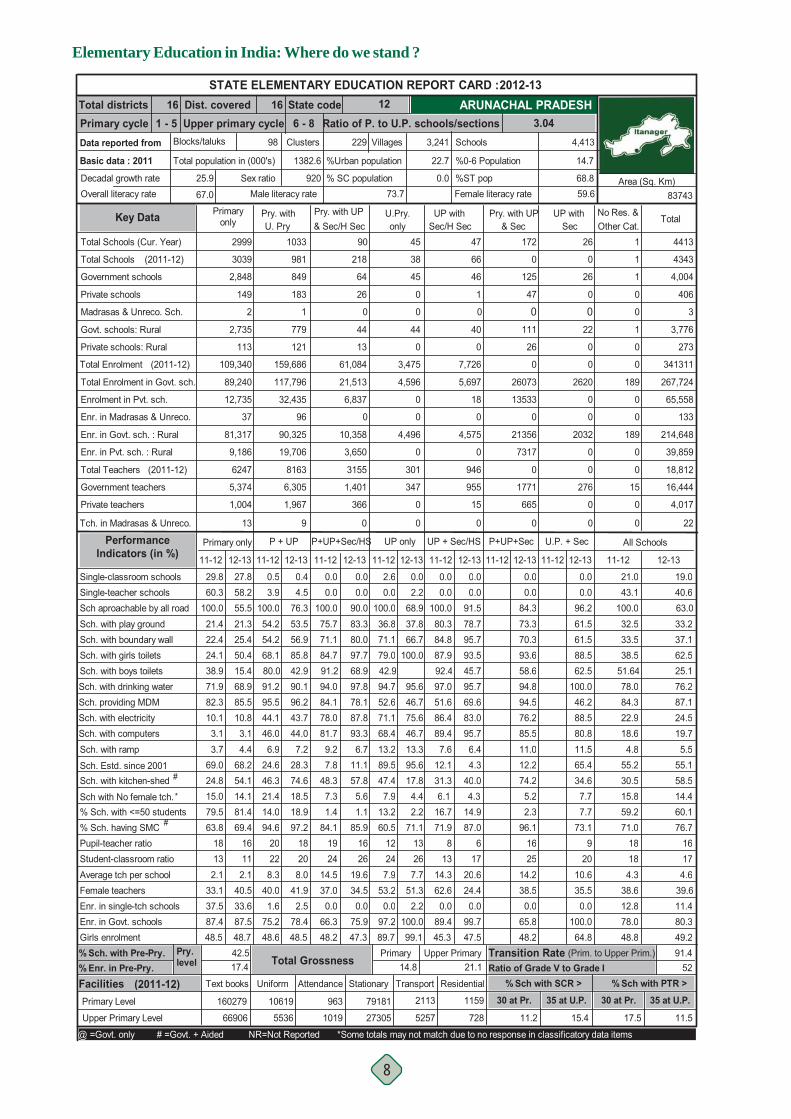
Elementary Education in India: Where do we stand ?
8
% Sch. with Pre-Pry.
Dist. covered State codeUpper primary cycle Ratio of P. to U.P. schools/sections 3.04
16 12161 - 5 6 - 8
Total districtsPrimary cycleData reported from
Basic data : 2011
Decadal growth rateOverall literacy rate
Blocks/taluks
25.9
67.0
Primaryonly
All Schools
Pry. withU. Pry
UP withSec/H Sec & Sec
Pry. with UP UP withSec
Pry. with UP & Sec/H Sec Other Cat.
No Res. &Total
Sch. with drinking water Sch. providing MDMSch. with electricity Sch. with computers
Sch. with kitchen-shedSch. Estd. since 2001
#
Sch. with ramp
Sch aproachable by all roadSch. with play groundSch. with boundary wallSch. with girls toilets
Single-teacher schoolsSingle-classroom schools
Sch. with boys toilets
85.510.83.14.4
68.254.1
12-13
58.255.521.325.4
27.8
50.415.468.9
46.06.9
24.6
95.5
46.3
11-12
54.254.2
3.9100.0
0.5
68.180.091.2
44.1
11-12
0.0
75.646.713.395.617.8
94.7
71.168.413.289.5
52.6
47.4
11-12 12-13
37.866.7
0.0
71.1
0.0100.0
2.6
36.8
2.268.9
100.079.042.9
95.646.7
12-13 11-12
0.0
12-13 11-12
0.0
12-13
0.00.0
100.075.771.184.791.294.084.178.081.79.27.8
48.3
97.8
87.893.36.7
11.157.8
12-13
90.083.380.0
0.00.0
97.768.9
78.1
44.07.2
28.374.6
12-13
76.353.556.9
0.44.5
85.842.990.196.243.710.1
3.1
69.03.7
82.3
24.8
21.422.4
100.0
29.860.3
24.138.971.9
11-12
0.0
7.612.1
51.6
31.3
11-12
0.0100.080.384.8
0.0
87.992.497.0
86.489.4
Total Schools (Cur. Year) 2999 1033 90 45 1
Total Schools
Madrasas & Unreco. Sch.
Private schools
Private schools: Rural
Total Enrolment
Govt. schools: Rural
(2011-12)
2,848
149
2
2,735
113
109,340
3039
1
44
0
3,475
0
38
45
0
13
61,084
0
218
64
26
44
981
849
183
1
779
121
159,686
1
1
0
0
1
0
0
Total Enrolment in Govt. sch.
Enrolment in Pvt. sch.
Enr. in Madrasas & Unreco.
Enr. in Govt. sch. : Rural
Enr. in Pvt. sch. : Rural
Total Teachers
Private teachers
Government teachers
Tch. in Madrasas & Unreco.
89,240
12,735
37
81,317
9,186
6247
5,374
1,004
13
P + UP P+UP+Sec/HS UP only UP + Sec/HS P+UP+Sec U.P. + Sec
4,596
0
0
4,496
301
347
0
0
0
21,513
6,837
3,650
10,358
3155
1,401
366
0
0
117,796
32,435
96
90,325
19,706
8163
6,305
1,967
9
189
0
0
189
0
0
15
0
0
Primary only Performance Indicators (in %)
Government schools
47
66
46
0
40
0
7,726
5,697
18
0
4,575
0
946
955
15
0
4413
4343
4,004
406
3
3,776
273
341311
267,724
65,558
133
214,648
39,859
18,812
16,444
4,017
22
21.0 19.043.1 40.6
100.0 63.032.5 33.233.5 37.138.5 62.5
51.64 25.178.0 76.284.3 87.122.9 24.518.6 19.74.8 5.5
55.2 55.130.5 58.5
11-12 12-13
0.091.578.795.793.545.795.7
0.0
69.683.095.76.44.3
40.0
84.373.370.393.658.694.894.5
96.261.561.588.562.5
100.046.2
76.285.511.012.274.2
88.580.811.565.434.6
STATE ELEMENTARY EDUCATION REPORT CARD : 2012-13
4,413
Female literacy rate
14.7
68.859.6
%ST pop
%0-6 Population
Schools
0.0
22.7
3,24198
Total population in (000's)
Sex ratio73.7
% SC population
%Urban population
229 VillagesClusters
1382.6
920Male literacy rate 83743
Area (Sq. Km)
ARUNACHAL PRADESH
Key Data
0 0
125 26
47 0
0 0111 22
26 0
0 0
26073 2620
13533 0
0 0
21356 2032
7317 0
0 0
1771 276
665 0
0 0
(2011-12)
(2011-12)
Pupil-teacher ratio% Sch. having SMC
Student-classroom ratio Average tch per schoolFemale teachersEnr. in single-tch schools
Girls enrolmentEnr. in Govt. schools
112.1
40.533.687.5
69.4
48.7
16228.3
40.01.6
75.248.6
94.620
247.9
53.20.0
97.289.7
60.512
267.7
51.32.2
100.0
71.1
99.1
1384.1
1924
14.537.00.0
66.348.2
75.9
85.9
47.3
1626
19.634.50.0
208.0
41.92.5
78.4
97.2
48.5
18132.1
33.137.587.448.5
63.818
1314.362.60.0
89.445.3
71.98 16
59.2 60.171.0 76.7
1818 174.3 4.6
38.6 39.612.8 11.478.0 80.348.8 49.2
87.06
1720.624.40.0
99.747.5
96.1 73.11625
14.238.50.0
65.848.2
920
10.635.50.0
100.064.8
% Sch. with <=50 students 79.5 81.4 14.0 18.9 1.4 1.1 13.2 2.2 16.7 14.9 2.3 7.7#
Upper Primary Level 66906 11.2 15.4 11.5
160279Primary Level
Facilities Text books
17.4 14.8 21.1 52 Residential
% Enr. in Pre-Pry.
14.4Sch with No female tch. 15.0 14.1 21.4 18.5 7.3 5.6 7.9 4.4 6.1 4.3 15.8
17.5
% Sch with SCR > % Sch with PTR >Ratio of Grade V to Grade I
42.5 Primary Upper Primary 91.4
30 at Pr. 35 at U.P. 30 at Pr.
Pry. level Total Grossness Transition Rate (Prim. to Upper Prim.)
*
@ =Govt. only # =Govt. + Aided NR=Not Reported *Some totals may not match due to no response in classificatory data items
5.2 7.7
172 26
U.Pry.only
2113
5257
TransportStationary
79181
273051019
963
AttendanceUniform
10619
5536
1159
728
35 at U.P.(2011-12)

Elementary Education : State Report Cards
9
Retention rate (Prim.)
4.980.24
% Grants utilized%Teachers by Age (In years)
42.28
Enrolment* 2012-13 Ratio of Girl's to Boy's Enr: Grades I to V
Grade Total
I
II
III
IV
V
VI
VII
VIII
Pry (I-V)
U.P. + Sec
Pry + U.Pry
U. Pry. only
0
U.P. + Sec
P + U.P. + Sec
Contract
Primary only
Primary + U.Pry
P + UP+Sec/HS
Upper Pry. only
U.P. + Sec/HS
P+ U.P. + Sec
U.P. + Sec/HS
Teachers by gender & casteSchool category
School category
Primary only
Primary with Upper Primary
Primary with UP. Pri. and Sec/HS
Upper Primary onlyUpper Primary with Sec/HS
Primary with UP. & Sec
Upper Primary with Sec % Teachers recd. in-service training (previous year)
% Sch. received
ARUNACHAL PRADESH
@
SD Grant
% ProfessionallyTrained teachers
Regular Private
Male
Female
All Tch.
All Teachers
Female
Male
Contract
23.1
21.0
25.8
17.6
17.7
17.5
21.1
25.7
28.4
12.6
7.1
10.4
10.9
7.7
9.5
3.0
0.0
1.4
4.1
4.0
4.0
P+UP+Sec/HS UP only
0.3
0.2
0.0
P + UP+Sec/HS
134
9
5
4
10
1
64
28
17
13
34
1
67
234
55
69
405
49
201 328
130
1,316
365
165
801 671
39
503
574
77
49
13
1
8
13
9
2
0
0
0
0
0
0
0
0
0
0
0
1,767
347
970
2,436
276
6,391
Total
8,281
Enrolment by medium of instructions*
4,643
1,151
136
720
1,437
169
Male
3,677
Regular teachers
146
235
899
93
Female
2,428
3,343
604
42
1
0
7
16
5
No res
5 160
130
5
32
2
38
5
Female
121
123
6
33
6
46
4
Male
Contractual teachers
0
0
0
0
0
0
0
No res
27
71
41
0
10
41
SC teachers
Male
33
43
5
0
2
8
Female
ST teachers
3,219
3,157
387
130
277
660
55
Male Female
TLM
54.5
70.9
41.1
20.048.9
51.2
30.8
219 2,587 4,267 794 26 1 0
U.Pry.
Avg. CLS
School category
Pry. only
Pry + U.Pry
U. Pry. only
U.P. + Sec
P + U.P. + Sec
U.P. + Sec
%Majorrepair
%Minorrepair
26.01
23.75
18.56
19.44
19.53
%Goodcond.
60.89
59.35
77.31
75.56
70.18
Pry. only
Enrolment by nature of disability
7.4
12.3
3.9
7.3
5.2
9.3
3.0
67.25
73.51
21.20
22.52
Otherrooms
13.10
16.90
4.13
5.00
10.29
Teachers by Edu. qualification (other than contract teachers)*
Classrooms/Other rooms
11.56
3.97
P + UP+Sec/HS
616 589 2,484 2,174 232 15 0 0
School category Grad.Below
Sec. Sec.Hr.
Sec.PostGrad.
MPhil/ PhD
PostDoc.
NoRes.
3.2 0.6
3.0 0.0
3.1 0.4
69,333
49,354
42,317
37,926
35,838
35,467
32,866
30,314
234,768
98,647
outCWSN0.7
U. Pry.Primary GER Primaryrate % SC enr. GER U. Pry.
34.92
15.73
12.16
% SC girls
% ST enr.
% ST girls
NER Primary
% TeachersinvolvedNumber ofdays involved
NER U. Pry.
Non-Tch assignment8.04 % OBC enr.
8.29 % OBC
2.60 girls
2.02 % Muslim enr.
18.69 % Muslim Pr. level
199
Average Instructional days
20
2.9
74.2
U. Pr. level
211
-titionTotalRepe-aters
rate1,138
372
232
158
103
105
66
52
2,003girls223
0.81
0.18
0.21
0.31
0.27
0.40
0.54
0.74
1.48
11.08
Repe- Drop SC/ST/OBC enrolment Enrolment ratio0.95
Total CLSrooms
8,970
7,622
1,106
177
345
1,596
134
2,028
2,396
509
91
314
696
114
V
20
524
400
119
103
465
14
47
VIIIVII
48
VI
50
27 8 3
468 382 378
296 260 188
109 87 79
103123 91
327 287 197
1 14 18
145 103 85 40 33 38 28 25
92 83 76 83
IVI II IIINature of Disability
80 21 32 28
501 534 548 524
534 584 562 444
243 171 170 145
190 178172 135
682 683 598
29 7 13
497
12
1630 1988 39 40 39 25
55
1.0
46.5
74.449.3
1.3
47.2
0.7
47.6 43.6
0.6
46.4
1.0
51.674.3
47.9
15
2,041
2,445
315
148
149
523
60
50.9
65.8
37.8
20.042.6
40.7
19.2
Girlsenrolment
33,671
24,285
20,401
18,600
17,480
17,933
16,590
15,083
114,437
49,606
1,439
1,298
1,198
958
909
732
612
479
5,802
1,823
Boys1,127
1,117
1,104
989
849
735
611
578
5,186
1,924
Girls
Blind
Low-vision
Hearing
Speach
Loco-motor
MentallyRetarded
Learning
CerebralPalsy
Autism
Multiple
0.18
0.07
0.14
149121
28085
45765715
39606
2509
English
101647 283
973
0
00
0
726
Others
0
00
0
100
12
Hindi
111
0
133
0
00
3
0
Kannada Urdu
32
0
0
00
0
135
1.22
0.41
0.90
1.99
0.76
1.50
Government
98.9 99.6
UP+Sec/HS P+UP+Sec UP+SecP + UPP. only 55 - 56 57-58 59-60 TLM SD Grant
Gender

Elementary Education in India: Where do we stand ?
10
% Sch. with Pre-Pry.
Dist. covered State codeUpper primary cycle Ratio of P. to U.P. schools/sections 3.10
27 18271 - 5 6 - 8
Total districtsPrimary cycleData reported from
Basic data : 2011
Decadal growth rateOverall literacy rate
Blocks/taluks
16.9
73.2
Primaryonly
All Schools
Pry. withU. Pry
UP withSec/H Sec & Sec
Pry. with UP UP withSec
Pry. with UP & Sec/H Sec Other Cat.
No Res. &Total
Sch. with drinking water Sch. providing MDMSch. with electricity Sch. with computers
Sch. with kitchen-shedSch. Estd. since 2001
#
Sch. with ramp
Sch aproachable by all roadSch. with play groundSch. with boundary wallSch. with girls toilets
Single-teacher schoolsSingle-classroom schools
Sch. with boys toilets
98.87.01.0
61.012.474.5
12-13
9.985.847.423.4
22.9
78.362.780.0
27.852.325.9
97.4
64.5
11-12
53.645.6
0.4100.0
3.1
67.975.489.6
42.4
11-12
1.8
22.217.041.34.4
32.9
75.9
19.815.537.24.2
61.5
3.4
11-12 12-13
67.120.1
3.7
18.9
0.1100.0
5.3
66.9
0.089.1
65.149.853.251.679.774.6
12-13 11-12
3.2
12-13 11-12
0.1
12-13
1.91.0
100.058.072.871.483.992.211.169.243.95.6
39.48.9
94.8
72.849.18.1
32.42.8
12-13
95.465.979.8
5.80.0
88.974.7
8.3
28.249.932.368.8
12-13
92.851.348.2
2.82.4
80.567.689.597.844.75.7
0.9
12.150.6
98.4
64.0
47.823.2
100.0
31.620.5
49.056.276.3
11-12
2.3
13.03.1
81.4
4.7
11-12
0.1100.076.164.5
1.1
67.976.393.5
69.053.8
Total Schools (Cur. Year) 45959 1762 173 10971 0
Total Schools
Madrasas & Unreco. Sch.
Private schools
Private schools: Rural
Total Enrolment
Govt. schools: Rural
(2011-12)
35,554
876
9529
34,059
822
3,637,366
45735
61
4,554
5,358
1,291,959
502
10940
4,934
5,535
88
238,388
10
982
31
132
18
1555
949
738
75
885
681
238,656
0
0
0
0
0
0
0
Total Enrolment in Govt. sch.
Enrolment in Pvt. sch.
Enr. in Madrasas & Unreco.
Enr. in Govt. sch. : Rural
Enr. in Pvt. sch. : Rural
Total Teachers
Private teachers
Government teachers
Tch. in Madrasas & Unreco.
2,875,046
57,933
640661
2,681,617
53,829
109654
103,303
4,116
22841
P + UP P+UP+Sec/HS UP only UP + Sec/HS P+UP+Sec U.P. + Sec
689,978
512,048
494,591
636,949
73051
37,983
37,375
39604
3295
12,731
40,058
20,311
6,255
13170
563
2,119
1956
119
169,097
93,631
8330
156,553
84,454
14324
9,527
7,106
560
0
0
0
0
0
0
0
0
0
Primary only Performance Indicators (in %)
Government schools
681
1898
608
12
455
59
354,598
140,773
7,290
1539
99,139
7,015
24873
15,120
1,011
191
61689
61110
42,993
8399
10297
40,702
7,835
5760967
4,045,328
942,701
716,015
3,702,258
825,009
235,072
181,658
66,716
29,158
24.7 17.915.4 7.5
100.0 87.052.4 51.925.1 25.650.5 76.2
56.88 61.877.3 80.989.9 93.112.2 13.96.5 7.2
46.3 54.711.2 11.749.0 64.4
11-12 12-13
0.095.378.977.286.572.596.8
1.0
88.583.379.112.82.2
48.7
92.855.670.684.980.190.527.0
94.168.657.978.970.092.286.2
68.742.44.2
40.413.5
67.149.913.13.3
44.2
STATE ELEMENTARY EDUCATION REPORT CARD : 2012-13
61,689
Female literacy rate
14.5
12.467.3
%ST pop
%0-6 Population
Schools
7.2
14.1
21,723145
Total population in (000's)
Sex ratio78.8
% SC population
%Urban population
3,416 VillagesClusters
31169.3
954Male literacy rate 78438
Area (Sq. Km)
ASSAM
Key Data
0 0
21 896
796 261
82 8716 715
602 225
0 0
5615 152088
204106 27635
16076 7849
4415 117330
141486 23323
0 0
345 14817
11238 3751
1139 1013
(2011-12)
(2011-12)
Pupil-teacher ratio% Sch. having SMC
Student-classroom ratio Average tch per schoolFemale teachersEnr. in single-tch schools
Girls enrolmentEnr. in Govt. schools
292.8
36.77.3
80.5
95.8
50.2
27259.2
39.00.2
71.947.7
81.517
346.7
22.00.1
54.952.7
78.218
317.2
24.50.0
55.6
94.4
53.0
1637.8
1822
13.451.11.35.3
43.123.3
33.3
46.3
2030
16.249.50.0
239.8
40.92.3
62.4
95.5
47.0
16332.4
34.919.281.750.0
79.233
2113.132.90.1
87.448.6
71.614 21
31.6 33.578.7 94.8
2531 283.8 4.5
31.8 33.912.2 4.772.5 70.950.2 50.2
79.59
2824.033.10.0
94.142.8
59.5 76.11826
14.251.21.12.5
43.0
1026
15.733.50.0
81.153.7
% Sch. with <=50 students 38.0 39.9 11.8 10.2 5.6 5.2 14.1 17.3 6.4 3.2 5.7 12.2#
Upper Primary Level 1480314 44.4 31.5 5.6
3979514Primary Level
Facilities Text books
19.2 7.5 19.0 69 Residential
% Enr. in Pre-Pry.
31.7Sch with No female tch. 33.7 36.0 15.3 9.7 4.2 5.2 30.4 24.0 13.0 10.1 31.6
36.8
% Sch with SCR > % Sch with PTR >Ratio of Grade V to Grade I
77.5 Primary Upper Primary 94.5
30 at Pr. 35 at U.P. 30 at Pr.
Pry. level Total Grossness Transition Rate (Prim. to Upper Prim.)
*
@ =Govt. only # =Govt. + Aided NR=Not Reported *Some totals may not match due to no response in classificatory data items
6.3 6.2
899 1244
U.Pry.only
557
620
TransportStationary
2197536
73922713939
31024
AttendanceUniform
672717
243047
1414
2162
35 at U.P.(2011-12)

Elementary Education : State Report Cards
11
Retention rate (Prim.)
10.160.97
% Grants utilized%Teachers by Age (In years)
56.23
Enrolment* 2012-13 Ratio of Girl's to Boy's Enr: Grades I to V
Grade Total
I
II
III
IV
V
VI
VII
VIII
Pry (I-V)
U.P. + Sec
Pry + U.Pry
U. Pry. only
0
U.P. + Sec
P + U.P. + Sec
Contract
Primary only
Primary + U.Pry
P + UP+Sec/HS
Upper Pry. only
U.P. + Sec/HS
P+ U.P. + Sec
U.P. + Sec/HS
Teachers by gender & casteSchool category
School category
Primary only
Primary with Upper Primary
Primary with UP. Pri. and Sec/HS
Upper Primary onlyUpper Primary with Sec/HS
Primary with UP. & Sec
Upper Primary with Sec % Teachers recd. in-service training (previous year)
% Sch. received
ASSAM
@
SD Grant
% ProfessionallyTrained teachers
Regular Private
Male
Female
All Tch.
All Teachers
Female
Male
Contract
7.6
8.9
6.9
20.6
32.5
12.3
53.0
52.3
52.0
32.4
33.5
32.8
21.1
16.0
19.0
26.1
26.0
26.1
0.4
0.4
0.5
P+UP+Sec/HS UP only
1.0
0.9
0.6
P + UP+Sec/HS
250
29
792
52
121
88
5
136
6,587
324
607
607
78
406
34,887
975
2,413
2,178
406 714
14,608
8,268
9,647
33,245
1,554 601
2,660
4,983
1,136
1,642
171
46
367
188
100
113
16
0
4
2
0
0
0
0
0
0
0
0
2,801
78,653
16,322
12,722
19,581
130,260
Total
17,193
Enrolment by medium of instructions*
10,128
1,404
59,371
10,834
6,182
12,830
Male
82,022
Regular teachers
19,171
5,337
6,463
6,406
Female
47,621
7,005
1,368
0
0
0
0
0
0
No res
0 171
30
18
87
68
50
150
Female
446
30
11
24
83
27
195
Male
Contractual teachers
0
0
0
0
0
0
0
No res
5,630
577
101
3,428
462
356
SC teachers
Male
2,907
384
81
1,074
217
351
Female
ST teachers
14,815
1,156
221
8,893
834
919
1,914
Male Female
TLM
65.0
51.4
0.6
83.844.8
0.6
42.4
1,693 5,582 8,602 854 152 0 0
U.Pry.
Avg. CLS
School category
Pry. only
Pry + U.Pry
U. Pry. only
U.P. + Sec
P + U.P. + Sec
U.P. + Sec
%Majorrepair
%Minorrepair
17.78
20.54
16.28
19.41
27.64
%Goodcond.
57.54
53.41
72.90
40.05
45.30
Pry. only
Enrolment by nature of disability
6.7
10.7
3.6
7.8
5.7
9.6
2.6
61.24
38.73
21.13
29.23
Otherrooms
24.68
26.05
10.82
40.54
27.06
Teachers by Edu. qualification (other than contract teachers)*
Classrooms/Other rooms
17.63
32.05
P + UP+Sec/HS
6,285 57,527 37,834 25,575 2,240 178 4 0
School category Grad.Below
Sec. Sec.Hr.
Sec.PostGrad.
MPhil/ PhD
PostDoc.
NoRes.
0.5 2.3
0.4 1.6
0.4 2.1
953,763
833,446
765,905
708,749
653,928
610,570
602,241
575,442
3,915,791
1,788,253
outCWSN8.6
U. Pry.Primary GER Primaryrate % SC enr. GER U. Pry.
16.68
7.96
6.49
% SC girls
% ST enr.
% ST girls
NER Primary
% TeachersinvolvedNumber ofdays involved
NER U. Pry.
Non-Tch assignment5.10 26.5% OBC enr.
4.41 % OBC
6.03 girls
2.95 % Muslim 40.0 33.6enr.
8.84 % Muslim Pr. level
215
Average Instructional days
19
9.1
70.3
U. Pr. level
221
-titionTotalRepe-aters
rate14,381
7,058
5,710
4,887
4,379
6,404
5,526
5,857
36,415girls17,787
0.93
0.98
0.93
1.00
0.69
0.71
0.75
0.85
1.43
21.72
Repe- Drop SC/ST/OBC enrolment Enrolment ratio0.99
Total CLSrooms
121,493
11,778
1,849
39,803
5,344
8,607
7,096
14,929
1,970
528
11,029
2,595
1,752
3,238
V
294
1807
1989
1465
1926
1442
31
329
VIIIVII
553
VI
501
219 180 236
1402 1414 1374
1258 1205 952
823 721 545
11141247 1192
690 606 385
25 23 17
872 647 461 408 371 210 183 173
2098 1602 1386 1105
IVI II IIINature of Disability
608 341 299 273
1916 2000 1889 1950
2370 2321 2401 2218
2808 2361 2067 1718
2351 21802760 2045
1288 1451 1708
91 65 47
1579
35
157194 1321413 649 496 392 360
946
49.3
14.349.7
25.2
49.3
50.0 55.1
49.2
50.215.8
50.5
9.8
322592
8,472
818
236
2,714
448
951
756
66.3
51.0
0.6
80.845.1
0.2
42.7
Girlsenrolment
468,487
412,791
381,204
354,752
327,632
313,707
309,430
297,752
1,944,866
920,889
9,566
8,271
7,405
6,862
6,059
3,789
3,490
2,967
38,163
10,246
Boys6,658
5,517
5,529
4,861
4,572
2,832
2,692
2,290
27,137
7,814
Girls
Blind
Low-vision
Hearing
Speach
Loco-motor
MentallyRetarded
Learning
CerebralPalsy
Autism
Multiple
0.34
0.25
0.31
201704
15837
970102113497
110398
145532
Assamese
2791884 524197
42479
3468
17095026344
15099
28543
Bengali
94761
476119177
29169
19877
61390
English
3937
132068
5840
1895
562324413
4302
4647
Bodo Hindi
44893
712
4165
19693366
1237
4537
3.06
2.13
2.74
4.31
3.27
3.96
Government
96.1 95.0
UP+Sec/HS P+UP+Sec UP+SecP + UPP. only 55 - 56 57-58 59-60 TLM SD Grant
Gender
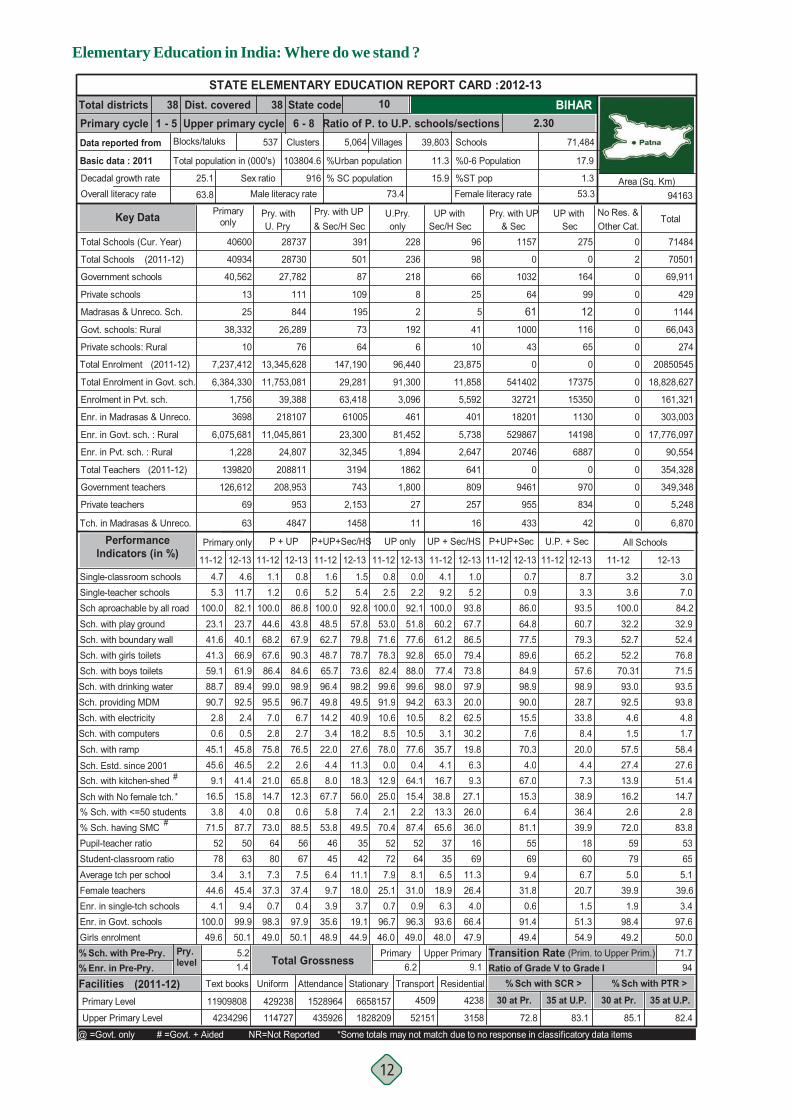
Elementary Education in India: Where do we stand ?
12
% Sch. with Pre-Pry.
Dist. covered State codeUpper primary cycle Ratio of P. to U.P. schools/sections 2.30
38 10381 - 5 6 - 8
Total districtsPrimary cycleData reported from
Basic data : 2011
Decadal growth rateOverall literacy rate
Blocks/taluks
25.1
63.8
Primaryonly
All Schools
Pry. withU. Pry
UP withSec/H Sec & Sec
Pry. with UP UP withSec
Pry. with UP & Sec/H Sec Other Cat.
No Res. &Total
Sch. with drinking water Sch. providing MDMSch. with electricity Sch. with computers
Sch. with kitchen-shedSch. Estd. since 2001
#
Sch. with ramp
Sch aproachable by all roadSch. with play groundSch. with boundary wallSch. with girls toilets
Single-teacher schoolsSingle-classroom schools
Sch. with boys toilets
92.52.40.5
45.846.541.4
12-13
11.782.123.740.1
4.6
66.961.989.4
2.875.82.2
95.5
21.0
11-12
44.668.2
1.2100.0
1.1
67.686.499.0
7.0
11-12
1.6
10.510.577.60.4
64.1
99.6
10.68.5
78.00.0
91.9
12.9
11-12 12-13
51.877.6
0.0
71.6
2.5100.0
0.8
53.0
2.292.1
92.878.388.082.499.694.2
12-13 11-12
0.7
12-13 11-12
3.3
12-13
8.75.2
100.048.562.748.765.796.449.814.23.4
22.04.48.0
98.2
40.918.227.611.318.3
12-13
92.857.879.8
1.55.4
78.773.6
49.5
2.776.52.6
65.8
12-13
86.843.867.9
0.80.6
90.384.698.996.76.72.8
0.6
45.645.1
90.7
9.1
23.141.6
100.0
4.75.3
41.359.188.7
11-12
1.0
35.74.1
63.3
16.7
11-12
9.2100.060.261.2
4.1
65.077.498.0
8.23.1
Total Schools (Cur. Year) 40600 28737 391 228 0
Total Schools
Madrasas & Unreco. Sch.
Private schools
Private schools: Rural
Total Enrolment
Govt. schools: Rural
(2011-12)
40,562
13
25
38,332
10
7,237,412
40934
25
192
6
96,440
2
236
218
8
64
147,190
195
501
87
109
73
28730
27,782
111
844
26,289
76
13,345,628
2
0
0
0
0
0
0
Total Enrolment in Govt. sch.
Enrolment in Pvt. sch.
Enr. in Madrasas & Unreco.
Enr. in Govt. sch. : Rural
Enr. in Pvt. sch. : Rural
Total Teachers
Private teachers
Government teachers
Tch. in Madrasas & Unreco.
6,384,330
1,756
3698
6,075,681
1,228
139820
126,612
69
63
P + UP P+UP+Sec/HS UP only UP + Sec/HS P+UP+Sec U.P. + Sec
91,300
3,096
1,894
81,452
1862
1,800
27
461
11
29,281
63,418
32,345
23,300
3194
743
2,153
61005
1458
11,753,081
39,388
218107
11,045,861
24,807
208811
208,953
953
4847
0
0
0
0
0
0
0
0
0
Primary only Performance Indicators (in %)
Government schools
96
98
66
5
41
10
23,875
11,858
5,592
401
5,738
2,647
641
809
257
16
71484
70501
69,911
429
1144
66,043
274
20850545
18,828,627
161,321
303,003
17,776,097
90,554
354,328
349,348
5,248
6,870
3.2 3.03.6 7.0
100.0 84.232.2 32.952.7 52.452.2 76.8
70.31 71.593.0 93.592.5 93.84.6 4.81.5 1.7
57.5 58.427.4 27.613.9 51.4
11-12 12-13
5.293.867.786.579.473.897.9
0.9
20.062.530.219.86.39.3
86.064.877.589.684.998.990.0
93.560.779.365.257.698.928.7
15.57.6
70.34.0
67.0
33.88.4
20.04.47.3
STATE ELEMENTARY EDUCATION REPORT CARD : 2012-13
71,484
Female literacy rate
17.9
1.353.3
%ST pop
%0-6 Population
Schools
15.9
11.3
39,803537
Total population in (000's)
Sex ratio73.4
% SC population
%Urban population
5,064 VillagesClusters
103804.6
916Male literacy rate 94163
Area (Sq. Km)
BIHAR
Key Data
0 0
1032 164
64 99
61 121000 116
43 65
0 0
541402 17375
32721 15350
18201 1130
529867 14198
20746 6887
0 0
9461 970
955 834
433 42
(2011-12)
(2011-12)
Pupil-teacher ratio% Sch. having SMC
Student-classroom ratio Average tch per schoolFemale teachersEnr. in single-tch schools
Girls enrolmentEnr. in Govt. schools
633.1
45.49.4
99.9
87.7
50.1
50807.3
37.30.7
98.349.0
73.064
727.9
25.10.7
96.746.0
70.452
648.1
31.00.9
96.3
87.4
49.0
5253.8
46456.49.73.9
35.648.9
19.1
49.5
44.9
3542
11.118.03.7
677.5
37.40.4
97.9
88.5
50.1
56783.4
44.64.1
100.049.6
71.552
356.5
18.96.3
93.648.0
65.637 53
2.6 2.872.0 83.8
5979 655.0 5.1
39.9 39.61.9 3.4
98.4 97.649.2 50.0
36.01669
11.326.44.0
66.447.9
81.1 39.955699.4
31.80.6
91.449.4
18606.7
20.71.5
51.354.9
% Sch. with <=50 students 3.8 4.0 0.8 0.6 5.8 7.4 2.1 2.2 13.3 26.0 6.4 36.4#
Upper Primary Level 4234296 72.8 83.1 82.4
11909808Primary Level
Facilities Text books
1.4 6.2 9.1 94 Residential
% Enr. in Pre-Pry.
14.7Sch with No female tch. 16.5 15.8 14.7 12.3 67.7 56.0 25.0 15.4 38.8 27.1 16.2
85.1
% Sch with SCR > % Sch with PTR >Ratio of Grade V to Grade I
5.2 Primary Upper Primary 71.7
30 at Pr. 35 at U.P. 30 at Pr.
Pry. level Total Grossness Transition Rate (Prim. to Upper Prim.)
*
@ =Govt. only # =Govt. + Aided NR=Not Reported *Some totals may not match due to no response in classificatory data items
15.3 38.9
1157 275
U.Pry.only
4509
52151
TransportStationary
6658157
1828209435926
1528964
AttendanceUniform
429238
114727
4238
3158
35 at U.P.(2011-12)

Elementary Education : State Report Cards
13
Retention rate (Prim.)
10.551.43
% Grants utilized%Teachers by Age (In years)
62.26
Enrolment* 2012-13 Ratio of Girl's to Boy's Enr: Grades I to V
Grade Total
I
II
III
IV
V
VI
VII
VIII
Pry (I-V)
U.P. + Sec
Pry + U.Pry
U. Pry. only
0
U.P. + Sec
P + U.P. + Sec
Contract
Primary only
Primary + U.Pry
P + UP+Sec/HS
Upper Pry. only
U.P. + Sec/HS
P+ U.P. + Sec
U.P. + Sec/HS
Teachers by gender & casteSchool category
School category
Primary only
Primary with Upper Primary
Primary with UP. Pri. and Sec/HS
Upper Primary onlyUpper Primary with Sec/HS
Primary with UP. & Sec
Upper Primary with Sec % Teachers recd. in-service training (previous year)
% Sch. received
BIHAR
@
SD Grant
% ProfessionallyTrained teachers
Regular Private
Male
Female
All Tch.
All Teachers
Female
Male
Contract
40.7
40.2
42.6
46.7
41.9
50.6
39.4
46.6
51.6
14.9
14.9
14.9
13.2
13.7
13.4
10.0
10.4
10.1
0.3
1.2
1.5
P+UP+Sec/HS UP only
0.0
0.0
0.0
P + UP+Sec/HS
5,366
153
25
39
266
74
26
327
195
35
1,054
168
135
1,235
468
374
4,010
498
432 200
465
3,448
146
712
831 1,682
413
436
1,854
574
100
80
23
48
181
66
7
5
0
1
6
0
0
0
0
0
0
0
4,354
1,838
1,082
10,849
1,846
126,741
Total
214,753
Enrolment by medium of instructions*
134,094
3,441
1,265
767
7,181
1,426
Male
68,919
Regular teachers
569
284
3,438
383
Female
57,362
80,010
771
83
101
2
28
200
36
No res
203 127
254
14
1
2
8
0
Female
130
312
27
1
1
22
1
Male
Contractual teachers
0
0
0
0
0
0
0
No res
13,427
19,762
66
142
22
892
SC teachers
Male
8,224
9,787
31
61
10
382
Female
ST teachers
2,558
4,174
79
35
13
204
16
Male Female
TLM
78.3
80.8
13.8
78.14.2
65.2
8.4
25,237 86,944 64,135 30,273 2,214 18 0
U.Pry.
Avg. CLS
School category
Pry. only
Pry + U.Pry
U. Pry. only
U.P. + Sec
P + U.P. + Sec
U.P. + Sec
%Majorrepair
%Minorrepair
14.23
13.67
8.11
13.64
10.08
%Goodcond.
76.50
76.63
84.95
75.94
80.62
Pry. only
Enrolment by nature of disability
6.2
9.4
6.5
2.7
2.0
7.4
2.5
79.28
83.89
11.68
7.61
Otherrooms
9.27
9.70
6.94
10.43
9.30
Teachers by Edu. qualification (other than contract teachers)*
Classrooms/Other rooms
9.04
8.50
P + UP+Sec/HS
2,890 15,333 68,280 30,638 8,150 1,187 4 2
School category Grad.Below
Sec. Sec.Hr.
Sec.PostGrad.
MPhil/ PhD
PostDoc.
NoRes.
10.1 1.6
12.0 1.6
10.5 1.6
2,825,542
2,836,846
2,905,819
2,802,532
2,660,524
2,090,409
1,715,091
1,456,188
14,031,263
5,261,688
outCWSN20.3
U. Pry.Primary GER Primaryrate % SC enr. GER U. Pry.
12.19
10.53
14.02
% SC girls
% ST enr.
% ST girls
NER Primary
% TeachersinvolvedNumber ofdays involved
NER U. Pry.
Non-Tch assignment14.75 65.3% OBC enr.
26.28 % OBC
12.11 girls
12.30 % Muslim 15.1 13.2enr.
15.27 % Muslim Pr. level
236
Average Instructional days
23
85.7
0.7
55.0
U. Pr. level
238
-titionTotalRepe-aters
rate189,297
85,369
71,300
60,597
53,086
30,359
22,564
18,271
459,649girls71,194
2.89
1.36
1.35
1.55
1.85
1.94
2.18
2.62
5.65
6.10
91.460.5
Repe- Drop SC/ST/OBC enrolment Enrolment ratio0.99
Total CLSrooms
101,486
179,004
3,672
1,486
260
8,590
560
24,230
41,623
616
512
57
1,949
117
V
1258
2591
2319
2411
7052
869
303
897
VIIIVII
1663
VI
1163
569 419 371
2122 1683 1410
1342 998 791
1492 1074 819
47565328 4910
409 253 204
180 191 169
1020 1172 989 798 694 376 247 219
5482 4807 4707 4122
IVI II IIINature of Disability
2040 1241 1282 1326
1759 2260 2785 2697
2204 2672 2925 2874
3248 3104 3214 2806
6158 71945336 6907
2006 1863 1593
305 301 354
1282
325
59101 57323 317 280 239 171
3437
48.9
2.249.2
63.4
50.0
50.9 54.6
50.5
49.81.8
47.9
16.5
935
2,342
2,598
29
14
3
89
5
80.5
83.3
15.3
86.84.2
66.2
8.0
Girlsenrolment
1,388,104
1,406,841
1,458,122
1,404,450
1,334,888
1,058,406
863,932
732,870
6,992,405
2,655,208
14,207
13,670
14,393
13,583
12,096
7,223
5,965
5,437
67,949
18,625
Boys9,516
10,225
10,930
9,793
9,009
6,359
5,032
4,256
49,473
15,647
Girls
Blind
Low-vision
Hearing
Speach
Loco-motor
MentallyRetarded
Learning
CerebralPalsy
Autism
Multiple
0.83
0.29
0.62
11418191
59584
9287812641
555523
30383
Hindi
6028201 324799
531770
53567
2434246
19070
177
Urdu
8666
10510
28151
6285
1299
English
1249
1985
21843
3578
83776
2070
1693
Sanskrit Others
6463
1223
870
044
253
153
4.38
1.79
3.35
4.84
2.53
3.92
Government
96.5 96.2
UP+Sec/HS P+UP+Sec UP+SecP + UPP. only 55 - 56 57-58 59-60 TLM SD Grant
Gender
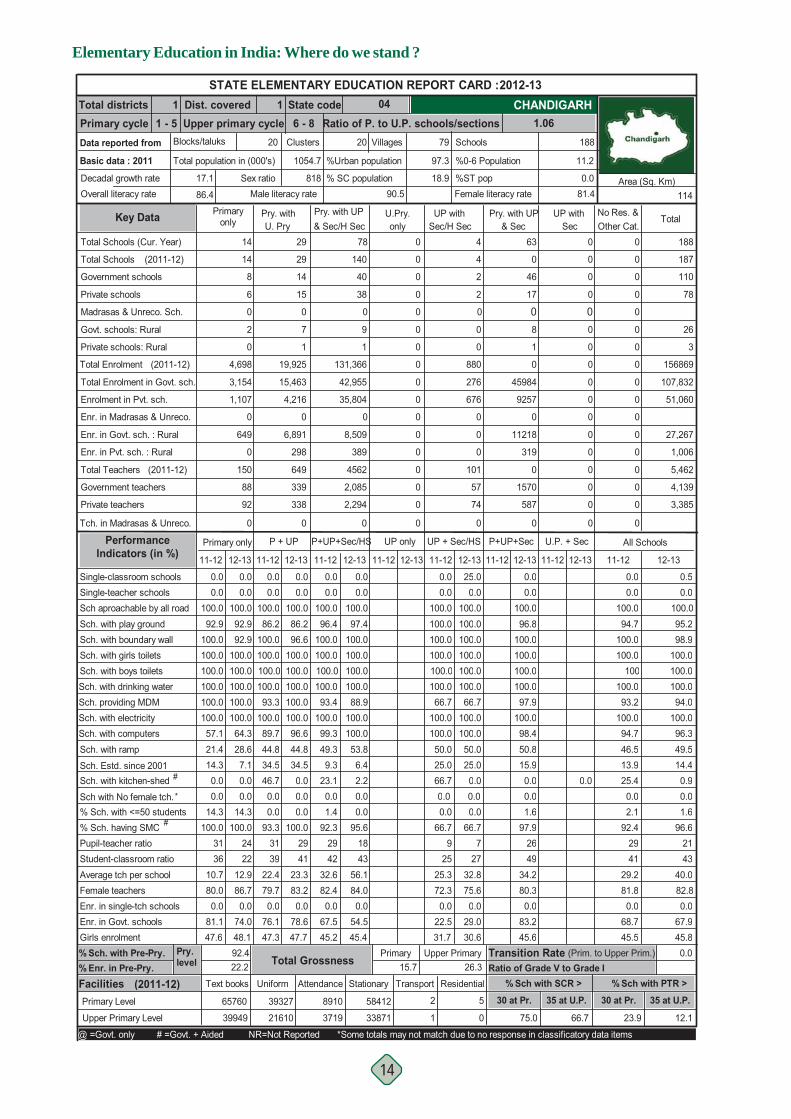
Elementary Education in India: Where do we stand ?
14
% Sch. with Pre-Pry.
Dist. covered State codeUpper primary cycle Ratio of P. to U.P. schools/sections 1.06
1 0411 - 5 6 - 8
Total districtsPrimary cycleData reported from
Basic data : 2011
Decadal growth rateOverall literacy rate
Blocks/taluks
17.1
86.4
Primaryonly
All Schools
Pry. withU. Pry
UP withSec/H Sec & Sec
Pry. with UP UP withSec
Pry. with UP & Sec/H Sec Other Cat.
No Res. &Total
Sch. with drinking water Sch. providing MDMSch. with electricity Sch. with computers
Sch. with kitchen-shedSch. Estd. since 2001
#
Sch. with ramp
Sch aproachable by all roadSch. with play groundSch. with boundary wallSch. with girls toilets
Single-teacher schoolsSingle-classroom schools
Sch. with boys toilets
100.0100.064.328.67.10.0
12-13
0.0100.092.992.9
0.0
100.0100.0100.0
89.744.834.5
93.3
46.7
11-12
86.2100.0
0.0100.0
0.0
100.0100.0100.0
100.0
11-12
0.0
11-12 12-13 12-13 11-12
0.0
12-13 11-12 12-13
0.0100.096.4
100.0100.0100.0100.093.4
100.099.349.39.3
23.1
100.0
100.0100.053.86.42.2
12-13
100.097.4
100.0
0.00.0
100.0100.0
88.9
96.644.834.50.0
12-13
100.086.296.6
0.00.0
100.0100.0100.0100.0100.0100.0
57.1
14.321.4
100.0
0.0
92.9100.0
100.0
0.00.0
100.0100.0100.0
11-12
25.0
50.025.0
66.7
66.7
11-12
0.0100.0100.0100.0
0.0
100.0100.0100.0
100.0100.0
Total Schools (Cur. Year) 14 29 78 0 0
Total Schools
Madrasas & Unreco. Sch.
Private schools
Private schools: Rural
Total Enrolment
Govt. schools: Rural
(2011-12)
8
6
0
2
0
4,698
14
2
0
0
0
0
0
0
0
1
131,366
0
140
40
38
9
29
14
15
0
7
1
19,925
0
0
0
0
0
0
0
Total Enrolment in Govt. sch.
Enrolment in Pvt. sch.
Enr. in Madrasas & Unreco.
Enr. in Govt. sch. : Rural
Enr. in Pvt. sch. : Rural
Total Teachers
Private teachers
Government teachers
Tch. in Madrasas & Unreco.
3,154
1,107
0
649
0
150
88
92
0
P + UP P+UP+Sec/HS UP only UP + Sec/HS P+UP+Sec U.P. + Sec
0
0
0
0
0
0
0
0
0
42,955
35,804
389
8,509
4562
2,085
2,294
0
0
15,463
4,216
0
6,891
298
649
339
338
0
0
0
0
0
0
0
0
0
0
Primary only Performance Indicators (in %)
Government schools
4
4
2
0
0
0
880
276
676
0
0
0
101
57
74
0
188
187
110
78
26
3
156869
107,832
51,060
27,267
1,006
5,462
4,139
3,385
0.0 0.50.0 0.0
100.0 100.094.7 95.2
100.0 98.9100.0 100.0
100 100.0100.0 100.093.2 94.0
100.0 100.094.7 96.346.5 49.513.9 14.425.4 0.9
11-12 12-13
0.0100.0100.0100.0100.0100.0100.0
0.0
66.7100.0100.050.025.00.0
100.096.8
100.0100.0100.0100.097.9
100.098.450.815.90.0 0.0
STATE ELEMENTARY EDUCATION REPORT CARD : 2012-13
188
Female literacy rate
11.2
0.081.4
%ST pop
%0-6 Population
Schools
18.9
97.3
7920
Total population in (000's)
Sex ratio90.5
% SC population
%Urban population
20 VillagesClusters
1054.7
818Male literacy rate 114
Area (Sq. Km)
CHANDIGARH
Key Data
0 0
46 0
17 0
0 08 0
1 0
0 0
45984 0
9257 0
0 0
11218 0
319 0
0 0
1570 0
587 0
0 0
(2011-12)
(2011-12)
Pupil-teacher ratio% Sch. having SMC
Student-classroom ratio Average tch per schoolFemale teachersEnr. in single-tch schools
Girls enrolmentEnr. in Govt. schools
2212.986.70.0
74.0
100.0
48.1
2439
22.479.70.0
76.147.3
93.331
92.32942
32.682.40.0
67.545.2
54.5
95.6
45.4
1843
56.184.00.0
4123.383.20.0
78.6
100.0
47.7
2936
10.780.00.0
81.147.6
100.031
2525.372.30.0
22.531.7
66.79 21
2.1 1.692.4 96.6
2941 43
29.2 40.081.8 82.80.0 0.0
68.7 67.945.5 45.8
66.77
2732.875.60.0
29.030.6
97.92649
34.280.30.0
83.245.6
% Sch. with <=50 students 14.3 14.3 0.0 0.0 1.4 0.0 0.0 0.0 1.6#
Upper Primary Level 39949 75.0 66.7 12.1
65760Primary Level
Facilities Text books
22.2 15.7 26.3
Residential% Enr. in Pre-Pry.
0.0Sch with No female tch. 0.0 0.0 0.0 0.0 0.0 0.0 0.0 0.0 0.0
23.9
% Sch with SCR > % Sch with PTR >Ratio of Grade V to Grade I
92.4 Primary Upper Primary 0.0
30 at Pr. 35 at U.P. 30 at Pr.
Pry. level Total Grossness Transition Rate (Prim. to Upper Prim.)
*
@ =Govt. only # =Govt. + Aided NR=Not Reported *Some totals may not match due to no response in classificatory data items
0.0
63 0
U.Pry.only
2
1
TransportStationary
58412
338713719
8910
AttendanceUniform
39327
21610
5
0
35 at U.P.(2011-12)

Elementary Education : State Report Cards
15
Retention rate (Prim.)
0.11
% Grants utilized%Teachers by Age (In years)
Enrolment* 2012-13 Ratio of Girl's to Boy's Enr: Grades I to V
Grade Total
I
II
III
IV
V
VI
VII
VIII
Pry (I-V)
U.P. + Sec
Pry + U.Pry
U. Pry. only
0
U.P. + Sec
P + U.P. + Sec
Contract
Primary only
Primary + U.Pry
P + UP+Sec/HS
Upper Pry. only
U.P. + Sec/HS
P+ U.P. + Sec
U.P. + Sec/HS
Teachers by gender & casteSchool category
School category
Primary only
Primary with Upper Primary
Primary with UP. Pri. and Sec/HS
Upper Primary onlyUpper Primary with Sec/HS
Primary with UP. & Sec
Upper Primary with Sec % Teachers recd. in-service training (previous year)
% Sch. received
CHANDIGARH
@
SD Grant
% ProfessionallyTrained teachers
Regular Private
Male
Female
All Tch.
All Teachers
Female
Male
Contract
98.5
98.8
96.3
96.5
96.0
97.9
99.3
99.2
99.0
54.2
25.0
28.9
35.1
27.5
28.8 0.0
7.8
8.5
12.4
P+UP+Sec/HS UP only
0.0
1.5
2.0
P + UP+Sec/HS
10
10
0
5
6
0
0
41
0
3
48
0
4
88
0
2
64
0
13 144
0
590
27
0
1,058 2,647
0
85
1,194
0
283
324
0
7
95
0
15
2
0
0
0
0
0
0
0
0
0
0
4,379
0
131
2,157
0
180
Total
677
Enrolment by medium of instructions*
103
641
0
32
394
0
Male
22
Regular teachers
0
97
1,603
0
Female
136
508
3,527
0
2
0
0
0
0
No res
0 20
55
151
0
2
128
0
Female
2
11
58
0
0
32
0
Male
Contractual teachers
0
0
0
0
0
0
0
No res
4
25
71
0
0
79
SC teachers
Male
9
53
160
0
0
148
Female
ST teachers
0
0
4
0
0
0
0
Male Female
TLM
57.1
48.3
47.4
25.0
68.3
13 26 252 296 14 0 0
U.Pry.
Avg. CLS
School category
Pry. only
Pry + U.Pry
U. Pry. only
U.P. + Sec
P + U.P. + Sec
U.P. + Sec
%Majorrepair
%Minorrepair
6.60
1.46
2.41
0.00
%Goodcond.
87.31
97.29
96.99
100.00
Pry. only
Enrolment by nature of disability
16.5
23.4
0.0
8.8
0.0
18.0
14.1
93.50 5.36
Otherrooms
6.09
1.25
0.60
0.00
Teachers by Edu. qualification (other than contract teachers)*
Classrooms/Other rooms
1.14
P + UP+Sec/HS
0 9 13 81 52 3 0 0
School category Grad.Below
Sec. Sec.Hr.
Sec.PostGrad.
MPhil/ PhD
PostDoc.
NoRes.
31.0
22.5
24.2 0.0
16,658
18,614
19,893
20,612
20,952
21,356
20,614
20,193
96,729
62,163
outCWSN9.0
U. Pry.Primary GER Primaryrate % SC enr. GER U. Pry.
% SC girls
0.0 0.0% ST enr.
% ST girls
NER Primary
% TeachersinvolvedNumber ofdays involved
NER U. Pry.
Non-Tch assignment2.0% OBC enr.
% OBC girls
% Muslim 5.0 4.7enr.
% Muslim Pr. level
222
Average Instructional days
10
90.1
9.0
81.2
U. Pr. level
224
-titionTotalRepe-aters
rate24
15
16
24
6
36
18
11
85girls65
0.09
0.06
0.09
0.18
0.03
0.12
0.08
0.08
0.14
106.8110.3
Repe- Drop SC/ST/OBC enrolment Enrolment ratio0.88
Total CLSrooms
197
479
1,825
0
35
1,132
0
53
211
1,296
0
57
772
0
V
11
306
34
61
25
80
4
20
VIIIVII
31
VI
28
14 22 9
549 643 713
33 24 21
77 59 62
3433 28
65 45 34
2 3 1
7 6 8 13 11 12 9 9
36 35 41 47
IVI II IIINature of Disability
13 18 17 16
28 48 79 173
14 8 14 30
25 41 59 65
16 1813 21
9 31 65
2 4 2
66
1
53 86 9 7 14 6
53
44.2
0.0
1.4
49.1
47.5 46.8
52.3
0.0
47.2
12.6
00
2
3
5
0
0
0
0
50.0
44.8
38.5
25.0
58.7
Girlsenrolment
7,717
8,749
9,419
9,756
9,580
9,551
9,054
8,868
45,221
27,473
90
153
187
266
341
450
453
467
1,037
1,370
Boys63
63
123
180
250
369
413
444
679
1,226
Girls
Blind
Low-vision
Hearing
Speach
Loco-motor
MentallyRetarded
Learning
CerebralPalsy
Autism
Multiple
0.08
0.13
0.12
6162
61259
0724
29420
0
English
2233 2028
13428
16764
0210
25568
0
Hindi
853
00
656
0
0
Others
0
0
0
80
018
253
0
Punjabi Tamil
0
45
0
00
0
0
0.31
0.31
0.31
2.01
2.12
2.10
Government
93.6 93.7
UP+Sec/HS P+UP+Sec UP+SecP + UPP. only 55 - 56 57-58 59-60 TLM SD Grant
Gender
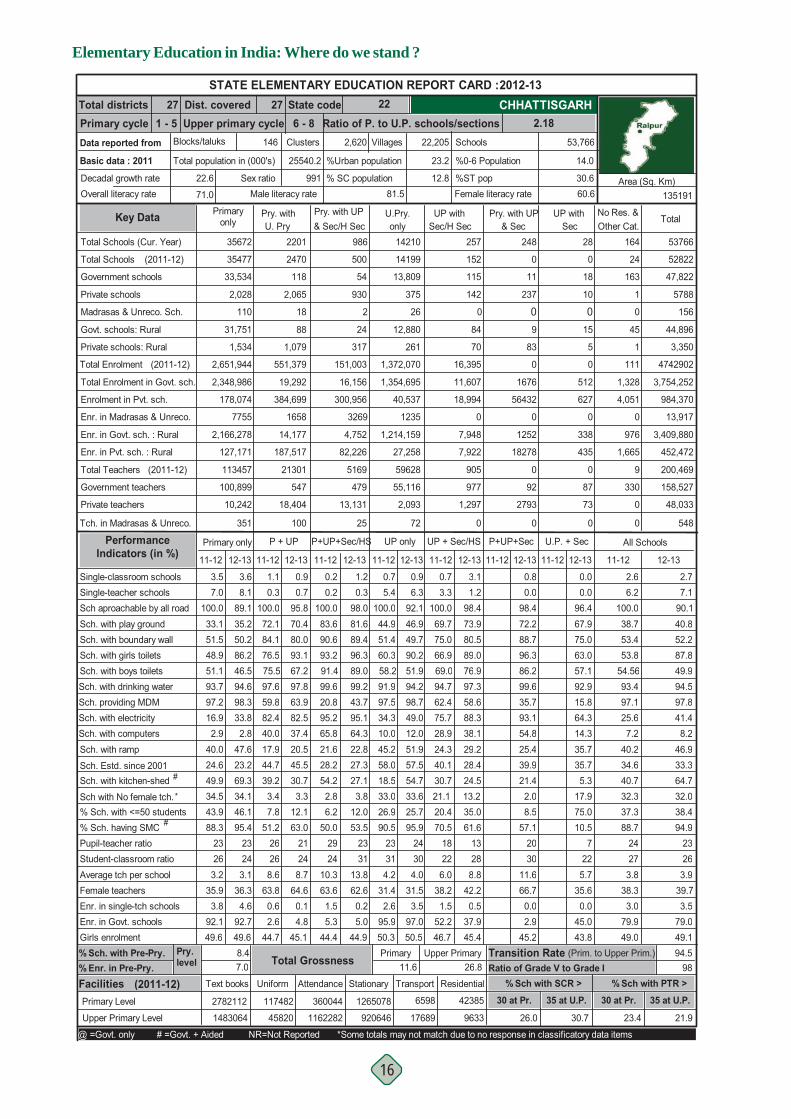
Elementary Education in India: Where do we stand ?
16
% Sch. with Pre-Pry.
Dist. covered State codeUpper primary cycle Ratio of P. to U.P. schools/sections 2.18
27 22271 - 5 6 - 8
Total districtsPrimary cycleData reported from
Basic data : 2011
Decadal growth rateOverall literacy rate
Blocks/taluks
22.6
71.0
Primaryonly
All Schools
Pry. withU. Pry
UP withSec/H Sec & Sec
Pry. with UP UP withSec
Pry. with UP & Sec/H Sec Other Cat.
No Res. &Total
Sch. with drinking water Sch. providing MDMSch. with electricity Sch. with computers
Sch. with kitchen-shedSch. Estd. since 2001
#
Sch. with ramp
Sch aproachable by all roadSch. with play groundSch. with boundary wallSch. with girls toilets
Single-teacher schoolsSingle-classroom schools
Sch. with boys toilets
98.333.82.8
47.623.269.3
12-13
8.189.135.250.2
3.6
86.246.594.6
40.017.944.7
59.8
39.2
11-12
72.184.1
0.3100.0
1.1
76.575.597.6
82.4
11-12
0.2
49.012.051.957.554.7
91.9
34.310.045.258.0
97.5
18.5
11-12 12-13
46.949.7
0.9
51.4
5.4100.0
0.7
44.9
6.392.1
90.260.351.958.294.298.7
12-13 11-12
0.8
12-13 11-12
0.0
12-13
0.00.2
100.083.690.693.291.499.620.895.265.821.628.254.2
99.2
95.164.322.827.327.1
12-13
98.081.689.4
1.20.3
96.389.0
43.7
37.420.545.530.7
12-13
95.870.480.0
0.90.7
93.167.297.863.982.516.9
2.9
24.640.0
97.2
49.9
33.151.5
100.0
3.57.0
48.951.193.7
11-12
3.1
24.340.1
62.4
30.7
11-12
3.3100.069.775.0
0.7
66.969.094.7
75.728.9
Total Schools (Cur. Year) 35672 2201 986 14210 164
Total Schools
Madrasas & Unreco. Sch.
Private schools
Private schools: Rural
Total Enrolment
Govt. schools: Rural
(2011-12)
33,534
2,028
110
31,751
1,534
2,651,944
35477
142
12,880
261
1,372,070
26
14199
13,809
375
317
151,003
2
500
54
930
24
2470
118
2,065
18
88
1,079
551,379
24
163
1
0
45
1
111
Total Enrolment in Govt. sch.
Enrolment in Pvt. sch.
Enr. in Madrasas & Unreco.
Enr. in Govt. sch. : Rural
Enr. in Pvt. sch. : Rural
Total Teachers
Private teachers
Government teachers
Tch. in Madrasas & Unreco.
2,348,986
178,074
7755
2,166,278
127,171
113457
100,899
10,242
351
P + UP P+UP+Sec/HS UP only UP + Sec/HS P+UP+Sec U.P. + Sec
1,354,695
40,537
27,258
1,214,159
59628
55,116
2,093
1235
72
16,156
300,956
82,226
4,752
5169
479
13,131
3269
25
19,292
384,699
1658
14,177
187,517
21301
547
18,404
100
1,328
4,051
0
976
1,665
9
330
0
0
Primary only Performance Indicators (in %)
Government schools
257
152
115
0
84
70
16,395
11,607
18,994
0
7,948
7,922
905
977
1,297
0
53766
52822
47,822
5788
156
44,896
3,350
4742902
3,754,252
984,370
13,917
3,409,880
452,472
200,469
158,527
48,033
548
2.6 2.76.2 7.1
100.0 90.138.7 40.853.4 52.253.8 87.8
54.56 49.993.4 94.597.1 97.825.6 41.47.2 8.2
40.2 46.934.6 33.340.7 64.7
11-12 12-13
1.298.473.980.589.076.997.3
0.0
58.688.338.129.228.424.5
98.472.288.796.386.299.635.7
96.467.975.063.057.192.915.8
93.154.825.439.921.4
64.314.335.735.75.3
STATE ELEMENTARY EDUCATION REPORT CARD : 2012-13
53,766
Female literacy rate
14.0
30.660.6
%ST pop
%0-6 Population
Schools
12.8
23.2
22,205146
Total population in (000's)
Sex ratio81.5
% SC population
%Urban population
2,620 VillagesClusters
25540.2
991Male literacy rate 135191
Area (Sq. Km)
CHHATTISGARH
Key Data
0 0
11 18
237 10
0 09 15
83 5
0 0
1676 512
56432 627
0 0
1252 338
18278 435
0 0
92 87
2793 73
0 0
(2011-12)
(2011-12)
Pupil-teacher ratio% Sch. having SMC
Student-classroom ratio Average tch per schoolFemale teachersEnr. in single-tch schools
Girls enrolmentEnr. in Govt. schools
243.1
36.34.6
92.7
95.4
49.6
23268.6
63.80.62.6
44.7
51.226
314.2
31.42.6
95.950.3
90.523
304.0
31.53.5
97.0
95.9
50.5
2450.0
2924
10.363.61.55.3
44.45.0
53.5
44.9
2331
13.862.60.2
248.7
64.60.14.8
63.0
45.1
21263.2
35.93.8
92.149.6
88.323
226.0
38.21.5
52.246.7
70.518 23
37.3 38.488.7 94.9
2427 263.8 3.9
38.3 39.73.0 3.5
79.9 79.049.0 49.1
61.613288.8
42.20.5
37.945.4
57.1 10.52030
11.666.70.02.9
45.2
7225.7
35.60.0
45.043.8
% Sch. with <=50 students 43.9 46.1 7.8 12.1 6.2 12.0 26.9 25.7 20.4 35.0 8.5 75.0#
Upper Primary Level 1483064 26.0 30.7 21.9
2782112Primary Level
Facilities Text books
7.0 11.6 26.8 98 Residential
% Enr. in Pre-Pry.
32.0Sch with No female tch. 34.5 34.1 3.4 3.3 2.8 3.8 33.0 33.6 21.1 13.2 32.3
23.4
% Sch with SCR > % Sch with PTR >Ratio of Grade V to Grade I
8.4 Primary Upper Primary 94.5
30 at Pr. 35 at U.P. 30 at Pr.
Pry. level Total Grossness Transition Rate (Prim. to Upper Prim.)
*
@ =Govt. only # =Govt. + Aided NR=Not Reported *Some totals may not match due to no response in classificatory data items
2.0 17.9
248 28
U.Pry.only
6598
17689
TransportStationary
1265078
9206461162282
360044
AttendanceUniform
117482
45820
42385
9633
35 at U.P.(2011-12)
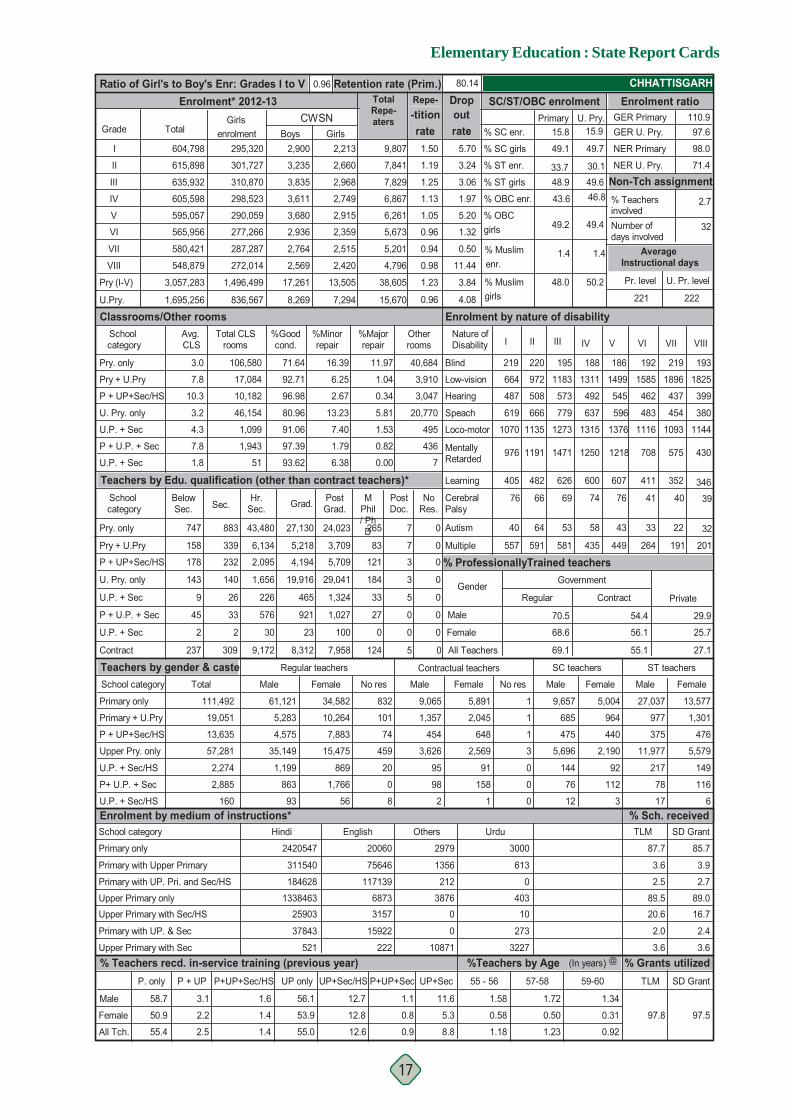
Elementary Education : State Report Cards
17
Retention rate (Prim.)
4.080.96
% Grants utilized%Teachers by Age (In years)
80.14
Enrolment* 2012-13 Ratio of Girl's to Boy's Enr: Grades I to V
Grade Total
I
II
III
IV
V
VI
VII
VIII
Pry (I-V)
U.P. + Sec
Pry + U.Pry
U. Pry. only
0
U.P. + Sec
P + U.P. + Sec
Contract
Primary only
Primary + U.Pry
P + UP+Sec/HS
Upper Pry. only
U.P. + Sec/HS
P+ U.P. + Sec
U.P. + Sec/HS
Teachers by gender & casteSchool category
School category
Primary only
Primary with Upper Primary
Primary with UP. Pri. and Sec/HS
Upper Primary onlyUpper Primary with Sec/HS
Primary with UP. & Sec
Upper Primary with Sec % Teachers recd. in-service training (previous year)
% Sch. received
CHHATTISGARH
@
SD Grant
% ProfessionallyTrained teachers
Regular Private
Male
Female
All Tch.
All Teachers
Female
Male
Contract
27.1
25.7
29.9
55.1
56.1
54.4
68.6
69.1
70.5
58.7
50.9
55.4
3.1
2.2
2.5
56.1
53.9
55.0
1.4
1.4
1.6
P+UP+Sec/HS UP only
12.7
12.6
12.8
P + UP+Sec/HS
158
178
143
9
45
2
237
232
140
26
33
2
309
2,095
1,656
226
576
30
9,172 8,312
23
921
465
19,916
4,194 5,709
29,041
1,324
1,027
100
7,958
121
184
33
27
0
124
3
3
5
0
0
5
0
0
0
0
0
13,635
57,281
2,274
2,885
160
111,492
Total
19,051
Enrolment by medium of instructions*
5,283
4,575
35,149
1,199
863
93
Male
61,121
Regular teachers
15,475
869
1,766
56
Female
34,582
10,264
7,883
101
74
459
20
0
8
No res
832 5,891
2,045
648
2,569
91
158
1
Female
9,065
1,357
454
3,626
95
98
2
Male
Contractual teachers
1
1
1
3
0
0
0
No res
9,657
685
475
5,696
144
76
SC teachers
Male
5,004
964
440
2,190
92
112
Female
ST teachers
27,037
977
375
11,977
217
78
17
Male Female
TLM
87.7
3.6
2.5
89.520.6
2.0
3.6
339 6,134 5,218 3,709 83 7 0
U.Pry.
Avg. CLS
School category
Pry. only
Pry + U.Pry
U. Pry. only
U.P. + Sec
P + U.P. + Sec
U.P. + Sec
%Majorrepair
%Minorrepair
16.39
6.25
2.67
13.23
7.40
%Goodcond.
71.64
92.71
96.98
80.96
91.06
Pry. only
Enrolment by nature of disability
7.8
10.3
3.2
4.3
1.8
7.8
3.0
97.39
93.62
1.79
6.38
Otherrooms
11.97
1.04
0.34
5.81
1.53
Teachers by Edu. qualification (other than contract teachers)*
Classrooms/Other rooms
0.82
0.00
P + UP+Sec/HS
747 883 43,480 27,130 24,023 265 7 0
School category Grad.Below
Sec. Sec.Hr.
Sec.PostGrad.
MPhil/ PhD
PostDoc.
NoRes.
1.1 11.6
0.8 5.3
0.9 8.8
604,798
615,898
635,932
605,598
595,057
565,956
580,421
548,879
3,057,283
1,695,256
outCWSN15.8
U. Pry.Primary GER Primaryrate % SC enr. GER U. Pry.
5.70
3.24
3.06
% SC girls
% ST enr.
% ST girls
NER Primary
% TeachersinvolvedNumber ofdays involved
NER U. Pry.
Non-Tch assignment1.97 46.8% OBC enr.
5.20 % OBC
1.32 girls
0.50 % Muslim 1.4 1.4enr.
3.84 % Muslim Pr. level
221
Average Instructional days
32
98.0
2.7
71.4
U. Pr. level
222
-titionTotalRepe-aters
rate9,807
7,841
7,829
6,867
6,261
5,673
5,201
4,796
38,605girls15,670
1.23
0.98
0.94
0.96
1.05
1.13
1.25
1.19
1.50
11.44
110.997.6
Repe- Drop SC/ST/OBC enrolment Enrolment ratio0.96
Total CLSrooms
106,580
17,084
10,182
46,154
1,099
1,943
51
40,684
3,910
3,047
20,770
495
436
7
V
186
1499
545
596
1376
607
43
430
VIIIVII
708
VI
575
192 219 193
1585 1896 1825
462 437 399
483 454 380
11441116 1093
411 352 346
33 22 32
557 591 581 435 449 264 191 201
976 1191 1471 1250
IVI II IIINature of Disability
219 220 195 188
664 972 1183 1311
487 508 573 492
619 666 779 637
1135 12731070 1315
405 482 626
40 64 53
600
58
4041 3976 66 69 74 76
1218
49.1
33.748.9
43.6
49.2
48.0 50.2
49.4
49.630.1
49.7
15.9
312
13,577
1,301
476
5,579
149
116
6
85.7
3.9
2.7
89.016.7
2.4
3.6
Girlsenrolment
295,320
301,727
310,870
298,523
290,059
277,266
287,287
272,014
1,496,499
836,567
2,900
3,235
3,835
3,611
3,680
2,936
2,764
2,569
17,261
8,269
Boys2,213
2,660
2,968
2,749
2,915
2,359
2,515
2,420
13,505
7,294
Girls
Blind
Low-vision
Hearing
Speach
Loco-motor
MentallyRetarded
Learning
CerebralPalsy
Autism
Multiple
1.34
0.31
0.92
311540
184628
133846325903
37843
521
Hindi
2420547 20060
75646
117139
68733157
15922
222
English
0
03876
212
1356
2979
Others
10871
3000
613
0
40310
273
3227
Urdu
1.72
0.50
1.23
1.58
0.58
1.18
Government
97.8 97.5
UP+Sec/HS P+UP+Sec UP+SecP + UPP. only 55 - 56 57-58 59-60 TLM SD Grant
Gender
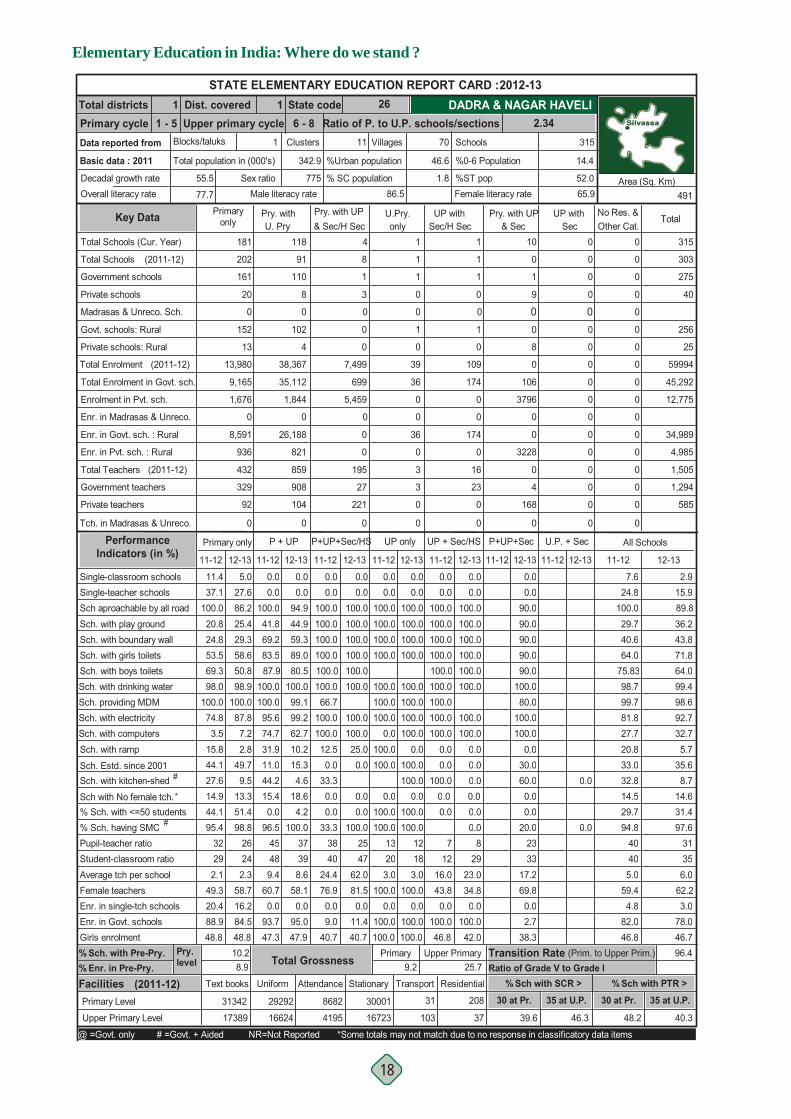
Elementary Education in India: Where do we stand ?
18
% Sch. with Pre-Pry.
Dist. covered State codeUpper primary cycle Ratio of P. to U.P. schools/sections 2.34
1 2611 - 5 6 - 8
Total districtsPrimary cycleData reported from
Basic data : 2011
Decadal growth rateOverall literacy rate
Blocks/taluks
55.5
77.7
Primaryonly
All Schools
Pry. withU. Pry
UP withSec/H Sec & Sec
Pry. with UP UP withSec
Pry. with UP & Sec/H Sec Other Cat.
No Res. &Total
Sch. with drinking water Sch. providing MDMSch. with electricity Sch. with computers
Sch. with kitchen-shedSch. Estd. since 2001
#
Sch. with ramp
Sch aproachable by all roadSch. with play groundSch. with boundary wallSch. with girls toilets
Single-teacher schoolsSingle-classroom schools
Sch. with boys toilets
100.087.87.22.8
49.79.5
12-13
27.686.225.429.3
5.0
58.650.898.9
74.731.911.0
100.0
44.2
11-12
41.869.2
0.0100.0
0.0
83.587.9
100.0
95.6
11-12
0.0
100.0100.0
0.0100.0100.0
100.0
100.00.0
100.0100.0
100.0
11-12 12-13
100.0100.0
0.0
100.0
0.0100.0
0.0
100.0
0.0100.0
100.0100.0
100.0100.0
12-13 11-12
0.0
12-13 11-12 12-13
0.0100.0100.0100.0100.0100.0100.066.7
100.0100.012.50.0
33.3
100.0
100.0100.025.00.0
12-13
100.0100.0100.0
0.00.0
100.0100.0
62.710.215.34.6
12-13
94.944.959.3
0.00.0
89.080.5
100.099.199.274.8
3.5
44.115.8
100.0
27.6
20.824.8
100.0
11.437.1
53.569.398.0
11-12
0.0
0.00.0
100.0
100.0
11-12
0.0100.0100.0100.0
0.0
100.0100.0100.0
100.0100.0
Total Schools (Cur. Year) 181 118 4 1 0
Total Schools
Madrasas & Unreco. Sch.
Private schools
Private schools: Rural
Total Enrolment
Govt. schools: Rural
(2011-12)
161
20
0
152
13
13,980
202
0
1
0
39
0
1
1
0
0
7,499
0
8
1
3
0
91
110
8
0
102
4
38,367
0
0
0
0
0
0
0
Total Enrolment in Govt. sch.
Enrolment in Pvt. sch.
Enr. in Madrasas & Unreco.
Enr. in Govt. sch. : Rural
Enr. in Pvt. sch. : Rural
Total Teachers
Private teachers
Government teachers
Tch. in Madrasas & Unreco.
9,165
1,676
0
8,591
936
432
329
92
0
P + UP P+UP+Sec/HS UP only UP + Sec/HS P+UP+Sec U.P. + Sec
36
0
0
36
3
3
0
0
0
699
5,459
0
0
195
27
221
0
0
35,112
1,844
0
26,188
821
859
908
104
0
0
0
0
0
0
0
0
0
0
Primary only Performance Indicators (in %)
Government schools
1
1
1
0
1
0
109
174
0
0
174
0
16
23
0
0
315
303
275
40
256
25
59994
45,292
12,775
34,989
4,985
1,505
1,294
585
7.6 2.924.8 15.9
100.0 89.829.7 36.240.6 43.864.0 71.8
75.83 64.098.7 99.499.7 98.681.8 92.727.7 32.720.8 5.733.0 35.632.8 8.7
11-12 12-13
0.0100.0100.0100.0100.0100.0100.0
0.0
100.0100.0
0.00.00.0
90.090.090.090.090.0
100.080.0
100.0100.0
0.030.060.0 0.0
STATE ELEMENTARY EDUCATION REPORT CARD : 2012-13
315
Female literacy rate
14.4
52.065.9
%ST pop
%0-6 Population
Schools
1.8
46.6
701
Total population in (000's)
Sex ratio86.5
% SC population
%Urban population
11 VillagesClusters
342.9
775Male literacy rate 491
Area (Sq. Km)
DADRA & NAGAR HAVELI
Key Data
0 0
1 0
9 0
0 00 0
8 0
0 0
106 0
3796 0
0 0
0 0
3228 0
0 0
4 0
168 0
0 0
(2011-12)
(2011-12)
Pupil-teacher ratio% Sch. having SMC
Student-classroom ratio Average tch per schoolFemale teachersEnr. in single-tch schools
Girls enrolmentEnr. in Govt. schools
242.3
58.716.284.5
98.8
48.8
26489.4
60.70.0
93.747.3
96.545
203.0
100.00.0
100.0100.0
100.013
183.0
100.00.0
100.0
100.0
100.0
1233.3
3840
24.476.90.09.0
40.711.4
100.0
40.7
2547
62.081.50.0
398.6
58.10.0
95.0
100.0
47.9
37292.1
49.320.488.948.8
95.432
1216.043.80.0
100.046.8
7 31
29.7 31.494.8 97.6
4040 355.0 6.0
59.4 62.24.8 3.0
82.0 78.046.8 46.7
0.08
2923.034.80.0
100.042.0
20.0 0.02333
17.269.80.02.7
38.3
% Sch. with <=50 students 44.1 51.4 0.0 4.2 0.0 0.0 100.0 100.0 0.0 0.0 0.0#
Upper Primary Level 17389 39.6 46.3 40.3
31342Primary Level
Facilities Text books
8.9 9.2 25.7
Residential% Enr. in Pre-Pry.
14.6Sch with No female tch. 14.9 13.3 15.4 18.6 0.0 0.0 0.0 0.0 0.0 0.0 14.5
48.2
% Sch with SCR > % Sch with PTR >Ratio of Grade V to Grade I
10.2 Primary Upper Primary 96.4
30 at Pr. 35 at U.P. 30 at Pr.
Pry. level Total Grossness Transition Rate (Prim. to Upper Prim.)
*
@ =Govt. only # =Govt. + Aided NR=Not Reported *Some totals may not match due to no response in classificatory data items
0.0
10 0
U.Pry.only
31
103
TransportStationary
30001
167234195
8682
AttendanceUniform
29292
16624
208
37
35 at U.P.(2011-12)
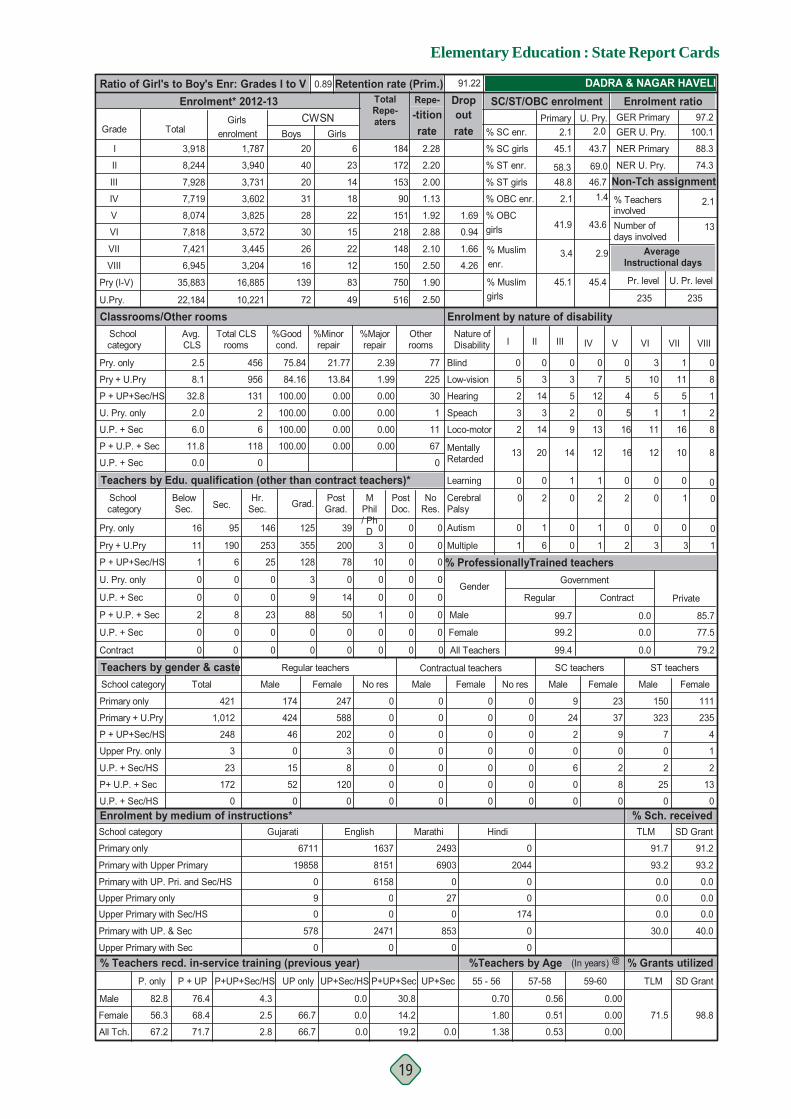
Elementary Education : State Report Cards
19
Retention rate (Prim.)
2.50
% Grants utilized%Teachers by Age (In years)
91.22
Enrolment* 2012-13 Ratio of Girl's to Boy's Enr: Grades I to V
Grade Total
I
II
III
IV
V
VI
VII
VIII
Pry (I-V)
U.P. + Sec
Pry + U.Pry
U. Pry. only
0
U.P. + Sec
P + U.P. + Sec
Contract
Primary only
Primary + U.Pry
P + UP+Sec/HS
Upper Pry. only
U.P. + Sec/HS
P+ U.P. + Sec
U.P. + Sec/HS
Teachers by gender & casteSchool category
School category
Primary only
Primary with Upper Primary
Primary with UP. Pri. and Sec/HS
Upper Primary onlyUpper Primary with Sec/HS
Primary with UP. & Sec
Upper Primary with Sec % Teachers recd. in-service training (previous year)
% Sch. received
DADRA & NAGAR HAVELI
@
SD Grant
% ProfessionallyTrained teachers
Regular Private
Male
Female
All Tch.
All Teachers
Female
Male
Contract
79.2
77.5
85.7
0.0
0.0
0.0
99.2
99.4
99.7
82.8
56.3
67.2
76.4
68.4
71.7
66.7
66.7
2.5
2.8
4.3
P+UP+Sec/HS UP only
0.0
0.0
0.0
P + UP+Sec/HS
11
1
0
0
2
0
0
6
0
0
8
0
0
25
0
0
23
0
0 0
0
88
9
3
128 78
0
14
50
0
0
10
0
0
1
0
0
0
0
0
0
0
0
0
0
0
0
0
248
3
23
172
0
421
Total
1,012
Enrolment by medium of instructions*
424
46
0
15
52
0
Male
174
Regular teachers
3
8
120
0
Female
247
588
202
0
0
0
0
0
0
No res
0 0
0
0
0
0
0
0
Female
0
0
0
0
0
0
0
Male
Contractual teachers
0
0
0
0
0
0
0
No res
9
24
2
0
6
0
SC teachers
Male
23
37
9
0
2
8
Female
ST teachers
150
323
7
0
2
25
0
Male Female
TLM
91.7
93.2
0.0
0.00.0
30.0
190 253 355 200 3 0 0
U.Pry.
Avg. CLS
School category
Pry. only
Pry + U.Pry
U. Pry. only
U.P. + Sec
P + U.P. + Sec
U.P. + Sec
%Majorrepair
%Minorrepair
21.77
13.84
0.00
0.00
0.00
%Goodcond.
75.84
84.16
100.00
100.00
100.00
Pry. only
Enrolment by nature of disability
8.1
32.8
2.0
6.0
0.0
11.8
2.5
100.00 0.00
Otherrooms
2.39
1.99
0.00
0.00
0.00
Teachers by Edu. qualification (other than contract teachers)*
Classrooms/Other rooms
0.00
P + UP+Sec/HS
16 95 146 125 39 0 0 0
School category Grad.Below
Sec. Sec.Hr.
Sec.PostGrad.
MPhil/ PhD
PostDoc.
NoRes.
30.8
14.2
19.2 0.0
3,918
8,244
7,928
7,719
8,074
7,818
7,421
6,945
35,883
22,184
outCWSN2.1
U. Pry.Primary GER Primaryrate % SC enr. GER U. Pry.
% SC girls
% ST enr.
% ST girls
NER Primary
% TeachersinvolvedNumber ofdays involved
NER U. Pry.
Non-Tch assignment1.4% OBC enr.
1.69 % OBC
0.94 girls
1.66 % Muslim 3.4 2.9enr.
% Muslim Pr. level
235
Average Instructional days
13
88.3
2.1
74.3
U. Pr. level
235
-titionTotalRepe-aters
rate184
172
153
90
151
218
148
150
750girls516
1.90
2.50
2.10
2.88
1.92
1.13
2.00
2.20
2.28
4.26
97.2100.1
Repe- Drop SC/ST/OBC enrolment Enrolment ratio0.89
Total CLSrooms
456
956
131
2
6
118
0
77
225
30
1
11
67
0
V
0
5
4
5
16
0
0
8
VIIIVII
12
VI
10
3 1 0
10 11 8
5 5 1
1 1 2
811 16
0 0 0
0 0 0
1 6 0 1 2 3 3 1
13 20 14 12
IVI II IIINature of Disability
0 0 0 0
5 3 3 7
2 14 5 12
3 3 2 0
14 92 13
0 0 1
0 1 0
1
1
10 00 2 0 2 2
16
45.1
58.348.8
2.1
41.9
45.1 45.4
43.6
46.769.0
43.7
2.0
00
111
235
4
1
2
13
0
91.2
93.2
0.0
0.00.0
40.0
Girlsenrolment
1,787
3,940
3,731
3,602
3,825
3,572
3,445
3,204
16,885
10,221
20
40
20
31
28
30
26
16
139
72
Boys6
23
14
18
22
15
22
12
83
49
Girls
Blind
Low-vision
Hearing
Speach
Loco-motor
MentallyRetarded
Learning
CerebralPalsy
Autism
Multiple
0.00
0.00
0.00
19858
0
90
578
0
Gujarati
6711 1637
8151
6158
00
2471
0
English
853
027
0
6903
2493
Marathi
0
0
2044
0
0174
0
0
Hindi
0.56
0.51
0.53
0.70
1.80
1.38
Government
71.5 98.8
UP+Sec/HS P+UP+Sec UP+SecP + UPP. only 55 - 56 57-58 59-60 TLM SD Grant
Gender

Elementary Education in India: Where do we stand ?
20
% Sch. with Pre-Pry.
Dist. covered State codeUpper primary cycle Ratio of P. to U.P. schools/sections 1.34
2 2521 - 5 6 - 8
Total districtsPrimary cycleData reported from
Basic data : 2011
Decadal growth rateOverall literacy rate
Blocks/taluks
53.5
87.1
Primaryonly
All Schools
Pry. withU. Pry
UP withSec/H Sec & Sec
Pry. with UP UP withSec
Pry. with UP & Sec/H Sec Other Cat.
No Res. &Total
Sch. with drinking water Sch. providing MDMSch. with electricity Sch. with computers
Sch. with kitchen-shedSch. Estd. since 2001
#
Sch. with ramp
Sch aproachable by all roadSch. with play groundSch. with boundary wallSch. with girls toilets
Single-teacher schoolsSingle-classroom schools
Sch. with boys toilets
97.9100.019.650.021.474.5
12-13
3.6100.050.085.7
0.0
100.098.2
100.0
100.050.037.5
100.0
75.0
11-12
62.587.5
0.0100.0
0.0
100.0100.0100.0
100.0
11-12
0.0
95.295.271.44.8
75.0
100.0
100.0100.068.04.0
96.0
60.0
11-12 12-13
57.190.5
0.0
96.0
0.0100.0
0.0
60.0
0.0100.0
100.095.5100.0100.095.295.2
12-13 11-12
0.0
12-13 11-12
0.0
12-13
0.00.0
100.087.5
100.0100.0100.0100.066.7
100.0100.012.537.533.3
85.7
85.785.728.628.6
100.0
12-13
100.085.785.7
0.00.0
100.0100.0
50.0
63.645.545.5
100.0
12-13
100.036.481.8
0.00.0
100.0100.090.985.790.9100.0
18.0
26.249.2
100.0
57.1
47.588.5
100.0
0.03.3
93.498.4
100.0
11-12
0.0
45.50.0
100.0
81.8
11-12
0.0100.063.690.9
0.0
100.0100.0100.0
100.090.9
Total Schools (Cur. Year) 56 11 7 21 5
Total Schools
Madrasas & Unreco. Sch.
Private schools
Private schools: Rural
Total Enrolment
Govt. schools: Rural
(2011-12)
48
8
0
34
4
10,100
61
1
14
0
3,891
0
25
21
0
3
7,668
0
8
1
6
0
8
7
4
0
6
2
2,561
0
5
0
0
0
0
0
Total Enrolment in Govt. sch.
Enrolment in Pvt. sch.
Enr. in Madrasas & Unreco.
Enr. in Govt. sch. : Rural
Enr. in Pvt. sch. : Rural
Total Teachers
Private teachers
Government teachers
Tch. in Madrasas & Unreco.
8,510
756
0
5,905
432
316
233
55
0
P + UP P+UP+Sec/HS UP only UP + Sec/HS P+UP+Sec U.P. + Sec
3,067
0
0
2,169
136
130
0
0
0
0
5,805
3,500
0
215
18
176
0
0
1,210
1,161
0
1,210
714
81
54
46
0
0
0
0
0
0
0
0
0
0
Primary only Performance Indicators (in %)
Government schools
11
11
10
0
8
0
2,239
2,054
266
0
1,364
0
71
121
40
0
120
113
97
22
1
65
10
26459
15,912
10,846
10,971
4,756
819
617
383
0.0 0.01.8 1.7
100.0 95.055.8 53.391.2 83.395.5 98.2
99.09 98.2100.0 93.397.8 89.0
100.0 93.354.9 52.550.4 47.520.4 19.260.9 79.1
11-12 12-13
0.090.963.690.9
100.0100.0100.0
0.0
100.0100.0100.036.40.0
100.0
100.080.0
100.0100.0100.0100.033.3
100.075.075.050.075.0
100.0100.0
100.0100.020.060.033.3
100.075.050.00.0
100.0
STATE ELEMENTARY EDUCATION REPORT CARD : 2012-13
120
Female literacy rate
10.7
6.379.6
%ST pop
%0-6 Population
Schools
2.5
75.2
392
Total population in (000's)
Sex ratio91.5
% SC population
%Urban population
7 VillagesClusters
242.9
618Male literacy rate 112
Area (Sq. Km)
DAMAN & DIU
Key Data
0 0
2 3
3 0
0 10 3
1 0
0 0
748 323
2858 0
0 0
0 323
110 0
0 0
36 25
66 0
0 0
(2011-12)
(2011-12)
Pupil-teacher ratio% Sch. having SMC
Student-classroom ratio Average tch per schoolFemale teachersEnr. in single-tch schools
Girls enrolmentEnr. in Govt. schools
335.1
77.41.4
91.8
100.0
50.1
3236
10.188.90.0
20.742.4
100.032
325.4
47.10.0
89.649.9
92.029
326.2
48.50.0
100.0
100.0
52.5
2433.3
3644
26.980.90.03.3
41.20.0
40.8
3049
27.786.10.0
279.1
89.00.0
51.0
100.0
42.8
24335.2
78.21.4
90.549.8
95.932
366.5
56.30.0
87.046.7
81.832 27
10.6 15.091.3 91.7
3236 367.2 8.3
72.9 69.70.5 0.5
58.0 59.546.4 45.9
100.01433
14.643.50.0
88.546.9
33.3 100.03551
20.467.60.0
20.739.2
13276.3
64.00.0
100.047.7
% Sch. with <=50 students 16.4 12.5 0.0 9.1 0.0 14.3 8.0 14.3 0.0 0.0 0.0 25.0#
Upper Primary Level 7072 43.0 39.0 17.2
10423Primary Level
Facilities Text books
19.6 16.1 20.3 92 Residential
% Enr. in Pre-Pry.
5.0Sch with No female tch. 6.6 7.1 0.0 0.0 0.0 0.0 4.0 4.8 9.1 9.1 5.3
36.1
% Sch with SCR > % Sch with PTR >Ratio of Grade V to Grade I
41.8 Primary Upper Primary 0.0
30 at Pr. 35 at U.P. 30 at Pr.
Pry. level Total Grossness Transition Rate (Prim. to Upper Prim.)
*
@ =Govt. only # =Govt. + Aided NR=Not Reported *Some totals may not match due to no response in classificatory data items
0.0 0.0
5 4
U.Pry.only
14
163
TransportStationary
5468
37841346
1985
AttendanceUniform
2886
1781
0
0
35 at U.P.(2011-12)
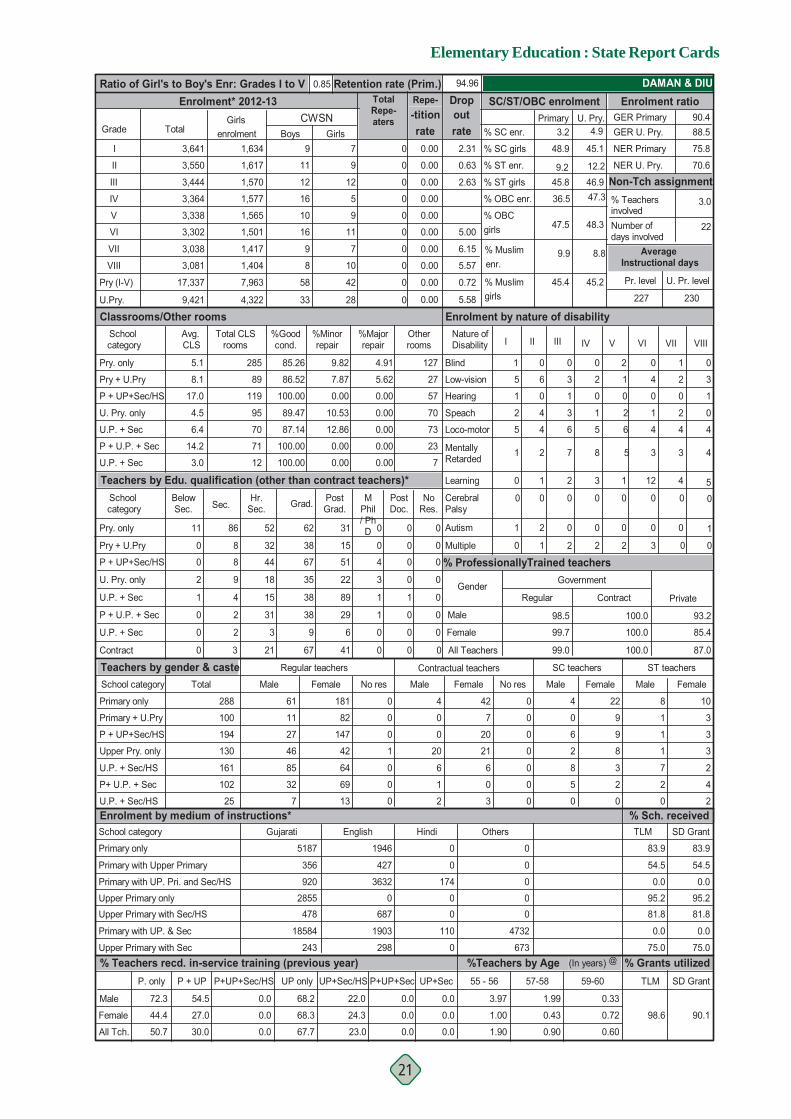
Elementary Education : State Report Cards
21
Retention rate (Prim.)
5.580.00
% Grants utilized%Teachers by Age (In years)
94.96
Enrolment* 2012-13 Ratio of Girl's to Boy's Enr: Grades I to V
Grade Total
I
II
III
IV
V
VI
VII
VIII
Pry (I-V)
U.P. + Sec
Pry + U.Pry
U. Pry. only
0
U.P. + Sec
P + U.P. + Sec
Contract
Primary only
Primary + U.Pry
P + UP+Sec/HS
Upper Pry. only
U.P. + Sec/HS
P+ U.P. + Sec
U.P. + Sec/HS
Teachers by gender & casteSchool category
School category
Primary only
Primary with Upper Primary
Primary with UP. Pri. and Sec/HS
Upper Primary onlyUpper Primary with Sec/HS
Primary with UP. & Sec
Upper Primary with Sec % Teachers recd. in-service training (previous year)
% Sch. received
DAMAN & DIU
@
SD Grant
% ProfessionallyTrained teachers
Regular Private
Male
Female
All Tch.
All Teachers
Female
Male
Contract
87.0
85.4
93.2
100.0
100.0
100.0
99.7
99.0
98.5
72.3
44.4
50.7
54.5
27.0
30.0
68.2
68.3
67.7
0.0
0.0
0.0
P+UP+Sec/HS UP only
22.0
23.0
24.3
P + UP+Sec/HS
0
0
2
1
0
0
0
8
9
4
2
2
3
44
18
15
31
3
21 67
9
38
38
35
67 51
22
89
29
6
41
4
3
1
1
0
0
0
0
1
0
0
0
0
0
0
0
0
194
130
161
102
25
288
Total
100
Enrolment by medium of instructions*
11
27
46
85
32
7
Male
61
Regular teachers
42
64
69
13
Female
181
82
147
0
0
1
0
0
0
No res
0 42
7
20
21
6
0
3
Female
4
0
0
20
6
1
2
Male
Contractual teachers
0
0
0
0
0
0
0
No res
4
0
6
2
8
5
SC teachers
Male
22
9
9
8
3
2
Female
ST teachers
8
1
1
1
7
2
0
Male Female
TLM
83.9
54.5
0.0
95.281.8
0.0
75.0
8 32 38 15 0 0 0
U.Pry.
Avg. CLS
School category
Pry. only
Pry + U.Pry
U. Pry. only
U.P. + Sec
P + U.P. + Sec
U.P. + Sec
%Majorrepair
%Minorrepair
9.82
7.87
0.00
10.53
12.86
%Goodcond.
85.26
86.52
100.00
89.47
87.14
Pry. only
Enrolment by nature of disability
8.1
17.0
4.5
6.4
3.0
14.2
5.1
100.00
100.00
0.00
0.00
Otherrooms
4.91
5.62
0.00
0.00
0.00
Teachers by Edu. qualification (other than contract teachers)*
Classrooms/Other rooms
0.00
0.00
P + UP+Sec/HS
11 86 52 62 31 0 0 0
School category Grad.Below
Sec. Sec.Hr.
Sec.PostGrad.
MPhil/ PhD
PostDoc.
NoRes.
0.0 0.0
0.0 0.0
0.0 0.0
3,641
3,550
3,444
3,364
3,338
3,302
3,038
3,081
17,337
9,421
outCWSN3.2
U. Pry.Primary GER Primaryrate % SC enr. GER U. Pry.
2.31
0.63
2.63
% SC girls
% ST enr.
% ST girls
NER Primary
% TeachersinvolvedNumber ofdays involved
NER U. Pry.
Non-Tch assignment47.3% OBC enr.
% OBC
5.00 girls
6.15 % Muslim 9.9 8.8enr.
0.72 % Muslim Pr. level
227
Average Instructional days
22
75.8
3.0
70.6
U. Pr. level
230
-titionTotalRepe-aters
rate0
0
0
0
0
0
0
0
0girls0
0.00
0.00
0.00
0.00
0.00
0.00
0.00
0.00
0.00
5.57
90.488.5
Repe- Drop SC/ST/OBC enrolment Enrolment ratio0.85
Total CLSrooms
285
89
119
95
70
71
12
127
27
57
70
73
23
7
V
2
1
0
2
6
1
0
4
VIIIVII
3
VI
3
0 1 0
4 2 3
0 0 1
1 2 0
44 4
12 4 5
0 0 1
0 1 2 2 2 3 0 0
1 2 7 8
IVI II IIINature of Disability
1 0 0 0
5 6 3 2
1 0 1 0
2 4 3 1
4 65 5
0 1 2
1 2 0
3
0
00 00 0 0 0 0
5
48.9
9.245.8
36.5
47.5
45.4 45.2
48.3
46.912.2
45.1
4.9
00
10
3
3
3
2
4
2
83.9
54.5
0.0
95.281.8
0.0
75.0
Girlsenrolment
1,634
1,617
1,570
1,577
1,565
1,501
1,417
1,404
7,963
4,322
9
11
12
16
10
16
9
8
58
33
Boys7
9
12
5
9
11
7
10
42
28
Girls
Blind
Low-vision
Hearing
Speach
Loco-motor
MentallyRetarded
Learning
CerebralPalsy
Autism
Multiple
0.33
0.72
0.60
356
920
2855478
18584
243
Gujarati
5187 1946
427
3632
0687
1903
298
English
110
00
174
0
0
Hindi
0
0
0
0
00
4732
673
Others
1.99
0.43
0.90
3.97
1.00
1.90
Government
98.6 90.1
UP+Sec/HS P+UP+Sec UP+SecP + UPP. only 55 - 56 57-58 59-60 TLM SD Grant
Gender
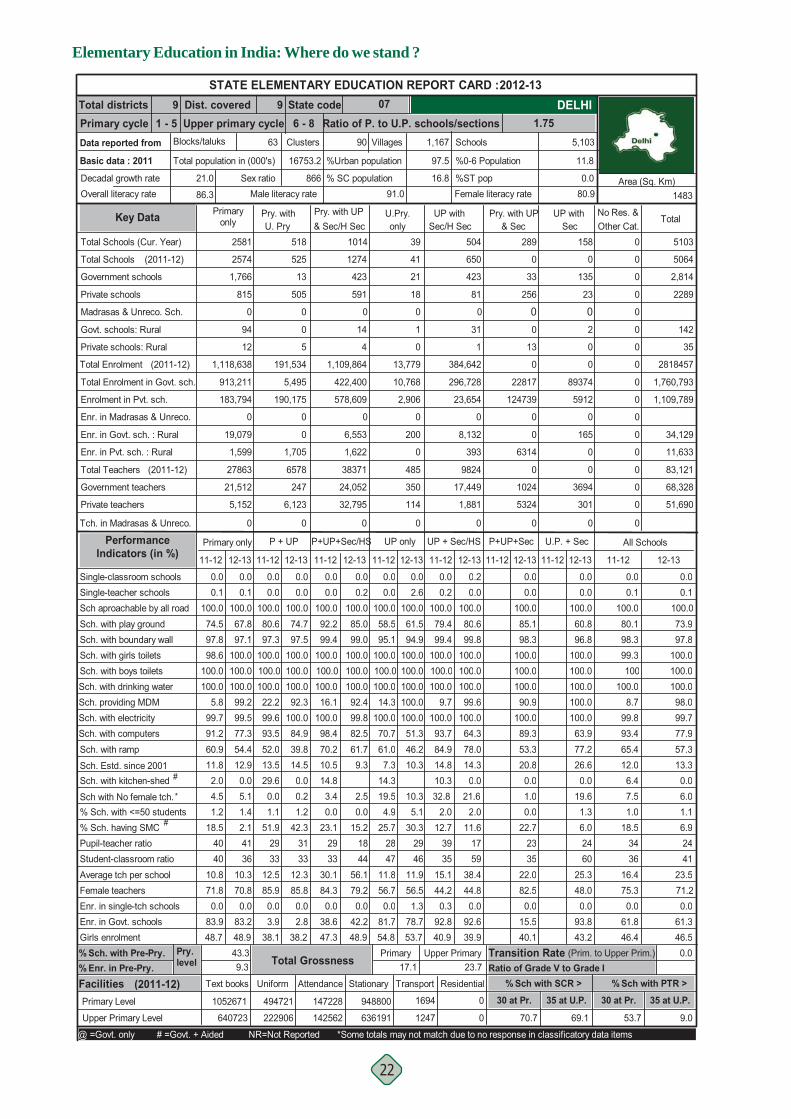
Elementary Education in India: Where do we stand ?
22
% Sch. with Pre-Pry.
Dist. covered State codeUpper primary cycle Ratio of P. to U.P. schools/sections 1.75
9 0791 - 5 6 - 8
Total districtsPrimary cycleData reported from
Basic data : 2011
Decadal growth rateOverall literacy rate
Blocks/taluks
21.0
86.3
Primaryonly
All Schools
Pry. withU. Pry
UP withSec/H Sec & Sec
Pry. with UP UP withSec
Pry. with UP & Sec/H Sec Other Cat.
No Res. &Total
Sch. with drinking water Sch. providing MDMSch. with electricity Sch. with computers
Sch. with kitchen-shedSch. Estd. since 2001
#
Sch. with ramp
Sch aproachable by all roadSch. with play groundSch. with boundary wallSch. with girls toilets
Single-teacher schoolsSingle-classroom schools
Sch. with boys toilets
99.299.577.354.412.90.0
12-13
0.1100.067.897.1
0.0
100.0100.0100.0
93.552.013.5
22.2
29.6
11-12
80.697.3
0.0100.0
0.0
100.0100.0100.0
99.6
11-12
0.0
100.051.346.210.3
100.0
100.070.761.07.3
14.3
14.3
11-12 12-13
61.594.9
0.0
95.1
0.0100.0
0.0
58.5
2.6100.0
100.0100.0100.0100.0100.0100.0
12-13 11-12
0.0
12-13 11-12
0.0
12-13
0.00.0
100.092.299.4
100.0100.0100.016.1
100.098.470.210.514.8
100.0
99.882.561.79.3
12-13
100.085.099.0
0.00.2
100.0100.0
92.4
84.939.814.50.0
12-13
100.074.797.5
0.00.0
100.0100.0100.092.3
100.099.791.2
11.860.9
5.8
2.0
74.597.8
100.0
0.00.1
98.6100.0100.0
11-12
0.2
84.914.8
9.7
10.3
11-12
0.2100.079.499.4
0.0
100.0100.0100.0
100.093.7
Total Schools (Cur. Year) 2581 518 1014 39 0
Total Schools
Madrasas & Unreco. Sch.
Private schools
Private schools: Rural
Total Enrolment
Govt. schools: Rural
(2011-12)
1,766
815
0
94
12
1,118,638
2574
81
1
0
13,779
0
41
21
18
4
1,109,864
0
1274
423
591
14
525
13
505
0
0
5
191,534
0
0
0
0
0
0
0
Total Enrolment in Govt. sch.
Enrolment in Pvt. sch.
Enr. in Madrasas & Unreco.
Enr. in Govt. sch. : Rural
Enr. in Pvt. sch. : Rural
Total Teachers
Private teachers
Government teachers
Tch. in Madrasas & Unreco.
913,211
183,794
0
19,079
1,599
27863
21,512
5,152
0
P + UP P+UP+Sec/HS UP only UP + Sec/HS P+UP+Sec U.P. + Sec
10,768
2,906
0
200
485
350
114
0
0
422,400
578,609
1,622
6,553
38371
24,052
32,795
0
0
5,495
190,175
0
0
1,705
6578
247
6,123
0
0
0
0
0
0
0
0
0
0
Primary only Performance Indicators (in %)
Government schools
504
650
423
0
31
1
384,642
296,728
23,654
0
8,132
393
9824
17,449
1,881
0
5103
5064
2,814
2289
142
35
2818457
1,760,793
1,109,789
34,129
11,633
83,121
68,328
51,690
0.0 0.00.1 0.1
100.0 100.080.1 73.998.3 97.899.3 100.0100 100.0
100.0 100.08.7 98.0
99.8 99.793.4 77.965.4 57.312.0 13.36.4 0.0
11-12 12-13
0.0100.080.699.8
100.0100.0100.0
0.0
99.6100.064.378.014.30.0
100.085.198.3
100.0100.0100.090.9
100.060.896.8
100.0100.0100.0100.0
100.089.353.320.80.0
100.063.977.226.60.0
STATE ELEMENTARY EDUCATION REPORT CARD : 2012-13
5,103
Female literacy rate
11.8
0.080.9
%ST pop
%0-6 Population
Schools
16.8
97.5
1,16763
Total population in (000's)
Sex ratio91.0
% SC population
%Urban population
90 VillagesClusters
16753.2
866Male literacy rate 1483
Area (Sq. Km)
DELHI
Key Data
0 0
33 135
256 23
0 00 2
13 0
0 0
22817 89374
124739 5912
0 0
0 165
6314 0
0 0
1024 3694
5324 301
0 0
(2011-12)
(2011-12)
Pupil-teacher ratio% Sch. having SMC
Student-classroom ratio Average tch per schoolFemale teachersEnr. in single-tch schools
Girls enrolmentEnr. in Govt. schools
3610.370.80.0
83.2
2.1
48.9
4133
12.585.90.03.9
38.1
51.929
4711.856.70.0
81.754.8
25.728
4611.956.51.3
78.7
30.3
53.7
2923.1
2933
30.184.30.0
38.647.3
42.2
15.2
48.9
1844
56.179.20.0
3312.385.80.02.8
42.3
38.2
3140
10.871.80.0
83.948.7
18.540
3515.144.20.3
92.840.9
12.739 24
1.0 1.118.5 6.9
3436 41
16.4 23.575.3 71.20.0 0.0
61.8 61.346.4 46.5
11.61759
38.444.80.0
92.639.9
22.7 6.02335
22.082.50.0
15.540.1
2460
25.348.00.0
93.843.2
% Sch. with <=50 students 1.2 1.4 1.1 1.2 0.0 0.0 4.9 5.1 2.0 2.0 0.0 1.3#
Upper Primary Level 640723 70.7 69.1 9.0
1052671Primary Level
Facilities Text books
9.3 17.1 23.7
Residential% Enr. in Pre-Pry.
6.0Sch with No female tch. 4.5 5.1 0.0 0.2 3.4 2.5 19.5 10.3 32.8 21.6 7.5
53.7
% Sch with SCR > % Sch with PTR >Ratio of Grade V to Grade I
43.3 Primary Upper Primary 0.0
30 at Pr. 35 at U.P. 30 at Pr.
Pry. level Total Grossness Transition Rate (Prim. to Upper Prim.)
*
@ =Govt. only # =Govt. + Aided NR=Not Reported *Some totals may not match due to no response in classificatory data items
1.0 19.6
289 158
U.Pry.only
1694
1247
TransportStationary
948800
636191142562
147228
AttendanceUniform
494721
222906
0
0
35 at U.P.(2011-12)

Elementary Education : State Report Cards
23
Retention rate (Prim.)
0.00
% Grants utilized%Teachers by Age (In years)
Enrolment* 2012-13 Ratio of Girl's to Boy's Enr: Grades I to V
Grade Total
I
II
III
IV
V
VI
VII
VIII
Pry (I-V)
U.P. + Sec
Pry + U.Pry
U. Pry. only
0
U.P. + Sec
P + U.P. + Sec
Contract
Primary only
Primary + U.Pry
P + UP+Sec/HS
Upper Pry. only
U.P. + Sec/HS
P+ U.P. + Sec
U.P. + Sec/HS
Teachers by gender & casteSchool category
School category
Primary only
Primary with Upper Primary
Primary with UP. Pri. and Sec/HS
Upper Primary onlyUpper Primary with Sec/HS
Primary with UP. & Sec
Upper Primary with Sec % Teachers recd. in-service training (previous year)
% Sch. received
DELHI
@
SD Grant
% ProfessionallyTrained teachers
Regular Private
Male
Female
All Tch.
All Teachers
Female
Male
Contract
100.0
100.0
100.0
0.0
0.0
0.0
100.0
100.0
100.0
12.4
9.8
10.5
4.1
2.7
2.9
24.8
40.1
33.4
17.7
19.5
26.3
P+UP+Sec/HS UP only
42.7
40.1
36.9
P + UP+Sec/HS
0
0
0
0
0
0
0
356
0
83
64
19
0
1,833
5
112
400
23
0 0
1,175
2,900
3,732
134
17,342 34,847
312
14,318
2,856
2,584
0
2,469
13
1,085
128
194
0
0
0
0
0
0
0
0
0
0
0
0
56,847
464
19,330
6,348
3,995
26,664
Total
6,370
Enrolment by medium of instructions*
906
11,822
202
10,678
1,110
2,079
Male
7,777
Regular teachers
262
8,652
5,238
1,916
Female
18,887
5,464
45,025
0
0
0
0
0
0
No res
0 0
0
0
0
0
0
0
Female
0
0
0
0
0
0
0
Male
Contractual teachers
0
0
0
0
0
0
0
No res
1,570
59
1,614
44
1,972
92
SC teachers
Male
2,110
114
2,392
36
1,067
132
Female
ST teachers
641
9
338
1
539
12
132
Male Female
TLM
67.9
4.4
46.1
74.491.1
13.8
86.1
69 387 3,255 2,505 154 0 0
U.Pry.
Avg. CLS
School category
Pry. only
Pry + U.Pry
U. Pry. only
U.P. + Sec
P + U.P. + Sec
U.P. + Sec
%Majorrepair
%Minorrepair
9.19
0.51
4.39
13.13
13.30
%Goodcond.
84.16
99.43
93.68
74.07
81.37
Pry. only
Enrolment by nature of disability
11.4
22.3
7.6
10.8
10.1
14.5
11.7
96.40
72.52
2.41
21.06
Otherrooms
6.65
0.07
1.92
12.79
5.33
Teachers by Edu. qualification (other than contract teachers)*
Classrooms/Other rooms
1.19
6.42
P + UP+Sec/HS
0 365 5,570 12,383 7,653 693 0 0
School category Grad.Below
Sec. Sec.Hr.
Sec.PostGrad.
MPhil/ PhD
PostDoc.
NoRes.
7.5 49.1
6.2 43.3
6.4 46.3
326,531
363,081
371,861
366,887
378,323
369,690
352,925
341,284
1,806,683
1,063,899
outCWSN10.7
U. Pry.Primary GER Primaryrate % SC enr. GER U. Pry.
% SC girls
0.4 0.4% ST enr.
% ST girls
NER Primary
% TeachersinvolvedNumber ofdays involved
NER U. Pry.
Non-Tch assignment2.8% OBC enr.
% OBC
0.12 girls
% Muslim 16.1 14.6enr.
% Muslim Pr. level
216
Average Instructional days
22
97.6
13.0
83.9
U. Pr. level
218
-titionTotalRepe-aters
rate0
0
0
0
0
0
0
0
0girls0
0.00
0.00
0.00
0.00
0.00
0.00
0.00
0.00
0.00
117.8110.0
Repe- Drop SC/ST/OBC enrolment Enrolment ratio0.88
Total CLSrooms
30,227
5,920
22,620
297
5,427
4,194
1,588
11,510
3,363
17,598
177
7,027
2,966
1,155
V
91
635
107
153
409
616
23
91
VIIIVII
114
VI
109
107 93 94
1165 1216 1212
214 201 200
261 241 158
523502 552
365 439 354
23 24 14
99 98 115 105 134 123 140 100
113 190 203 173
IVI II IIINature of Disability
76 89 90 111
192 360 445 594
87 107 117 117
97 170 169 158
290 325192 361
214 362 525
35 27 55
590
29
2840 2924 24 26 19 23
182
47.6
42.9
6.3
48.3
48.8 49.0
44.7
47.1
51.6
9.5
227457
409
13
457
3
190
24
38
66.7
4.2
42.3
71.884.7
11.8
81.6
Girlsenrolment
155,252
170,787
173,721
169,570
177,277
170,268
162,836
156,447
846,607
489,551
649
968
1,094
1,202
1,270
1,555
1,595
1,420
5,183
4,570
Boys480
749
976
1,055
1,103
1,359
1,448
1,355
4,363
4,162
Girls
Blind
Low-vision
Hearing
Speach
Loco-motor
MentallyRetarded
Learning
CerebralPalsy
Autism
Multiple
1.94
0.97
1.25
40458
247234
11407255763
26934
85863
Hindi
870970 203825
154031
746213
145460461
119648
9212
English
974
3675813
5867
576
20446
Urdu
211
0
0
1298
00
7109
155
Malayalam Sanskrit
454
0
74
0370
0
0
3.28
1.65
2.12
3.73
1.89
2.42
Government
93.9 91.4
UP+Sec/HS P+UP+Sec UP+SecP + UPP. only 55 - 56 57-58 59-60 TLM SD Grant
Gender
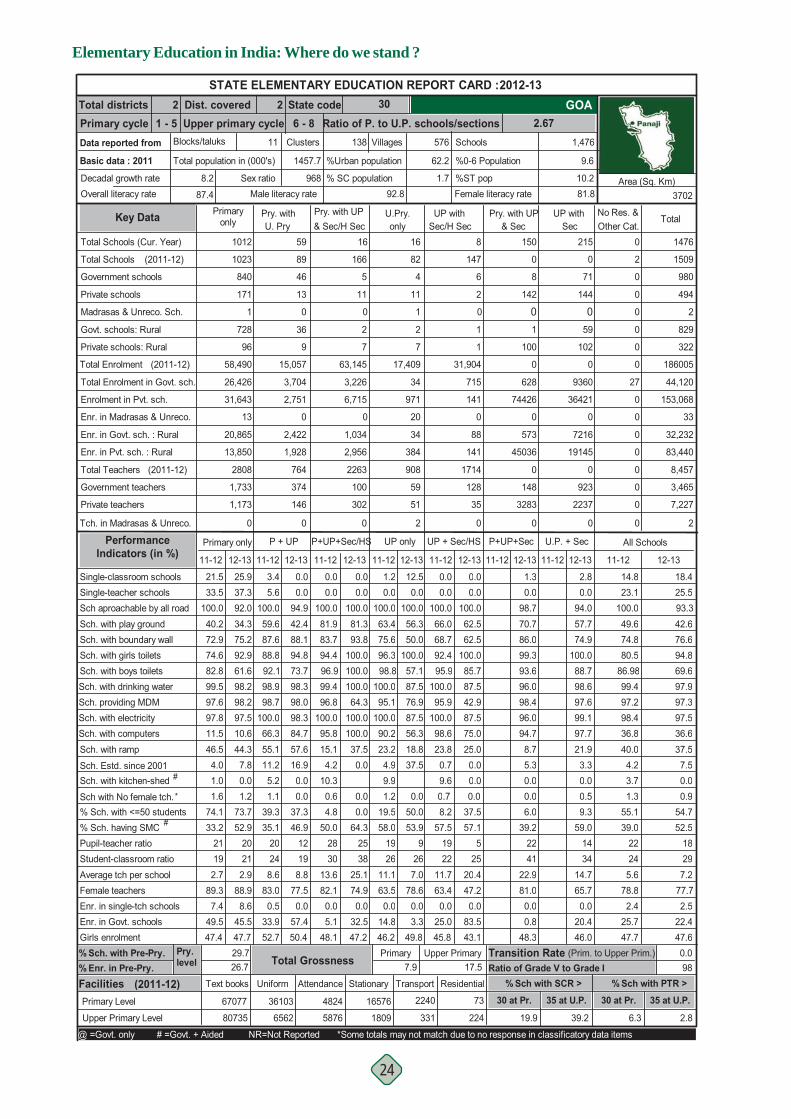
Elementary Education in India: Where do we stand ?
24
% Sch. with Pre-Pry.
Dist. covered State codeUpper primary cycle Ratio of P. to U.P. schools/sections 2.67
2 3021 - 5 6 - 8
Total districtsPrimary cycleData reported from
Basic data : 2011
Decadal growth rateOverall literacy rate
Blocks/taluks
8.2
87.4
Primaryonly
All Schools
Pry. withU. Pry
UP withSec/H Sec & Sec
Pry. with UP UP withSec
Pry. with UP & Sec/H Sec Other Cat.
No Res. &Total
Sch. with drinking water Sch. providing MDMSch. with electricity Sch. with computers
Sch. with kitchen-shedSch. Estd. since 2001
#
Sch. with ramp
Sch aproachable by all roadSch. with play groundSch. with boundary wallSch. with girls toilets
Single-teacher schoolsSingle-classroom schools
Sch. with boys toilets
98.297.510.644.37.80.0
12-13
37.392.034.375.2
25.9
92.961.698.2
66.355.111.2
98.7
5.2
11-12
59.687.6
5.6100.0
3.4
88.892.198.9
100.0
11-12
0.0
87.556.318.837.5
100.0
100.090.223.24.9
95.1
9.9
11-12 12-13
56.350.0
12.5
75.6
0.0100.0
1.2
63.4
0.0100.0
100.096.357.198.887.576.9
12-13 11-12
1.3
12-13 11-12
0.0
12-13
2.80.0
100.081.983.794.496.999.496.8
100.095.815.14.2
10.3
100.0
100.0100.037.50.0
12-13
100.081.393.8
0.00.0
100.0100.0
64.3
84.757.616.90.0
12-13
94.942.488.1
0.00.0
94.873.798.398.098.397.8
11.5
4.046.5
97.6
1.0
40.272.9
100.0
21.533.5
74.682.899.5
11-12
0.0
23.80.7
95.9
9.6
11-12
0.0100.066.068.7
0.0
92.495.9
100.0
100.098.6
Total Schools (Cur. Year) 1012 59 16 16 0
Total Schools
Madrasas & Unreco. Sch.
Private schools
Private schools: Rural
Total Enrolment
Govt. schools: Rural
(2011-12)
840
171
1
728
96
58,490
1023
2
2
7
17,409
1
82
4
11
7
63,145
0
166
5
11
2
89
46
13
0
36
9
15,057
2
0
0
0
0
0
0
Total Enrolment in Govt. sch.
Enrolment in Pvt. sch.
Enr. in Madrasas & Unreco.
Enr. in Govt. sch. : Rural
Enr. in Pvt. sch. : Rural
Total Teachers
Private teachers
Government teachers
Tch. in Madrasas & Unreco.
26,426
31,643
13
20,865
13,850
2808
1,733
1,173
0
P + UP P+UP+Sec/HS UP only UP + Sec/HS P+UP+Sec U.P. + Sec
34
971
384
34
908
59
51
20
2
3,226
6,715
2,956
1,034
2263
100
302
0
0
3,704
2,751
0
2,422
1,928
764
374
146
0
27
0
0
0
0
0
0
0
0
Primary only Performance Indicators (in %)
Government schools
8
147
6
0
1
1
31,904
715
141
0
88
141
1714
128
35
0
1476
1509
980
494
2
829
322
186005
44,120
153,068
33
32,232
83,440
8,457
3,465
7,227
2
14.8 18.423.1 25.5
100.0 93.349.6 42.674.8 76.680.5 94.8
86.98 69.699.4 97.997.2 97.398.4 97.536.8 36.640.0 37.54.2 7.53.7 0.0
11-12 12-13
0.0100.062.562.5
100.085.787.5
0.0
42.987.575.025.00.00.0
98.770.786.099.393.696.098.4
94.057.774.9
100.088.798.697.6
96.094.78.75.30.0
99.197.721.93.30.0
STATE ELEMENTARY EDUCATION REPORT CARD : 2012-13
1,476
Female literacy rate
9.6
10.281.8
%ST pop
%0-6 Population
Schools
1.7
62.2
57611
Total population in (000's)
Sex ratio92.8
% SC population
%Urban population
138 VillagesClusters
1457.7
968Male literacy rate 3702
Area (Sq. Km)
GOA
Key Data
0 0
8 71
142 144
0 01 59
100 102
0 0
628 9360
74426 36421
0 0
573 7216
45036 19145
0 0
148 923
3283 2237
0 0
(2011-12)
(2011-12)
Pupil-teacher ratio% Sch. having SMC
Student-classroom ratio Average tch per schoolFemale teachersEnr. in single-tch schools
Girls enrolmentEnr. in Govt. schools
212.9
88.98.6
45.5
52.9
47.7
20248.6
83.00.5
33.952.7
35.120
2611.163.50.0
14.846.2
58.019
267.0
78.60.03.3
53.9
49.8
950.0
2830
13.682.10.05.1
48.132.5
64.3
47.2
2538
25.174.90.0
198.8
77.50.0
57.4
46.9
50.4
12192.7
89.37.4
49.547.4
33.221
2211.763.40.0
25.045.8
57.519 18
55.1 54.739.0 52.5
2224 295.6 7.2
78.8 77.72.4 2.5
25.7 22.447.7 47.6
57.15
2520.447.20.0
83.543.1
39.2 59.02241
22.981.00.00.8
48.3
1434
14.765.70.0
20.446.0
% Sch. with <=50 students 74.1 73.7 39.3 37.3 4.8 0.0 19.5 50.0 8.2 37.5 6.0 9.3#
Upper Primary Level 80735 19.9 39.2 2.8
67077Primary Level
Facilities Text books
26.7 7.9 17.5 98 Residential
% Enr. in Pre-Pry.
0.9Sch with No female tch. 1.6 1.2 1.1 0.0 0.6 0.0 1.2 0.0 0.7 0.0 1.3
6.3
% Sch with SCR > % Sch with PTR >Ratio of Grade V to Grade I
29.7 Primary Upper Primary 0.0
30 at Pr. 35 at U.P. 30 at Pr.
Pry. level Total Grossness Transition Rate (Prim. to Upper Prim.)
*
@ =Govt. only # =Govt. + Aided NR=Not Reported *Some totals may not match due to no response in classificatory data items
0.0 0.5
150 215
U.Pry.only
2240
331
TransportStationary
16576
18095876
4824
AttendanceUniform
36103
6562
73
224
35 at U.P.(2011-12)
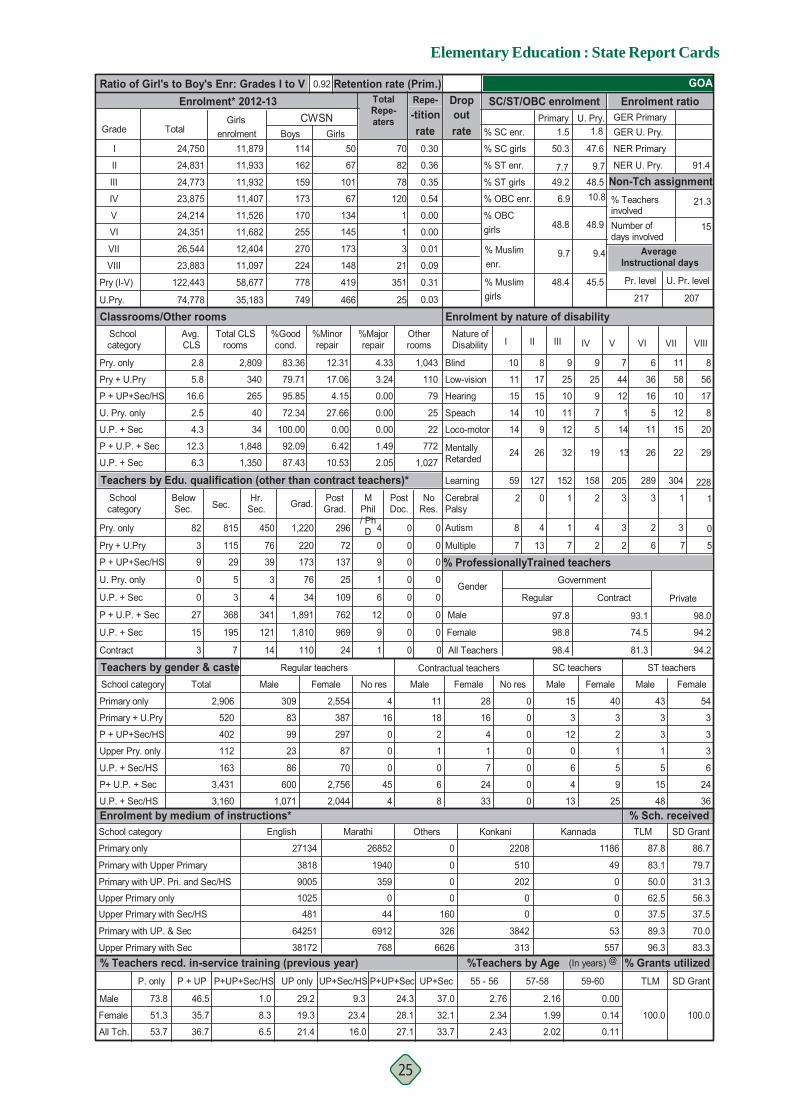
Elementary Education : State Report Cards
25
Retention rate (Prim.)
0.03
% Grants utilized%Teachers by Age (In years)
Enrolment* 2012-13 Ratio of Girl's to Boy's Enr: Grades I to V
Grade Total
I
II
III
IV
V
VI
VII
VIII
Pry (I-V)
U.P. + Sec
Pry + U.Pry
U. Pry. only
0
U.P. + Sec
P + U.P. + Sec
Contract
Primary only
Primary + U.Pry
P + UP+Sec/HS
Upper Pry. only
U.P. + Sec/HS
P+ U.P. + Sec
U.P. + Sec/HS
Teachers by gender & casteSchool category
School category
Primary only
Primary with Upper Primary
Primary with UP. Pri. and Sec/HS
Upper Primary onlyUpper Primary with Sec/HS
Primary with UP. & Sec
Upper Primary with Sec % Teachers recd. in-service training (previous year)
% Sch. received
GOA
@
SD Grant
% ProfessionallyTrained teachers
Regular Private
Male
Female
All Tch.
All Teachers
Female
Male
Contract
94.2
94.2
98.0
81.3
74.5
93.1
98.8
98.4
97.8
73.8
51.3
53.7
46.5
35.7
36.7
29.2
19.3
21.4
8.3
6.5
1.0
P+UP+Sec/HS UP only
9.3
16.0
23.4
P + UP+Sec/HS
3
9
0
0
27
15
3
29
5
3
368
195
7
39
3
4
341
121
14 110
1,810
1,891
34
76
173 137
25
109
762
969
24
9
1
6
12
9
1
0
0
0
0
0
0
0
0
0
0
0
402
112
163
3,431
3,160
2,906
Total
520
Enrolment by medium of instructions*
83
99
23
86
600
1,071
Male
309
Regular teachers
87
70
2,756
2,044
Female
2,554
387
297
16
0
0
0
45
4
No res
4 28
16
4
1
7
24
33
Female
11
18
2
1
0
6
8
Male
Contractual teachers
0
0
0
0
0
0
0
No res
15
3
12
0
6
4
SC teachers
Male
40
3
2
1
5
9
Female
ST teachers
43
3
3
1
5
15
48
Male Female
TLM
87.8
83.1
50.0
62.537.5
89.3
96.3
115 76 220 72 0 0 0
U.Pry.
Avg. CLS
School category
Pry. only
Pry + U.Pry
U. Pry. only
U.P. + Sec
P + U.P. + Sec
U.P. + Sec
%Majorrepair
%Minorrepair
12.31
17.06
4.15
27.66
0.00
%Goodcond.
83.36
79.71
95.85
72.34
100.00
Pry. only
Enrolment by nature of disability
5.8
16.6
2.5
4.3
6.3
12.3
2.8
92.09
87.43
6.42
10.53
Otherrooms
4.33
3.24
0.00
0.00
0.00
Teachers by Edu. qualification (other than contract teachers)*
Classrooms/Other rooms
1.49
2.05
P + UP+Sec/HS
82 815 450 1,220 296 4 0 0
School category Grad.Below
Sec. Sec.Hr.
Sec.PostGrad.
MPhil/ PhD
PostDoc.
NoRes.
24.3 37.0
28.1 32.1
27.1 33.7
24,750
24,831
24,773
23,875
24,214
24,351
26,544
23,883
122,443
74,778
outCWSN1.5
U. Pry.Primary GER Primaryrate % SC enr. GER U. Pry.
% SC girls
% ST enr.
% ST girls
NER Primary
% TeachersinvolvedNumber ofdays involved
NER U. Pry.
Non-Tch assignment10.8% OBC enr.
% OBC girls
% Muslim 9.7 9.4enr.
% Muslim Pr. level
217
Average Instructional days
15
21.3
91.4
U. Pr. level
207
-titionTotalRepe-aters
rate70
82
78
120
1
1
3
21
351girls25
0.31
0.09
0.01
0.00
0.00
0.54
0.35
0.36
0.30
Repe- Drop SC/ST/OBC enrolment Enrolment ratio0.92
Total CLSrooms
2,809
340
265
40
34
1,848
1,350
1,043
110
79
25
22
772
1,027
V
7
44
12
1
14
205
3
29
VIIIVII
26
VI
22
6 11 8
36 58 56
16 10 17
5 12 8
2011 15
289 304 228
2 3 0
7 13 7 2 2 6 7 5
24 26 32 19
IVI II IIINature of Disability
10 8 9 9
11 17 25 25
15 15 10 9
14 10 11 7
9 1214 5
59 127 152
8 4 1
158
4
13 12 0 1 2 3
13
50.3
7.749.2
6.9
48.8
48.4 45.5
48.9
48.59.7
47.6
1.8
2513
54
3
3
3
6
24
36
86.7
79.7
31.3
56.337.5
70.0
83.3
Girlsenrolment
11,879
11,933
11,932
11,407
11,526
11,682
12,404
11,097
58,677
35,183
114
162
159
173
170
255
270
224
778
749
Boys50
67
101
67
134
145
173
148
419
466
Girls
Blind
Low-vision
Hearing
Speach
Loco-motor
MentallyRetarded
Learning
CerebralPalsy
Autism
Multiple
0.00
0.14
0.11
3818
9005
1025481
64251
38172
English
27134 26852
1940
359
044
6912
768
Marathi
326
1600
0
0
0
Others
6626
2208
510
202
00
3842
313
Konkani Kannada
1186
49
0
00
53
557
2.16
1.99
2.02
2.76
2.34
2.43
Government
100.0 100.0
UP+Sec/HS P+UP+Sec UP+SecP + UPP. only 55 - 56 57-58 59-60 TLM SD Grant
Gender

Elementary Education in India: Where do we stand ?
26
% Sch. with Pre-Pry.
Dist. covered State codeUpper primary cycle Ratio of P. to U.P. schools/sections 1.33
26 24261 - 5 6 - 8
Total districtsPrimary cycleData reported from
Basic data : 2011
Decadal growth rateOverall literacy rate
Blocks/taluks
19.2
79.3
Primaryonly
All Schools
Pry. withU. Pry
UP withSec/H Sec & Sec
Pry. with UP UP withSec
Pry. with UP & Sec/H Sec Other Cat.
No Res. &Total
Sch. with drinking water Sch. providing MDMSch. with electricity Sch. with computers
Sch. with kitchen-shedSch. Estd. since 2001
#
Sch. with ramp
Sch aproachable by all roadSch. with play groundSch. with boundary wallSch. with girls toilets
Single-teacher schoolsSingle-classroom schools
Sch. with boys toilets
98.097.723.083.523.676.4
12-13
3.887.464.880.9
3.8
94.952.399.6
75.581.412.2
89.4
47.4
11-12
77.193.1
0.3100.0
0.7
99.784.8
100.0
99.4
11-12
0.7
98.876.356.820.521.4
100.0
99.368.145.730.9
63.3
28.6
11-12 12-13
87.593.2
1.0
93.1
5.9100.0
3.3
91.4
2.994.9
99.6100.094.493.299.673.0
12-13 11-12
0.3
12-13 11-12
1.1
12-13
37.60.0
100.095.193.7
100.090.7
100.074.4
100.075.546.925.930.8
98.7
97.691.537.334.918.4
12-13
96.789.495.7
0.70.1
98.397.1
30.6
89.482.612.773.5
12-13
95.675.892.6
0.60.9
98.582.699.796.699.297.6
18.5
22.984.9
91.8
39.5
64.978.0
100.0
4.71.9
99.654.3
100.0
11-12
9.8
27.327.3
37.5
25.0
11-12
27.3100.0100.0100.0
27.3
100.0100.0100.0
100.0100.0
Total Schools (Cur. Year) 11365 27976 1741 511 40
Total Schools
Madrasas & Unreco. Sch.
Private schools
Private schools: Rural
Total Enrolment
Govt. schools: Rural
(2011-12)
10,443
922
0
9,844
532
799,483
11105
176
46
188
49,702
0
304
227
284
631
40,258
2
143
51
1,688
31
29380
22,863
5,112
1
20,660
2,152
7,486,079
0
36
3
1
12
2
0
Total Enrolment in Govt. sch.
Enrolment in Pvt. sch.
Enr. in Madrasas & Unreco.
Enr. in Govt. sch. : Rural
Enr. in Pvt. sch. : Rural
Total Teachers
Private teachers
Government teachers
Tch. in Madrasas & Unreco.
705,607
111,245
0
578,179
54,099
32191
29,278
4,393
0
P + UP P+UP+Sec/HS UP only UP + Sec/HS P+UP+Sec U.P. + Sec
49,589
56,157
27,480
7,620
1678
1,470
1,379
0
0
17,723
896,063
224,947
5,834
1160
834
30,231
1079
36
5,422,120
1,677,449
52
4,636,376
563,942
237989
174,146
49,114
4
1,714
3,507
0
1,187
725
0
70
33
0
Primary only Performance Indicators (in %)
Government schools
214
11
38
0
33
124
1,445
4,709
26,251
0
4,210
15,617
47
452
2,596
0
42745
40943
33,767
8972
6
30,716
4,024
8376967
6,215,390
3,003,059
1,755
5,245,666
976,223
273,065
206,965
96,570
72
1.8 1.70.8 1.6
100.0 93.474.0 73.889.0 89.699.7 97.5
76.36 75.3100.0 99.689.9 95.798.9 98.760.0 71.582.0 79.415.3 17.344.8 73.1
11-12 12-13
1.496.789.393.597.995.299.5
0.3
41.598.678.539.723.427.4
95.990.895.699.695.3
100.041.4
96.380.484.196.489.997.410.5
99.493.837.143.327.6
95.267.221.743.92.4
STATE ELEMENTARY EDUCATION REPORT CARD : 2012-13
42,746
Female literacy rate
12.4
14.870.7
%ST pop
%0-6 Population
Schools
6.7
42.6
19,813228
Total population in (000's)
Sex ratio87.2
% SC population
%Urban population
4,295 VillagesClusters
60383.6
918Male literacy rate 196024
Area (Sq. Km)
GUJARAT
Key Data
0 0
34 75
674 113
1 129 61
302 93
0 0
10886 3042
226949 5438
476 148
9897 2363
84755 4658
0 0
368 347
8241 583
25 7
(2011-12)
(2011-12)
Pupil-teacher ratio% Sch. having SMC
Student-classroom ratio Average tch per schoolFemale teachersEnr. in single-tch schools
Girls enrolmentEnr. in Govt. schools
243.0
48.81.9
86.4
98.4
48.0
24348.1
55.50.1
70.346.1
89.531
305.5
55.02.4
40.446.1
49.530
325.6
56.31.2
46.9
84.6
42.6
3735.9
35308.1
67.80.04.7
39.41.9
43.7
41.3
2944
17.963.10.0
338.0
54.10.2
76.4
98.3
46.8
32252.9
47.91.0
87.247.8
92.625
254.3
46.87.7
19.947.8
37.531 30
17.9 19.290.1 97.3
3133 336.7 7.1
54.7 54.50.2 0.3
71.4 67.446.2 46.1
58.51031
14.229.20.8
15.239.3
67.2 13.72835
12.265.20.24.6
40.1
9245.0
31.60.3
35.348.5
% Sch. with <=50 students 47.2 48.9 7.0 7.8 7.0 7.5 15.8 10.8 27.3 31.8 4.2 68.8#
Upper Primary Level 1756654 43.8 36.8 28.2
4148578Primary Level
Facilities Text books
5.7 17.9 23.5 99 Residential
% Enr. in Pre-Pry.
12.2Sch with No female tch. 28.0 25.9 8.1 7.4 7.7 3.9 12.5 10.0 0.0 9.8 13.6
38.3
% Sch with SCR > % Sch with PTR >Ratio of Grade V to Grade I
8.1 Primary Upper Primary 99.0
30 at Pr. 35 at U.P. 30 at Pr.
Pry. level Total Grossness Transition Rate (Prim. to Upper Prim.)
*
@ =Govt. only # =Govt. + Aided NR=Not Reported *Some totals may not match due to no response in classificatory data items
3.0 23.8
709 189
U.Pry.only
24651
18943
TransportStationary
3394265
14327461737291
3617707
AttendanceUniform
639136
218636
35177
20493
35 at U.P.(2011-12)
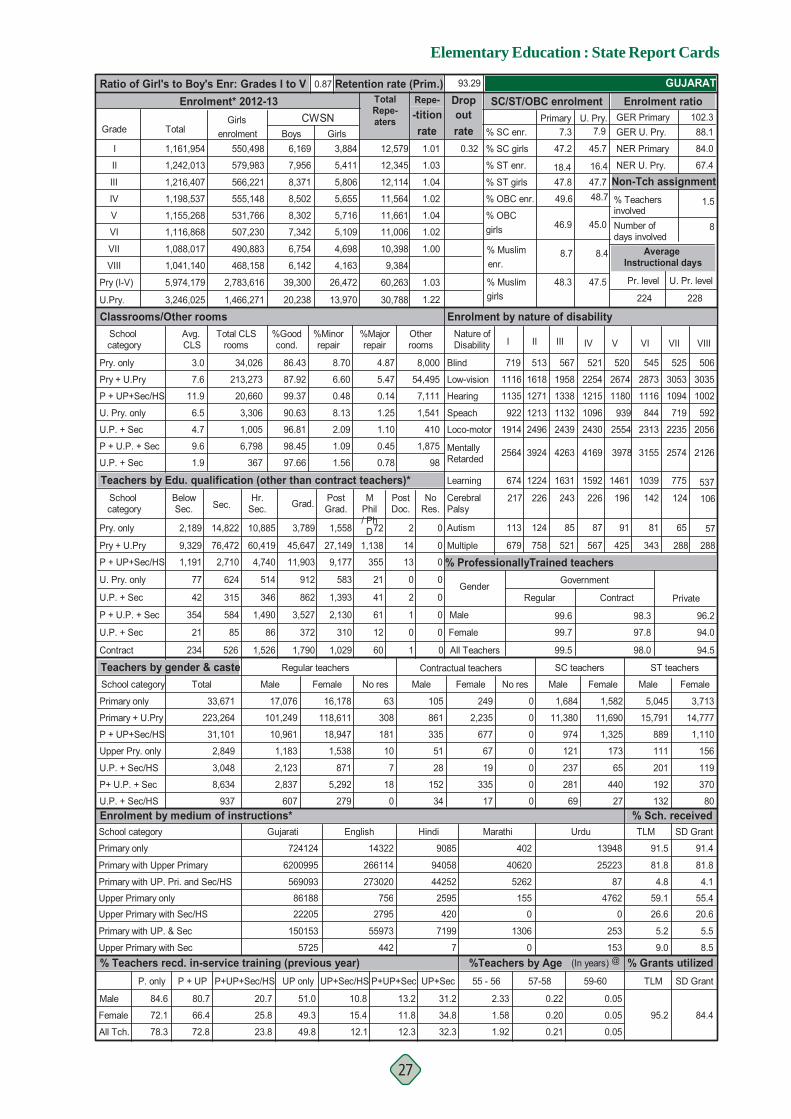
Elementary Education : State Report Cards
27
Retention rate (Prim.)
1.22
% Grants utilized%Teachers by Age (In years)
93.29
Enrolment* 2012-13 Ratio of Girl's to Boy's Enr: Grades I to V
Grade Total
I
II
III
IV
V
VI
VII
VIII
Pry (I-V)
U.P. + Sec
Pry + U.Pry
U. Pry. only
0
U.P. + Sec
P + U.P. + Sec
Contract
Primary only
Primary + U.Pry
P + UP+Sec/HS
Upper Pry. only
U.P. + Sec/HS
P+ U.P. + Sec
U.P. + Sec/HS
Teachers by gender & casteSchool category
School category
Primary only
Primary with Upper Primary
Primary with UP. Pri. and Sec/HS
Upper Primary onlyUpper Primary with Sec/HS
Primary with UP. & Sec
Upper Primary with Sec % Teachers recd. in-service training (previous year)
% Sch. received
GUJARAT
@
SD Grant
% ProfessionallyTrained teachers
Regular Private
Male
Female
All Tch.
All Teachers
Female
Male
Contract
94.5
94.0
96.2
98.0
97.8
98.3
99.7
99.5
99.6
84.6
72.1
78.3
80.7
66.4
72.8
51.0
49.3
49.8
25.8
23.8
20.7
P+UP+Sec/HS UP only
10.8
12.1
15.4
P + UP+Sec/HS
9,329
1,191
77
42
354
21
234
2,710
624
315
584
85
526
4,740
514
346
1,490
86
1,526 1,790
372
3,527
862
912
11,903 9,177
583
1,393
2,130
310
1,029
355
21
41
61
12
60
13
0
2
1
0
1
0
0
0
0
0
31,101
2,849
3,048
8,634
937
33,671
Total
223,264
Enrolment by medium of instructions*
101,249
10,961
1,183
2,123
2,837
607
Male
17,076
Regular teachers
1,538
871
5,292
279
Female
16,178
118,611
18,947
308
181
10
7
18
0
No res
63 249
2,235
677
67
19
335
17
Female
105
861
335
51
28
152
34
Male
Contractual teachers
0
0
0
0
0
0
0
No res
1,684
11,380
974
121
237
281
SC teachers
Male
1,582
11,690
1,325
173
65
440
Female
ST teachers
5,045
15,791
889
111
201
192
132
Male Female
TLM
91.5
81.8
4.8
59.126.6
5.2
9.0
76,472 60,419 45,647 27,149 1,138 14 0
U.Pry.
Avg. CLS
School category
Pry. only
Pry + U.Pry
U. Pry. only
U.P. + Sec
P + U.P. + Sec
U.P. + Sec
%Majorrepair
%Minorrepair
8.70
6.60
0.48
8.13
2.09
%Goodcond.
86.43
87.92
99.37
90.63
96.81
Pry. only
Enrolment by nature of disability
7.6
11.9
6.5
4.7
1.9
9.6
3.0
98.45
97.66
1.09
1.56
Otherrooms
4.87
5.47
0.14
1.25
1.10
Teachers by Edu. qualification (other than contract teachers)*
Classrooms/Other rooms
0.45
0.78
P + UP+Sec/HS
2,189 14,822 10,885 3,789 1,558 72 2 0
School category Grad.Below
Sec. Sec.Hr.
Sec.PostGrad.
MPhil/ PhD
PostDoc.
NoRes.
13.2 31.2
11.8 34.8
12.3 32.3
1,161,954
1,242,013
1,216,407
1,198,537
1,155,268
1,116,868
1,088,017
1,041,140
5,974,179
3,246,025
outCWSN7.3
U. Pry.Primary GER Primaryrate % SC enr. GER U. Pry.
0.32 % SC girls
% ST enr.
% ST girls
NER Primary
% TeachersinvolvedNumber ofdays involved
NER U. Pry.
Non-Tch assignment48.7% OBC enr.
% OBC girls
% Muslim 8.7 8.4enr.
% Muslim Pr. level
224
Average Instructional days
8
84.0
1.5
67.4
U. Pr. level
228
-titionTotalRepe-aters
rate12,579
12,345
12,114
11,564
11,661
11,006
10,398
9,384
60,263girls30,788
1.03
1.00
1.02
1.04
1.02
1.04
1.03
1.01
102.388.1
Repe- Drop SC/ST/OBC enrolment Enrolment ratio0.87
Total CLSrooms
34,026
213,273
20,660
3,306
1,005
6,798
367
8,000
54,495
7,111
1,541
410
1,875
98
V
520
2674
1180
939
2554
1461
91
2126
VIIIVII
3155
VI
2574
545 525 506
2873 3053 3035
1116 1094 1002
844 719 592
20562313 2235
1039 775 537
81 65 57
679 758 521 567 425 343 288 288
2564 3924 4263 4169
IVI II IIINature of Disability
719 513 567 521
1116 1618 1958 2254
1135 1271 1338 1215
922 1213 1132 1096
2496 24391914 2430
674 1224 1631
113 124 85
1592
87
124142 106217 226 243 226 196
3978
47.2
18.447.8
49.6
46.9
48.3 47.5
45.0
47.716.4
45.7
7.9
2769
3,713
14,777
1,110
156
119
370
80
91.4
81.8
4.1
55.420.6
5.5
8.5
Girlsenrolment
550,498
579,983
566,221
555,148
531,766
507,230
490,883
468,158
2,783,616
1,466,271
6,169
7,956
8,371
8,502
8,302
7,342
6,754
6,142
39,300
20,238
Boys3,884
5,411
5,806
5,655
5,716
5,109
4,698
4,163
26,472
13,970
Girls
Blind
Low-vision
Hearing
Speach
Loco-motor
MentallyRetarded
Learning
CerebralPalsy
Autism
Multiple
0.05
0.05
0.05
6200995
569093
8618822205
150153
5725
Gujarati
724124 14322
266114
273020
7562795
55973
442
English
7199
4202595
44252
94058
9085
Hindi
7
402
40620
5262
1550
1306
0
Marathi Urdu
13948
25223
87
47620
253
153
0.22
0.20
0.21
2.33
1.58
1.92
Government
95.2 84.4
UP+Sec/HS P+UP+Sec UP+SecP + UPP. only 55 - 56 57-58 59-60 TLM SD Grant
Gender
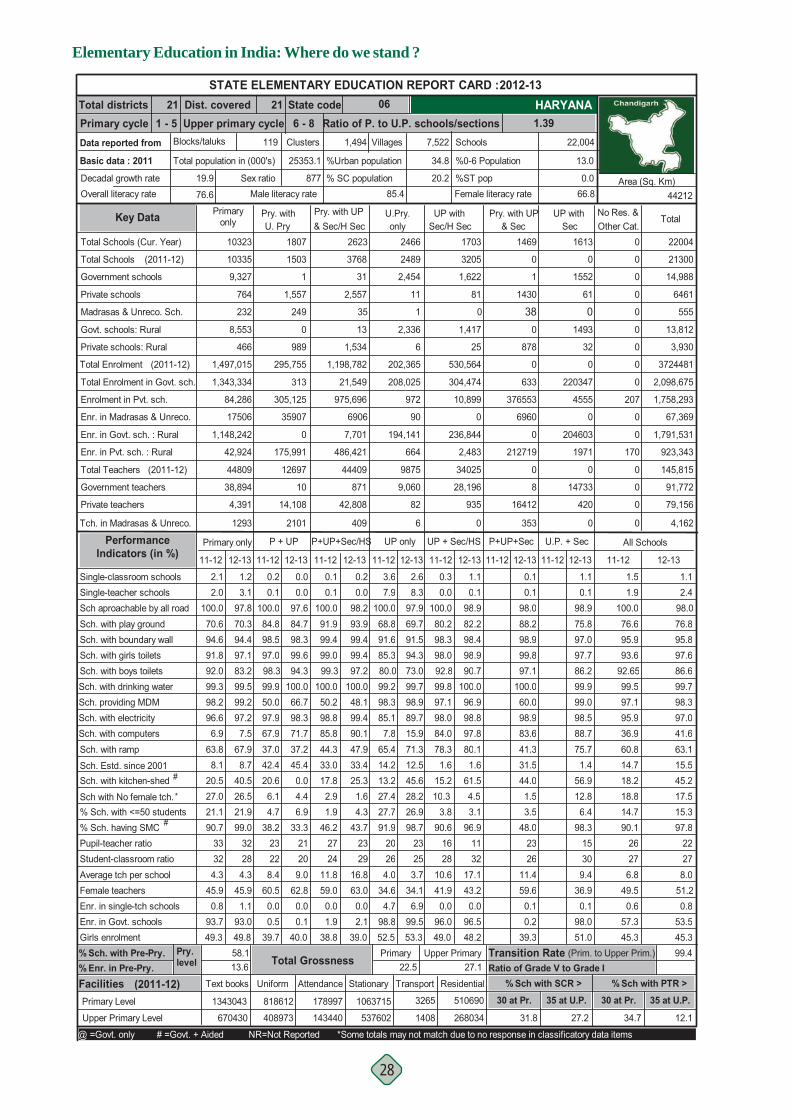
Elementary Education in India: Where do we stand ?
28
% Sch. with Pre-Pry.
Dist. covered State codeUpper primary cycle Ratio of P. to U.P. schools/sections 1.39
21 06211 - 5 6 - 8
Total districtsPrimary cycleData reported from
Basic data : 2011
Decadal growth rateOverall literacy rate
Blocks/taluks
19.9
76.6
Primaryonly
All Schools
Pry. withU. Pry
UP withSec/H Sec & Sec
Pry. with UP UP withSec
Pry. with UP & Sec/H Sec Other Cat.
No Res. &Total
Sch. with drinking water Sch. providing MDMSch. with electricity Sch. with computers
Sch. with kitchen-shedSch. Estd. since 2001
#
Sch. with ramp
Sch aproachable by all roadSch. with play groundSch. with boundary wallSch. with girls toilets
Single-teacher schoolsSingle-classroom schools
Sch. with boys toilets
99.297.27.5
67.98.7
40.5
12-13
3.197.870.394.4
1.2
97.183.299.5
67.937.042.4
50.0
20.6
11-12
84.898.5
0.1100.0
0.2
97.098.399.9
97.9
11-12
0.1
89.715.971.312.545.6
99.2
85.17.8
65.414.2
98.3
13.2
11-12 12-13
69.791.5
2.6
91.6
7.9100.0
3.6
68.8
8.397.9
94.385.373.080.099.798.9
12-13 11-12
0.1
12-13 11-12
0.1
12-13
1.10.1
100.091.999.499.099.3
100.050.298.885.844.333.017.8
100.0
99.490.147.933.425.3
12-13
98.293.999.4
0.20.0
99.497.2
48.1
71.737.245.40.0
12-13
97.684.798.3
0.00.0
99.694.3
100.066.798.396.6
6.9
8.163.8
98.2
20.5
70.694.6
100.0
2.12.0
91.892.099.3
11-12
1.1
78.31.6
97.1
15.2
11-12
0.0100.080.298.3
0.3
98.092.899.8
98.084.0
Total Schools (Cur. Year) 10323 1807 2623 2466 0
Total Schools
Madrasas & Unreco. Sch.
Private schools
Private schools: Rural
Total Enrolment
Govt. schools: Rural
(2011-12)
9,327
764
232
8,553
466
1,497,015
10335
81
2,336
6
202,365
1
2489
2,454
11
1,534
1,198,782
35
3768
31
2,557
13
1503
1
1,557
249
0
989
295,755
0
0
0
0
0
0
0
Total Enrolment in Govt. sch.
Enrolment in Pvt. sch.
Enr. in Madrasas & Unreco.
Enr. in Govt. sch. : Rural
Enr. in Pvt. sch. : Rural
Total Teachers
Private teachers
Government teachers
Tch. in Madrasas & Unreco.
1,343,334
84,286
17506
1,148,242
42,924
44809
38,894
4,391
1293
P + UP P+UP+Sec/HS UP only UP + Sec/HS P+UP+Sec U.P. + Sec
208,025
972
664
194,141
9875
9,060
82
90
6
21,549
975,696
486,421
7,701
44409
871
42,808
6906
409
313
305,125
35907
0
175,991
12697
10
14,108
2101
0
207
0
0
170
0
0
0
0
Primary only Performance Indicators (in %)
Government schools
1703
3205
1,622
0
1,417
25
530,564
304,474
10,899
0
236,844
2,483
34025
28,196
935
0
22004
21300
14,988
6461
555
13,812
3,930
3724481
2,098,675
1,758,293
67,369
1,791,531
923,343
145,815
91,772
79,156
4,162
1.5 1.11.9 2.4
100.0 98.076.6 76.895.9 95.893.6 97.6
92.65 86.699.5 99.797.1 98.395.9 97.036.9 41.660.8 63.114.7 15.518.2 45.2
11-12 12-13
0.198.982.298.498.990.7
100.0
0.1
96.998.897.880.11.6
61.5
98.088.298.999.897.1
100.060.0
98.975.897.097.786.299.999.0
98.983.641.331.544.0
98.588.775.71.4
56.9
STATE ELEMENTARY EDUCATION REPORT CARD : 2012-13
22,004
Female literacy rate
13.0
0.066.8
%ST pop
%0-6 Population
Schools
20.2
34.8
7,522119
Total population in (000's)
Sex ratio85.4
% SC population
%Urban population
1,494 VillagesClusters
25353.1
877Male literacy rate 44212
Area (Sq. Km)
HARYANA
Key Data
0 0
1 1552
1430 61
38 00 1493
878 32
0 0
633 220347
376553 4555
6960 0
0 204603
212719 1971
0 0
8 14733
16412 420
353 0
(2011-12)
(2011-12)
Pupil-teacher ratio% Sch. having SMC
Student-classroom ratio Average tch per schoolFemale teachersEnr. in single-tch schools
Girls enrolmentEnr. in Govt. schools
284.3
45.91.1
93.0
99.0
49.8
32228.4
60.50.00.5
39.7
38.223
264.0
34.64.7
98.852.5
91.920
253.7
34.16.9
99.5
98.7
53.3
2346.2
2724
11.859.00.01.9
38.82.1
43.7
39.0
2329
16.863.00.0
209.0
62.80.00.1
33.3
40.0
21324.3
45.90.8
93.749.3
90.733
2810.641.90.0
96.049.0
90.616 22
14.7 15.390.1 97.8
2627 276.8 8.0
49.5 51.20.6 0.8
57.3 53.545.3 45.3
96.91132
17.143.20.0
96.548.2
48.0 98.32326
11.459.60.10.2
39.3
15309.4
36.90.1
98.051.0
% Sch. with <=50 students 21.1 21.9 4.7 6.9 1.9 4.3 27.7 26.9 3.8 3.1 3.5 6.4#
Upper Primary Level 670430 31.8 27.2 12.1
1343043Primary Level
Facilities Text books
13.6 22.5 27.1
Residential% Enr. in Pre-Pry.
17.5Sch with No female tch. 27.0 26.5 6.1 4.4 2.9 1.6 27.4 28.2 10.3 4.5 18.8
34.7
% Sch with SCR > % Sch with PTR >Ratio of Grade V to Grade I
58.1 Primary Upper Primary 99.4
30 at Pr. 35 at U.P. 30 at Pr.
Pry. level Total Grossness Transition Rate (Prim. to Upper Prim.)
*
@ =Govt. only # =Govt. + Aided NR=Not Reported *Some totals may not match due to no response in classificatory data items
1.5 12.8
1469 1613
U.Pry.only
3265
1408
TransportStationary
1063715
537602143440
178997
AttendanceUniform
818612
408973
510690
268034
35 at U.P.(2011-12)
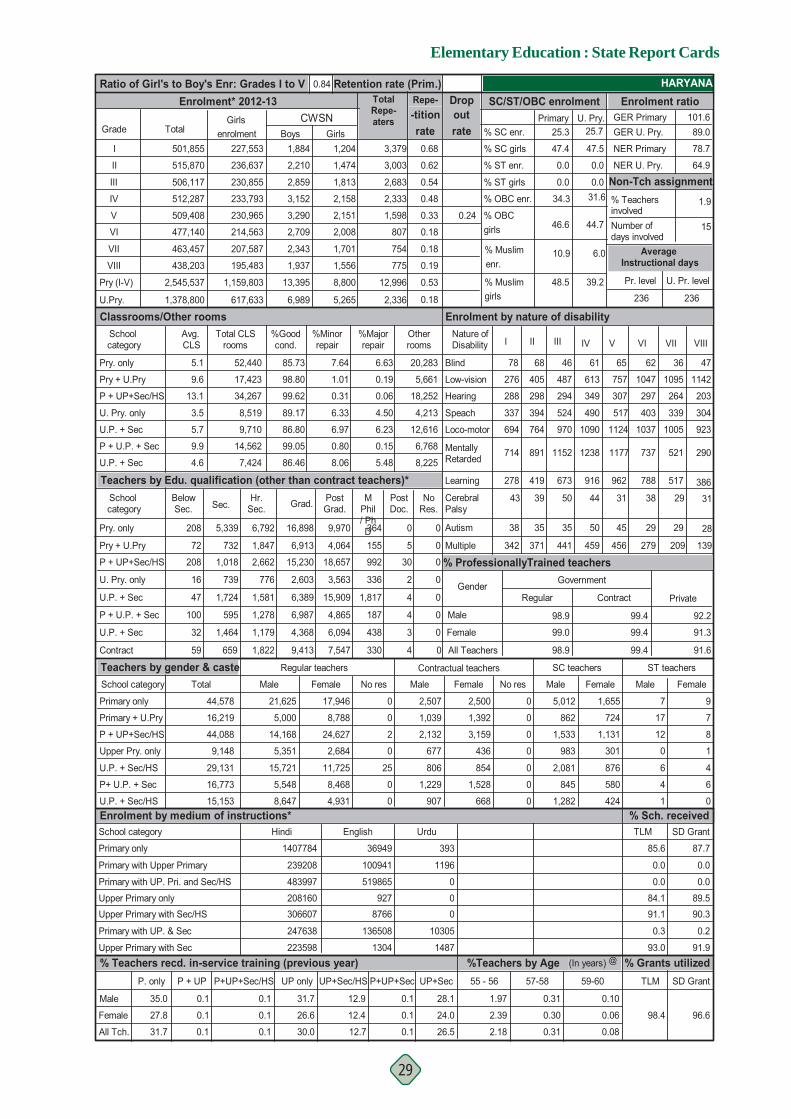
Elementary Education : State Report Cards
29
Retention rate (Prim.)
0.18
% Grants utilized%Teachers by Age (In years)
Enrolment* 2012-13 Ratio of Girl's to Boy's Enr: Grades I to V
Grade Total
I
II
III
IV
V
VI
VII
VIII
Pry (I-V)
U.P. + Sec
Pry + U.Pry
U. Pry. only
0
U.P. + Sec
P + U.P. + Sec
Contract
Primary only
Primary + U.Pry
P + UP+Sec/HS
Upper Pry. only
U.P. + Sec/HS
P+ U.P. + Sec
U.P. + Sec/HS
Teachers by gender & casteSchool category
School category
Primary only
Primary with Upper Primary
Primary with UP. Pri. and Sec/HS
Upper Primary onlyUpper Primary with Sec/HS
Primary with UP. & Sec
Upper Primary with Sec % Teachers recd. in-service training (previous year)
% Sch. received
HARYANA
@
SD Grant
% ProfessionallyTrained teachers
Regular Private
Male
Female
All Tch.
All Teachers
Female
Male
Contract
91.6
91.3
92.2
99.4
99.4
99.4
99.0
98.9
98.9
35.0
27.8
31.7
0.1
0.1
0.1
31.7
26.6
30.0
0.1
0.1
0.1
P+UP+Sec/HS UP only
12.9
12.7
12.4
P + UP+Sec/HS
72
208
16
47
100
32
59
1,018
739
1,724
595
1,464
659
2,662
776
1,581
1,278
1,179
1,822 9,413
4,368
6,987
6,389
2,603
15,230 18,657
3,563
15,909
4,865
6,094
7,547
992
336
1,817
187
438
330
30
2
4
4
3
4
0
0
0
0
0
44,088
9,148
29,131
16,773
15,153
44,578
Total
16,219
Enrolment by medium of instructions*
5,000
14,168
5,351
15,721
5,548
8,647
Male
21,625
Regular teachers
2,684
11,725
8,468
4,931
Female
17,946
8,788
24,627
0
2
0
25
0
0
No res
0 2,500
1,392
3,159
436
854
1,528
668
Female
2,507
1,039
2,132
677
806
1,229
907
Male
Contractual teachers
0
0
0
0
0
0
0
No res
5,012
862
1,533
983
2,081
845
SC teachers
Male
1,655
724
1,131
301
876
580
Female
ST teachers
7
17
12
0
6
4
1
Male Female
TLM
85.6
0.0
0.0
84.191.1
0.3
93.0
732 1,847 6,913 4,064 155 5 0
U.Pry.
Avg. CLS
School category
Pry. only
Pry + U.Pry
U. Pry. only
U.P. + Sec
P + U.P. + Sec
U.P. + Sec
%Majorrepair
%Minorrepair
7.64
1.01
0.31
6.33
6.97
%Goodcond.
85.73
98.80
99.62
89.17
86.80
Pry. only
Enrolment by nature of disability
9.6
13.1
3.5
5.7
4.6
9.9
5.1
99.05
86.46
0.80
8.06
Otherrooms
6.63
0.19
0.06
4.50
6.23
Teachers by Edu. qualification (other than contract teachers)*
Classrooms/Other rooms
0.15
5.48
P + UP+Sec/HS
208 5,339 6,792 16,898 9,970 364 0 0
School category Grad.Below
Sec. Sec.Hr.
Sec.PostGrad.
MPhil/ PhD
PostDoc.
NoRes.
0.1 28.1
0.1 24.0
0.1 26.5
501,855
515,870
506,117
512,287
509,408
477,140
463,457
438,203
2,545,537
1,378,800
outCWSN25.3
U. Pry.Primary GER Primaryrate % SC enr. GER U. Pry.
% SC girls
0.0 0.0% ST enr.
% ST girls
NER Primary
% TeachersinvolvedNumber ofdays involved
NER U. Pry.
Non-Tch assignment31.6% OBC enr.
0.24 % OBC girls
% Muslim 10.9 6.0enr.
% Muslim Pr. level
236
Average Instructional days
15
78.7
1.9
64.9
U. Pr. level
236
-titionTotalRepe-aters
rate3,379
3,003
2,683
2,333
1,598
807
754
775
12,996girls2,336
0.53
0.19
0.18
0.18
0.33
0.48
0.54
0.62
0.68
101.689.0
Repe- Drop SC/ST/OBC enrolment Enrolment ratio0.84
Total CLSrooms
52,440
17,423
34,267
8,519
9,710
14,562
7,424
20,283
5,661
18,252
4,213
12,616
6,768
8,225
V
65
757
307
517
1124
962
45
290
VIIIVII
737
VI
521
62 36 47
1047 1095 1142
297 264 203
403 339 304
9231037 1005
788 517 386
29 29 28
342 371 441 459 456 279 209 139
714 891 1152 1238
IVI II IIINature of Disability
78 68 46 61
276 405 487 613
288 298 294 349
337 394 524 490
764 970694 1090
278 419 673
38 35 35
916
50
2938 3143 39 50 44 31
1177
47.4
0.0
34.3
46.6
48.5 39.2
44.7
0.0
47.5
25.7
4241,282
9
7
8
1
4
6
0
87.7
0.0
0.0
89.590.3
0.2
91.9
Girlsenrolment
227,553
236,637
230,855
233,793
230,965
214,563
207,587
195,483
1,159,803
617,633
1,884
2,210
2,859
3,152
3,290
2,709
2,343
1,937
13,395
6,989
Boys1,204
1,474
1,813
2,158
2,151
2,008
1,701
1,556
8,800
5,265
Girls
Blind
Low-vision
Hearing
Speach
Loco-motor
MentallyRetarded
Learning
CerebralPalsy
Autism
Multiple
0.10
0.06
0.08
239208
483997
208160306607
247638
223598
Hindi
1407784 36949
100941
519865
9278766
136508
1304
English
10305
00
0
1196
393
Urdu
1487
0.31
0.30
0.31
1.97
2.39
2.18
Government
98.4 96.6
UP+Sec/HS P+UP+Sec UP+SecP + UPP. only 55 - 56 57-58 59-60 TLM SD Grant
Gender

Elementary Education in India: Where do we stand ?
30
% Sch. with Pre-Pry.
Dist. covered State codeUpper primary cycle Ratio of P. to U.P. schools/sections 2.08
12 02121 - 5 6 - 8
Total districtsPrimary cycleData reported from
Basic data : 2011
Decadal growth rateOverall literacy rate
Blocks/taluks
12.8
83.8
Primaryonly
All Schools
Pry. withU. Pry
UP withSec/H Sec & Sec
Pry. with UP UP withSec
Pry. with UP & Sec/H Sec Other Cat.
No Res. &Total
Sch. with drinking water Sch. providing MDMSch. with electricity Sch. with computers
Sch. with kitchen-shedSch. Estd. since 2001
#
Sch. with ramp
Sch aproachable by all roadSch. with play groundSch. with boundary wallSch. with girls toilets
Single-teacher schoolsSingle-classroom schools
Sch. with boys toilets
99.681.53.8
61.37.7
87.4
12-13
10.278.780.954.0
3.8
97.168.098.9
84.011.367.0
9.1
0.0
11-12
95.868.9
0.0100.0
0.3
91.495.399.9
96.7
11-12
0.3
79.612.850.851.678.9
97.7
66.83.8
46.349.9
99.5
1.8
11-12 12-13
80.453.2
5.7
48.9
2.0100.0
5.8
58.9
2.880.5
96.797.771.279.198.598.7
12-13 11-12
0.1
12-13 11-12
0.1
12-13
2.50.0
100.097.075.598.698.499.828.298.394.811.335.123.1
100.0
99.394.215.730.4
12-13
99.196.882.9
0.20.0
100.096.1
4.2
82.513.872.00.0
12-13
97.596.665.9
0.10.0
99.383.099.90.0
98.264.54.3
7.056.8
99.8
18.7
60.147.8
100.0
4.37.9
95.176.798.7
11-12
2.1
64.08.9
99.3
3.2
11-12
0.2100.084.359.5
1.1
99.289.199.5
96.051.3
Total Schools (Cur. Year) 11267 669 434 2281 0
Total Schools
Madrasas & Unreco. Sch.
Private schools
Private schools: Rural
Total Enrolment
Govt. schools: Rural
(2011-12)
10,619
646
2
10,376
589
427,089
11215
14
2,231
2
94,823
0
2275
2,279
2
291
225,124
0
1045
23
411
14
718
6
663
0
4
602
68,774
0
0
0
0
0
0
0
Total Enrolment in Govt. sch.
Enrolment in Pvt. sch.
Enr. in Madrasas & Unreco.
Enr. in Govt. sch. : Rural
Enr. in Pvt. sch. : Rural
Total Teachers
Private teachers
Government teachers
Tch. in Madrasas & Unreco.
381,083
24,639
62
365,055
21,117
28771
25,274
2,917
8
P + UP P+UP+Sec/HS UP only UP + Sec/HS P+UP+Sec U.P. + Sec
85,692
144
144
83,176
9393
9,208
14
0
0
9,023
133,360
81,968
4,793
9595
487
7,075
0
0
843
58,339
0
554
51,996
5507
56
5,553
0
0
0
0
0
0
0
0
0
0
Primary only Performance Indicators (in %)
Government schools
1349
2135
1,335
0
1,249
7
190,132
125,138
1,492
0
114,114
604
11880
22,670
171
0
17547
17388
15,111
2434
2
14,701
2,062
1005942
657,700
327,136
62
621,659
242,616
65,146
63,971
23,520
8
3.7 3.45.4 6.9
100.0 82.266.6 83.951.9 57.196.0 97.6
80.58 72.798.8 99.199.4 99.172.0 85.018.7 21.751.7 56.417.0 17.913.9 85.9
11-12 12-13
0.091.893.867.999.487.199.9
0.0
98.799.079.572.14.8
87.9
97.698.174.599.993.9
100.00.0
84.389.057.899.179.899.399.5
99.492.215.044.20.0
94.648.269.013.087.0
STATE ELEMENTARY EDUCATION REPORT CARD : 2012-13
17,547
Female literacy rate
11.1
5.776.6
%ST pop
%0-6 Population
Schools
25.2
10.0
10,024124
Total population in (000's)
Sex ratio90.8
% SC population
%Urban population
2,249 VillagesClusters
6856.5
974Male literacy rate 55673
Area (Sq. Km)
HIMACHAL PRADESH
Key Data
0 0
6 843
695 3
0 03 824
569 2
0 0
1205 54716
109110 52
0 0
517 53450
86757 30
0 0
81 6195
7772 18
0 0
(2011-12)
(2011-12)
Pupil-teacher ratio% Sch. having SMC
Student-classroom ratio Average tch per schoolFemale teachersEnr. in single-tch schools
Girls enrolmentEnr. in Govt. schools
122.5
44.95.8
93.9
96.4
50.0
14107.7
67.00.01.7
41.8
45.512
154.1
25.81.2
99.949.3
99.710
134.0
25.91.7
99.8
94.3
49.5
956.4
23159.2
66.20.03.9
41.16.3
54.2
41.9
1926
17.467.70.0
108.4
69.20.01.4
33.3
42.2
11132.6
44.84.4
94.249.9
99.815
195.6
32.70.1
99.049.4
99.616 11
63.4 65.999.6 95.7
1514 153.7 5.0
44.9 45.42.0 2.5
69.1 66.847.2 47.3
94.26
2716.936.90.0
98.849.0
33.3 95.71417
11.266.30.01.1
41.6
9217.3
32.50.2
99.950.3
% Sch. with <=50 students 77.3 79.6 24.2 25.1 7.4 4.4 72.2 77.7 21.3 19.2 7.3 37.8#
Upper Primary Level 264037 4.3 12.0 1.8
394368Primary Level
Facilities Text books
13.5 17.0 23.5
Residential% Enr. in Pre-Pry.
25.7Sch with No female tch. 32.3 31.3 0.4 0.0 0.6 0.5 36.6 34.5 23.7 4.2 28.6
4.5
% Sch with SCR > % Sch with PTR >Ratio of Grade V to Grade I
14.3 Primary Upper Primary 98.6
30 at Pr. 35 at U.P. 30 at Pr.
Pry. level Total Grossness Transition Rate (Prim. to Upper Prim.)
*
@ =Govt. only # =Govt. + Aided NR=Not Reported *Some totals may not match due to no response in classificatory data items
0.1 14.7
701 846
U.Pry.only
855
723
TransportStationary
65667
327119097
26629
AttendanceUniform
80326
5063
489
603
35 at U.P.(2011-12)

Elementary Education : State Report Cards
31
Retention rate (Prim.)
0.25
% Grants utilized%Teachers by Age (In years)
95.01
Enrolment* 2012-13 Ratio of Girl's to Boy's Enr: Grades I to V
Grade Total
I
II
III
IV
V
VI
VII
VIII
Pry (I-V)
U.P. + Sec
Pry + U.Pry
U. Pry. only
0
U.P. + Sec
P + U.P. + Sec
Contract
Primary only
Primary + U.Pry
P + UP+Sec/HS
Upper Pry. only
U.P. + Sec/HS
P+ U.P. + Sec
U.P. + Sec/HS
Teachers by gender & casteSchool category
School category
Primary only
Primary with Upper Primary
Primary with UP. Pri. and Sec/HS
Upper Primary onlyUpper Primary with Sec/HS
Primary with UP. & Sec
Upper Primary with Sec % Teachers recd. in-service training (previous year)
% Sch. received
HIMACHAL PRADESH
@
SD Grant
% ProfessionallyTrained teachers
Regular Private
Male
Female
All Tch.
All Teachers
Female
Male
Contract
90.8
89.6
93.5
86.5
87.1
86.3
96.3
95.8
95.4
85.6
73.4
80.1
0.9
0.9
0.9
80.4
79.5
80.1
0.9
0.8
0.8
P+UP+Sec/HS UP only
24.2
23.9
23.6
P + UP+Sec/HS
7
7
120
93
12
46
13
229
1,843
1,774
318
911
400
448
1,005
1,041
825
472
1,131 2,169
1,720
3,087
4,077
2,360
2,303 4,000
2,546
13,297
2,859
2,353
2,355
221
146
1,498
119
154
146
7
3
10
4
1
0
0
0
0
0
0
7,562
9,222
22,841
7,853
6,213
28,199
Total
5,609
Enrolment by medium of instructions*
1,554
2,350
5,993
13,773
2,429
3,843
Male
14,333
Regular teachers
2,030
8,017
4,795
1,814
Female
11,936
3,549
4,865
0
0
0
0
0
0
No res
4 739
330
251
361
411
415
205
Female
1,187
176
96
838
640
214
351
Male
Contractual teachers
0
0
0
0
0
0
0
No res
3,342
260
255
1,128
2,297
438
SC teachers
Male
1,576
435
345
336
1,097
481
Female
ST teachers
1,370
85
82
462
841
99
289
Male Female
TLM
93.5
0.0
1.4
96.296.8
0.4
98.6
286 737 2,215 1,795 62 1 0
U.Pry.
Avg. CLS
School category
Pry. only
Pry + U.Pry
U. Pry. only
U.P. + Sec
P + U.P. + Sec
U.P. + Sec
%Majorrepair
%Minorrepair
19.75
3.24
1.30
18.02
20.53
%Goodcond.
68.26
96.36
98.51
77.78
67.92
Pry. only
Enrolment by nature of disability
8.7
12.6
2.9
3.4
3.0
9.1
3.1
98.14
66.09
1.59
22.17
Otherrooms
11.99
0.39
0.18
4.20
11.55
Teachers by Edu. qualification (other than contract teachers)*
Classrooms/Other rooms
0.28
11.74
P + UP+Sec/HS
627 8,207 4,790 7,357 5,094 196 2 0
School category Grad.Below
Sec. Sec.Hr.
Sec.PostGrad.
MPhil/ PhD
PostDoc.
NoRes.
0.8 61.6
0.2 57.7
0.4 60.3
113,403
119,825
125,378
127,273
124,219
122,785
124,785
127,230
610,098
374,800
outCWSN28.1
U. Pry.Primary GER Primaryrate % SC enr. GER U. Pry.
0.15 % SC girls
% ST enr.
% ST girls
NER Primary
% TeachersinvolvedNumber ofdays involved
NER U. Pry.
Non-Tch assignment14.1% OBC enr.
1.11 % OBC
0.08 girls
% Muslim 1.7 1.6enr.
% Muslim Pr. level
247
Average Instructional days
17
86.7
13.9
75.3
U. Pr. level
246
-titionTotalRepe-aters
rate397
358
314
353
315
359
285
315
1,737girls959
0.28
0.23
0.23
0.29
0.25
0.29
0.25
0.29
0.33
104.598.3
Repe- Drop SC/ST/OBC enrolment Enrolment ratio0.91
Total CLSrooms
34,562
5,815
5,480
6,707
4,618
6,367
2,561
14,281
1,689
2,969
3,217
4,549
2,905
2,190
V
43
149
93
144
195
375
6
306
VIIIVII
405
VI
262
52 65 88
348 381 419
143 155 143
131 175 163
216187 160
312 355 278
3 4 5
193 118 137 138 110 80 75 86
280 296 353 448
IVI II IIINature of Disability
28 31 28 44
57 87 126 155
48 71 74 87
131 132 143 165
149 163139 183
140 268 400
5 3 8
420
10
1614 2074 35 24 27 22
388
48.8
5.648.8
12.8
47.2
47.7 44.1
46.1
48.35.9
48.3
27.6
301743
819
168
126
155
542
201
125
93.4
0.3
1.2
95.594.1
0.3
98.0
Girlsenrolment
53,621
56,877
59,907
60,575
58,886
57,901
58,220
59,448
289,866
175,569
647
692
879
987
929
979
945
1,012
4,134
2,936
Boys448
498
577
690
596
696
703
712
2,809
2,111
Girls
Blind
Low-vision
Hearing
Speach
Loco-motor
MentallyRetarded
Learning
CerebralPalsy
Autism
Multiple
0.01
0.01
0.01
10814
15363
6090691320
18584
36146
Hindi
264753 13111
30518
97749
1834327
55640
298
English
197
5032
90
241
19
Others
0
0
0
127
00
4732
673
Kashmiri Sanskrit
0
0
0
052
130
0
0.11
0.08
0.10
2.74
1.76
2.29
Government
95.6 91.4
UP+Sec/HS P+UP+Sec UP+SecP + UPP. only 55 - 56 57-58 59-60 TLM SD Grant
Gender
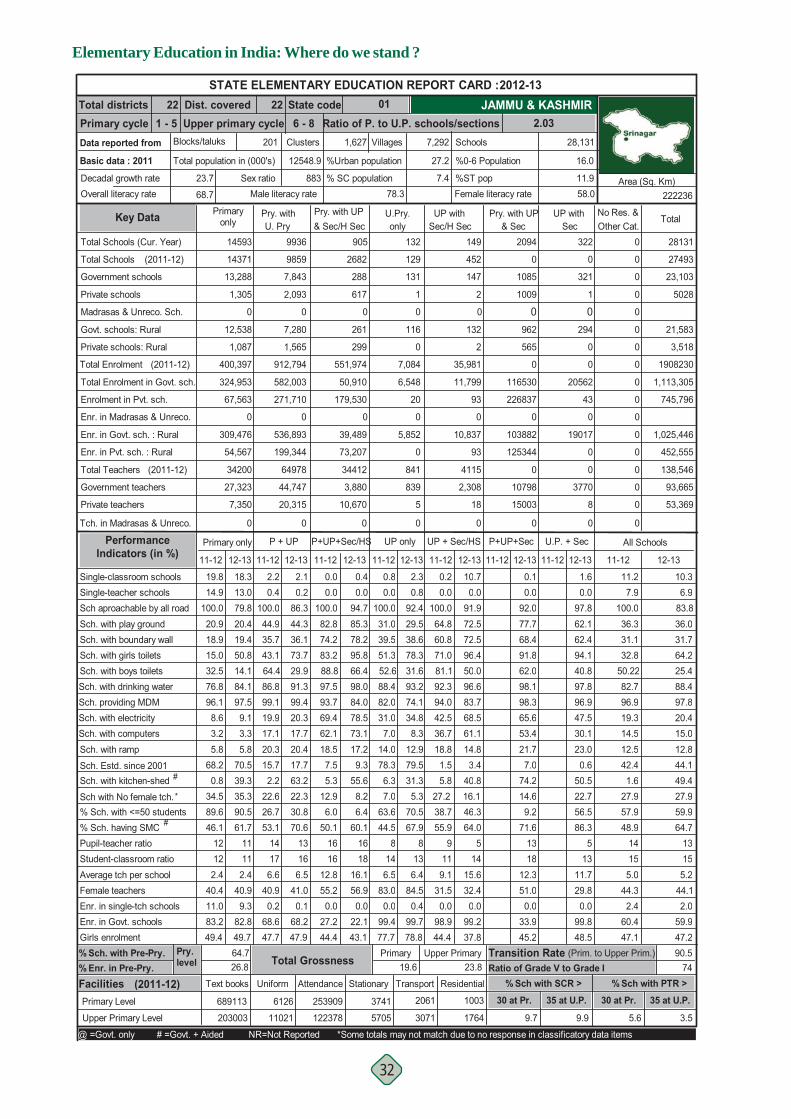
Elementary Education in India: Where do we stand ?
32
% Sch. with Pre-Pry.
Dist. covered State codeUpper primary cycle Ratio of P. to U.P. schools/sections 2.03
22 01221 - 5 6 - 8
Total districtsPrimary cycleData reported from
Basic data : 2011
Decadal growth rateOverall literacy rate
Blocks/taluks
23.7
68.7
Primaryonly
All Schools
Pry. withU. Pry
UP withSec/H Sec & Sec
Pry. with UP UP withSec
Pry. with UP & Sec/H Sec Other Cat.
No Res. &Total
Sch. with drinking water Sch. providing MDMSch. with electricity Sch. with computers
Sch. with kitchen-shedSch. Estd. since 2001
#
Sch. with ramp
Sch aproachable by all roadSch. with play groundSch. with boundary wallSch. with girls toilets
Single-teacher schoolsSingle-classroom schools
Sch. with boys toilets
97.59.13.35.8
70.539.3
12-13
13.079.820.419.4
18.3
50.814.184.1
17.120.315.7
99.1
2.2
11-12
44.935.7
0.4100.0
2.2
43.164.486.8
19.9
11-12
0.0
34.88.3
12.979.531.3
88.4
31.07.0
14.078.3
82.0
6.3
11-12 12-13
29.538.6
2.3
39.5
0.0100.0
0.8
31.0
0.892.4
78.351.331.652.693.274.1
12-13 11-12
0.1
12-13 11-12
0.0
12-13
1.60.0
100.082.874.283.288.897.593.769.462.118.57.55.3
98.0
78.573.117.29.3
55.6
12-13
94.785.378.2
0.40.0
95.866.4
84.0
17.720.417.763.2
12-13
86.344.336.1
2.10.2
73.729.991.399.420.38.6
3.2
68.25.8
96.1
0.8
20.918.9
100.0
19.814.9
15.032.576.8
11-12
10.7
18.81.5
94.0
5.8
11-12
0.0100.064.860.8
0.2
71.081.192.3
42.536.7
Total Schools (Cur. Year) 14593 9936 905 132 0
Total Schools
Madrasas & Unreco. Sch.
Private schools
Private schools: Rural
Total Enrolment
Govt. schools: Rural
(2011-12)
13,288
1,305
0
12,538
1,087
400,397
14371
2
116
0
7,084
0
129
131
1
299
551,974
0
2682
288
617
261
9859
7,843
2,093
0
7,280
1,565
912,794
0
0
0
0
0
0
0
Total Enrolment in Govt. sch.
Enrolment in Pvt. sch.
Enr. in Madrasas & Unreco.
Enr. in Govt. sch. : Rural
Enr. in Pvt. sch. : Rural
Total Teachers
Private teachers
Government teachers
Tch. in Madrasas & Unreco.
324,953
67,563
0
309,476
54,567
34200
27,323
7,350
0
P + UP P+UP+Sec/HS UP only UP + Sec/HS P+UP+Sec U.P. + Sec
6,548
20
0
5,852
841
839
5
0
0
50,910
179,530
73,207
39,489
34412
3,880
10,670
0
0
582,003
271,710
0
536,893
199,344
64978
44,747
20,315
0
0
0
0
0
0
0
0
0
0
Primary only Performance Indicators (in %)
Government schools
149
452
147
0
132
2
35,981
11,799
93
0
10,837
93
4115
2,308
18
0
28131
27493
23,103
5028
21,583
3,518
1908230
1,113,305
745,796
1,025,446
452,555
138,546
93,665
53,369
11.2 10.37.9 6.9
100.0 83.836.3 36.031.1 31.732.8 64.2
50.22 25.482.7 88.496.9 97.819.3 20.414.5 15.012.5 12.842.4 44.11.6 49.4
11-12 12-13
0.091.972.572.596.450.096.6
0.0
83.768.561.114.83.4
40.8
92.077.768.491.862.098.198.3
97.862.162.494.140.897.896.9
65.653.421.77.0
74.2
47.530.123.00.6
50.5
STATE ELEMENTARY EDUCATION REPORT CARD : 2012-13
28,131
Female literacy rate
16.0
11.958.0
%ST pop
%0-6 Population
Schools
7.4
27.2
7,292201
Total population in (000's)
Sex ratio78.3
% SC population
%Urban population
1,627 VillagesClusters
12548.9
883Male literacy rate 222236
Area (Sq. Km)
JAMMU & KASHMIR
Key Data
0 0
1085 321
1009 1
0 0962 294
565 0
0 0
116530 20562
226837 43
0 0
103882 19017
125344 0
0 0
10798 3770
15003 8
0 0
(2011-12)
(2011-12)
Pupil-teacher ratio% Sch. having SMC
Student-classroom ratio Average tch per schoolFemale teachersEnr. in single-tch schools
Girls enrolmentEnr. in Govt. schools
112.4
40.99.3
82.8
61.7
49.7
11176.6
40.90.2
68.647.7
53.114
146.5
83.00.0
99.477.7
44.58
136.4
84.50.4
99.7
67.9
78.8
850.1
1616
12.855.20.0
27.244.4
22.1
60.1
43.1
1618
16.156.90.0
166.5
41.00.1
68.2
70.6
47.9
13122.4
40.411.083.249.4
46.112
119.1
31.50.0
98.944.4
55.99 13
57.9 59.948.9 64.7
1415 155.0 5.2
44.3 44.12.4 2.0
60.4 59.947.1 47.2
64.05
1415.632.40.0
99.237.8
71.6 86.31318
12.351.00.0
33.945.2
513
11.729.80.0
99.848.5
% Sch. with <=50 students 89.6 90.5 26.7 30.8 6.0 6.4 63.6 70.5 38.7 46.3 9.2 56.5#
Upper Primary Level 203003 9.7 9.9 3.5
689113Primary Level
Facilities Text books
26.8 19.6 23.8 74 Residential
% Enr. in Pre-Pry.
27.9Sch with No female tch. 34.5 35.3 22.6 22.3 12.9 8.2 7.0 5.3 27.2 16.1 27.9
5.6
% Sch with SCR > % Sch with PTR >Ratio of Grade V to Grade I
64.7 Primary Upper Primary 90.5
30 at Pr. 35 at U.P. 30 at Pr.
Pry. level Total Grossness Transition Rate (Prim. to Upper Prim.)
*
@ =Govt. only # =Govt. + Aided NR=Not Reported *Some totals may not match due to no response in classificatory data items
14.6 22.7
2094 322
U.Pry.only
2061
3071
TransportStationary
3741
5705122378
253909
AttendanceUniform
6126
11021
1003
1764
35 at U.P.(2011-12)
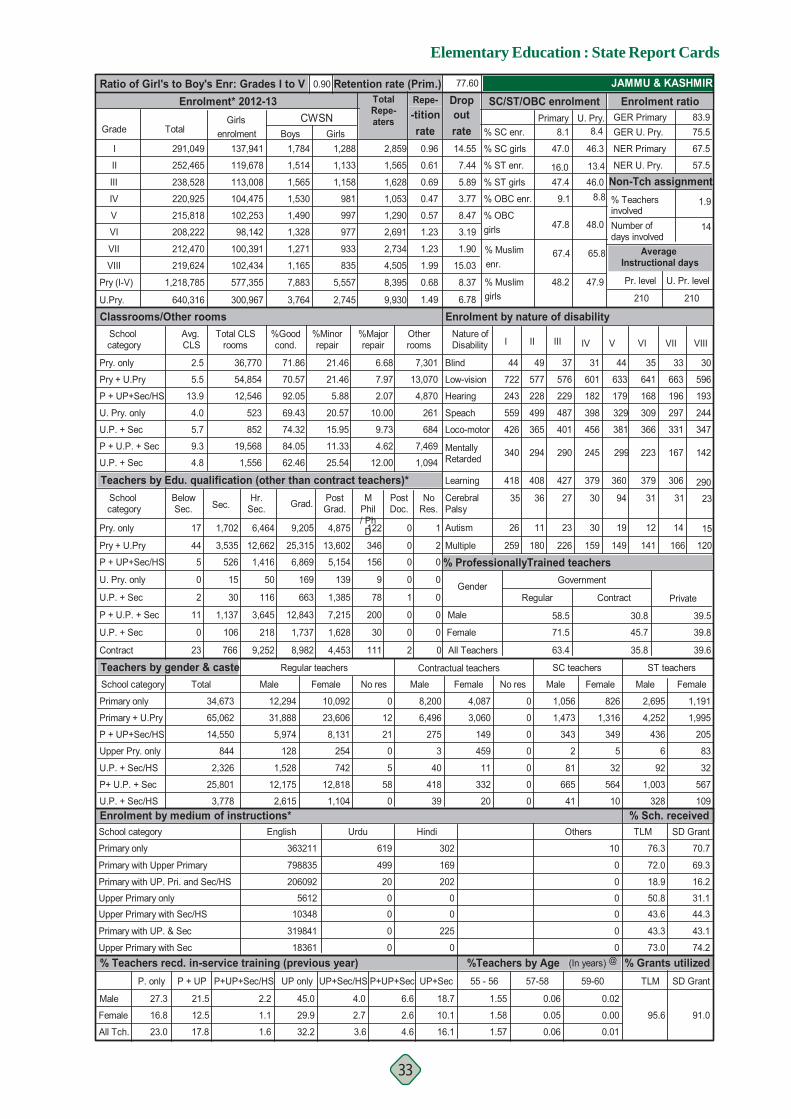
Elementary Education : State Report Cards
33
Retention rate (Prim.)
6.781.49
% Grants utilized%Teachers by Age (In years)
77.60
Enrolment* 2012-13 Ratio of Girl's to Boy's Enr: Grades I to V
Grade Total
I
II
III
IV
V
VI
VII
VIII
Pry (I-V)
U.P. + Sec
Pry + U.Pry
U. Pry. only
0
U.P. + Sec
P + U.P. + Sec
Contract
Primary only
Primary + U.Pry
P + UP+Sec/HS
Upper Pry. only
U.P. + Sec/HS
P+ U.P. + Sec
U.P. + Sec/HS
Teachers by gender & casteSchool category
School category
Primary only
Primary with Upper Primary
Primary with UP. Pri. and Sec/HS
Upper Primary onlyUpper Primary with Sec/HS
Primary with UP. & Sec
Upper Primary with Sec % Teachers recd. in-service training (previous year)
% Sch. received
JAMMU & KASHMIR
@
SD Grant
% ProfessionallyTrained teachers
Regular Private
Male
Female
All Tch.
All Teachers
Female
Male
Contract
39.6
39.8
39.5
35.8
45.7
30.8
71.5
63.4
58.5
27.3
16.8
23.0
21.5
12.5
17.8
45.0
29.9
32.2
1.1
1.6
2.2
P+UP+Sec/HS UP only
4.0
3.6
2.7
P + UP+Sec/HS
44
5
0
2
11
0
23
526
15
30
1,137
106
766
1,416
50
116
3,645
218
9,252 8,982
1,737
12,843
663
169
6,869 5,154
139
1,385
7,215
1,628
4,453
156
9
78
200
30
111
0
0
1
0
0
2
0
0
0
0
0
14,550
844
2,326
25,801
3,778
34,673
Total
65,062
Enrolment by medium of instructions*
31,888
5,974
128
1,528
12,175
2,615
Male
12,294
Regular teachers
254
742
12,818
1,104
Female
10,092
23,606
8,131
12
21
0
5
58
0
No res
0 4,087
3,060
149
459
11
332
20
Female
8,200
6,496
275
3
40
418
39
Male
Contractual teachers
0
0
0
0
0
0
0
No res
1,056
1,473
343
2
81
665
SC teachers
Male
826
1,316
349
5
32
564
Female
ST teachers
2,695
4,252
436
6
92
1,003
328
Male Female
TLM
76.3
72.0
18.9
50.843.6
43.3
73.0
3,535 12,662 25,315 13,602 346 0 2
U.Pry.
Avg. CLS
School category
Pry. only
Pry + U.Pry
U. Pry. only
U.P. + Sec
P + U.P. + Sec
U.P. + Sec
%Majorrepair
%Minorrepair
21.46
21.46
5.88
20.57
15.95
%Goodcond.
71.86
70.57
92.05
69.43
74.32
Pry. only
Enrolment by nature of disability
5.5
13.9
4.0
5.7
4.8
9.3
2.5
84.05
62.46
11.33
25.54
Otherrooms
6.68
7.97
2.07
10.00
9.73
Teachers by Edu. qualification (other than contract teachers)*
Classrooms/Other rooms
4.62
12.00
P + UP+Sec/HS
17 1,702 6,464 9,205 4,875 122 0 1
School category Grad.Below
Sec. Sec.Hr.
Sec.PostGrad.
MPhil/ PhD
PostDoc.
NoRes.
6.6 18.7
2.6 10.1
4.6 16.1
291,049
252,465
238,528
220,925
215,818
208,222
212,470
219,624
1,218,785
640,316
outCWSN8.1
U. Pry.Primary GER Primaryrate % SC enr. GER U. Pry.
14.55
7.44
5.89
% SC girls
% ST enr.
% ST girls
NER Primary
% TeachersinvolvedNumber ofdays involved
NER U. Pry.
Non-Tch assignment3.77 8.8% OBC enr.
8.47 % OBC
3.19 girls
1.90 % Muslim 67.4 65.8enr.
8.37 % Muslim Pr. level
210
Average Instructional days
14
67.5
1.9
57.5
U. Pr. level
210
-titionTotalRepe-aters
rate2,859
1,565
1,628
1,053
1,290
2,691
2,734
4,505
8,395girls9,930
0.68
1.99
1.23
1.23
0.57
0.47
0.69
0.61
0.96
15.03
83.975.5
Repe- Drop SC/ST/OBC enrolment Enrolment ratio0.90
Total CLSrooms
36,770
54,854
12,546
523
852
19,568
1,556
7,301
13,070
4,870
261
684
7,469
1,094
V
44
633
179
329
381
360
19
142
VIIIVII
223
VI
167
35 33 30
641 663 596
168 196 193
309 297 244
347366 331
379 306 290
12 14 15
259 180 226 159 149 141 166 120
340 294 290 245
IVI II IIINature of Disability
44 49 37 31
722 577 576 601
243 228 229 182
559 499 487 398
365 401426 456
418 408 427
26 11 23
379
30
3131 2335 36 27 30 94
299
47.0
16.047.4
9.1
47.8
48.2 47.9
48.0
46.013.4
46.3
8.4
1041
1,191
1,995
205
83
32
567
109
70.7
69.3
16.2
31.144.3
43.1
74.2
Girlsenrolment
137,941
119,678
113,008
104,475
102,253
98,142
100,391
102,434
577,355
300,967
1,784
1,514
1,565
1,530
1,490
1,328
1,271
1,165
7,883
3,764
Boys1,288
1,133
1,158
981
997
977
933
835
5,557
2,745
Girls
Blind
Low-vision
Hearing
Speach
Loco-motor
MentallyRetarded
Learning
CerebralPalsy
Autism
Multiple
0.02
0.00
0.01
798835
206092
561210348
319841
18361
English
363211 619
499
20
00
0
0
Urdu
225
00
202
169
302
Hindi
0
Others
10
0
0
00
0
0
0.06
0.05
0.06
1.55
1.58
1.57
Government
95.6 91.0
UP+Sec/HS P+UP+Sec UP+SecP + UPP. only 55 - 56 57-58 59-60 TLM SD Grant
Gender

Elementary Education in India: Where do we stand ?
34
% Sch. with Pre-Pry.
Dist. covered State codeUpper primary cycle Ratio of P. to U.P. schools/sections 2.45
24 20241 - 5 6 - 8
Total districtsPrimary cycleData reported from
Basic data : 2011
Decadal growth rateOverall literacy rate
Blocks/taluks
22.3
67.6
Primaryonly
All Schools
Pry. withU. Pry
UP withSec/H Sec & Sec
Pry. with UP UP withSec
Pry. with UP & Sec/H Sec Other Cat.
No Res. &Total
Sch. with drinking water Sch. providing MDMSch. with electricity Sch. with computers
Sch. with kitchen-shedSch. Estd. since 2001
#
Sch. with ramp
Sch aproachable by all roadSch. with play groundSch. with boundary wallSch. with girls toilets
Single-teacher schoolsSingle-classroom schools
Sch. with boys toilets
97.34.73.3
32.769.341.5
12-13
19.740.527.516.0
1.3
81.457.888.2
8.950.810.2
98.9
42.7
11-12
30.934.3
2.4100.0
0.4
74.581.694.4
13.1
11-12
0.1
20.916.318.611.637.5
95.8
25.016.722.912.5
87.2
23.1
11-12 12-13
60.560.5
7.0
64.6
14.6100.0
4.2
62.5
16.379.1
88.156.550.061.995.396.9
12-13 11-12
0.3
12-13 11-12
3.0
12-13
2.90.6
100.056.767.282.086.196.188.051.845.930.613.742.1
96.2
73.565.620.816.643.0
12-13
78.371.979.2
0.11.0
91.777.9
66.2
9.851.611.565.5
12-13
57.032.333.1
0.32.5
86.964.394.498.814.44.4
3.4
68.730.1
97.6
23.9
26.217.9
100.0
1.719.2
63.671.487.0
11-12
0.8
11.326.3
58.1
29.3
11-12
1.4100.068.265.9
0.3
75.168.495.5
54.952.2
Total Schools (Cur. Year) 27539 14792 686 43 0
Total Schools
Madrasas & Unreco. Sch.
Private schools
Private schools: Rural
Total Enrolment
Govt. schools: Rural
(2011-12)
26,012
679
848
25,028
597
1,993,766
27070
112
19
10
11,600
11
48
20
12
218
866,339
157
1868
110
419
85
14874
12,872
762
1158
12,191
512
3,635,639
0
0
0
0
0
0
0
Total Enrolment in Govt. sch.
Enrolment in Pvt. sch.
Enr. in Madrasas & Unreco.
Enr. in Govt. sch. : Rural
Enr. in Pvt. sch. : Rural
Total Teachers
Private teachers
Government teachers
Tch. in Madrasas & Unreco.
1,723,979
81,801
86679
1,640,207
64,482
55841
50,471
2,104
4359
P + UP P+UP+Sec/HS UP only UP + Sec/HS P+UP+Sec U.P. + Sec
5,870
2,404
2,022
5,773
226
111
39
1458
41
56,290
341,773
123,221
31,854
23721
1,557
9,171
63933
1881
2,909,109
303,474
282409
2,674,322
193,336
78905
63,077
6,138
9401
1,393
1,662
820
822
1,650
0
0
0
0
Primary only Performance Indicators (in %)
Government schools
485
975
353
20
281
82
152,915
36,875
31,579
2965
28,291
23,119
8073
2,719
1,045
159
45760
44835
40,674
2583
2503
38,825
1,828
6660259
5,144,565
959,946
513,939
4,771,609
529,945
166,766
126,804
24,831
18,874
1.1 0.912.4 12.8
100.0 48.530.0 31.326.5 25.068.2 83.7
75.36 60.890.0 90.897.1 96.810.4 11.18.1 8.3
36.6 38.646.0 46.830.6 49.6
11-12 12-13
2.576.360.469.988.464.994.8
1.0
40.062.365.613.052.020.6
73.747.152.489.973.496.694.0
80.169.665.182.558.093.459.6
34.127.143.99.7
70.1
46.039.311.014.820.2
STATE ELEMENTARY EDUCATION REPORT CARD : 2012-13
45,760
Female literacy rate
15.9
26.256.2
%ST pop
%0-6 Population
Schools
12.1
24.1
27,844260
Total population in (000's)
Sex ratio78.5
% SC population
%Urban population
2,278 VillagesClusters
32966.2
947Male literacy rate 79714
Area (Sq. Km)
JHARKHAND
Key Data
0 0
1114 193
267 332
241 681073 148
157 252
0 0
391604 19445
130261 66992
67095 8580
376678 13662
73727 48388
0 0
7787 1082
3457 2877
2562 471
(2011-12)
(2011-12)
Pupil-teacher ratio% Sch. having SMC
Student-classroom ratio Average tch per schoolFemale teachersEnr. in single-tch schools
Girls enrolmentEnr. in Govt. schools
242.1
29.815.791.1
97.8
49.8
33375.3
28.81.1
87.049.7
85.846
454.7
28.36.3
66.043.5
82.151
414.4
23.64.9
60.3
90.6
42.6
5178.4
3734
12.743.10.3
37.344.9
12.2
70.0
43.9
3740
18.448.20.7
335.3
29.41.2
83.2
98.3
49.8
44282.1
29.815.092.049.8
85.636
198.3
39.60.8
41.255.3
74.019 39
22.7 25.885.3 97.2
4033 303.7 3.7
31.7 31.75.2 5.3
80.9 77.749.2 49.4
69.518218.1
45.51.2
51.659.9
93.6 63.443398.5
33.61.0
66.548.0
21267.5
33.31.6
20.551.8
% Sch. with <=50 students 35.1 40.1 3.2 3.2 2.3 2.2 6.3 16.3 15.5 18.6 1.6 27.8#
Upper Primary Level 1377970 38.1 40.0 60.6
3235354Primary Level
Facilities Text books
5.0 11.7 17.0 84 Residential
% Enr. in Pre-Pry.
40.6Sch with No female tch. 43.3 43.1 40.2 39.6 22.5 16.2 10.4 16.3 21.0 15.3 40.9
60.7
% Sch with SCR > % Sch with PTR >Ratio of Grade V to Grade I
5.7 Primary Upper Primary 78.7
30 at Pr. 35 at U.P. 30 at Pr.
Pry. level Total Grossness Transition Rate (Prim. to Upper Prim.)
*
@ =Govt. only # =Govt. + Aided NR=Not Reported *Some totals may not match due to no response in classificatory data items
30.1 27.8
1622 593
U.Pry.only
2691
12901
TransportStationary
48142
63530756568
1751759
AttendanceUniform
104103
41895
4997
5483
35 at U.P.(2011-12)

Elementary Education : State Report Cards
35
Retention rate (Prim.)
7.081.09
% Grants utilized%Teachers by Age (In years)
60.17
Enrolment* 2012-13 Ratio of Girl's to Boy's Enr: Grades I to V
Grade Total
I
II
III
IV
V
VI
VII
VIII
Pry (I-V)
U.P. + Sec
Pry + U.Pry
U. Pry. only
0
U.P. + Sec
P + U.P. + Sec
Contract
Primary only
Primary + U.Pry
P + UP+Sec/HS
Upper Pry. only
U.P. + Sec/HS
P+ U.P. + Sec
U.P. + Sec/HS
Teachers by gender & casteSchool category
School category
Primary only
Primary with Upper Primary
Primary with UP. Pri. and Sec/HS
Upper Primary onlyUpper Primary with Sec/HS
Primary with UP. & Sec
Upper Primary with Sec % Teachers recd. in-service training (previous year)
% Sch. received
JHARKHAND
@
SD Grant
% ProfessionallyTrained teachers
Regular Private
Male
Female
All Tch.
All Teachers
Female
Male
Contract
65.0
68.0
62.0
72.5
75.7
71.5
94.6
94.9
95.0
38.5
34.8
37.4
33.3
27.3
31.5
19.9
28.9
22.0
0.7
1.5
2.2
P+UP+Sec/HS UP only
1.0
1.8
2.7
P + UP+Sec/HS
673
134
1
23
100
38
1,040
404
25
50
833
130
2,203
1,102
19
79
1,612
251
26,121 46,504
2,307
5,063
1,404
87
5,323 4,765
41
1,741
2,548
1,458
7,163
312
0
129
95
60
283
2
0
1
1
1
3
0
0
0
0
0
12,609
191
3,923
13,806
4,430
56,934
Total
78,616
Enrolment by medium of instructions*
25,965
6,205
135
1,990
6,471
2,823
Male
10,405
Regular teachers
38
1,437
3,781
1,422
Female
6,251
14,432
5,837
0
0
0
0
0
0
No res
0 10,712
8,686
237
7
347
863
54
Female
29,566
29,533
330
11
149
2,691
131
Male
Contractual teachers
0
0
0
0
0
0
0
No res
3,936
4,928
283
5
97
762
SC teachers
Male
923
1,151
176
0
98
181
Female
ST teachers
11,239
8,952
420
31
256
1,300
600
Male Female
TLM
87.3
83.9
11.4
55.88.9
61.9
12.6
5,349 8,180 17,814 8,048 328 5 0
U.Pry.
Avg. CLS
School category
Pry. only
Pry + U.Pry
U. Pry. only
U.P. + Sec
P + U.P. + Sec
U.P. + Sec
%Majorrepair
%Minorrepair
6.42
7.65
3.93
6.64
4.91
%Goodcond.
87.78
84.53
93.76
85.89
88.56
Pry. only
Enrolment by nature of disability
7.1
16.8
5.6
6.9
6.1
9.4
2.9
87.20
82.05
6.35
9.04
Otherrooms
5.80
7.82
2.32
7.47
6.53
Teachers by Edu. qualification (other than contract teachers)*
Classrooms/Other rooms
6.45
8.91
P + UP+Sec/HS
520 3,102 4,088 6,662 2,150 131 3 0
School category Grad.Below
Sec. Sec.Hr.
Sec.PostGrad.
MPhil/ PhD
PostDoc.
NoRes.
20.2 0.8
11.8 0.5
17.4 0.7
1,025,783
955,146
911,144
896,498
864,562
683,846
660,330
621,141
4,653,133
1,965,317
outCWSN15.1
U. Pry.Primary GER Primaryrate % SC enr. GER U. Pry.
8.65
2.17
4.72
% SC girls
% ST enr.
% ST girls
NER Primary
% TeachersinvolvedNumber ofdays involved
NER U. Pry.
Non-Tch assignment3.15 49.0% OBC enr.
19.44 % OBC
3.64 girls
1.13 % Muslim 13.8 13.7enr.
7.51 % Muslim Pr. level
253
Average Instructional days
16
97.3
1.5
68.5
U. Pr. level
253
-titionTotalRepe-aters
rate92,751
23,466
18,874
15,471
15,123
7,752
6,737
6,297
165,685girls20,786
3.49
1.06
1.07
1.13
1.76
1.73
2.00
2.51
8.27
17.39
110.282.5
Repe- Drop SC/ST/OBC enrolment Enrolment ratio0.96
Total CLSrooms
79,278
104,755
11,535
240
3,350
15,192
3,646
41,595
33,984
4,773
98
2,930
5,840
2,114
V
391
1810
1192
1238
2239
471
74
365
VIIIVII
593
VI
493
93 107 98
1324 1223 1272
696 631 575
742 604 553
13001373 1309
198 121 146
27 20 18
842 720 606 495 477 258 180 152
1544 1480 1439 1229
IVI II IIINature of Disability
431 336 275 310
1747 1857 1957 1815
1353 1413 1327 1325
1783 1665 1579 1349
2005 22132101 2244
686 1193 795
84 79 66
602
70
5170 47396 301 278 244 177
1126
49.0
30.049.0
44.4
50.0
49.7 52.2
51.2
49.825.3
49.2
13.4
23100
6,782
7,531
734
19
672
1,253
775
88.1
84.6
12.4
53.513.2
62.9
16.7
Girlsenrolment
499,442
466,890
447,494
442,974
427,650
342,282
331,283
309,353
2,284,450
982,918
6,340
6,093
6,037
5,362
4,858
2,890
2,548
2,368
28,690
7,806
Boys4,627
4,956
4,498
4,321
4,337
2,484
2,191
2,158
22,739
6,833
Girls
Blind
Low-vision
Hearing
Speach
Loco-motor
MentallyRetarded
Learning
CerebralPalsy
Autism
Multiple
0.33
0.21
0.29
3126721
155613
892764394
489557
86141
Hindi
1766513 48189
156416
281292
1453557
70802
3606
English
13423
7520
11532
97844
23001
Urdu
747
13547
30714
323
277152
2926
1281
Bengali Others
4615
14953
2615
0257
3499
166
2.95
1.89
2.61
3.05
2.22
2.79
Government
95.5 95.2
UP+Sec/HS P+UP+Sec UP+SecP + UPP. only 55 - 56 57-58 59-60 TLM SD Grant
Gender
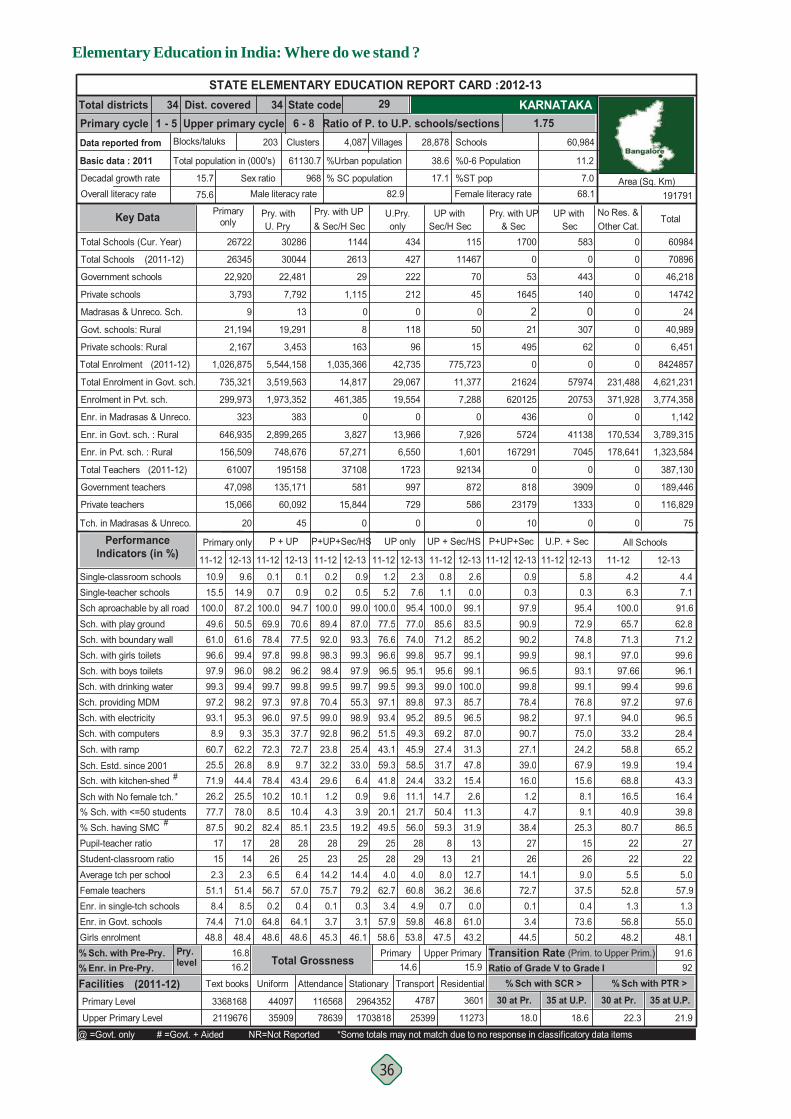
Elementary Education in India: Where do we stand ?
36
% Sch. with Pre-Pry.
Dist. covered State codeUpper primary cycle Ratio of P. to U.P. schools/sections 1.75
34 29341 - 5 6 - 8
Total districtsPrimary cycleData reported from
Basic data : 2011
Decadal growth rateOverall literacy rate
Blocks/taluks
15.7
75.6
Primaryonly
All Schools
Pry. withU. Pry
UP withSec/H Sec & Sec
Pry. with UP UP withSec
Pry. with UP & Sec/H Sec Other Cat.
No Res. &Total
Sch. with drinking water Sch. providing MDMSch. with electricity Sch. with computers
Sch. with kitchen-shedSch. Estd. since 2001
#
Sch. with ramp
Sch aproachable by all roadSch. with play groundSch. with boundary wallSch. with girls toilets
Single-teacher schoolsSingle-classroom schools
Sch. with boys toilets
98.295.39.3
62.226.844.4
12-13
14.987.250.561.6
9.6
99.496.099.4
35.372.38.9
97.3
78.4
11-12
69.978.4
0.7100.0
0.1
97.898.299.7
96.0
11-12
0.2
95.249.345.958.524.4
99.5
93.451.543.159.3
97.1
41.8
11-12 12-13
77.074.0
2.3
76.6
5.2100.0
1.2
77.5
7.695.4
99.896.695.196.599.389.8
12-13 11-12
0.9
12-13 11-12
0.3
12-13
5.80.2
100.089.492.098.398.499.570.499.092.823.832.229.6
99.7
98.996.225.433.06.4
12-13
99.087.093.3
0.90.5
99.397.9
55.3
37.772.79.7
43.4
12-13
94.770.677.5
0.10.9
99.896.299.897.897.593.1
8.9
25.560.7
97.2
71.9
49.661.0
100.0
10.915.5
96.697.999.3
11-12
2.6
27.431.7
97.3
33.2
11-12
1.1100.085.671.2
0.8
95.795.699.0
89.569.2
Total Schools (Cur. Year) 26722 30286 1144 434 0
Total Schools
Madrasas & Unreco. Sch.
Private schools
Private schools: Rural
Total Enrolment
Govt. schools: Rural
(2011-12)
22,920
3,793
9
21,194
2,167
1,026,875
26345
45
118
96
42,735
0
427
222
212
163
1,035,366
0
2613
29
1,115
8
30044
22,481
7,792
13
19,291
3,453
5,544,158
0
0
0
0
0
0
0
Total Enrolment in Govt. sch.
Enrolment in Pvt. sch.
Enr. in Madrasas & Unreco.
Enr. in Govt. sch. : Rural
Enr. in Pvt. sch. : Rural
Total Teachers
Private teachers
Government teachers
Tch. in Madrasas & Unreco.
735,321
299,973
323
646,935
156,509
61007
47,098
15,066
20
P + UP P+UP+Sec/HS UP only UP + Sec/HS P+UP+Sec U.P. + Sec
29,067
19,554
6,550
13,966
1723
997
729
0
0
14,817
461,385
57,271
3,827
37108
581
15,844
0
0
3,519,563
1,973,352
383
2,899,265
748,676
195158
135,171
60,092
45
231,488
371,928
0
170,534
178,641
0
0
0
0
Primary only Performance Indicators (in %)
Government schools
115
11467
70
0
50
15
775,723
11,377
7,288
0
7,926
1,601
92134
872
586
0
60984
70896
46,218
14742
24
40,989
6,451
8424857
4,621,231
3,774,358
1,142
3,789,315
1,323,584
387,130
189,446
116,829
75
4.2 4.46.3 7.1
100.0 91.665.7 62.871.3 71.297.0 99.6
97.66 96.199.4 99.697.2 97.694.0 96.533.2 28.458.8 65.219.9 19.468.8 43.3
11-12 12-13
0.099.183.585.299.199.1
100.0
0.3
85.796.587.031.347.815.4
97.990.990.299.996.599.878.4
95.472.974.898.193.199.176.8
98.290.727.139.016.0
97.175.024.267.915.6
STATE ELEMENTARY EDUCATION REPORT CARD : 2012-13
60,984
Female literacy rate
11.2
7.068.1
%ST pop
%0-6 Population
Schools
17.1
38.6
28,878203
Total population in (000's)
Sex ratio82.9
% SC population
%Urban population
4,087 VillagesClusters
61130.7
968Male literacy rate 191791
Area (Sq. Km)
KARNATAKA
Key Data
0 0
53 443
1645 140
2 021 307
495 62
0 0
21624 57974
620125 20753
436 0
5724 41138
167291 7045
0 0
818 3909
23179 1333
10 0
(2011-12)
(2011-12)
Pupil-teacher ratio% Sch. having SMC
Student-classroom ratio Average tch per schoolFemale teachersEnr. in single-tch schools
Girls enrolmentEnr. in Govt. schools
142.3
51.48.5
71.0
90.2
48.4
17266.5
56.70.2
64.848.6
82.428
284.0
62.73.4
57.958.6
49.525
294.0
60.84.9
59.8
56.0
53.8
2823.5
2823
14.275.70.13.7
45.33.1
19.2
46.1
2925
14.479.20.3
256.4
57.00.4
64.1
85.1
48.6
28152.3
51.18.4
74.448.8
87.517
138.0
36.20.7
46.847.5
59.38 27
40.9 39.880.7 86.5
2222 225.5 5.0
52.8 57.91.3 1.3
56.8 55.048.2 48.1
31.91321
12.736.60.0
61.043.2
38.4 25.32726
14.172.70.13.4
44.5
15269.0
37.50.4
73.650.2
% Sch. with <=50 students 77.7 78.0 8.5 10.4 4.3 3.9 20.1 21.7 50.4 11.3 4.7 9.1#
Upper Primary Level 2119676 18.0 18.6 21.9
3368168Primary Level
Facilities Text books
16.2 14.6 15.9 92 Residential
% Enr. in Pre-Pry.
16.4Sch with No female tch. 26.2 25.5 10.2 10.1 1.2 0.9 9.6 11.1 14.7 2.6 16.5
22.3
% Sch with SCR > % Sch with PTR >Ratio of Grade V to Grade I
16.8 Primary Upper Primary 91.6
30 at Pr. 35 at U.P. 30 at Pr.
Pry. level Total Grossness Transition Rate (Prim. to Upper Prim.)
*
@ =Govt. only # =Govt. + Aided NR=Not Reported *Some totals may not match due to no response in classificatory data items
1.2 8.1
1700 583
U.Pry.only
4787
25399
TransportStationary
2964352
170381878639
116568
AttendanceUniform
44097
35909
3601
11273
35 at U.P.(2011-12)
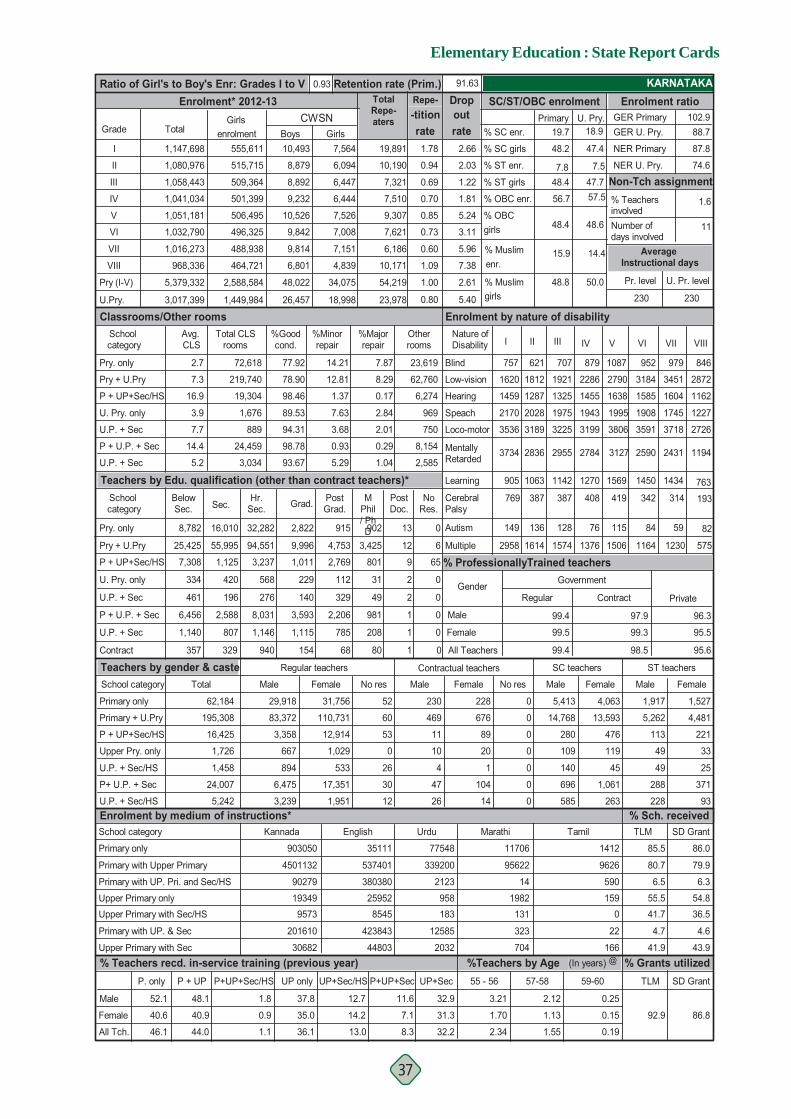
Elementary Education : State Report Cards
37
Retention rate (Prim.)
5.400.80
% Grants utilized%Teachers by Age (In years)
91.63
Enrolment* 2012-13 Ratio of Girl's to Boy's Enr: Grades I to V
Grade Total
I
II
III
IV
V
VI
VII
VIII
Pry (I-V)
U.P. + Sec
Pry + U.Pry
U. Pry. only
0
U.P. + Sec
P + U.P. + Sec
Contract
Primary only
Primary + U.Pry
P + UP+Sec/HS
Upper Pry. only
U.P. + Sec/HS
P+ U.P. + Sec
U.P. + Sec/HS
Teachers by gender & casteSchool category
School category
Primary only
Primary with Upper Primary
Primary with UP. Pri. and Sec/HS
Upper Primary onlyUpper Primary with Sec/HS
Primary with UP. & Sec
Upper Primary with Sec % Teachers recd. in-service training (previous year)
% Sch. received
KARNATAKA
@
SD Grant
% ProfessionallyTrained teachers
Regular Private
Male
Female
All Tch.
All Teachers
Female
Male
Contract
95.6
95.5
96.3
98.5
99.3
97.9
99.5
99.4
99.4
52.1
40.6
46.1
48.1
40.9
44.0
37.8
35.0
36.1
0.9
1.1
1.8
P+UP+Sec/HS UP only
12.7
13.0
14.2
P + UP+Sec/HS
25,425
7,308
334
461
6,456
1,140
357
1,125
420
196
2,588
807
329
3,237
568
276
8,031
1,146
940 154
1,115
3,593
140
229
1,011 2,769
112
329
2,206
785
68
801
31
49
981
208
80
9
2
2
1
1
1
65
0
0
0
0
16,425
1,726
1,458
24,007
5,242
62,184
Total
195,308
Enrolment by medium of instructions*
83,372
3,358
667
894
6,475
3,239
Male
29,918
Regular teachers
1,029
533
17,351
1,951
Female
31,756
110,731
12,914
60
53
0
26
30
12
No res
52 228
676
89
20
1
104
14
Female
230
469
11
10
4
47
26
Male
Contractual teachers
0
0
0
0
0
0
0
No res
5,413
14,768
280
109
140
696
SC teachers
Male
4,063
13,593
476
119
45
1,061
Female
ST teachers
1,917
5,262
113
49
49
288
228
Male Female
TLM
85.5
80.7
6.5
55.541.7
4.7
41.9
55,995 94,551 9,996 4,753 3,425 12 6
U.Pry.
Avg. CLS
School category
Pry. only
Pry + U.Pry
U. Pry. only
U.P. + Sec
P + U.P. + Sec
U.P. + Sec
%Majorrepair
%Minorrepair
14.21
12.81
1.37
7.63
3.68
%Goodcond.
77.92
78.90
98.46
89.53
94.31
Pry. only
Enrolment by nature of disability
7.3
16.9
3.9
7.7
5.2
14.4
2.7
98.78
93.67
0.93
5.29
Otherrooms
7.87
8.29
0.17
2.84
2.01
Teachers by Edu. qualification (other than contract teachers)*
Classrooms/Other rooms
0.29
1.04
P + UP+Sec/HS
8,782 16,010 32,282 2,822 915 902 13 0
School category Grad.Below
Sec. Sec.Hr.
Sec.PostGrad.
MPhil/ PhD
PostDoc.
NoRes.
11.6 32.9
7.1 31.3
8.3 32.2
1,147,698
1,080,976
1,058,443
1,041,034
1,051,181
1,032,790
1,016,273
968,336
5,379,332
3,017,399
outCWSN19.7
U. Pry.Primary GER Primaryrate % SC enr. GER U. Pry.
2.66
2.03
1.22
% SC girls
% ST enr.
% ST girls
NER Primary
% TeachersinvolvedNumber ofdays involved
NER U. Pry.
Non-Tch assignment1.81 57.5% OBC enr.
5.24 % OBC
3.11 girls
5.96 % Muslim 15.9 14.4enr.
2.61 % Muslim Pr. level
230
Average Instructional days
11
87.8
1.6
74.6
U. Pr. level
230
-titionTotalRepe-aters
rate19,891
10,190
7,321
7,510
9,307
7,621
6,186
10,171
54,219girls23,978
1.00
1.09
0.60
0.73
0.85
0.70
0.69
0.94
1.78
7.38
102.988.7
Repe- Drop SC/ST/OBC enrolment Enrolment ratio0.93
Total CLSrooms
72,618
219,740
19,304
1,676
889
24,459
3,034
23,619
62,760
6,274
969
750
8,154
2,585
V
1087
2790
1638
1995
3806
1569
115
1194
VIIIVII
2590
VI
2431
952 979 846
3184 3451 2872
1585 1604 1162
1908 1745 1227
27263591 3718
1450 1434 763
84 59 82
2958 1614 1574 1376 1506 1164 1230 575
3734 2836 2955 2784
IVI II IIINature of Disability
757 621 707 879
1620 1812 1921 2286
1459 1287 1325 1455
2170 2028 1975 1943
3189 32253536 3199
905 1063 1142
149 136 128
1270
76
314342 193769 387 387 408 419
3127
48.2
7.848.4
56.7
48.4
48.8 50.0
48.6
47.77.5
47.4
18.9
263585
1,527
4,481
221
33
25
371
93
86.0
79.9
6.3
54.836.5
4.6
43.9
Girlsenrolment
555,611
515,715
509,364
501,399
506,495
496,325
488,938
464,721
2,588,584
1,449,984
10,493
8,879
8,892
9,232
10,526
9,842
9,814
6,801
48,022
26,457
Boys7,564
6,094
6,447
6,444
7,526
7,008
7,151
4,839
34,075
18,998
Girls
Blind
Low-vision
Hearing
Speach
Loco-motor
MentallyRetarded
Learning
CerebralPalsy
Autism
Multiple
0.25
0.15
0.19
4501132
90279
193499573
201610
30682
Kannada
903050 35111
537401
380380
259528545
423843
44803
English
12585
183958
2123
339200
77548
Urdu
2032
11706
95622
14
1982131
323
704
Marathi Tamil
1412
9626
590
1590
22
166
2.12
1.13
1.55
3.21
1.70
2.34
Government
92.9 86.8
UP+Sec/HS P+UP+Sec UP+SecP + UPP. only 55 - 56 57-58 59-60 TLM SD Grant
Gender
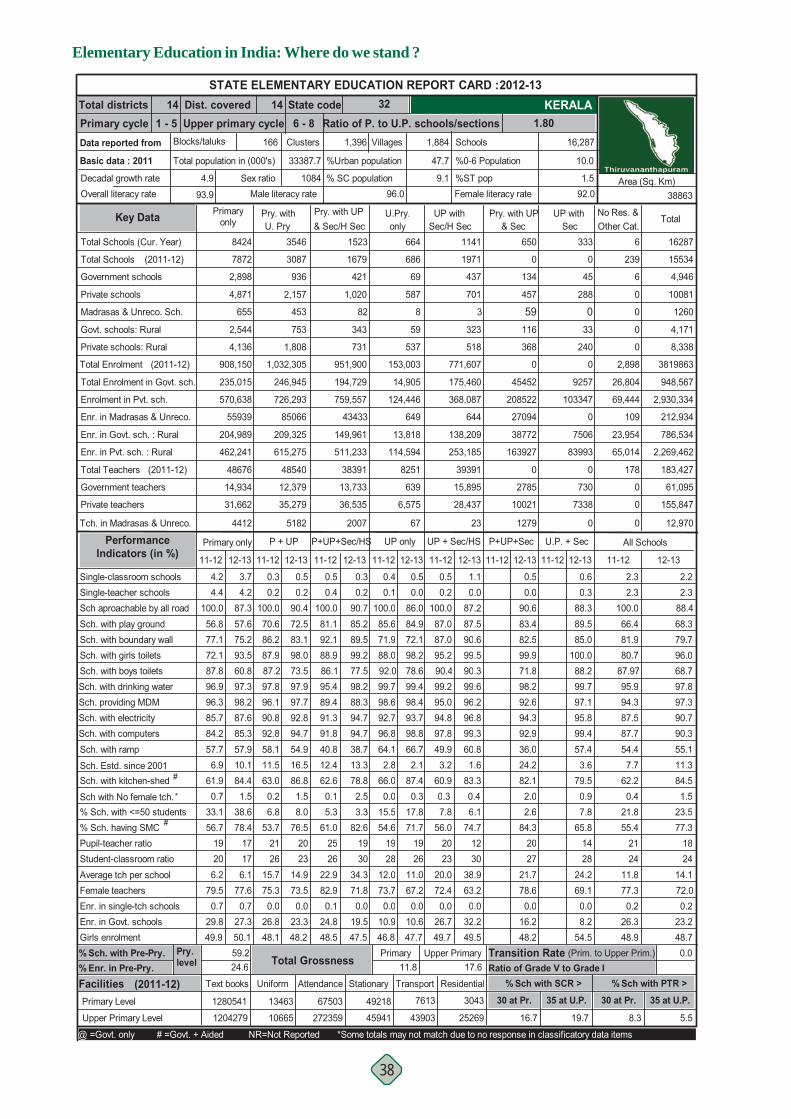
Elementary Education in India: Where do we stand ?
38
% Sch. with Pre-Pry.
Dist. covered State codeUpper primary cycle Ratio of P. to U.P. schools/sections 1.80
14 32141 - 5 6 - 8
Total districtsPrimary cycleData reported from
Basic data : 2011
Decadal growth rateOverall literacy rate
Blocks/taluks
4.9
93.9
Primaryonly
All Schools
Pry. withU. Pry
UP withSec/H Sec & Sec
Pry. with UP UP withSec
Pry. with UP & Sec/H Sec Other Cat.
No Res. &Total
Sch. with drinking water Sch. providing MDMSch. with electricity Sch. with computers
Sch. with kitchen-shedSch. Estd. since 2001
#
Sch. with ramp
Sch aproachable by all roadSch. with play groundSch. with boundary wallSch. with girls toilets
Single-teacher schoolsSingle-classroom schools
Sch. with boys toilets
98.287.685.357.910.184.4
12-13
4.287.357.675.2
3.7
93.560.897.3
92.858.111.5
96.1
63.0
11-12
70.686.2
0.2100.0
0.3
87.987.297.8
90.8
11-12
0.5
93.798.866.72.1
87.4
99.7
92.796.864.12.8
98.6
66.0
11-12 12-13
84.972.1
0.5
71.9
0.1100.0
0.4
85.6
0.086.0
98.288.078.692.099.498.4
12-13 11-12
0.5
12-13 11-12
0.3
12-13
0.60.4
100.081.192.188.986.195.489.491.391.840.812.462.6
98.2
94.794.738.713.378.8
12-13
90.785.289.5
0.30.2
99.277.5
88.3
94.754.916.586.8
12-13
90.472.583.1
0.50.2
98.073.597.997.792.885.7
84.2
6.957.7
96.3
61.9
56.877.1
100.0
4.24.4
72.187.896.9
11-12
1.1
49.93.2
95.0
60.9
11-12
0.2100.087.087.0
0.5
95.290.499.2
94.897.8
Total Schools (Cur. Year) 8424 3546 1523 664 6
Total Schools
Madrasas & Unreco. Sch.
Private schools
Private schools: Rural
Total Enrolment
Govt. schools: Rural
(2011-12)
2,898
4,871
655
2,544
4,136
908,150
7872
701
59
537
153,003
8
686
69
587
731
951,900
82
1679
421
1,020
343
3087
936
2,157
453
753
1,808
1,032,305
239
6
0
0
0
0
2,898
Total Enrolment in Govt. sch.
Enrolment in Pvt. sch.
Enr. in Madrasas & Unreco.
Enr. in Govt. sch. : Rural
Enr. in Pvt. sch. : Rural
Total Teachers
Private teachers
Government teachers
Tch. in Madrasas & Unreco.
235,015
570,638
55939
204,989
462,241
48676
14,934
31,662
4412
P + UP P+UP+Sec/HS UP only UP + Sec/HS P+UP+Sec U.P. + Sec
14,905
124,446
114,594
13,818
8251
639
6,575
649
67
194,729
759,557
511,233
149,961
38391
13,733
36,535
43433
2007
246,945
726,293
85066
209,325
615,275
48540
12,379
35,279
5182
26,804
69,444
109
23,954
65,014
178
0
0
0
Primary only Performance Indicators (in %)
Government schools
1141
1971
437
3
323
518
771,607
175,460
368,087
644
138,209
253,185
39391
15,895
28,437
23
16287
15534
4,946
10081
1260
4,171
8,338
3819863
948,567
2,930,334
212,934
786,534
2,269,462
183,427
61,095
155,847
12,970
2.3 2.22.3 2.3
100.0 88.466.4 68.381.9 79.780.7 96.0
87.97 68.795.9 97.894.3 97.387.5 90.787.7 90.354.4 55.17.7 11.3
62.2 84.5
11-12 12-13
0.087.287.590.699.590.399.6
0.0
96.296.899.360.81.6
83.3
90.683.482.599.971.898.292.6
88.389.585.0
100.088.299.797.1
94.392.936.024.282.1
95.899.457.43.6
79.5
STATE ELEMENTARY EDUCATION REPORT CARD : 2012-13
16,287
Female literacy rate
10.0
1.592.0
%ST pop
%0-6 Population
Schools
9.1
47.7
1,884166
Total population in (000's)
Sex ratio96.0
% SC population
%Urban population
1,396 VillagesClusters
33387.7
1084Male literacy rate 38863
Area (Sq. Km)
KERALA
Key Data
0 0
134 45
457 288
59 0116 33
368 240
0 0
45452 9257
208522 103347
27094 0
38772 7506
163927 83993
0 0
2785 730
10021 7338
1279 0
(2011-12)
(2011-12)
Pupil-teacher ratio% Sch. having SMC
Student-classroom ratio Average tch per schoolFemale teachersEnr. in single-tch schools
Girls enrolmentEnr. in Govt. schools
176.1
77.60.7
27.3
78.4
50.1
1726
15.775.30.0
26.848.1
53.721
2812.073.70.0
10.946.8
54.619
2611.067.20.0
10.6
71.7
47.7
1961.0
2526
22.982.90.1
24.848.5
19.5
82.6
47.5
1930
34.371.80.0
2314.973.50.0
23.3
76.5
48.2
20206.2
79.50.7
29.849.9
56.719
2320.072.40.0
26.749.7
56.020 18
21.8 23.555.4 77.3
2124 24
11.8 14.177.3 72.00.2 0.2
26.3 23.248.9 48.7
74.71230
38.963.20.0
32.249.5
84.3 65.82027
21.778.60.0
16.248.2
1428
24.269.10.08.2
54.5
% Sch. with <=50 students 33.1 38.6 6.8 8.0 5.3 3.3 15.5 17.8 7.8 6.1 2.6 7.8#
Upper Primary Level 1204279 16.7 19.7 5.5
1280541Primary Level
Facilities Text books
24.6 11.8 17.6
Residential% Enr. in Pre-Pry.
1.5Sch with No female tch. 0.7 1.5 0.2 1.5 0.1 2.5 0.0 0.3 0.3 0.4 0.4
8.3
% Sch with SCR > % Sch with PTR >Ratio of Grade V to Grade I
59.2 Primary Upper Primary 0.0
30 at Pr. 35 at U.P. 30 at Pr.
Pry. level Total Grossness Transition Rate (Prim. to Upper Prim.)
*
@ =Govt. only # =Govt. + Aided NR=Not Reported *Some totals may not match due to no response in classificatory data items
2.0 0.9
650 333
U.Pry.only
7613
43903
TransportStationary
49218
45941272359
67503
AttendanceUniform
13463
10665
3043
25269
35 at U.P.(2011-12)

Elementary Education : State Report Cards
39
Retention rate (Prim.)
0.58
% Grants utilized%Teachers by Age (In years)
94.28
Enrolment* 2012-13 Ratio of Girl's to Boy's Enr: Grades I to V
Grade Total
I
II
III
IV
V
VI
VII
VIII
Pry (I-V)
U.P. + Sec
Pry + U.Pry
U. Pry. only
0
U.P. + Sec
P + U.P. + Sec
Contract
Primary only
Primary + U.Pry
P + UP+Sec/HS
Upper Pry. only
U.P. + Sec/HS
P+ U.P. + Sec
U.P. + Sec/HS
Teachers by gender & casteSchool category
School category
Primary only
Primary with Upper Primary
Primary with UP. Pri. and Sec/HS
Upper Primary onlyUpper Primary with Sec/HS
Primary with UP. & Sec
Upper Primary with Sec % Teachers recd. in-service training (previous year)
% Sch. received
KERALA
@
SD Grant
% ProfessionallyTrained teachers
Regular Private
Male
Female
All Tch.
All Teachers
Female
Male
Contract
87.7
93.5
95.0
93.3
93.7
92.1
97.1
90.7
96.5
46.1
37.8
38.3
37.7
27.4
28.7
38.9
37.6
36.6
6.6
6.7
11.5
P+UP+Sec/HS UP only
11.7
10.3
11.5
P + UP+Sec/HS
793
719
68
341
201
49
116
3,393
1,482
3,814
1,055
918
731
12,327
1,724
9,099
3,143
1,497
980 1,565
3,864
6,216
16,897
3,056
18,503 15,708
673
12,891
2,959
1,544
901
784
25
791
219
110
107
11
0
9
5
0
0
0
0
0
0
0
52,275
7,281
44,355
14,085
8,068
51,008
Total
52,840
Enrolment by medium of instructions*
11,742
8,628
2,033
11,429
2,162
1,854
Male
9,746
Regular teachers
4,727
27,659
10,848
5,510
Female
38,695
37,809
36,932
1,940
5,885
268
4,754
788
618
No res
1,485 887
1,050
620
166
358
226
61
Female
193
298
208
86
151
61
24
Male
Contractual teachers
2
1
2
1
4
0
1
No res
427
440
535
43
576
144
SC teachers
Male
1,712
1,498
1,483
76
1,142
477
Female
ST teachers
195
201
173
22
158
45
20
Male Female
TLM
76.7
62.8
34.7
93.286.4
33.8
87.1
9,400 15,280 20,388 5,262 363 5 0
U.Pry.
Avg. CLS
School category
Pry. only
Pry + U.Pry
U. Pry. only
U.P. + Sec
P + U.P. + Sec
U.P. + Sec
%Majorrepair
%Minorrepair
20.52
14.04
7.25
19.84
13.70
%Goodcond.
74.24
80.75
89.95
76.88
80.10
Pry. only
Enrolment by nature of disability
12.7
21.9
8.1
16.1
12.0
15.8
6.0
89.89
81.74
7.10
15.03
Otherrooms
5.24
5.21
2.80
3.29
6.20
Teachers by Edu. qualification (other than contract teachers)*
Classrooms/Other rooms
3.02
3.23
P + UP+Sec/HS
878 9,085 22,156 14,779 2,842 183 3 0
School category Grad.Below
Sec. Sec.Hr.
Sec.PostGrad.
MPhil/ PhD
PostDoc.
NoRes.
13.2 20.6
10.9 21.1
10.6 19.3
488,285
480,079
487,342
501,843
513,809
530,507
547,794
542,176
2,471,358
1,620,477
outCWSN9.1
U. Pry.Primary GER Primaryrate % SC enr. GER U. Pry.
% SC girls
% ST enr.
% ST girls
NER Primary
% TeachersinvolvedNumber ofdays involved
NER U. Pry.
Non-Tch assignment62.7% OBC enr.
% OBC girls
% Muslim 32.0 30.5enr.
% Muslim Pr. level
194
Average Instructional days
11
86.0
2.3
80.1
U. Pr. level
195
-titionTotalRepe-aters
rate5,552
4,919
4,726
4,657
3,307
2,973
2,878
3,048
23,161girls8,899
1.01
0.61
0.55
0.58
0.67
0.99
1.04
1.11
1.29
97.597.1
Repe- Drop SC/ST/OBC enrolment Enrolment ratio0.95
Total CLSrooms
50,215
45,132
33,318
5,373
18,381
10,263
3,996
17,110
12,888
10,255
2,391
8,564
2,829
2,279
V
4114
8447
2139
988
1379
2939
171
4619
VIIIVII
4426
VI
4554
5025 5261 4486
9803 10067 9917
1955 2039 1866
910 725 610
13321468 1443
3310 3185 3010
132 100 96
1223 910 732 691 580 583 556 470
3793 3411 3751 3874
IVI II IIINature of Disability
1221 1601 2178 2872
2027 2922 3806 4816
930 1121 1163 1331
1854 1331 1137 1031
1184 12121191 1227
1304 2215 3100
492 357 233
3338
254
252240 277625 454 311 294 277
4074
48.6
2.148.2
63.6
49.0
49.0 48.6
48.7
47.71.9
48.1
9.8
8241
804
617
592
64
381
200
66
73.9
59.9
31.1
86.974.6
30.5
76.6
Girlsenrolment
238,305
235,003
237,859
245,042
249,870
257,777
267,023
262,647
1,206,079
787,447
8,701
9,025
10,299
11,391
14,123
15,152
15,314
14,882
53,539
45,348
Boys5,959
6,481
7,324
8,337
10,985
12,700
12,868
11,801
39,086
37,369
Girls
Blind
Low-vision
Hearing
Speach
Loco-motor
MentallyRetarded
Learning
CerebralPalsy
Autism
Multiple
0.04
0.02
0.02
638368
217137
109752337647
78272
66889
Malayalam
587402 217065
348167
674938
23498149423
168370
34299
English
11698
9112496
50502
30847
12387
Others
1249
5426
12144
3563
3793101
4732
1198
Kannada Tamil
4917
1402
2417
13132485
2069
663
0.09
0.06
0.07
0.22
0.13
0.15
Government
97.6 96.1
UP+Sec/HS P+UP+Sec UP+SecP + UPP. only 55 - 56 57-58 59-60 TLM SD Grant
Gender
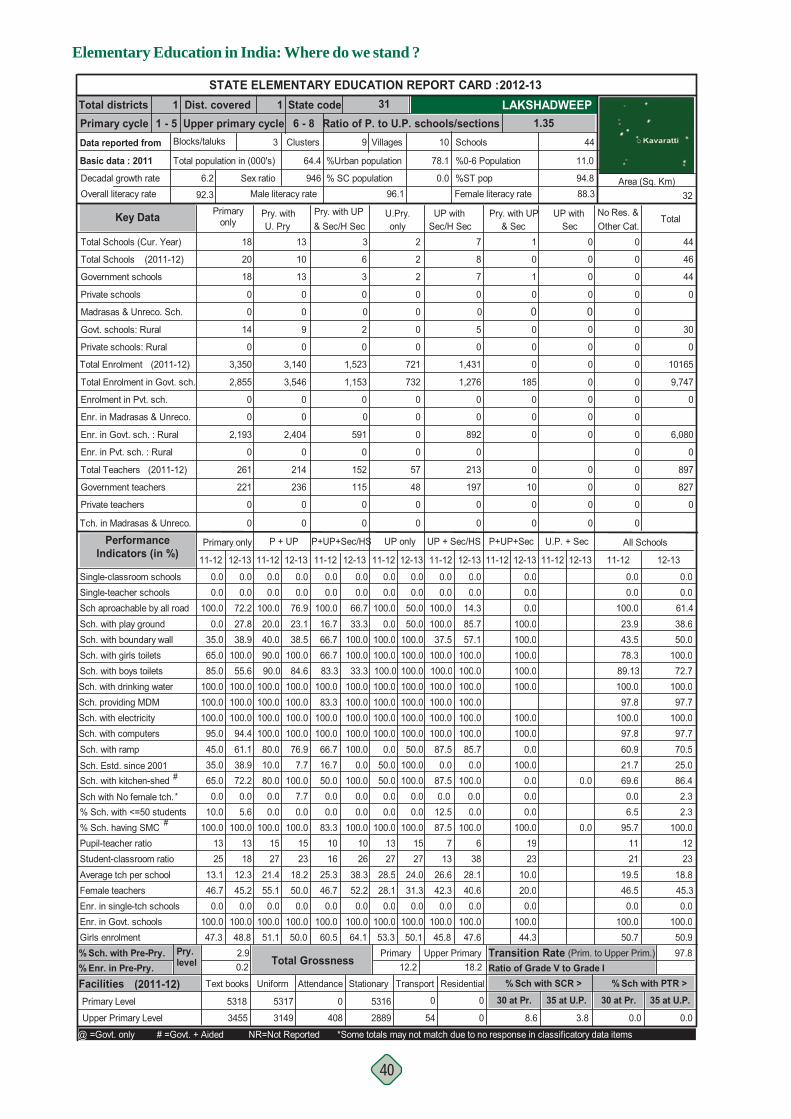
Elementary Education in India: Where do we stand ?
40
% Sch. with Pre-Pry.
Dist. covered State codeUpper primary cycle Ratio of P. to U.P. schools/sections 1.35
1 3111 - 5 6 - 8
Total districtsPrimary cycleData reported from
Basic data : 2011
Decadal growth rateOverall literacy rate
Blocks/taluks
6.2
92.3
Primaryonly
All Schools
Pry. withU. Pry
UP withSec/H Sec & Sec
Pry. with UP UP withSec
Pry. with UP & Sec/H Sec Other Cat.
No Res. &Total
Sch. with drinking water Sch. providing MDMSch. with electricity Sch. with computers
Sch. with kitchen-shedSch. Estd. since 2001
#
Sch. with ramp
Sch aproachable by all roadSch. with play groundSch. with boundary wallSch. with girls toilets
Single-teacher schoolsSingle-classroom schools
Sch. with boys toilets
100.0100.094.461.138.972.2
12-13
0.072.227.838.9
0.0
100.055.6
100.0
100.080.010.0
100.0
80.0
11-12
20.040.0
0.0100.0
0.0
90.090.0
100.0
100.0
11-12
0.0
100.0100.050.0
100.0100.0
100.0
100.0100.0
0.050.0
100.0
50.0
11-12 12-13
50.0100.0
0.0
100.0
0.0100.0
0.0
0.0
0.050.0
100.0100.0100.0100.0100.0100.0
12-13 11-12
0.0
12-13 11-12 12-13
0.0100.016.766.766.783.3
100.083.3
100.0100.066.716.750.0
100.0
100.0100.0100.0
0.0100.0
12-13
66.733.3
100.0
0.00.0
100.033.3
100.0
100.076.97.7
100.0
12-13
76.923.138.5
0.00.0
100.084.6
100.0100.0100.0100.0
95.0
35.045.0
100.0
65.0
0.035.0
100.0
0.00.0
65.085.0
100.0
11-12
0.0
87.50.0
100.0
87.5
11-12
0.0100.0100.037.5
0.0
100.0100.0100.0
100.0100.0
Total Schools (Cur. Year) 18 13 3 2 0
Total Schools
Madrasas & Unreco. Sch.
Private schools
Private schools: Rural
Total Enrolment
Govt. schools: Rural
(2011-12)
18
0
0
14
0
3,350
20
0
0
0
721
0
2
2
0
0
1,523
0
6
3
0
2
10
13
0
0
9
0
3,140
0
0
0
0
0
0
0
Total Enrolment in Govt. sch.
Enrolment in Pvt. sch.
Enr. in Madrasas & Unreco.
Enr. in Govt. sch. : Rural
Enr. in Pvt. sch. : Rural
Total Teachers
Private teachers
Government teachers
Tch. in Madrasas & Unreco.
2,855
0
0
2,193
0
261
221
0
0
P + UP P+UP+Sec/HS UP only UP + Sec/HS P+UP+Sec U.P. + Sec
732
0
0
0
57
48
0
0
0
1,153
0
0
591
152
115
0
0
0
3,546
0
0
2,404
0
214
236
0
0
0
0
0
0
0
0
0
0
0
Primary only Performance Indicators (in %)
Government schools
7
8
7
0
5
0
1,431
1,276
0
0
892
0
213
197
0
0
44
46
44
0
30
0
10165
9,747
0
6,080
0
897
827
0
0.0 0.00.0 0.0
100.0 61.423.9 38.643.5 50.078.3 100.0
89.13 72.7100.0 100.097.8 97.7
100.0 100.097.8 97.760.9 70.521.7 25.069.6 86.4
11-12 12-13
0.014.385.757.1
100.0100.0100.0
0.0
100.0100.0100.085.70.0
100.0
0.0100.0100.0100.0100.0100.0
100.0100.0
0.0100.0
0.0 0.0
STATE ELEMENTARY EDUCATION REPORT CARD : 2012-13
44
Female literacy rate
11.0
94.888.3
%ST pop
%0-6 Population
Schools
0.0
78.1
103
Total population in (000's)
Sex ratio96.1
% SC population
%Urban population
9 VillagesClusters
64.4
946Male literacy rate 32
Area (Sq. Km)
LAKSHADWEEP
Key Data
0 0
1 0
0 0
0 00 0
0 0
0 0
185 0
0 0
0 0
0 0
0 0
10 0
0 0
0 0
(2011-12)
(2011-12)
Pupil-teacher ratio% Sch. having SMC
Student-classroom ratio Average tch per schoolFemale teachersEnr. in single-tch schools
Girls enrolmentEnr. in Govt. schools
1812.345.20.0
100.0
100.0
48.8
1327
21.455.10.0
100.051.1
100.015
2728.528.10.0
100.053.3
100.013
2724.031.30.0
100.0
100.0
50.1
1583.3
1016
25.346.70.0
100.060.5
100.0
100.0
64.1
1026
38.352.20.0
2318.250.00.0
100.0
100.0
50.0
1525
13.146.70.0
100.047.3
100.013
1326.642.30.0
100.045.8
87.57 12
6.5 2.395.7 100.0
1121 23
19.5 18.846.5 45.30.0 0.0
100.0 100.050.7 50.9
100.06
3828.140.60.0
100.047.6
100.0 0.01923
10.020.00.0
100.044.3
% Sch. with <=50 students 10.0 5.6 0.0 0.0 0.0 0.0 0.0 0.0 12.5 0.0 0.0#
Upper Primary Level 3455 8.6 3.8 0.0
5318Primary Level
Facilities Text books
0.2 12.2 18.2
Residential% Enr. in Pre-Pry.
2.3Sch with No female tch. 0.0 0.0 0.0 7.7 0.0 0.0 0.0 0.0 0.0 0.0 0.0
0.0
% Sch with SCR > % Sch with PTR >Ratio of Grade V to Grade I
2.9 Primary Upper Primary 97.8
30 at Pr. 35 at U.P. 30 at Pr.
Pry. level Total Grossness Transition Rate (Prim. to Upper Prim.)
*
@ =Govt. only # =Govt. + Aided NR=Not Reported *Some totals may not match due to no response in classificatory data items
0.0
1 0
U.Pry.only
0
54
TransportStationary
5316
2889408
0
AttendanceUniform
5317
3149
0
0
35 at U.P.(2011-12)
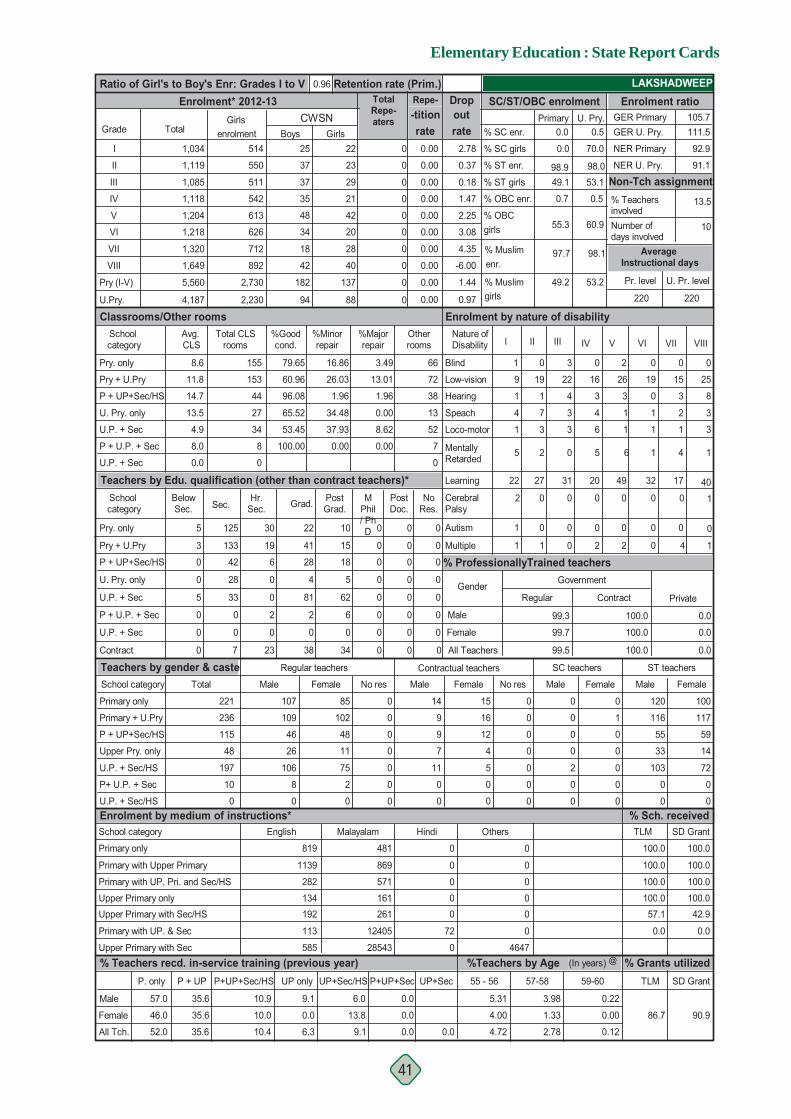
Elementary Education : State Report Cards
41
Retention rate (Prim.)
0.970.00
% Grants utilized%Teachers by Age (In years)
Enrolment* 2012-13 Ratio of Girl's to Boy's Enr: Grades I to V
Grade Total
I
II
III
IV
V
VI
VII
VIII
Pry (I-V)
U.P. + Sec
Pry + U.Pry
U. Pry. only
0
U.P. + Sec
P + U.P. + Sec
Contract
Primary only
Primary + U.Pry
P + UP+Sec/HS
Upper Pry. only
U.P. + Sec/HS
P+ U.P. + Sec
U.P. + Sec/HS
Teachers by gender & casteSchool category
School category
Primary only
Primary with Upper Primary
Primary with UP. Pri. and Sec/HS
Upper Primary onlyUpper Primary with Sec/HS
Primary with UP. & Sec
Upper Primary with Sec % Teachers recd. in-service training (previous year)
% Sch. received
LAKSHADWEEP
@
SD Grant
% ProfessionallyTrained teachers
Regular Private
Male
Female
All Tch.
All Teachers
Female
Male
Contract
0.0
0.0
0.0
100.0
100.0
100.0
99.7
99.5
99.3
57.0
46.0
52.0
35.6
35.6
35.6
9.1
0.0
6.3
10.0
10.4
10.9
P+UP+Sec/HS UP only
6.0
9.1
13.8
P + UP+Sec/HS
3
0
0
5
0
0
0
42
28
33
0
0
7
6
0
0
2
0
23 38
0
2
81
4
28 18
5
62
6
0
34
0
0
0
0
0
0
0
0
0
0
0
0
0
0
0
0
0
115
48
197
10
0
221
Total
236
Enrolment by medium of instructions*
109
46
26
106
8
0
Male
107
Regular teachers
11
75
2
0
Female
85
102
48
0
0
0
0
0
0
No res
0 15
16
12
4
5
0
0
Female
14
9
9
7
11
0
0
Male
Contractual teachers
0
0
0
0
0
0
0
No res
0
0
0
0
2
0
SC teachers
Male
0
1
0
0
0
0
Female
ST teachers
120
116
55
33
103
0
0
Male Female
TLM
100.0
100.0
100.0
100.057.1
0.0
133 19 41 15 0 0 0
U.Pry.
Avg. CLS
School category
Pry. only
Pry + U.Pry
U. Pry. only
U.P. + Sec
P + U.P. + Sec
U.P. + Sec
%Majorrepair
%Minorrepair
16.86
26.03
1.96
34.48
37.93
%Goodcond.
79.65
60.96
96.08
65.52
53.45
Pry. only
Enrolment by nature of disability
11.8
14.7
13.5
4.9
0.0
8.0
8.6
100.00 0.00
Otherrooms
3.49
13.01
1.96
0.00
8.62
Teachers by Edu. qualification (other than contract teachers)*
Classrooms/Other rooms
0.00
P + UP+Sec/HS
5 125 30 22 10 0 0 0
School category Grad.Below
Sec. Sec.Hr.
Sec.PostGrad.
MPhil/ PhD
PostDoc.
NoRes.
0.0
0.0
0.0 0.0
1,034
1,119
1,085
1,118
1,204
1,218
1,320
1,649
5,560
4,187
outCWSN0.5
U. Pry.Primary GER Primaryrate % SC enr. GER U. Pry.
2.78
0.37
0.18
% SC girls
% ST enr.
% ST girls
NER Primary
% TeachersinvolvedNumber ofdays involved
NER U. Pry.
Non-Tch assignment1.47 0.7% OBC enr.
2.25 % OBC
3.08 girls
4.35 % Muslim 97.7 98.1enr.
1.44 % Muslim Pr. level
220
Average Instructional days
10
92.9
13.5
91.1
U. Pr. level
220
-titionTotalRepe-aters
rate0
0
0
0
0
0
0
0
0girls0
0.00
0.00
0.00
0.00
0.00
0.00
0.00
0.00
0.00
-6.00
105.7111.5
Repe- Drop SC/ST/OBC enrolment Enrolment ratio0.96
Total CLSrooms
155
153
44
27
34
8
0
66
72
38
13
52
7
0
V
2
26
3
1
1
49
0
1
VIIIVII
1
VI
4
0 0 0
19 15 25
0 3 8
1 2 3
31 1
32 17 40
0 0 0
1 1 0 2 2 0 4 1
5 2 0 5
IVI II IIINature of Disability
1 0 3 0
9 19 22 16
1 1 4 3
4 7 3 4
3 31 6
22 27 31
1 0 0
20
0
00 12 0 0 0 0
6
0.0
0.0
98.949.1
55.3
49.2 53.2
60.9
0.5
53.198.0
70.0
00
100
117
59
14
72
0
0
100.0
100.0
100.0
100.042.9
0.0
Girlsenrolment
514
550
511
542
613
626
712
892
2,730
2,230
25
37
37
35
48
34
18
42
182
94
Boys22
23
29
21
42
20
28
40
137
88
Girls
Blind
Low-vision
Hearing
Speach
Loco-motor
MentallyRetarded
Learning
CerebralPalsy
Autism
Multiple
0.22
0.00
0.12
1139
282
134192
113
585
English
819 481
869
571
161261
12405
28543
Malayalam
72
00
0
0
0
Hindi
0
0
0
0
00
0
4647
Others
3.98
1.33
2.78
5.31
4.00
4.72
Government
86.7 90.9
UP+Sec/HS P+UP+Sec UP+SecP + UPP. only 55 - 56 57-58 59-60 TLM SD Grant
Gender

Elementary Education in India: Where do we stand ?
42
% Sch. with Pre-Pry.
Dist. covered State codeUpper primary cycle Ratio of P. to U.P. schools/sections 2.18
50 23501 - 5 6 - 8
Total districtsPrimary cycleData reported from
Basic data : 2011
Decadal growth rateOverall literacy rate
Blocks/taluks
20.3
70.6
Primaryonly
All Schools
Pry. withU. Pry
UP withSec/H Sec & Sec
Pry. with UP UP withSec
Pry. with UP & Sec/H Sec Other Cat.
No Res. &Total
Sch. with drinking water Sch. providing MDMSch. with electricity Sch. with computers
Sch. with kitchen-shedSch. Estd. since 2001
#
Sch. with ramp
Sch aproachable by all roadSch. with play groundSch. with boundary wallSch. with girls toilets
Single-teacher schoolsSingle-classroom schools
Sch. with boys toilets
97.410.43.2
55.613.360.5
12-13
17.681.951.136.5
4.4
92.774.395.9
40.437.848.8
24.2
19.4
11-12
84.284.3
4.3100.0
1.8
79.791.299.5
80.0
11-12
0.7
20.313.166.645.745.5
97.4
21.313.366.844.1
98.4
25.3
11-12 12-13
54.637.5
1.3
39.8
16.8100.0
1.1
55.5
17.286.3
89.174.969.385.295.097.3
12-13 11-12
1.5
12-13 11-12
1.6
12-13
6.30.4
100.092.291.593.096.699.836.093.675.048.422.627.3
99.8
91.373.952.227.12.2
12-13
92.387.792.2
1.42.2
99.176.9
21.2
44.640.356.25.5
12-13
89.583.483.2
1.43.5
98.265.799.525.180.210.6
3.1
13.654.5
98.1
66.1
51.238.2
100.0
4.516.7
75.690.697.9
11-12
1.1
48.218.7
43.7
40.9
11-12
3.1100.090.788.6
1.0
92.393.9
100.0
90.265.3
Total Schools (Cur. Year) 90804 15819 3645 30181 0
Total Schools
Madrasas & Unreco. Sch.
Private schools
Private schools: Rural
Total Enrolment
Govt. schools: Rural
(2011-12)
83,413
6,364
1027
79,141
4,401
7,696,738
92053
225
27,130
438
3,488,672
22
29781
29,305
854
1,084
837,027
16
2483
79
3,550
20
16483
50
15,098
671
11
7,817
3,270,551
0
0
0
0
0
0
0
Total Enrolment in Govt. sch.
Enrolment in Pvt. sch.
Enr. in Madrasas & Unreco.
Enr. in Govt. sch. : Rural
Enr. in Pvt. sch. : Rural
Total Teachers
Private teachers
Government teachers
Tch. in Madrasas & Unreco.
6,450,524
615,095
83584
5,912,588
342,691
223201
194,018
24,931
2852
P + UP P+UP+Sec/HS UP only UP + Sec/HS P+UP+Sec U.P. + Sec
3,376,712
93,486
38,400
3,003,366
81041
78,493
3,908
1518
71
46,013
1,193,030
302,489
6,900
28219
1,194
38,391
2176
101
13,452
2,742,032
93963
1,642
1,225,326
111286
415
105,066
2914
14,847
9,223
0
9,811
2,119
0
0
0
0
Primary only Performance Indicators (in %)
Government schools
264
193
39
0
25
78
24,840
8,946
22,066
0
6,301
5,179
1309
436
1,478
0
141859
140993
112,895
27227
1737
106,329
14,242
15317828
9,913,184
4,971,038
181,311
8,941,225
2,007,422
445,056
274,635
183,442
5,941
3.4 3.314.9 15.4
100.0 84.156.7 56.745.0 43.976.3 92.8
89.67 72.398.0 96.297.8 97.022.5 23.111.0 12.355.1 56.124.3 25.655.6 56.4
11-12 12-13
5.389.884.892.097.965.999.6
2.0
36.087.163.351.521.613.0
98.384.891.398.372.099.722.7
98.481.387.598.461.798.40.0
90.067.557.041.59.1
75.042.250.043.80.0
STATE ELEMENTARY EDUCATION REPORT CARD : 2012-13
141,859
Female literacy rate
14.5
21.160.0
%ST pop
%0-6 Population
Schools
15.6
27.6
54,609319
Total population in (000's)
Sex ratio80.5
% SC population
%Urban population
3,361 VillagesClusters
72597.6
930Male literacy rate 308245
Area (Sq. Km)
MADHYA PRADESH
Key Data
0 0
8 1
1073 63
1 02 0
391 33
0 0
2575 115
290821 5285
70 0
617 0
88791 2427
0 0
72 7
9347 321
3 0
(2011-12)
(2011-12)
Pupil-teacher ratio% Sch. having SMC
Student-classroom ratio Average tch per schoolFemale teachersEnr. in single-tch schools
Girls enrolmentEnr. in Govt. schools
242.4
33.313.790.2
98.1
50.0
32266.8
55.83.10.8
43.7
23.729
312.7
31.912.695.753.3
96.543
302.7
30.913.497.3
97.9
53.1
4248.3
3024
11.467.90.23.1
43.23.7
37.7
42.8
3129
10.964.31.5
246.9
55.22.70.5
31.1
44.1
26262.4
33.812.688.650.5
96.734
126.8
44.21.4
22.140.2
56.319 32
27.1 29.496.3 97.8
3427 263.2 3.3
41.2 41.19.9 10.2
66.7 65.849.3 48.8
47.016167.3
39.64.1
28.841.6
27.3 85.731328.7
54.31.60.9
41.4
16155.1
46.01.82.1
43.8
% Sch. with <=50 students 34.0 37.5 8.1 9.6 4.3 6.3 18.2 19.1 29.0 31.4 7.4 37.5#
Upper Primary Level 3000395 30.1 30.6 42.1
6105443Primary Level
Facilities Text books
5.8 16.6 24.1 94 Residential
% Enr. in Pre-Pry.
31.9Sch with No female tch. 35.9 36.5 12.5 12.2 3.5 4.9 31.9 32.7 17.1 18.2 31.7
44.3
% Sch with SCR > % Sch with PTR >Ratio of Grade V to Grade I
14.3 Primary Upper Primary 87.6
30 at Pr. 35 at U.P. 30 at Pr.
Pry. level Total Grossness Transition Rate (Prim. to Upper Prim.)
*
@ =Govt. only # =Govt. + Aided NR=Not Reported *Some totals may not match due to no response in classificatory data items
6.6 15.6
1082 64
U.Pry.only
19926
8048
TransportStationary
5815391
28622012867560
1882621
AttendanceUniform
204226
88442
0
0
35 at U.P.(2011-12)

Elementary Education : State Report Cards
43
Retention rate (Prim.)
8.173.31
% Grants utilized%Teachers by Age (In years)
73.51
Enrolment* 2012-13 Ratio of Girl's to Boy's Enr: Grades I to V
Grade Total
I
II
III
IV
V
VI
VII
VIII
Pry (I-V)
U.P. + Sec
Pry + U.Pry
U. Pry. only
0
U.P. + Sec
P + U.P. + Sec
Contract
Primary only
Primary + U.Pry
P + UP+Sec/HS
Upper Pry. only
U.P. + Sec/HS
P+ U.P. + Sec
U.P. + Sec/HS
Teachers by gender & casteSchool category
School category
Primary only
Primary with Upper Primary
Primary with UP. Pri. and Sec/HS
Upper Primary onlyUpper Primary with Sec/HS
Primary with UP. & Sec
Upper Primary with Sec % Teachers recd. in-service training (previous year)
% Sch. received
MADHYA PRADESH
@
SD Grant
% ProfessionallyTrained teachers
Regular Private
Male
Female
All Tch.
All Teachers
Female
Male
Contract
41.8
41.5
42.2
42.5
28.8
53.3
82.8
86.5
88.1
13.9
11.5
13.1
0.9
0.4
0.6
16.7
17.0
16.8
0.1
0.2
0.3
P+UP+Sec/HS UP only
0.3
0.5
0.8
P + UP+Sec/HS
1,233
357
389
11
120
0
48
1,575
888
84
325
7
189
6,011
4,909
194
2,044
43
441 702
146
4,260
699
30,704
17,368 13,745
44,219
889
2,527
124
192
443
616
26
69
7
8
15
29
1
1
1
0
0
673
0
0
0
39,686
82,472
1,914
9,422
328
221,801
Total
108,395
Enrolment by medium of instructions*
48,159
14,106
56,999
1,152
4,283
177
Male
147,793
Regular teachers
25,428
752
5,063
151
Female
73,555
59,412
25,408
0
0
0
0
0
0
No res
0 207
439
106
17
5
49
0
Female
246
385
66
28
5
27
0
Male
Contractual teachers
0
0
0
0
0
0
0
No res
22,746
4,739
1,110
9,969
117
401
SC teachers
Male
10,022
4,717
1,409
3,562
68
359
Female
ST teachers
33,565
2,331
493
9,893
88
144
10
Male Female
TLM
78.5
2.6
2.0
76.35.7
1.3
1.6
6,617 34,072 46,488 18,348 785 28 0
U.Pry.
Avg. CLS
School category
Pry. only
Pry + U.Pry
U. Pry. only
U.P. + Sec
P + U.P. + Sec
U.P. + Sec
%Majorrepair
%Minorrepair
17.11
5.38
2.52
13.45
3.77
%Goodcond.
75.57
94.16
97.32
82.29
95.66
Pry. only
Enrolment by nature of disability
7.6
11.7
3.8
7.2
5.7
8.4
3.3
97.59
99.18
2.11
0.54
Otherrooms
7.32
0.46
0.16
4.26
0.58
Teachers by Edu. qualification (other than contract teachers)*
Classrooms/Other rooms
0.31
0.27
P + UP+Sec/HS
2,493 4,858 85,062 74,036 52,684 771 38 1,406
School category Grad.Below
Sec. Sec.Hr.
Sec.PostGrad.
MPhil/ PhD
PostDoc.
NoRes.
0.4 0.6
0.3 1.3
0.3 0.9
2,060,927
1,907,139
2,061,953
2,028,653
1,930,313
1,786,061
1,695,618
1,594,869
9,988,985
5,076,548
outCWSN17.2
U. Pry.Primary GER Primaryrate % SC enr. GER U. Pry.
6.28
5.81
5.71
% SC girls
% ST enr.
% ST girls
NER Primary
% TeachersinvolvedNumber ofdays involved
NER U. Pry.
Non-Tch assignment5.20 43.9% OBC enr.
8.36 % OBC
2.18 girls
2.27 % Muslim 5.4 4.5enr.
6.24 % Muslim Pr. level
220
Average Instructional days
46
1.7
75.2
U. Pr. level
221
-titionTotalRepe-aters
rate91,195
81,814
86,079
83,037
77,790
58,111
54,093
50,585
419,915girls162,789
4.04
3.27
3.31
3.34
3.95
4.07
4.00
3.75
4.46
21.12
Repe- Drop SC/ST/OBC enrolment Enrolment ratio0.93
Total CLSrooms
295,418
119,825
42,552
114,047
1,896
9,103
367
88,541
26,011
13,758
37,783
1,138
2,560
113
V
411
1380
1257
630
3332
211
28
618
VIIIVII
1350
VI
902
557 386 445
1592 1417 1277
1273 1065 970
685 604 560
29933439 3146
173 154 120
23 17 13
764 683 786 521 427 359 226 198
1569 1608 2493 2254
IVI II IIINature of Disability
578 356 520 465
824 819 1203 1396
1420 1425 1954 1649
548 548 781 727
2364 35063467 3533
173 163 254
18 20 25
264
22
3438 2682 55 73 71 68
1873
48.3
26.348.4
41.4
48.4
48.3 50.9
49.7
51.021.5
50.0
18.3
1226
13,336
2,749
874
3,693
48
149
2
78.2
3.4
2.2
78.00.8
2.8
4.7
Girlsenrolment
975,365
901,569
995,331
995,285
958,110
884,423
847,567
798,957
4,825,660
2,530,947
6,135
4,703
6,629
6,207
5,328
5,369
4,446
3,943
29,002
13,758
Boys3,308
3,338
4,966
4,695
4,289
4,120
3,505
3,277
20,596
10,902
Girls
Blind
Low-vision
Hearing
Speach
Loco-motor
MentallyRetarded
Learning
CerebralPalsy
Autism
Multiple
1.44
0.50
1.05
2292455
795537
341276526054
209701
4966
Hindi
6949373 85328
505532
423763
112233576
76703
324
English
43275
28098
1645
6419410
1431
79897
Urdu Marathi
12655
1680
734
73550
253
14483
1.66
0.72
1.28
1.75
0.88
1.39
Government
93.6 93.5
UP+Sec/HS P+UP+Sec UP+SecP + UPP. only 55 - 56 57-58 59-60 TLM SD Grant
Gender
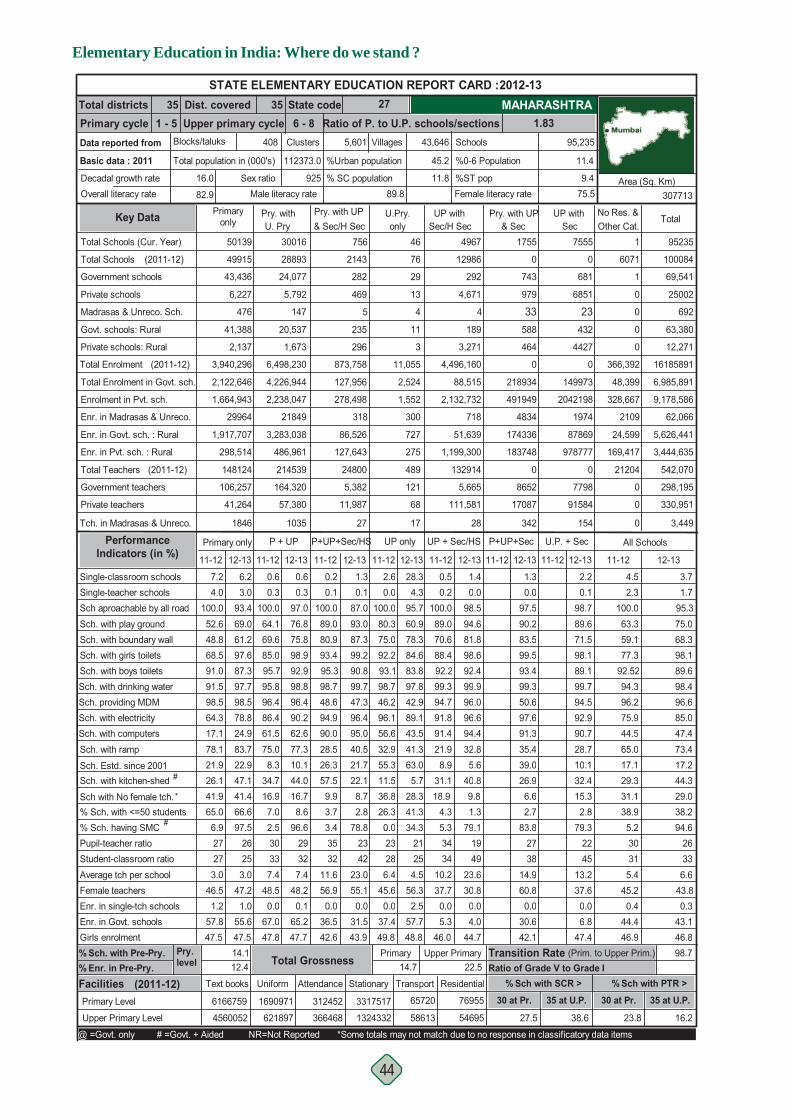
Elementary Education in India: Where do we stand ?
44
% Sch. with Pre-Pry.
Dist. covered State codeUpper primary cycle Ratio of P. to U.P. schools/sections 1.83
35 27351 - 5 6 - 8
Total districtsPrimary cycleData reported from
Basic data : 2011
Decadal growth rateOverall literacy rate
Blocks/taluks
16.0
82.9
Primaryonly
All Schools
Pry. withU. Pry
UP withSec/H Sec & Sec
Pry. with UP UP withSec
Pry. with UP & Sec/H Sec Other Cat.
No Res. &Total
Sch. with drinking water Sch. providing MDMSch. with electricity Sch. with computers
Sch. with kitchen-shedSch. Estd. since 2001
#
Sch. with ramp
Sch aproachable by all roadSch. with play groundSch. with boundary wallSch. with girls toilets
Single-teacher schoolsSingle-classroom schools
Sch. with boys toilets
98.578.824.983.722.947.1
12-13
3.093.469.061.2
6.2
97.687.397.7
61.575.08.3
96.4
34.7
11-12
64.169.6
0.3100.0
0.6
85.095.795.8
86.4
11-12
0.2
89.143.541.363.05.7
98.7
96.156.632.955.3
46.2
11.5
11-12 12-13
60.978.3
28.3
75.0
0.0100.0
2.6
80.3
4.395.7
84.692.283.893.197.842.9
12-13 11-12
1.3
12-13 11-12
0.1
12-13
2.20.1
100.089.080.993.495.398.748.694.990.028.526.357.5
99.7
96.495.040.521.722.1
12-13
87.093.087.3
1.30.1
99.290.8
47.3
62.677.310.144.0
12-13
97.076.875.8
0.60.3
98.992.998.896.490.264.3
17.1
21.978.1
98.5
26.1
52.648.8
100.0
7.24.0
68.591.091.5
11-12
1.4
21.98.9
94.7
31.1
11-12
0.2100.089.070.6
0.5
88.492.299.3
91.891.4
Total Schools (Cur. Year) 50139 30016 756 46 1
Total Schools
Madrasas & Unreco. Sch.
Private schools
Private schools: Rural
Total Enrolment
Govt. schools: Rural
(2011-12)
43,436
6,227
476
41,388
2,137
3,940,296
49915
4,671
11
3
11,055
4
76
29
13
296
873,758
5
2143
282
469
235
28893
24,077
5,792
147
20,537
1,673
6,498,230
6071
1
0
0
0
0
366,392
Total Enrolment in Govt. sch.
Enrolment in Pvt. sch.
Enr. in Madrasas & Unreco.
Enr. in Govt. sch. : Rural
Enr. in Pvt. sch. : Rural
Total Teachers
Private teachers
Government teachers
Tch. in Madrasas & Unreco.
2,122,646
1,664,943
29964
1,917,707
298,514
148124
106,257
41,264
1846
P + UP P+UP+Sec/HS UP only UP + Sec/HS P+UP+Sec U.P. + Sec
2,524
1,552
275
727
489
121
68
300
17
127,956
278,498
127,643
86,526
24800
5,382
11,987
318
27
4,226,944
2,238,047
21849
3,283,038
486,961
214539
164,320
57,380
1035
48,399
328,667
2109
24,599
169,417
21204
0
0
0
Primary only Performance Indicators (in %)
Government schools
4967
12986
292
4
189
3,271
4,496,160
88,515
2,132,732
718
51,639
1,199,300
132914
5,665
111,581
28
95235
100084
69,541
25002
692
63,380
12,271
16185891
6,985,891
9,178,586
62,066
5,626,441
3,444,635
542,070
298,195
330,951
3,449
4.5 3.72.3 1.7
100.0 95.363.3 75.059.1 68.377.3 98.1
92.52 89.694.3 98.496.2 96.675.9 85.044.5 47.465.0 73.417.1 17.229.3 44.3
11-12 12-13
0.098.594.681.898.692.499.9
0.0
96.096.694.432.85.6
40.8
97.590.283.599.593.499.350.6
98.789.671.598.189.199.794.5
97.691.335.439.026.9
92.990.728.710.132.4
STATE ELEMENTARY EDUCATION REPORT CARD : 2012-13
95,235
Female literacy rate
11.4
9.475.5
%ST pop
%0-6 Population
Schools
11.8
45.2
43,646408
Total population in (000's)
Sex ratio89.8
% SC population
%Urban population
5,601 VillagesClusters
112373.0
925Male literacy rate 307713
Area (Sq. Km)
MAHARASHTRA
Key Data
0 0
743 681
979 6851
33 23588 432
464 4427
0 0
218934 149973
491949 2042198
4834 1974
174336 87869
183748 978777
0 0
8652 7798
17087 91584
342 154
(2011-12)
(2011-12)
Pupil-teacher ratio% Sch. having SMC
Student-classroom ratio Average tch per schoolFemale teachersEnr. in single-tch schools
Girls enrolmentEnr. in Govt. schools
253.0
47.21.0
55.6
97.5
47.5
26337.4
48.50.0
67.047.8
2.530
286.4
45.60.0
37.449.8
0.023
254.5
56.32.5
57.7
34.3
48.8
213.43532
11.656.90.0
36.542.6
31.5
78.8
43.9
2342
23.055.10.0
327.4
48.20.1
65.2
96.6
47.7
29273.0
46.51.2
57.847.5
6.927
3410.237.70.05.3
46.0
5.334 26
38.9 38.25.2 94.63031 335.4 6.6
45.2 43.80.4 0.3
44.4 43.146.9 46.8
79.11949
23.630.80.04.0
44.7
83.8 79.32738
14.960.80.0
30.642.1
2245
13.237.60.06.8
47.4
% Sch. with <=50 students 65.0 66.6 7.0 8.6 3.7 2.8 26.3 41.3 4.3 1.3 2.7 2.8#
Upper Primary Level 4560052 27.5 38.6 16.2
6166759Primary Level
Facilities Text books
12.4 14.7 22.5
Residential% Enr. in Pre-Pry.
29.0Sch with No female tch. 41.9 41.4 16.9 16.7 9.9 8.7 36.8 28.3 18.9 9.8 31.1
23.8
% Sch with SCR > % Sch with PTR >Ratio of Grade V to Grade I
14.1 Primary Upper Primary 98.7
30 at Pr. 35 at U.P. 30 at Pr.
Pry. level Total Grossness Transition Rate (Prim. to Upper Prim.)
*
@ =Govt. only # =Govt. + Aided NR=Not Reported *Some totals may not match due to no response in classificatory data items
6.6 15.3
1755 7555
U.Pry.only
65720
58613
TransportStationary
3317517
1324332366468
312452
AttendanceUniform
1690971
621897
76955
54695
35 at U.P.(2011-12)

Elementary Education : State Report Cards
45
Retention rate (Prim.)
1.820.30
% Grants utilized%Teachers by Age (In years)
91.23
Enrolment* 2012-13 Ratio of Girl's to Boy's Enr: Grades I to V
Grade Total
I
II
III
IV
V
VI
VII
VIII
Pry (I-V)
U.P. + Sec
Pry + U.Pry
U. Pry. only
0
U.P. + Sec
P + U.P. + Sec
Contract
Primary only
Primary + U.Pry
P + UP+Sec/HS
Upper Pry. only
U.P. + Sec/HS
P+ U.P. + Sec
U.P. + Sec/HS
Teachers by gender & casteSchool category
School category
Primary only
Primary with Upper Primary
Primary with UP. Pri. and Sec/HS
Upper Primary onlyUpper Primary with Sec/HS
Primary with UP. & Sec
Upper Primary with Sec % Teachers recd. in-service training (previous year)
% Sch. received
MAHARASHTRA
@
SD Grant
% ProfessionallyTrained teachers
Regular Private
Male
Female
All Tch.
All Teachers
Female
Male
Contract
98.3
98.0
98.6
85.7
89.9
84.1
99.7
99.5
99.4
47.5
38.0
43.0
41.1
36.3
38.8
14.4
30.2
23.3
4.7
7.2
10.1
P+UP+Sec/HS UP only
16.2
15.7
14.6
P + UP+Sec/HS
4,254
372
9
1,320
603
1,145
453
1,376
32
12,212
2,775
10,478
1,572
1,856
47
14,085
4,130
13,434
8,078 7,202
55,798
12,143
53,380
79
7,152 6,037
32
32,800
5,448
16,978
2,921
218
0
694
186
256
67
12
0
62
16
26
14
0
0
0
0
0
17,396
206
117,274
26,081
99,536
149,367
Total
222,735
Enrolment by medium of instructions*
111,071
7,606
88
79,472
9,885
61,293
Male
73,510
Regular teachers
111
35,081
15,416
36,822
Female
68,032
104,484
9,417
0
0
0
0
0
0
No res
0 2,399
2,927
175
5
1,000
450
587
Female
5,426
4,253
198
2
1,721
330
834
Male
Contractual teachers
0
0
0
0
0
0
0
No res
10,291
14,856
949
13
10,366
1,348
SC teachers
Male
7,689
12,266
622
21
3,977
1,345
Female
ST teachers
10,020
11,008
766
9
5,044
1,017
3,837
Male Female
TLM
88.9
84.2
40.5
26.177.9
34.6
72.2
50,731 60,991 77,240 22,007 319 13 0
U.Pry.
Avg. CLS
School category
Pry. only
Pry + U.Pry
U. Pry. only
U.P. + Sec
P + U.P. + Sec
U.P. + Sec
%Majorrepair
%Minorrepair
6.57
7.58
4.55
1.18
6.89
%Goodcond.
87.80
86.16
94.35
98.82
90.63
Pry. only
Enrolment by nature of disability
6.9
13.0
3.8
9.1
6.5
10.8
3.0
92.61
89.38
5.56
7.50
Otherrooms
5.63
6.27
1.10
0.00
2.47
Teachers by Edu. qualification (other than contract teachers)*
Classrooms/Other rooms
1.84
3.12
P + UP+Sec/HS
3,706 35,983 44,401 45,892 11,365 188 7 0
School category Grad.Below
Sec. Sec.Hr.
Sec.PostGrad.
MPhil/ PhD
PostDoc.
NoRes.
17.1 24.2
10.1 18.2
12.8 21.9
2,035,780
2,027,589
2,063,758
2,112,049
2,045,183
2,022,972
2,013,019
1,906,193
10,284,359
5,942,184
outCWSN13.6
U. Pry.Primary GER Primaryrate % SC enr. GER U. Pry.
0.18
0.24
0.39
% SC girls
% ST enr.
% ST girls
NER Primary
% TeachersinvolvedNumber ofdays involved
NER U. Pry.
Non-Tch assignment1.16 34.9% OBC enr.
0.63 % OBC
0.67 girls
4.46 % Muslim 13.7 12.2enr.
0.52 % Muslim Pr. level
226
Average Instructional days
19
90.1
4.7
71.5
U. Pr. level
228
-titionTotalRepe-aters
rate10,842
9,383
9,504
9,007
6,293
5,575
5,369
6,461
45,029girls17,405
0.44
0.35
0.27
0.28
0.31
0.43
0.45
0.45
0.53
0.20
105.692.3
Repe- Drop SC/ST/OBC enrolment Enrolment ratio0.89
Total CLSrooms
151,744
205,772
9,795
176
45,094
19,025
48,877
50,600
57,584
4,854
128
27,824
8,492
32,584
V
1691
9947
4431
3558
5148
4674
266
1912
VIIIVII
4460
VI
3401
1582 1442 1120
11726 13162 10025
4156 4194 2677
3136 2746 1789
38355084 5009
4120 3526 2072
221 166 122
2044 2140 2136 2399 992 809 729 451
8525 8917 9933 12332
IVI II IIINature of Disability
1509 1440 1539 1842
4904 5910 7169 8439
5602 4813 5116 5906
4352 5265 5333 5400
5738 60365553 6873
3340 6044 7350
520 597 554
8247
502
227263 212524 495 507 527 285
6296
48.1
12.647.9
33.5
47.0
48.9 49.0
46.5
46.410.2
47.4
14.3
3,7118,031
3,787
5,133
342
6
2,006
479
1,711
88.9
84.4
39.3
23.974.3
34.9
68.6
Girlsenrolment
957,548
954,544
974,483
995,759
956,506
939,899
938,554
882,007
4,838,840
2,760,460
22,430
24,600
27,292
31,167
21,783
20,219
19,531
13,859
127,272
53,609
Boys14,443
16,759
18,381
21,300
15,505
15,338
15,071
10,356
86,388
40,765
Girls
Blind
Low-vision
Hearing
Speach
Loco-motor
MentallyRetarded
Learning
CerebralPalsy
Autism
Multiple
0.03
0.03
0.03
4427822
124891
24721753027
230033
1551485
Marathi
2685183 680671
941408
244019
597154853
427831
345548
English
19877
110839706
2769
593544
182555
Urdu
83417
79327
268229
3859
049548
12723
79897
Hindi Gujarati
11788
11636
1116
1185038
253
14483
0.08
0.09
0.09
0.83
0.96
0.89
Government
94.7 92.1
UP+Sec/HS P+UP+Sec UP+SecP + UPP. only 55 - 56 57-58 59-60 TLM SD Grant
Gender
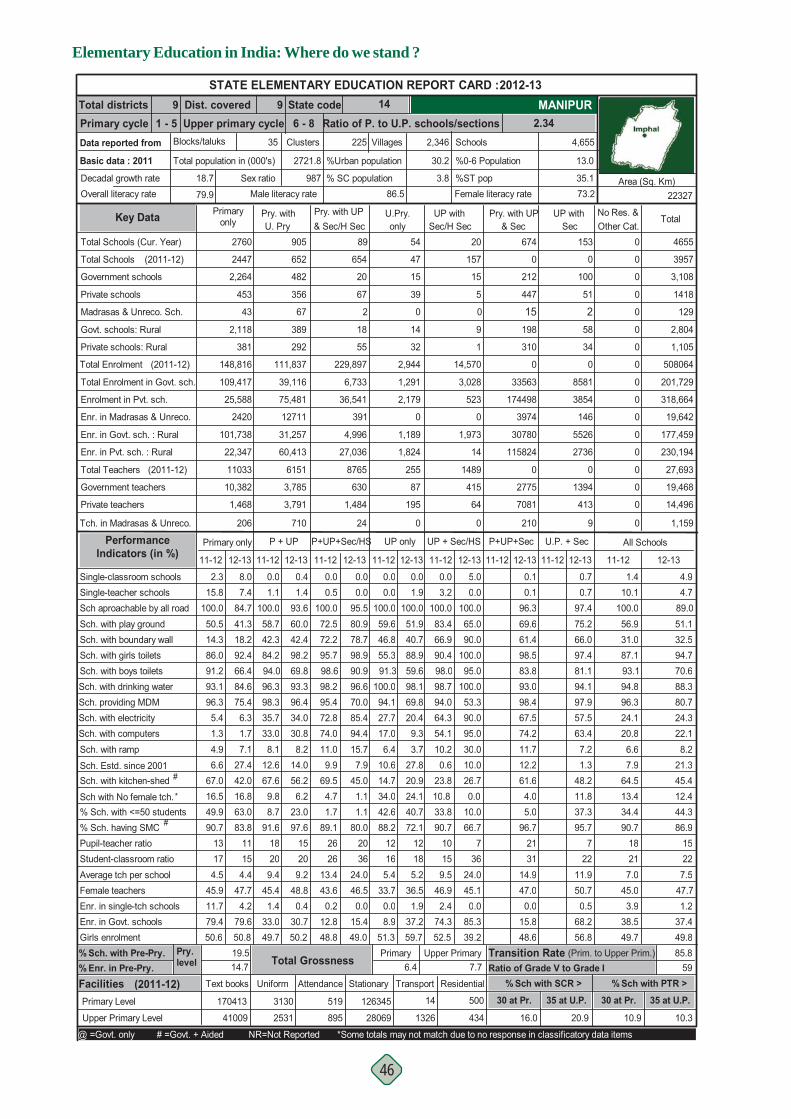
Elementary Education in India: Where do we stand ?
46
% Sch. with Pre-Pry.
Dist. covered State codeUpper primary cycle Ratio of P. to U.P. schools/sections 2.34
9 1491 - 5 6 - 8
Total districtsPrimary cycleData reported from
Basic data : 2011
Decadal growth rateOverall literacy rate
Blocks/taluks
18.7
79.9
Primaryonly
All Schools
Pry. withU. Pry
UP withSec/H Sec & Sec
Pry. with UP UP withSec
Pry. with UP & Sec/H Sec Other Cat.
No Res. &Total
Sch. with drinking water Sch. providing MDMSch. with electricity Sch. with computers
Sch. with kitchen-shedSch. Estd. since 2001
#
Sch. with ramp
Sch aproachable by all roadSch. with play groundSch. with boundary wallSch. with girls toilets
Single-teacher schoolsSingle-classroom schools
Sch. with boys toilets
75.46.31.77.1
27.442.0
12-13
7.484.741.318.2
8.0
92.466.484.6
33.08.1
12.6
98.3
67.6
11-12
58.742.3
1.1100.0
0.0
84.294.096.3
35.7
11-12
0.0
20.49.33.7
27.820.9
100.0
27.717.06.4
10.6
94.1
14.7
11-12 12-13
51.940.7
0.0
46.8
0.0100.0
0.0
59.6
1.9100.0
88.955.359.691.398.169.8
12-13 11-12
0.1
12-13 11-12
0.7
12-13
0.70.5
100.072.572.295.798.698.295.472.874.011.09.9
69.5
96.6
85.494.415.77.9
45.0
12-13
95.580.978.7
0.00.0
98.990.9
70.0
30.88.2
14.056.2
12-13
93.660.042.4
0.41.4
98.269.893.396.434.05.4
1.3
6.64.9
96.3
67.0
50.514.3
100.0
2.315.8
86.091.293.1
11-12
5.0
10.20.6
94.0
23.8
11-12
3.2100.083.466.9
0.0
90.498.098.7
64.354.1
Total Schools (Cur. Year) 2760 905 89 54 0
Total Schools
Madrasas & Unreco. Sch.
Private schools
Private schools: Rural
Total Enrolment
Govt. schools: Rural
(2011-12)
2,264
453
43
2,118
381
148,816
2447
5
14
32
2,944
0
47
15
39
55
229,897
2
654
20
67
18
652
482
356
67
389
292
111,837
0
0
0
0
0
0
0
Total Enrolment in Govt. sch.
Enrolment in Pvt. sch.
Enr. in Madrasas & Unreco.
Enr. in Govt. sch. : Rural
Enr. in Pvt. sch. : Rural
Total Teachers
Private teachers
Government teachers
Tch. in Madrasas & Unreco.
109,417
25,588
2420
101,738
22,347
11033
10,382
1,468
206
P + UP P+UP+Sec/HS UP only UP + Sec/HS P+UP+Sec U.P. + Sec
1,291
2,179
1,824
1,189
255
87
195
0
0
6,733
36,541
27,036
4,996
8765
630
1,484
391
24
39,116
75,481
12711
31,257
60,413
6151
3,785
3,791
710
0
0
0
0
0
0
0
0
0
Primary only Performance Indicators (in %)
Government schools
20
157
15
0
9
1
14,570
3,028
523
0
1,973
14
1489
415
64
0
4655
3957
3,108
1418
129
2,804
1,105
508064
201,729
318,664
19,642
177,459
230,194
27,693
19,468
14,496
1,159
1.4 4.910.1 4.7
100.0 89.056.9 51.131.0 32.587.1 94.793.1 70.694.8 88.396.3 80.724.1 24.320.8 22.16.6 8.27.9 21.3
64.5 45.4
11-12 12-13
0.0100.065.090.0
100.095.0
100.0
0.1
53.390.095.030.010.026.7
96.369.661.498.583.893.098.4
97.475.266.097.481.194.197.9
67.574.211.712.261.6
57.563.47.21.3
48.2
STATE ELEMENTARY EDUCATION REPORT CARD : 2012-13
4,655
Female literacy rate
13.0
35.173.2
%ST pop
%0-6 Population
Schools
3.8
30.2
2,34635
Total population in (000's)
Sex ratio86.5
% SC population
%Urban population
225 VillagesClusters
2721.8
987Male literacy rate 22327
Area (Sq. Km)
MANIPUR
Key Data
0 0
212 100
447 51
15 2198 58
310 34
0 0
33563 8581
174498 3854
3974 146
30780 5526
115824 2736
0 0
2775 1394
7081 413
210 9
(2011-12)
(2011-12)
Pupil-teacher ratio% Sch. having SMC
Student-classroom ratio Average tch per schoolFemale teachersEnr. in single-tch schools
Girls enrolmentEnr. in Govt. schools
154.4
47.74.2
79.6
83.8
50.8
11209.4
45.41.4
33.049.7
91.618
165.4
33.70.08.9
51.3
88.212
185.2
36.51.9
37.2
72.1
59.7
1289.1
2626
13.443.60.2
12.848.8
15.4
80.0
49.0
2036
24.046.50.0
209.2
48.80.4
30.7
97.6
50.2
15174.5
45.911.779.450.6
90.713
159.5
46.92.4
74.352.5
90.710 15
34.4 44.390.7 86.9
1821 227.0 7.5
45.0 47.73.9 1.2
38.5 37.449.7 49.8
66.77
3624.045.10.0
85.339.2
96.7 95.72131
14.947.00.0
15.848.6
722
11.950.70.5
68.256.8
% Sch. with <=50 students 49.9 63.0 8.7 23.0 1.7 1.1 42.6 40.7 33.8 10.0 5.0 37.3#
Upper Primary Level 41009 16.0 20.9 10.3
170413Primary Level
Facilities Text books
14.7 6.4 7.7 59 Residential
% Enr. in Pre-Pry.
12.4Sch with No female tch. 16.5 16.8 9.8 6.2 4.7 1.1 34.0 24.1 10.8 0.0 13.4
10.9
% Sch with SCR > % Sch with PTR >Ratio of Grade V to Grade I
19.5 Primary Upper Primary 85.8
30 at Pr. 35 at U.P. 30 at Pr.
Pry. level Total Grossness Transition Rate (Prim. to Upper Prim.)
*
@ =Govt. only # =Govt. + Aided NR=Not Reported *Some totals may not match due to no response in classificatory data items
4.0 11.8
674 153
U.Pry.only
14
1326
TransportStationary
126345
28069895
519
AttendanceUniform
3130
2531
500
434
35 at U.P.(2011-12)

Elementary Education : State Report Cards
47
Retention rate (Prim.)
1.220.78
% Grants utilized%Teachers by Age (In years)
64.50
Enrolment* 2012-13 Ratio of Girl's to Boy's Enr: Grades I to V
Grade Total
I
II
III
IV
V
VI
VII
VIII
Pry (I-V)
U.P. + Sec
Pry + U.Pry
U. Pry. only
0
U.P. + Sec
P + U.P. + Sec
Contract
Primary only
Primary + U.Pry
P + UP+Sec/HS
Upper Pry. only
U.P. + Sec/HS
P+ U.P. + Sec
U.P. + Sec/HS
Teachers by gender & casteSchool category
School category
Primary only
Primary with Upper Primary
Primary with UP. Pri. and Sec/HS
Upper Primary onlyUpper Primary with Sec/HS
Primary with UP. & Sec
Upper Primary with Sec % Teachers recd. in-service training (previous year)
% Sch. received
MANIPUR
@
SD Grant
% ProfessionallyTrained teachers
Regular Private
Male
Female
All Tch.
All Teachers
Female
Male
Contract
26.5
27.8
25.5
26.2
32.8
15.0
42.9
41.5
40.1
24.4
20.6
22.6
9.9
6.9
8.4
9.5
5.8
8.2
2.5
2.4
2.4
P+UP+Sec/HS UP only
0.0
0.0
0.0
P + UP+Sec/HS
113
1
0
0
117
2
4
97
12
7
537
22
39
212
33
2
1,460
74
202 603
1,448
5,630
160
200
948 787
16
299
1,692
252
209
47
1
11
85
8
2
0
0
0
0
0
0
0
0
0
0
0
2,138
282
479
10,066
1,816
12,056
Total
8,286
Enrolment by medium of instructions*
4,094
1,126
163
263
5,092
890
Male
6,282
Regular teachers
99
216
4,429
916
Female
5,677
3,851
966
0
0
0
0
0
0
No res
0 70
191
28
4
0
303
5
Female
27
150
18
16
0
242
5
Male
Contractual teachers
0
0
0
0
0
0
0
No res
163
255
58
7
9
181
SC teachers
Male
147
180
18
5
9
145
Female
ST teachers
3,604
1,583
520
51
13
1,940
47
Male Female
TLM
74.3
58.6
15.7
61.130.0
35.5
84.3
733 1,711 4,499 836 52 1 0
U.Pry.
Avg. CLS
School category
Pry. only
Pry + U.Pry
U. Pry. only
U.P. + Sec
P + U.P. + Sec
U.P. + Sec
%Majorrepair
%Minorrepair
31.90
28.51
12.93
37.57
29.63
%Goodcond.
28.12
47.66
82.74
30.39
62.22
Pry. only
Enrolment by nature of disability
7.1
13.6
3.6
5.0
3.7
10.0
3.4
65.27
30.28
20.79
38.42
Otherrooms
39.97
23.83
4.33
32.04
8.15
Teachers by Edu. qualification (other than contract teachers)*
Classrooms/Other rooms
13.94
31.30
P + UP+Sec/HS
219 1,560 3,925 5,385 812 55 3 0
School category Grad.Below
Sec. Sec.Hr.
Sec.PostGrad.
MPhil/ PhD
PostDoc.
NoRes.
7.0 3.8
3.7 2.0
5.4 2.9
105,238
84,329
70,954
65,804
62,223
51,153
51,511
48,823
388,548
151,487
outCWSN4.1
U. Pry.Primary GER Primaryrate % SC enr. GER U. Pry.
11.27
12.35
3.65
% SC girls
% ST enr.
% ST girls
NER Primary
% TeachersinvolvedNumber ofdays involved
NER U. Pry.
Non-Tch assignment0.35 17.7% OBC enr.
13.65 % OBC girls
% Muslim 9.3 8.7enr.
8.61 % Muslim Pr. level
207
Average Instructional days
20
27.0
87.5
U. Pr. level
218
-titionTotalRepe-aters
rate693
246
291
295
306
343
279
488
1,831girls1,110
0.50
1.08
0.59
0.69
0.52
0.47
0.43
0.30
0.73
Repe- Drop SC/ST/OBC enrolment Enrolment ratio0.99
Total CLSrooms
9,288
6,412
1,208
195
100
6,739
563
1,531
1,578
681
72
174
2,636
647
V
39
131
153
53
167
19
2
24
VIIIVII
74
VI
38
18 14 16
104 84 61
74 53 50
21 16 20
6275 54
22 5 8
1 0 0
165 110 97 45 48 23 11 6
414 389 315 206
IVI II IIINature of Disability
97 53 55 34
162 162 183 114
178 184 177 155
112 155 110 66
268 211208 151
42 44 32
23 8 6
25
1
2115 11135 92 65 37 41
166
50.3
47.149.3
14.1
50.4
50.7 49.6
50.3
49.538.1
50.7
4.6
2955
3,300
1,361
471
32
7
1,690
24
74.6
58.7
15.7
61.130.0
35.3
85.6
Girlsenrolment
52,375
42,274
35,215
32,766
30,934
25,364
25,667
24,140
193,564
75,171
838
852
690
490
444
217
165
156
3,314
538
Boys698
613
561
344
375
210
131
102
2,591
443
Girls
Blind
Low-vision
Hearing
Speach
Loco-motor
MentallyRetarded
Learning
CerebralPalsy
Autism
Multiple
0.22
0.13
0.18
91050
36121
24813283
170615
10296
English
77664 25072
10030
555
74133
12597
462
Others
10305
0359
779
11430
17250
Manipuri
1487
5152
3322
2015
640
1700
1693
Hindi Nepali
264
0
0
00
253
153
1.70
1.36
1.54
2.32
1.98
2.16
Government
99.8 99.6
UP+Sec/HS P+UP+Sec UP+SecP + UPP. only 55 - 56 57-58 59-60 TLM SD Grant
Gender

Elementary Education in India: Where do we stand ?
48
% Sch. with Pre-Pry.
Dist. covered State codeUpper primary cycle Ratio of P. to U.P. schools/sections 2.53
7 1771 - 5 6 - 8
Total districtsPrimary cycleData reported from
Basic data : 2011
Decadal growth rateOverall literacy rate
Blocks/taluks
27.8
75.5
Primaryonly
All Schools
Pry. withU. Pry
UP withSec/H Sec & Sec
Pry. with UP UP withSec
Pry. with UP & Sec/H Sec Other Cat.
No Res. &Total
Sch. with drinking water Sch. providing MDMSch. with electricity Sch. with computers
Sch. with kitchen-shedSch. Estd. since 2001
#
Sch. with ramp
Sch aproachable by all roadSch. with play groundSch. with boundary wallSch. with girls toilets
Single-teacher schoolsSingle-classroom schools
Sch. with boys toilets
96.210.12.8
18.429.552.2
12-13
10.051.729.215.1
22.4
44.746.359.2
36.910.736.4
86.4
9.7
11-12
49.560.3
0.9100.0
1.9
62.680.171.0
52.8
11-12
0.0
27.815.024.158.253.3
57.2
22.413.023.459.0
79.1
9.9
11-12 12-13
38.319.1
6.5
18.9
0.2100.0
5.1
41.7
0.459.7
42.337.544.160.556.385.5
12-13 11-12
0.0
12-13 11-12
0.0
12-13
0.00.0
100.071.384.495.897.593.459.795.180.39.8
11.514.9
90.5
100.095.214.34.8
12.5
12-13
100.085.795.2
0.00.0
100.094.7
12.5
26.38.0
51.173.7
12-13
84.754.056.9
2.20.0
55.954.761.379.047.48.1
2.9
29.618.4
94.6
24.7
32.514.9
100.0
21.09.7
34.858.759.9
11-12
0.0
16.110.5
35.0
6.8
11-12
2.1100.066.450.3
2.1
66.783.275.5
75.566.4
Total Schools (Cur. Year) 9164 137 21 3317 0
Total Schools
Madrasas & Unreco. Sch.
Private schools
Private schools: Rural
Total Enrolment
Govt. schools: Rural
(2011-12)
5,423
3,664
77
5,231
3,429
436,626
9081
38
2,261
842
167,692
1
3236
2,390
926
7
41,301
0
122
6
15
3
214
9
121
7
6
104
37,006
0
0
0
0
0
0
0
Total Enrolment in Govt. sch.
Enrolment in Pvt. sch.
Enr. in Madrasas & Unreco.
Enr. in Govt. sch. : Rural
Enr. in Pvt. sch. : Rural
Total Teachers
Private teachers
Government teachers
Tch. in Madrasas & Unreco.
258,328
205,675
2394
243,775
175,672
22725
12,731
9,676
173
P + UP P+UP+Sec/HS UP only UP + Sec/HS P+UP+Sec U.P. + Sec
98,072
62,873
53,554
90,701
13672
9,444
4,248
33
3
3,014
8,437
2,459
949
1459
185
397
0
0
1,418
21,058
1222
763
15,755
1783
96
961
56
887
20
0
771
20
0
0
0
0
Primary only Performance Indicators (in %)
Government schools
52
143
14
0
7
16
22,991
3,123
11,239
0
1,198
4,400
1118
296
737
0
12878
12796
7,853
4940
85
7,516
4,516
705616
366,590
342,476
3,649
339,262
272,113
40,757
22,897
17,919
232
16.3 17.66.9 7.2
100.0 55.035.8 32.517.7 17.836.9 45.0
60.12 46.559.9 59.189.4 92.714.0 16.67.5 7.6
19.4 19.636.7 36.720.2 52.4
11-12 12-13
0.098.167.375.093.693.296.2
0.0
17.296.292.315.40.0
17.2
97.267.683.185.785.787.371.4
88.856.062.176.571.282.859.0
91.573.25.6
22.557.1
81.057.816.46.9
41.0
STATE ELEMENTARY EDUCATION REPORT CARD : 2012-13
12,878
Female literacy rate
18.8
86.173.8
%ST pop
%0-6 Population
Schools
0.6
20.1
6,10341
Total population in (000's)
Sex ratio77.2
% SC population
%Urban population
538 VillagesClusters
2964.0
986Male literacy rate 22429
Area (Sq. Km)
MEGHALAYA
Key Data
0 0
2 9
69 107
0 00 8
45 73
0 0
542 1206
18744 14430
0 0
0 1105
10906 9347
0 0
48 97
843 1057
0 0
(2011-12)
(2011-12)
Pupil-teacher ratio% Sch. having SMC
Student-classroom ratio Average tch per schoolFemale teachersEnr. in single-tch schools
Girls enrolmentEnr. in Govt. schools
192.5
55.76.1
55.4
90.9
50.0
21218.3
69.30.16.6
52.1
88.421
174.2
44.70.1
55.752.8
69.212
164.1
45.60.2
60.9
89.9
53.2
1273.1
2826
12.073.70.08.5
52.326.3
62.5
53.7
2047
27.773.40.0
238.1
70.40.06.0
89.5
52.1
21182.5
55.95.9
58.550.0
70.019
247.8
48.20.4
17.153.2
63.321 17
65.5 65.669.9 90.4
1719 193.2 3.2
53.2 53.33.7 4.0
50.8 51.451.0 50.9
44.81441
19.957.10.0
21.751.7
85.7 80.32230
12.576.00.02.8
47.4
14319.9
51.90.07.7
53.6
% Sch. with <=50 students 68.3 66.8 16.8 16.8 4.1 0.0 65.3 68.8 18.2 0.0 9.9 10.3#
Upper Primary Level 145671 21.4 12.0 4.3
363319Primary Level
Facilities Text books
49.4 27.9 40.5 49 Residential
% Enr. in Pre-Pry.
19.2Sch with No female tch. 21.8 21.6 2.8 3.6 0.8 0.0 15.0 14.5 3.5 3.8 19.4
19.5
% Sch with SCR > % Sch with PTR >Ratio of Grade V to Grade I
80.4 Primary Upper Primary 0.0
30 at Pr. 35 at U.P. 30 at Pr.
Pry. level Total Grossness Transition Rate (Prim. to Upper Prim.)
*
@ =Govt. only # =Govt. + Aided NR=Not Reported *Some totals may not match due to no response in classificatory data items
0.0 5.2
71 116
U.Pry.only
193
559
TransportStationary
431
889822
1395
AttendanceUniform
5148
2525
46
285
35 at U.P.(2011-12)

Elementary Education : State Report Cards
49
Retention rate (Prim.)
10.243.37
% Grants utilized%Teachers by Age (In years)
51.90
Enrolment* 2012-13 Ratio of Girl's to Boy's Enr: Grades I to V
Grade Total
I
II
III
IV
V
VI
VII
VIII
Pry (I-V)
U.P. + Sec
Pry + U.Pry
U. Pry. only
0
U.P. + Sec
P + U.P. + Sec
Contract
Primary only
Primary + U.Pry
P + UP+Sec/HS
Upper Pry. only
U.P. + Sec/HS
P+ U.P. + Sec
U.P. + Sec/HS
Teachers by gender & casteSchool category
School category
Primary only
Primary with Upper Primary
Primary with UP. Pri. and Sec/HS
Upper Primary onlyUpper Primary with Sec/HS
Primary with UP. & Sec
Upper Primary with Sec % Teachers recd. in-service training (previous year)
% Sch. received
MEGHALAYA
@
SD Grant
% ProfessionallyTrained teachers
Regular Private
Male
Female
All Tch.
All Teachers
Female
Male
Contract
30.6
30.8
30.3
10.0
10.6
9.5
32.0
30.1
28.3
46.0
40.2
42.8
12.5
11.6
11.9
42.8
42.7
42.8
1.6
1.7
1.9
P+UP+Sec/HS UP only
0.2
1.4
2.2
P + UP+Sec/HS
21
0
62
1
3
7
146
4
1,117
20
21
40
700
48
5,344
85
174
176
3,079 1,372
645
524
399
4,086
310 213
374
488
130
225
75
7
15
19
7
6
2
0
1
0
1
0
0
0
0
0
0
0
582
13,695
1,033
891
1,154
22,580
Total
1,113
Enrolment by medium of instructions*
307
155
5,950
431
202
525
Male
8,954
Regular teachers
5,049
581
658
574
Female
11,118
743
427
0
0
0
0
0
0
No res
0 1,457
41
0
1,194
9
19
25
Female
1,051
22
0
1,502
12
12
30
Male
Contractual teachers
0
0
0
0
0
0
0
No res
95
23
10
139
14
7
SC teachers
Male
82
20
13
65
8
10
Female
ST teachers
9,263
224
87
6,303
231
136
313
Male Female
TLM
78.5
11.7
4.8
85.715.4
11.3
31.9
97 413 458 58 3 0 0
U.Pry.
Avg. CLS
School category
Pry. only
Pry + U.Pry
U. Pry. only
U.P. + Sec
P + U.P. + Sec
U.P. + Sec
%Majorrepair
%Minorrepair
32.28
32.35
4.13
26.70
19.37
%Goodcond.
47.44
55.49
92.98
58.97
75.78
Pry. only
Enrolment by nature of disability
7.4
11.5
3.0
6.8
4.3
9.0
2.7
78.29
59.24
18.29
24.45
Otherrooms
20.29
12.16
2.89
14.33
4.84
Teachers by Edu. qualification (other than contract teachers)*
Classrooms/Other rooms
3.41
16.30
P + UP+Sec/HS
1,663 5,825 8,610 3,670 286 18 0 0
School category Grad.Below
Sec. Sec.Hr.
Sec.PostGrad.
MPhil/ PhD
PostDoc.
NoRes.
3.7 7.6
3.2 7.7
3.4 7.6
146,364
110,775
99,461
85,438
71,882
73,870
67,167
57,758
513,920
198,795
outCWSN1.2
U. Pry.Primary GER Primaryrate % SC enr. GER U. Pry.
26.39
10.35
12.35
% SC girls
% ST enr.
% ST girls
NER Primary
% TeachersinvolvedNumber ofdays involved
NER U. Pry.
Non-Tch assignment13.82 0.6% OBC enr.
% OBC
9.81 girls
9.19 % Muslim 2.3 1.7enr.
13.91 % Muslim Pr. level
192
Average Instructional days
14
93.4
25.8
50.5
U. Pr. level
199
-titionTotalRepe-aters
rate5,361
3,347
2,886
2,251
2,195
2,267
1,979
2,132
16,040girls6,378
3.11
4.18
3.12
3.03
3.14
2.70
2.94
3.00
3.50
12.16
129.585.0
Repe- Drop SC/ST/OBC enrolment Enrolment ratio1.00
Total CLSrooms
24,476
1,020
242
10,024
351
642
503
5,887
286
155
3,736
190
287
312
V
36
107
140
38
120
45
0
34
VIIIVII
70
VI
58
145 43 26
92 75 49
117 69 61
33 22 8
49101 92
67 46 36
0 1 1
143 80 60 42 20 17 9 4
376 173 163 90
IVI II IIINature of Disability
164 87 67 50
170 171 150 132
428 255 218 153
186 97 83 57
271 213391 168
199 164 119
6 7 2
73
8
36 181 35 23 15 11
86
49.4
91.350.1
49.6
51.2 48.1
48.8
0.8
53.389.8
42.6
1.2
1322
11,986
681
345
5,829
451
518
446
61.7
11.7
4.8
68.19.6
7.0
24.1
Girlsenrolment
71,724
54,972
49,874
43,640
37,171
38,916
35,728
30,683
257,381
105,327
1,246
783
572
461
356
327
224
135
3,418
686
Boys898
557
526
327
247
321
194
134
2,555
649
Girls
Blind
Low-vision
Hearing
Speach
Loco-motor
MentallyRetarded
Learning
CerebralPalsy
Autism
Multiple
0.05
0.04
0.04
21465
11103
15099813930
18814
14559
English
102583 188244
1902
52
5323420
472
421
Khasi
285
123581
0
0
138196
Garo
283
26751
186
0
3990
7109
884
Assamese Bengali
7888
96
0
00
3390
7781
0.17
0.10
0.13
0.81
0.62
0.71
Government
99.8 98.9
UP+Sec/HS P+UP+Sec UP+SecP + UPP. only 55 - 56 57-58 59-60 TLM SD Grant
Gender
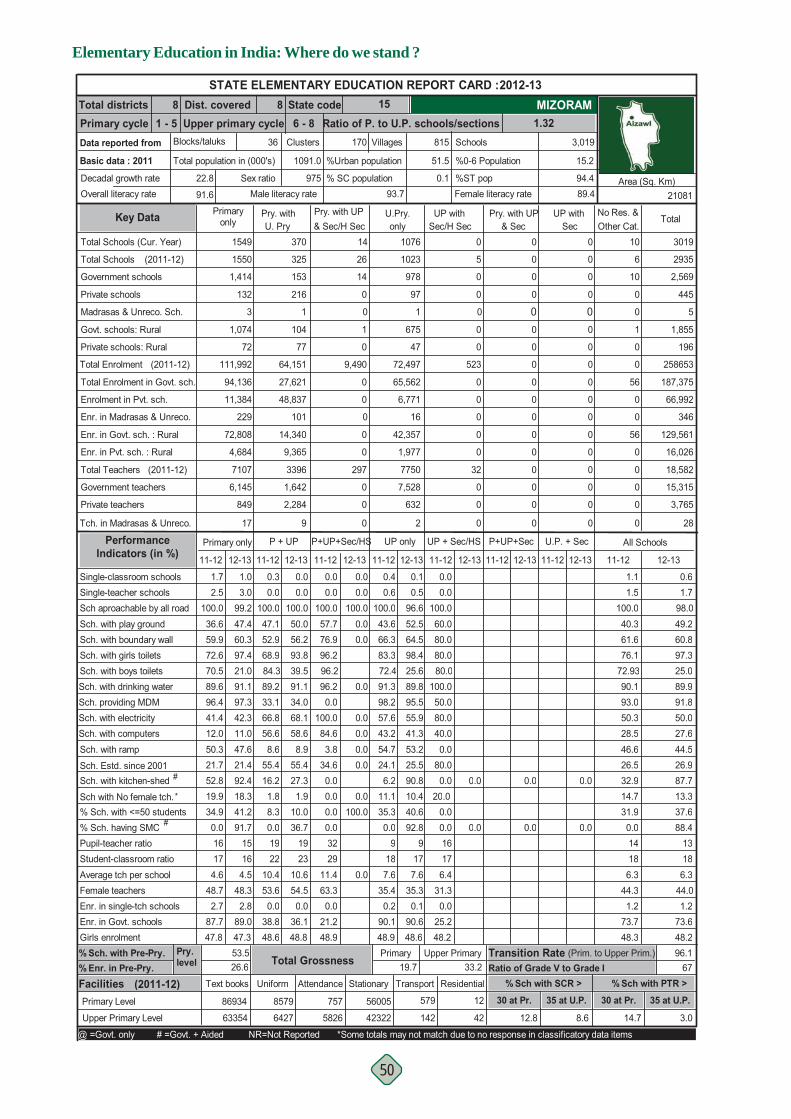
Elementary Education in India: Where do we stand ?
50
% Sch. with Pre-Pry.
Dist. covered State codeUpper primary cycle Ratio of P. to U.P. schools/sections 1.32
8 1581 - 5 6 - 8
Total districtsPrimary cycleData reported from
Basic data : 2011
Decadal growth rateOverall literacy rate
Blocks/taluks
22.8
91.6
Primaryonly
All Schools
Pry. withU. Pry
UP withSec/H Sec & Sec
Pry. with UP UP withSec
Pry. with UP & Sec/H Sec Other Cat.
No Res. &Total
Sch. with drinking water Sch. providing MDMSch. with electricity Sch. with computers
Sch. with kitchen-shedSch. Estd. since 2001
#
Sch. with ramp
Sch aproachable by all roadSch. with play groundSch. with boundary wallSch. with girls toilets
Single-teacher schoolsSingle-classroom schools
Sch. with boys toilets
97.342.311.047.621.492.4
12-13
3.099.247.460.3
1.0
97.421.091.1
56.68.6
55.4
33.1
16.2
11-12
47.152.9
0.0100.0
0.3
68.984.389.2
66.8
11-12
0.0
55.941.353.225.590.8
91.3
57.643.254.724.1
98.2
6.2
11-12 12-13
52.564.5
0.1
66.3
0.6100.0
0.4
43.6
0.596.6
98.483.325.672.489.895.5
12-13 11-12 12-13 11-12 12-13
0.0100.057.776.996.296.296.20.0
100.084.63.8
34.60.0
0.0
0.00.00.00.0
12-13
100.00.00.0
0.00.0
58.68.9
55.427.3
12-13
100.050.056.2
0.00.0
93.839.591.134.068.141.4
12.0
21.750.3
96.4
52.8
36.659.9
100.0
1.72.5
72.670.589.6
11-12
0.080.0
50.0
0.0
11-12
0.0100.060.080.0
0.0
80.080.0
100.0
80.040.0
Total Schools (Cur. Year) 1549 370 14 1076 10
Total Schools
Madrasas & Unreco. Sch.
Private schools
Private schools: Rural
Total Enrolment
Govt. schools: Rural
(2011-12)
1,414
132
3
1,074
72
111,992
1550
0
675
47
72,497
1
1023
978
97
0
9,490
0
26
14
0
1
325
153
216
1
104
77
64,151
6
10
0
0
1
0
0
Total Enrolment in Govt. sch.
Enrolment in Pvt. sch.
Enr. in Madrasas & Unreco.
Enr. in Govt. sch. : Rural
Enr. in Pvt. sch. : Rural
Total Teachers
Private teachers
Government teachers
Tch. in Madrasas & Unreco.
94,136
11,384
229
72,808
4,684
7107
6,145
849
17
P + UP P+UP+Sec/HS UP only UP + Sec/HS P+UP+Sec U.P. + Sec
65,562
6,771
1,977
42,357
7750
7,528
632
16
2
0
0
0
0
297
0
0
0
0
27,621
48,837
101
14,340
9,365
3396
1,642
2,284
9
56
0
0
56
0
0
0
0
0
Primary only Performance Indicators (in %)
Government schools
0
5
0
0
0
0
523
0
0
0
0
0
32
0
0
0
3019
2935
2,569
445
5
1,855
196
258653
187,375
66,992
346
129,561
16,026
18,582
15,315
3,765
28
1.1 0.61.5 1.7
100.0 98.040.3 49.261.6 60.876.1 97.3
72.93 25.090.1 89.993.0 91.850.3 50.028.5 27.646.6 44.526.5 26.932.9 87.7
11-12 12-13
0.0 0.0 0.0
STATE ELEMENTARY EDUCATION REPORT CARD : 2012-13
3,019
Female literacy rate
15.2
94.489.4
%ST pop
%0-6 Population
Schools
0.1
51.5
81536
Total population in (000's)
Sex ratio93.7
% SC population
%Urban population
170 VillagesClusters
1091.0
975Male literacy rate 21081
Area (Sq. Km)
MIZORAM
Key Data
0 0
0 0
0 0
0 00 0
0 0
0 0
0 0
0 0
0 0
0 0
0 0
0 0
0 0
0 0
0 0
(2011-12)
(2011-12)
Pupil-teacher ratio% Sch. having SMC
Student-classroom ratio Average tch per schoolFemale teachersEnr. in single-tch schools
Girls enrolmentEnr. in Govt. schools
164.5
48.32.8
89.0
91.7
47.3
1522
10.453.60.0
38.848.6
0.019
187.6
35.40.2
90.148.9
0.09
177.6
35.30.1
90.6
92.8
48.6
90.03229
11.463.30.0
21.248.9
0.023
10.654.50.0
36.1
36.7
48.8
19174.6
48.72.7
87.747.8
0.016
176.4
31.30.0
25.248.2
0.016 13
31.9 37.60.0 88.41418 186.3 6.3
44.3 44.01.2 1.2
73.7 73.648.3 48.2
0.0 0.0 0.0% Sch. with <=50 students 34.9 41.2 8.3 10.0 0.0 100.0 35.3 40.6 0.0
#
Upper Primary Level 63354 12.8 8.6 3.0
86934Primary Level
Facilities Text books
26.6 19.7 33.2 67 Residential
% Enr. in Pre-Pry.
13.3Sch with No female tch. 19.9 18.3 1.8 1.9 0.0 0.0 11.1 10.4 20.0 14.7
14.7
% Sch with SCR > % Sch with PTR >Ratio of Grade V to Grade I
53.5 Primary Upper Primary 96.1
30 at Pr. 35 at U.P. 30 at Pr.
Pry. level Total Grossness Transition Rate (Prim. to Upper Prim.)
*
@ =Govt. only # =Govt. + Aided NR=Not Reported *Some totals may not match due to no response in classificatory data items
0 0
U.Pry.only
579
142
TransportStationary
56005
423225826
757
AttendanceUniform
8579
6427
12
42
35 at U.P.(2011-12)
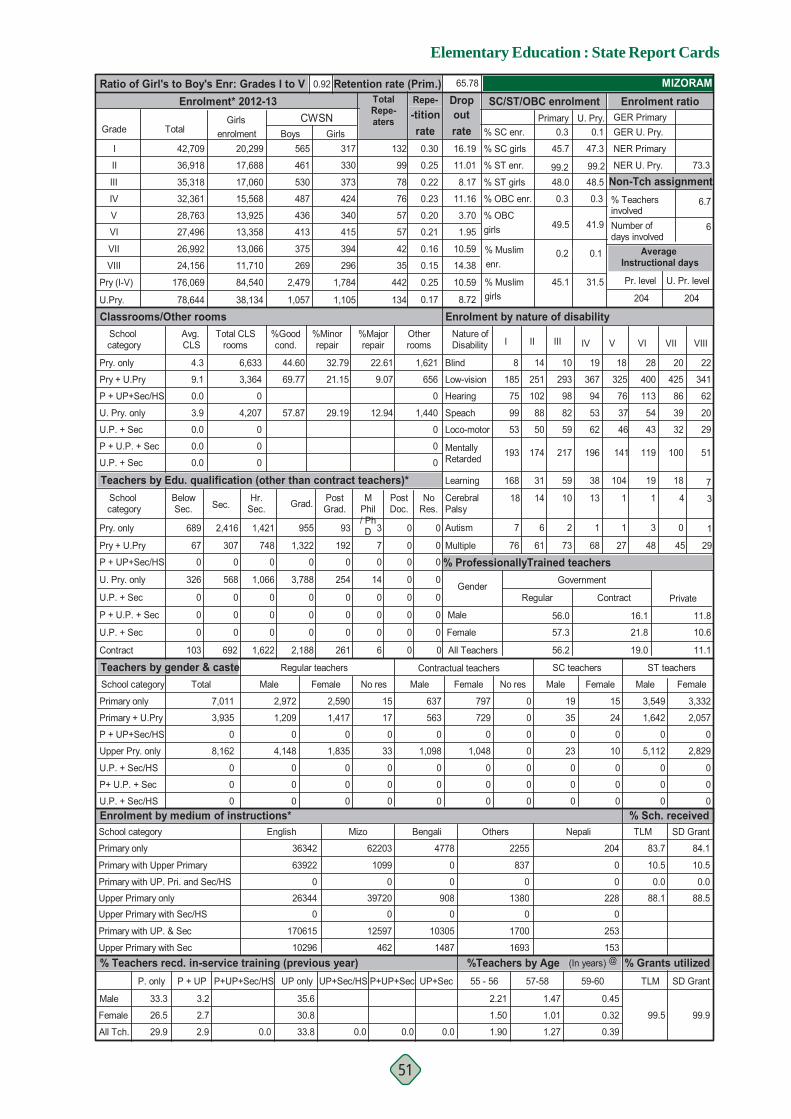
Elementary Education : State Report Cards
51
Retention rate (Prim.)
8.720.17
% Grants utilized%Teachers by Age (In years)
65.78
Enrolment* 2012-13 Ratio of Girl's to Boy's Enr: Grades I to V
Grade Total
I
II
III
IV
V
VI
VII
VIII
Pry (I-V)
U.P. + Sec
Pry + U.Pry
U. Pry. only
0
U.P. + Sec
P + U.P. + Sec
Contract
Primary only
Primary + U.Pry
P + UP+Sec/HS
Upper Pry. only
U.P. + Sec/HS
P+ U.P. + Sec
U.P. + Sec/HS
Teachers by gender & casteSchool category
School category
Primary only
Primary with Upper Primary
Primary with UP. Pri. and Sec/HS
Upper Primary onlyUpper Primary with Sec/HS
Primary with UP. & Sec
Upper Primary with Sec % Teachers recd. in-service training (previous year)
% Sch. received
MIZORAM
@
SD Grant
% ProfessionallyTrained teachers
Regular Private
Male
Female
All Tch.
All Teachers
Female
Male
Contract
11.1
10.6
11.8
19.0
21.8
16.1
57.3
56.2
56.0
33.3
26.5
29.9
3.2
2.7
2.9
35.6
30.8
33.80.0
P+UP+Sec/HS UP only
0.0
P + UP+Sec/HS
67
0
326
0
0
0
103
0
568
0
0
0
692
0
1,066
0
0
0
1,622 2,188
0
0
0
3,788
0 0
254
0
0
0
261
0
14
0
0
0
6
0
0
0
0
0
0
0
0
0
0
0
0
8,162
0
0
0
7,011
Total
3,935
Enrolment by medium of instructions*
1,209
0
4,148
0
0
0
Male
2,972
Regular teachers
1,835
0
0
0
Female
2,590
1,417
0
17
0
33
0
0
0
No res
15 797
729
0
1,048
0
0
0
Female
637
563
0
1,098
0
0
0
Male
Contractual teachers
0
0
0
0
0
0
0
No res
19
35
0
23
0
0
SC teachers
Male
15
24
0
10
0
0
Female
ST teachers
3,549
1,642
0
5,112
0
0
0
Male Female
TLM
83.7
10.5
0.0
88.1
307 748 1,322 192 7 0 0
U.Pry.
Avg. CLS
School category
Pry. only
Pry + U.Pry
U. Pry. only
U.P. + Sec
P + U.P. + Sec
U.P. + Sec
%Majorrepair
%Minorrepair
32.79
21.15
29.19
%Goodcond.
44.60
69.77
57.87
Pry. only
Enrolment by nature of disability
9.1
0.0
3.9
0.0
0.0
0.0
4.3
Otherrooms
22.61
9.07
12.94
Teachers by Edu. qualification (other than contract teachers)*
Classrooms/Other rooms
P + UP+Sec/HS
689 2,416 1,421 955 93 3 0 0
School category Grad.Below
Sec. Sec.Hr.
Sec.PostGrad.
MPhil/ PhD
PostDoc.
NoRes.
0.0 0.0
42,709
36,918
35,318
32,361
28,763
27,496
26,992
24,156
176,069
78,644
outCWSN0.1
U. Pry.Primary GER Primaryrate % SC enr. GER U. Pry.
16.19
11.01
8.17
% SC girls
% ST enr.
% ST girls
NER Primary
% TeachersinvolvedNumber ofdays involved
NER U. Pry.
Non-Tch assignment11.16 0.3% OBC enr.
3.70 % OBC
1.95 girls
10.59 % Muslim enr.
10.59 % Muslim Pr. level
204
Average Instructional days
6
6.7
73.3
U. Pr. level
204
-titionTotalRepe-aters
rate132
99
78
76
57
57
42
35
442girls134
0.25
0.15
0.16
0.21
0.20
0.23
0.22
0.25
0.30
14.38
Repe- Drop SC/ST/OBC enrolment Enrolment ratio0.92
Total CLSrooms
6,633
3,364
0
4,207
0
0
0
1,621
656
0
1,440
0
0
0
V
18
325
76
37
46
104
1
51
VIIIVII
119
VI
100
28 20 22
400 425 341
113 86 62
54 39 20
2943 32
19 18 7
3 0 1
76 61 73 68 27 48 45 29
193 174 217 196
IVI II IIINature of Disability
8 14 10 19
185 251 293 367
75 102 98 94
99 88 82 53
50 5953 62
168 31 59
7 6 2
38
1
41 318 14 10 13 1
141
0.3
45.7
99.248.0
49.5
0.2
45.1 31.5
0.1
41.9
0.3
48.599.2
47.3
00
3,332
2,057
0
2,829
0
0
0
84.1
10.5
0.0
88.5
Girlsenrolment
20,299
17,688
17,060
15,568
13,925
13,358
13,066
11,710
84,540
38,134
565
461
530
487
436
413
375
269
2,479
1,057
Boys317
330
373
424
340
415
394
296
1,784
1,105
Girls
Blind
Low-vision
Hearing
Speach
Loco-motor
MentallyRetarded
Learning
CerebralPalsy
Autism
Multiple
0.45
0.32
0.39
63922
0
263440
170615
10296
English
36342 62203
1099
0
397200
12597
462
Mizo
10305
0908
0
0
4778
Bengali
1487
2255
837
0
13800
1700
1693
Others Nepali
204
0
0
2280
253
153
1.47
1.01
1.27
2.21
1.50
1.90
Government
99.5 99.9
UP+Sec/HS P+UP+Sec UP+SecP + UPP. only 55 - 56 57-58 59-60 TLM SD Grant
Gender
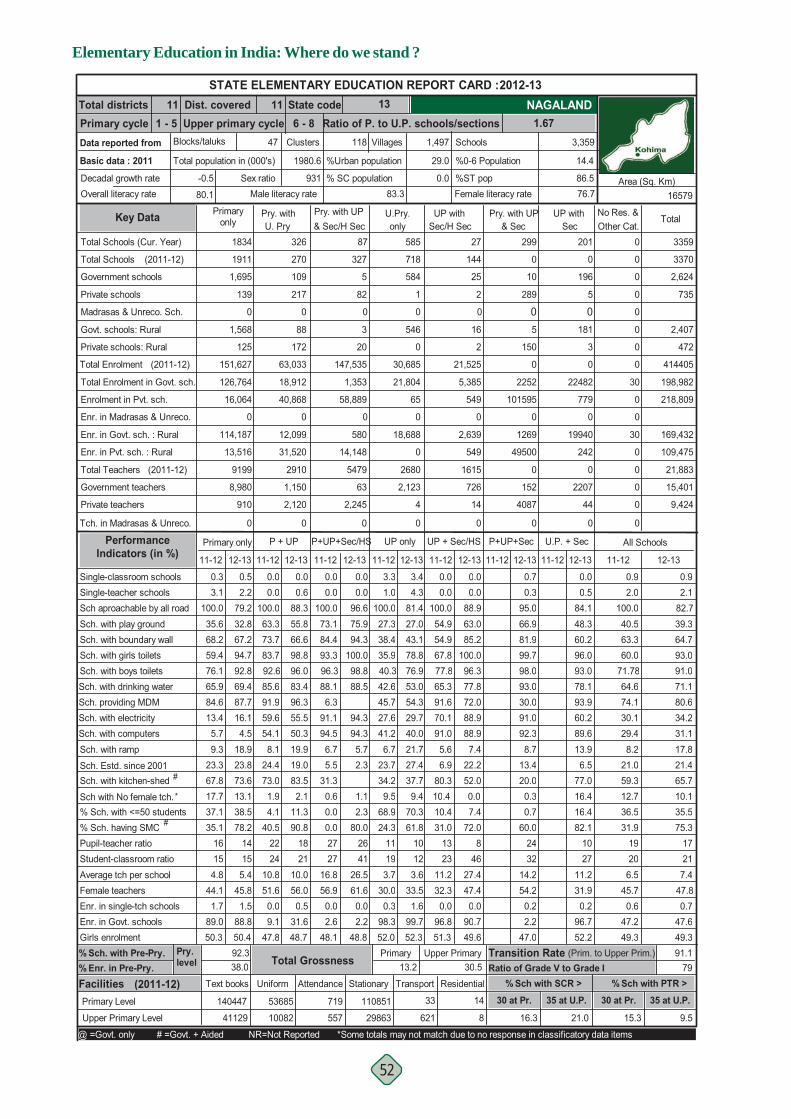
Elementary Education in India: Where do we stand ?
52
% Sch. with Pre-Pry.
Dist. covered State codeUpper primary cycle Ratio of P. to U.P. schools/sections 1.67
11 13111 - 5 6 - 8
Total districtsPrimary cycleData reported from
Basic data : 2011
Decadal growth rateOverall literacy rate
Blocks/taluks
-0.5
80.1
Primaryonly
All Schools
Pry. withU. Pry
UP withSec/H Sec & Sec
Pry. with UP UP withSec
Pry. with UP & Sec/H Sec Other Cat.
No Res. &Total
Sch. with drinking water Sch. providing MDMSch. with electricity Sch. with computers
Sch. with kitchen-shedSch. Estd. since 2001
#
Sch. with ramp
Sch aproachable by all roadSch. with play groundSch. with boundary wallSch. with girls toilets
Single-teacher schoolsSingle-classroom schools
Sch. with boys toilets
87.716.14.5
18.923.873.6
12-13
2.279.232.867.2
0.5
94.792.869.4
54.18.1
24.4
91.9
73.0
11-12
63.373.7
0.0100.0
0.0
83.792.685.6
59.6
11-12
0.0
29.740.021.727.437.7
42.6
27.641.26.7
23.7
45.7
34.2
11-12 12-13
27.043.1
3.4
38.4
1.0100.0
3.3
27.3
4.381.4
78.835.976.940.353.054.3
12-13 11-12
0.7
12-13 11-12
0.5
12-13
0.00.0
100.073.184.493.396.388.16.3
91.194.56.75.5
31.3
88.5
94.394.35.72.3
12-13
96.675.994.3
0.00.0
100.098.8
50.319.919.083.5
12-13
88.355.866.6
0.00.6
98.896.083.496.355.513.4
5.7
23.39.3
84.6
67.8
35.668.2
100.0
0.33.1
59.476.165.9
11-12
0.0
5.66.9
91.6
80.3
11-12
0.0100.054.954.9
0.0
67.877.865.3
70.191.0
Total Schools (Cur. Year) 1834 326 87 585 0
Total Schools
Madrasas & Unreco. Sch.
Private schools
Private schools: Rural
Total Enrolment
Govt. schools: Rural
(2011-12)
1,695
139
0
1,568
125
151,627
1911
2
546
0
30,685
0
718
584
1
20
147,535
0
327
5
82
3
270
109
217
0
88
172
63,033
0
0
0
0
0
0
0
Total Enrolment in Govt. sch.
Enrolment in Pvt. sch.
Enr. in Madrasas & Unreco.
Enr. in Govt. sch. : Rural
Enr. in Pvt. sch. : Rural
Total Teachers
Private teachers
Government teachers
Tch. in Madrasas & Unreco.
126,764
16,064
0
114,187
13,516
9199
8,980
910
0
P + UP P+UP+Sec/HS UP only UP + Sec/HS P+UP+Sec U.P. + Sec
21,804
65
0
18,688
2680
2,123
4
0
0
1,353
58,889
14,148
580
5479
63
2,245
0
0
18,912
40,868
0
12,099
31,520
2910
1,150
2,120
0
30
0
0
30
0
0
0
0
0
Primary only Performance Indicators (in %)
Government schools
27
144
25
0
16
2
21,525
5,385
549
0
2,639
549
1615
726
14
0
3359
3370
2,624
735
2,407
472
414405
198,982
218,809
169,432
109,475
21,883
15,401
9,424
0.9 0.92.0 2.1
100.0 82.740.5 39.363.3 64.760.0 93.0
71.78 91.064.6 71.174.1 80.630.1 34.229.4 31.18.2 17.8
21.0 21.459.3 65.7
11-12 12-13
0.088.963.085.2
100.096.377.8
0.3
72.088.988.97.4
22.252.0
95.066.981.999.798.093.030.0
84.148.360.296.093.078.193.9
91.092.38.7
13.420.0
60.289.613.96.5
77.0
STATE ELEMENTARY EDUCATION REPORT CARD : 2012-13
3,359
Female literacy rate
14.4
86.576.7
%ST pop
%0-6 Population
Schools
0.0
29.0
1,49747
Total population in (000's)
Sex ratio83.3
% SC population
%Urban population
118 VillagesClusters
1980.6
931Male literacy rate 16579
Area (Sq. Km)
NAGALAND
Key Data
0 0
10 196
289 5
0 05 181
150 3
0 0
2252 22482
101595 779
0 0
1269 19940
49500 242
0 0
152 2207
4087 44
0 0
(2011-12)
(2011-12)
Pupil-teacher ratio% Sch. having SMC
Student-classroom ratio Average tch per schoolFemale teachersEnr. in single-tch schools
Girls enrolmentEnr. in Govt. schools
155.4
45.81.5
88.8
78.2
50.4
1424
10.851.60.09.1
47.8
40.522
193.7
30.00.3
98.352.0
24.311
123.6
33.51.6
99.7
61.8
52.3
100.02727
16.856.90.02.6
48.12.2
80.0
48.8
2641
26.561.60.0
2110.056.00.5
31.6
90.8
48.7
18154.8
44.11.7
89.050.3
35.116
2311.232.30.0
96.851.3
31.013 17
36.5 35.531.9 75.3
1920 216.5 7.4
45.7 47.80.6 0.7
47.2 47.649.3 49.3
72.08
4627.447.40.0
90.749.6
60.0 82.12432
14.254.20.22.2
47.0
1027
11.231.90.2
96.752.2
% Sch. with <=50 students 37.1 38.5 4.1 11.3 0.0 2.3 68.9 70.3 10.4 7.4 0.7 16.4#
Upper Primary Level 41129 16.3 21.0 9.5
140447Primary Level
Facilities Text books
38.0 13.2 30.5 79 Residential
% Enr. in Pre-Pry.
10.1Sch with No female tch. 17.7 13.1 1.9 2.1 0.6 1.1 9.5 9.4 10.4 0.0 12.7
15.3
% Sch with SCR > % Sch with PTR >Ratio of Grade V to Grade I
92.3 Primary Upper Primary 91.1
30 at Pr. 35 at U.P. 30 at Pr.
Pry. level Total Grossness Transition Rate (Prim. to Upper Prim.)
*
@ =Govt. only # =Govt. + Aided NR=Not Reported *Some totals may not match due to no response in classificatory data items
0.3 16.4
299 201
U.Pry.only
33
621
TransportStationary
110851
29863557
719
AttendanceUniform
53685
10082
14
8
35 at U.P.(2011-12)
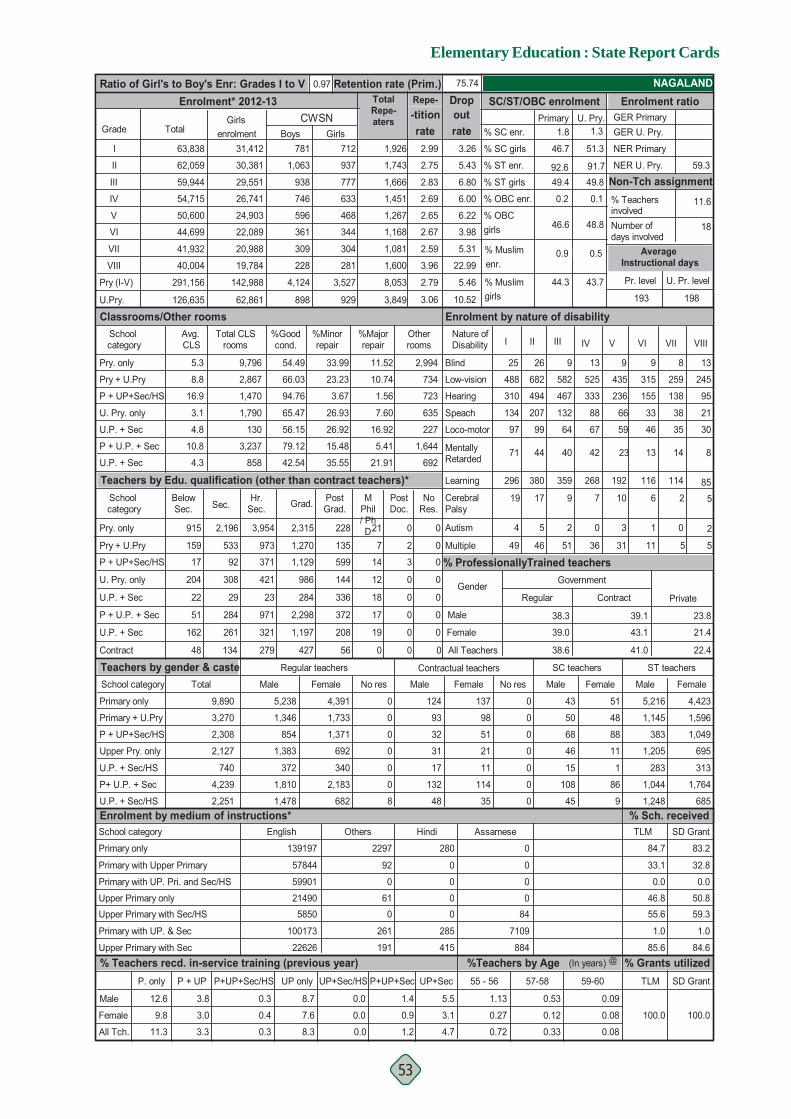
Elementary Education : State Report Cards
53
Retention rate (Prim.)
10.523.06
% Grants utilized%Teachers by Age (In years)
75.74
Enrolment* 2012-13 Ratio of Girl's to Boy's Enr: Grades I to V
Grade Total
I
II
III
IV
V
VI
VII
VIII
Pry (I-V)
U.P. + Sec
Pry + U.Pry
U. Pry. only
0
U.P. + Sec
P + U.P. + Sec
Contract
Primary only
Primary + U.Pry
P + UP+Sec/HS
Upper Pry. only
U.P. + Sec/HS
P+ U.P. + Sec
U.P. + Sec/HS
Teachers by gender & casteSchool category
School category
Primary only
Primary with Upper Primary
Primary with UP. Pri. and Sec/HS
Upper Primary onlyUpper Primary with Sec/HS
Primary with UP. & Sec
Upper Primary with Sec % Teachers recd. in-service training (previous year)
% Sch. received
NAGALAND
@
SD Grant
% ProfessionallyTrained teachers
Regular Private
Male
Female
All Tch.
All Teachers
Female
Male
Contract
22.4
21.4
23.8
41.0
43.1
39.1
39.0
38.6
38.3
12.6
9.8
11.3
3.8
3.0
3.3
8.7
7.6
8.3
0.4
0.3
0.3
P+UP+Sec/HS UP only
0.0
0.0
0.0
P + UP+Sec/HS
159
17
204
22
51
162
48
92
308
29
284
261
134
371
421
23
971
321
279 427
1,197
2,298
284
986
1,129 599
144
336
372
208
56
14
12
18
17
19
0
3
0
0
0
0
0
0
0
0
0
0
2,308
2,127
740
4,239
2,251
9,890
Total
3,270
Enrolment by medium of instructions*
1,346
854
1,383
372
1,810
1,478
Male
5,238
Regular teachers
692
340
2,183
682
Female
4,391
1,733
1,371
0
0
0
0
0
8
No res
0 137
98
51
21
11
114
35
Female
124
93
32
31
17
132
48
Male
Contractual teachers
0
0
0
0
0
0
0
No res
43
50
68
46
15
108
SC teachers
Male
51
48
88
11
1
86
Female
ST teachers
5,216
1,145
383
1,205
283
1,044
1,248
Male Female
TLM
84.7
33.1
0.0
46.855.6
1.0
85.6
533 973 1,270 135 7 2 0
U.Pry.
Avg. CLS
School category
Pry. only
Pry + U.Pry
U. Pry. only
U.P. + Sec
P + U.P. + Sec
U.P. + Sec
%Majorrepair
%Minorrepair
33.99
23.23
3.67
26.93
26.92
%Goodcond.
54.49
66.03
94.76
65.47
56.15
Pry. only
Enrolment by nature of disability
8.8
16.9
3.1
4.8
4.3
10.8
5.3
79.12
42.54
15.48
35.55
Otherrooms
11.52
10.74
1.56
7.60
16.92
Teachers by Edu. qualification (other than contract teachers)*
Classrooms/Other rooms
5.41
21.91
P + UP+Sec/HS
915 2,196 3,954 2,315 228 21 0 0
School category Grad.Below
Sec. Sec.Hr.
Sec.PostGrad.
MPhil/ PhD
PostDoc.
NoRes.
1.4 5.5
0.9 3.1
1.2 4.7
63,838
62,059
59,944
54,715
50,600
44,699
41,932
40,004
291,156
126,635
outCWSN1.8
U. Pry.Primary GER Primaryrate % SC enr. GER U. Pry.
3.26
5.43
6.80
% SC girls
% ST enr.
% ST girls
NER Primary
% TeachersinvolvedNumber ofdays involved
NER U. Pry.
Non-Tch assignment6.00 0.2% OBC enr.
6.22 % OBC
3.98 girls
5.31 % Muslim enr.
5.46 % Muslim Pr. level
193
Average Instructional days
18
11.6
59.3
U. Pr. level
198
-titionTotalRepe-aters
rate1,926
1,743
1,666
1,451
1,267
1,168
1,081
1,600
8,053girls3,849
2.79
3.96
2.59
2.67
2.65
2.69
2.83
2.75
2.99
22.99
Repe- Drop SC/ST/OBC enrolment Enrolment ratio0.97
Total CLSrooms
9,796
2,867
1,470
1,790
130
3,237
858
2,994
734
723
635
227
1,644
692
V
9
435
236
66
59
192
3
8
VIIIVII
13
VI
14
9 8 13
315 259 245
155 138 95
33 38 21
3046 35
116 114 85
1 0 2
49 46 51 36 31 11 5 5
71 44 40 42
IVI II IIINature of Disability
25 26 9 13
488 682 582 525
310 494 467 333
134 207 132 88
99 6497 67
296 380 359
4 5 2
268
0
26 519 17 9 7 10
23
46.7
92.649.4
46.6
0.9
44.3 43.7
0.5
48.8
0.1
49.891.7
51.3
1.3
945
4,423
1,596
1,049
695
313
1,764
685
83.2
32.8
0.0
50.859.3
1.0
84.6
Girlsenrolment
31,412
30,381
29,551
26,741
24,903
22,089
20,988
19,784
142,988
62,861
781
1,063
938
746
596
361
309
228
4,124
898
Boys712
937
777
633
468
344
304
281
3,527
929
Girls
Blind
Low-vision
Hearing
Speach
Loco-motor
MentallyRetarded
Learning
CerebralPalsy
Autism
Multiple
0.09
0.08
0.08
57844
59901
214905850
100173
22626
English
139197 2297
92
0
610
261
191
Others
285
00
0
0
280
Hindi
415
0
0
0
084
7109
884
Assamese
0.53
0.12
0.33
1.13
0.27
0.72
Government
100.0 100.0
UP+Sec/HS P+UP+Sec UP+SecP + UPP. only 55 - 56 57-58 59-60 TLM SD Grant
Gender
Elementary Education in India: Where do we stand ?
54
% Sch. with Pre-Pry.
Dist. covered State codeUpper primary cycle Ratio of P. to U.P. schools/sections 1.85
30 21301 - 5 6 - 8
Total districtsPrimary cycleData reported from
Basic data : 2011
Decadal growth rateOverall literacy rate
Blocks/taluks
14.0
73.5
Primaryonly
All Schools
Pry. withU. Pry
UP withSec/H Sec & Sec
Pry. with UP UP withSec
Pry. with UP & Sec/H Sec Other Cat.
No Res. &Total
Sch. with drinking water Sch. providing MDMSch. with electricity Sch. with computers
Sch. with kitchen-shedSch. Estd. since 2001
#
Sch. with ramp
Sch aproachable by all roadSch. with play groundSch. with boundary wallSch. with girls toilets
Single-teacher schoolsSingle-classroom schools
Sch. with boys toilets
95.710.54.0
52.329.052.6
12-13
12.083.518.457.8
8.5
62.317.294.3
13.864.65.6
95.6
33.0
11-12
29.673.6
1.3100.0
0.9
52.683.597.2
30.9
11-12
0.6
26.27.1
48.71.3
48.2
92.5
24.16.7
43.71.2
95.3
8.0
11-12 12-13
50.465.4
3.1
62.6
4.8100.0
2.7
51.0
6.790.2
66.245.617.272.394.396.6
12-13 11-12
4.4
12-13 11-12
0.4
12-13
24.73.5
100.056.983.868.676.498.488.069.953.434.98.2
43.5
100.0
95.981.426.816.520.7
12-13
75.392.897.9
1.08.2
90.649.5
20.7
14.667.66.8
64.0
12-13
85.529.775.4
1.11.1
75.427.897.596.833.89.2
3.7
28.145.6
94.9
20.0
18.255.5
100.0
7.812.8
29.374.992.9
11-12
2.7
11.32.8
89.5
11.8
11-12
0.3100.071.568.6
2.5
68.772.195.9
56.218.8
Total Schools (Cur. Year) 37075 16910 97 3988 0
Total Schools
Madrasas & Unreco. Sch.
Private schools
Private schools: Rural
Total Enrolment
Govt. schools: Rural
(2011-12)
35,625
893
557
33,797
711
2,345,721
37293
2
2,165
1,535
338,593
71
4107
2,304
1,613
20
393,016
6
1087
29
62
8
16731
15,288
996
626
14,530
706
2,869,412
0
0
0
0
0
0
0
Total Enrolment in Govt. sch.
Enrolment in Pvt. sch.
Enr. in Madrasas & Unreco.
Enr. in Govt. sch. : Rural
Enr. in Pvt. sch. : Rural
Total Teachers
Private teachers
Government teachers
Tch. in Madrasas & Unreco.
2,090,522
80,287
40029
1,934,523
59,515
92920
83,210
4,764
3675
P + UP P+UP+Sec/HS UP only UP + Sec/HS P+UP+Sec U.P. + Sec
221,443
95,547
90,103
208,497
11116
6,963
3,387
3369
190
18,693
49,247
9,746
3,525
11832
597
1,430
3731
175
2,490,780
197,727
116477
2,317,177
127,661
91103
76,470
10,795
6641
0
0
0
0
0
0
0
0
0
Primary only Performance Indicators (in %)
Government schools
37
7471
34
1
28
1
573,388
6,411
456
16
5,452
52
58066
577
41
6
67271
66689
58,355
7418
1498
55,101
6,437
6520130
5,458,962
761,458
201,995
5,014,946
502,497
265,037
206,252
52,727
13,194
5.0 7.97.9 7.4
100.0 85.229.7 29.662.4 64.941.1 68.5
76.65 21.194.4 94.894.5 95.621.8 23.99.0 9.2
46.2 52.117.7 18.221.8 54.0
11-12 12-13
0.078.494.694.694.451.4
100.0
1.3
44.197.381.121.635.135.3
85.243.580.680.929.494.093.9
90.070.971.281.425.591.392.4
52.732.648.94.6
61.9
58.917.318.32.6
39.4
STATE ELEMENTARY EDUCATION REPORT CARD : 2012-13
67,271
Female literacy rate
12.0
22.864.4
%ST pop
%0-6 Population
Schools
17.1
16.7
38,803419
Total population in (000's)
Sex ratio82.4
% SC population
%Urban population
5,026 VillagesClusters
41947.4
978Male literacy rate 155707
Area (Sq. Km)
ODISHA
Key Data
0 0
1371 3704
432 3420
96 1411310 3263
207 3257
0 0
285340 345773
161961 176233
32834 5539
269607 276165
50380 165040
0 0
10334 28101
6139 26171
1378 1129
(2011-12)
(2011-12)
Pupil-teacher ratio% Sch. having SMC
Student-classroom ratio Average tch per schoolFemale teachersEnr. in single-tch schools
Girls enrolmentEnr. in Govt. schools
222.5
42.87.3
94.6
94.6
49.0
24325.4
43.70.9
90.848.3
67.831
332.7
29.63.7
69.648.5
72.030
322.6
30.94.8
69.1
94.7
48.7
3056.7
3332
10.948.27.1
33.746.1
26.1
37.9
44.2
3334
22.766.58.5
315.6
46.21.0
88.8
95.5
48.3
30242.5
42.08.2
94.349.0
65.525
177.8
24.30.3
66.149.6
50.810 24
36.5 38.464.9 86.1
2527 274.0 4.0
38.5 40.33.9 3.4
85.4 85.048.6 48.5
26.51119
16.937.00.0
93.140.3
7.4 26.927369.4
44.01.5
59.447.0
10217.6
25.70.4
65.549.3
% Sch. with <=50 students 51.5 54.4 5.2 6.1 3.8 3.1 27.4 30.2 41.3 2.7 6.8 45.6#
Upper Primary Level 1598337 31.7 34.6 26.5
3741754Primary Level
Facilities Text books
4.8 16.8 26.7 90 Residential
% Enr. in Pre-Pry.
31.1Sch with No female tch. 34.3 33.8 23.1 22.2 12.1 3.1 50.1 47.5 34.8 5.4 32.1
31.6
% Sch with SCR > % Sch with PTR >Ratio of Grade V to Grade I
7.3 Primary Upper Primary 86.9
30 at Pr. 35 at U.P. 30 at Pr.
Pry. level Total Grossness Transition Rate (Prim. to Upper Prim.)
*
@ =Govt. only # =Govt. + Aided NR=Not Reported *Some totals may not match due to no response in classificatory data items
18.3 33.0
1899 7265
U.Pry.only
99542
80495
TransportStationary
3311974
1297565193689
58082
AttendanceUniform
167966
69372
26578
33832
35 at U.P.(2011-12)
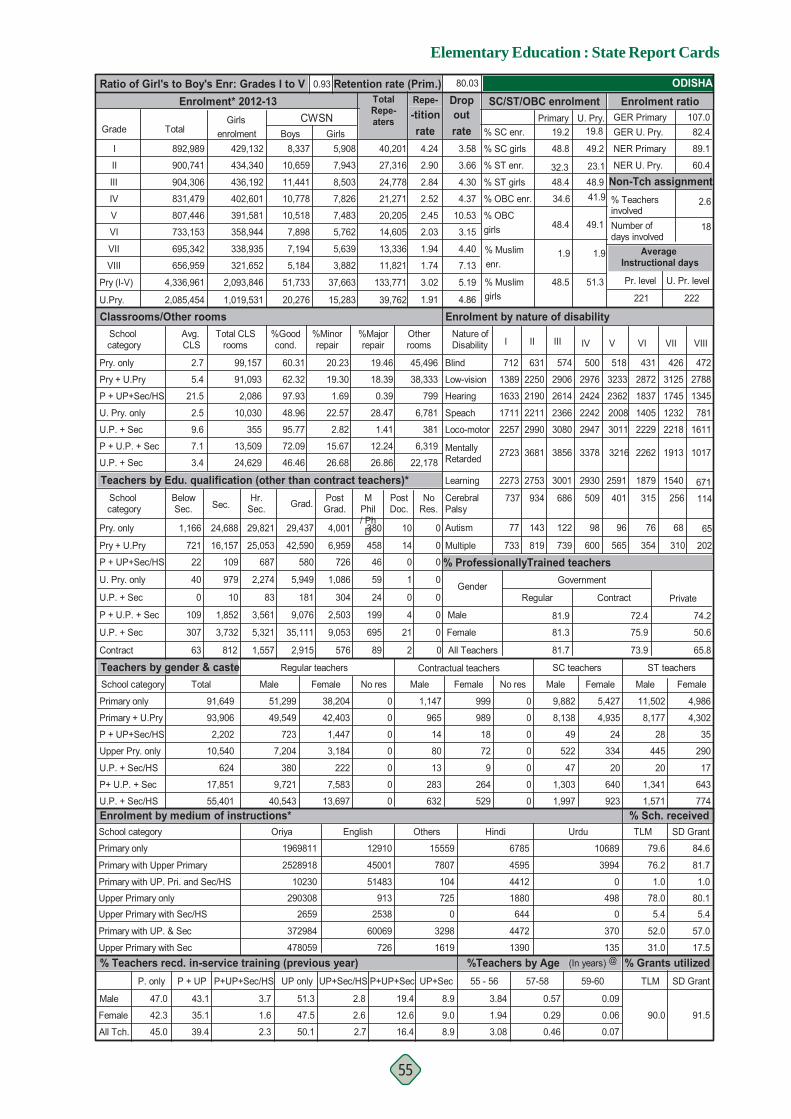
Elementary Education : State Report Cards
55
Retention rate (Prim.)
4.861.91
% Grants utilized%Teachers by Age (In years)
80.03
Enrolment* 2012-13 Ratio of Girl's to Boy's Enr: Grades I to V
Grade Total
I
II
III
IV
V
VI
VII
VIII
Pry (I-V)
U.P. + Sec
Pry + U.Pry
U. Pry. only
0
U.P. + Sec
P + U.P. + Sec
Contract
Primary only
Primary + U.Pry
P + UP+Sec/HS
Upper Pry. only
U.P. + Sec/HS
P+ U.P. + Sec
U.P. + Sec/HS
Teachers by gender & casteSchool category
School category
Primary only
Primary with Upper Primary
Primary with UP. Pri. and Sec/HS
Upper Primary onlyUpper Primary with Sec/HS
Primary with UP. & Sec
Upper Primary with Sec % Teachers recd. in-service training (previous year)
% Sch. received
ODISHA
@
SD Grant
% ProfessionallyTrained teachers
Regular Private
Male
Female
All Tch.
All Teachers
Female
Male
Contract
65.8
50.6
74.2
73.9
75.9
72.4
81.3
81.7
81.9
47.0
42.3
45.0
43.1
35.1
39.4
51.3
47.5
50.1
1.6
2.3
3.7
P+UP+Sec/HS UP only
2.8
2.7
2.6
P + UP+Sec/HS
721
22
40
0
109
307
63
109
979
10
1,852
3,732
812
687
2,274
83
3,561
5,321
1,557 2,915
35,111
9,076
181
5,949
580 726
1,086
304
2,503
9,053
576
46
59
24
199
695
89
0
1
0
4
21
2
0
0
0
0
0
2,202
10,540
624
17,851
55,401
91,649
Total
93,906
Enrolment by medium of instructions*
49,549
723
7,204
380
9,721
40,543
Male
51,299
Regular teachers
3,184
222
7,583
13,697
Female
38,204
42,403
1,447
0
0
0
0
0
0
No res
0 999
989
18
72
9
264
529
Female
1,147
965
14
80
13
283
632
Male
Contractual teachers
0
0
0
0
0
0
0
No res
9,882
8,138
49
522
47
1,303
SC teachers
Male
5,427
4,935
24
334
20
640
Female
ST teachers
11,502
8,177
28
445
20
1,341
1,571
Male Female
TLM
79.6
76.2
1.0
78.05.4
52.0
31.0
16,157 25,053 42,590 6,959 458 14 0
U.Pry.
Avg. CLS
School category
Pry. only
Pry + U.Pry
U. Pry. only
U.P. + Sec
P + U.P. + Sec
U.P. + Sec
%Majorrepair
%Minorrepair
20.23
19.30
1.69
22.57
2.82
%Goodcond.
60.31
62.32
97.93
48.96
95.77
Pry. only
Enrolment by nature of disability
5.4
21.5
2.5
9.6
3.4
7.1
2.7
72.09
46.46
15.67
26.68
Otherrooms
19.46
18.39
0.39
28.47
1.41
Teachers by Edu. qualification (other than contract teachers)*
Classrooms/Other rooms
12.24
26.86
P + UP+Sec/HS
1,166 24,688 29,821 29,437 4,001 380 10 0
School category Grad.Below
Sec. Sec.Hr.
Sec.PostGrad.
MPhil/ PhD
PostDoc.
NoRes.
19.4 8.9
12.6 9.0
16.4 8.9
892,989
900,741
904,306
831,479
807,446
733,153
695,342
656,959
4,336,961
2,085,454
outCWSN19.2
U. Pry.Primary GER Primaryrate % SC enr. GER U. Pry.
3.58
3.66
4.30
% SC girls
% ST enr.
% ST girls
NER Primary
% TeachersinvolvedNumber ofdays involved
NER U. Pry.
Non-Tch assignment4.37 41.9% OBC enr.
10.53 % OBC
3.15 girls
4.40 % Muslim 1.9 1.9enr.
5.19 % Muslim Pr. level
221
Average Instructional days
18
89.1
2.6
60.4
U. Pr. level
222
-titionTotalRepe-aters
rate40,201
27,316
24,778
21,271
20,205
14,605
13,336
11,821
133,771girls39,762
3.02
1.74
1.94
2.03
2.45
2.52
2.84
2.90
4.24
7.13
107.082.4
Repe- Drop SC/ST/OBC enrolment Enrolment ratio0.93
Total CLSrooms
99,157
91,093
2,086
10,030
355
13,509
24,629
45,496
38,333
799
6,781
381
6,319
22,178
V
518
3233
2362
2008
3011
2591
96
1017
VIIIVII
2262
VI
1913
431 426 472
2872 3125 2788
1837 1745 1345
1405 1232 781
16112229 2218
1879 1540 671
76 68 65
733 819 739 600 565 354 310 202
2723 3681 3856 3378
IVI II IIINature of Disability
712 631 574 500
1389 2250 2906 2976
1633 2190 2614 2424
1711 2211 2366 2242
2990 30802257 2947
2273 2753 3001
77 143 122
2930
98
256315 114737 934 686 509 401
3216
48.8
32.348.4
34.6
48.4
48.5 51.3
49.1
48.923.1
49.2
19.8
9231,997
4,986
4,302
35
290
17
643
774
84.6
81.7
1.0
80.15.4
57.0
17.5
Girlsenrolment
429,132
434,340
436,192
402,601
391,581
358,944
338,935
321,652
2,093,846
1,019,531
8,337
10,659
11,441
10,778
10,518
7,898
7,194
5,184
51,733
20,276
Boys5,908
7,943
8,503
7,826
7,483
5,762
5,639
3,882
37,663
15,283
Girls
Blind
Low-vision
Hearing
Speach
Loco-motor
MentallyRetarded
Learning
CerebralPalsy
Autism
Multiple
0.09
0.06
0.07
2528918
10230
2903082659
372984
478059
Oriya
1969811 12910
45001
51483
9132538
60069
726
English
3298
0725
104
7807
15559
Others
1619
6785
4595
4412
1880644
4472
1390
Hindi Urdu
10689
3994
0
4980
370
135
0.57
0.29
0.46
3.84
1.94
3.08
Government
90.0 91.5
UP+Sec/HS P+UP+Sec UP+SecP + UPP. only 55 - 56 57-58 59-60 TLM SD Grant
Gender
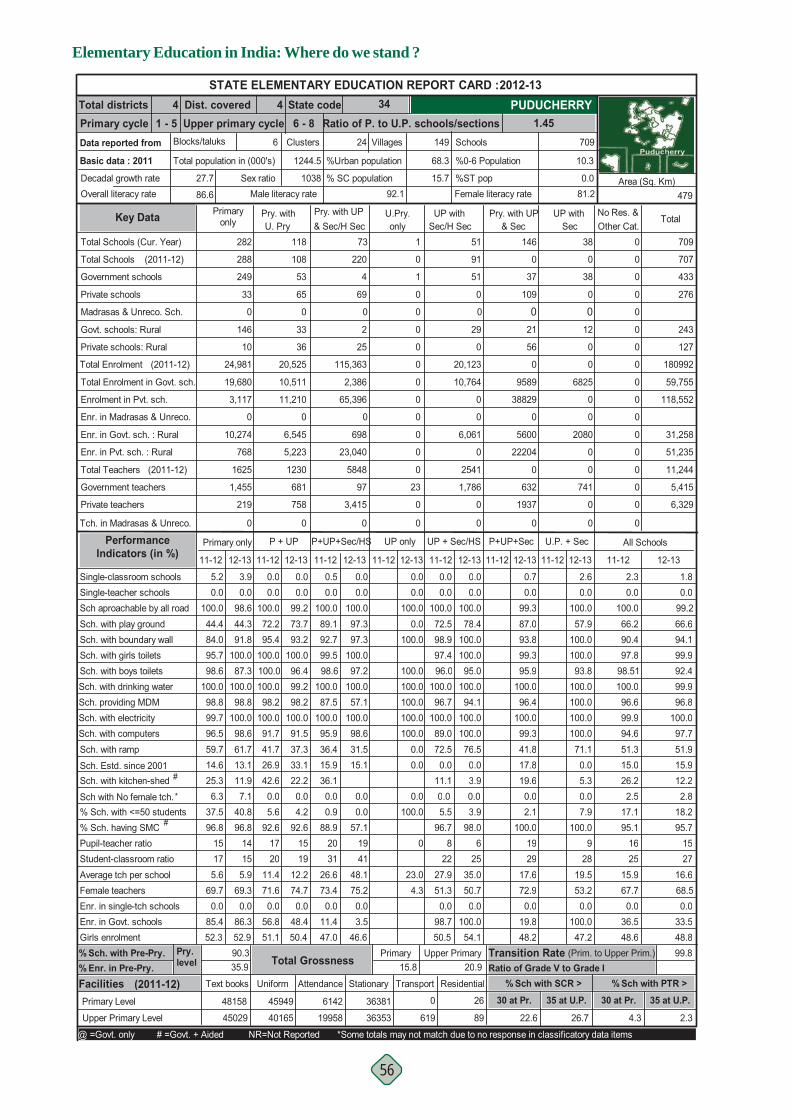
Elementary Education in India: Where do we stand ?
56
% Sch. with Pre-Pry.
Dist. covered State codeUpper primary cycle Ratio of P. to U.P. schools/sections 1.45
4 3441 - 5 6 - 8
Total districtsPrimary cycleData reported from
Basic data : 2011
Decadal growth rateOverall literacy rate
Blocks/taluks
27.7
86.6
Primaryonly
All Schools
Pry. withU. Pry
UP withSec/H Sec & Sec
Pry. with UP UP withSec
Pry. with UP & Sec/H Sec Other Cat.
No Res. &Total
Sch. with drinking water Sch. providing MDMSch. with electricity Sch. with computers
Sch. with kitchen-shedSch. Estd. since 2001
#
Sch. with ramp
Sch aproachable by all roadSch. with play groundSch. with boundary wallSch. with girls toilets
Single-teacher schoolsSingle-classroom schools
Sch. with boys toilets
98.8100.098.661.713.111.9
12-13
0.098.644.391.8
3.9
100.087.3
100.0
91.741.726.9
98.2
42.6
11-12
72.295.4
0.0100.0
0.0
100.0100.0100.0
100.0
11-12
0.5
100.0100.0
0.00.0
11-12 12-13
0.0100.0
0.00.0
100.0
100.0100.0100.0
12-13 11-12
0.7
12-13 11-12
0.0
12-13
2.60.0
100.089.192.799.598.6
100.087.5
100.095.936.415.936.1
100.0
100.098.631.515.1
12-13
100.097.397.3
0.00.0
100.097.2
57.1
91.537.333.122.2
12-13
99.273.793.2
0.00.0
100.096.499.298.2
100.099.796.5
14.659.7
98.8
25.3
44.484.0
100.0
5.20.0
95.798.6
100.0
11-12
0.0
72.50.0
96.7
11.1
11-12
0.0100.072.598.9
0.0
97.496.0
100.0
100.089.0
Total Schools (Cur. Year) 282 118 73 1 0
Total Schools
Madrasas & Unreco. Sch.
Private schools
Private schools: Rural
Total Enrolment
Govt. schools: Rural
(2011-12)
249
33
0
146
10
24,981
288
0
0
0
0
0
0
1
0
25
115,363
0
220
4
69
2
108
53
65
0
33
36
20,525
0
0
0
0
0
0
0
Total Enrolment in Govt. sch.
Enrolment in Pvt. sch.
Enr. in Madrasas & Unreco.
Enr. in Govt. sch. : Rural
Enr. in Pvt. sch. : Rural
Total Teachers
Private teachers
Government teachers
Tch. in Madrasas & Unreco.
19,680
3,117
0
10,274
768
1625
1,455
219
0
P + UP P+UP+Sec/HS UP only UP + Sec/HS P+UP+Sec U.P. + Sec
0
0
0
0
0
23
0
0
0
2,386
65,396
23,040
698
5848
97
3,415
0
0
10,511
11,210
0
6,545
5,223
1230
681
758
0
0
0
0
0
0
0
0
0
0
Primary only Performance Indicators (in %)
Government schools
51
91
51
0
29
0
20,123
10,764
0
0
6,061
0
2541
1,786
0
0
709
707
433
276
243
127
180992
59,755
118,552
31,258
51,235
11,244
5,415
6,329
2.3 1.80.0 0.0
100.0 99.266.2 66.690.4 94.197.8 99.9
98.51 92.4100.0 99.996.6 96.899.9 100.094.6 97.751.3 51.915.0 15.926.2 12.2
11-12 12-13
0.0100.078.4
100.0100.095.0
100.0
0.0
94.1100.0100.076.50.03.9
99.387.093.899.395.9
100.096.4
100.057.9
100.0100.093.8
100.0100.0
100.099.341.817.819.6
100.0100.071.10.05.3
STATE ELEMENTARY EDUCATION REPORT CARD : 2012-13
709
Female literacy rate
10.3
0.081.2
%ST pop
%0-6 Population
Schools
15.7
68.3
1496
Total population in (000's)
Sex ratio92.1
% SC population
%Urban population
24 VillagesClusters
1244.5
1038Male literacy rate 479
Area (Sq. Km)
PUDUCHERRY
Key Data
0 0
37 38
109 0
0 021 12
56 0
0 0
9589 6825
38829 0
0 0
5600 2080
22204 0
0 0
632 741
1937 0
0 0
(2011-12)
(2011-12)
Pupil-teacher ratio% Sch. having SMC
Student-classroom ratio Average tch per schoolFemale teachersEnr. in single-tch schools
Girls enrolmentEnr. in Govt. schools
155.9
69.30.0
86.3
96.8
52.9
1420
11.471.60.0
56.851.1
92.617
23.04.3
088.9
2031
26.673.40.0
11.447.0
3.5
57.1
46.6
1941
48.175.20.0
1912.274.70.0
48.4
92.6
50.4
15175.6
69.70.0
85.452.3
96.815
2227.951.30.0
98.750.5
96.78 15
17.1 18.295.1 95.7
1625 27
15.9 16.667.7 68.50.0 0.0
36.5 33.548.6 48.8
98.06
2535.050.70.0
100.054.1
100.0 100.01929
17.672.90.0
19.848.2
928
19.553.20.0
100.047.2
% Sch. with <=50 students 37.5 40.8 5.6 4.2 0.9 0.0 100.0 5.5 3.9 2.1 7.9#
Upper Primary Level 45029 22.6 26.7 2.3
48158Primary Level
Facilities Text books
35.9 15.8 20.9
Residential% Enr. in Pre-Pry.
2.8Sch with No female tch. 6.3 7.1 0.0 0.0 0.0 0.0 0.0 0.0 0.0 2.5
4.3
% Sch with SCR > % Sch with PTR >Ratio of Grade V to Grade I
90.3 Primary Upper Primary 99.8
30 at Pr. 35 at U.P. 30 at Pr.
Pry. level Total Grossness Transition Rate (Prim. to Upper Prim.)
*
@ =Govt. only # =Govt. + Aided NR=Not Reported *Some totals may not match due to no response in classificatory data items
0.0 0.0
146 38
U.Pry.only
0
619
TransportStationary
36381
3635319958
6142
AttendanceUniform
45949
40165
26
89
35 at U.P.(2011-12)
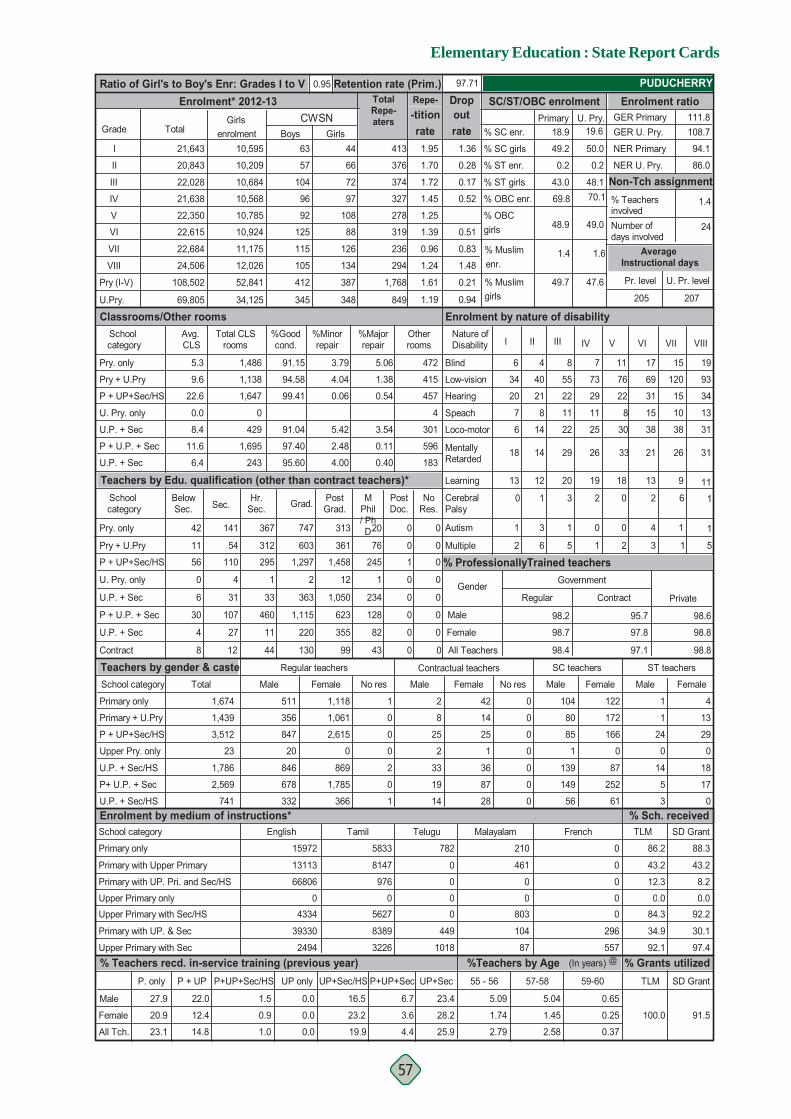
Elementary Education : State Report Cards
57
Retention rate (Prim.)
0.941.19
% Grants utilized%Teachers by Age (In years)
97.71
Enrolment* 2012-13 Ratio of Girl's to Boy's Enr: Grades I to V
Grade Total
I
II
III
IV
V
VI
VII
VIII
Pry (I-V)
U.P. + Sec
Pry + U.Pry
U. Pry. only
0
U.P. + Sec
P + U.P. + Sec
Contract
Primary only
Primary + U.Pry
P + UP+Sec/HS
Upper Pry. only
U.P. + Sec/HS
P+ U.P. + Sec
U.P. + Sec/HS
Teachers by gender & casteSchool category
School category
Primary only
Primary with Upper Primary
Primary with UP. Pri. and Sec/HS
Upper Primary onlyUpper Primary with Sec/HS
Primary with UP. & Sec
Upper Primary with Sec % Teachers recd. in-service training (previous year)
% Sch. received
PUDUCHERRY
@
SD Grant
% ProfessionallyTrained teachers
Regular Private
Male
Female
All Tch.
All Teachers
Female
Male
Contract
98.8
98.8
98.6
97.1
97.8
95.7
98.7
98.4
98.2
27.9
20.9
23.1
22.0
12.4
14.8
0.0
0.0
0.0
0.9
1.0
1.5
P+UP+Sec/HS UP only
16.5
19.9
23.2
P + UP+Sec/HS
11
56
0
6
30
4
8
110
4
31
107
27
12
295
1
33
460
11
44 130
220
1,115
363
2
1,297 1,458
12
1,050
623
355
99
245
1
234
128
82
43
1
0
0
0
0
0
0
0
0
0
0
3,512
23
1,786
2,569
741
1,674
Total
1,439
Enrolment by medium of instructions*
356
847
20
846
678
332
Male
511
Regular teachers
0
869
1,785
366
Female
1,118
1,061
2,615
0
0
0
2
0
1
No res
1 42
14
25
1
36
87
28
Female
2
8
25
2
33
19
14
Male
Contractual teachers
0
0
0
0
0
0
0
No res
104
80
85
1
139
149
SC teachers
Male
122
172
166
0
87
252
Female
ST teachers
1
1
24
0
14
5
3
Male Female
TLM
86.2
43.2
12.3
0.084.3
34.9
92.1
54 312 603 361 76 0 0
U.Pry.
Avg. CLS
School category
Pry. only
Pry + U.Pry
U. Pry. only
U.P. + Sec
P + U.P. + Sec
U.P. + Sec
%Majorrepair
%Minorrepair
3.79
4.04
0.06
5.42
%Goodcond.
91.15
94.58
99.41
91.04
Pry. only
Enrolment by nature of disability
9.6
22.6
0.0
8.4
6.4
11.6
5.3
97.40
95.60
2.48
4.00
Otherrooms
5.06
1.38
0.54
3.54
Teachers by Edu. qualification (other than contract teachers)*
Classrooms/Other rooms
0.11
0.40
P + UP+Sec/HS
42 141 367 747 313 20 0 0
School category Grad.Below
Sec. Sec.Hr.
Sec.PostGrad.
MPhil/ PhD
PostDoc.
NoRes.
6.7 23.4
3.6 28.2
4.4 25.9
21,643
20,843
22,028
21,638
22,350
22,615
22,684
24,506
108,502
69,805
outCWSN18.9
U. Pry.Primary GER Primaryrate % SC enr. GER U. Pry.
1.36
0.28
0.17
% SC girls
0.2 0.2% ST enr.
% ST girls
NER Primary
% TeachersinvolvedNumber ofdays involved
NER U. Pry.
Non-Tch assignment0.52 70.1% OBC enr.
% OBC
0.51 girls
0.83 % Muslim 1.4 1.6enr.
0.21 % Muslim Pr. level
205
Average Instructional days
24
94.1
1.4
86.0
U. Pr. level
207
-titionTotalRepe-aters
rate413
376
374
327
278
319
236
294
1,768girls849
1.61
1.24
0.96
1.39
1.25
1.45
1.72
1.70
1.95
1.48
111.8108.7
Repe- Drop SC/ST/OBC enrolment Enrolment ratio0.95
Total CLSrooms
1,486
1,138
1,647
0
429
1,695
243
472
415
457
4
301
596
183
V
11
76
22
8
30
18
0
31
VIIIVII
21
VI
26
17 15 19
69 120 93
31 15 34
15 10 13
3138 38
13 9 11
4 1 1
2 6 5 1 2 3 1 5
18 14 29 26
IVI II IIINature of Disability
6 4 8 7
34 40 55 73
20 21 22 29
7 8 11 11
14 226 25
13 12 20
1 3 1
19
0
62 10 1 3 2 0
33
49.2
43.0
69.8
48.9
49.7 47.6
49.0
48.1
50.0
19.6
6156
4
13
29
0
18
17
0
88.3
43.2
8.2
0.092.2
30.1
97.4
Girlsenrolment
10,595
10,209
10,684
10,568
10,785
10,924
11,175
12,026
52,841
34,125
63
57
104
96
92
125
115
105
412
345
Boys44
66
72
97
108
88
126
134
387
348
Girls
Blind
Low-vision
Hearing
Speach
Loco-motor
MentallyRetarded
Learning
CerebralPalsy
Autism
Multiple
0.65
0.25
0.37
13113
66806
04334
39330
2494
English
15972 5833
8147
976
05627
8389
3226
Tamil
449
00
0
0
782
Telugu
1018
210
461
0
0803
104
87
Malayalam French
0
0
0
00
296
557
5.04
1.45
2.58
5.09
1.74
2.79
Government
100.0 91.5
UP+Sec/HS P+UP+Sec UP+SecP + UPP. only 55 - 56 57-58 59-60 TLM SD Grant
Gender
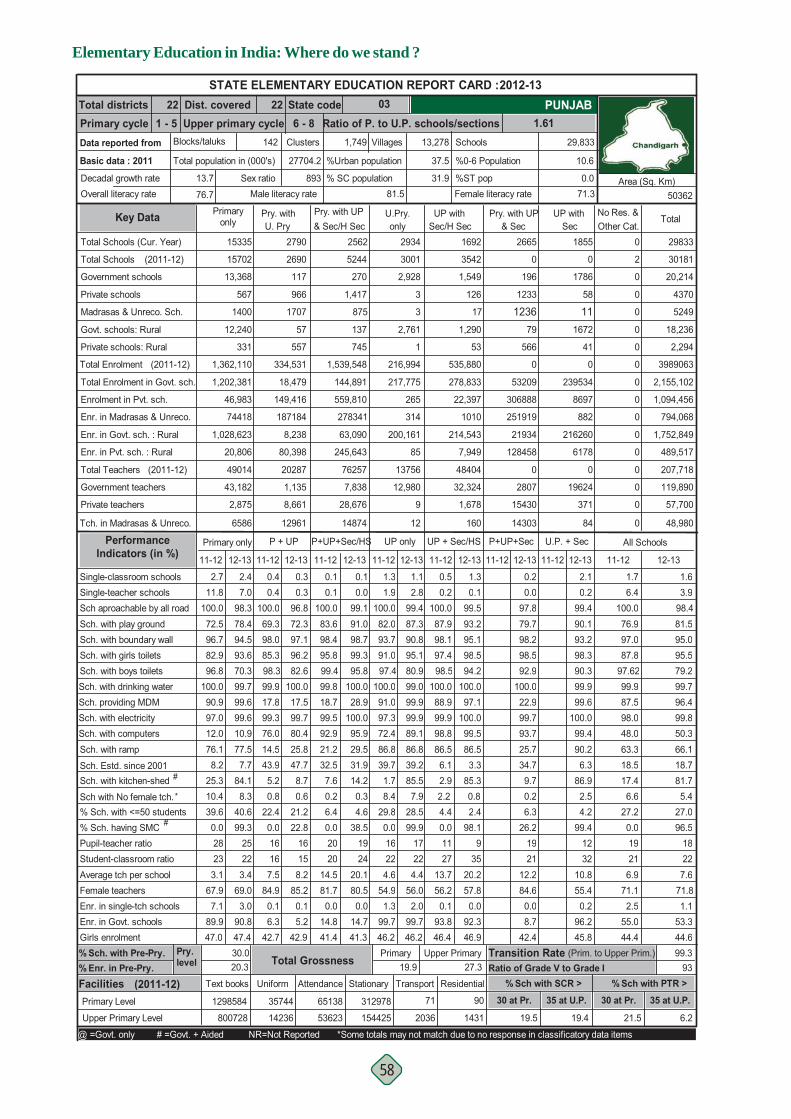
Elementary Education in India: Where do we stand ?
58
% Sch. with Pre-Pry.
Dist. covered State codeUpper primary cycle Ratio of P. to U.P. schools/sections 1.61
22 03221 - 5 6 - 8
Total districtsPrimary cycleData reported from
Basic data : 2011
Decadal growth rateOverall literacy rate
Blocks/taluks
13.7
76.7
Primaryonly
All Schools
Pry. withU. Pry
UP withSec/H Sec & Sec
Pry. with UP UP withSec
Pry. with UP & Sec/H Sec Other Cat.
No Res. &Total
Sch. with drinking water Sch. providing MDMSch. with electricity Sch. with computers
Sch. with kitchen-shedSch. Estd. since 2001
#
Sch. with ramp
Sch aproachable by all roadSch. with play groundSch. with boundary wallSch. with girls toilets
Single-teacher schoolsSingle-classroom schools
Sch. with boys toilets
99.699.610.977.57.7
84.1
12-13
7.098.378.494.5
2.4
93.670.399.7
76.014.543.9
17.8
5.2
11-12
69.398.0
0.4100.0
0.4
85.398.399.9
99.3
11-12
0.1
99.989.186.839.285.5
100.0
97.372.486.839.7
91.0
1.7
11-12 12-13
87.390.8
1.1
93.7
1.9100.0
1.3
82.0
2.899.4
95.191.080.997.499.099.9
12-13 11-12
0.2
12-13 11-12
0.2
12-13
2.10.1
100.083.698.495.899.499.818.799.592.921.232.57.6
100.0
100.095.929.531.914.2
12-13
99.191.098.7
0.10.0
99.395.8
28.9
80.425.847.78.7
12-13
96.872.397.1
0.30.3
96.282.6
100.017.599.797.0
12.0
8.276.1
90.9
25.3
72.596.7
100.0
2.711.8
82.996.8
100.0
11-12
1.3
86.56.1
88.9
2.9
11-12
0.2100.087.998.1
0.5
97.498.5
100.0
99.998.8
Total Schools (Cur. Year) 15335 2790 2562 2934 0
Total Schools
Madrasas & Unreco. Sch.
Private schools
Private schools: Rural
Total Enrolment
Govt. schools: Rural
(2011-12)
13,368
567
1400
12,240
331
1,362,110
15702
126
2,761
1
216,994
3
3001
2,928
3
745
1,539,548
875
5244
270
1,417
137
2690
117
966
1707
57
557
334,531
2
0
0
0
0
0
0
Total Enrolment in Govt. sch.
Enrolment in Pvt. sch.
Enr. in Madrasas & Unreco.
Enr. in Govt. sch. : Rural
Enr. in Pvt. sch. : Rural
Total Teachers
Private teachers
Government teachers
Tch. in Madrasas & Unreco.
1,202,381
46,983
74418
1,028,623
20,806
49014
43,182
2,875
6586
P + UP P+UP+Sec/HS UP only UP + Sec/HS P+UP+Sec U.P. + Sec
217,775
265
85
200,161
13756
12,980
9
314
12
144,891
559,810
245,643
63,090
76257
7,838
28,676
278341
14874
18,479
149,416
187184
8,238
80,398
20287
1,135
8,661
12961
0
0
0
0
0
0
0
0
0
Primary only Performance Indicators (in %)
Government schools
1692
3542
1,549
17
1,290
53
535,880
278,833
22,397
1010
214,543
7,949
48404
32,324
1,678
160
29833
30181
20,214
4370
5249
18,236
2,294
3989063
2,155,102
1,094,456
794,068
1,752,849
489,517
207,718
119,890
57,700
48,980
1.7 1.66.4 3.9
100.0 98.476.9 81.597.0 95.087.8 95.5
97.62 79.299.9 99.787.5 96.498.0 99.848.0 50.363.3 66.118.5 18.717.4 81.7
11-12 12-13
0.199.593.295.198.594.2
100.0
0.0
97.1100.099.586.53.3
85.3
97.879.798.298.592.9
100.022.9
99.490.193.298.390.399.999.6
99.793.725.734.79.7
100.099.490.26.3
86.9
STATE ELEMENTARY EDUCATION REPORT CARD : 2012-13
29,833
Female literacy rate
10.6
0.071.3
%ST pop
%0-6 Population
Schools
31.9
37.5
13,278142
Total population in (000's)
Sex ratio81.5
% SC population
%Urban population
1,749 VillagesClusters
27704.2
893Male literacy rate 50362
Area (Sq. Km)
PUNJAB
Key Data
0 0
196 1786
1233 58
1236 1179 1672
566 41
0 0
53209 239534
306888 8697
251919 882
21934 216260
128458 6178
0 0
2807 19624
15430 371
14303 84
(2011-12)
(2011-12)
Pupil-teacher ratio% Sch. having SMC
Student-classroom ratio Average tch per schoolFemale teachersEnr. in single-tch schools
Girls enrolmentEnr. in Govt. schools
223.4
69.03.0
90.8
99.3
47.4
25167.5
84.90.16.3
42.7
0.016
224.6
54.91.3
99.746.2
0.016
224.4
56.02.0
99.7
99.9
46.2
170.02020
14.581.70.0
14.841.4
14.7
38.5
41.3
1924
20.180.50.0
158.2
85.20.15.2
22.8
42.9
16233.1
67.97.1
89.947.0
0.028
2713.756.20.1
93.846.4
0.011 18
27.2 27.00.0 96.51921 226.9 7.6
71.1 71.82.5 1.1
55.0 53.344.4 44.6
98.19
3520.257.80.0
92.346.9
26.2 99.41921
12.284.60.08.7
42.4
1232
10.855.40.2
96.245.8
% Sch. with <=50 students 39.6 40.6 22.4 21.2 6.4 4.6 29.8 28.5 4.4 2.4 6.3 4.2#
Upper Primary Level 800728 19.5 19.4 6.2
1298584Primary Level
Facilities Text books
20.3 19.9 27.3 93 Residential
% Enr. in Pre-Pry.
5.4Sch with No female tch. 10.4 8.3 0.8 0.6 0.2 0.3 8.4 7.9 2.2 0.8 6.6
21.5
% Sch with SCR > % Sch with PTR >Ratio of Grade V to Grade I
30.0 Primary Upper Primary 99.3
30 at Pr. 35 at U.P. 30 at Pr.
Pry. level Total Grossness Transition Rate (Prim. to Upper Prim.)
*
@ =Govt. only # =Govt. + Aided NR=Not Reported *Some totals may not match due to no response in classificatory data items
0.2 2.5
2665 1855
U.Pry.only
71
2036
TransportStationary
312978
15442553623
65138
AttendanceUniform
35744
14236
90
1431
35 at U.P.(2011-12)
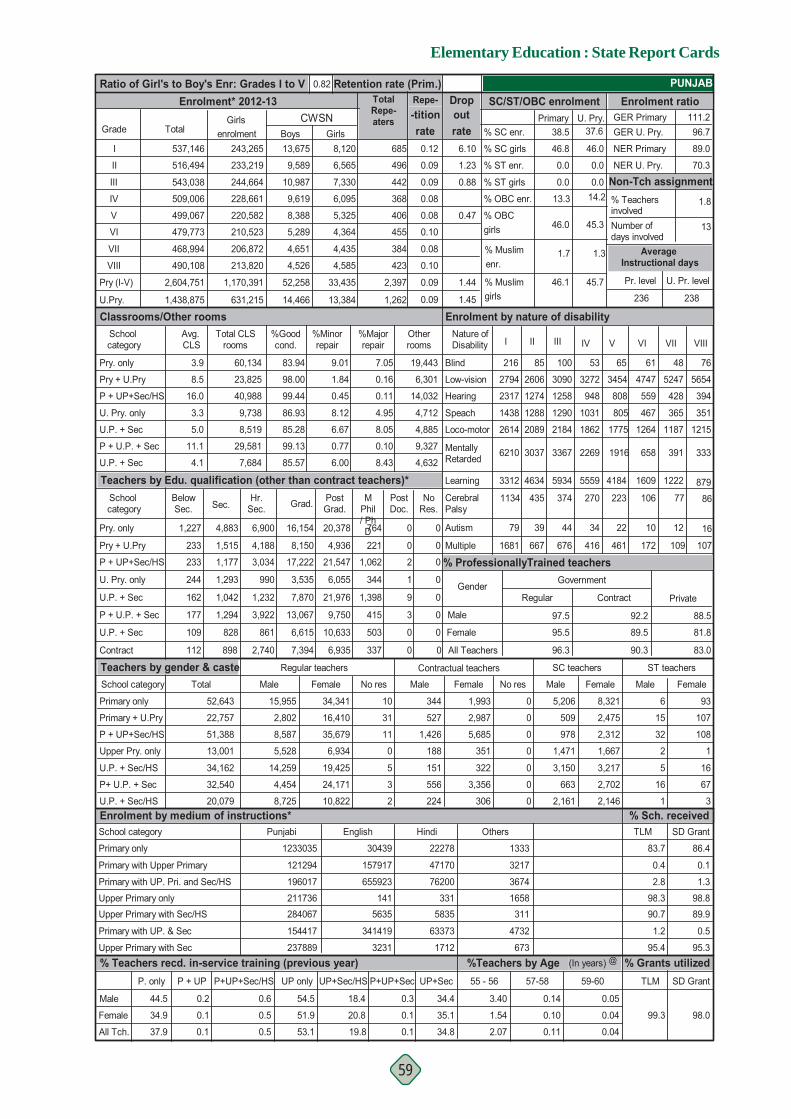
Elementary Education : State Report Cards
59
Retention rate (Prim.)
1.450.09
% Grants utilized%Teachers by Age (In years)
Enrolment* 2012-13 Ratio of Girl's to Boy's Enr: Grades I to V
Grade Total
I
II
III
IV
V
VI
VII
VIII
Pry (I-V)
U.P. + Sec
Pry + U.Pry
U. Pry. only
0
U.P. + Sec
P + U.P. + Sec
Contract
Primary only
Primary + U.Pry
P + UP+Sec/HS
Upper Pry. only
U.P. + Sec/HS
P+ U.P. + Sec
U.P. + Sec/HS
Teachers by gender & casteSchool category
School category
Primary only
Primary with Upper Primary
Primary with UP. Pri. and Sec/HS
Upper Primary onlyUpper Primary with Sec/HS
Primary with UP. & Sec
Upper Primary with Sec % Teachers recd. in-service training (previous year)
% Sch. received
PUNJAB
@
SD Grant
% ProfessionallyTrained teachers
Regular Private
Male
Female
All Tch.
All Teachers
Female
Male
Contract
83.0
81.8
88.5
90.3
89.5
92.2
95.5
96.3
97.5
44.5
34.9
37.9
0.2
0.1
0.1
54.5
51.9
53.1
0.5
0.5
0.6
P+UP+Sec/HS UP only
18.4
19.8
20.8
P + UP+Sec/HS
233
233
244
162
177
109
112
1,177
1,293
1,042
1,294
828
898
3,034
990
1,232
3,922
861
2,740 7,394
6,615
13,067
7,870
3,535
17,222 21,547
6,055
21,976
9,750
10,633
6,935
1,062
344
1,398
415
503
337
2
1
9
3
0
0
0
0
0
0
0
51,388
13,001
34,162
32,540
20,079
52,643
Total
22,757
Enrolment by medium of instructions*
2,802
8,587
5,528
14,259
4,454
8,725
Male
15,955
Regular teachers
6,934
19,425
24,171
10,822
Female
34,341
16,410
35,679
31
11
0
5
3
2
No res
10 1,993
2,987
5,685
351
322
3,356
306
Female
344
527
1,426
188
151
556
224
Male
Contractual teachers
0
0
0
0
0
0
0
No res
5,206
509
978
1,471
3,150
663
SC teachers
Male
8,321
2,475
2,312
1,667
3,217
2,702
Female
ST teachers
6
15
32
2
5
16
1
Male Female
TLM
83.7
0.4
2.8
98.390.7
1.2
95.4
1,515 4,188 8,150 4,936 221 0 0
U.Pry.
Avg. CLS
School category
Pry. only
Pry + U.Pry
U. Pry. only
U.P. + Sec
P + U.P. + Sec
U.P. + Sec
%Majorrepair
%Minorrepair
9.01
1.84
0.45
8.12
6.67
%Goodcond.
83.94
98.00
99.44
86.93
85.28
Pry. only
Enrolment by nature of disability
8.5
16.0
3.3
5.0
4.1
11.1
3.9
99.13
85.57
0.77
6.00
Otherrooms
7.05
0.16
0.11
4.95
8.05
Teachers by Edu. qualification (other than contract teachers)*
Classrooms/Other rooms
0.10
8.43
P + UP+Sec/HS
1,227 4,883 6,900 16,154 20,378 764 0 0
School category Grad.Below
Sec. Sec.Hr.
Sec.PostGrad.
MPhil/ PhD
PostDoc.
NoRes.
0.3 34.4
0.1 35.1
0.1 34.8
537,146
516,494
543,038
509,006
499,067
479,773
468,994
490,108
2,604,751
1,438,875
outCWSN38.5
U. Pry.Primary GER Primaryrate % SC enr. GER U. Pry.
6.10
1.23
0.88
% SC girls
0.0 0.0% ST enr.
% ST girls
NER Primary
% TeachersinvolvedNumber ofdays involved
NER U. Pry.
Non-Tch assignment14.2% OBC enr.
0.47 % OBC girls
% Muslim 1.7 1.3enr.
1.44 % Muslim Pr. level
236
Average Instructional days
13
89.0
1.8
70.3
U. Pr. level
238
-titionTotalRepe-aters
rate685
496
442
368
406
455
384
423
2,397girls1,262
0.09
0.10
0.08
0.10
0.08
0.08
0.09
0.09
0.12
111.296.7
Repe- Drop SC/ST/OBC enrolment Enrolment ratio0.82
Total CLSrooms
60,134
23,825
40,988
9,738
8,519
29,581
7,684
19,443
6,301
14,032
4,712
4,885
9,327
4,632
V
65
3454
808
805
1775
4184
22
333
VIIIVII
658
VI
391
61 48 76
4747 5247 5654
559 428 394
467 365 351
12151264 1187
1609 1222 879
10 12 16
1681 667 676 416 461 172 109 107
6210 3037 3367 2269
IVI II IIINature of Disability
216 85 100 53
2794 2606 3090 3272
2317 1274 1258 948
1438 1288 1290 1031
2089 21842614 1862
3312 4634 5934
79 39 44
5559
34
77106 861134 435 374 270 223
1916
46.8
0.0
13.3
46.0
46.1 45.7
45.3
0.0
46.0
37.6
2,1462,161
93
107
108
1
16
67
3
86.4
0.1
1.3
98.889.9
0.5
95.3
Girlsenrolment
243,265
233,219
244,664
228,661
220,582
210,523
206,872
213,820
1,170,391
631,215
13,675
9,589
10,987
9,619
8,388
5,289
4,651
4,526
52,258
14,466
Boys8,120
6,565
7,330
6,095
5,325
4,364
4,435
4,585
33,435
13,384
Girls
Blind
Low-vision
Hearing
Speach
Loco-motor
MentallyRetarded
Learning
CerebralPalsy
Autism
Multiple
0.05
0.04
0.04
121294
196017
211736284067
154417
237889
Punjabi
1233035 30439
157917
655923
1415635
341419
3231
English
63373
5835331
76200
47170
22278
Hindi
1712
1333
3217
3674
1658311
4732
673
Others
0.14
0.10
0.11
3.40
1.54
2.07
Government
99.3 98.0
UP+Sec/HS P+UP+Sec UP+SecP + UPP. only 55 - 56 57-58 59-60 TLM SD Grant
Gender
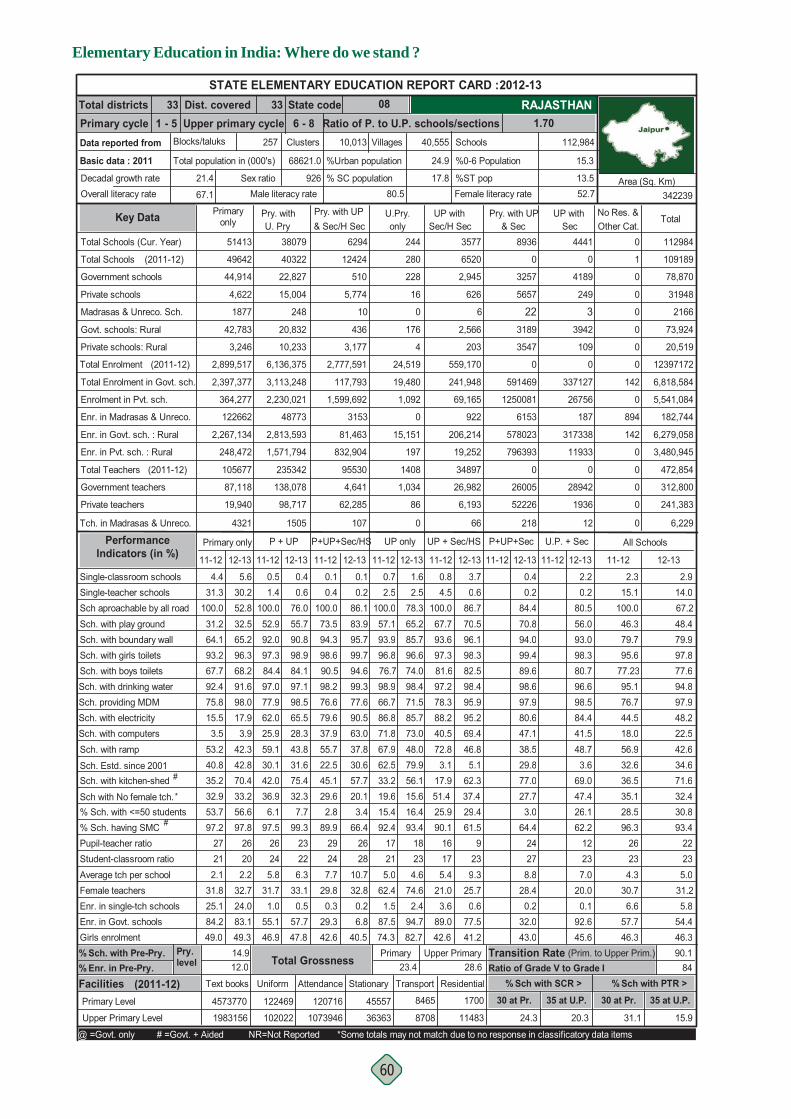
Elementary Education in India: Where do we stand ?
60
% Sch. with Pre-Pry.
Dist. covered State codeUpper primary cycle Ratio of P. to U.P. schools/sections 1.70
33 08331 - 5 6 - 8
Total districtsPrimary cycleData reported from
Basic data : 2011
Decadal growth rateOverall literacy rate
Blocks/taluks
21.4
67.1
Primaryonly
All Schools
Pry. withU. Pry
UP withSec/H Sec & Sec
Pry. with UP UP withSec
Pry. with UP & Sec/H Sec Other Cat.
No Res. &Total
Sch. with drinking water Sch. providing MDMSch. with electricity Sch. with computers
Sch. with kitchen-shedSch. Estd. since 2001
#
Sch. with ramp
Sch aproachable by all roadSch. with play groundSch. with boundary wallSch. with girls toilets
Single-teacher schoolsSingle-classroom schools
Sch. with boys toilets
98.017.93.9
42.342.870.4
12-13
30.252.832.565.2
5.6
96.368.291.6
25.959.130.1
77.9
42.0
11-12
52.992.0
1.4100.0
0.5
97.384.497.0
62.0
11-12
0.1
85.773.048.079.956.1
98.9
86.871.867.962.5
66.7
33.2
11-12 12-13
65.285.7
1.6
93.9
2.5100.0
0.7
57.1
2.578.3
96.696.874.076.798.471.5
12-13 11-12
0.4
12-13 11-12
0.2
12-13
2.20.4
100.073.594.398.690.598.276.679.637.955.722.545.1
99.3
90.563.037.830.657.7
12-13
86.183.995.7
0.10.2
99.794.6
77.6
28.343.831.675.4
12-13
76.055.790.8
0.40.6
98.984.197.198.565.515.5
3.5
40.853.2
75.8
35.2
31.264.1
100.0
4.431.3
93.267.792.4
11-12
3.7
72.83.1
78.3
17.9
11-12
4.5100.067.793.6
0.8
97.381.697.2
88.240.5
Total Schools (Cur. Year) 51413 38079 6294 244 0
Total Schools
Madrasas & Unreco. Sch.
Private schools
Private schools: Rural
Total Enrolment
Govt. schools: Rural
(2011-12)
44,914
4,622
1877
42,783
3,246
2,899,517
49642
626
176
4
24,519
0
280
228
16
3,177
2,777,591
10
12424
510
5,774
436
40322
22,827
15,004
248
20,832
10,233
6,136,375
1
0
0
0
0
0
0
Total Enrolment in Govt. sch.
Enrolment in Pvt. sch.
Enr. in Madrasas & Unreco.
Enr. in Govt. sch. : Rural
Enr. in Pvt. sch. : Rural
Total Teachers
Private teachers
Government teachers
Tch. in Madrasas & Unreco.
2,397,377
364,277
122662
2,267,134
248,472
105677
87,118
19,940
4321
P + UP P+UP+Sec/HS UP only UP + Sec/HS P+UP+Sec U.P. + Sec
19,480
1,092
197
15,151
1408
1,034
86
0
0
117,793
1,599,692
832,904
81,463
95530
4,641
62,285
3153
107
3,113,248
2,230,021
48773
2,813,593
1,571,794
235342
138,078
98,717
1505
142
0
894
142
0
0
0
0
0
Primary only Performance Indicators (in %)
Government schools
3577
6520
2,945
6
2,566
203
559,170
241,948
69,165
922
206,214
19,252
34897
26,982
6,193
66
112984
109189
78,870
31948
2166
73,924
20,519
12397172
6,818,584
5,541,084
182,744
6,279,058
3,480,945
472,854
312,800
241,383
6,229
2.3 2.915.1 14.0
100.0 67.246.3 48.479.7 79.995.6 97.8
77.23 77.695.1 94.876.7 97.944.5 48.218.0 22.556.9 42.632.6 34.636.5 71.6
11-12 12-13
0.686.770.596.198.382.598.4
0.2
95.995.269.446.85.1
62.3
84.470.894.099.489.698.697.9
80.556.093.098.380.796.698.5
80.647.138.529.877.0
84.441.548.73.6
69.0
STATE ELEMENTARY EDUCATION REPORT CARD : 2012-13
112,984
Female literacy rate
15.3
13.552.7
%ST pop
%0-6 Population
Schools
17.8
24.9
40,555257
Total population in (000's)
Sex ratio80.5
% SC population
%Urban population
10,013 VillagesClusters
68621.0
926Male literacy rate 342239
Area (Sq. Km)
RAJASTHAN
Key Data
0 0
3257 4189
5657 249
22 33189 3942
3547 109
0 0
591469 337127
1250081 26756
6153 187
578023 317338
796393 11933
0 0
26005 28942
52226 1936
218 12
(2011-12)
(2011-12)
Pupil-teacher ratio% Sch. having SMC
Student-classroom ratio Average tch per schoolFemale teachersEnr. in single-tch schools
Girls enrolmentEnr. in Govt. schools
202.2
32.724.083.1
97.8
49.3
26245.8
31.71.0
55.146.9
97.526
215.0
62.41.5
87.574.3
92.417
234.6
74.62.4
94.7
93.4
82.7
1889.9
29247.7
29.80.3
29.342.6
6.8
66.4
40.5
2628
10.732.80.2
226.3
33.10.5
57.7
99.3
47.8
23212.1
31.825.184.249.0
97.227
175.4
21.03.6
89.042.6
90.116 22
28.5 30.896.3 93.4
2623 234.3 5.0
30.7 31.26.6 5.8
57.7 54.446.3 46.3
61.59
239.3
25.70.6
77.541.2
64.4 62.224278.8
28.40.2
32.043.0
12237.0
20.00.1
92.645.6
% Sch. with <=50 students 53.7 56.6 6.1 7.7 2.8 3.4 15.4 16.4 25.9 29.4 3.0 26.1#
Upper Primary Level 1983156 24.3 20.3 15.9
4573770Primary Level
Facilities Text books
12.0 23.4 28.6 84 Residential
% Enr. in Pre-Pry.
32.4Sch with No female tch. 32.9 33.2 36.9 32.3 29.6 20.1 19.6 15.6 51.4 37.4 35.1
31.1
% Sch with SCR > % Sch with PTR >Ratio of Grade V to Grade I
14.9 Primary Upper Primary 90.1
30 at Pr. 35 at U.P. 30 at Pr.
Pry. level Total Grossness Transition Rate (Prim. to Upper Prim.)
*
@ =Govt. only # =Govt. + Aided NR=Not Reported *Some totals may not match due to no response in classificatory data items
27.7 47.4
8936 4441
U.Pry.only
8465
8708
TransportStationary
45557
363631073946
120716
AttendanceUniform
122469
102022
1700
11483
35 at U.P.(2011-12)
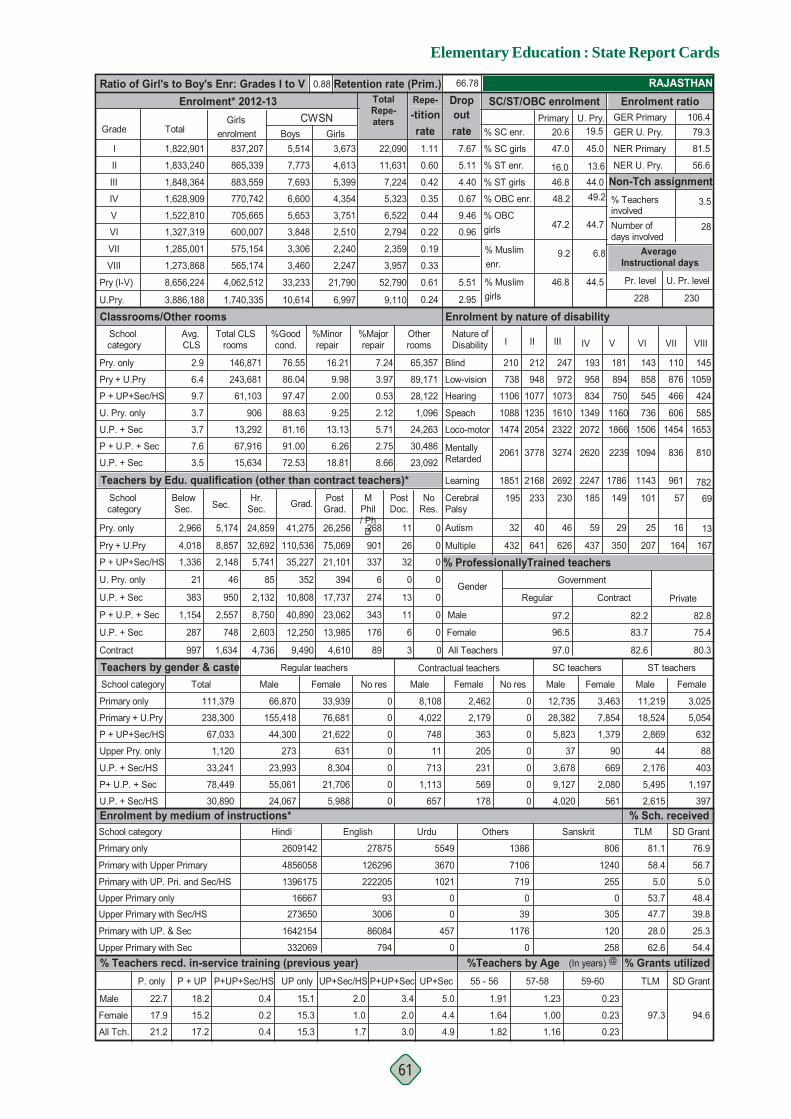
Elementary Education : State Report Cards
61
Retention rate (Prim.)
2.950.24
% Grants utilized%Teachers by Age (In years)
66.78
Enrolment* 2012-13 Ratio of Girl's to Boy's Enr: Grades I to V
Grade Total
I
II
III
IV
V
VI
VII
VIII
Pry (I-V)
U.P. + Sec
Pry + U.Pry
U. Pry. only
0
U.P. + Sec
P + U.P. + Sec
Contract
Primary only
Primary + U.Pry
P + UP+Sec/HS
Upper Pry. only
U.P. + Sec/HS
P+ U.P. + Sec
U.P. + Sec/HS
Teachers by gender & casteSchool category
School category
Primary only
Primary with Upper Primary
Primary with UP. Pri. and Sec/HS
Upper Primary onlyUpper Primary with Sec/HS
Primary with UP. & Sec
Upper Primary with Sec % Teachers recd. in-service training (previous year)
% Sch. received
RAJASTHAN
@
SD Grant
% ProfessionallyTrained teachers
Regular Private
Male
Female
All Tch.
All Teachers
Female
Male
Contract
80.3
75.4
82.8
82.6
83.7
82.2
96.5
97.0
97.2
22.7
17.9
21.2
18.2
15.2
17.2
15.1
15.3
15.3
0.2
0.4
0.4
P+UP+Sec/HS UP only
2.0
1.7
1.0
P + UP+Sec/HS
4,018
1,336
21
383
1,154
287
997
2,148
46
950
2,557
748
1,634
5,741
85
2,132
8,750
2,603
4,736 9,490
12,250
40,890
10,808
352
35,227 21,101
394
17,737
23,062
13,985
4,610
337
6
274
343
176
89
32
0
13
11
6
3
0
0
0
0
0
67,033
1,120
33,241
78,449
30,890
111,379
Total
238,300
Enrolment by medium of instructions*
155,418
44,300
273
23,993
55,061
24,067
Male
66,870
Regular teachers
631
8,304
21,706
5,988
Female
33,939
76,681
21,622
0
0
0
0
0
0
No res
0 2,462
2,179
363
205
231
569
178
Female
8,108
4,022
748
11
713
1,113
657
Male
Contractual teachers
0
0
0
0
0
0
0
No res
12,735
28,382
5,823
37
3,678
9,127
SC teachers
Male
3,463
7,854
1,379
90
669
2,080
Female
ST teachers
11,219
18,524
2,869
44
2,176
5,495
2,615
Male Female
TLM
81.1
58.4
5.0
53.747.7
28.0
62.6
8,857 32,692 110,536 75,069 901 26 0
U.Pry.
Avg. CLS
School category
Pry. only
Pry + U.Pry
U. Pry. only
U.P. + Sec
P + U.P. + Sec
U.P. + Sec
%Majorrepair
%Minorrepair
16.21
9.98
2.00
9.25
13.13
%Goodcond.
76.55
86.04
97.47
88.63
81.16
Pry. only
Enrolment by nature of disability
6.4
9.7
3.7
3.7
3.5
7.6
2.9
91.00
72.53
6.26
18.81
Otherrooms
7.24
3.97
0.53
2.12
5.71
Teachers by Edu. qualification (other than contract teachers)*
Classrooms/Other rooms
2.75
8.66
P + UP+Sec/HS
2,966 5,174 24,859 41,275 26,256 268 11 0
School category Grad.Below
Sec. Sec.Hr.
Sec.PostGrad.
MPhil/ PhD
PostDoc.
NoRes.
3.4 5.0
2.0 4.4
3.0 4.9
1,822,901
1,833,240
1,848,364
1,628,909
1,522,810
1,327,319
1,285,001
1,273,868
8,656,224
3,886,188
outCWSN20.6
U. Pry.Primary GER Primaryrate % SC enr. GER U. Pry.
7.67
5.11
4.40
% SC girls
% ST enr.
% ST girls
NER Primary
% TeachersinvolvedNumber ofdays involved
NER U. Pry.
Non-Tch assignment0.67 49.2% OBC enr.
9.46 % OBC
0.96 girls
% Muslim 9.2 6.8enr.
5.51 % Muslim Pr. level
228
Average Instructional days
28
81.5
3.5
56.6
U. Pr. level
230
-titionTotalRepe-aters
rate22,090
11,631
7,224
5,323
6,522
2,794
2,359
3,957
52,790girls9,110
0.61
0.33
0.19
0.22
0.44
0.35
0.42
0.60
1.11
106.479.3
Repe- Drop SC/ST/OBC enrolment Enrolment ratio0.88
Total CLSrooms
146,871
243,681
61,103
906
13,292
67,916
15,634
65,357
89,171
28,122
1,096
24,263
30,486
23,092
V
181
894
750
1160
1866
1786
29
810
VIIIVII
1094
VI
836
143 110 145
858 876 1059
545 466 424
736 606 585
16531506 1454
1143 961 782
25 16 13
432 641 626 437 350 207 164 167
2061 3778 3274 2620
IVI II IIINature of Disability
210 212 247 193
738 948 972 958
1106 1077 1073 834
1088 1235 1610 1349
2054 23221474 2072
1851 2168 2692
32 40 46
2247
59
57101 69195 233 230 185 149
2239
47.0
16.046.8
48.2
47.2
46.8 44.5
44.7
44.013.6
45.0
19.5
5614,020
3,025
5,054
632
88
403
1,197
397
76.9
56.7
5.0
48.439.8
25.3
54.4
Girlsenrolment
837,207
865,339
883,559
770,742
705,665
600,007
575,154
565,174
4,062,512
1,740,335
5,514
7,773
7,693
6,600
5,653
3,848
3,306
3,460
33,233
10,614
Boys3,673
4,613
5,399
4,354
3,751
2,510
2,240
2,247
21,790
6,997
Girls
Blind
Low-vision
Hearing
Speach
Loco-motor
MentallyRetarded
Learning
CerebralPalsy
Autism
Multiple
0.23
0.23
0.23
4856058
1396175
16667273650
1642154
332069
Hindi
2609142 27875
126296
222205
933006
86084
794
English
457
00
1021
3670
5549
Urdu
0
1386
7106
719
039
1176
0
Others Sanskrit
806
1240
255
0305
120
258
1.23
1.00
1.16
1.91
1.64
1.82
Government
97.3 94.6
UP+Sec/HS P+UP+Sec UP+SecP + UPP. only 55 - 56 57-58 59-60 TLM SD Grant
Gender
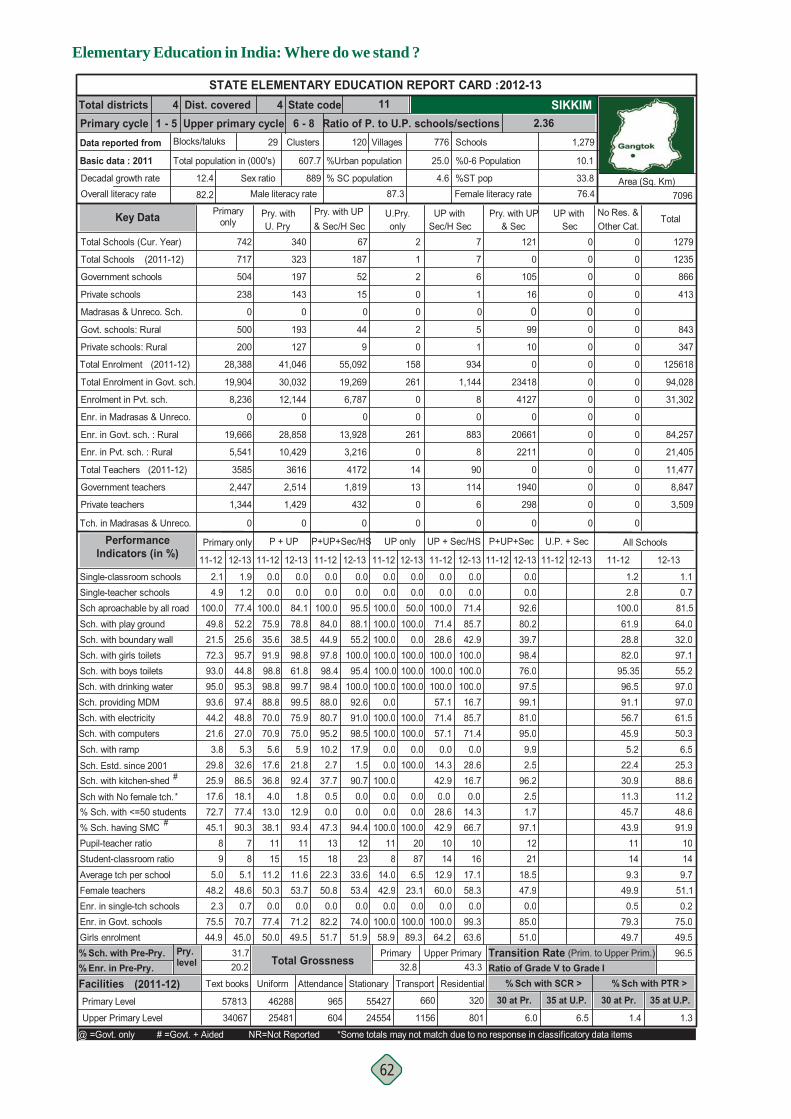
Elementary Education in India: Where do we stand ?
62
% Sch. with Pre-Pry.
Dist. covered State codeUpper primary cycle Ratio of P. to U.P. schools/sections 2.36
4 1141 - 5 6 - 8
Total districtsPrimary cycleData reported from
Basic data : 2011
Decadal growth rateOverall literacy rate
Blocks/taluks
12.4
82.2
Primaryonly
All Schools
Pry. withU. Pry
UP withSec/H Sec & Sec
Pry. with UP UP withSec
Pry. with UP & Sec/H Sec Other Cat.
No Res. &Total
Sch. with drinking water Sch. providing MDMSch. with electricity Sch. with computers
Sch. with kitchen-shedSch. Estd. since 2001
#
Sch. with ramp
Sch aproachable by all roadSch. with play groundSch. with boundary wallSch. with girls toilets
Single-teacher schoolsSingle-classroom schools
Sch. with boys toilets
97.448.827.05.3
32.686.5
12-13
1.277.452.225.6
1.9
95.744.895.3
70.95.6
17.6
88.8
36.8
11-12
75.935.6
0.0100.0
0.0
91.998.898.8
70.0
11-12
0.0
100.0100.0
0.0100.0
100.0
100.0100.0
0.00.0
0.0
100.0
11-12 12-13
100.00.0
0.0
100.0
0.0100.0
0.0
100.0
0.050.0
100.0100.0100.0100.0100.0
12-13 11-12
0.0
12-13 11-12 12-13
0.0100.084.044.997.898.498.488.080.795.210.22.7
37.7
100.0
91.098.517.91.5
90.7
12-13
95.588.155.2
0.00.0
100.095.4
92.6
75.05.9
21.892.4
12-13
84.178.838.5
0.00.0
98.861.899.799.575.944.2
21.6
29.83.8
93.6
25.9
49.821.5
100.0
2.14.9
72.393.095.0
11-12
0.0
0.014.3
57.1
42.9
11-12
0.0100.071.428.6
0.0
100.0100.0100.0
71.457.1
Total Schools (Cur. Year) 742 340 67 2 0
Total Schools
Madrasas & Unreco. Sch.
Private schools
Private schools: Rural
Total Enrolment
Govt. schools: Rural
(2011-12)
504
238
0
500
200
28,388
717
1
2
0
158
0
1
2
0
9
55,092
0
187
52
15
44
323
197
143
0
193
127
41,046
0
0
0
0
0
0
0
Total Enrolment in Govt. sch.
Enrolment in Pvt. sch.
Enr. in Madrasas & Unreco.
Enr. in Govt. sch. : Rural
Enr. in Pvt. sch. : Rural
Total Teachers
Private teachers
Government teachers
Tch. in Madrasas & Unreco.
19,904
8,236
0
19,666
5,541
3585
2,447
1,344
0
P + UP P+UP+Sec/HS UP only UP + Sec/HS P+UP+Sec U.P. + Sec
261
0
0
261
14
13
0
0
0
19,269
6,787
3,216
13,928
4172
1,819
432
0
0
30,032
12,144
0
28,858
10,429
3616
2,514
1,429
0
0
0
0
0
0
0
0
0
0
Primary only Performance Indicators (in %)
Government schools
7
7
6
0
5
1
934
1,144
8
0
883
8
90
114
6
0
1279
1235
866
413
843
347
125618
94,028
31,302
84,257
21,405
11,477
8,847
3,509
1.2 1.12.8 0.7
100.0 81.561.9 64.028.8 32.082.0 97.1
95.35 55.296.5 97.091.1 97.056.7 61.545.9 50.35.2 6.5
22.4 25.330.9 88.6
11-12 12-13
0.071.485.742.9
100.0100.0100.0
0.0
16.785.771.40.0
28.616.7
92.680.239.798.476.097.599.181.095.09.92.5
96.2
STATE ELEMENTARY EDUCATION REPORT CARD : 2012-13
1,279
Female literacy rate
10.1
33.876.4
%ST pop
%0-6 Population
Schools
4.6
25.0
77629
Total population in (000's)
Sex ratio87.3
% SC population
%Urban population
120 VillagesClusters
607.7
889Male literacy rate 7096
Area (Sq. Km)
SIKKIM
Key Data
0 0
105 0
16 0
0 099 0
10 0
0 0
23418 0
4127 0
0 0
20661 0
2211 0
0 0
1940 0
298 0
0 0
(2011-12)
(2011-12)
Pupil-teacher ratio% Sch. having SMC
Student-classroom ratio Average tch per schoolFemale teachersEnr. in single-tch schools
Girls enrolmentEnr. in Govt. schools
85.1
48.60.7
70.7
90.3
45.0
715
11.250.30.0
77.450.0
38.111
814.042.90.0
100.058.9
100.011
876.5
23.10.0
100.0
100.0
89.3
2047.3
1318
22.350.80.0
82.251.7
74.0
94.4
51.9
1223
33.653.40.0
1511.653.70.0
71.2
93.4
49.5
119
5.048.22.3
75.544.9
45.18
1412.960.00.0
100.064.2
42.910 10
45.7 48.643.9 91.9
1114 149.3 9.7
49.9 51.10.5 0.2
79.3 75.049.7 49.5
66.71016
17.158.30.0
99.363.6
97.11221
18.547.90.0
85.051.0
% Sch. with <=50 students 72.7 77.4 13.0 12.9 0.0 0.0 0.0 0.0 28.6 14.3 1.7#
Upper Primary Level 34067 6.0 6.5 1.3
57813Primary Level
Facilities Text books
20.2 32.8 43.3
Residential% Enr. in Pre-Pry.
11.2Sch with No female tch. 17.6 18.1 4.0 1.8 0.5 0.0 0.0 0.0 0.0 0.0 11.3
1.4
% Sch with SCR > % Sch with PTR >Ratio of Grade V to Grade I
31.7 Primary Upper Primary 96.5
30 at Pr. 35 at U.P. 30 at Pr.
Pry. level Total Grossness Transition Rate (Prim. to Upper Prim.)
*
@ =Govt. only # =Govt. + Aided NR=Not Reported *Some totals may not match due to no response in classificatory data items
2.5
121 0
U.Pry.only
660
1156
TransportStationary
55427
24554604
965
AttendanceUniform
46288
25481
320
801
35 at U.P.(2011-12)
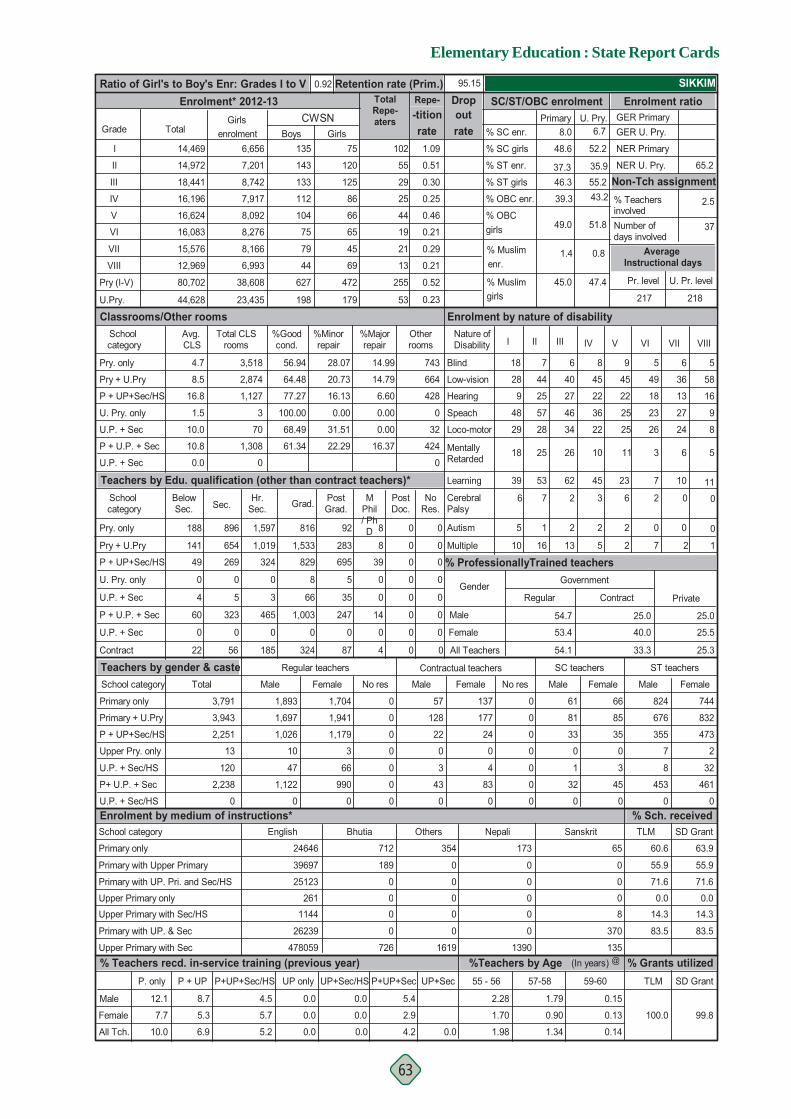
Elementary Education : State Report Cards
63
Retention rate (Prim.)
0.23
% Grants utilized%Teachers by Age (In years)
95.15
Enrolment* 2012-13 Ratio of Girl's to Boy's Enr: Grades I to V
Grade Total
I
II
III
IV
V
VI
VII
VIII
Pry (I-V)
U.P. + Sec
Pry + U.Pry
U. Pry. only
0
U.P. + Sec
P + U.P. + Sec
Contract
Primary only
Primary + U.Pry
P + UP+Sec/HS
Upper Pry. only
U.P. + Sec/HS
P+ U.P. + Sec
U.P. + Sec/HS
Teachers by gender & casteSchool category
School category
Primary only
Primary with Upper Primary
Primary with UP. Pri. and Sec/HS
Upper Primary onlyUpper Primary with Sec/HS
Primary with UP. & Sec
Upper Primary with Sec % Teachers recd. in-service training (previous year)
% Sch. received
SIKKIM
@
SD Grant
% ProfessionallyTrained teachers
Regular Private
Male
Female
All Tch.
All Teachers
Female
Male
Contract
25.3
25.5
25.0
33.3
40.0
25.0
53.4
54.1
54.7
12.1
7.7
10.0
8.7
5.3
6.9
0.0
0.0
0.0
5.7
5.2
4.5
P+UP+Sec/HS UP only
0.0
0.0
0.0
P + UP+Sec/HS
141
49
0
4
60
0
22
269
0
5
323
0
56
324
0
3
465
0
185 324
0
1,003
66
8
829 695
5
35
247
0
87
39
0
0
14
0
4
0
0
0
0
0
0
0
0
0
0
0
2,251
13
120
2,238
0
3,791
Total
3,943
Enrolment by medium of instructions*
1,697
1,026
10
47
1,122
0
Male
1,893
Regular teachers
3
66
990
0
Female
1,704
1,941
1,179
0
0
0
0
0
0
No res
0 137
177
24
0
4
83
0
Female
57
128
22
0
3
43
0
Male
Contractual teachers
0
0
0
0
0
0
0
No res
61
81
33
0
1
32
SC teachers
Male
66
85
35
0
3
45
Female
ST teachers
824
676
355
7
8
453
0
Male Female
TLM
60.6
55.9
71.6
0.014.3
83.5
654 1,019 1,533 283 8 0 0
U.Pry.
Avg. CLS
School category
Pry. only
Pry + U.Pry
U. Pry. only
U.P. + Sec
P + U.P. + Sec
U.P. + Sec
%Majorrepair
%Minorrepair
28.07
20.73
16.13
0.00
31.51
%Goodcond.
56.94
64.48
77.27
100.00
68.49
Pry. only
Enrolment by nature of disability
8.5
16.8
1.5
10.0
0.0
10.8
4.7
61.34 22.29
Otherrooms
14.99
14.79
6.60
0.00
0.00
Teachers by Edu. qualification (other than contract teachers)*
Classrooms/Other rooms
16.37
P + UP+Sec/HS
188 896 1,597 816 92 8 0 0
School category Grad.Below
Sec. Sec.Hr.
Sec.PostGrad.
MPhil/ PhD
PostDoc.
NoRes.
5.4
2.9
4.2 0.0
14,469
14,972
18,441
16,196
16,624
16,083
15,576
12,969
80,702
44,628
outCWSN8.0
U. Pry.Primary GER Primaryrate % SC enr. GER U. Pry.
% SC girls
% ST enr.
% ST girls
NER Primary
% TeachersinvolvedNumber ofdays involved
NER U. Pry.
Non-Tch assignment43.2% OBC enr.
% OBC girls
% Muslim 1.4enr.
% Muslim Pr. level
217
Average Instructional days
37
2.5
65.2
U. Pr. level
218
-titionTotalRepe-aters
rate102
55
29
25
44
19
21
13
255girls53
0.52
0.21
0.29
0.21
0.46
0.25
0.30
0.51
1.09
Repe- Drop SC/ST/OBC enrolment Enrolment ratio0.92
Total CLSrooms
3,518
2,874
1,127
3
70
1,308
0
743
664
428
0
32
424
0
V
9
45
22
25
25
23
2
5
VIIIVII
3
VI
6
5 6 5
49 36 58
18 13 16
23 27 9
826 24
7 10 11
0 0 0
10 16 13 5 2 7 2 1
18 25 26 10
IVI II IIINature of Disability
18 7 6 8
28 44 40 45
9 25 27 22
48 57 46 36
28 3429 22
39 53 62
5 1 2
45
2
02 06 7 2 3 6
11
48.6
37.346.3
39.3
49.0
45.0 47.4
0.8
51.8
55.235.9
52.2
6.7
00
744
832
473
2
32
461
0
63.9
55.9
71.6
0.014.3
83.5
Girlsenrolment
6,656
7,201
8,742
7,917
8,092
8,276
8,166
6,993
38,608
23,435
135
143
133
112
104
75
79
44
627
198
Boys75
120
125
86
66
65
45
69
472
179
Girls
Blind
Low-vision
Hearing
Speach
Loco-motor
MentallyRetarded
Learning
CerebralPalsy
Autism
Multiple
0.15
0.13
0.14
39697
25123
2611144
26239
478059
English
24646 712
189
0
00
0
726
Bhutia
0
00
0
0
354
Others
1619
173
0
0
00
0
1390
Nepali Sanskrit
65
0
0
08
370
135
1.79
0.90
1.34
2.28
1.70
1.98
Government
100.0 99.8
UP+Sec/HS P+UP+Sec UP+SecP + UPP. only 55 - 56 57-58 59-60 TLM SD Grant
Gender
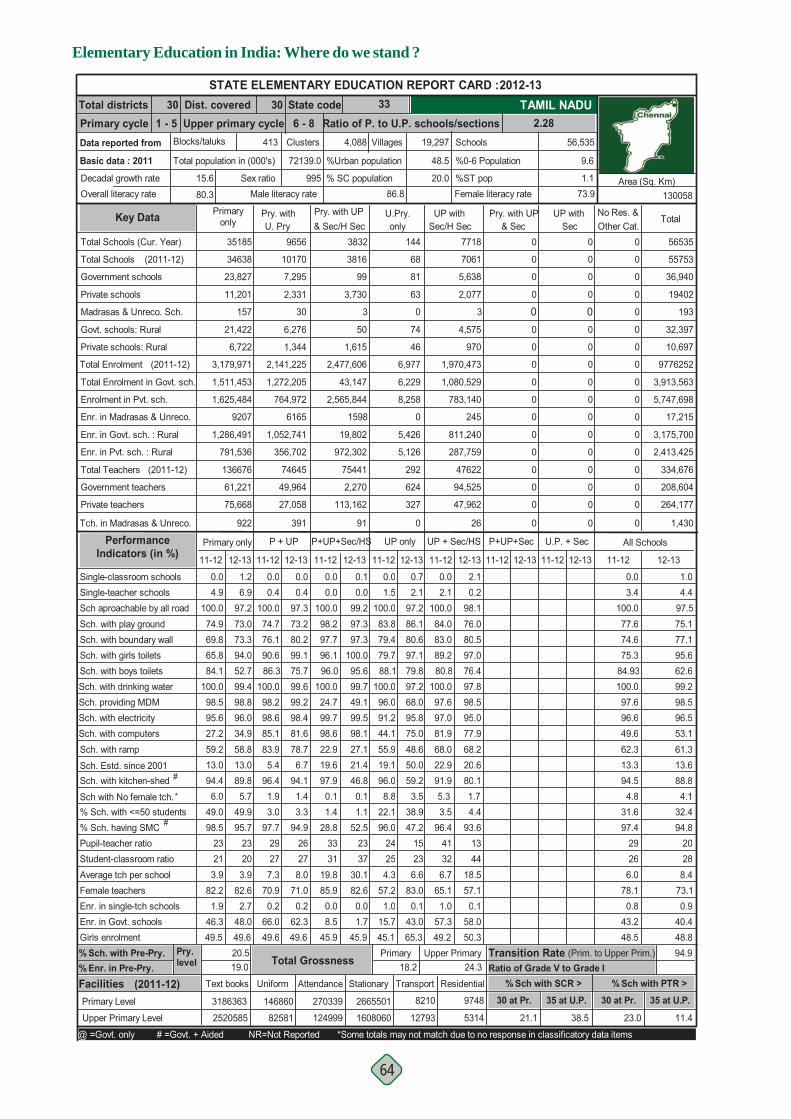
Elementary Education in India: Where do we stand ?
64
% Sch. with Pre-Pry.
Dist. covered State codeUpper primary cycle Ratio of P. to U.P. schools/sections 2.28
30 33301 - 5 6 - 8
Total districtsPrimary cycleData reported from
Basic data : 2011
Decadal growth rateOverall literacy rate
Blocks/taluks
15.6
80.3
Primaryonly
All Schools
Pry. withU. Pry
UP withSec/H Sec & Sec
Pry. with UP UP withSec
Pry. with UP & Sec/H Sec Other Cat.
No Res. &Total
Sch. with drinking water Sch. providing MDMSch. with electricity Sch. with computers
Sch. with kitchen-shedSch. Estd. since 2001
#
Sch. with ramp
Sch aproachable by all roadSch. with play groundSch. with boundary wallSch. with girls toilets
Single-teacher schoolsSingle-classroom schools
Sch. with boys toilets
98.896.034.958.813.089.8
12-13
6.997.273.073.3
1.2
94.052.799.4
85.183.95.4
98.2
96.4
11-12
74.776.1
0.4100.0
0.0
90.686.3
100.0
98.6
11-12
0.0
95.875.048.650.059.2
100.0
91.244.155.919.1
96.0
96.0
11-12 12-13
86.180.6
0.7
79.4
1.5100.0
0.0
83.8
2.197.2
97.179.779.888.197.268.0
12-13 11-12 12-13 11-12 12-13
0.0100.098.297.796.196.0
100.024.799.798.622.919.697.9
99.7
99.598.127.121.446.8
12-13
99.297.397.3
0.10.0
100.095.6
49.1
81.678.76.7
94.1
12-13
97.373.280.2
0.00.4
99.175.799.699.298.495.6
27.2
13.059.2
98.5
94.4
74.969.8
100.0
0.04.9
65.884.1
100.0
11-12
2.1
68.022.9
97.6
91.9
11-12
2.1100.084.083.0
0.0
89.280.8
100.0
97.081.9
Total Schools (Cur. Year) 35185 9656 3832 144 0
Total Schools
Madrasas & Unreco. Sch.
Private schools
Private schools: Rural
Total Enrolment
Govt. schools: Rural
(2011-12)
23,827
11,201
157
21,422
6,722
3,179,971
34638
2,077
74
46
6,977
0
68
81
63
1,615
2,477,606
3
3816
99
3,730
50
10170
7,295
2,331
30
6,276
1,344
2,141,225
0
0
0
0
0
0
0
Total Enrolment in Govt. sch.
Enrolment in Pvt. sch.
Enr. in Madrasas & Unreco.
Enr. in Govt. sch. : Rural
Enr. in Pvt. sch. : Rural
Total Teachers
Private teachers
Government teachers
Tch. in Madrasas & Unreco.
1,511,453
1,625,484
9207
1,286,491
791,536
136676
61,221
75,668
922
P + UP P+UP+Sec/HS UP only UP + Sec/HS P+UP+Sec U.P. + Sec
6,229
8,258
5,126
5,426
292
624
327
0
0
43,147
2,565,844
972,302
19,802
75441
2,270
113,162
1598
91
1,272,205
764,972
6165
1,052,741
356,702
74645
49,964
27,058
391
0
0
0
0
0
0
0
0
0
Primary only Performance Indicators (in %)
Government schools
7718
7061
5,638
3
4,575
970
1,970,473
1,080,529
783,140
245
811,240
287,759
47622
94,525
47,962
26
56535
55753
36,940
19402
193
32,397
10,697
9776252
3,913,563
5,747,698
17,215
3,175,700
2,413,425
334,676
208,604
264,177
1,430
0.0 1.03.4 4.4
100.0 97.577.6 75.174.6 77.175.3 95.6
84.93 62.6100.0 99.297.6 98.596.6 96.549.6 53.162.3 61.313.3 13.694.5 88.8
11-12 12-13
0.298.176.080.597.076.497.898.595.077.968.220.680.1
STATE ELEMENTARY EDUCATION REPORT CARD : 2012-13
56,535
Female literacy rate
9.6
1.173.9
%ST pop
%0-6 Population
Schools
20.0
48.5
19,297413
Total population in (000's)
Sex ratio86.8
% SC population
%Urban population
4,088 VillagesClusters
72139.0
995Male literacy rate 130058
Area (Sq. Km)
TAMIL NADU
Key Data
0 0
0 0
0 0
0 00 0
0 0
0 0
0 0
0 0
0 0
0 0
0 0
0 0
0 0
0 0
0 0
(2011-12)
(2011-12)
Pupil-teacher ratio% Sch. having SMC
Student-classroom ratio Average tch per schoolFemale teachersEnr. in single-tch schools
Girls enrolmentEnr. in Govt. schools
203.9
82.62.7
48.0
95.7
49.6
23277.3
70.90.2
66.049.6
97.729
254.3
57.21.0
15.745.1
96.024
236.6
83.00.1
43.0
47.2
65.3
1528.8
3331
19.885.90.08.5
45.91.7
52.5
45.9
2337
30.182.60.0
278.0
71.00.2
62.3
94.9
49.6
26213.9
82.21.9
46.349.5
98.523
326.7
65.11.0
57.349.2
96.441 20
31.6 32.497.4 94.8
2926 286.0 8.4
78.1 73.10.8 0.9
43.2 40.448.5 48.8
93.61344
18.557.10.1
58.050.3
% Sch. with <=50 students 49.0 49.9 3.0 3.3 1.4 1.1 22.1 38.9 3.5 4.4#
Upper Primary Level 2520585 21.1 38.5 11.4
3186363Primary Level
Facilities Text books
19.0 18.2 24.3
Residential% Enr. in Pre-Pry.
4.1Sch with No female tch. 6.0 5.7 1.9 1.4 0.1 0.1 8.8 3.5 5.3 1.7 4.8
23.0
% Sch with SCR > % Sch with PTR >Ratio of Grade V to Grade I
20.5 Primary Upper Primary 94.9
30 at Pr. 35 at U.P. 30 at Pr.
Pry. level Total Grossness Transition Rate (Prim. to Upper Prim.)
*
@ =Govt. only # =Govt. + Aided NR=Not Reported *Some totals may not match due to no response in classificatory data items
0 0
U.Pry.only
8210
12793
TransportStationary
2665501
1608060124999
270339
AttendanceUniform
146860
82581
9748
5314
35 at U.P.(2011-12)
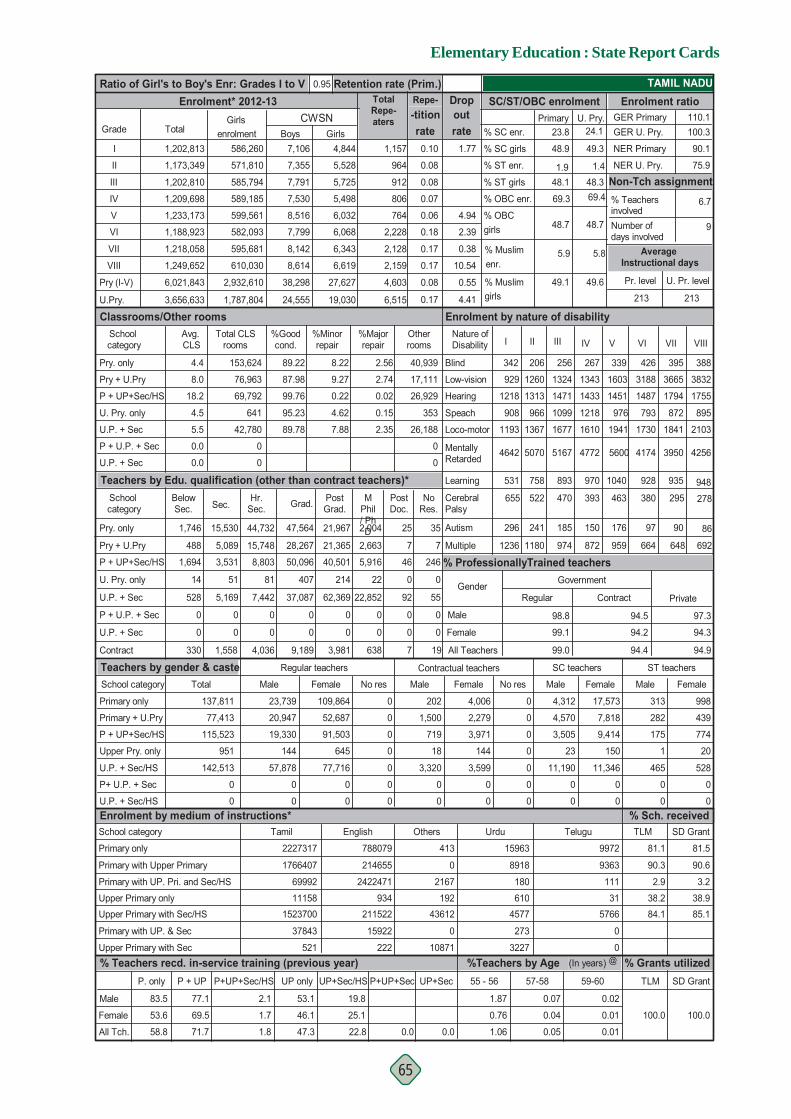
Elementary Education : State Report Cards
65
Retention rate (Prim.)
4.410.17
% Grants utilized%Teachers by Age (In years)
Enrolment* 2012-13 Ratio of Girl's to Boy's Enr: Grades I to V
Grade Total
I
II
III
IV
V
VI
VII
VIII
Pry (I-V)
U.P. + Sec
Pry + U.Pry
U. Pry. only
19
U.P. + Sec
P + U.P. + Sec
Contract
Primary only
Primary + U.Pry
P + UP+Sec/HS
Upper Pry. only
U.P. + Sec/HS
P+ U.P. + Sec
U.P. + Sec/HS
Teachers by gender & casteSchool category
School category
Primary only
Primary with Upper Primary
Primary with UP. Pri. and Sec/HS
Upper Primary onlyUpper Primary with Sec/HS
Primary with UP. & Sec
Upper Primary with Sec % Teachers recd. in-service training (previous year)
% Sch. received
TAMIL NADU
@
SD Grant
% ProfessionallyTrained teachers
Regular Private
Male
Female
All Tch.
All Teachers
Female
Male
Contract
94.9
94.3
97.3
94.4
94.2
94.5
99.1
99.0
98.8
83.5
53.6
58.8
77.1
69.5
71.7
53.1
46.1
47.3
1.7
1.8
2.1
P+UP+Sec/HS UP only
19.8
22.8
25.1
P + UP+Sec/HS
488
1,694
14
528
0
0
330
3,531
51
5,169
0
0
1,558
8,803
81
7,442
0
0
4,036 9,189
0
0
37,087
407
50,096 40,501
214
62,369
0
0
3,981
5,916
22
22,852
0
0
638
46
0
92
0
0
7
246
0
55
0
0
115,523
951
142,513
0
0
137,811
Total
77,413
Enrolment by medium of instructions*
20,947
19,330
144
57,878
0
0
Male
23,739
Regular teachers
645
77,716
0
0
Female
109,864
52,687
91,503
0
0
0
0
0
0
No res
0 4,006
2,279
3,971
144
3,599
0
0
Female
202
1,500
719
18
3,320
0
0
Male
Contractual teachers
0
0
0
0
0
0
0
No res
4,312
4,570
3,505
23
11,190
0
SC teachers
Male
17,573
7,818
9,414
150
11,346
0
Female
ST teachers
313
282
175
1
465
0
0
Male Female
TLM
81.1
90.3
2.9
38.284.1
5,089 15,748 28,267 21,365 2,663 7 7
U.Pry.
Avg. CLS
School category
Pry. only
Pry + U.Pry
U. Pry. only
U.P. + Sec
P + U.P. + Sec
U.P. + Sec
%Majorrepair
%Minorrepair
8.22
9.27
0.22
4.62
7.88
%Goodcond.
89.22
87.98
99.76
95.23
89.78
Pry. only
Enrolment by nature of disability
8.0
18.2
4.5
5.5
0.0
0.0
4.4
Otherrooms
2.56
2.74
0.02
0.15
2.35
Teachers by Edu. qualification (other than contract teachers)*
Classrooms/Other rooms
P + UP+Sec/HS
1,746 15,530 44,732 47,564 21,967 2,004 25 35
School category Grad.Below
Sec. Sec.Hr.
Sec.PostGrad.
MPhil/ PhD
PostDoc.
NoRes.
0.0 0.0
1,202,813
1,173,349
1,202,810
1,209,698
1,233,173
1,188,923
1,218,058
1,249,652
6,021,843
3,656,633
outCWSN23.8
U. Pry.Primary GER Primaryrate % SC enr. GER U. Pry.
1.77 % SC girls
% ST enr.
% ST girls
NER Primary
% TeachersinvolvedNumber ofdays involved
NER U. Pry.
Non-Tch assignment69.4% OBC enr.
4.94 % OBC
2.39 girls
0.38 % Muslim 5.9 5.8enr.
0.55 % Muslim Pr. level
213
Average Instructional days
9
90.1
6.7
75.9
U. Pr. level
213
-titionTotalRepe-aters
rate1,157
964
912
806
764
2,228
2,128
2,159
4,603girls6,515
0.08
0.17
0.17
0.18
0.06
0.07
0.08
0.08
0.10
10.54
110.1100.3
Repe- Drop SC/ST/OBC enrolment Enrolment ratio0.95
Total CLSrooms
153,624
76,963
69,792
641
42,780
0
0
40,939
17,111
26,929
353
26,188
0
0
V
339
1603
1451
976
1941
1040
176
4256
VIIIVII
4174
VI
3950
426 395 388
3188 3665 3832
1487 1794 1755
793 872 895
21031730 1841
928 935 948
97 90 86
1236 1180 974 872 959 664 648 692
4642 5070 5167 4772
IVI II IIINature of Disability
342 206 256 267
929 1260 1324 1343
1218 1313 1471 1433
908 966 1099 1218
1367 16771193 1610
531 758 893
296 241 185
970
150
295380 278655 522 470 393 463
5600
48.9
1.948.1
69.3
48.7
49.1 49.6
48.7
48.31.4
49.3
24.1
00
998
439
774
20
528
0
0
81.5
90.6
3.2
38.985.1
Girlsenrolment
586,260
571,810
585,794
589,185
599,561
582,093
595,681
610,030
2,932,610
1,787,804
7,106
7,355
7,791
7,530
8,516
7,799
8,142
8,614
38,298
24,555
Boys4,844
5,528
5,725
5,498
6,032
6,068
6,343
6,619
27,627
19,030
Girls
Blind
Low-vision
Hearing
Speach
Loco-motor
MentallyRetarded
Learning
CerebralPalsy
Autism
Multiple
0.02
0.01
0.01
1766407
69992
111581523700
37843
521
Tamil
2227317 788079
214655
2422471
934211522
15922
222
English
0
43612192
2167
0
413
Others
10871
15963
8918
180
6104577
273
3227
Urdu Telugu
9972
9363
111
315766
0
0
0.07
0.04
0.05
1.87
0.76
1.06
Government
100.0 100.0
UP+Sec/HS P+UP+Sec UP+SecP + UPP. only 55 - 56 57-58 59-60 TLM SD Grant
Gender

Elementary Education in India: Where do we stand ?
66
% Sch. with Pre-Pry.
Dist. covered State codeUpper primary cycle Ratio of P. to U.P. schools/sections 2.11
8 1681 - 5 6 - 8
Total districtsPrimary cycleData reported from
Basic data : 2011
Decadal growth rateOverall literacy rate
Blocks/taluks
14.8
87.8
Primaryonly
All Schools
Pry. withU. Pry
UP withSec/H Sec & Sec
Pry. with UP UP withSec
Pry. with UP & Sec/H Sec Other Cat.
No Res. &Total
Sch. with drinking water Sch. providing MDMSch. with electricity Sch. with computers
Sch. with kitchen-shedSch. Estd. since 2001
#
Sch. with ramp
Sch aproachable by all roadSch. with play groundSch. with boundary wallSch. with girls toilets
Single-teacher schoolsSingle-classroom schools
Sch. with boys toilets
97.79.33.4
43.352.362.5
12-13
2.675.550.310.7
8.3
77.725.180.7
2.952.47.2
99.8
69.7
11-12
64.810.2
0.2100.0
0.9
68.681.277.7
6.2
11-12
0.0
50.050.025.050.050.0
100.0
100.0100.0
0.0100.0
0.0
0.0
11-12 12-13
75.025.0
0.0
0.0
0.0100.0
0.0
100.0
0.0100.0
75.0100.0100.0100.0100.050.0
12-13 11-12
0.5
12-13 11-12
0.0
12-13
0.00.0
100.080.539.382.194.694.198.759.747.775.91.2
76.6
99.0
89.982.173.40.6
79.6
12-13
97.483.164.6
0.30.0
96.760.9
96.2
3.548.38.4
81.8
12-13
77.964.314.2
0.90.0
95.636.786.598.78.33.3
1.4
50.651.1
99.7
43.9
49.95.3
100.0
5.73.0
29.669.466.8
11-12
0.0
76.05.3
94.7
52.0
11-12
0.0100.085.358.7
0.0
85.392.296.0
89.382.7
Total Schools (Cur. Year) 2535 1263 308 4 0
Total Schools
Madrasas & Unreco. Sch.
Private schools
Private schools: Rural
Total Enrolment
Govt. schools: Rural
(2011-12)
2,349
137
49
2,249
101
117,642
2317
9
4
0
172
0
1
4
0
14
293,995
3
816
270
35
214
1294
1,210
46
7
1,171
35
178,177
0
0
0
0
0
0
0
Total Enrolment in Govt. sch.
Enrolment in Pvt. sch.
Enr. in Madrasas & Unreco.
Enr. in Govt. sch. : Rural
Enr. in Pvt. sch. : Rural
Total Teachers
Private teachers
Government teachers
Tch. in Madrasas & Unreco.
114,397
10,867
5134
105,806
7,432
8385
8,174
1,098
154
P + UP P+UP+Sec/HS UP only UP + Sec/HS P+UP+Sec U.P. + Sec
348
0
0
348
18
41
0
0
0
117,893
26,498
10,293
86,936
11511
8,657
1,508
1022
28
158,403
7,449
1200
151,256
6,061
11675
10,672
597
55
0
0
0
0
0
0
0
0
0
Primary only Performance Indicators (in %)
Government schools
66
75
57
0
40
4
13,594
10,384
1,929
0
7,382
682
573
1,426
344
0
4745
4503
4,411
274
60
4,156
185
603580
534,569
63,978
7,483
471,736
35,095
32,162
37,522
4,454
246
3.2 4.71.6 1.4
100.0 79.860.3 60.213.7 18.251.2 86.5
77.69 33.875.3 85.799.4 97.915.8 19.811.6 12.756.3 50.328.4 30.657.2 71.5
11-12 12-13
0.095.589.460.698.375.9
100.0
0.0
90.992.487.971.26.1
68.2
91.579.230.498.947.897.299.4
100.0100.050.0
100.025.0
100.0100.0
45.128.271.02.1
84.3
66.733.366.716.760.0
STATE ELEMENTARY EDUCATION REPORT CARD : 2012-13
4,745
Female literacy rate
12.1
31.883.2
%ST pop
%0-6 Population
Schools
17.8
26.2
1,06146
Total population in (000's)
Sex ratio92.2
% SC population
%Urban population
351 VillagesClusters
3671.0
961Male literacy rate 10486
Area (Sq. Km)
TRIPURA
Key Data
0 0
516 5
46 1
1 0474 4
31 0
0 0
132628 516
17166 69
127 0
119553 455
10627 0
0 0
8486 66
895 12
9 0
(2011-12)
(2011-12)
Pupil-teacher ratio% Sch. having SMC
Student-classroom ratio Average tch per schoolFemale teachersEnr. in single-tch schools
Girls enrolmentEnr. in Govt. schools
143.7
26.32.1
87.7
96.7
49.3
14239.0
23.20.0
95.849.2
95.915
1018.038.90.0
100.050.6
100.010
1710.343.90.0
100.0
75.0
45.7
897.0
2642
14.131.30.0
85.549.1
81.1
97.6
48.5
1459
33.137.90.0
219.0
23.80.0
94.8
98.9
48.8
15153.6
25.62.6
90.649.3
93.214
207.6
30.00.0
85.040.4
94.724 14
34.9 36.294.7 97.6
1926 267.1 8.9
26.9 28.90.5 0.4
89.5 88.249.0 48.9
92.47
3426.829.50.0
84.339.0
99.4 100.01645
16.727.70.0
88.549.9
828
13.050.00.0
88.259.7
% Sch. with <=50 students 62.9 62.8 8.4 9.3 0.6 0.6 0.0 50.0 2.7 0.0 0.7 0.0#
Upper Primary Level 201154 25.7 37.6 4.4
347901Primary Level
Facilities Text books
4.6 6.6 16.3 95 Residential
% Enr. in Pre-Pry.
38.3Sch with No female tch. 52.7 52.9 30.5 30.4 14.8 4.2 0.0 0.0 26.7 6.1 39.0
10.1
% Sch with SCR > % Sch with PTR >Ratio of Grade V to Grade I
5.1 Primary Upper Primary 94.3
30 at Pr. 35 at U.P. 30 at Pr.
Pry. level Total Grossness Transition Rate (Prim. to Upper Prim.)
*
@ =Govt. only # =Govt. + Aided NR=Not Reported *Some totals may not match due to no response in classificatory data items
13.5 0.0
563 6
U.Pry.only
891
2307
TransportStationary
296954
174137103589
47339
AttendanceUniform
9161
5273
297
974
35 at U.P.(2011-12)
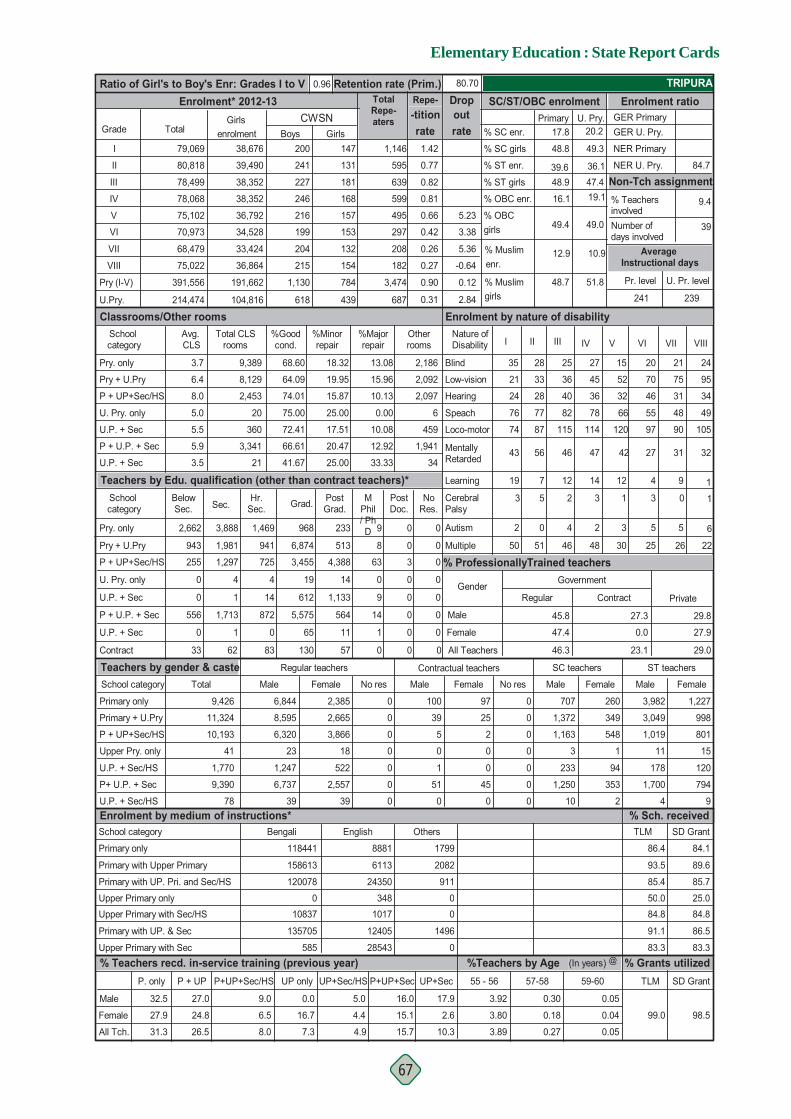
Elementary Education : State Report Cards
67
Retention rate (Prim.)
2.840.31
% Grants utilized%Teachers by Age (In years)
80.70
Enrolment* 2012-13 Ratio of Girl's to Boy's Enr: Grades I to V
Grade Total
I
II
III
IV
V
VI
VII
VIII
Pry (I-V)
U.P. + Sec
Pry + U.Pry
U. Pry. only
0
U.P. + Sec
P + U.P. + Sec
Contract
Primary only
Primary + U.Pry
P + UP+Sec/HS
Upper Pry. only
U.P. + Sec/HS
P+ U.P. + Sec
U.P. + Sec/HS
Teachers by gender & casteSchool category
School category
Primary only
Primary with Upper Primary
Primary with UP. Pri. and Sec/HS
Upper Primary onlyUpper Primary with Sec/HS
Primary with UP. & Sec
Upper Primary with Sec % Teachers recd. in-service training (previous year)
% Sch. received
TRIPURA
@
SD Grant
% ProfessionallyTrained teachers
Regular Private
Male
Female
All Tch.
All Teachers
Female
Male
Contract
29.0
27.9
29.8
23.1
0.0
27.3
47.4
46.3
45.8
32.5
27.9
31.3
27.0
24.8
26.5
0.0
16.7
7.3
6.5
8.0
9.0
P+UP+Sec/HS UP only
5.0
4.9
4.4
P + UP+Sec/HS
943
255
0
0
556
0
33
1,297
4
1
1,713
1
62
725
4
14
872
0
83 130
65
5,575
612
19
3,455 4,388
14
1,133
564
11
57
63
0
9
14
1
0
3
0
0
0
0
0
0
0
0
0
0
10,193
41
1,770
9,390
78
9,426
Total
11,324
Enrolment by medium of instructions*
8,595
6,320
23
1,247
6,737
39
Male
6,844
Regular teachers
18
522
2,557
39
Female
2,385
2,665
3,866
0
0
0
0
0
0
No res
0 97
25
2
0
0
45
0
Female
100
39
5
0
1
51
0
Male
Contractual teachers
0
0
0
0
0
0
0
No res
707
1,372
1,163
3
233
1,250
SC teachers
Male
260
349
548
1
94
353
Female
ST teachers
3,982
3,049
1,019
11
178
1,700
4
Male Female
TLM
86.4
93.5
85.4
50.084.8
91.1
83.3
1,981 941 6,874 513 8 0 0
U.Pry.
Avg. CLS
School category
Pry. only
Pry + U.Pry
U. Pry. only
U.P. + Sec
P + U.P. + Sec
U.P. + Sec
%Majorrepair
%Minorrepair
18.32
19.95
15.87
25.00
17.51
%Goodcond.
68.60
64.09
74.01
75.00
72.41
Pry. only
Enrolment by nature of disability
6.4
8.0
5.0
5.5
3.5
5.9
3.7
66.61
41.67
20.47
25.00
Otherrooms
13.08
15.96
10.13
0.00
10.08
Teachers by Edu. qualification (other than contract teachers)*
Classrooms/Other rooms
12.92
33.33
P + UP+Sec/HS
2,662 3,888 1,469 968 233 9 0 0
School category Grad.Below
Sec. Sec.Hr.
Sec.PostGrad.
MPhil/ PhD
PostDoc.
NoRes.
16.0 17.9
15.1 2.6
15.7 10.3
79,069
80,818
78,499
78,068
75,102
70,973
68,479
75,022
391,556
214,474
outCWSN17.8
U. Pry.Primary GER Primaryrate % SC enr. GER U. Pry.
% SC girls
% ST enr.
% ST girls
NER Primary
% TeachersinvolvedNumber ofdays involved
NER U. Pry.
Non-Tch assignment19.1% OBC enr.
5.23 % OBC
3.38 girls
5.36 % Muslim 12.9 10.9enr.
0.12 % Muslim Pr. level
241
Average Instructional days
39
9.4
84.7
U. Pr. level
239
-titionTotalRepe-aters
rate1,146
595
639
599
495
297
208
182
3,474girls687
0.90
0.27
0.26
0.42
0.66
0.81
0.82
0.77
1.42
-0.64
Repe- Drop SC/ST/OBC enrolment Enrolment ratio0.96
Total CLSrooms
9,389
8,129
2,453
20
360
3,341
21
2,186
2,092
2,097
6
459
1,941
34
V
15
52
32
66
120
12
3
32
VIIIVII
27
VI
31
20 21 24
70 75 95
46 31 34
55 48 49
10597 90
4 9 1
5 5 6
50 51 46 48 30 25 26 22
43 56 46 47
IVI II IIINature of Disability
35 28 25 27
21 33 36 45
24 28 40 36
76 77 82 78
87 11574 114
19 7 12
2 0 4
14
2
03 13 5 2 3 1
42
48.8
39.648.9
16.1
49.4
48.7 51.8
49.0
47.436.1
49.3
20.2
210
1,227
998
801
15
120
794
9
84.1
89.6
85.7
25.084.8
86.5
83.3
Girlsenrolment
38,676
39,490
38,352
38,352
36,792
34,528
33,424
36,864
191,662
104,816
200
241
227
246
216
199
204
215
1,130
618
Boys147
131
181
168
157
153
132
154
784
439
Girls
Blind
Low-vision
Hearing
Speach
Loco-motor
MentallyRetarded
Learning
CerebralPalsy
Autism
Multiple
0.05
0.04
0.05
158613
120078
010837
135705
585
Bengali
118441 8881
6113
24350
3481017
12405
28543
English
1496
00
911
2082
1799
Others
0
0.30
0.18
0.27
3.92
3.80
3.89
Government
99.0 98.5
UP+Sec/HS P+UP+Sec UP+SecP + UPP. only 55 - 56 57-58 59-60 TLM SD Grant
Gender
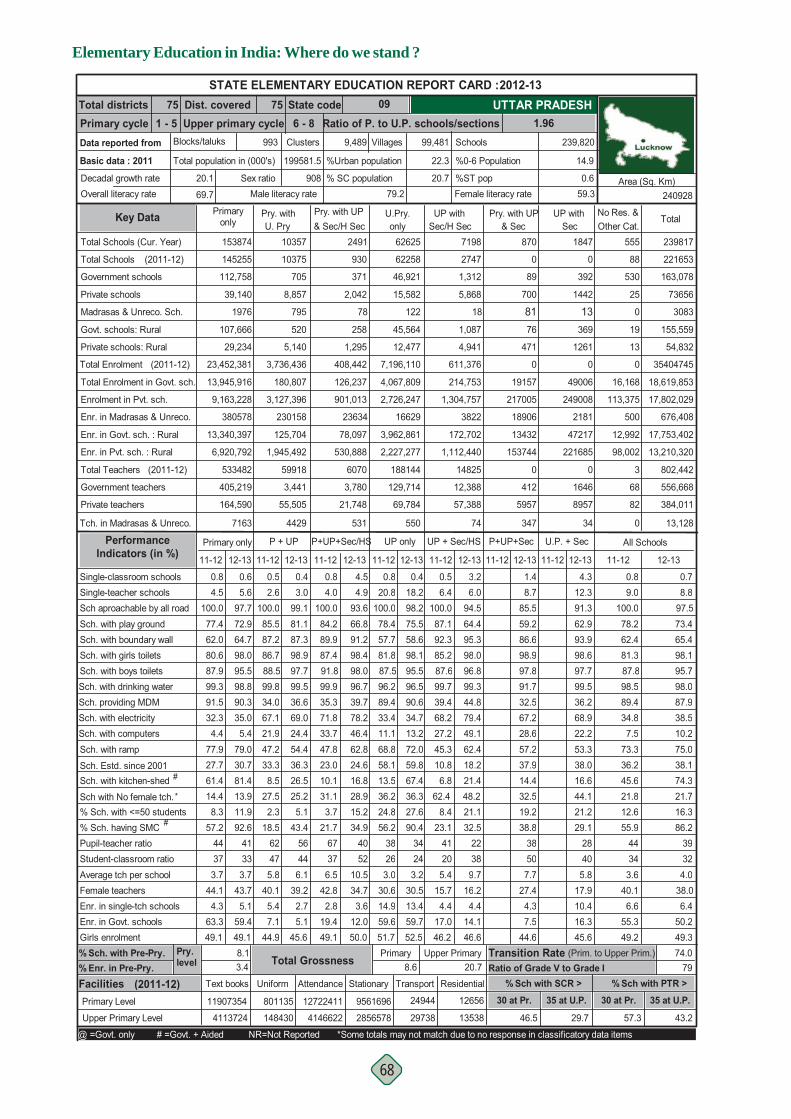
Elementary Education in India: Where do we stand ?
68
% Sch. with Pre-Pry.
Dist. covered State codeUpper primary cycle Ratio of P. to U.P. schools/sections 1.96
75 09751 - 5 6 - 8
Total districtsPrimary cycleData reported from
Basic data : 2011
Decadal growth rateOverall literacy rate
Blocks/taluks
20.1
69.7
Primaryonly
All Schools
Pry. withU. Pry
UP withSec/H Sec & Sec
Pry. with UP UP withSec
Pry. with UP & Sec/H Sec Other Cat.
No Res. &Total
Sch. with drinking water Sch. providing MDMSch. with electricity Sch. with computers
Sch. with kitchen-shedSch. Estd. since 2001
#
Sch. with ramp
Sch aproachable by all roadSch. with play groundSch. with boundary wallSch. with girls toilets
Single-teacher schoolsSingle-classroom schools
Sch. with boys toilets
90.335.05.4
79.030.781.4
12-13
5.697.772.964.7
0.6
98.095.598.8
21.947.233.3
34.0
8.5
11-12
85.587.2
2.6100.0
0.5
86.788.599.8
67.1
11-12
0.8
34.713.272.059.867.4
96.2
33.411.168.858.1
89.4
13.5
11-12 12-13
75.558.6
0.4
57.7
20.8100.0
0.8
78.4
18.298.2
98.181.895.587.596.590.6
12-13 11-12
1.4
12-13 11-12
12.3
12-13
4.34.0
100.084.289.987.491.899.935.371.833.747.823.010.1
96.7
78.246.462.824.616.8
12-13
93.666.891.2
4.54.9
98.498.0
39.7
24.454.436.326.5
12-13
99.181.187.3
0.43.0
98.997.799.536.669.032.3
4.4
27.777.9
91.5
61.4
77.462.0
100.0
0.84.5
80.687.999.3
11-12
3.2
45.310.8
39.4
6.8
11-12
6.4100.087.192.3
0.5
85.287.699.7
68.227.2
Total Schools (Cur. Year) 153874 10357 2491 62625 555
Total Schools
Madrasas & Unreco. Sch.
Private schools
Private schools: Rural
Total Enrolment
Govt. schools: Rural
(2011-12)
112,758
39,140
1976
107,666
29,234
23,452,381
145255
5,868
45,564
12,477
7,196,110
122
62258
46,921
15,582
1,295
408,442
78
930
371
2,042
258
10375
705
8,857
795
520
5,140
3,736,436
88
530
25
0
19
13
0
Total Enrolment in Govt. sch.
Enrolment in Pvt. sch.
Enr. in Madrasas & Unreco.
Enr. in Govt. sch. : Rural
Enr. in Pvt. sch. : Rural
Total Teachers
Private teachers
Government teachers
Tch. in Madrasas & Unreco.
13,945,916
9,163,228
380578
13,340,397
6,920,792
533482
405,219
164,590
7163
P + UP P+UP+Sec/HS UP only UP + Sec/HS P+UP+Sec U.P. + Sec
4,067,809
2,726,247
2,227,277
3,962,861
188144
129,714
69,784
16629
550
126,237
901,013
530,888
78,097
6070
3,780
21,748
23634
531
180,807
3,127,396
230158
125,704
1,945,492
59918
3,441
55,505
4429
16,168
113,375
500
12,992
98,002
3
68
82
0
Primary only Performance Indicators (in %)
Government schools
7198
2747
1,312
18
1,087
4,941
611,376
214,753
1,304,757
3822
172,702
1,112,440
14825
12,388
57,388
74
239817
221653
163,078
73656
3083
155,559
54,832
35404745
18,619,853
17,802,029
676,408
17,753,402
13,210,320
802,442
556,668
384,011
13,128
0.8 0.79.0 8.8
100.0 97.578.2 73.462.4 65.481.3 98.187.8 95.798.5 98.089.4 87.934.8 38.57.5 10.2
73.3 75.036.2 38.145.6 74.3
11-12 12-13
6.094.564.495.398.096.899.3
8.7
44.879.449.162.418.221.4
85.559.286.698.997.891.732.5
91.362.993.998.697.799.536.2
67.228.657.237.914.4
68.922.253.338.016.6
STATE ELEMENTARY EDUCATION REPORT CARD : 2012-13
239,820
Female literacy rate
14.9
0.659.3
%ST pop
%0-6 Population
Schools
20.7
22.3
99,481993
Total population in (000's)
Sex ratio79.2
% SC population
%Urban population
9,489 VillagesClusters
199581.5
908Male literacy rate 240928
Area (Sq. Km)
UTTAR PRADESH
Key Data
0 0
89 392
700 1442
81 1376 369
471 1261
0 0
19157 49006
217005 249008
18906 2181
13432 47217
153744 221685
0 0
412 1646
5957 8957
347 34
(2011-12)
(2011-12)
Pupil-teacher ratio% Sch. having SMC
Student-classroom ratio Average tch per schoolFemale teachersEnr. in single-tch schools
Girls enrolmentEnr. in Govt. schools
333.7
43.75.1
59.4
92.6
49.1
41475.8
40.15.47.1
44.9
18.562
263.0
30.614.959.651.7
56.238
243.2
30.513.459.7
90.4
52.5
3421.7
67376.5
42.82.8
19.449.1
12.0
34.9
50.0
4052
10.534.73.6
446.1
39.22.75.1
43.4
45.6
56373.7
44.14.3
63.349.1
57.244
205.4
15.74.4
17.046.2
23.141 39
12.6 16.355.9 86.2
4434 323.6 4.0
40.1 38.06.6 6.4
55.3 50.249.2 49.3
32.522389.7
16.24.4
14.146.6
38.8 29.138507.7
27.44.37.5
44.6
28405.8
17.910.416.345.6
% Sch. with <=50 students 8.3 11.9 2.3 5.1 3.7 15.2 24.8 27.6 8.4 21.1 19.2 21.2#
Upper Primary Level 4113724 46.5 29.7 43.2
11907354Primary Level
Facilities Text books
3.4 8.6 20.7 79 Residential
% Enr. in Pre-Pry.
21.7Sch with No female tch. 14.4 13.9 27.5 25.2 31.1 28.9 36.2 36.3 62.4 48.2 21.8
57.3
% Sch with SCR > % Sch with PTR >Ratio of Grade V to Grade I
8.1 Primary Upper Primary 74.0
30 at Pr. 35 at U.P. 30 at Pr.
Pry. level Total Grossness Transition Rate (Prim. to Upper Prim.)
*
@ =Govt. only # =Govt. + Aided NR=Not Reported *Some totals may not match due to no response in classificatory data items
32.5 44.1
870 1847
U.Pry.only
24944
29738
TransportStationary
9561696
28565784146622
12722411
AttendanceUniform
801135
148430
12656
13538
35 at U.P.(2011-12)
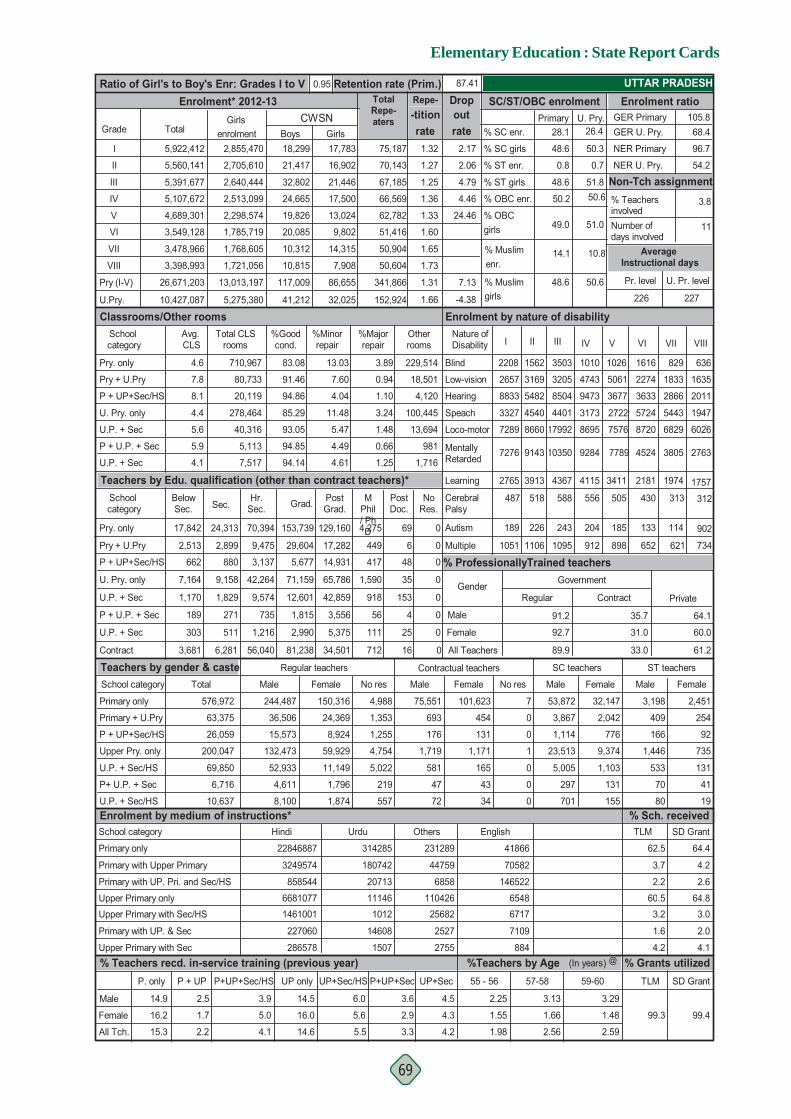
Elementary Education : State Report Cards
69
Retention rate (Prim.)
-4.381.66
% Grants utilized%Teachers by Age (In years)
87.41
Enrolment* 2012-13 Ratio of Girl's to Boy's Enr: Grades I to V
Grade Total
I
II
III
IV
V
VI
VII
VIII
Pry (I-V)
U.P. + Sec
Pry + U.Pry
U. Pry. only
0
U.P. + Sec
P + U.P. + Sec
Contract
Primary only
Primary + U.Pry
P + UP+Sec/HS
Upper Pry. only
U.P. + Sec/HS
P+ U.P. + Sec
U.P. + Sec/HS
Teachers by gender & casteSchool category
School category
Primary only
Primary with Upper Primary
Primary with UP. Pri. and Sec/HS
Upper Primary onlyUpper Primary with Sec/HS
Primary with UP. & Sec
Upper Primary with Sec % Teachers recd. in-service training (previous year)
% Sch. received
UTTAR PRADESH
@
SD Grant
% ProfessionallyTrained teachers
Regular Private
Male
Female
All Tch.
All Teachers
Female
Male
Contract
61.2
60.0
64.1
33.0
31.0
35.7
92.7
89.9
91.2
14.9
16.2
15.3
2.5
1.7
2.2
14.5
16.0
14.6
5.0
4.1
3.9
P+UP+Sec/HS UP only
6.0
5.5
5.6
P + UP+Sec/HS
2,513
662
7,164
1,170
189
303
3,681
880
9,158
1,829
271
511
6,281
3,137
42,264
9,574
735
1,216
56,040 81,238
2,990
1,815
12,601
71,159
5,677 14,931
65,786
42,859
3,556
5,375
34,501
417
1,590
918
56
111
712
48
35
153
4
25
16
0
0
0
0
0
26,059
200,047
69,850
6,716
10,637
576,972
Total
63,375
Enrolment by medium of instructions*
36,506
15,573
132,473
52,933
4,611
8,100
Male
244,487
Regular teachers
59,929
11,149
1,796
1,874
Female
150,316
24,369
8,924
1,353
1,255
4,754
5,022
219
557
No res
4,988 101,623
454
131
1,171
165
43
34
Female
75,551
693
176
1,719
581
47
72
Male
Contractual teachers
7
0
0
1
0
0
0
No res
53,872
3,867
1,114
23,513
5,005
297
SC teachers
Male
32,147
2,042
776
9,374
1,103
131
Female
ST teachers
3,198
409
166
1,446
533
70
80
Male Female
TLM
62.5
3.7
2.2
60.53.2
1.6
4.2
2,899 9,475 29,604 17,282 449 6 0
U.Pry.
Avg. CLS
School category
Pry. only
Pry + U.Pry
U. Pry. only
U.P. + Sec
P + U.P. + Sec
U.P. + Sec
%Majorrepair
%Minorrepair
13.03
7.60
4.04
11.48
5.47
%Goodcond.
83.08
91.46
94.86
85.29
93.05
Pry. only
Enrolment by nature of disability
7.8
8.1
4.4
5.6
4.1
5.9
4.6
94.85
94.14
4.49
4.61
Otherrooms
3.89
0.94
1.10
3.24
1.48
Teachers by Edu. qualification (other than contract teachers)*
Classrooms/Other rooms
0.66
1.25
P + UP+Sec/HS
17,842 24,313 70,394 153,739 129,160 4,275 69 0
School category Grad.Below
Sec. Sec.Hr.
Sec.PostGrad.
MPhil/ PhD
PostDoc.
NoRes.
3.6 4.5
2.9 4.3
3.3 4.2
5,922,412
5,560,141
5,391,677
5,107,672
4,689,301
3,549,128
3,478,966
3,398,993
26,671,203
10,427,087
outCWSN28.1
U. Pry.Primary GER Primaryrate % SC enr. GER U. Pry.
2.17
2.06
4.79
% SC girls
0.8 0.7% ST enr.
% ST girls
NER Primary
% TeachersinvolvedNumber ofdays involved
NER U. Pry.
Non-Tch assignment4.46 50.6% OBC enr.
24.46 % OBC girls
% Muslim 14.1 10.8enr.
7.13 % Muslim Pr. level
226
Average Instructional days
11
96.7
3.8
54.2
U. Pr. level
227
-titionTotalRepe-aters
rate75,187
70,143
67,185
66,569
62,782
51,416
50,904
50,604
341,866girls152,924
1.31
1.73
1.65
1.60
1.33
1.36
1.25
1.27
1.32
105.868.4
Repe- Drop SC/ST/OBC enrolment Enrolment ratio0.95
Total CLSrooms
710,967
80,733
20,119
278,464
40,316
5,113
7,517
229,514
18,501
4,120
100,445
13,694
981
1,716
V
1026
5061
3677
2722
7576
3411
185
2763
VIIIVII
4524
VI
3805
1616 829 636
2274 1833 1635
3633 2866 2011
5724 5443 1947
60268720 6829
2181 1974 1757
133 114 902
1051 1106 1095 912 898 652 621 734
7276 9143 10350 9284
IVI II IIINature of Disability
2208 1562 3503 1010
2657 3169 3205 4743
8833 5482 8504 9473
3327 4540 4401 3173
8660 179927289 8695
2765 3913 4367
189 226 243
4115
204
313430 312487 518 588 556 505
7789
48.6
48.6
50.2
49.0
48.6 50.6
51.0
51.8
50.3
26.4
155701
2,451
254
92
735
131
41
19
64.4
4.2
2.6
64.83.0
2.0
4.1
Girlsenrolment
2,855,470
2,705,610
2,640,444
2,513,099
2,298,574
1,785,719
1,768,605
1,721,056
13,013,197
5,275,380
18,299
21,417
32,802
24,665
19,826
20,085
10,312
10,815
117,009
41,212
Boys17,783
16,902
21,446
17,500
13,024
9,802
14,315
7,908
86,655
32,025
Girls
Blind
Low-vision
Hearing
Speach
Loco-motor
MentallyRetarded
Learning
CerebralPalsy
Autism
Multiple
3.29
1.48
2.59
3249574
858544
66810771461001
227060
286578
Hindi
22846887 314285
180742
20713
111461012
14608
1507
Urdu
2527
25682110426
6858
44759
231289
Others
2755
41866
70582
146522
65486717
7109
884
English
3.13
1.66
2.56
2.25
1.55
1.98
Government
99.3 99.4
UP+Sec/HS P+UP+Sec UP+SecP + UPP. only 55 - 56 57-58 59-60 TLM SD Grant
Gender
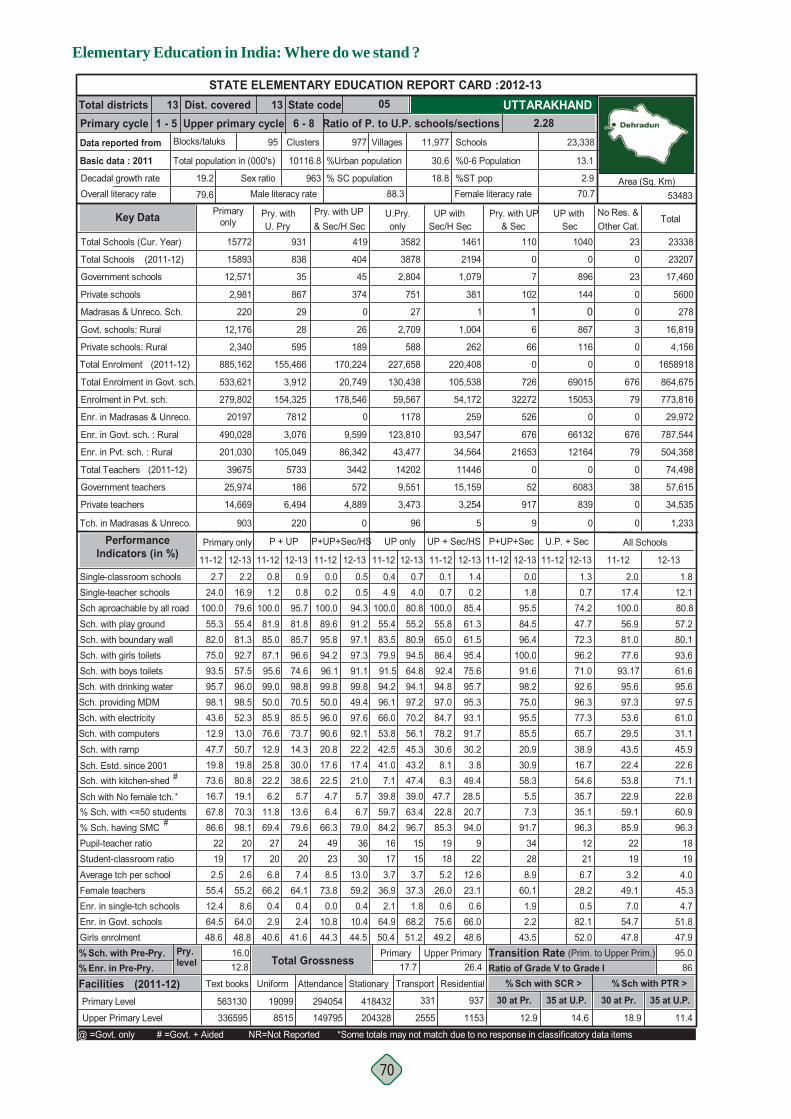
Elementary Education in India: Where do we stand ?
70
% Sch. with Pre-Pry.
Dist. covered State codeUpper primary cycle Ratio of P. to U.P. schools/sections 2.28
13 05131 - 5 6 - 8
Total districtsPrimary cycleData reported from
Basic data : 2011
Decadal growth rateOverall literacy rate
Blocks/taluks
19.2
79.6
Primaryonly
All Schools
Pry. withU. Pry
UP withSec/H Sec & Sec
Pry. with UP UP withSec
Pry. with UP & Sec/H Sec Other Cat.
No Res. &Total
Sch. with drinking water Sch. providing MDMSch. with electricity Sch. with computers
Sch. with kitchen-shedSch. Estd. since 2001
#
Sch. with ramp
Sch aproachable by all roadSch. with play groundSch. with boundary wallSch. with girls toilets
Single-teacher schoolsSingle-classroom schools
Sch. with boys toilets
98.552.313.050.719.880.8
12-13
16.979.655.481.3
2.2
92.757.596.0
76.612.925.8
50.0
22.2
11-12
81.985.0
1.2100.0
0.8
87.195.699.0
85.9
11-12
0.0
70.256.145.343.247.4
94.2
66.053.842.541.0
96.1
7.1
11-12 12-13
55.280.9
0.7
83.5
4.9100.0
0.4
55.4
4.080.8
94.579.964.891.594.197.2
12-13 11-12
0.0
12-13 11-12
0.7
12-13
1.30.2
100.089.695.894.296.199.850.096.090.620.817.622.5
99.8
97.692.122.217.421.0
12-13
94.391.297.1
0.50.5
97.391.1
49.4
73.714.330.038.6
12-13
95.781.885.7
0.90.8
96.674.698.870.585.543.6
12.9
19.847.7
98.1
73.6
55.382.0
100.0
2.724.0
75.093.595.7
11-12
1.4
30.68.1
97.0
6.3
11-12
0.7100.055.865.0
0.1
86.492.494.8
84.778.2
Total Schools (Cur. Year) 15772 931 419 3582 23
Total Schools
Madrasas & Unreco. Sch.
Private schools
Private schools: Rural
Total Enrolment
Govt. schools: Rural
(2011-12)
12,571
2,981
220
12,176
2,340
885,162
15893
381
2,709
588
227,658
27
3878
2,804
751
189
170,224
0
404
45
374
26
838
35
867
29
28
595
155,466
0
23
0
0
3
0
0
Total Enrolment in Govt. sch.
Enrolment in Pvt. sch.
Enr. in Madrasas & Unreco.
Enr. in Govt. sch. : Rural
Enr. in Pvt. sch. : Rural
Total Teachers
Private teachers
Government teachers
Tch. in Madrasas & Unreco.
533,621
279,802
20197
490,028
201,030
39675
25,974
14,669
903
P + UP P+UP+Sec/HS UP only UP + Sec/HS P+UP+Sec U.P. + Sec
130,438
59,567
43,477
123,810
14202
9,551
3,473
1178
96
20,749
178,546
86,342
9,599
3442
572
4,889
0
0
3,912
154,325
7812
3,076
105,049
5733
186
6,494
220
676
79
0
676
79
0
38
0
0
Primary only Performance Indicators (in %)
Government schools
1461
2194
1,079
1
1,004
262
220,408
105,538
54,172
259
93,547
34,564
11446
15,159
3,254
5
23338
23207
17,460
5600
278
16,819
4,156
1658918
864,675
773,816
29,972
787,544
504,358
74,498
57,615
34,535
1,233
2.0 1.817.4 12.1
100.0 80.856.9 57.281.0 80.177.6 93.6
93.17 61.695.6 95.697.3 97.553.6 61.029.5 31.143.5 45.922.4 22.653.8 71.1
11-12 12-13
0.285.461.361.595.475.695.7
1.8
95.393.191.730.23.8
49.4
95.584.596.4
100.091.698.275.0
74.247.772.396.271.092.696.3
95.585.520.930.958.3
77.365.738.916.754.6
STATE ELEMENTARY EDUCATION REPORT CARD : 2012-13
23,338
Female literacy rate
13.1
2.970.7
%ST pop
%0-6 Population
Schools
18.8
30.6
11,97795
Total population in (000's)
Sex ratio88.3
% SC population
%Urban population
977 VillagesClusters
10116.8
963Male literacy rate 53483
Area (Sq. Km)
UTTARAKHAND
Key Data
0 0
7 896
102 144
1 06 867
66 116
0 0
726 69015
32272 15053
526 0
676 66132
21653 12164
0 0
52 6083
917 839
9 0
(2011-12)
(2011-12)
Pupil-teacher ratio% Sch. having SMC
Student-classroom ratio Average tch per schoolFemale teachersEnr. in single-tch schools
Girls enrolmentEnr. in Govt. schools
172.6
55.28.6
64.0
98.1
48.8
20206.8
66.20.42.9
40.6
69.427
173.7
36.92.1
64.950.4
84.216
153.7
37.31.8
68.2
96.7
51.2
1566.3
49238.5
73.80.0
10.844.3
10.4
79.0
44.5
3630
13.059.20.4
207.4
64.10.42.4
79.6
41.6
24192.5
55.412.464.548.6
86.622
185.2
26.00.6
75.649.2
85.319 18
59.1 60.985.9 96.3
2219 193.2 4.0
49.1 45.37.0 4.7
54.7 51.847.8 47.9
94.09
2212.623.10.6
66.048.6
91.7 96.334288.9
60.11.92.2
43.5
12216.7
28.20.5
82.152.0
% Sch. with <=50 students 67.8 70.3 11.8 13.6 6.4 6.7 59.7 63.4 22.8 20.7 7.3 35.1#
Upper Primary Level 336595 12.9 14.6 11.4
563130Primary Level
Facilities Text books
12.8 17.7 26.4 86 Residential
% Enr. in Pre-Pry.
22.6Sch with No female tch. 16.7 19.1 6.2 5.7 4.7 5.7 39.8 39.0 47.7 28.5 22.9
18.9
% Sch with SCR > % Sch with PTR >Ratio of Grade V to Grade I
16.0 Primary Upper Primary 95.0
30 at Pr. 35 at U.P. 30 at Pr.
Pry. level Total Grossness Transition Rate (Prim. to Upper Prim.)
*
@ =Govt. only # =Govt. + Aided NR=Not Reported *Some totals may not match due to no response in classificatory data items
5.5 35.7
110 1040
U.Pry.only
331
2555
TransportStationary
418432
204328149795
294054
AttendanceUniform
19099
8515
937
1153
35 at U.P.(2011-12)
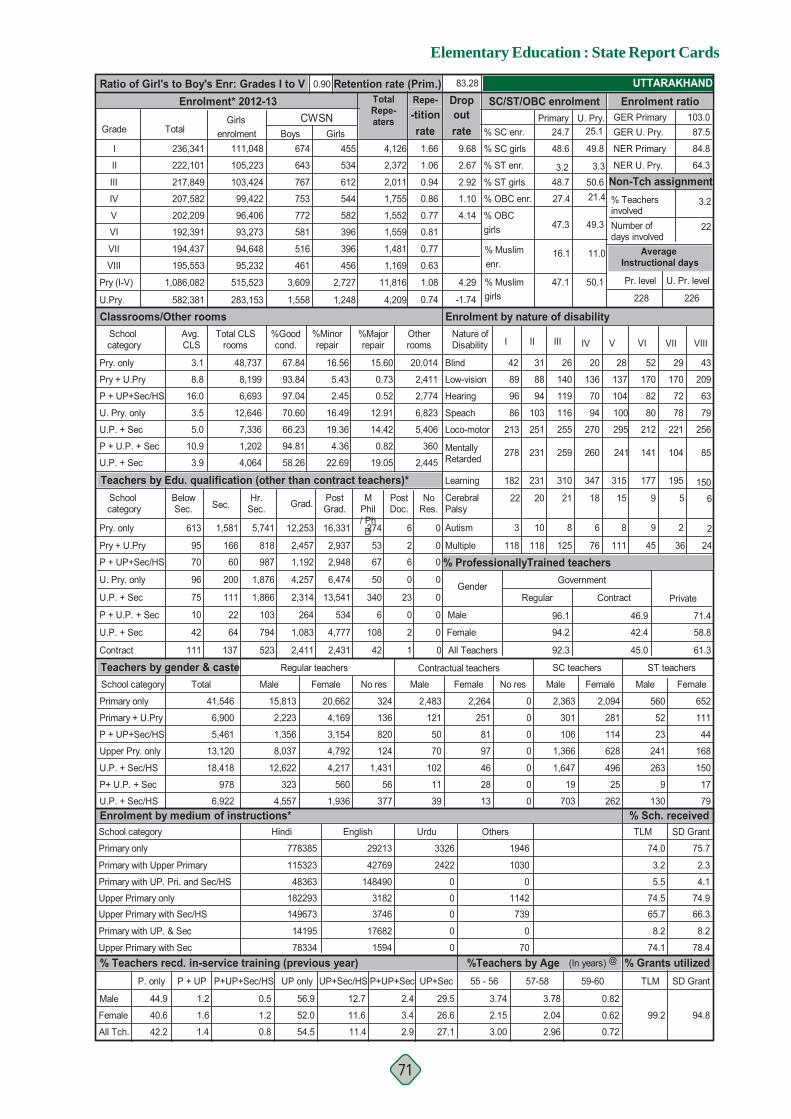
Elementary Education : State Report Cards
71
Retention rate (Prim.)
-1.740.74
% Grants utilized%Teachers by Age (In years)
83.28
Enrolment* 2012-13 Ratio of Girl's to Boy's Enr: Grades I to V
Grade Total
I
II
III
IV
V
VI
VII
VIII
Pry (I-V)
U.P. + Sec
Pry + U.Pry
U. Pry. only
0
U.P. + Sec
P + U.P. + Sec
Contract
Primary only
Primary + U.Pry
P + UP+Sec/HS
Upper Pry. only
U.P. + Sec/HS
P+ U.P. + Sec
U.P. + Sec/HS
Teachers by gender & casteSchool category
School category
Primary only
Primary with Upper Primary
Primary with UP. Pri. and Sec/HS
Upper Primary onlyUpper Primary with Sec/HS
Primary with UP. & Sec
Upper Primary with Sec % Teachers recd. in-service training (previous year)
% Sch. received
UTTARAKHAND
@
SD Grant
% ProfessionallyTrained teachers
Regular Private
Male
Female
All Tch.
All Teachers
Female
Male
Contract
61.3
58.8
71.4
45.0
42.4
46.9
94.2
92.3
96.1
44.9
40.6
42.2
1.2
1.6
1.4
56.9
52.0
54.5
1.2
0.8
0.5
P+UP+Sec/HS UP only
12.7
11.4
11.6
P + UP+Sec/HS
95
70
96
75
10
42
111
60
200
111
22
64
137
987
1,876
1,866
103
794
523 2,411
1,083
264
2,314
4,257
1,192 2,948
6,474
13,541
534
4,777
2,431
67
50
340
6
108
42
6
0
23
0
2
1
0
0
0
0
0
5,461
13,120
18,418
978
6,922
41,546
Total
6,900
Enrolment by medium of instructions*
2,223
1,356
8,037
12,622
323
4,557
Male
15,813
Regular teachers
4,792
4,217
560
1,936
Female
20,662
4,169
3,154
136
820
124
1,431
56
377
No res
324 2,264
251
81
97
46
28
13
Female
2,483
121
50
70
102
11
39
Male
Contractual teachers
0
0
0
0
0
0
0
No res
2,363
301
106
1,366
1,647
19
SC teachers
Male
2,094
281
114
628
496
25
Female
ST teachers
560
52
23
241
263
9
130
Male Female
TLM
74.0
3.2
5.5
74.565.7
8.2
74.1
166 818 2,457 2,937 53 2 0
U.Pry.
Avg. CLS
School category
Pry. only
Pry + U.Pry
U. Pry. only
U.P. + Sec
P + U.P. + Sec
U.P. + Sec
%Majorrepair
%Minorrepair
16.56
5.43
2.45
16.49
19.36
%Goodcond.
67.84
93.84
97.04
70.60
66.23
Pry. only
Enrolment by nature of disability
8.8
16.0
3.5
5.0
3.9
10.9
3.1
94.81
58.26
4.36
22.69
Otherrooms
15.60
0.73
0.52
12.91
14.42
Teachers by Edu. qualification (other than contract teachers)*
Classrooms/Other rooms
0.82
19.05
P + UP+Sec/HS
613 1,581 5,741 12,253 16,331 274 6 0
School category Grad.Below
Sec. Sec.Hr.
Sec.PostGrad.
MPhil/ PhD
PostDoc.
NoRes.
2.4 29.5
3.4 26.6
2.9 27.1
236,341
222,101
217,849
207,582
202,209
192,391
194,437
195,553
1,086,082
582,381
outCWSN24.7
U. Pry.Primary GER Primaryrate % SC enr. GER U. Pry.
9.68
2.67
2.92
% SC girls
% ST enr.
% ST girls
NER Primary
% TeachersinvolvedNumber ofdays involved
NER U. Pry.
Non-Tch assignment1.10 21.4% OBC enr.
4.14 % OBC girls
% Muslim 16.1 11.0enr.
4.29 % Muslim Pr. level
228
Average Instructional days
22
84.8
3.2
64.3
U. Pr. level
226
-titionTotalRepe-aters
rate4,126
2,372
2,011
1,755
1,552
1,559
1,481
1,169
11,816girls4,209
1.08
0.63
0.77
0.81
0.77
0.86
0.94
1.06
1.66
103.087.5
Repe- Drop SC/ST/OBC enrolment Enrolment ratio0.90
Total CLSrooms
48,737
8,199
6,693
12,646
7,336
1,202
4,064
20,014
2,411
2,774
6,823
5,406
360
2,445
V
28
137
104
100
295
315
8
85
VIIIVII
141
VI
104
52 29 43
170 170 209
82 72 63
80 78 79
256212 221
177 195 150
9 2 2
118 118 125 76 111 45 36 24
278 231 259 260
IVI II IIINature of Disability
42 31 26 20
89 88 140 136
96 94 119 70
86 103 116 94
251 255213 270
182 231 310
3 10 8
347
6
59 622 20 21 18 15
241
48.6
3.248.7
27.4
47.3
47.1 50.1
49.3
50.63.3
49.8
25.1
262703
652
111
44
168
150
17
79
75.7
2.3
4.1
74.966.3
8.2
78.4
Girlsenrolment
111,048
105,223
103,424
99,422
96,406
93,273
94,648
95,232
515,523
283,153
674
643
767
753
772
581
516
461
3,609
1,558
Boys455
534
612
544
582
396
396
456
2,727
1,248
Girls
Blind
Low-vision
Hearing
Speach
Loco-motor
MentallyRetarded
Learning
CerebralPalsy
Autism
Multiple
0.82
0.62
0.72
115323
48363
182293149673
14195
78334
Hindi
778385 29213
42769
148490
31823746
17682
1594
English
0
00
0
2422
3326
Urdu
0
1946
1030
0
1142739
0
70
Others
3.78
2.04
2.96
3.74
2.15
3.00
Government
99.2 94.8
UP+Sec/HS P+UP+Sec UP+SecP + UPP. only 55 - 56 57-58 59-60 TLM SD Grant
Gender
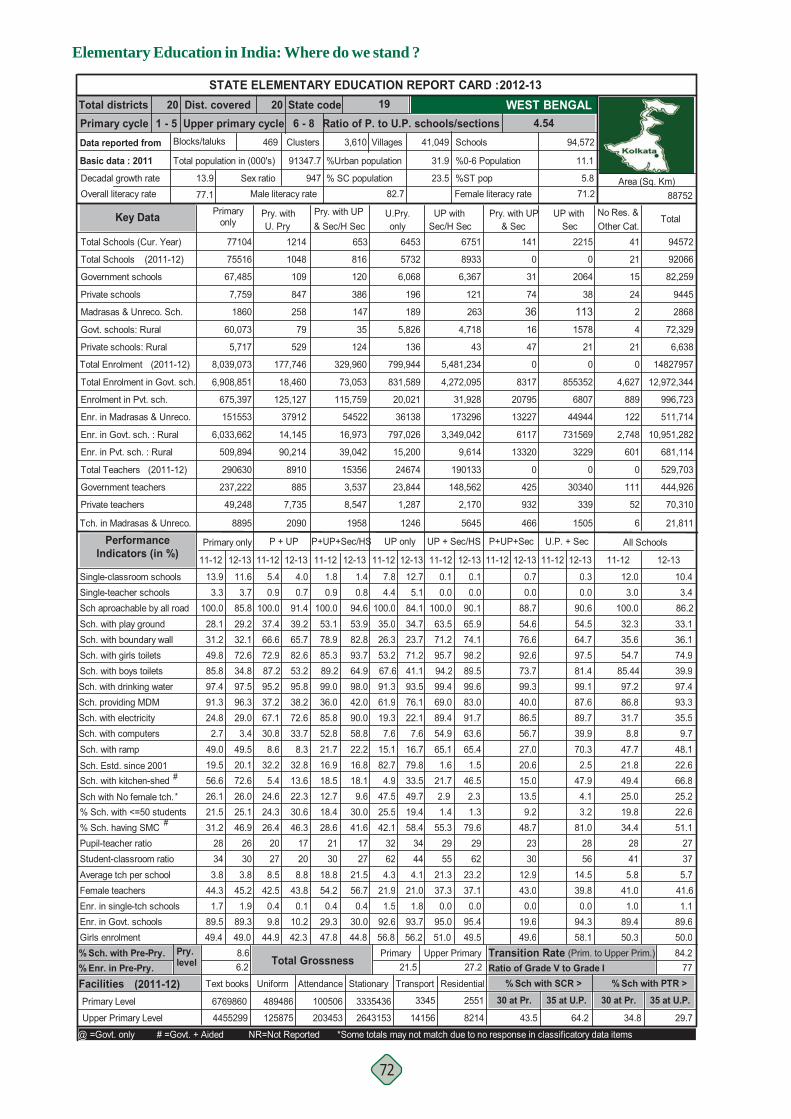
Elementary Education in India: Where do we stand ?
72
% Sch. with Pre-Pry.
Dist. covered State codeUpper primary cycle Ratio of P. to U.P. schools/sections 4.54
20 19201 - 5 6 - 8
Total districtsPrimary cycleData reported from
Basic data : 2011
Decadal growth rateOverall literacy rate
Blocks/taluks
13.9
77.1
Primaryonly
All Schools
Pry. withU. Pry
UP withSec/H Sec & Sec
Pry. with UP UP withSec
Pry. with UP & Sec/H Sec Other Cat.
No Res. &Total
Sch. with drinking water Sch. providing MDMSch. with electricity Sch. with computers
Sch. with kitchen-shedSch. Estd. since 2001
#
Sch. with ramp
Sch aproachable by all roadSch. with play groundSch. with boundary wallSch. with girls toilets
Single-teacher schoolsSingle-classroom schools
Sch. with boys toilets
96.329.03.4
49.520.172.6
12-13
3.785.829.232.1
11.6
72.634.897.5
30.88.6
32.2
37.2
5.4
11-12
37.466.6
0.9100.0
5.4
72.987.295.2
67.1
11-12
1.8
22.17.6
16.779.833.5
91.3
19.37.6
15.182.7
61.9
4.9
11-12 12-13
34.723.7
12.7
26.3
4.4100.0
7.8
35.0
5.184.1
71.253.241.167.693.576.1
12-13 11-12
0.7
12-13 11-12
0.0
12-13
0.30.9
100.053.178.985.389.299.036.085.852.821.716.918.5
98.0
90.058.822.216.818.1
12-13
94.653.982.8
1.40.8
93.764.9
42.0
33.78.3
32.813.6
12-13
91.439.265.7
4.00.7
82.653.295.838.272.624.8
2.7
19.549.0
91.3
56.6
28.131.2
100.0
13.93.3
49.885.897.4
11-12
0.1
65.11.6
69.0
21.7
11-12
0.0100.063.571.2
0.1
95.794.299.4
89.454.9
Total Schools (Cur. Year) 77104 1214 653 6453 41
Total Schools
Madrasas & Unreco. Sch.
Private schools
Private schools: Rural
Total Enrolment
Govt. schools: Rural
(2011-12)
67,485
7,759
1860
60,073
5,717
8,039,073
75516
121
5,826
136
799,944
189
5732
6,068
196
124
329,960
147
816
120
386
35
1048
109
847
258
79
529
177,746
21
15
24
2
4
21
0
Total Enrolment in Govt. sch.
Enrolment in Pvt. sch.
Enr. in Madrasas & Unreco.
Enr. in Govt. sch. : Rural
Enr. in Pvt. sch. : Rural
Total Teachers
Private teachers
Government teachers
Tch. in Madrasas & Unreco.
6,908,851
675,397
151553
6,033,662
509,894
290630
237,222
49,248
8895
P + UP P+UP+Sec/HS UP only UP + Sec/HS P+UP+Sec U.P. + Sec
831,589
20,021
15,200
797,026
24674
23,844
1,287
36138
1246
73,053
115,759
39,042
16,973
15356
3,537
8,547
54522
1958
18,460
125,127
37912
14,145
90,214
8910
885
7,735
2090
4,627
889
122
2,748
601
0
111
52
6
Primary only Performance Indicators (in %)
Government schools
6751
8933
6,367
263
4,718
43
5,481,234
4,272,095
31,928
173296
3,349,042
9,614
190133
148,562
2,170
5645
94572
92066
82,259
9445
2868
72,329
6,638
14827957
12,972,344
996,723
511,714
10,951,282
681,114
529,703
444,926
70,310
21,811
12.0 10.43.0 3.4
100.0 86.232.3 33.135.6 36.154.7 74.9
85.44 39.997.2 97.486.8 93.331.7 35.58.8 9.7
47.7 48.121.8 22.649.4 66.8
11-12 12-13
0.090.165.974.198.289.599.6
0.0
83.091.763.665.41.5
46.5
88.754.676.692.673.799.340.0
90.654.564.797.581.499.187.6
86.556.727.020.615.0
89.739.970.32.5
47.9
STATE ELEMENTARY EDUCATION REPORT CARD : 2012-13
94,572
Female literacy rate
11.1
5.871.2
%ST pop
%0-6 Population
Schools
23.5
31.9
41,049469
Total population in (000's)
Sex ratio82.7
% SC population
%Urban population
3,610 VillagesClusters
91347.7
947Male literacy rate 88752
Area (Sq. Km)
WEST BENGAL
Key Data
0 0
31 2064
74 38
36 11316 1578
47 21
0 0
8317 855352
20795 6807
13227 44944
6117 731569
13320 3229
0 0
425 30340
932 339
466 1505
(2011-12)
(2011-12)
Pupil-teacher ratio% Sch. having SMC
Student-classroom ratio Average tch per schoolFemale teachersEnr. in single-tch schools
Girls enrolmentEnr. in Govt. schools
303.8
45.21.9
89.3
46.9
49.0
26278.5
42.50.49.8
44.9
26.420
624.3
21.91.5
92.656.8
42.132
444.1
21.01.8
93.7
58.4
56.2
3428.6
2130
18.854.20.4
29.347.8
30.0
41.6
44.8
1727
21.556.70.4
208.8
43.80.1
10.2
46.3
42.3
17343.8
44.31.7
89.549.4
31.228
5521.337.30.0
95.051.0
55.329 27
19.8 22.634.4 51.1
2841 375.8 5.7
41.0 41.61.0 1.1
89.4 89.650.3 50.0
79.62962
23.237.10.0
95.449.5
48.7 81.02330
12.943.00.0
19.649.6
2856
14.539.80.0
94.358.1
% Sch. with <=50 students 21.5 25.1 24.3 30.6 18.4 30.0 25.5 19.4 1.4 1.3 9.2 3.2#
Upper Primary Level 4455299 43.5 64.2 29.7
6769860Primary Level
Facilities Text books
6.2 21.5 27.2 77 Residential
% Enr. in Pre-Pry.
25.2Sch with No female tch. 26.1 26.0 24.6 22.3 12.7 9.6 47.5 49.7 2.9 2.3 25.0
34.8
% Sch with SCR > % Sch with PTR >Ratio of Grade V to Grade I
8.6 Primary Upper Primary 84.2
30 at Pr. 35 at U.P. 30 at Pr.
Pry. level Total Grossness Transition Rate (Prim. to Upper Prim.)
*
@ =Govt. only # =Govt. + Aided NR=Not Reported *Some totals may not match due to no response in classificatory data items
13.5 4.1
141 2215
U.Pry.only
3345
14156
TransportStationary
3335436
2643153203453
100506
AttendanceUniform
489486
125875
2551
8214
35 at U.P.(2011-12)

Elementary Education : State Report Cards
73
Retention rate (Prim.)
7.175.58
% Grants utilized%Teachers by Age (In years)
74.96
Enrolment* 2012-13 Ratio of Girl's to Boy's Enr: Grades I to V
Grade Total
I
II
III
IV
V
VI
VII
VIII
Pry (I-V)
U.P. + Sec
Pry + U.Pry
U. Pry. only
0
U.P. + Sec
P + U.P. + Sec
Contract
Primary only
Primary + U.Pry
P + UP+Sec/HS
Upper Pry. only
U.P. + Sec/HS
P+ U.P. + Sec
U.P. + Sec/HS
Teachers by gender & casteSchool category
School category
Primary only
Primary with Upper Primary
Primary with UP. Pri. and Sec/HS
Upper Primary onlyUpper Primary with Sec/HS
Primary with UP. & Sec
Upper Primary with Sec % Teachers recd. in-service training (previous year)
% Sch. received
WEST BENGAL
@
SD Grant
% ProfessionallyTrained teachers
Regular Private
Male
Female
All Tch.
All Teachers
Female
Male
Contract
25.1
25.9
24.2
19.6
19.1
20.1
51.4
57.3
61.1
59.0
43.4
51.9
1.5
0.7
1.2
16.8
19.4
17.4
1.7
2.8
4.3
P+UP+Sec/HS UP only
17.5
17.0
16.3
P + UP+Sec/HS
415
191
90
240
12
39
665
575
198
576
91
106
9,486
864
294
1,279
223
321
6,340 29,908
14,515
891
61,112
17,229
6,476 5,262
7,918
68,544
504
11,325
6,933
288
138
1,827
12
303
270
0
0
0
0
0
0
0
0
0
0
0
14,042
26,377
156,377
1,823
32,184
295,365
Total
10,710
Enrolment by medium of instructions*
5,968
5,882
20,569
87,913
989
16,903
Male
149,587
Regular teachers
5,288
45,462
740
9,654
Female
121,394
4,667
7,730
17
44
10
203
4
52
No res
204 12,088
28
229
244
12,530
44
3,157
Female
12,092
30
157
266
10,269
46
2,418
Male
Contractual teachers
0
0
0
0
0
0
0
No res
37,765
369
444
3,285
21,381
85
SC teachers
Male
21,420
337
372
943
10,717
52
Female
ST teachers
9,348
276
153
438
4,689
21
1,082
Male Female
TLM
66.0
1.2
15.2
37.079.9
23.4
81.8
1,204 1,821 5,635 1,438 139 0 0
U.Pry.
Avg. CLS
School category
Pry. only
Pry + U.Pry
U. Pry. only
U.P. + Sec
P + U.P. + Sec
U.P. + Sec
%Majorrepair
%Minorrepair
16.33
13.87
6.25
13.16
14.78
%Goodcond.
65.95
76.80
89.78
68.09
71.76
Pry. only
Enrolment by nature of disability
7.5
13.6
3.1
10.6
7.3
10.1
3.4
79.46
71.50
13.74
15.17
Otherrooms
17.72
9.33
3.97
18.75
13.46
Teachers by Edu. qualification (other than contract teachers)*
Classrooms/Other rooms
6.80
13.33
P + UP+Sec/HS
7,577 82,416 70,127 93,955 15,931 1,178 1 0
School category Grad.Below
Sec. Sec.Hr.
Sec.PostGrad.
MPhil/ PhD
PostDoc.
NoRes.
8.2 32.2
3.3 28.5
6.1 30.7
2,367,768
1,909,855
1,797,232
1,844,275
1,812,782
1,687,745
1,574,433
1,486,691
9,731,912
4,748,869
outCWSN27.1
U. Pry.Primary GER Primaryrate % SC enr. GER U. Pry.
10.03
4.20
2.76
% SC girls
% ST enr.
% ST girls
NER Primary
% TeachersinvolvedNumber ofdays involved
NER U. Pry.
Non-Tch assignment7.61 11.5% OBC enr.
7.08 % OBC
5.08 girls
6.09 % Muslim 32.3 28.0enr.
6.56 % Muslim Pr. level
219
Average Instructional days
13
93.2
25.4
65.6
U. Pr. level
214
-titionTotalRepe-aters
rate464,896
127,092
90,836
108,920
138,742
92,605
89,465
82,531
930,486girls264,601
9.23
5.54
5.63
5.57
7.44
5.64
4.84
6.64
18.61
10.66
118.790.2
Repe- Drop SC/ST/OBC enrolment Enrolment ratio0.98
Total CLSrooms
261,746
9,119
8,856
20,190
71,648
1,421
16,182
81,328
2,019
3,245
4,496
38,486
434
9,001
V
1282
4827
2689
2329
4115
1630
211
799
VIIIVII
1649
VI
1094
795 726 621
4682 4197 3890
2306 1933 1689
2004 1620 1349
33883888 3503
1163 935 701
172 157 161
3525 2355 1835 2024 1269 939 855 756
7829 6507 5571 5682
IVI II IIINature of Disability
1655 998 843 876
2833 3107 3064 3419
3107 2566 2421 2613
6211 4557 3710 3587
4787 43345934 4573
2728 2511 2336
495 373 336
2260
384
189226 1651711 1087 808 757 395
2466
48.9
7.749.4
7.5
49.3
50.0 56.8
50.9
50.26.1
50.0
28.1
2,3863,946
5,460
324
193
197
1,978
42
503
66.5
2.1
16.4
37.580.7
23.4
86.7
Girlsenrolment
1,152,601
939,314
887,692
913,838
916,338
866,091
819,693
784,421
4,809,783
2,470,205
21,034
17,261
14,428
15,050
11,647
9,345
7,996
7,088
79,420
24,429
Boys14,994
11,587
10,830
11,125
9,566
8,479
7,213
6,431
58,102
22,123
Girls
Blind
Low-vision
Hearing
Speach
Loco-motor
MentallyRetarded
Learning
CerebralPalsy
Autism
Multiple
0.86
0.70
0.79
98018
91036
7241044073458
22940
803576
Bengali
6052599 189259
11877
14751
19725136383
1635
26559
Hindi
13369
314969917
93121
42057
73317
English
10871
80361
4679
5565
1298038639
273
3227
Urdu
4.01
2.88
3.54
4.14
3.57
3.90
Government
87.4 79.9
UP+Sec/HS P+UP+Sec UP+SecP + UPP. only 55 - 56 57-58 59-60 TLM SD Grant
Gender
• I sincerely thank for having sent us the a copy of your latest publications which are very useful for ourfaculty members as reference material. Mr. A. Sukumar, North East Regional Institute of Education,National Council of Educational Research & Training, Meghalaya.
• Thank you very much for sending copy of your publication. This has been very carefully and excellentlyprepared. Dr. M. D. Tiwari, Director, Indian Institute of Information Technology, Allahabad.
• This publication certainly is useful for planning of school education in the country. I appreciate theefforts of NUEPA for their hard and tireless effort for bringing out this publication. Dr S.S Jena,Chairman, National Institute of Open Schooling, NOIDA, U.P.
• The choice and usefulness of the content is very good quality and presentation is excellent. Nodoubt it is useful. Principal, M.M. Shah College of Education Wadhwan City.
• The publications are very useful in knowing the status of Gujarat with other states. It wouldbe useful for research also. Mr. M.N. Bhad, Director, SCERT, Gujarat.
• Excellent compilation of the data and very useful in planning activities pertaining to elementaryeducation. Dr. M. Shanmugam, Regional Director, IGNOU RC, Madurai.
• The quality of printing and arranging of data displayed are very good and are very easy to useand understand. Mr. YaqoobMemon, Director, Al-Hira Public School, Indore.
• This is a most impressive publication and is very precious for students and researchers in thisfield. Mr. Jacques Hallak, UNESCO, Paris, France.
• I am amazed at the analysis of school infrastructure, enrolment, teacher statistics etc. TheEducation Development Index appears to be a welcome tool of comparing the performanceof States. Shri. Prabhat Kumar, Former Cabinet Secretary, New Delhi.
• I am sure that our library users including M.Ed and Ph.D students will be benefited from thispublication. Dr.Muhammad Memon, Director, Aga Khan University Institute for EducationalDevelopment, Karachi, Pakistan.
• The document will surely help us to understand the latest status of education in India in generaland Gujrat in particular. Dr. PushpaWadhwani, Head, AzimPremji Foundation, Gujarat.
• I find the publication well prepared, quite useful and informative, Dr. B.N. Yugandhar, Member,Planning Commission of India, YojanaBhawan, Parliament Street, New Delhi.
• Just received the two volumes of elementary education in India. Should I say I am privileged?I have just leafed through the pages and have had a sensation. What a tremendous job done!Mr. SoumenHom, Kolkata.
• We will add the publication to our well-used education section and are sure that our readerswill find them useful and informative. Mr. Emma Mathieson, Librarian Oxford University, Oxford(U.K).
DISE Publications : A Few Comments
• The publication is very useful to our library users and researchers. Mr. Laxmi Prasad Sharma,CRC Co-ordinator, Nandugaon, South Sikkim.
• Publications are very useful for research work for faculty members and research scholars. Dr.PhanindraGoyari, Faculty Member, University of Hyderabad, Hyderabad.
• DISE publications are so good for working the uplifting of education in our day to day work.Mr. R. Kapzauva, Deputy Director, School Education, Aizawal.
• Publication and information are very useful. Dr. D.K. Mathela, Joint Director of Education,Nainital, Uttarakhand.
• Thank you for sending me very useful publications, Shri J. Veeraraghavan, Director,BhartiyaVidyaBhavan, New Delhi.
• I have placed the publication in our library for wider consultation by our scholars, ProfessorC.H. Hanumantha Rao, Chairman, Centre for Economic and Social Studies, Hyderabad.
• NUEPA’s success in operationalising the nationally acclaimed DISE has been one suchlandmark, revolutionizing the role of education planners, who can now address localdevelopmental needs from an informed perspective, armed with statistical and situationaldata, Mr. SampheLhalungpa, Ex-Chief, Education Section, UNICEF India Country Office, NewDelhi.
• Please accept my heartiest congratulations for the Silver Medal Awarded to the NationalUniversity of Educational Planning and Administration for developing the School ReportCards under DISE. Shri KapilSibal, Minister of Human Resource Development, Government ofIndia, New Delhi.
• The publication is useful for our institution. It will definitely enhance our knowledge. Mr. C.G.Joshi, Principal, Rajkot Inter College, Almora.
• Very good and useful publication, especially for research scholars. Dr. PratibhaPande, AssociateProfessor, S.C. College, Ballia.
• My joy knows no bound in receiving 3 latest publications on Elementary Education in Indiapublished by the National University of Education Planning and Administration. NUEPA hasbeen rendering yeoman’s service to the cause of education in general and school education inparticular for a long period of time. Shri Kanti Biswas, Former Education Minister, West Bengal.
• The publications: Elementary Education in Rural and Urban India would be very useful additionto our library, Mr. Mohammad Hamid Ansari, Chairperson, National Commission for Minorities,Government of India, New Delhi.
• These publication will be of immense useful to this University and to myself. Prof. Dillip. K.Bandyopadhyay, Vice-Chancellor, Guru Gobind Singh Indraprastha University, New Delhi.
• These Publications are very useful for the faculties and research scholors. Prof. B. Hanumaiah,Vice-Chancellor, BadasahebBhimraoAmbedkar University, Lucknow.
• DISE Publications are very useful to the researchers, administrators and academic community.Prof. M.C. Reddeppa Reddy, Director, Department of ADULT & Continuing Education, Trirupati.

• These Publications are very useful to the students, research scholars and Teachers. Dr. L.B.Patted, Principal, University College of Education, Dharwad, Karnataka.
• Appreciate the efforts of NUEPA for bringing out such an exhaustive publication for use ofall concerned and distribution. Dr. G. Vijayalakshmi, Professor & Head, Department ofEducation, S.P. MahilaVisvavidyalayam, Tirupati.
• These Publications are very good. Ms. Bhavana Sharma, Asst. Manager, Habitat Library &Resource Centre, India Habitat Centre.
• These Publications are very useful and informative for the faculty members of my department.Shri Chandra Sadayat, Head, Dept of Education in Languages, N.C.E.R.T, New Delhi.
• These Publications will be best utilized by our students and teachers in the library. Librarian,R.B.S. College, Library, Agra.
• The publications that we received are very useful. Dr. Mohd. Mussa, Principal, D.I.E.T Kargil.
• These Publications are very good and useful. Ms. SanjuKumari, Principal, District Institute ofEducation & Training, D.I.E.T Jasidih, Deoghar Jharkhand.
• These Publications are very good and useful content. Principal, D.I.E.T, East Siang Distt,Arunachal Pradesh.
• These Publications are useful for research, planning and further study. Mr. Zohmingthanga,Principal, District Institute of Education and Training: Aizwal.
• These Publications will be really helpful for the readers at the library. Dr. M. Samantaray,Head, LDD.
• The publication is quite informative with regard to Elementary Education in India. The samehas been sent to the Central Library for reference. Prof. O .P. Gill, Vice-Chancellor, MPUAT,Udaipur.
• The publication is very informative. I have deposited the same in our Library for wider use.Dr. Niti Mehta, Acting Director, SPIESR, Ahmedabad
• The publications containing valuable recent data on the state of elementary education inIndia will no doubt be found most useful by me and my students at JNU, Professor D.N. Rao,Centre for Economic Studies & Planning, Jawaharlal Nehru University, New Delhi.
• The DISE Flash Statistics is becoming smarter with more and more information. I congratulateDISE team for their total dedication in compiling the data, Mr. S.S. Rajagopalan, Chennai.
• I am sure the publication will be of immense use to many in the field of school education. Mr.S. Sathyam, Chairman, HRD Ministry’s Review Committee on Educational Statistics, New Delhi.
• We became very pleased and hope in future you must support us through these type ofeducational material from which our organization enrich its performance and updatesknowledge in educational concern. Mr. Umesh Secretary, SamajikParivartanSansthan, Giridih.
• The hard work done by NUEPA in bringing out these volumes without much time-lag iscommendable. The quality of publication is excellent. I am sure that the material given in

these volumes will be widely used. Professor A.B.L Srivastava, Chief Consultant, Technical SupportGroup, Ed. CIL. New Delhi.
• This will herald a new era for the academicians and researchers in the field of education toembark on fresh research and analysis. Professor RajendraMenaria, Jaipur.
• The publications are bound to help in my working on legal aspects of right to elementaryeducation. Mr. Ashok Aggarwal, Social Jurist, New Delhi.
• Congratulations on all your good work with DISE data. It is really a fantastic achievement toget increasingly reliable data on 1.3 million elementary schools in India. I think a lot can bedone in terms of district level analysis of the data. Dr. GeetaKingdon, Department of Economics,University of Oxford, Oxford.
• Thanks for sending me two volumes of your valuable publication, Elementary Education inIndia: District Report Cards, Professor Ashish Bose, Leading Demographer and Former Professor,Institute of Economic Growth, Delhi.
• The publications are immensely helpful with their rich State and District specific informationon all vital aspects of elementary education. Dr. C. Seshadri, Chairman, Karnataka KnowledgeCommission, Karnataka.
• Thanks for felicitations for your monumental publication, Elementary Education in India:Progress towards UEE, Analytical Report, Mr. Saiyid Hamid, former Vice-Chancellor, AligarhMuslim University, Chancellor, JamiaHamdard and Secretary, Hamdard Education Society, NewDelhi.
• The data provided by DISE would be of immense help to the people who are working in thefield of primary education. It would have been of great help to government to properly planfor the school level education for Muslims. Mr. Kamal Faruqui, Chariman, Delhi MinoritiesCommission, VikasBhawan, New Delhi.
• It was great to learn about the progress made regarding DIS.E. Dr. DeepaSankar, EducationEconomist, The World Bank, New Delhi.
• We hope to benefit from the publication. Dr. Montek Singh Ahluwalia, Deputy Chairman, PlanningCommission, New Delhi.
• Congratulations on the excellent production of the two volumes of the District Report Cards.Professor Amitabh Kundu, Centre for Studies in Regional Development, Jawaharlal Nehru University,New Delhi.
• I wish to compliment NUEPA for the valuable documents, very well structured to serve asvaluable reference material. Dr. M. Anandakrishnan, Chairman, Indian Institute of Technology,Kanpur.
• On behalf of our students and faculty, I would like to congratulate NUEPA for producing suchvaluable publications. Indeed, our faculty, researchers and students will benefit from thescholarly work that provides deeper insight into elementary education in India. Dr. MuhammadMenon, The Aga Khan University, Karachi (Pakistan).
• It is a massive work magnificently executed. Mr. MarmarMukhopadhyay, Director, EducationalTechnology and Management Academy, New Delhi.
• I am sending these publications to our Library for the benefit of researchers and students ofJNU. Professor B.B. Bhattacharya, Vice-Chancellor, Jawaharlal Nehru University, New Delhi.
• Congratulations for launching over one million school report cards - this is wonderfulachievement, Dr. Michael Ward, Senior Education Adviser, DFID India, British High Commission,New Delhi.
• It has been a sole pivotal contribution of NUEPA to the world of education, which shall bealways remembered. Professor B.P. Khandelwal, 45.3, ATS Greens II, NOIDA.
• Hon’ble Human Resource Development Minister Shri KapilSibal has been quite pleased tonote the enormous efforts of NUEPA that went into the significant publication, and extendscompliments to all those behind the arduous compilation which would be of immense value tothe policy-makers and researchers. Mr. Satish Nambudiripad, PS to HRM, Government of India,New Delhi.
• The publication will be extremely valuable input for my own research and understanding.Prof. G.K. Chadha, Chief Executive Officer, South Asian University, New Delhi.
• The publication is quite useful and informative. Prof. Ramesh K. Goyal, Vice-Chancellor, TheMaharaja Sayajirao University of Baroda, Gujarat.
• This is very valuable and useful. This publication had been placed in our Central Library.Prof. B.S. Bisht, Vice-Chancellor, G.B. Pant University of Agriculture and Technology, Uttarakhand.
• This is very useful document for everybody engaged in work related to developed of education.Mr. Prem Chand, Sr. Consultant, TSG, NLMA, New Delhi.
• The outcome of the publications is truly satisfactory and it is quite useful and informative.State Report Cards also represents the information of progression. Swami Swarupananda,Ramakrishna Ashrama, Gwalior.
• The publication will be a vital source of information for our researchers. Dr. H.S. Chopra,Librarian, Bhai Gurudas Library, Guru Nanak Dev University, Punjab.
• These documents would be immense use to our readers as well as researchers. It will be a richaddition to our library collection. Dr. H.S. Chopra, Librarian, Bhai Gurdas Library, Amritsar,Punjab.
• This publication is very much useful to us. No doubt, it will enrich our Library. Prof.SudarshanLyenger, Vice-Chancellor, Gujarat Vidyapith, Ahmedabad.
• These publications will be very much useful to our readers. Dr. Th. Khomdon Singh, Librarian,Manipur University, Imphal.
• The two volumes contain abundant and valuable information pertaining to ElementaryEducation in India. Ms. Cima M. Yeole, Shivaji University, Kolhapur, Maharashtra.
• NUEPA documents are really helpful for research in education. Dr. NeerjaDhankar, Principal,Army Institute of Education. New Delhi.
• The publication contain immensely useful data and analysis, Prof. A. S. Khullar, NationalInstitute of Administrative Research, Mussoorrie, Uttarakhand.
• This publication is not only very useful for our library uses but it has also enhanced our librarycollection qualitatively and quantitatively. Mr. B. Ganapathi, Librarian, EntrepreneurshipDevelopment Institute of India.
• The publication give important and useful information on various facts of elementary educationand significantly useful to the researchers who are working in this area. Prof. R.S. Deshpande,Director, Institute for Social and Economic Change, Bangalore.
• I found them to be very informative, giving good idea about the current state of elementaryeducation vis-à-vis national goals. Dr. S Krishnamoorthy, Registrar, Amrita, VishwaVidyapeetham,Coimbatore.
• The information is quite informative and useful for those working in this area. Mr. M.D.Tiwari, Indian Institute of Information Technology, U.P.
• The publication is very useful to us. No doubt, it will enrich our library. Mr. SudarshaIyengar,Vice-Chancellor, Gujarat Vidyapeeth, Ahmedabad.
• The publication are being kept in our Central Library for general reading and also for using itas a reference material by the faculty and students. Prof. AbhijitMukharjee, Director, ThaparUniversity, Punjab.
• Every year, I look forward to receiving your publications filled with pieces of valuableinformation. The DISE system is one of the most important resources for my study and researchwork. Dr.Hisako Akai-Pinto, Fukuoka, Japan.
• This is informative, useful and a great resource to the researchers and policy makers, hencethese copies are in our library for our team and visitors as well. Mr. Suchash Chandra, Director,Centre for Action Research and Peoples Development, Hyderabad.
• Elementary Education is one of the important core area of research and training of NationalInstitute of Administrative Research, LalBahadurShasrti National Academy of Administration.Thus, these valuable publications of NUEPA are of paramount importance to us. Prof. A.S.Khullar, LalBahadurShasrti National Academy of Administration, Uttarakhand.
• We find the State Report Cards of NUEPA very useful. Ms. Rohini Mukherjee, Head, Policy &Advocacy, Nandi Foundation, Hyderabad.
• These compilations which are very much useful for appropriate planning and need basedstrategies. Mr. P. Prasanthi, State Programme Director, A.P. MahilaSamatha Society, Andhra Pradesh.
• I browsed through the above reports and I congratulate the team involved in bringing ourthese useful and informative reports which will be immensely helpful to the researchers andpolicy makers as it gives vital information pertaining to elementary education. Prof. R.S.Deshpande, Director, Institute for Social and Economic Change, Bangalore.

• I hope the scope of this exercise in future will be expanded to the High, Higher Secondary andCollege level for a holistic understanding on the educational scenarios in India. An abstractedstatement indicating performance of district within the state and states within the countrybased on indentified key parameters will strengthen the understanding. My best wishes andappreciation to the team members committed in doing this excellent task. Dr. M. Paramathma,Ph.D. Director of Research, Tamil Nadu Agricultural University, Coimbatore.
• It is a very valuable data for researchers. Prof. A.K. Sharma, formerly Director NCERT, NewDelhi.
• This publication is very timely and useful for all researchers and policy makers pertaining toelementary and associated planning. I have referred these publications to our Central Libraryfor necessary action. Mr. B.S. Bist, Vice-Chancellor, G.B. Pant University of Agriculture andTechnology, Uttarakhand.
• These publications will help us in updating our knowledge base regarding the educationalstatus across the country. Sandhan Society of Education & Development.
• These are really useful for the faculty and researchers concerned. Mr. I.V.Trivedi, Vice-Chancellor,MohanlalSukhadia University, Rajasthan.
• The publications contain lots of information. It will be very useful for our research work. Itwill be display in the Library for our users. Dr. Christopher Lakra, Executive Director, IndianSocial Institute, New Delhi.
• A significant addition to our collection and help to our academic and research community with vitalinformation on various facets of elementary Education. Dr K. Rama Patnaik, Indian Institute ofManagement, Banglore.
• Thank you very much. It is indeed a valuable addition to the knowledge resources of our future. Mr.Kush Verma, Director General, NIAR, LBSNAA, Mussoorie.
• This is an excellent document which would be very useful for us. Shri Ratan Mathur, Senior ProgramOfficer Education, Sir Dorabji Tata Trust and the Allied Trusts, Mumbai.
• Many thanks for sending publications for our library. Mr. Peter McGuckian, Director of InternationalDevelopment, Australian Council for Educational Research, Camberwell.
• I wish to compliment you and your team for the excellent document. Dr. Amarjit Singh, AdditionalSecretary, Department of School Education and Literacy, MHRD, New Delhi.
• I am sure my colleagues will find the publication useful and informative. Thank you for sending us thesame. Dr. K C Sivaramakrishnan, Research Professor and Chairman Centre for Policy Research,New Delhi.
• The documents are of immense value for the educators and education loving people, as thosecater various facets of elementary education of the country. Mr. Abani Boral, Convener, NationalCo-ordinator Committee of Indian Teachers’ Organisations, Bhubneswar.
• The wealth of information contained in these documents are immensely useful in our day today work. Mr. Janmejoy Patel, President, Sundergarh Education Society, Orissa.
• The document is useful to our faculty, scholars and students. S.K.V. Suryanarayana Raju, Headof the Department, Department of Economics, Andhra University.
• The publication will help us in our ongoing activities as NIAR is working on education since itsinception. Ms. Garima Yadav, NIAR, Uttarakhand.
• The kind of information provided in your publication is of great value addition and being aneconomic research firm we seeks such information. Dr. Laveesh Bhandari, Director, IndicusAnalytics Pvt. LTd., New Delhi.
• These reports are quite useful and informative for our researchers and teachers. Dr. H.S. Chopra,Librarian, Bhai Gurudas Library, Guru Nanak Dev University, Amritsar.
• The documents will provide vital information pertaining to various facts of elementary educationto all concerned. Prof. VandanaSuhag, Registrar (Academic), Sikkim Manipal University, Sikkim.
• These publication of course, is of immense help and contains useful information pertaining toelementary education. Dr. Sheikh Bashir Ahmad, Chairman, J & K State Boards of School Education,J&K.
• I am sure it will be very useful and informative for the concerned readers. It is being kept inthe university library for the use of the students and faculty members of the university. Prof.B. Hanumaiah, Vice-Chancellor, BabasahebBhimraoAmbedkar University, Lucknow, Uttar Pradesh.
• This is, indeed, a very useful document, which presents the overall scenario of elementaryeducation, across the country. Dr. MeenalSarda, Programme Officer (Education), Aga KhanFoundation (India), New Delhi.
• It is really a wealth to researchers & policy makers to access vital information pertaining to variousfacets of elementary education. Mr. M. Subhash Chandra, Centre for Action Research and People’sDevelopment (CARPED), Hyderabad.
• Please accept my congratulations for bringing out such an important document along with theanalytical tables. Mr. Rajendra Menaria, [email protected], Jaipur.
• This report is useful to us in our regular research and advocacy campaign for child rights.Dr. R. Venkat Reddy, National Convener, [email protected].
• The publication has a wealth of information about elementary education and will definitely help theacademic community in reaserch, administration and related activities. Mr. Paritosh Pawar, K.E.T’sV.G. Vaze-Kelkar College, Mumbai.
• The team that has compiled these volumes deserves compliments for their excellent contribution.Prof A.K Singh, Vice Chancellor, Rajmata Vijayaraje Scindia Krishi Vishwa Vidaylaya, Gwalior.
• I express my warm congratulation to NUEPA for bringing such an informative and useful material. Dr. Kunjumuhammed Pulavath, Lecturer in Education, DIET Ernakulam, Kerala.
• I have received the publications. It is very important and useful for us. Mr. Jay Kumar Mishra,Secretary, Apna Aangan, District. Giridih, Jharkhand.
• I am happy to inform you that I have received the publications, Mr. B. Latanpuia, Director, SRC,NEHU, Shillong.
• This book will be very useful addition to our library collection and I am sure our readers willfind it useful. This book would be added to the library collection and displayed prominentlyin the new additions. Mr. Prabhu B. Gaddimani, Assistant Librarian, Sir Dorabji Tata MemorialLibrary, Mumbai.
• It has very useful contents and qualitative material and presentation. Dr. Ajit Kumar Jain,Formerly Professor, HCM, RIPA & IHMR, Jaipur.
• The publication is useful for our institution. It will definitely enhance our knowledge. Mr. C. G.Joshi, Principal, Rajkot Inter College, Almora.
• Very good and useful publication, especially for research scholars. Dr. PratibhaPande, AssociateProfessor, S. C. College, Ballia.
• The publication will be of great reference to our teachers as well as students and hence a veryuseful addition to our library. Ms.Nandi Nailwal, Librarian, LalBahadurShastri Institute ofManagement, New Delhi.
• This publication is very good for Elementary Level. Dr. ShobhaPawar, Principal, District Instituteof Education and Training, Loni- Kalbhor, Pune.
• The choice and usefulness of the content is very good quality and presentation is excellent. Nodoubt it is useful. Principal, Smt. M.M. Shah College of Education Wadhwan City.
• The publications are very useful in knowing the status of Gujarat with other states. It wouldbe useful for research also. Shri M.N. Bhad, Director, SCERT, Gujarat.
• Excellent compilation of the data, very useful in planning activities pertaining to elementaryeducation. Dr. M. Shanmugam, Regional Director, IGNOU, Madurai.
• The publication is very useful to our library users and researchers. Mr. Laxmi Prasad Sharma,CRC Co-ordinator, Nandugaon, South Sikkim.
• I acknowledge with thanks the receipt of your latest publications. Mr. Sunit Tandon, DirectorGeneral, Indian Institute of Mass Communication, New Delhi.
• The publication would be a great help for the researchers in CMDR and particularly to those whoare researching in the domain of education. Prof Pushpa Trivedi, Director, Centre for Multi-Disciplinary Deveoplment Research, Karnataka.
• The Flash Statistics relating to Elementary Education in India, does provide the very up to date,comprehensive and usable data. Dr. Pritam Singh,Common Wealth Fellow.
• I have gone through the publications and found them very informative. Ms. Mamta Sharma,Chairperson, National Commission for Women, New Delhi.
• Very informative and useful statistics for research. Mr. Bhagirath Govind Shetye, Secretary, GoaBoard of Secondary Education, Goa.
• I find the publication very informative. Our colleagues and research scholars should find it useful fortheir work, Prof. Rama Mathew, Head and Dean, Faculty of Education, University of Delhi,Delhi.
• It gives a wealth of information on schools which can be selectively analysed by researchers to giveinputs to projects they are involved in. Please keep up your good work, Prof. Ashish Bose,Honorary Professor, The Institute of Economic Growth, Delhi University, Delhi.
• Publications are very useful for research work for faculty members and research scholars. Dr.PhanindraGoyari, Faculty Member, University of Hyderabad, Hyderabad.
• DISE publications are so good for working the uplifting of education in our day to day work.Mr. R. Kapzauva, Deputy Director, School Education, Aizawal.
• Publication and information are very useful. Dr. D.K. Mathela, Joint Director of Education,Nainital, Uttarakhand.
• This is a good publication for researchers. Ms. Padmaja Panda, Librarian, D.P. MisraInstitutefor advanced studies in Special Education and Technology, Ganjam.
• The report is of great help to me and to the researchers of my department. An excellent work.Dr. VandanaUpadjyay, Associate Professor, Department of Economics, Rajiv Gandhi University,Itanagar.
• This document will be helpful for our training programme as well as further research work.Ms. RenuTanwar, Principal, DIET-Nathdwara, Rajsamand.
• DISE publications are very useful to understand status of education and future planning. Mr.N. Raghu Kumar, Principal, DIET, Boyapalem, Guntur.
• In connection with our research requirements we shall appreciate receiving DISE publications.Dr. VibhaDutt, Secretary, SaraswatiKunj, Nirala Nagar, Lucknow.
• Good compilation. Dr. SheelaRamchandran, Vice-Chancellor, AvinashilingamInstitute for HomeScience and Higher Education for Women, Coimbatore.
• It will be a valuable addition to our library which is being used by scholars, activists andsocial workers. Mr. Anil Pradhan, Member-Secretary, Sikshasandhan, Sikshasandhan Campus,Bhubaneswar, Odisha.
• These publications are lot of value to an education sector research organization such as ours.Mr. Chetan Sharma-Datamation Group, New Delhi.
• These are the authentic documents which are being used by Research Scholars very frequently.Shri. G. B. Devchardhury, Librarian, OKD Institute of Social Change and Development, Guwahati.
• The document is very useful to me and over one lakh teachers in our organization. Mr.KathiNarasimha Reddy, President, State Teachers Union, Hyderabad.
• It is a wonderful publication. Mr. B. LalTanpuia I/C Director, S.R.C Nehu, Shillong.
• I just browsed through the report and found it quite useful and informative. Prof Binay KumarPattnaik, Institute For Social and Economic Change, Bangalore.

• It is really a matter of great pleasure to have update status of Elementary Education in India throughyour publication. It is indeed the result of hard work and commitment for the cause of children’seducation. Mr. Ashok Aggarwal, Advocate Delhi High Court, Delhi.
• I found the publication very informative and useful. Prof Saswata Biswas, Director-in-chanrge,Institute of Rural Management Anand, Gujarat.
• I have been receiving these valuable publications in the past as well. They are of immense use to mein preparing my public lectures as well as input into my research writings. Thanks a lot, from the coreof my heart, for sending me such valuable publications, Prof G.K Chadha,President South AsianUniversity, New Delhi.
• In fact, these reports have encouraged me to undertake a research study on elementary education,especially in remote areas and urban slums in selected areas, Mr. Keshab Das, Professor, GujaratInstitute of Development Research, Ahemdabad.
• The literature is comprehensive and rich in context, Mr. Jitendra Singh, Secretary, Innovation,CSR, Education & Skill Development Committee, New Delhi.
• It is definitely useful for all stakeholders working for educational management and improvement, Dr.Shibal Gupta, Member- Secretary, Asian Development Research Institute (ADRI), Patna.
• DISE Publication is commendable. Mr. ManindraBhujel, Principal, KalimpongGovernment PrimaryTeachers Training Institute, Darjelling.
• Material published is useful source of data. Dr. Brundaban Chandra Mishra, Principal, DAV.Koraput.
• The document is informative and very useful for our faculty members. Smt. T. G. Momin,Principal In-charge, DIET, Resubelhara, East Garo Hills.
• This is very useful for the researchers. Dr. Ajay Lakhan Pal, Principal, Government College ofTeacher Education, Dharamshala.
• It is very informative publication and useful resource for the researchers. Mr.GajendraBallavDevchudhury, Librarian, OKD Institute of Social Change & Development, Guwahati.
• Contents of DISE publications are very useful for us. Mr. Umesh Kumar, Secretary,SamajitParivartanSansthan, Shree Krishna Nagar, Giridih, Jharkhand.
• Very useful for each one of us working on school education. Dr. Gouri Srivastava, Professor &Head, Department of Women’s Studies, NCERT, New Delhi.
• Both documents shows the mirror of the District Scenario and it is quite useful to achieve thegoals in the field of education. Dr. T. S. Joshi, Principal, DIET, Gandhi nagar, Gujarat.
• This document, no doubt, will provide opportunity to researchers and policy makers to access vitalinformation pertaining to various facets of Elementary Education and quite useful and informative.Prof K.B. Rath, Principal, Regional Institute of Education, Bhubaneswar.
• Thank you for sending the publication. The publications will be kept in our University Library for useby the researchers and teachers. Prof Dr. B. Thimme Gowda, Vice Chancellor. Banglore University
• Many thanks for sending me your publication. This publication has been kept in our library. ProfChetan Vaidya, Director, School of Planning and Architecture, MHRD, New Delhi
• Thank you very much for sending your latest publications. I am sure this publication will be of immensevalue to the researchers and educators. Prof S. M Sajid, V.C Jamia Milia Islamia, New Delhi
• Thank you for sending me copies of your latest publications. Prof. S. K. Sopory, Vice-Chancellor,Jawaharlal Nehru University, Delhi.
• This report is very informative and useful for our students and faculty at our University. MrSuresh Balutagi, Azim Premji University, Bangalore.
• Many thanks for sending your latest publications. Prof R. Radhakrishna, Chairman, Centre forEconomic and Social Studies, Hyderabad.
• It has provided us ample amount of data about our state in the present context of education. Mr. G.CJoshi, Principal Dubkiya-‘ Ashish Sadan’ Uttarakhand
• Thank you for forwarding a copy of latest publications. I look forward to collaboration in future, Dr.Bharat Bhushan, Professor, Environmental Planning & Dean, Yashwnatrao Chavan Academyof Development Administration, Maharashtra.
• I congratulate you and your team for this commendable work, Mr. Shiv Das Meena, PrincipalSecretary to Government, Annamalai University, Chidambaram.
• I sincerely hope your efforts will go a long way to improve the education system, Mr. S. SudhakarReddy, General Secretary, Communist Party of India, New Delhi.
• I am sure that the staff and researchers would find it immensely useful for their teaching and research,Central Library, Loyola College, Chennai.
• We appreciate your efforts for the detailed account of the Elementary Education in India, Col J ARocque, Principal, International India School, Dammam, Saudi Arabia.
• We have been hugely benefited by the data we got from “School Report Cards”, Ms. Alka Pagare,Manager, Kotak Education Foundation, Deonar, Mumbai.
• It is a landmark attainment of NUEPA, useful for study on Administration and planning. Prof B.PKhandelwal, Consultant COBSE, Member DPS Society, NOIDA.
• It will be of great value for policy makers as well as researchers. Prof. Sudhi Rajiv, Director,Kamla Nehru College for Women, Jodhpur.
• Thank you for sending me a copy of your recently report on the elementary education. I appreciateyour kind gesture, Mr. N.R Narayana Murthy, Executive chairman, Infosys, Bangalore.
Elementary Education in India: Where do we stand ?
74