Embed Size (px)
Citation preview

PULSE SEQUENCES
Emphasizing the differences among spin density, T1, and T2 relaxation time constants of the tissues is the key to the exquisite contrast sensitivity of MR images. • Tailoring the pulse sequences—that is, the
timing, order, polarity, and repetition frequency of the RF pulses and applied magnetic field gradients—makes the emitted signals dependent on T1, T2 or spin density relaxation characteristics.
MR relies on three major pulse sequences: • spin echo,
• inversion recovery, and
• gradient recalled echo.
When these used in conjunction with localization methods (i.e., the ability to spatially encode the signal to produce an image, “contrast-weighted” images are obtained.
SPIN ECHO
Spin echo describes the excitation of the magnetized protons in a sample with an RF pulse and production of the FID, followed by a second RF pulse to produce an echo. • Timing between the RU pulses allows
separation of the initial FID and the echo and the ability to adjust tissue contrast.
Time of Echo
An initial 90-degree pulse produces the maximal transverse magnetization, Mxy, and places the spins in phase coherence. • The signal exponentially decays with T2*
relaxation caused by intrinsic and extrinsic magnetic field variations.

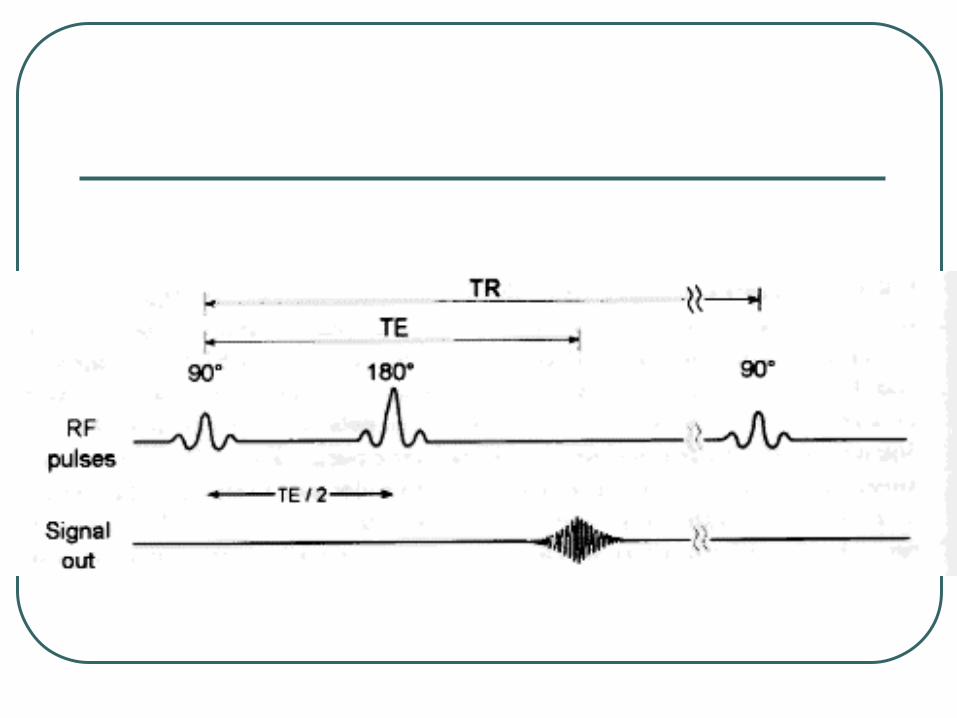
After a time delay of TE/2, where TE is the time of echo, a 180-degree RF pulse is applied, which inverts the spin system and induces a rephasing of the transverse magnetization. • The spins are rephased and produce a
measurable signal at a time equal to the time of echo (TE).
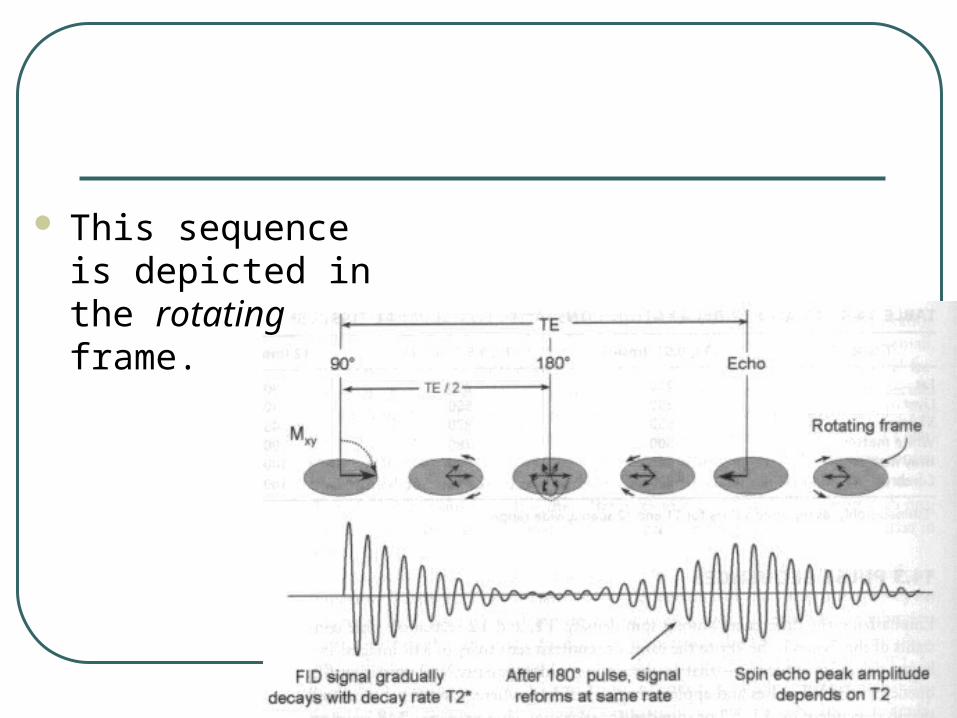
This sequence is depicted in the rotating frame.
The echo reforms in the opposite direction from the initial transverse magnetization vector, so the spins experience the opposite external magnetic field inhomogeneities and this strategy cancels their effect.
• The 0 inhomogeneiry-canceling effect that the spin echo pulse sequence produces has been likened to a foot race on a track.
The racers start running at the 90-degree pulse, but quickly their tight grouping at the starting line spreads out (dephases) as they run at different speeds.
After a short period, the runners are spread out along the track, with the fastest runners in front and the slower ones in the rear. • At this time (TE/2), a 180-degree pulse is
applied and the runners all instantly reverse their direction, but they keep running at the same speed as before.

Immediately after the 180-degree rephasing RF pulse, the fastest runners are the farthest behind and the slowest runners are in front of the pack. • Under these conditions, the fast runners at
the end of the pack will catch the slow runners at the front of the pack as they all run past the starring line together (i.e., at time TE).
Even in a field of runners in which each runs at a markedly different speed from the others, they all will recross the starting line at exactly TE. • The MR signal is at a maximum (i.e., the peak
of the FID envelope) as the runners are all in phase when they cross the starting line.

They can rim off in the other direction, and after another time interval of TE/2 reverse their direction and run back to the starting line. • Again, after a second TE period, they will all
cross the starting line (and the FID signal will be at its third peak), then head off in the other direction.
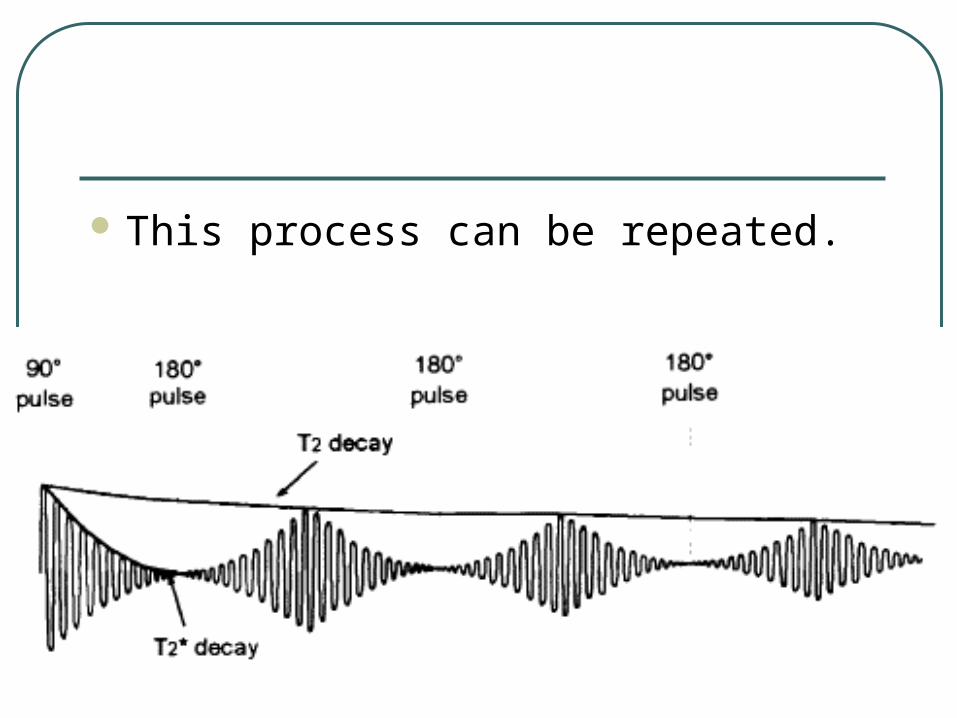
This process can be repeated.
The maximal echo amplitude depends on the T2 constant and not on T2*, which is the decay constant that includes magnetic field inhomogeneities. • Of course all MR signals depend on the
proton density of the tissue sample, as well.
Just before and after the peak amplitude of the echo (centered at time TE) digital sampling and acquisition of the signal occurs.
Spin echo formation separates the RF excitation and signal acquisition events by finite periods of time, which emphasizes the fact that relaxation phenomena are being observed and encoded into the images. • Contrast in the image is produced because
different tissue types relax differently (based on their T1 and T2 characteristics).
Multiple echoes generated by 180-degree pulses after the initial excitation allow the determination of the “true T2” of the sample.
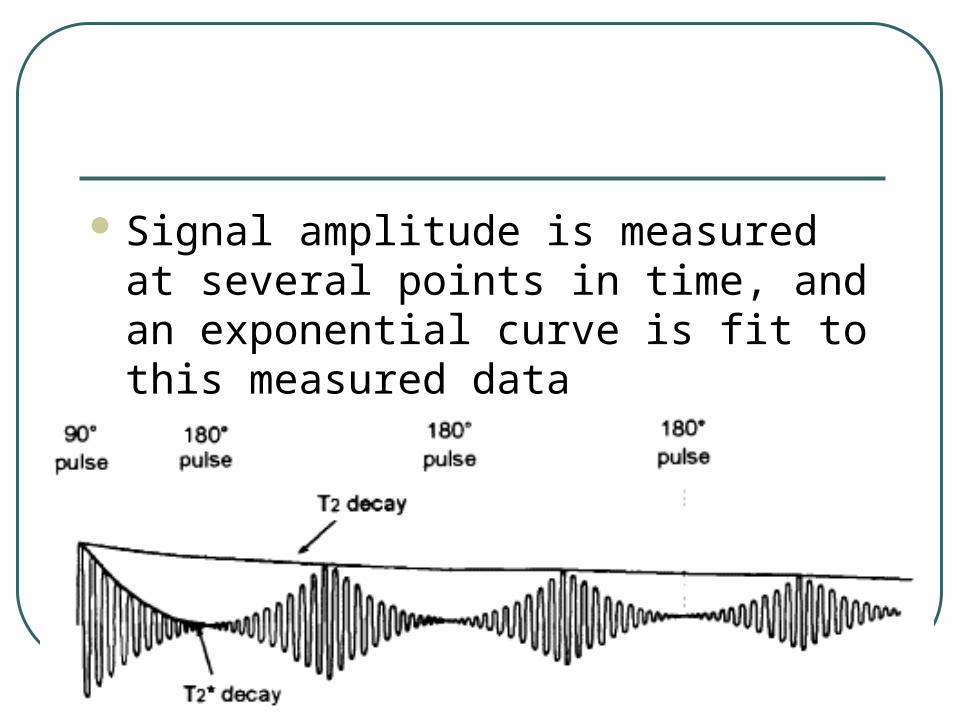
Signal amplitude is measured at several points in time, and an exponential curve is fit to this measured data

The T2 value is one of the curve-fitting coefficients.
Time of Repetition and Partial Saturation
The standard spin echo pulse sequence uses a series of 90-degree pulses separated by a period known as the time of repetition (TR), which typically ranges from about 300 to 3,000 msec. • A time delay between excitation pulses allows
recovery of the longitudinal magnetization.
During this period, the FID and the echo produce the MR signal. • After the ‘ER interval, the next 90-degree
pulse is applied, but usually before the complete longitudinal magnetization recovery of the tissues.

In this instance, the FID generated is less than the first FID. • After the second 90-degree pulse, a steady-
state longitudinal magnetization produces the same FID amplitude from each subsequent 90-degree pulse (spins are rotated through 360 degrees and are reintroduced in the transverse plane).
Tissues become partially saturated (i.e., the full transverse magnetization is decreased from the equilibrium magnetization), with the amount of saturation dependent on the T1 relaxation time.
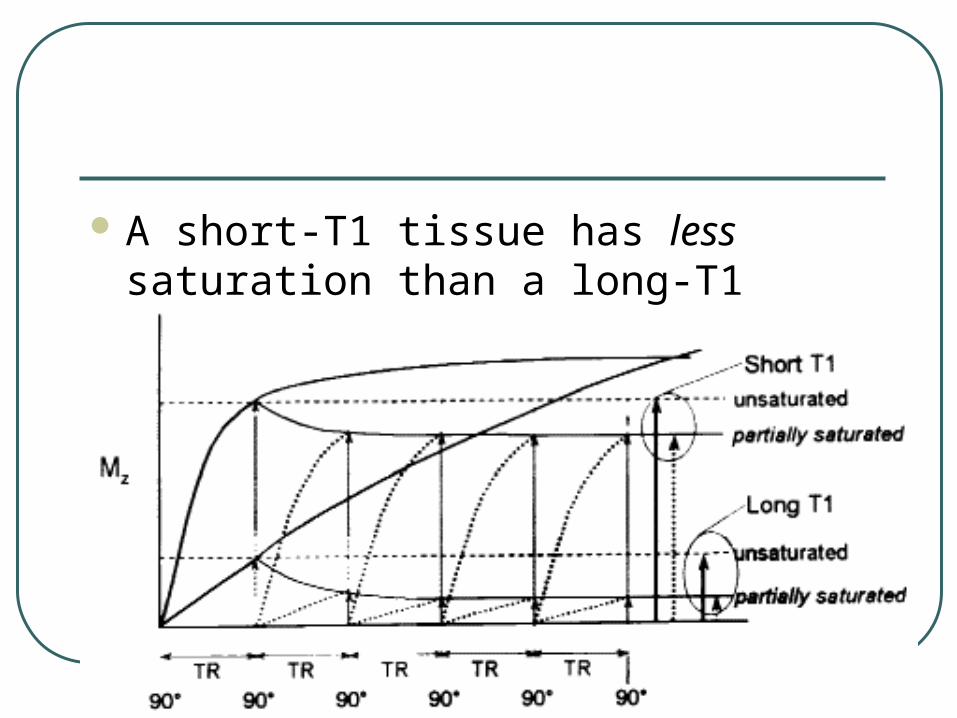
A short-T1 tissue has less saturation than a long-T1 tissue.
For spin echo sequences, partial saturation of the longitudinal magnetization depends on the TR and T1 of the tissues. • Partial saturation has an impact on tissue
contrast.
Spin Echo Contrast Weighting
Contrast in an image is proportional to the difference in signal intensity between adjacent pixels in the image, corresponding to two different voxels in the patient.
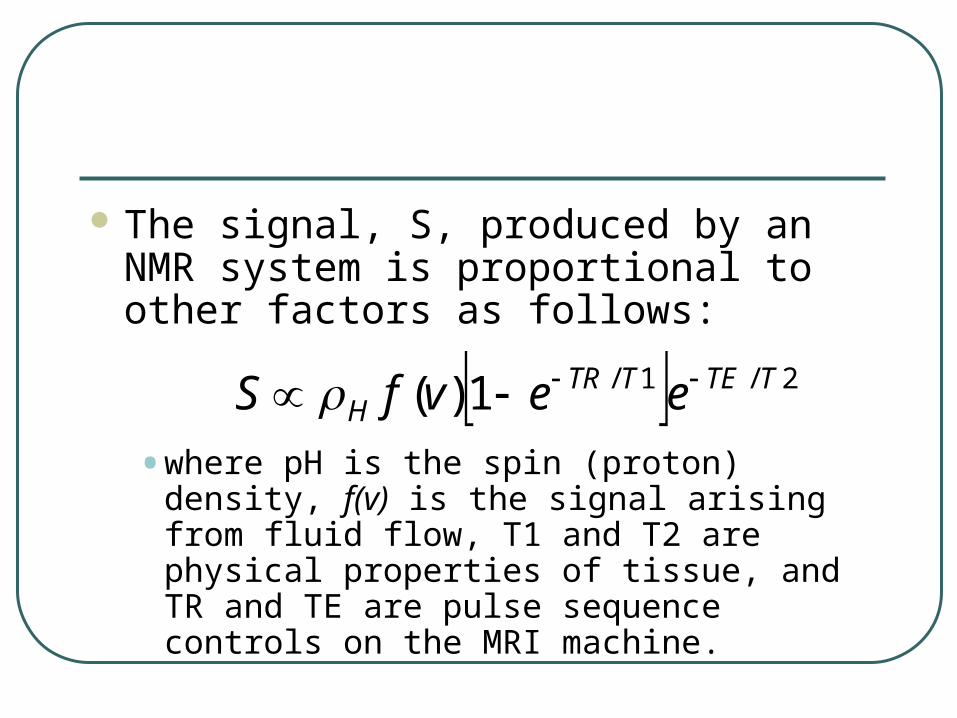
The signal, S, produced by an NMR system is proportional to other factors as follows:
• where pH is the spin (proton) density, f(v) is the signal arising from fluid flow, T1 and T2 are physical properties of tissue, and TR and TE are pulse sequence controls on the MRI machine.
2/1/1)( TTETTRH eevfS
The equation shows that for the same values of TR and TE (i.e., for the same pulse sequence), different values of T1 or T2 (or of H or f(v)) will change the signal S. • The signal in adjacent voxels will be different
when T1 or T2 changes between those two voxels, and this is the essence of how contrast is formed in MRI.
Importantly, by changing the pulse sequence parameters TR and TE, the contrast dependence in the image can be weighted toward T1 or toward T2.
T1 Weighting
A “T1–weighted” spin echo sequence is designed to produce contrast chiefly based on the T1 characteristics of tissues by de-emphasizing T2 contributions. • This is achieved with the use of a relatively
short TR to maximize the differences in longitudinal magnetization during the return to equilibrium, and a short TE to minimize T2 dependency during signal acquisition.
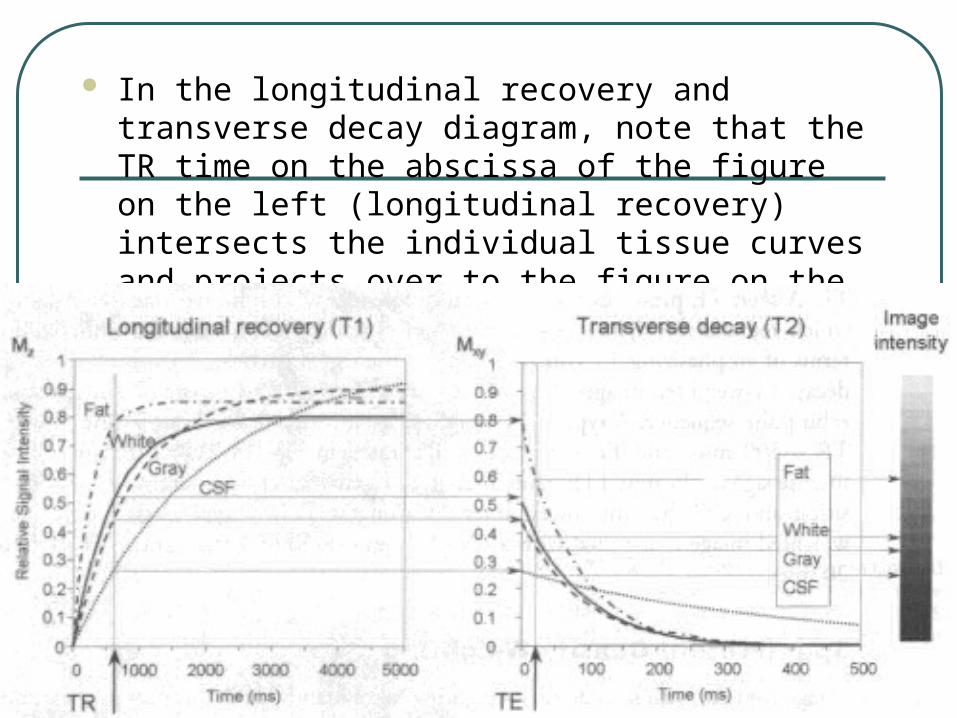
In the longitudinal recovery and transverse decay diagram, note that the TR time on the abscissa of the figure on the left (longitudinal recovery) intersects the individual tissue curves and projects over to the figure on the right (transverse decay).
These values represent the amount of magnetization that is available to produce the transverse signal, and therefore the individual tissue curves on right-hand figure start at this point at time T = 0. • The horizontal projections (arrows) graphically
demonstrate how the T1 values modulate the overall MRI signal.
When TR is chosen to be 400 to 600 msec, the difference in longitudinal magnetization relaxation times (T1) between tissues is emphasized.
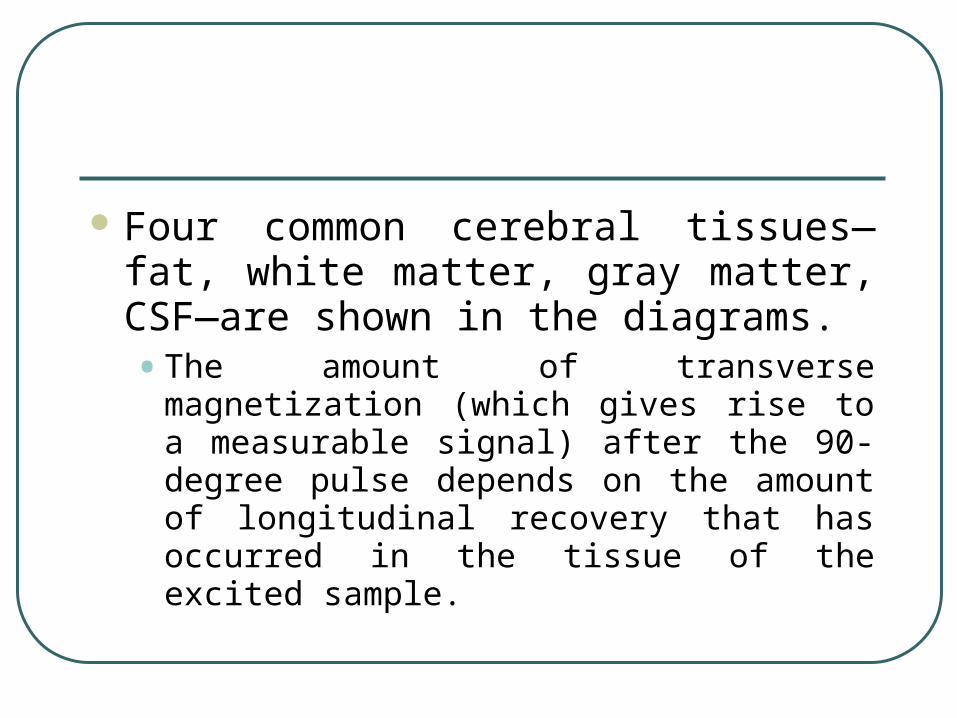
Four common cerebral tissues—fat, white matter, gray matter, CSF—are shown in the diagrams. • The amount of transverse magnetization
(which gives rise to a measurable signal) after the 90-degree pulse depends on the amount of longitudinal recovery that has occurred in the tissue of the excited sample.
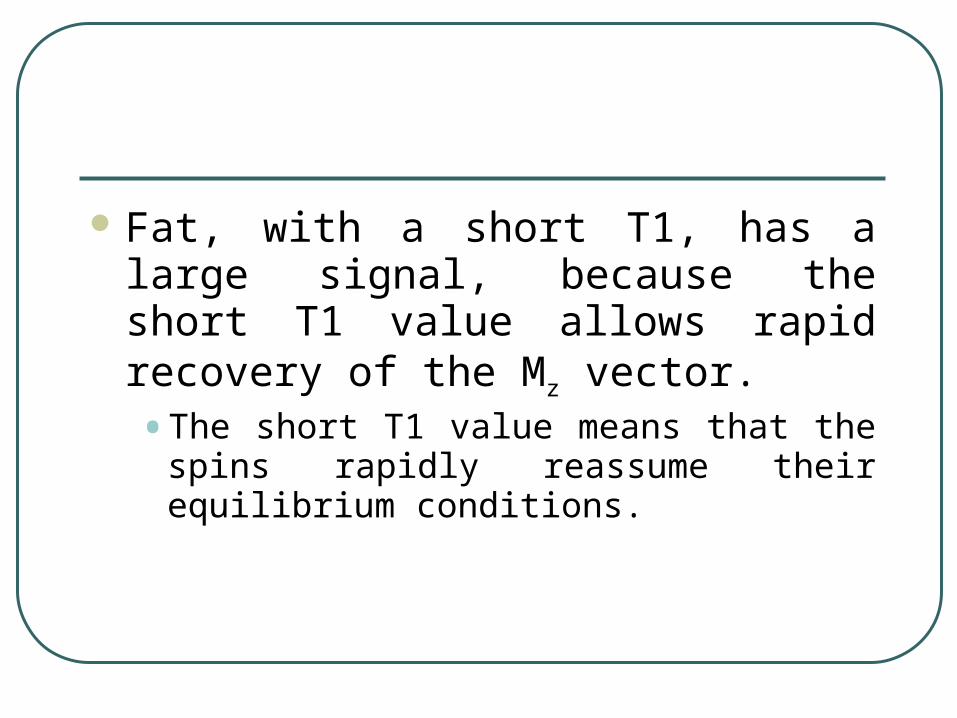
Fat, with a short T1, has a large signal, because the short T1 value allows rapid recovery of the Mz vector. • The short T1 value means that the spins
rapidly reassume their equilibrium conditions.
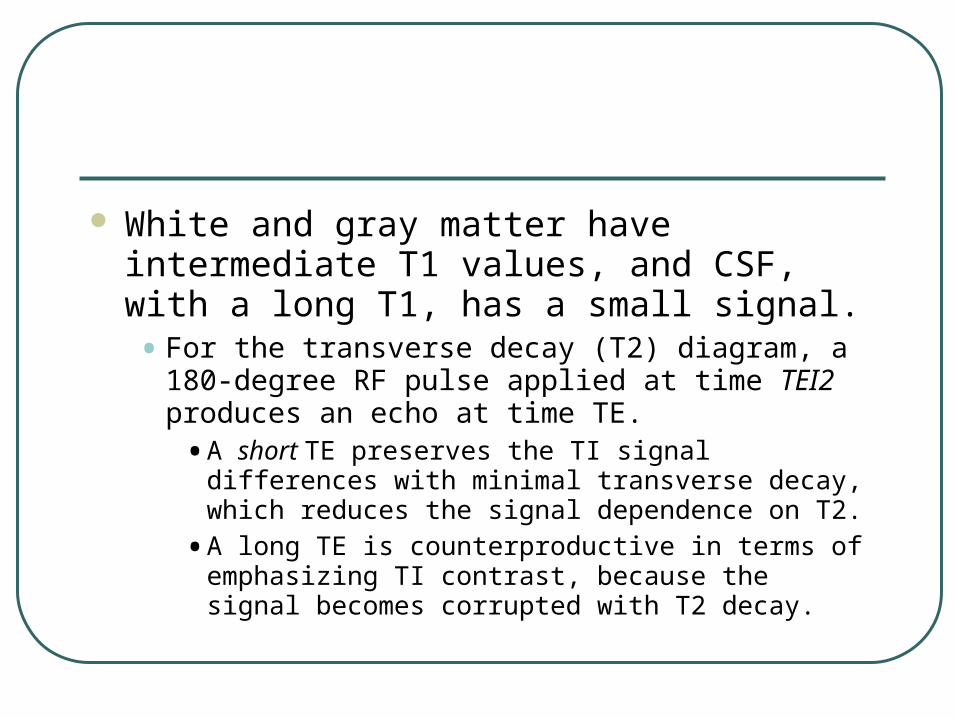
White and gray matter have intermediate T1 values, and CSF, with a long T1, has a small signal. • For the transverse decay (T2) diagram, a 180-degree
RF pulse applied at time TEI2 produces an echo at time TE.
• A short TE preserves the TI signal differences with minimal transverse decay, which reduces the signal dependence on T2.
• A long TE is counterproductive in terms of emphasizing TI contrast, because the signal becomes corrupted with T2 decay.
T1-weighted images therefore require a short TR and a short TE for the spin echo pulse sequence.
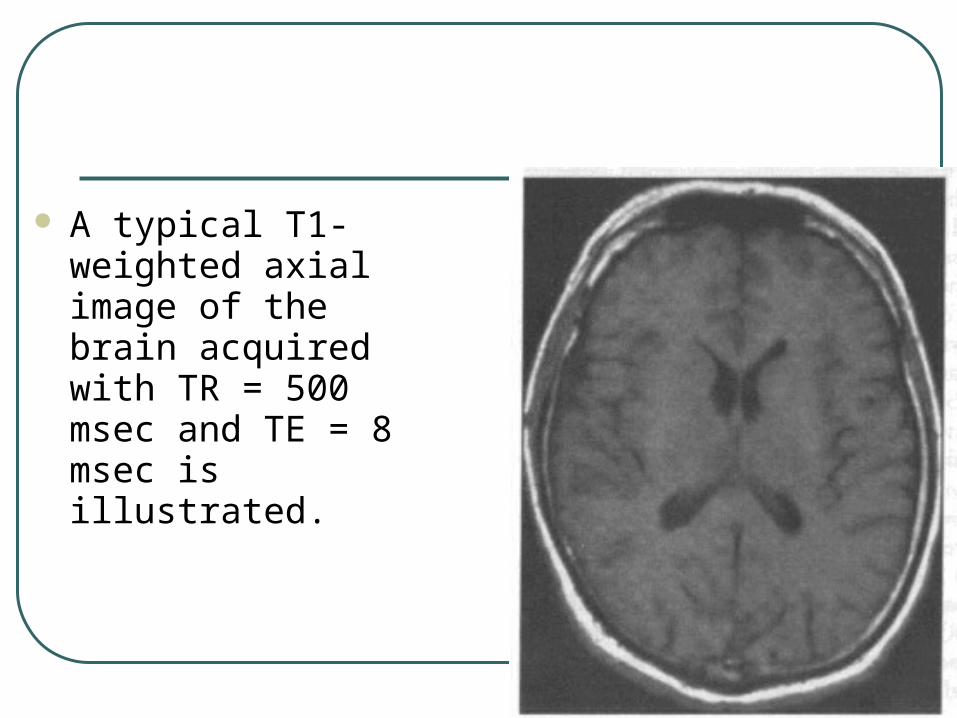
A typical T1-weighted axial image of the brain acquired with TR = 500 msec and TE = 8 msec is illustrated.
Fat is the most intense signal (shortest T1); • White matter and gray matter have
intermediate intensities; and
• CSF has the lowest intensity (longest T1).
A typical spin echo T1-weighted image is acquired with a TR of about 400 to 600 msec and a TE of 5 to 20 msec.
Spin (Proton) Density Weighting
Image contrast with spin density weighting relies mainly on differences in the number of magnetizable protons per volume of tissue. • At thermal equilibrium, those tissues with a
greater spin density exhibit a larger longitudinal magnetization.
Very hydrogenous tissues such as lipids and fats have a high spin density compared with proteinaceous soft tissues; aqueous tissues such as CSF also have a relatively high spin density.
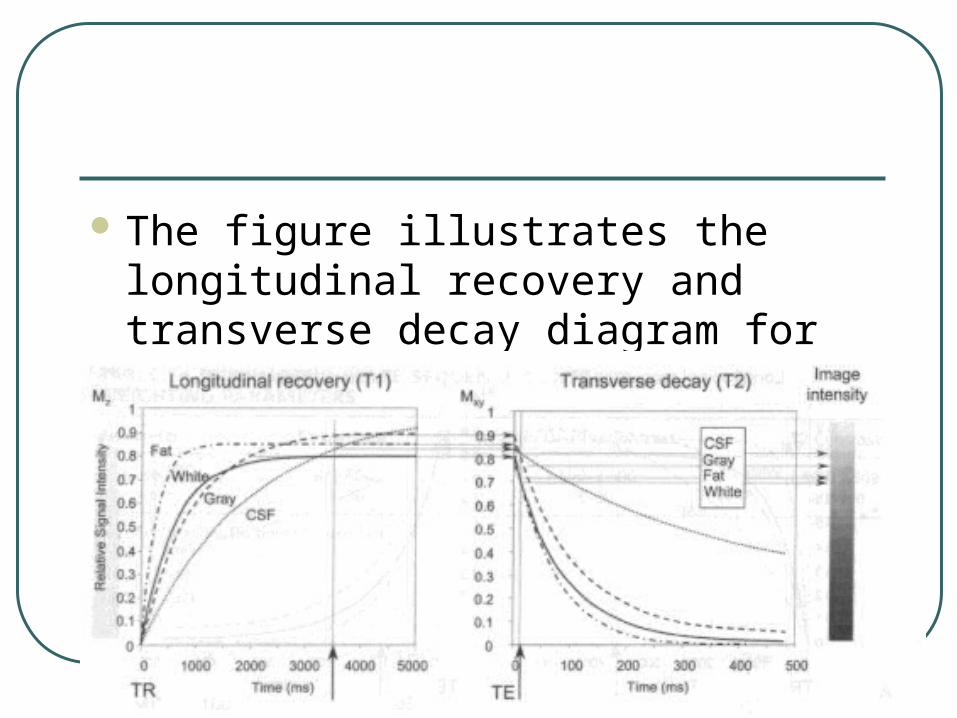
The figure illustrates the longitudinal recovery and transverse decay diagram for spin density weighting.
To minimize the T1 differences of the tissues, a relatively long TR is used. • This allows significant longitudinal recovery so
that the transverse magnetization differences are chiefly those resulting from variations in spin density (CSF > fat > gray matter > white matter).
Signal amplitude differences in the FID are preserved with a short TE, so the influences of T2 differences are minimized. • Spin density-weighted images therefore
require a long TR and a short TE for the spin echo pulse sequence.
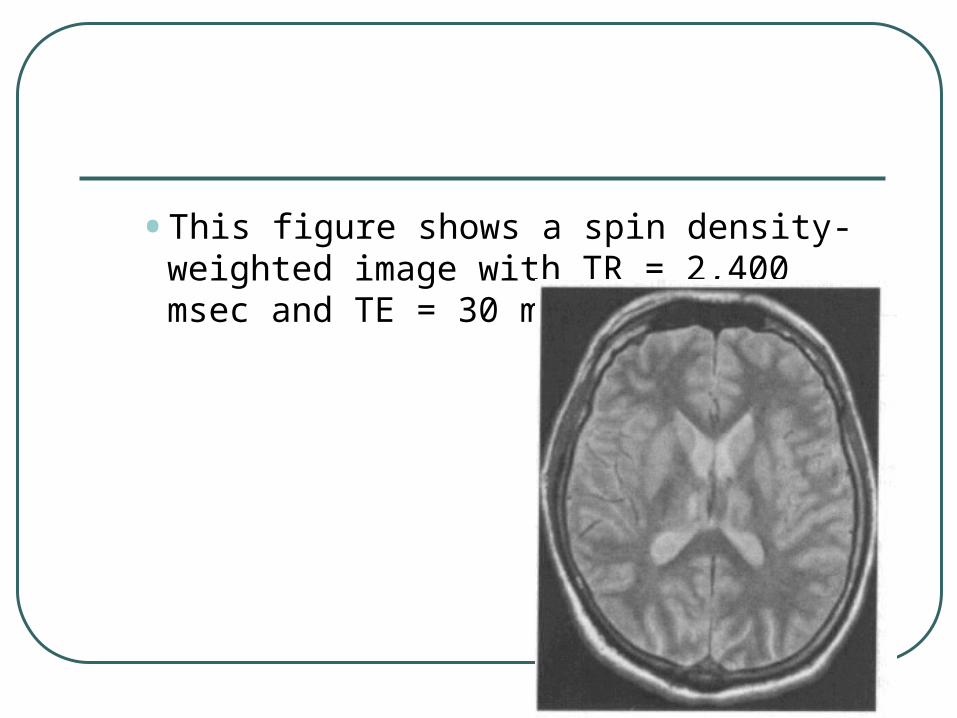
• This figure shows a spin density-weighted image with TR = 2,400 msec and TE = 30 msec.
Fat and CSF display as a relatively bright signal, and a slight contrast inversion between white and gray matter occurs. • A typical spin density-weighted image has a
TR between 2,000 and 3,500 msec and a TE between 8 and 30 msec.
This sequence achieves the highest overall signal and the highest signal-to-noise ratio (SNR) for spin echo imaging; however, the image contrast is relatively poor, and therefore the contrast-to-noise ratio is not necessarily higher than with a T1- or T2-weighted image.
T2 Weighting
T2 weighting follows directly from the spin density weighting sequence: • Reduce T1 effects with a long TR, and
accentuate T2 differences with a longer TE.
The T2-weighted signal is usually the second echo (produced by a second 180-degree pulse) of a long-TR spin echo pulse sequence (the first echo is spin density weighted).
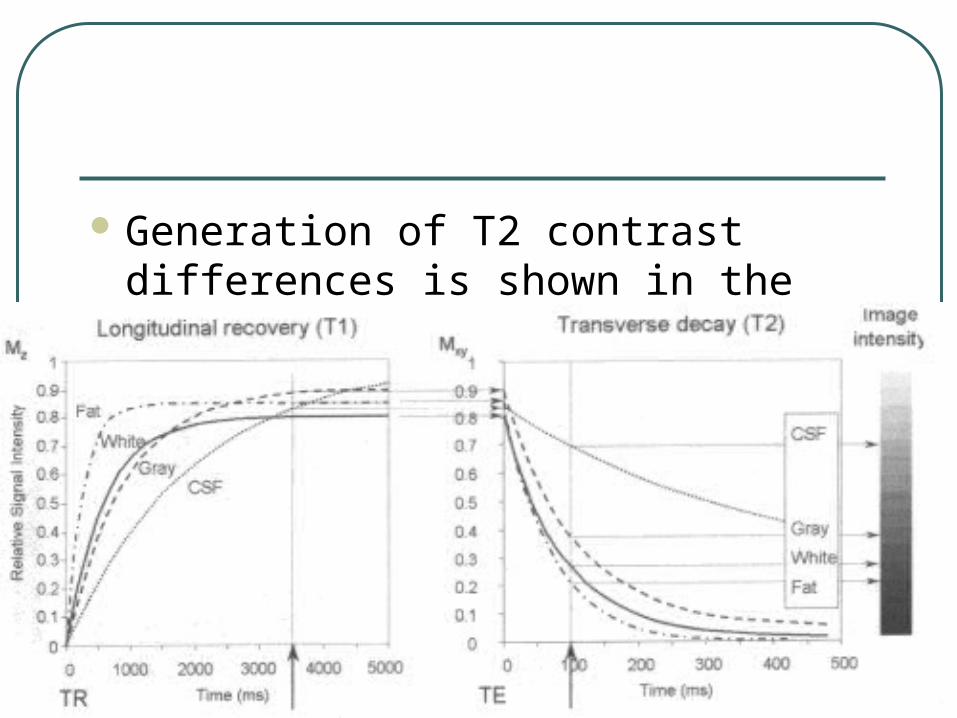
Generation of T2 contrast differences is shown in the figure.

Compared with a T1-weighted image, inversion of tissue contrast occurs (CSF is brighter than fat instead of darker), because short-T1 tissues usually have a short T2, and long-T1 tissues have a long T2. • Tissues with a long T2 (e.g., CSF) maintain transverse
magnetization longer than short-T2 tissues, and thus result in higher signal intensity.
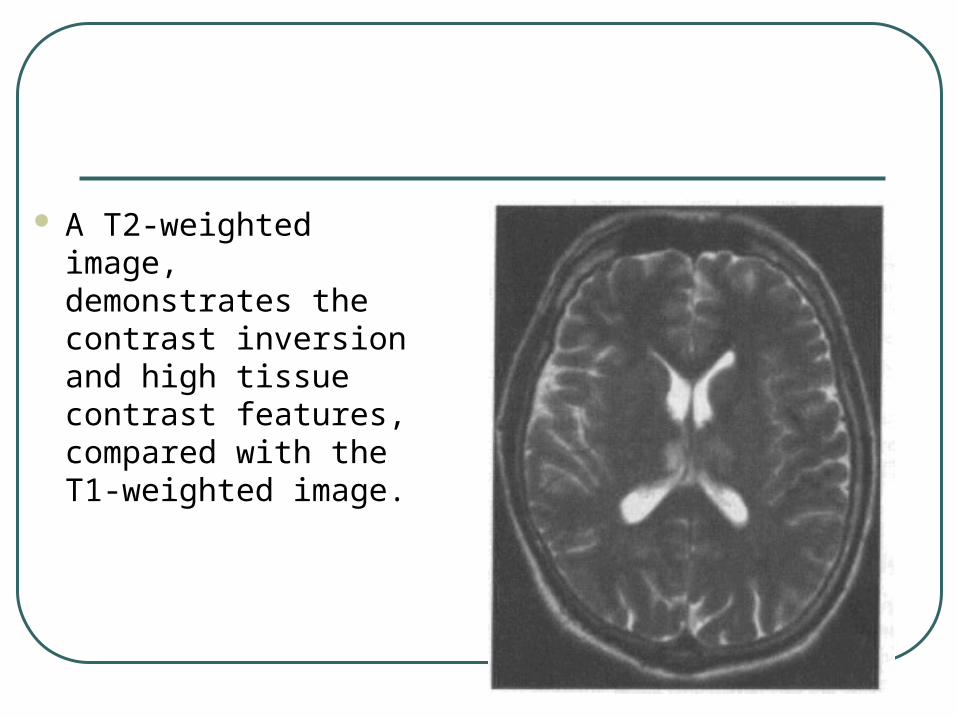
A T2-weighted image, demonstrates the contrast inversion and high tissue contrast features, compared with the T1-weighted image.
As TE is increased, moreT2 contrast is achieved, at the expense of a reduced transverse magnetization signal. • Even with low signal, window width and
window level adjustments remap the signals over the full range of the display, so that the overall perceived intensity is similar for all images.
The typical T2-weighted sequence uses a TR of approximately 2,000 to 4,000 msec and a TE of 80 to 120 msec.

Spin Echo Parameters
For conventional spin echo sequences, both a spin density and a T2-weighted contrast signal are acquired during each TR by acquiring two echoes with a short TE and a long TE.