Embed Size (px)
Citation preview
Central London office market reportTentative improvement in leasing volumes
Q1 2021
UK Research
2 | JLL research Central London office market report | Q1 2021 | 3
04 08Central London overview
14West End overview
24Rental conditions in Central London
Key transactions
18City overview
12Issue to watch
22East London overview
Table of contents
4 | JLL research Central London office market report | Q1 2021 | 5
01Central London overview
Leasing activity improves quarter on quarterDespite a strict national Covid lockdown, leasing volumes increased quarter on quarter with 1.3 million sq ft let, which ended five consecutive quarterly declines. While still not back at pre-Covid levels, Q1 was the strongest period since the pandemic took hold and volumes were 69% up in comparison to Q4 but still a third below Q1 2019.
Second-hand space fuels supply increaseSupply levels continued to increase during the quarter, with both new and second-hand space rising. As a result, there was 19.2 million sq ft of space available at the end of Q1, which was the highest volume of supply since Q4 2009. The vacancy rate rose to 7.8%, which was up 100bp quarter on quarter and at levels not seen since the Global Financial Crisis.
Take-upCentral London
Q1 Q2 Q3 Q4
Under o�er Average 2011-2020
0.0
2.0
4.0
6.0
8.0
10.0
12.0
14.0
2017 2018 2019 2020 2021
Mill
ion
sq �
SupplyCentral London
0.0
5.0
10.0
15.0
20.0
25.0
Q1 Q3 Q1 Q3 Q1 Q3 Q1 Q3 Q1 Q3 Q1
2016 2017 2018 2019 2020 2021
Mill
ion
sq �
New Second-hand
There was an increase in activity from all sectors, bar public & administration, over the quarter. The banking & finance and professional services sectors were most active, and these two sectors accounted for over half of the space leased in Q1. Professional services accounted for 373,000 sq ft of transactions. This included the largest deal of the quarter which was to Latham & Watkins, who signed a 200,000 sq ft pre-let at Leadenhall Court, EC3. Banking & finance leasing stood at 338,000 sq ft during the quarter, which was higher than any quarter in 2020.
Space under offer declined over the quarter, falling from 1.6 million sq ft to 1.5 million sq ft, which was the lowest level since Q4 2016. The drop was in part due to higher leasing combined with limited replacement transactions coming forward. The decrease was most evident in the volume of second-hand space under offer, with both new and pre-let space remaining stable. Active demand, on the other hand, rose to 7.6 million sq ft, with more enquiries evident from banking & finance and TMT companies in the first three months of the year compared to the final quarter of 2020.
The second-hand vacancy rate continued to increase at pace, rising to 6.4%, although the new vacancy rate also increased for the second consecutive quarter to 1.3% and was ahead of the 10-year average of 1.1%.
Increases in vacancy were evident across all key markets. The City and West End vacancy rates both ended the quarter at 7.3%, while the East London vacancy rate rose to 11.7%. The 130bp increase in City vacancy was primarily fuelled by an increase in second-hand space, with the new vacancy rate stable quarter on quarter. The West End also saw a sharp rise in second-hand vacancy, but the new vacancy rate also increased, as Scale Space, W12 (56,000 sq ft) completed during the quarter.
Speculative space under construction increased during the quarter, rising from just under 8 million sq ft to 8.5 million sq ft. New starts were evident in both the City and West End, with 263,000 sq ft and 335,000 sq ft starting on site respectively. This quarter saw seven schemes commence, with new builds dominating and expected floorspace accounting for 66% of new starts. Landsec’s 166,000 sq ft Nova East, SW1 was the largest scheme to commence and is expected to complete in mid-2023. Just over 3.2 million sq ft is currently anticipated to complete speculatively in 2021, with 2.5 million sq ft due to complete the year after.

6 | JLL research Central London office market report | Q1 2021 | 7 The logistics sector in Asia Pacific – The road ahead | 6
Investment market stalls The momentum in investment activity seen in the final three months of 2020 was not carried over into 2021. Investment volumes reached £1.2 billion during the quarter which was 68% below the 10-year quarterly average of £3.7 billion and half the levels seen in the same period in 2020. This fall back was primarily due to a lack of stock being marketed as the structured lifting of lockdown measures pushed new launches back.
Activity from overseas investors was muted this quarter with just £827 million transacted, accounting for 71% of volumes. The largest deal was the purchase of 66 Shoe Lane, EC4 acquired by Wing Tai for £255 million at a net initial yield of 4.15%.
There is an estimated £3.0 billion currently under offer and a further £6.3 billion of assets potentially available. Activity is anticipated to pick up during the latter half of the year, with stock levels due to increase in line with the return to the office and opening up of borders.
Investment volumesCentral London
Overseas UK 10-year average
0.0
2.0
4.0
6.0
8.0
10.0
12.0
14.0
16.0
18.0
20.0
2011
2012
2013
2014
2015
2016
2017
2018
2019
2020
Q1
2021
£ bi
llion
Central London office market report | Q1 2021 | 7
8 | JLL research Central London office market report | Q1 2021 | 9
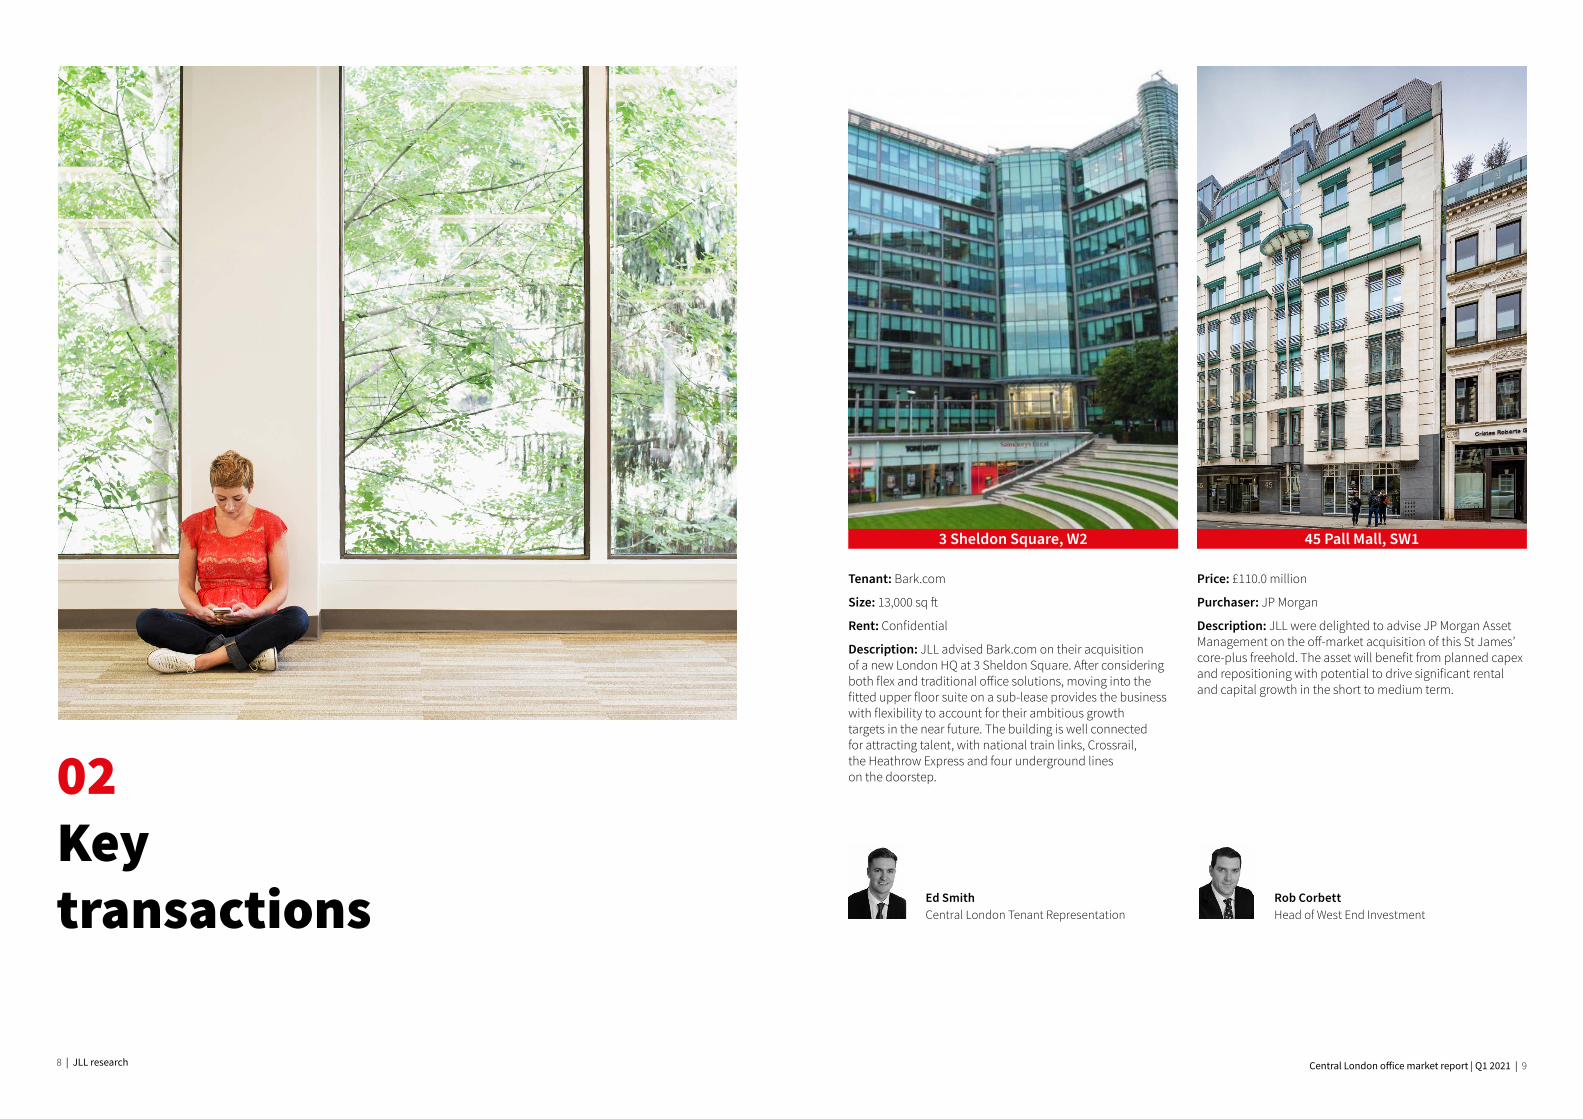
Tenant: Bark.com
Size: 13,000 sq ft
Rent: Confidential
Description: JLL advised Bark.com on their acquisition of a new London HQ at 3 Sheldon Square. After considering both flex and traditional office solutions, moving into the fitted upper floor suite on a sub-lease provides the business with flexibility to account for their ambitious growth targets in the near future. The building is well connected for attracting talent, with national train links, Crossrail, the Heathrow Express and four underground lines on the doorstep.
Price: £110.0 million
Purchaser: JP Morgan
Description: JLL were delighted to advise JP Morgan Asset Management on the off-market acquisition of this St James’ core-plus freehold. The asset will benefit from planned capex and repositioning with potential to drive significant rental and capital growth in the short to medium term.
3 Sheldon Square, W2 45 Pall Mall, SW1
02Keytransactions Ed Smith
Central London Tenant RepresentationRob CorbettHead of West End Investment
10 | JLL research Central London office market report | Q1 2021 | 11
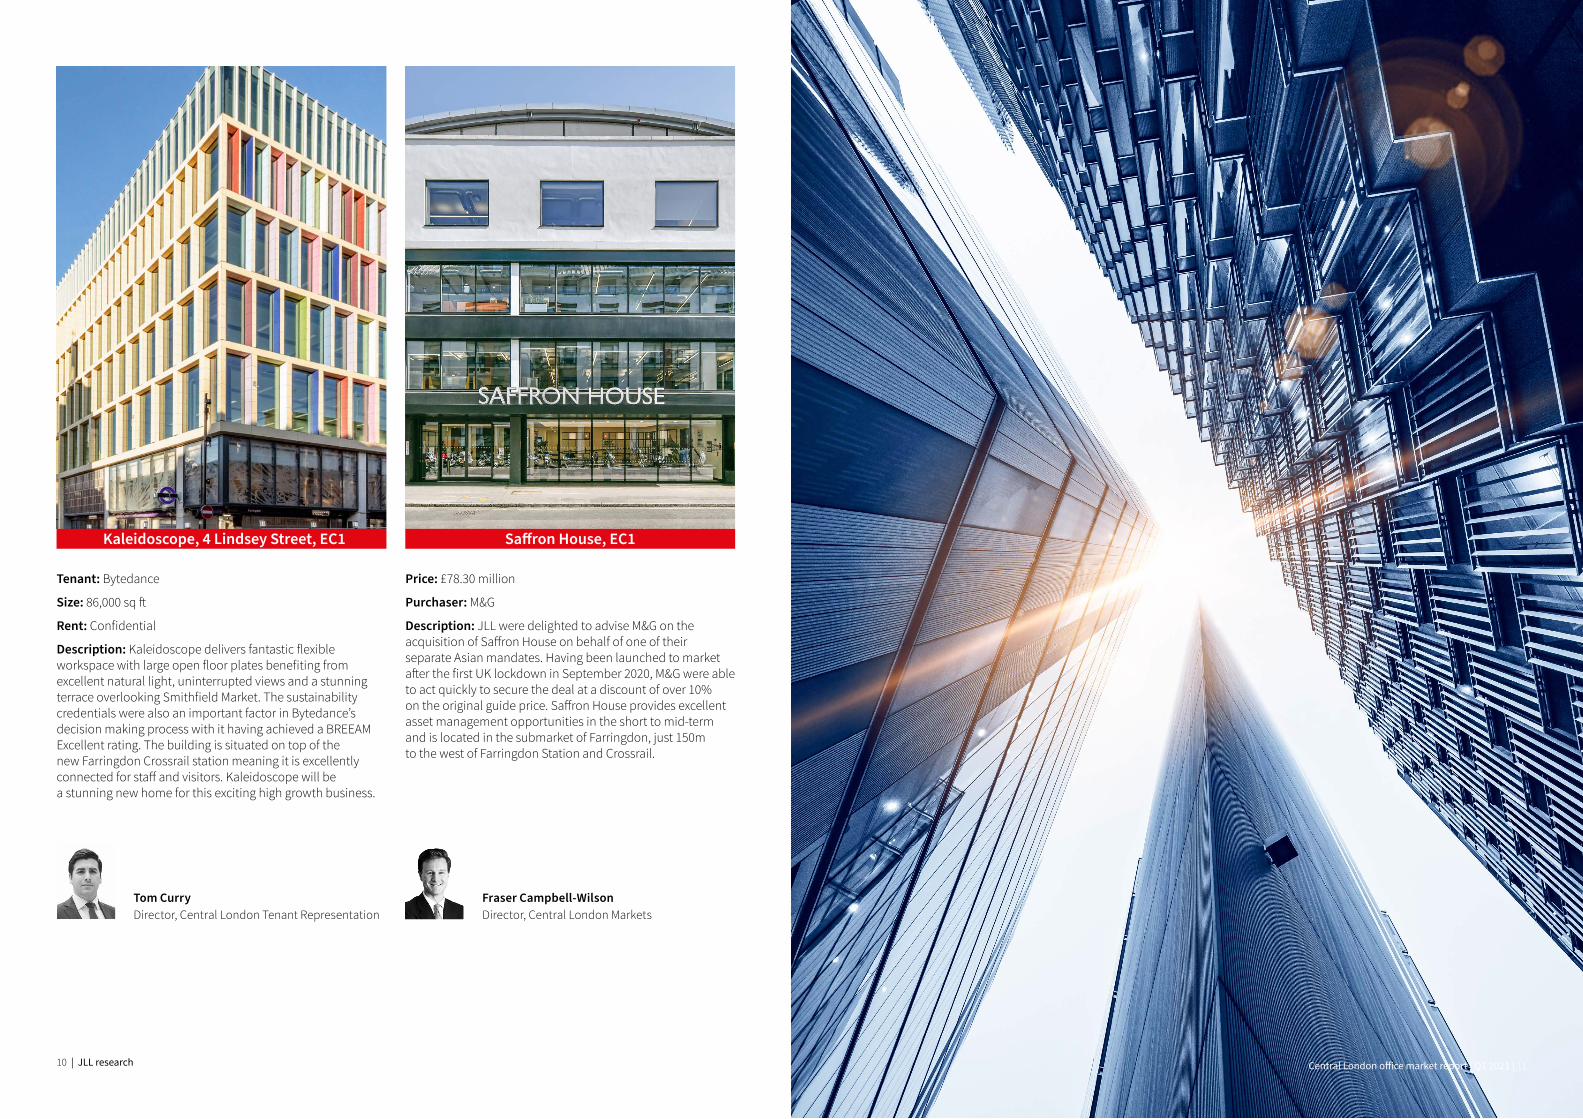
Tenant: Bytedance
Size: 86,000 sq ft
Rent: Confidential
Description: Kaleidoscope delivers fantastic flexible workspace with large open floor plates benefiting from excellent natural light, uninterrupted views and a stunning terrace overlooking Smithfield Market. The sustainability credentials were also an important factor in Bytedance’s decision making process with it having achieved a BREEAM Excellent rating. The building is situated on top of the new Farringdon Crossrail station meaning it is excellently connected for staff and visitors. Kaleidoscope will be a stunning new home for this exciting high growth business.
Price: £78.30 million
Purchaser: M&G
Description: JLL were delighted to advise M&G on the acquisition of Saffron House on behalf of one of their separate Asian mandates. Having been launched to market after the first UK lockdown in September 2020, M&G were able to act quickly to secure the deal at a discount of over 10% on the original guide price. Saffron House provides excellent asset management opportunities in the short to mid-term and is located in the submarket of Farringdon, just 150m to the west of Farringdon Station and Crossrail.
Kaleidoscope, 4 Lindsey Street, EC1 Saffron House, EC1
Central London office market report | Q1 2021 | 11
Tom CurryDirector, Central London Tenant Representation
Fraser Campbell-WilsonDirector, Central London Markets
12 | JLL research Central London office market report | Q1 2021 | 13
03 Issue to watch
We have witnessed an unprecedented global crisis that is likely to drive a fundamental change in how we live and work. Times are therefore uncertain for property owners and occupiers, with some office-based companies pondering the long-term viability of mass home-working, and developers of mixed-use buildings considering what the ‘healthy place of the future’ needs to look like. However, this rapidly emerging new world also presents significant opportunity.
As companies are directed to prioritise their most valuable asset – their people – their reflections will lead to far better recognition of what employees as human beings need to be fulfilled and productive. Those that address this now will reap the benefits of not only creating great places, but also delivering the best return financially.
Health & Wellbeing - Creating places people want to be
Our new health and wellbeing report is designed to get our clients thinking about how to deliver healthy and safe places to work and live, understand the human impact of their real estate, and future-proof their buildings with smart use of technology.
When it comes to developing the place of the future, the report looks at what needs to be provided to meet the emerging needs of the people who will live, work and play in them. Good is simply not good enough any more, so how do we measure success?
Great places of the future will need to fundamentally address the indicators of health and wellbeing (summarised in the table above) at increasing levels of expectation and best practice.
In response to this challenge, JLL has developed health and wellbeing expertise by researching, developing benchmarking reports and including health and wellbeing as part of our advice to clients.
JLL’s new health and wellbeing report illuminates three key learnings: The next normal (2021 – 2025)
Developers and planners will need to put wellbeing and resilience firmly front of mind in placemaking designs, in order to attract occupiers and visitors. Changes will include:• Greater use of technology• Higher levels of flexible working• More savvy occupiers – recognising the role
of buildings on health
1
Active living • Cycle parking • Minimal car parking• Car club spaces• Green spaces• In-house gym facilities
• Convenient indoor cycle storage
• No car parking• On site bike shop• Outdoor gyms• Attractive public leisure centres• Dedicated cycle routes
• Active design principles incorporated into all buildings
• Car-sharing rental services• Site logistics operation• Community designed parks• Dedicated cycle and pedestrian routes
integrated into surrounding area
Community • Creation of residents/tenants associations
• Provision of community space
• Provision of community activities through NPO partnerships
• Support of arts events• Support of skills/education
programmes
• Community platform enabling an ecology of selfstarting groups
• Collaboration with educational institutions, financiers to support entrepreneurs
• Co-location of different age groups• Seniors housing linked with learning• Co-housing
Nature • Enhanced biodiversity • Tree planting• Green spaces• Green roofs
• Green walls• Intensive internal planting• Biodiversity action plans• Rooftop allotments• Community gardens
• Infrastructure integrating amenity, water treatment, and transportation
• Intensive external planting• Creation of natural forest-like views
from all areas of the development
Light • Above-average window sizes and floor to ceiling heights
• Public spaces sunlit throughout the day
• Building openings and orientation designed to maximise natural light and reduce internal lighting requirements
• Masterplan designed to maximise internal and external natural light and reduce lighting requirements
Measurement • BREEAM Excellent • SKA Gold• CSH 4
• PassivHaus Standard• WELL Building Standard• Socio-economic studies• Healthy building studies
• Living Building Challenge• One Planet Living• Cradle to Cradle• Partnerships with academic/medical
institutions to measure impact
Good practice
Best practice
World-leading practice
Predicted CRE trends are already starting to happen3
Wellbeing
Distributed working
‘Hub & Spoke’ office strategy
Agile/Flexible working
Office redesign
Technology investment
Corporate social responsibility
Lease terms
Centralisation of business processes
Densification of use/desk sharing
Co-working spaces
Re-think use of large spaces
Company bureaucracy
Incr
ease
Decrease
The acceleration of ‘green health’ and the appreciation of our environment being a key indicator of mental health and happiness has driven a real imperative to ensure we have a softer, kinder recovery to a new normal. We have to put people at the heart of our new places, their health and wellbeing will be a fundamental part of the choice of where they live and visit as well as where they work (and who for). Those who address this now will reap the benefits of not only creating great places but also delivering the best return financially.
Katie KopecLead Director - Strategic Development Consulting, JLL
”
“
12 | JLL research Central London office market report | Q1 2021 | 13
Industry standards emerging
Quality offices will need to demonstrate quality of space, including air quality, lighting, acoustics, biophilic design, activity levels and even social programmes.
Owners of real estate will need to demonstrate that their asset is safe, healthy and supports wellbeing in order to drive value
Air pollutionSmall increase in long-term exposure to particulate air pollution leads to significant increase in COVID-19 death rate.
Ventilation rateHigher ventilation rates = lower disease spread.
Humidity Humidity rate of 40-60% = lower infectivity of aerosolised viruses.
2
14 | JLL research Central London office market report | Q1 2021 | 15
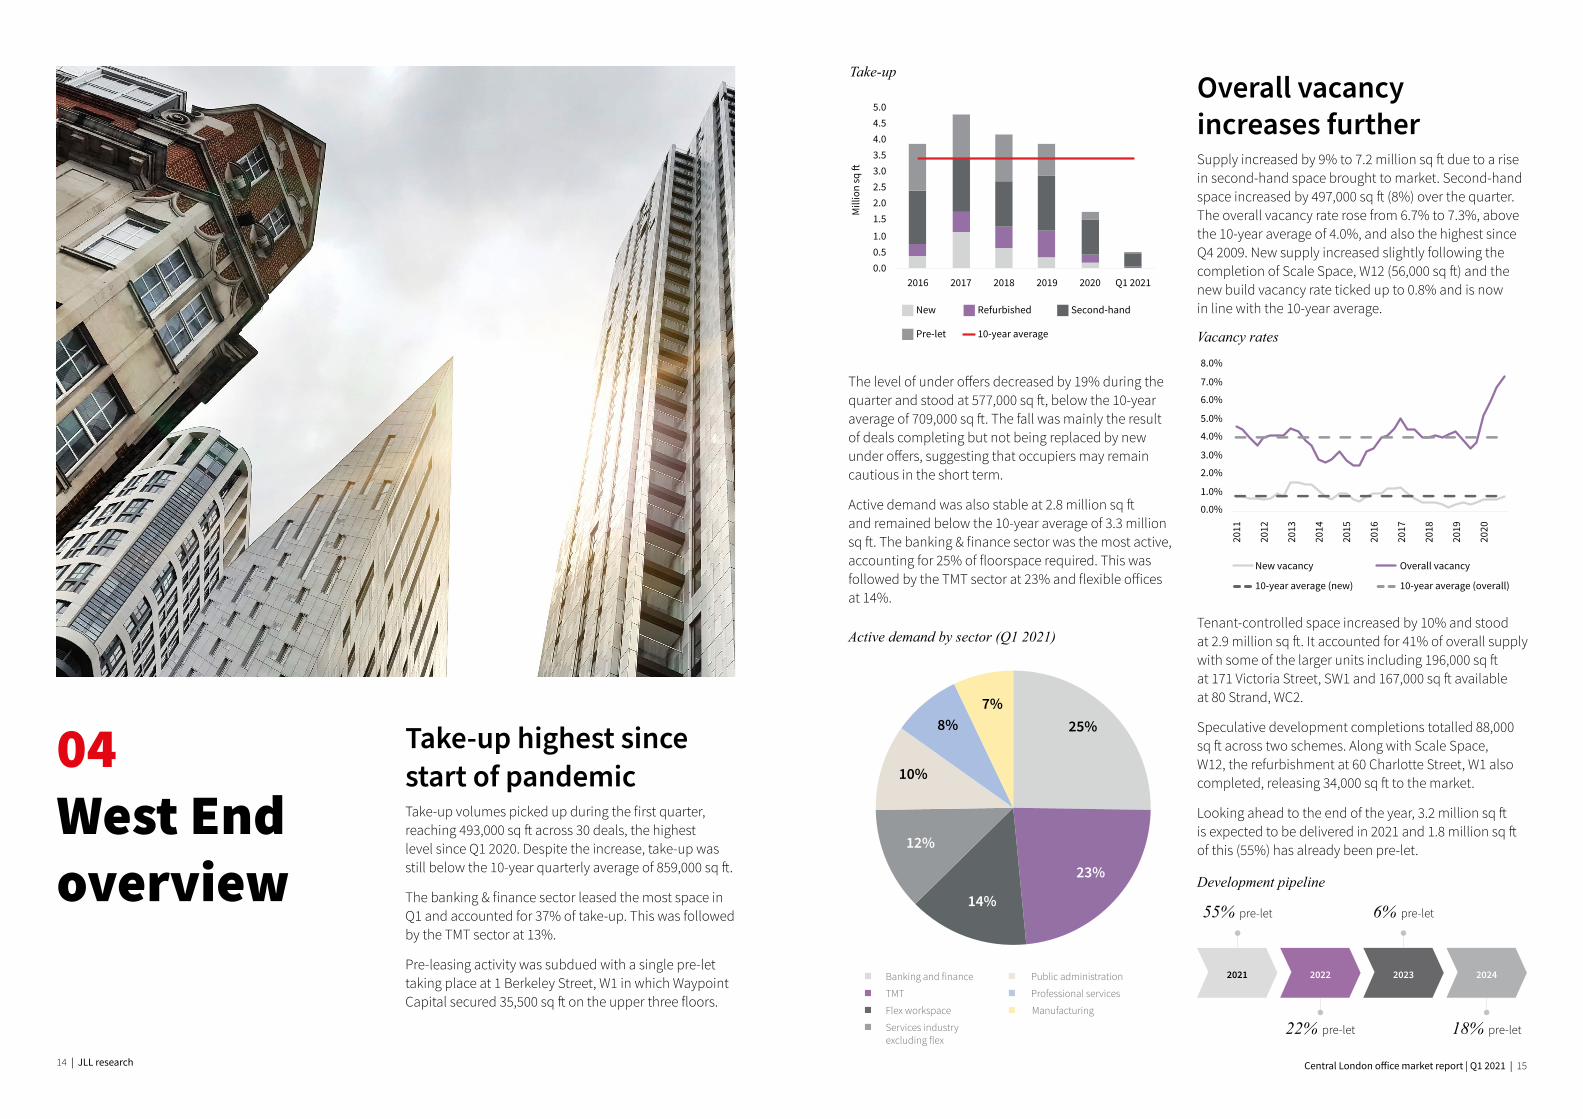
04West End overview
Take-up highest since start of pandemicTake-up volumes picked up during the first quarter, reaching 493,000 sq ft across 30 deals, the highest level since Q1 2020. Despite the increase, take-up was still below the 10-year quarterly average of 859,000 sq ft.
The banking & finance sector leased the most space in Q1 and accounted for 37% of take-up. This was followed by the TMT sector at 13%.
Pre-leasing activity was subdued with a single pre-let taking place at 1 Berkeley Street, W1 in which Waypoint Capital secured 35,500 sq ft on the upper three floors.
Overall vacancy increases furtherSupply increased by 9% to 7.2 million sq ft due to a rise in second-hand space brought to market. Second-hand space increased by 497,000 sq ft (8%) over the quarter. The overall vacancy rate rose from 6.7% to 7.3%, above the 10-year average of 4.0%, and also the highest since Q4 2009. New supply increased slightly following the completion of Scale Space, W12 (56,000 sq ft) and the new build vacancy rate ticked up to 0.8% and is now in line with the 10-year average.
The level of under offers decreased by 19% during the quarter and stood at 577,000 sq ft, below the 10-year average of 709,000 sq ft. The fall was mainly the result of deals completing but not being replaced by new under offers, suggesting that occupiers may remain cautious in the short term.
Active demand was also stable at 2.8 million sq ft and remained below the 10-year average of 3.3 million sq ft. The banking & finance sector was the most active, accounting for 25% of floorspace required. This was followed by the TMT sector at 23% and flexible offices at 14%.
Tenant-controlled space increased by 10% and stood at 2.9 million sq ft. It accounted for 41% of overall supply with some of the larger units including 196,000 sq ft at 171 Victoria Street, SW1 and 167,000 sq ft available at 80 Strand, WC2.
Speculative development completions totalled 88,000 sq ft across two schemes. Along with Scale Space, W12, the refurbishment at 60 Charlotte Street, W1 also completed, releasing 34,000 sq ft to the market.
Looking ahead to the end of the year, 3.2 million sq ft is expected to be delivered in 2021 and 1.8 million sq ft of this (55%) has already been pre-let.
Take-up
Active demand by sector (Q1 2021)
Vacancy rates
Development pipeline
2021 2022 2023
22% pre-let
6% pre-let
18% pre-let
55% pre-let
0.00.51.0
1.52.02.53.03.54.04.55.0
2016 2017 2018 2019 2020 Q1 2021
Mill
ion
sq �
New Refurbished Second-hand
Pre-let 10-year average
0.0%
1.0%
2.0%
3.0%
4.0%
5.0%
6.0%
7.0%
8.0%
2011
2012
2013
2014
2015
2016
2017
2018
2019
2020
New vacancy Overall vacancy
10-year average (new) 10-year average (overall)
2024
Flex workspace
Banking and finance
TMT
Services industry excluding flex
Public administration
Professional services
Manufacturing
25%
23%
14%
12%
10%
8%7%
16 | JLL research Central London office market report | Q1 2021 | 17
The largest deal of the quarter involved the sale of 45 Pall Mall, SW1 which was bought by JP Morgan for £110 million reflecting a net initial yield of 4.55% and capital value of £1,851 per sq ft.
Prime rents unchangedPrime rents and rent-free periods in the Core were unchanged at £115.00 per sq ft and 24 months respectively for this quarter (assuming a 10,000 sq ft floor plate and a 10-year term). Prime rents were also unchanged in all other West End submarkets.
Investment volumes fall in Q1Investment volumes reached £541 million across twelve transactions in Q1, below the 10-year quarterly average of £1.4 billion.
Investment volumes
£1.2 billion Q1 2020
£1.1 billion10-year
Q1 average
£0.7 billion Q1 2019
£0.5 billion Q1 2021
Investors from the USA accounted for the largest share of investment volumes during the quarter at 36% across three deals. This was followed by UK-based investors with a share of 20%, also across three transactions.
Property companies were most active in Q1 and had a 39% share of total investment volumes.
Prime yields remained unchanged at 3.50% for lot sizes below £40 million. Yields for lot sizes between £40 million and £125 million were unchanged at 3.75% but trending stronger. Prime yields were 3.75% for lot sizes above £125 million.
Investment volumes by purchaser nationality (Q1 2021)
Investment volumesby purchaser
nationality
UK
USA
20%
36%
China
4%
Hong Kong
12%
7%Other
Czech Republic
10%
Germany
10%
Central London office market report | Q1 2021 | 17
18 | JLL research Central London office market report | Q1 2021 | 19
Cities
0.0%
1.0%
2.0%
3.0%
4.0%
5.0%
6.0%
7.0%
8.0%
9.0%
2011
2012
2013
2014
2015
2016
2017
2018
2019
2020
2021
City overall City - new
Overall 10-year average New 10-year average05City overview
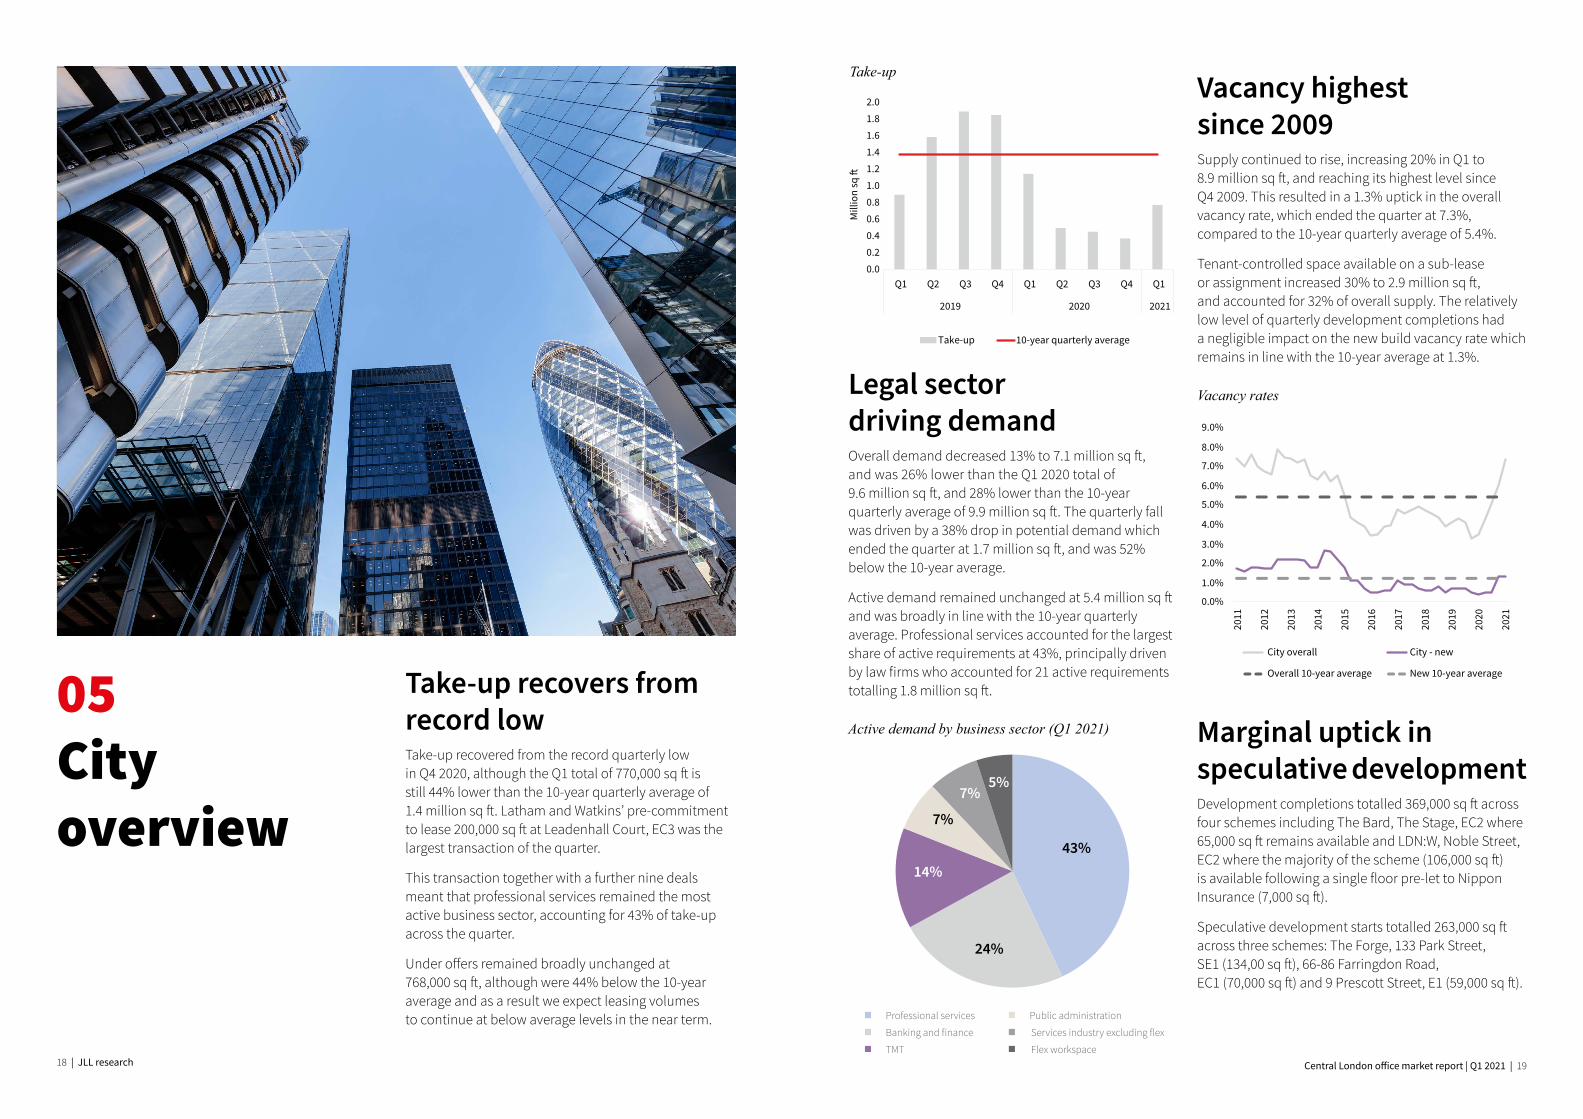
Take-up recovers from record lowTake-up recovered from the record quarterly low in Q4 2020, although the Q1 total of 770,000 sq ft is still 44% lower than the 10-year quarterly average of 1.4 million sq ft. Latham and Watkins’ pre-commitment to lease 200,000 sq ft at Leadenhall Court, EC3 was the largest transaction of the quarter.
This transaction together with a further nine deals meant that professional services remained the most active business sector, accounting for 43% of take-up across the quarter.
Under offers remained broadly unchanged at 768,000 sq ft, although were 44% below the 10-year average and as a result we expect leasing volumes to continue at below average levels in the near term.
Legal sector driving demand Overall demand decreased 13% to 7.1 million sq ft, and was 26% lower than the Q1 2020 total of 9.6 million sq ft, and 28% lower than the 10-year quarterly average of 9.9 million sq ft. The quarterly fall was driven by a 38% drop in potential demand which ended the quarter at 1.7 million sq ft, and was 52% below the 10-year average.
Active demand remained unchanged at 5.4 million sq ft and was broadly in line with the 10-year quarterly average. Professional services accounted for the largest share of active requirements at 43%, principally driven by law firms who accounted for 21 active requirements totalling 1.8 million sq ft.
Vacancy highest since 2009 Supply continued to rise, increasing 20% in Q1 to 8.9 million sq ft, and reaching its highest level since Q4 2009. This resulted in a 1.3% uptick in the overall vacancy rate, which ended the quarter at 7.3%, compared to the 10-year quarterly average of 5.4%.
Tenant-controlled space available on a sub-lease or assignment increased 30% to 2.9 million sq ft, and accounted for 32% of overall supply. The relatively low level of quarterly development completions had a negligible impact on the new build vacancy rate which remains in line with the 10-year average at 1.3%.
Take-up
Active demand by business sector (Q1 2021)
Vacancy rates
Cities
0.00.20.40.60.81.01.21.41.61.82.0
Q1 Q2 Q3 Q4 Q1 Q2 Q3 Q4 Q1
2019 2020 2021
Mill
ion
sq
Take-up 10-year quarterly average
Marginal uptick in speculative development Development completions totalled 369,000 sq ft across four schemes including The Bard, The Stage, EC2 where 65,000 sq ft remains available and LDN:W, Noble Street, EC2 where the majority of the scheme (106,000 sq ft) is available following a single floor pre-let to Nippon Insurance (7,000 sq ft).
Speculative development starts totalled 263,000 sq ft across three schemes: The Forge, 133 Park Street, SE1 (134,00 sq ft), 66-86 Farringdon Road, EC1 (70,000 sq ft) and 9 Prescott Street, E1 (59,000 sq ft).
TMT
Professional services
Banking and finance
Public administration
Services industry excluding flex
Flex workspace
43%
24%
14%
7%
7%5%
20 | JLL research Central London office market report | Q1 2021 | 21
29% Private
15% Institution
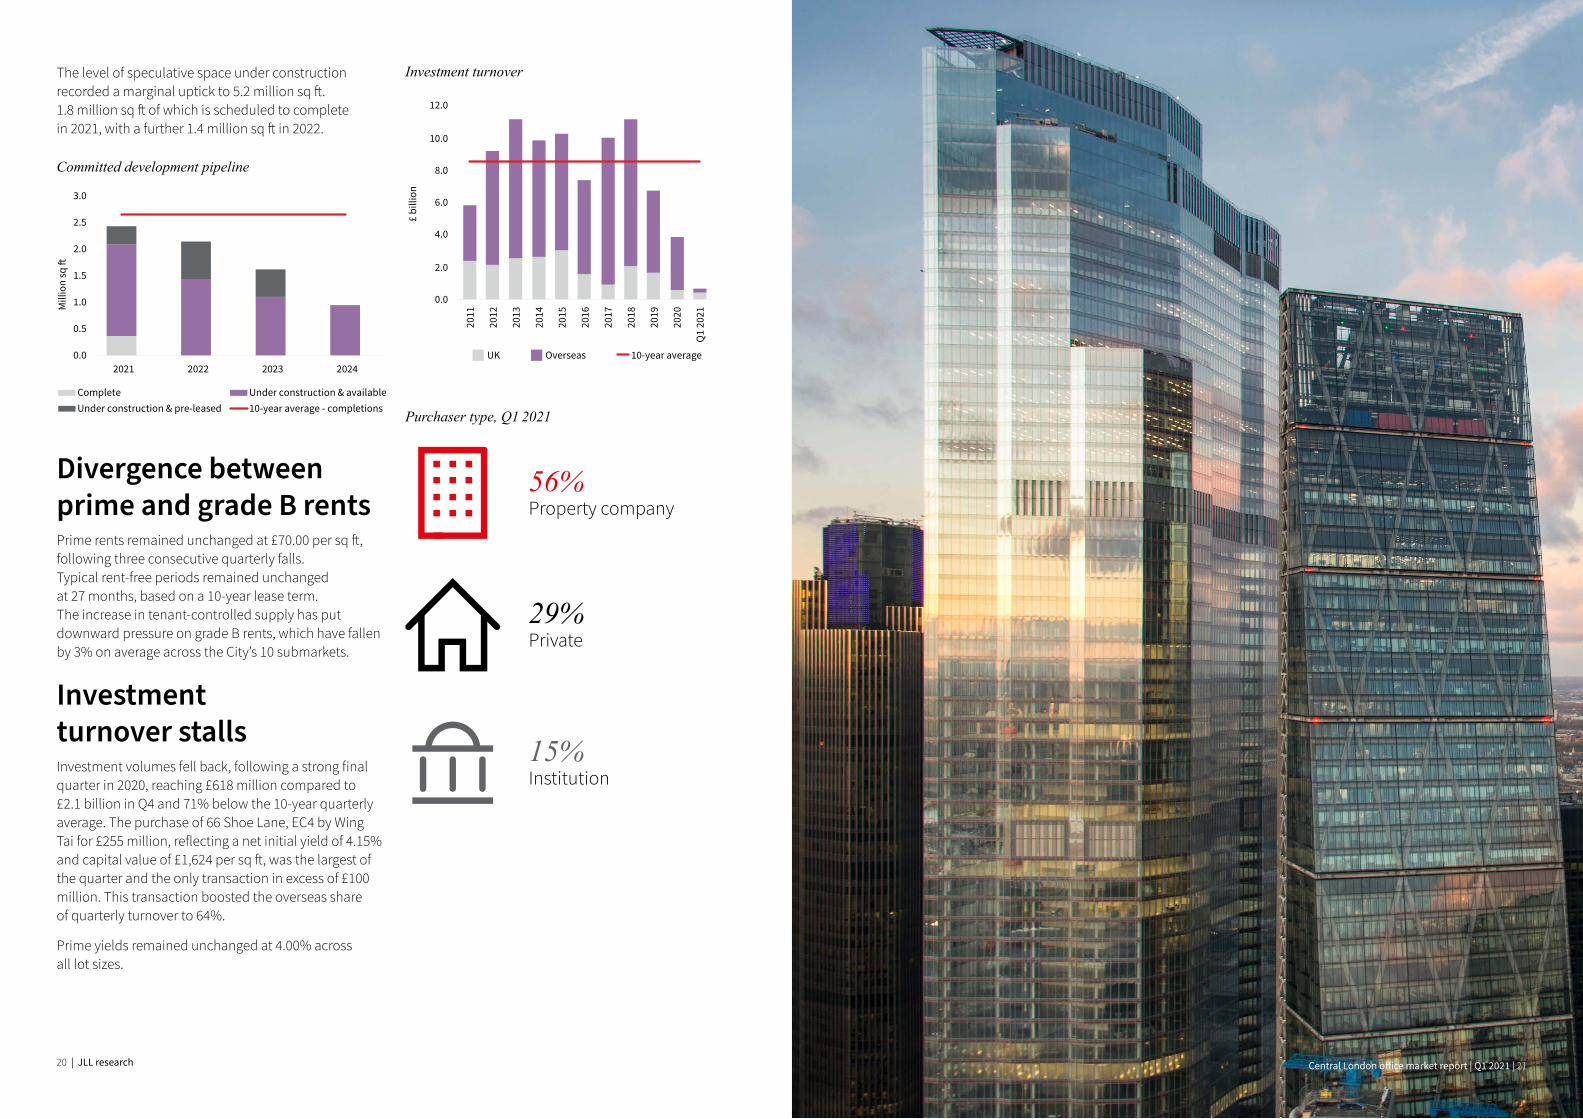
Divergence between prime and grade B rentsPrime rents remained unchanged at £70.00 per sq ft, following three consecutive quarterly falls. Typical rent-free periods remained unchanged at 27 months, based on a 10-year lease term. The increase in tenant-controlled supply has put downward pressure on grade B rents, which have fallen by 3% on average across the City’s 10 submarkets.
Investment turnover stalls Investment volumes fell back, following a strong final quarter in 2020, reaching £618 million compared to £2.1 billion in Q4 and 71% below the 10-year quarterly average. The purchase of 66 Shoe Lane, EC4 by Wing Tai for £255 million, reflecting a net initial yield of 4.15% and capital value of £1,624 per sq ft, was the largest of the quarter and the only transaction in excess of £100 million. This transaction boosted the overseas share of quarterly turnover to 64%.
Prime yields remained unchanged at 4.00% across all lot sizes.
Committed development pipeline
Investment turnover
0.0
2.0
4.0
6.0
8.0
10.0
12.0
2011
2012
2013
2014
2015
2016
2017
2018
2019
2020
Q1
2021
£ bi
llion
UK Overseas 10-year average
Cities
Purchaser type, Q1 2021
56% Property company
The level of speculative space under construction recorded a marginal uptick to 5.2 million sq ft. 1.8 million sq ft of which is scheduled to complete in 2021, with a further 1.4 million sq ft in 2022.
Central London office market report | Q1 2021 | 21
0.0
0.5
1.0
1.5
2.0
2.5
3.0
2021 2022 2023 2024
Mill
ion
sq �
Complete Under construction & availableUnder construction & pre-leased 10-year average - completions
22 | JLL research Central London office market report | Q1 2021 | 23
06East London overview
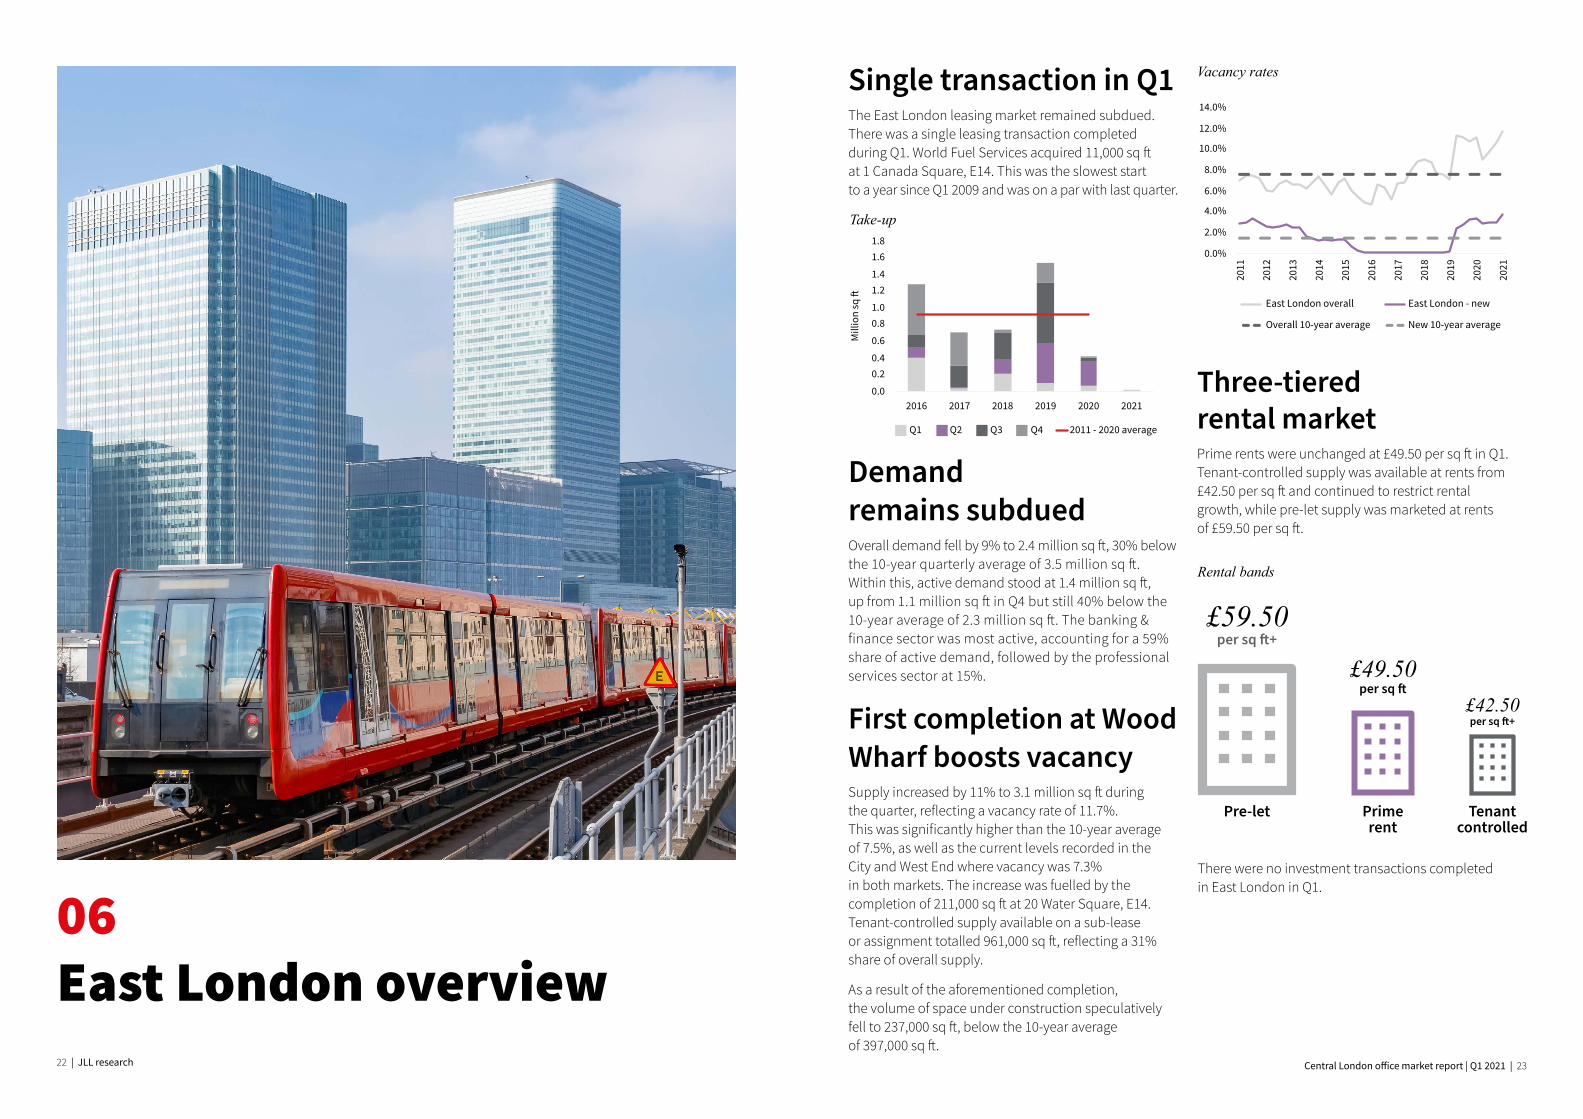
Single transaction in Q1The East London leasing market remained subdued. There was a single leasing transaction completed during Q1. World Fuel Services acquired 11,000 sq ft at 1 Canada Square, E14. This was the slowest start to a year since Q1 2009 and was on a par with last quarter.
Demand remains subdued Overall demand fell by 9% to 2.4 million sq ft, 30% below the 10-year quarterly average of 3.5 million sq ft. Within this, active demand stood at 1.4 million sq ft, up from 1.1 million sq ft in Q4 but still 40% below the 10-year average of 2.3 million sq ft. The banking & finance sector was most active, accounting for a 59% share of active demand, followed by the professional services sector at 15%.
First completion at Wood Wharf boosts vacancy Supply increased by 11% to 3.1 million sq ft during the quarter, reflecting a vacancy rate of 11.7%. This was significantly higher than the 10-year average of 7.5%, as well as the current levels recorded in the City and West End where vacancy was 7.3% in both markets. The increase was fuelled by the completion of 211,000 sq ft at 20 Water Square, E14. Tenant-controlled supply available on a sub-lease or assignment totalled 961,000 sq ft, reflecting a 31% share of overall supply.
As a result of the aforementioned completion, the volume of space under construction speculatively fell to 237,000 sq ft, below the 10-year average of 397,000 sq ft.
Three-tiered rental marketPrime rents were unchanged at £49.50 per sq ft in Q1. Tenant-controlled supply was available at rents from £42.50 per sq ft and continued to restrict rental growth, while pre-let supply was marketed at rents of £59.50 per sq ft.
Take-up
Vacancy rates
There were no investment transactions completed in East London in Q1.
Rental bands
0.0
0.20.4
0.6
0.81.0
1.21.4
1.61.8
2016 2017 2018 2019 2020 2021
Mill
ion
sq �
Q1 Q2 Q3 Q4 2011 - 2020 average
0.0%
2.0%
4.0%
6.0%
8.0%
10.0%
12.0%
14.0%
2011
2012
2013
2014
2015
2016
2017
2018
2019
2020
2021
East London overall East London - new
Overall 10-year average New 10-year average
Pre-let
£59.50per sq ft+
Primerent
£49.50per sq ft
Tenant controlled
£42.50per sq ft+
24 | JLL research Central London office market report | Q1 2021 | 25
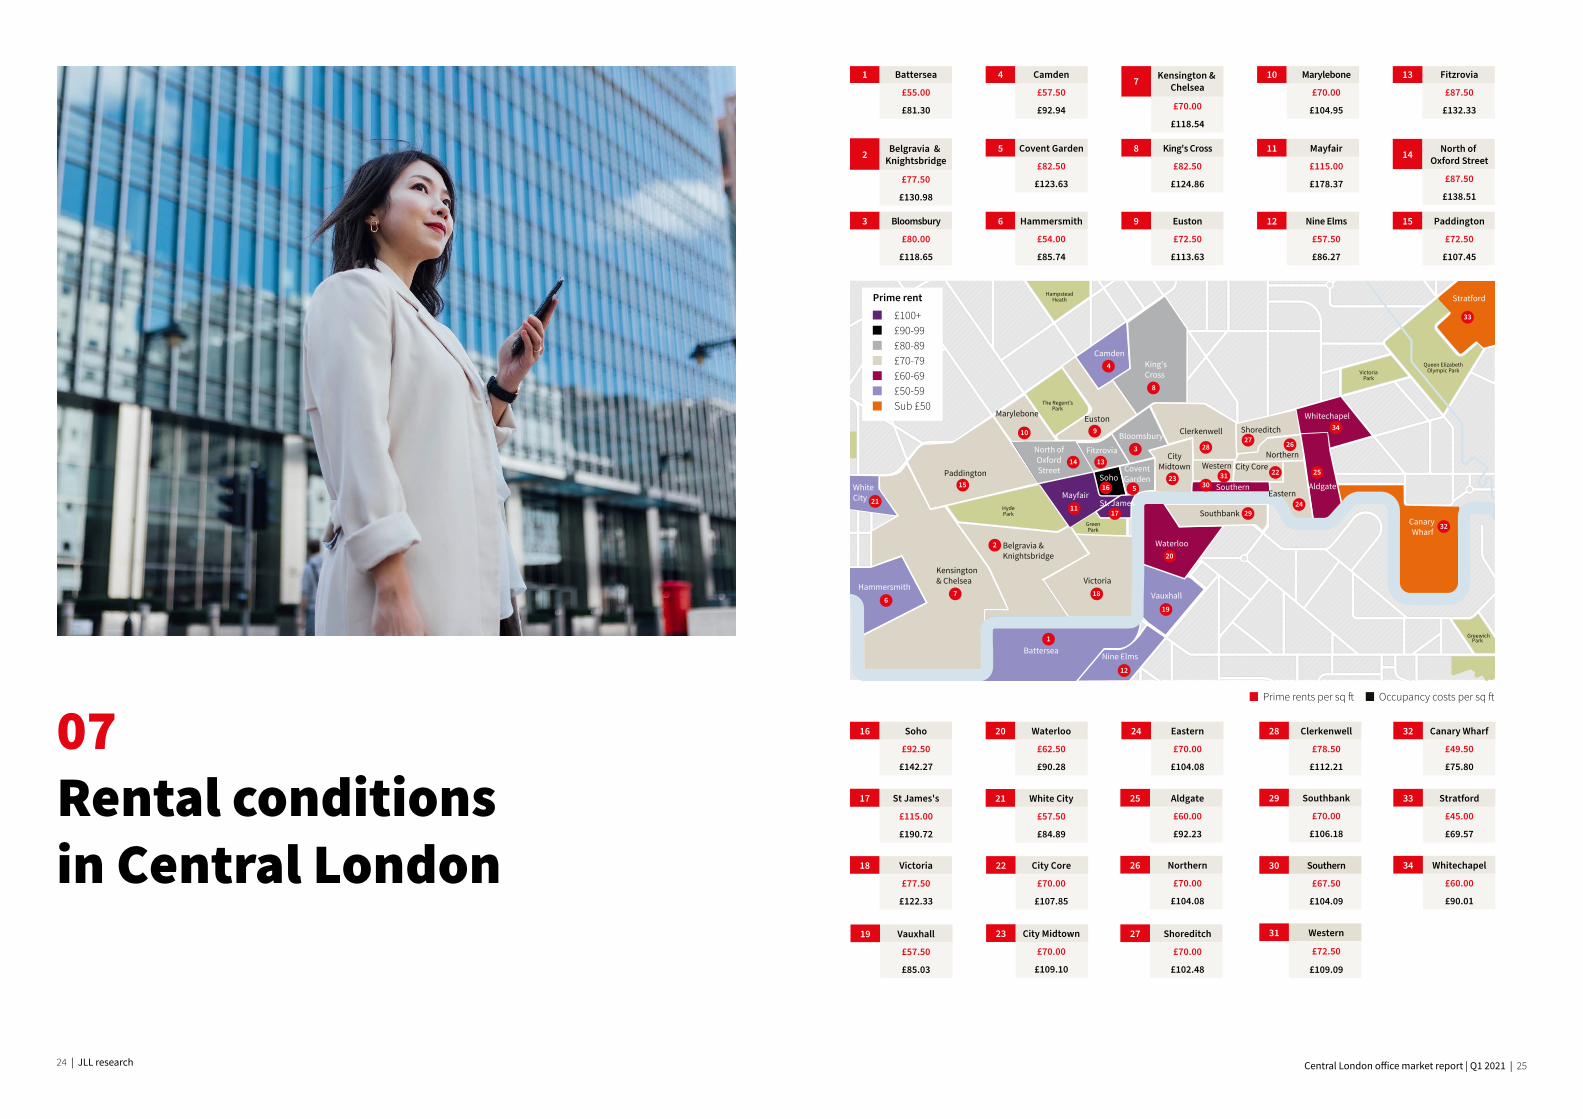
07Rental conditions in Central London
3 Bloomsbury
£80.00
£118.65
16 Soho
£92.50
£142.27
17 St James's
£115.00
£190.72
18 Victoria
£77.50
£122.33
8 King's Cross
£82.50
£124.86
9 Euston
£72.50
£113.63
22 City Core
£70.00
£107.85
23 City Midtown
£70.00
£109.10
24 Eastern
£70.00
£104.08
6 Hammersmith
£54.00
£85.74
21 White City
£57.50
£84.89
20 Waterloo
£62.50
£90.28
19 Vauxhall
£57.50
£85.03
12 Nine Elms
£57.50
£86.27
11 Mayfair
£115.00
£178.37
27 Shoreditch
£70.00
£102.48
26 Northern
£70.00
£104.08
25 Aldgate
£60.00
£92.23
15 Paddington
£72.50
£107.45
14 North of Oxford Street
£87.50
£138.51
1 Battersea
£55.00
£81.30
4 Camden
£57.50
£92.94
10 Marylebone
£70.00
£104.95
13 Fitzrovia
£87.50
£132.33
30 Southern
£67.50
£104.09
31 Western
£72.50
£109.09
29 Southbank
£70.00
£106.18
28 Clerkenwell
£78.50
£112.21
32 Canary Wharf
£49.50
£75.80
33 Stratford
£45.00
£69.57
34 Whitechapel
£60.00
£90.01
BATTER1EAPARK
HydePark
GreenPark
The Regent’sPark
HampsteadHeath
WormwoodScrubs
Park
ClaphamCommon
VictoriaPark
Queen ElizabethOlympic Park
FinsburyPark
WimbledonCommon
GreewichPark
BrockwellPark
RIVER THAMES
RIVER THAMES
Canary Wharf
Stratford
eeyyrr
£90-100+
0
67
15
11
1
18
19
20
17
16 5
13
10 9
8
28
3130
29
22 25
33
32
2627
24
23
3
4
2
£100+£90-99£80-89£70-79£60-69£50-59Sub £50
King’sCross
Camden
Euston
Mayfair
Belgravia &Knightsbridge
St. James
Soho
CityMidtownCovent
Garden
Marylebone
Paddington
Bloomsbury
Fitzrovia
Clerkenwell
Western
Southern
Southbank
Waterloo
Vauxhall
Victoria
Battersea
Hammersmith
Kensington & Chelsea
EasternAldgate
City Core
Shoreditch
Northern
Prime rent
14North ofOxfordStreet
WhiteCity 21
Nine Elms12
Whitechapel34
2
£77.50
£130.98
Belgravia & Knightsbridge
7
£70.00
£118.54
Kensington & Chelsea
5 Covent Garden
£82.50
£123.63
© 2021 Jones Lang LaSalle IP, Inc. All rights reserved. The information contained in this document is proprietary to Jones Lang LaSalle and shall be used solely for the purposes of evaluating this proposal. All such documentation and information remains the property of Jones Lang LaSalle and shall be kept confi dential. Reproduction of any part of this document is authorized only to the extent necessary for its evaluation. It is not to be shown to any third party without the prior written authorization of Jones Lang LaSalle. All information contained herein is from sources deemed reliable; however, no representation or warranty is made as to the accuracy thereof.
jll.co.uk/london-office-markets
About JLLJLL (NYSE: JLL) is a leading professional services firm thatspecializes in real estate and investment management.JLL shapes the future of real estate for a better world byusing the most advanced technology to create rewardingopportunities, amazing spaces and sustainable real estatesolutions for our clients, our people and our communities.JLL is a Fortune 500 company with annual revenue of$18.0 billion, operations in over 80 countries and a globalworkforce of more than 94,000 as of March 31, 2020. JLL isthe brand name, and a registered trademark, of Jones LangLaSalle Incorporated. For further information, visit jll.com.
About JLL ResearchJLL’s research team delivers intelligence, analysis and insight through market-leading reports and services that illuminate today’s commercial real estate dynamics and identify tomorrow’s challenges and opportunities. Our more than 400 global research professionals track and analyze economic and property trends and forecast future conditions in over 60 countries, producing unrivalled local and global perspectives. Our research and expertise, fueled by real-time information and innovative thinking around the world, creates a competitive advantage for our clients and drives successful strategies and optimal real estate decisions.
LeasingChris ValentineHead of West End Agency+44 (0)20 7087 [email protected]
Jeremy AttfieldHead of City Office+44 (0)20 7399 5675 [email protected]
Lease AdvisoryGeoffrey PentecostDirector - Lease Advisory +44 (0)20 7399 [email protected]
Nicholas SmithDirector - Lease Advisory+44 (0)20 7087 5762 [email protected]
Capital MarketsJulian SandbachHead of Central London Markets+44 (0)20 7399 5973 [email protected]
Rob Jackson Head of City Capital Markets+44 (0)20 7399 5029 [email protected]
Rob CorbettHead of West End Capital Markets+44 (0)20 7399 5545 [email protected]
ResearchJon NealeHead of UK Research+44 (0)20 7087 5508 [email protected]
Elaine RossallHead of UK Offices Research+44 (0)20 3147 1666 [email protected]
James NortonDirector-UK Research+44 (0)20 7087 5033 [email protected]
Amy BirdeeAssociate Director-UK Research+44 (0)20 7087 5098 [email protected]