Embed Size (px)
Citation preview
This document is Vistaprint’s fourth quarter and fiscal year 2014 earnings commentary. This document contains slides and accompanying comments in the “notes” section below each slide.
1Vistaprint N.V. Q4 FY2014 Earnings Presentation
2
Please read the above safe harbor statement. Additionally, a detailed reconciliation of GAAP and non‐GAAP measures is posted in the appendix of the Q4 and fiscal 2014 earnings presentation that accompanies these remarks.
Vistaprint N.V. Q4 FY2014 Earnings Presentation

3
This presentation is organized into the categories shown on the left hand side of this slide.
Robert Keane, CEO, and Ernst Teunissen, CFO, will host a live question and answer conference call at 5:15 p.m. U.S. Eastern timewhich you can access through a link on the investor relations section of www.vistaprint.com.
Vistaprint N.V. Q4 FY2014 Earnings Presentation
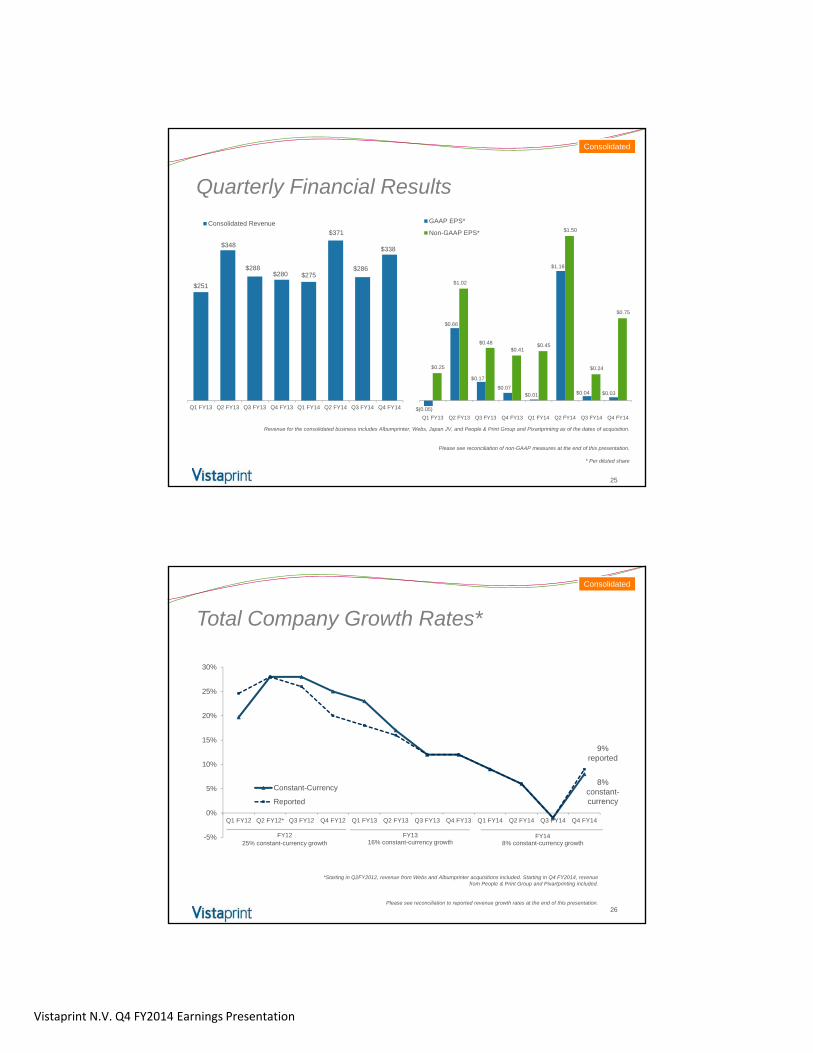
Total revenue for the full year was $1,270.2 million, reflecting a 9% increase year over year in reported currency and 8% in constant currency terms. Fourth quarter 2014 revenue grew 21% year over year, benefitting from the addition of our People & Print Group and Pixartprinting acquisitions, as well as sequentially improved growth rates for our Vistaprint brand.
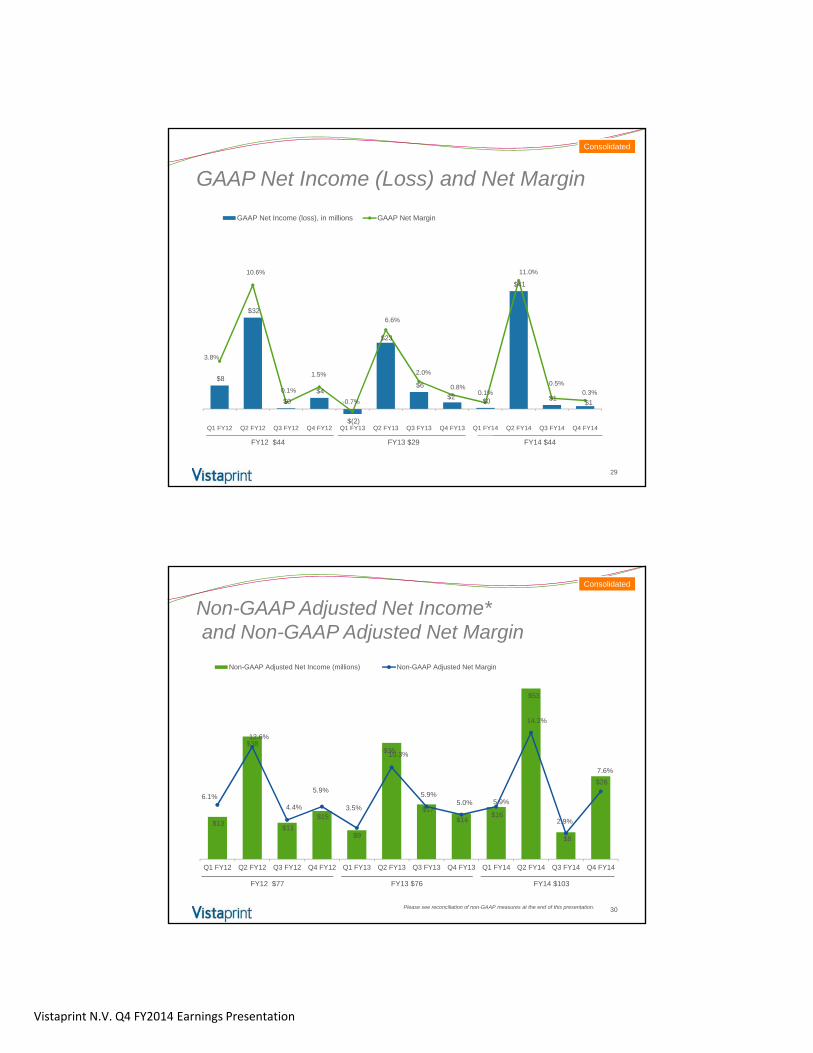
Even as we made significant investments and despite revenue headwinds (these subjects are discussed later in this presentation), we expanded our net income faster than our revenue. GAAP net income grew 48% year over year, non‐GAAP adjusted net income grew 35% year‐over‐year. For the fourth quarter in comparison to the same quarter last year, GAAP net income decreased 55% while non‐GAAP adjusted net income growth was 82%.
Full year net income growth was a result of successful achievement of margin expansion that we anticipated a year ago when webegan FY14. We expect to continue to drive margin expansion over time while making targeted growth investments in the business.
For the full fiscal year, GAAP earnings per share grew 51% year over year to $1.28 and non‐GAAP earnings per share grew 37% to $2.95. In FY14, our GAAP net income margin was 3.4%, and our non‐GAAP net income margin was 8.1 %, compared to 2.5% and 6.5%, respectively, in FY 2013. Fourth quarter 2014 GAAP EPS was $0.03, and non‐GAAP EPS was $0.75. Our GAAP results include a previously disclosed charge of $12.7 million related to the disposal of our minority equity interest in China.
4Vistaprint N.V. Q4 FY2014 Earnings Presentation
For our Vistaprint‐branded business in North America and Europe, FY14 was a transitional year for us as we continued our multi‐year effort to reposition the Vistaprint brand beyond our previous value proposition that had centered on the most price‐ and discount‐sensitive of customers. This entails a wide spectrum of improvements to pricing consistency and transparency, site experience, customer communications, product selection, product quality, merchandising, marketing messaging and customer service.
Our net promoter score, already on a strong improvement trajectory, showed significant sequential improvement in the U.S. and Germany in this first full quarter after these pricing and marketing changes were implemented. This improvement was most pronounced with first‐time customers, which is an encouraging result. Feedback from customers in these markets indicates that they have a clearer understanding of pricing structures since the changes were implemented, in line with our objective of greater price transparency.
We also made progress with the improvement of our digital marketing products during quarter:
• We expanded our website designs for Webs customers from 50 to 500 themes that match our most popular design templates for our physical products.• We delivered an enhanced mobile site experience and updated photo gallery module for both brands.• We launched new social media capabilities for Vistaprint customers including Facebook posts, contests, and cover photos.
Though we have made much progress with our digital integration and feature set, our digital revenue remains flat while we prioritize overall Vistaprintcustomer value proposition changes, and as a result of our broader merchandising customer‐focused changes that result in significantly less aggressive cross‐selling of digital products than in the past.
This quarter, our advertising as a percent of revenue was below 20% for our Vistaprint brand. This level is not our long‐term expectation, but we believe it was the right level of marketing investment in this quarter. In addition to our continued drive for improved customer economics in Europe, our new approach in large markets to offer consistent pricing and discount levels across channels and to focus less on some lower return channels, drove more customers through unpaid channels such as direct URL type‐in and organic search. This contributed to our advertising cost reduction. We expect advertising levels to be higher than 20% for the Vistaprint brand in FY15.
Vistaprint brand year‐over‐year revenue growth rates improved sequentially from Q3 to Q4 in the U.S., UK and Germany. These are the three main markets in which we implemented significant pricing and marketing changes during the fiscal year, and as discussed three months ago, they have created more of a revenue headwind than we had anticipated. While we still have more work ahead of us in these markets, we are encouraged by our fourth quarter results. We continued to see a trend of fewer orders or slower order growth, depending upon the market, and higher AOV in each of these markets, which is similar to the experience we’ve had in other markets in which we have made more substantive pricing changes.
Although our revenue growth this year was lower than we initially expected, we are confident that the changes that we’re making in our business are strengthening our customer value proposition and Vistaprint brand and creating long‐term value.
Vistaprint N.V. Q4 FY2014 Earnings Presentation 5
In Asia‐Pacific, we introduced new pricing and marketing changes in Australia and Japan in the fourth quarter:• In Australia, these changes were less impactful than those we made in the U.S. and Germany in the third quarter. Australia is
a smaller market than the U.S. and Germany, and the pricing changes we made this quarter were more limited to shipping and upload fees.
• Through our joint venture in Japan, we have begun a longer‐term effort to materially improve the quality and competitiveness of our value proposition, including building a domestic Japanese production facility over the coming 15 months to improve delivery reliability and cost. Fiscal year 2015 will be a year of building the operational foundations of theJapanese business, not driving revenue via marketing. As such, we have dialed back our advertising spend and expect to continue to constrain advertising (and thus Japanese revenues) for at least the next five quarters.
Our business in India continued triple‐digit growth off a small base. This business launched with a focus on offering a great customer value proposition, and though the business is less than two years old, we have impressive customer retention in thisdeveloping market.
Finally, as discussed last quarter, we took a charge in the fourth quarter related to the disposal of our minority equity investment in China. The total charge was $12.7M, lower than previously anticipated. We remain committed to building a business in this exciting market over time, but we do not expect to launch revenue generating activities here for 2 to 3 years.
Vistaprint N.V. Q4 FY2014 Earnings Presentation 6
Turning to the performance of our recent acquisitions, both People & Print Group and Pixartprinting outperformed our revenue and profit expectations for the quarter. After the first quarter of ownership, we are pleased with our integration planning andexecution. The acquisitions were slightly dilutive to our GAAP EPS during the fourth quarter, primarily because of the $2.2Mchange in estimate for the earn‐outs, which flows through the P&L. Amortization of acquisition‐related intangible assets was $3.3M in Q4. The deal costs for the acquisitions were largely booked in Q3, but there was about $800K of third‐party fees related to these acquisitions during Q4 ($4.5M for the full year). Our interest expense also increased with the acquisitions.
Both of these companies have great value propositions that resonate in their respective market focus areas, and we believe they will show strong growth in FY15.
Finally, subsequent to the quarter close, we made a small acquisition that will become a part of our Albumprinter business: FotoKnudsen. This is a leading photo book producer in Norway which will complement our other Albumprinter brands. We don’t expect this acquisition to have a material impact on our financial results.
Vistaprint N.V. Q4 FY2014 Earnings Presentation 7
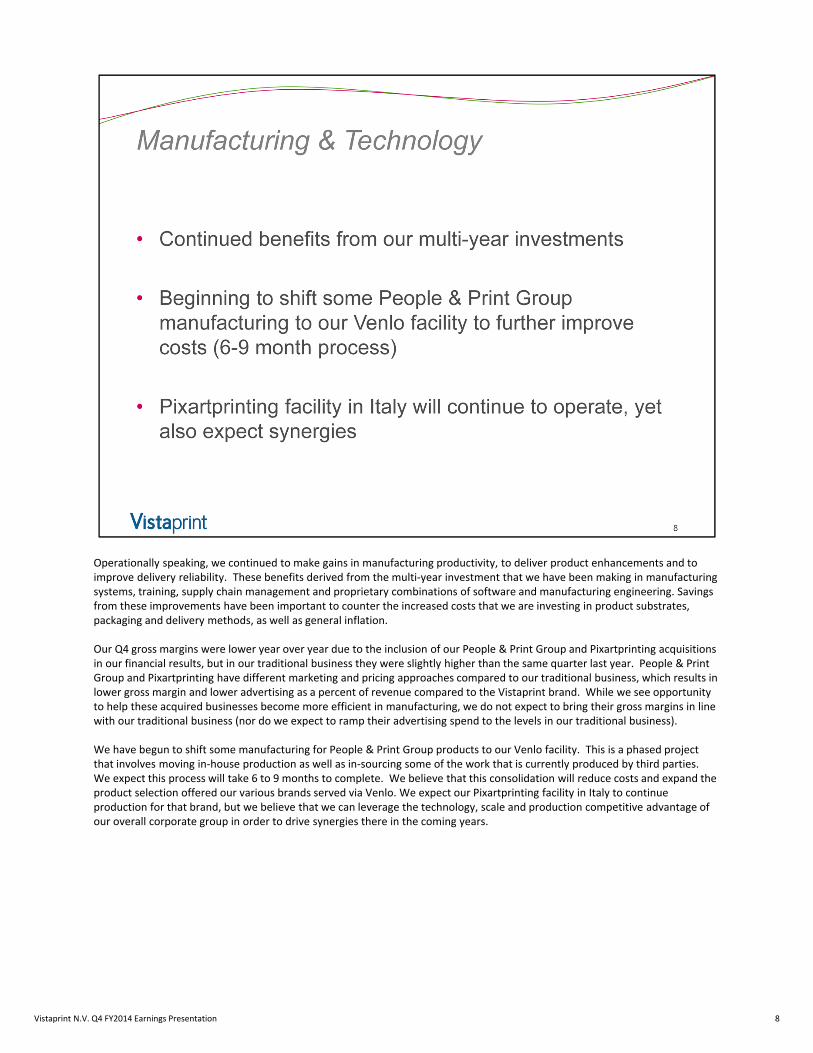
Operationally speaking, we continued to make gains in manufacturing productivity, to deliver product enhancements and to improve delivery reliability. These benefits derived from the multi‐year investment that we have been making in manufacturing systems, training, supply chain management and proprietary combinations of software and manufacturing engineering. Savings from these improvements have been important to counter the increased costs that we are investing in product substrates, packaging and delivery methods, as well as general inflation.
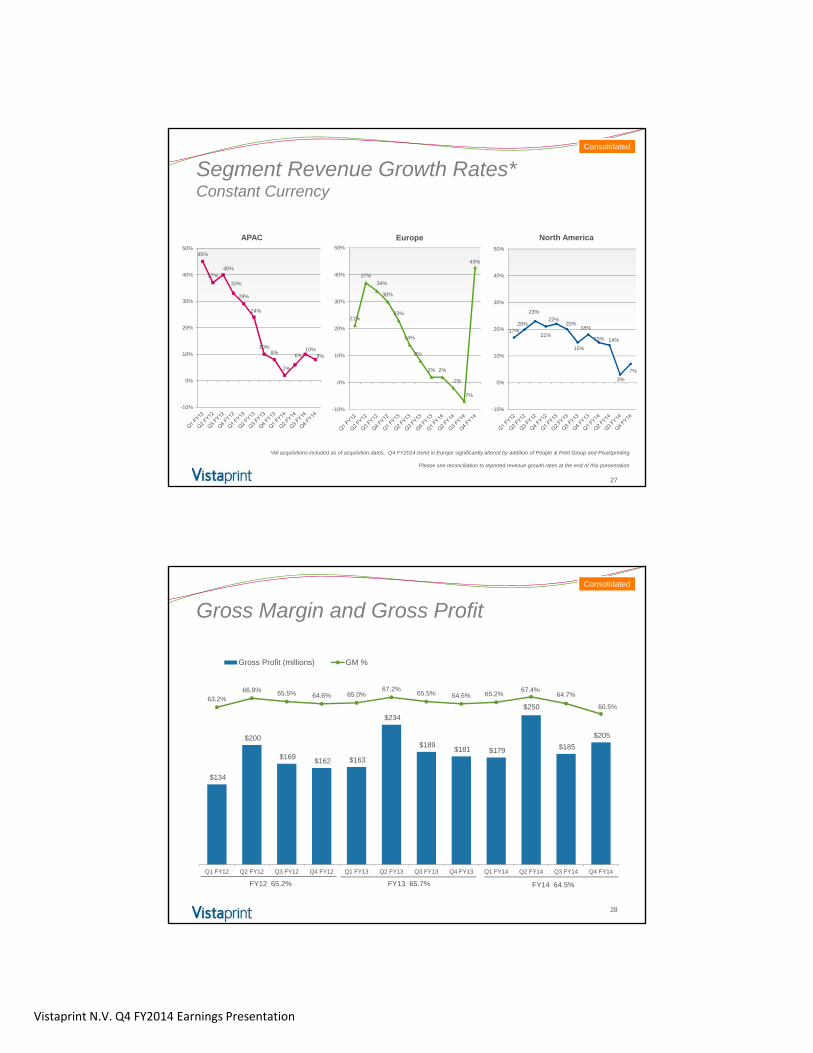
Our Q4 gross margins were lower year over year due to the inclusion of our People & Print Group and Pixartprinting acquisitions in our financial results, but in our traditional business they were slightly higher than the same quarter last year. People & Print Group and Pixartprinting have different marketing and pricing approaches compared to our traditional business, which results in lower gross margin and lower advertising as a percent of revenue compared to the Vistaprint brand. While we see opportunity to help these acquired businesses become more efficient in manufacturing, we do not expect to bring their gross margins in line with our traditional business (nor do we expect to ramp their advertising spend to the levels in our traditional business).
We have begun to shift some manufacturing for People & Print Group products to our Venlo facility. This is a phased project that involves moving in‐house production as well as in‐sourcing some of the work that is currently produced by third parties. We expect this process will take 6 to 9 months to complete. We believe that this consolidation will reduce costs and expand theproduct selection offered our various brands served via Venlo. We expect our Pixartprinting facility in Italy to continue production for that brand, but we believe that we can leverage the technology, scale and production competitive advantage of our overall corporate group in order to drive synergies there in the coming years.
Vistaprint N.V. Q4 FY2014 Earnings Presentation 8
No notes here – transition slide
Vistaprint N.V. Q4 FY2014 Earnings Presentation 9
10
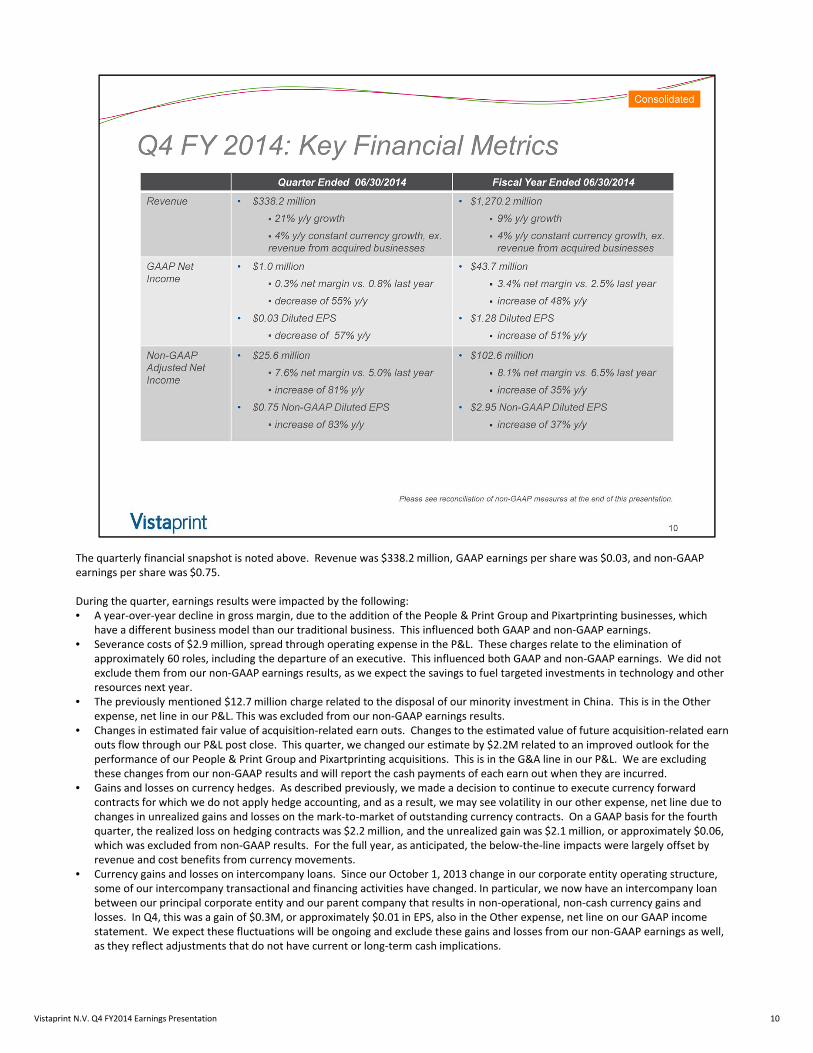
The quarterly financial snapshot is noted above. Revenue was $338.2 million, GAAP earnings per share was $0.03, and non‐GAAP earnings per share was $0.75.
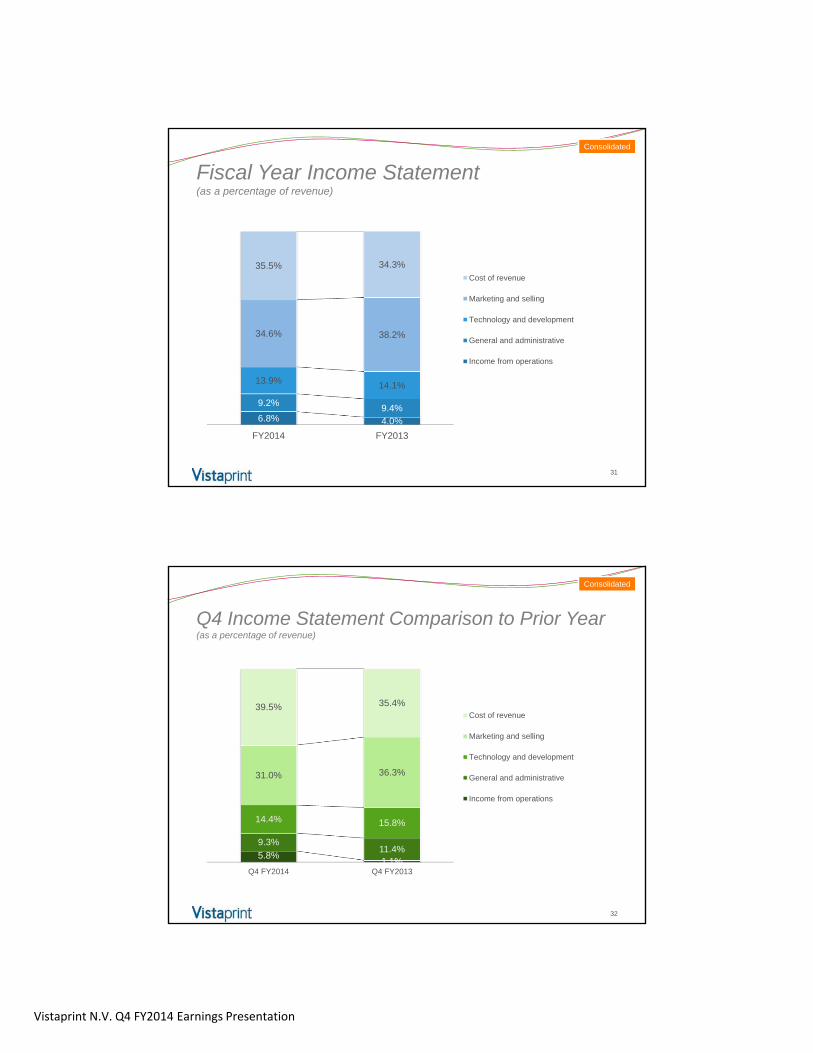
During the quarter, earnings results were impacted by the following: • A year‐over‐year decline in gross margin, due to the addition of the People & Print Group and Pixartprinting businesses, which
have a different business model than our traditional business. This influenced both GAAP and non‐GAAP earnings.• Severance costs of $2.9 million, spread through operating expense in the P&L. These charges relate to the elimination of
approximately 60 roles, including the departure of an executive. This influenced both GAAP and non‐GAAP earnings. We did not exclude them from our non‐GAAP earnings results, as we expect the savings to fuel targeted investments in technology and other resources next year.
• The previously mentioned $12.7 million charge related to the disposal of our minority investment in China. This is in the Otherexpense, net line in our P&L. This was excluded from our non‐GAAP earnings results.
• Changes in estimated fair value of acquisition‐related earn outs. Changes to the estimated value of future acquisition‐related earn outs flow through our P&L post close. This quarter, we changed our estimate by $2.2M related to an improved outlook for the performance of our People & Print Group and Pixartprinting acquisitions. This is in the G&A line in our P&L. We are excluding these changes from our non‐GAAP results and will report the cash payments of each earn out when they are incurred.
• Gains and losses on currency hedges. As described previously, we made a decision to continue to execute currency forward contracts for which we do not apply hedge accounting, and as a result, we may see volatility in our other expense, net line due to changes in unrealized gains and losses on the mark‐to‐market of outstanding currency contracts. On a GAAP basis for the fourth quarter, the realized loss on hedging contracts was $2.2 million, and the unrealized gain was $2.1 million, or approximately $0.06, which was excluded from non‐GAAP results. For the full year, as anticipated, the below‐the‐line impacts were largely offset by revenue and cost benefits from currency movements.
• Currency gains and losses on intercompany loans. Since our October 1, 2013 change in our corporate entity operating structure, some of our intercompany transactional and financing activities have changed. In particular, we now have an intercompany loanbetween our principal corporate entity and our parent company that results in non‐operational, non‐cash currency gains and losses. In Q4, this was a gain of $0.3M, or approximately $0.01 in EPS, also in the Other expense, net line on our GAAP income statement. We expect these fluctuations will be ongoing and exclude these gains and losses from our non‐GAAP earnings as well, as they reflect adjustments that do not have current or long‐term cash implications.
Vistaprint N.V. Q4 FY2014 Earnings Presentation
11
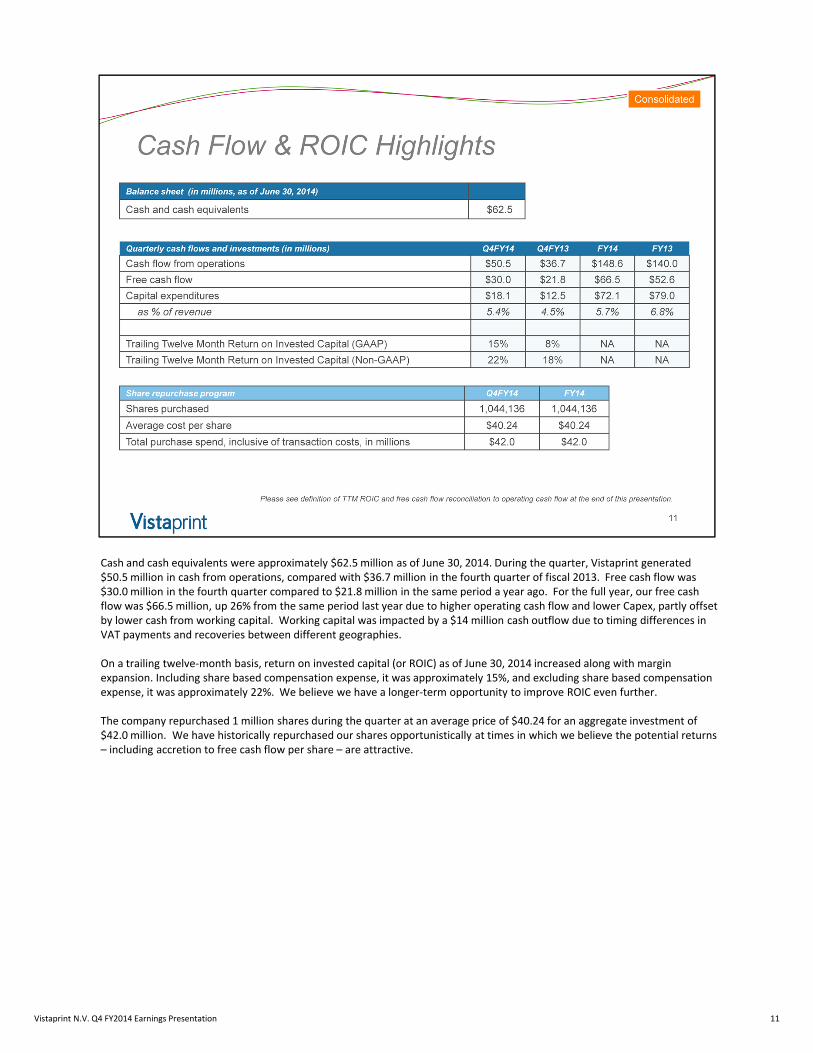
Cash and cash equivalents were approximately $62.5 million as of June 30, 2014. During the quarter, Vistaprint generated $50.5 million in cash from operations, compared with $36.7 million in the fourth quarter of fiscal 2013. Free cash flow was $30.0 million in the fourth quarter compared to $21.8 million in the same period a year ago. For the full year, our free cash flow was $66.5 million, up 26% from the same period last year due to higher operating cash flow and lower Capex, partly offset by lower cash from working capital. Working capital was impacted by a $14 million cash outflow due to timing differences in VAT payments and recoveries between different geographies.
On a trailing twelve‐month basis, return on invested capital (or ROIC) as of June 30, 2014 increased along with margin expansion. Including share based compensation expense, it was approximately 15%, and excluding share based compensation expense, it was approximately 22%. We believe we have a longer‐term opportunity to improve ROIC even further.
The company repurchased 1 million shares during the quarter at an average price of $40.24 for an aggregate investment of $42.0 million. We have historically repurchased our shares opportunistically at times in which we believe the potential returns– including accretion to free cash flow per share – are attractive.
Vistaprint N.V. Q4 FY2014 Earnings Presentation
12
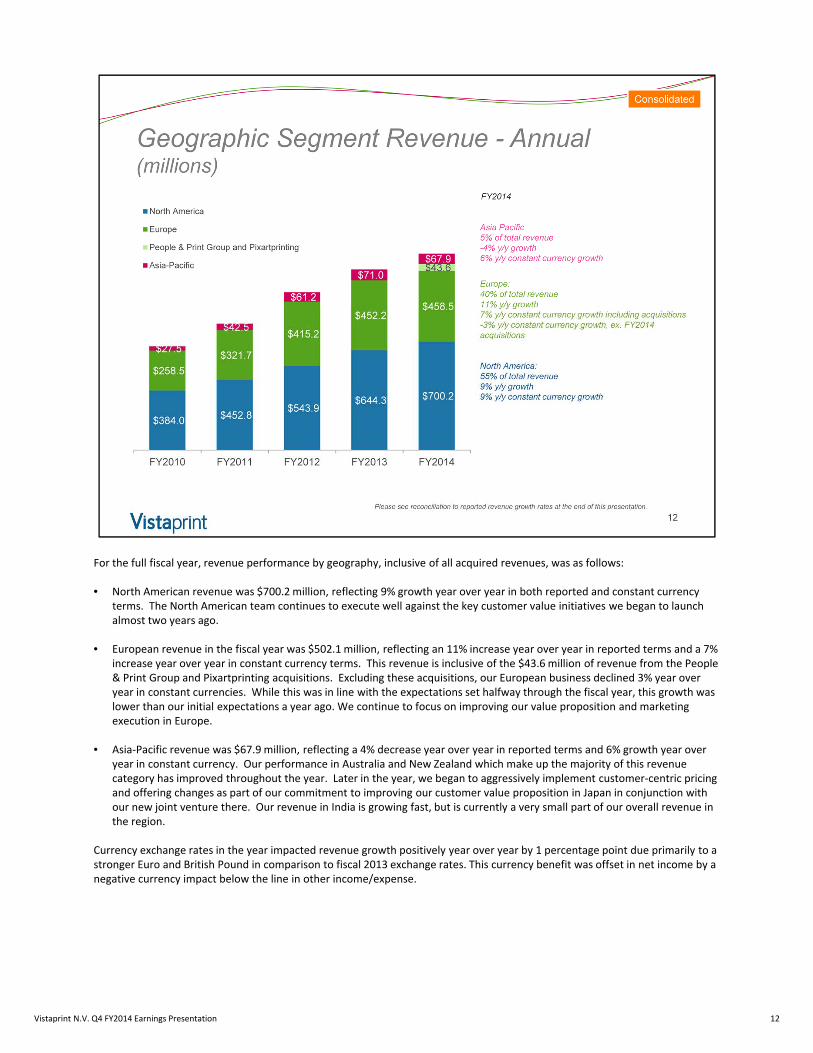
For the full fiscal year, revenue performance by geography, inclusive of all acquired revenues, was as follows:
• North American revenue was $700.2 million, reflecting 9% growth year over year in both reported and constant currency terms. The North American team continues to execute well against the key customer value initiatives we began to launch almost two years ago.
• European revenue in the fiscal year was $502.1 million, reflecting an 11% increase year over year in reported terms and a 7% increase year over year in constant currency terms. This revenue is inclusive of the $43.6 million of revenue from the People & Print Group and Pixartprinting acquisitions. Excluding these acquisitions, our European business declined 3% year over year in constant currencies. While this was in line with the expectations set halfway through the fiscal year, this growth was lower than our initial expectations a year ago. We continue to focus on improving our value proposition and marketing execution in Europe.
• Asia‐Pacific revenue was $67.9 million, reflecting a 4% decrease year over year in reported terms and 6% growth year over year in constant currency. Our performance in Australia and New Zealand which make up the majority of this revenue category has improved throughout the year. Later in the year, we began to aggressively implement customer‐centric pricing and offering changes as part of our commitment to improving our customer value proposition in Japan in conjunction with our new joint venture there. Our revenue in India is growing fast, but is currently a very small part of our overall revenue inthe region.
Currency exchange rates in the year impacted revenue growth positively year over year by 1 percentage point due primarily to a stronger Euro and British Pound in comparison to fiscal 2013 exchange rates. This currency benefit was offset in net income by anegative currency impact below the line in other income/expense.
Vistaprint N.V. Q4 FY2014 Earnings Presentation
13
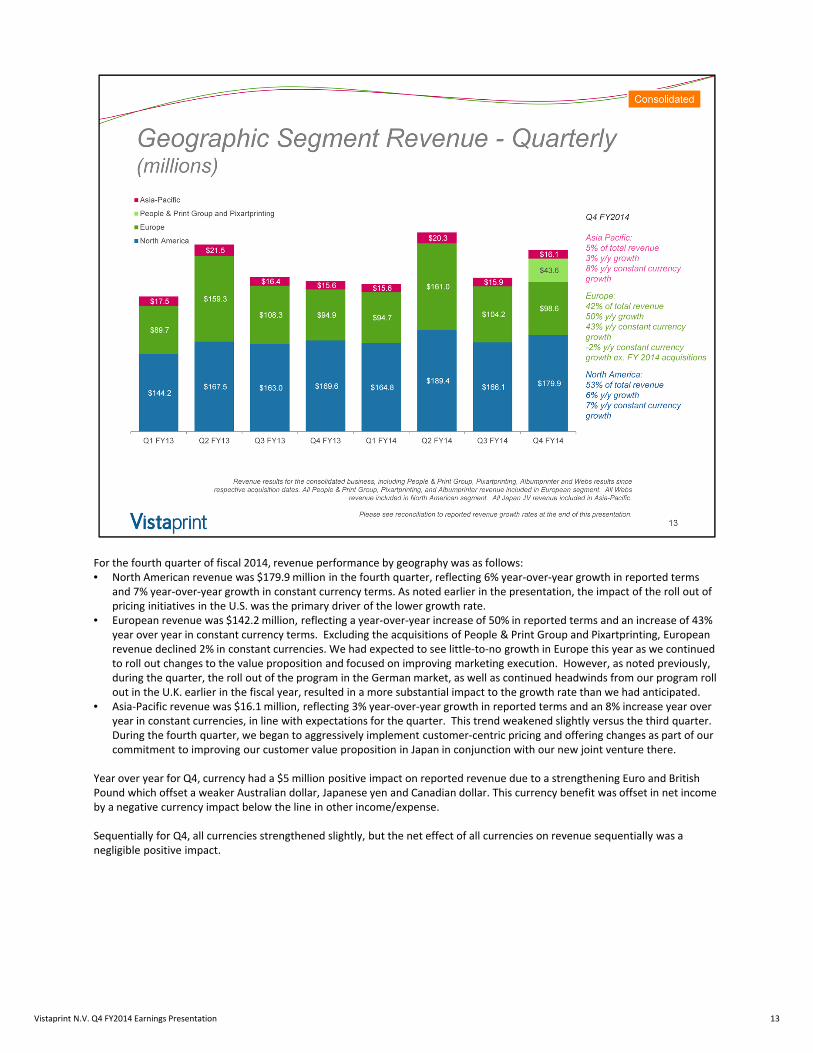
For the fourth quarter of fiscal 2014, revenue performance by geography was as follows:• North American revenue was $179.9 million in the fourth quarter, reflecting 6% year‐over‐year growth in reported terms
and 7% year‐over‐year growth in constant currency terms. As noted earlier in the presentation, the impact of the roll out of pricing initiatives in the U.S. was the primary driver of the lower growth rate.
• European revenue was $142.2 million, reflecting a year‐over‐year increase of 50% in reported terms and an increase of 43% year over year in constant currency terms. Excluding the acquisitions of People & Print Group and Pixartprinting, European revenue declined 2% in constant currencies. We had expected to see little‐to‐no growth in Europe this year as we continued to roll out changes to the value proposition and focused on improving marketing execution. However, as noted previously, during the quarter, the roll out of the program in the German market, as well as continued headwinds from our program roll out in the U.K. earlier in the fiscal year, resulted in a more substantial impact to the growth rate than we had anticipated.
• Asia‐Pacific revenue was $16.1 million, reflecting 3% year‐over‐year growth in reported terms and an 8% increase year over year in constant currencies, in line with expectations for the quarter. This trend weakened slightly versus the third quarter. During the fourth quarter, we began to aggressively implement customer‐centric pricing and offering changes as part of our commitment to improving our customer value proposition in Japan in conjunction with our new joint venture there.
Year over year for Q4, currency had a $5 million positive impact on reported revenue due to a strengthening Euro and British Pound which offset a weaker Australian dollar, Japanese yen and Canadian dollar. This currency benefit was offset in net income by a negative currency impact below the line in other income/expense.
Sequentially for Q4, all currencies strengthened slightly, but the net effect of all currencies on revenue sequentially was anegligible positive impact.
Vistaprint N.V. Q4 FY2014 Earnings Presentation
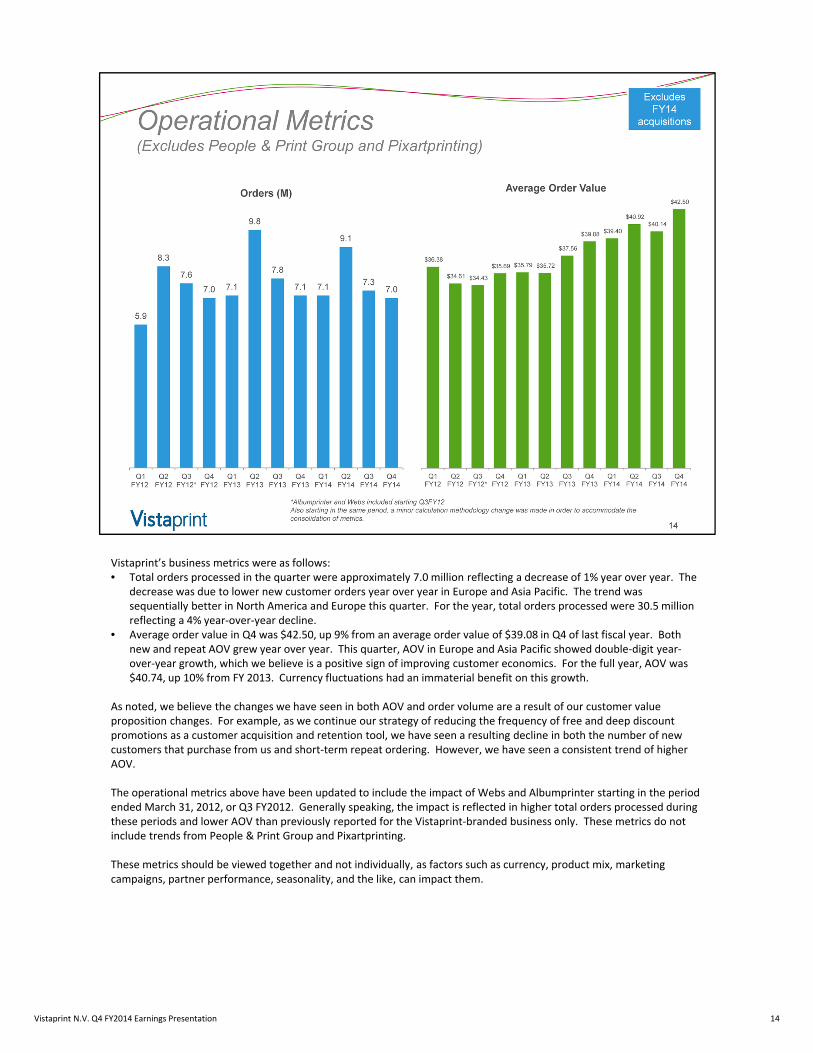
Vistaprint’s business metrics were as follows: • Total orders processed in the quarter were approximately 7.0 million reflecting a decrease of 1% year over year. The
decrease was due to lower new customer orders year over year in Europe and Asia Pacific. The trend was sequentially better in North America and Europe this quarter. For the year, total orders processed were 30.5 million reflecting a 4% year‐over‐year decline.
• Average order value in Q4 was $42.50, up 9% from an average order value of $39.08 in Q4 of last fiscal year. Both new and repeat AOV grew year over year. This quarter, AOV in Europe and Asia Pacific showed double‐digit year‐over‐year growth, which we believe is a positive sign of improving customer economics. For the full year, AOV was $40.74, up 10% from FY 2013. Currency fluctuations had an immaterial benefit on this growth.
As noted, we believe the changes we have seen in both AOV and order volume are a result of our customer value proposition changes. For example, as we continue our strategy of reducing the frequency of free and deep discount promotions as a customer acquisition and retention tool, we have seen a resulting decline in both the number of new customers that purchase from us and short‐term repeat ordering. However, we have seen a consistent trend of higher AOV.
The operational metrics above have been updated to include the impact of Webs and Albumprinter starting in the period ended March 31, 2012, or Q3 FY2012. Generally speaking, the impact is reflected in higher total orders processed during these periods and lower AOV than previously reported for the Vistaprint‐branded business only. These metrics do not include trends from People & Print Group and Pixartprinting.
These metrics should be viewed together and not individually, as factors such as currency, product mix, marketing campaigns, partner performance, seasonality, and the like, can impact them.
Vistaprint N.V. Q4 FY2014 Earnings Presentation 14
Additional customer metrics for our business excluding People & Print Group and Pixartprinting for the period ended June 30, 2014, were as follows:
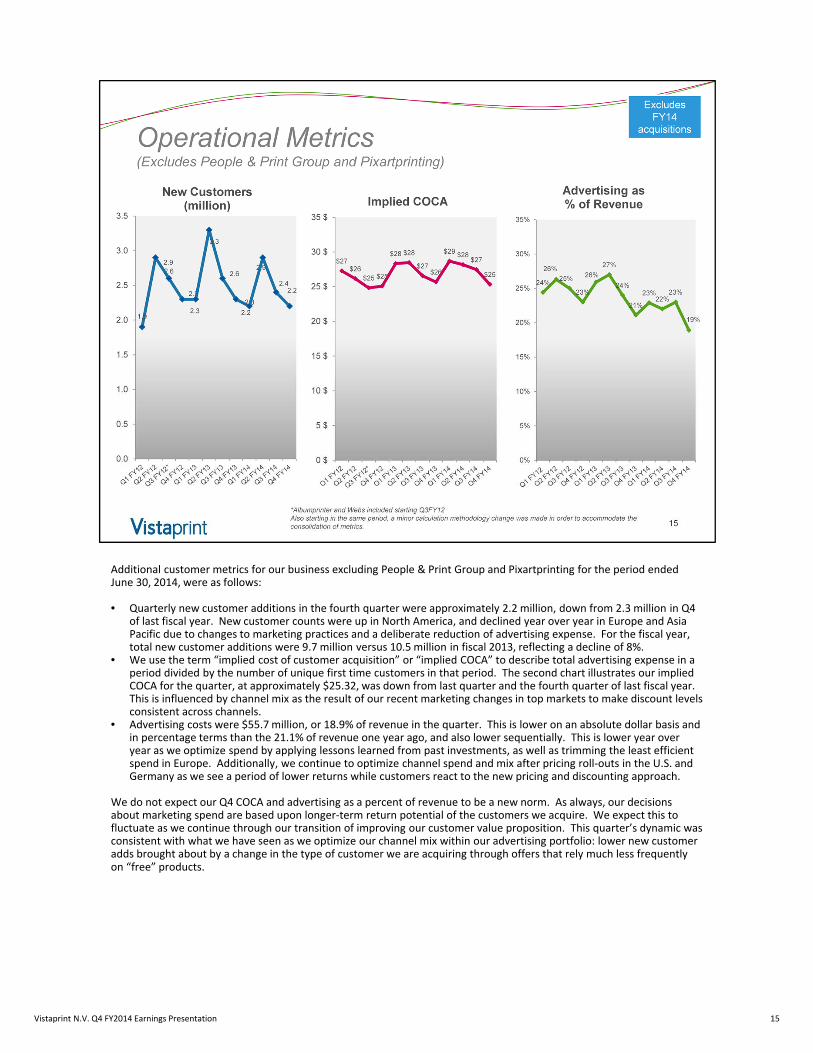
• Quarterly new customer additions in the fourth quarter were approximately 2.2 million, down from 2.3 million in Q4 of last fiscal year. New customer counts were up in North America, and declined year over year in Europe and Asia Pacific due to changes to marketing practices and a deliberate reduction of advertising expense. For the fiscal year, total new customer additions were 9.7 million versus 10.5 million in fiscal 2013, reflecting a decline of 8%.
• We use the term “implied cost of customer acquisition” or “implied COCA” to describe total advertising expense in a period divided by the number of unique first time customers in that period. The second chart illustrates our implied COCA for the quarter, at approximately $25.32, was down from last quarter and the fourth quarter of last fiscal year. This is influenced by channel mix as the result of our recent marketing changes in top markets to make discount levels consistent across channels.
• Advertising costs were $55.7 million, or 18.9% of revenue in the quarter. This is lower on an absolute dollar basis and in percentage terms than the 21.1% of revenue one year ago, and also lower sequentially. This is lower year over year as we optimize spend by applying lessons learned from past investments, as well as trimming the least efficient spend in Europe. Additionally, we continue to optimize channel spend and mix after pricing roll‐outs in the U.S. and Germany as we see a period of lower returns while customers react to the new pricing and discounting approach.
We do not expect our Q4 COCA and advertising as a percent of revenue to be a new norm. As always, our decisions about marketing spend are based upon longer‐term return potential of the customers we acquire. We expect this to fluctuate as we continue through our transition of improving our customer value proposition. This quarter’s dynamic was consistent with what we have seen as we optimize our channel mix within our advertising portfolio: lower new customer adds brought about by a change in the type of customer we are acquiring through offers that rely much less frequently on “free” products.
Vistaprint N.V. Q4 FY2014 Earnings Presentation 15
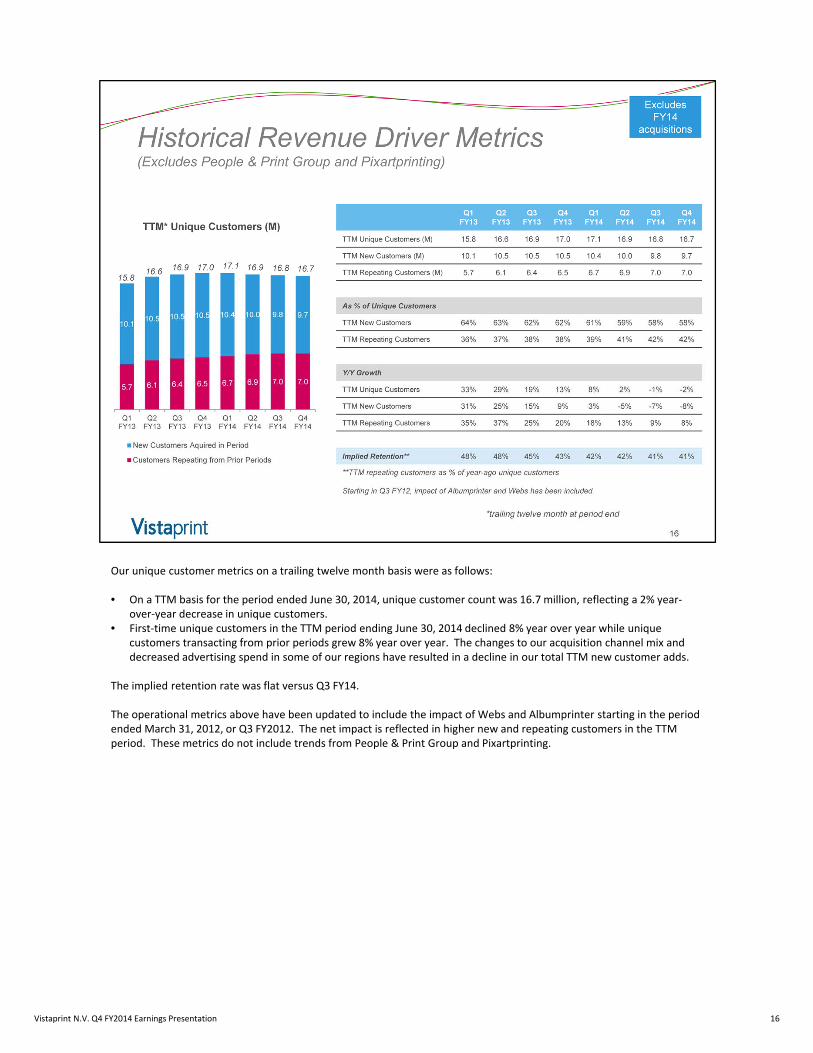
Our unique customer metrics on a trailing twelve month basis were as follows:
• On a TTM basis for the period ended June 30, 2014, unique customer count was 16.7 million, reflecting a 2% year‐over‐year decrease in unique customers.
• First‐time unique customers in the TTM period ending June 30, 2014 declined 8% year over year while unique customers transacting from prior periods grew 8% year over year. The changes to our acquisition channel mix and decreased advertising spend in some of our regions have resulted in a decline in our total TTM new customer adds.
The implied retention rate was flat versus Q3 FY14.
The operational metrics above have been updated to include the impact of Webs and Albumprinter starting in the period ended March 31, 2012, or Q3 FY2012. The net impact is reflected in higher new and repeating customers in the TTM period. These metrics do not include trends from People & Print Group and Pixartprinting.
Vistaprint N.V. Q4 FY2014 Earnings Presentation 16
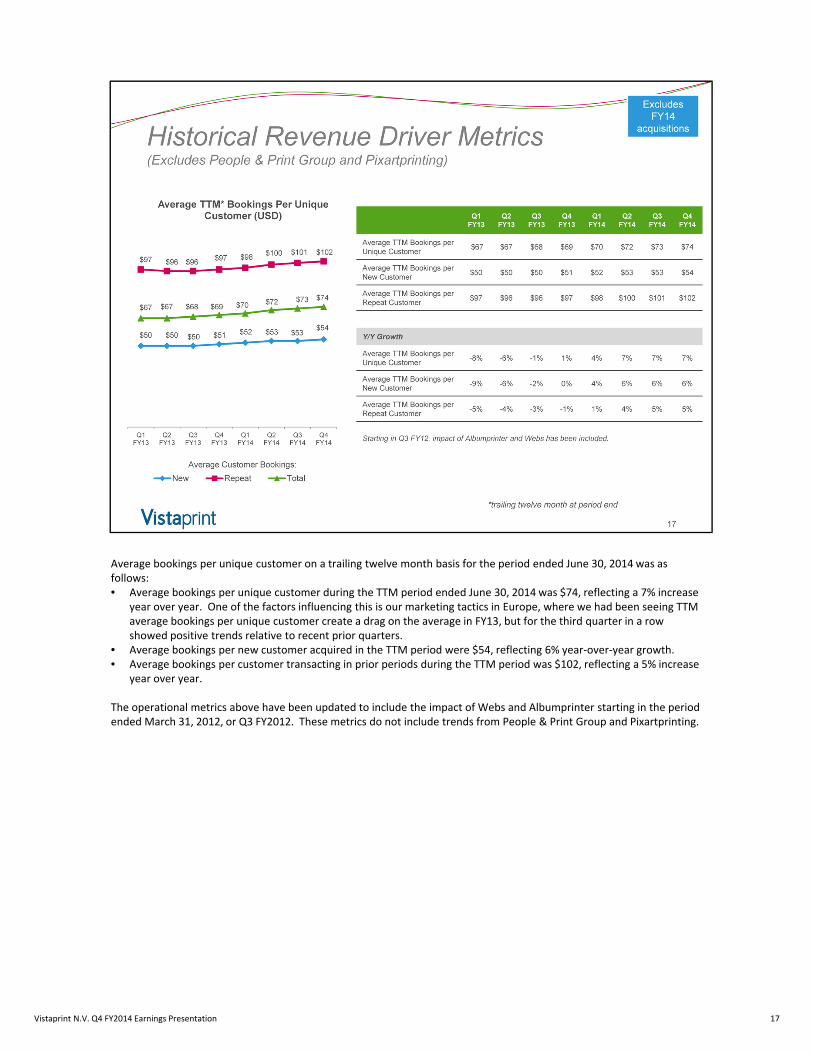
Average bookings per unique customer on a trailing twelve month basis for the period ended June 30, 2014 was as follows: • Average bookings per unique customer during the TTM period ended June 30, 2014 was $74, reflecting a 7% increase
year over year. One of the factors influencing this is our marketing tactics in Europe, where we had been seeing TTM average bookings per unique customer create a drag on the average in FY13, but for the third quarter in a row showed positive trends relative to recent prior quarters.
• Average bookings per new customer acquired in the TTM period were $54, reflecting 6% year‐over‐year growth. • Average bookings per customer transacting in prior periods during the TTM period was $102, reflecting a 5% increase
year over year.
The operational metrics above have been updated to include the impact of Webs and Albumprinter starting in the period ended March 31, 2012, or Q3 FY2012. These metrics do not include trends from People & Print Group and Pixartprinting.
17Vistaprint N.V. Q4 FY2014 Earnings Presentation
No notes here – transition slide
Vistaprint N.V. Q4 FY2014 Earnings Presentation 18
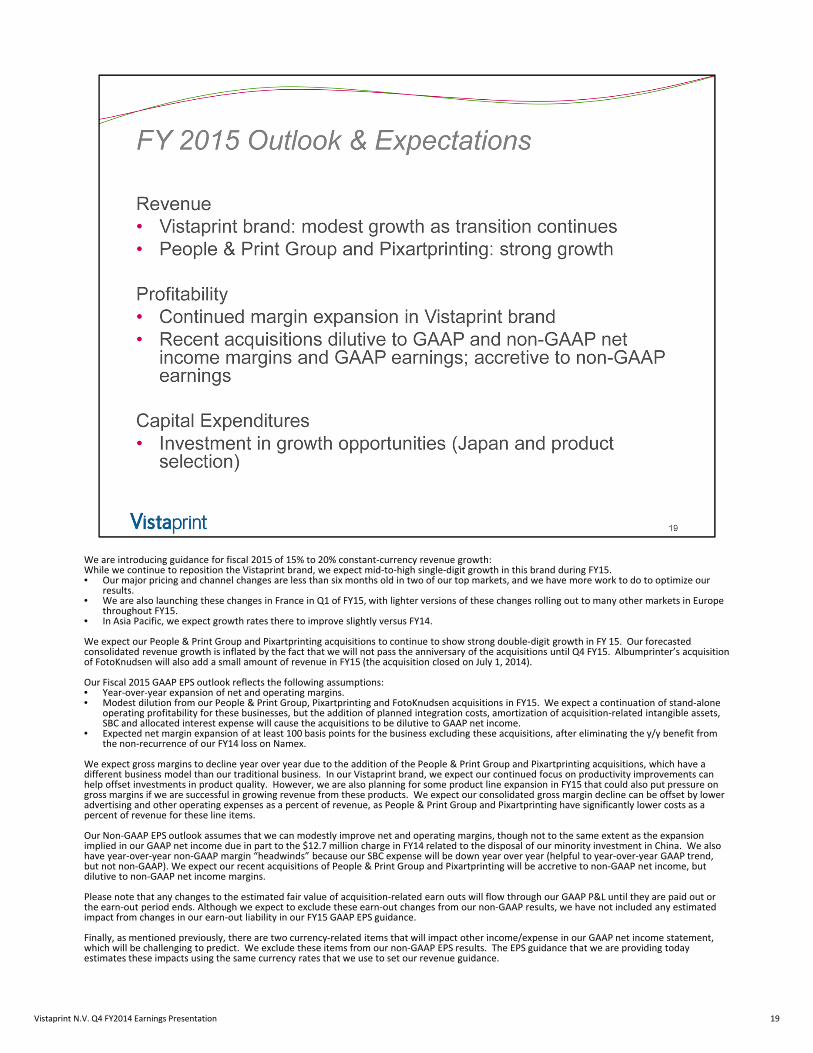
We are introducing guidance for fiscal 2015 of 15% to 20% constant‐currency revenue growth:While we continue to reposition the Vistaprint brand, we expect mid‐to‐high single‐digit growth in this brand during FY15. • Our major pricing and channel changes are less than six months old in two of our top markets, and we have more work to do to optimize our
results. • We are also launching these changes in France in Q1 of FY15, with lighter versions of these changes rolling out to many other markets in Europe
throughout FY15.• In Asia Pacific, we expect growth rates there to improve slightly versus FY14.
We expect our People & Print Group and Pixartprinting acquisitions to continue to show strong double‐digit growth in FY 15. Our forecasted consolidated revenue growth is inflated by the fact that we will not pass the anniversary of the acquisitions until Q4 FY15. Albumprinter’s acquisition of FotoKnudsen will also add a small amount of revenue in FY15 (the acquisition closed on July 1, 2014).
Our Fiscal 2015 GAAP EPS outlook reflects the following assumptions:• Year‐over‐year expansion of net and operating margins. • Modest dilution from our People & Print Group, Pixartprinting and FotoKnudsen acquisitions in FY15. We expect a continuation of stand‐alone
operating profitability for these businesses, but the addition of planned integration costs, amortization of acquisition‐related intangible assets, SBC and allocated interest expense will cause the acquisitions to be dilutive to GAAP net income.
• Expected net margin expansion of at least 100 basis points for the business excluding these acquisitions, after eliminating the y/y benefit from the non‐recurrence of our FY14 loss on Namex.
We expect gross margins to decline year over year due to the addition of the People & Print Group and Pixartprinting acquisitions, which have a different business model than our traditional business. In our Vistaprint brand, we expect our continued focus on productivity improvements can help offset investments in product quality. However, we are also planning for some product line expansion in FY15 that could also put pressure on gross margins if we are successful in growing revenue from these products. We expect our consolidated gross margin decline can be offset by lower advertising and other operating expenses as a percent of revenue, as People & Print Group and Pixartprinting have significantly lower costs as a percent of revenue for these line items.
Our Non‐GAAP EPS outlook assumes that we can modestly improve net and operating margins, though not to the same extent as the expansion implied in our GAAP net income due in part to the $12.7 million charge in FY14 related to the disposal of our minority investment in China. We also have year‐over‐year non‐GAAP margin “headwinds” because our SBC expense will be down year over year (helpful to year‐over‐year GAAP trend, but not non‐GAAP). We expect our recent acquisitions of People & Print Group and Pixartprinting will be accretive to non‐GAAP net income, but dilutive to non‐GAAP net income margins.
Please note that any changes to the estimated fair value of acquisition‐related earn outs will flow through our GAAP P&L until they are paid out or the earn‐out period ends. Although we expect to exclude these earn‐out changes from our non‐GAAP results, we have not included any estimated impact from changes in our earn‐out liability in our FY15 GAAP EPS guidance.
Finally, as mentioned previously, there are two currency‐related items that will impact other income/expense in our GAAP net income statement, which will be challenging to predict. We exclude these items from our non‐GAAP EPS results. The EPS guidance that we are providing today estimates these impacts using the same currency rates that we use to set our revenue guidance.
Vistaprint N.V. Q4 FY2014 Earnings Presentation 19
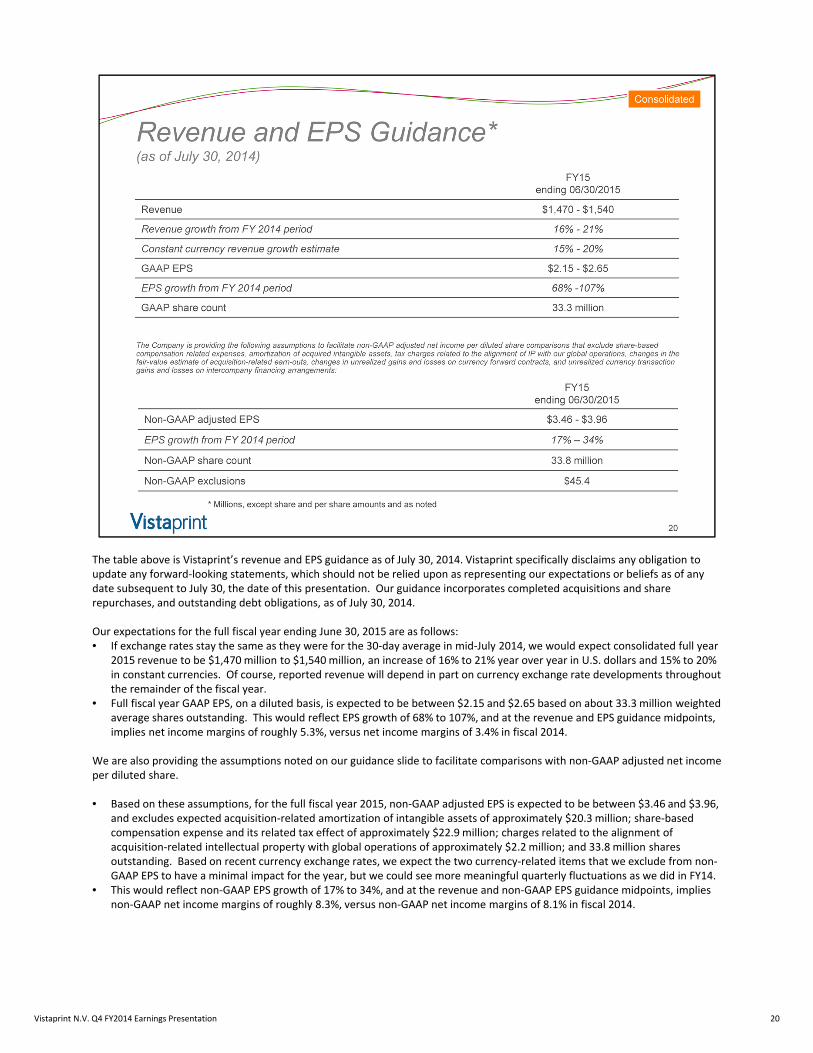
20
The table above is Vistaprint’s revenue and EPS guidance as of July 30, 2014. Vistaprint specifically disclaims any obligation to update any forward‐looking statements, which should not be relied upon as representing our expectations or beliefs as of any date subsequent to July 30, the date of this presentation. Our guidance incorporates completed acquisitions and share repurchases, and outstanding debt obligations, as of July 30, 2014.
Our expectations for the full fiscal year ending June 30, 2015 are as follows: • If exchange rates stay the same as they were for the 30‐day average in mid‐July 2014, we would expect consolidated full year
2015 revenue to be $1,470 million to $1,540 million, an increase of 16% to 21% year over year in U.S. dollars and 15% to 20% in constant currencies. Of course, reported revenue will depend in part on currency exchange rate developments throughout the remainder of the fiscal year.
• Full fiscal year GAAP EPS, on a diluted basis, is expected to be between $2.15 and $2.65 based on about 33.3 million weighted average shares outstanding. This would reflect EPS growth of 68% to 107%, and at the revenue and EPS guidance midpoints, implies net income margins of roughly 5.3%, versus net income margins of 3.4% in fiscal 2014.
We are also providing the assumptions noted on our guidance slide to facilitate comparisons with non‐GAAP adjusted net income per diluted share.
• Based on these assumptions, for the full fiscal year 2015, non‐GAAP adjusted EPS is expected to be between $3.46 and $3.96, and excludes expected acquisition‐related amortization of intangible assets of approximately $20.3 million; share‐based compensation expense and its related tax effect of approximately $22.9 million; charges related to the alignment of acquisition‐related intellectual property with global operations of approximately $2.2 million; and 33.8 million shares outstanding. Based on recent currency exchange rates, we expect the two currency‐related items that we exclude from non‐GAAP EPS to have a minimal impact for the year, but we could see more meaningful quarterly fluctuations as we did in FY14.
• This would reflect non‐GAAP EPS growth of 17% to 34%, and at the revenue and non‐GAAP EPS guidance midpoints, implies non‐GAAP net income margins of roughly 8.3%, versus non‐GAAP net income margins of 8.1% in fiscal 2014.
Vistaprint N.V. Q4 FY2014 Earnings Presentation
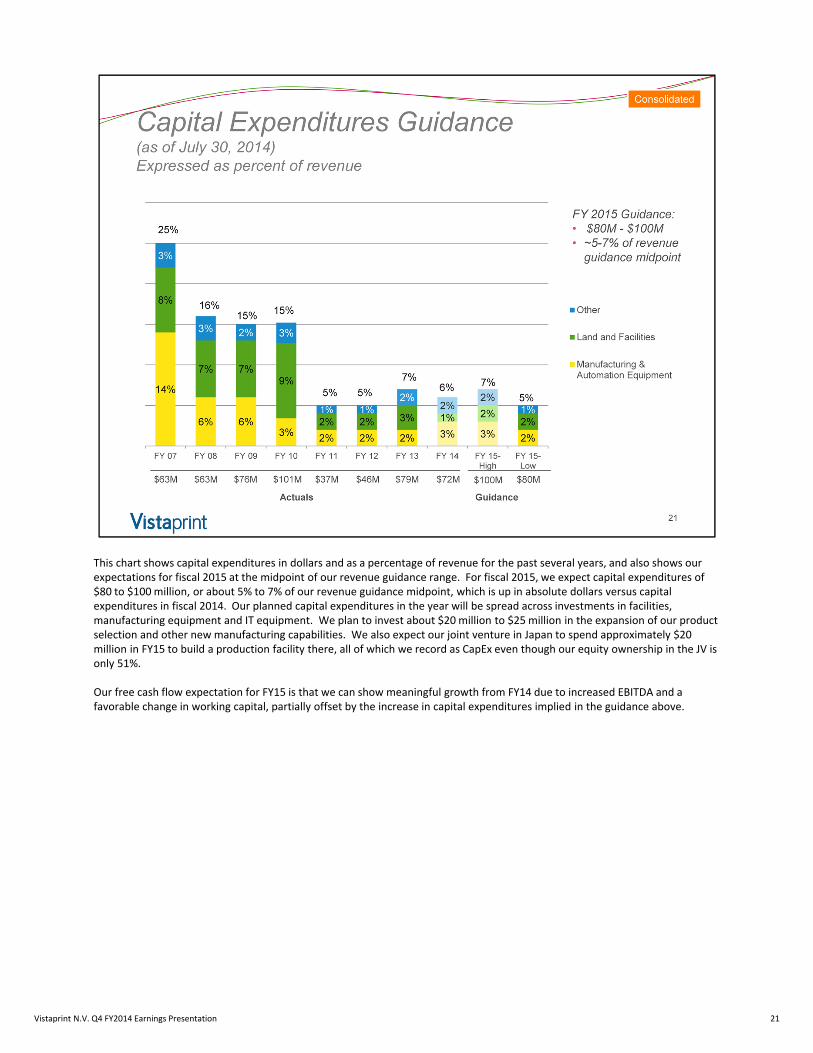
This chart shows capital expenditures in dollars and as a percentage of revenue for the past several years, and also shows our expectations for fiscal 2015 at the midpoint of our revenue guidance range. For fiscal 2015, we expect capital expenditures of $80 to $100 million, or about 5% to 7% of our revenue guidance midpoint, which is up in absolute dollars versus capital expenditures in fiscal 2014. Our planned capital expenditures in the year will be spread across investments in facilities, manufacturing equipment and IT equipment. We plan to invest about $20 million to $25 million in the expansion of our product selection and other new manufacturing capabilities. We also expect our joint venture in Japan to spend approximately $20 million in FY15 to build a production facility there, all of which we record as CapEx even though our equity ownership in the JV is only 51%.
Our free cash flow expectation for FY15 is that we can show meaningful growth from FY14 due to increased EBITDA and a favorable change in working capital, partially offset by the increase in capital expenditures implied in the guidance above.
21Vistaprint N.V. Q4 FY2014 Earnings Presentation
In summary, we continue to focus on our strategic and operational objectives. After three years of investment and focus on our manufacturing operations and technology, we are pleased with the competitive advances we have achieved. We plan on continuing to invest strongly in this operational capability going forward.
For our critical Vistaprint brand, we remain in the middle of a transformation of our value proposition that is longer and more arduous than anticipated three years ago, but which we continue to believe will position that brand for long‐term success. We are patient with our slower revenue growth because we are making strong progress on our strategic priorities, especially a much improved value proposition when viewed from the perspective of our target customers.
As we navigate these difficult revenue headwinds, we remain committed to evaluating decisions with financial discipline, specifically our returns on invested capital and advertising investments, and to invest for long‐term competitive advantage in the pursuit of strong financial returns. We believe that doing so will drive attainment of our ultimate financial goal to deliver a compounded annual growth rate in cash flow per share that, measured over the long term, is uniquely and highly attractive.
We look forward to speaking more about these topics at our Investor Day in New York and via webcast one week from today on August 6, 2014.
22Vistaprint N.V. Q4 FY2014 Earnings Presentation
Vistaprint N.V. Q4 FY2014 Earnings Presentation
Q&A SessionPlease go to theInvestor Relations section of www.vistaprint.comfor the live Q&A call at 5:15 pm EDT on July 29, 2014
Q4 & Fiscal Year 2014Financial and Operating Results Supplement
Vistaprint N.V. Q4 FY2014 Earnings Presentation
Quarterly Financial Results
25
$(0.05)
$0.66
$0.17
$0.07 $0.01
$1.18
$0.04 $0.03
$0.25
$1.02
$0.48 $0.41
$0.45
$1.50
$0.24
$0.75
Q1 FY13 Q2 FY13 Q3 FY13 Q4 FY13 Q1 FY14 Q2 FY14 Q3 FY14 Q4 FY14
GAAP EPS*
Non-GAAP EPS*
Revenue for the consolidated business includes Albumprinter, Webs, Japan JV, and People & Print Group and Pixartprinting as of the dates of acquisition.
Please see reconciliation of non-GAAP measures at the end of this presentation.
* Per diluted share
$251
$348
$288$280 $275
$371
$286
$338
Q1 FY13 Q2 FY13 Q3 FY13 Q4 FY13 Q1 FY14 Q2 FY14 Q3 FY14 Q4 FY14
Consolidated Revenue
Consolidated
-5%
0%
5%
10%
15%
20%
25%
30%
Q1 FY12 Q2 FY12* Q3 FY12 Q4 FY12 Q1 FY13 Q2 FY13 Q3 FY13 Q4 FY13 Q1 FY14 Q2 FY14 Q3 FY14 Q4 FY14
Constant-Currency
Reported
Total Company Growth Rates*
*Starting in Q2FY2012, revenue from Webs and Albumprinter acquisitions included. Starting in Q4 FY2014, revenue from People & Print Group and Pixartprinting included.
Please see reconciliation to reported revenue growth rates at the end of this presentation.
9%reported
8% constant-currency
26
FY1225% constant-currency growth
FY1316% constant-currency growth
Consolidated
FY148% constant-currency growth
Vistaprint N.V. Q4 FY2014 Earnings Presentation
17%20%
23%
21%
22%20%
15%
18%
15% 14%
3%
7%
-10%
0%
10%
20%
30%
40%
50%
North America
Segment Revenue Growth Rates*Constant Currency
27
45%
37%40%
33%
29%
24%
10%8%
2%
6%10%
8%
-10%
0%
10%
20%
30%
40%
50%
APAC
21%
37%
34%
30%
23%
14%
8%
2% 2%
-2%
-7%
43%
-10%
0%
10%
20%
30%
40%
50%
Europe
*All acquisitions included as of acquisition dates. Q4 FY2014 trend in Europe significantly altered by addition of People & Print Group and Pixartprinting.
Please see reconciliation to reported revenue growth rates at the end of this presentation.
Consolidated
$134
$200
$169 $162 $163
$234
$189 $181 $179
$250
$185
$205
63.2%66.8% 65.5% 64.6% 65.0%
67.2%65.5% 64.6% 65.2%
67.4%64.7%
60.5%
Q1 FY12 Q2 FY12 Q3 FY12 Q4 FY12 Q1 FY13 Q2 FY13 Q3 FY13 Q4 FY13 Q1 FY14 Q2 FY14 Q3 FY14 Q4 FY14
Gross Profit (millions) GM %
Gross Margin and Gross Profit
28
FY12 65.2%
Consolidated
FY13 65.7% FY14 64.5%
Vistaprint N.V. Q4 FY2014 Earnings Presentation
GAAP Net Income (Loss) and Net Margin
$8
$32
$0
$4
$(2)
$23
$6
$2 $0
$41
$1 $1
3.8%
10.6%
0.1%
1.5%
-0.7%
6.6%
2.0%
0.8%0.1%
11.0%
0.5%0.3%
-1.5%
0.5%
2.5%
4.5%
6.5%
8.5%
10.5%
12.5%
14.5%
$(4)
$1
$6
$11
$16
$21
$26
$31
$36
$41
$46
$51
$56
Q1 FY12 Q2 FY12 Q3 FY12 Q4 FY12 Q1 FY13 Q2 FY13 Q3 FY13 Q4 FY13 Q1 FY14 Q2 FY14 Q3 FY14 Q4 FY14
GAAP Net Income (loss), in millions GAAP Net Margin
29
FY12 $44
Consolidated
FY13 $29 FY14 $44
Non-GAAP Adjusted Net Income* and Non-GAAP Adjusted Net Margin
$13
$38
$11
$15
$9
$36
$17
$14 $16
$53
$8
$26
6.1%
12.6%
4.4%
5.9%
3.5%
10.3%
5.9%5.0% 5.9%
14.2%
2.9%
7.6%
Q1 FY12 Q2 FY12 Q3 FY12 Q4 FY12 Q1 FY13 Q2 FY13 Q3 FY13 Q4 FY13 Q1 FY14 Q2 FY14 Q3 FY14 Q4 FY14
Non-GAAP Adjusted Net Income (millions) Non-GAAP Adjusted Net Margin
Please see reconciliation of non-GAAP measures at the end of this presentation. 30
FY12 $77
Consolidated
FY13 $76 FY14 $103
Vistaprint N.V. Q4 FY2014 Earnings Presentation
Fiscal Year Income Statement(as a percentage of revenue)
6.8% 4.0%
9.2%9.4%
13.9% 14.1%
34.6% 38.2%
35.5% 34.3%
FY2014 FY2013
Cost of revenue
Marketing and selling
Technology and development
General and administrative
Income from operations
31
Consolidated
Q4 Income Statement Comparison to Prior Year(as a percentage of revenue)
5.8%1.1%
9.3%11.4%
14.4% 15.8%
31.0% 36.3%
39.5% 35.4%
Q4 FY2014 Q4 FY2013
Cost of revenue
Marketing and selling
Technology and development
General and administrative
Income from operations
32
Consolidated
Vistaprint N.V. Q4 FY2014 Earnings Presentation
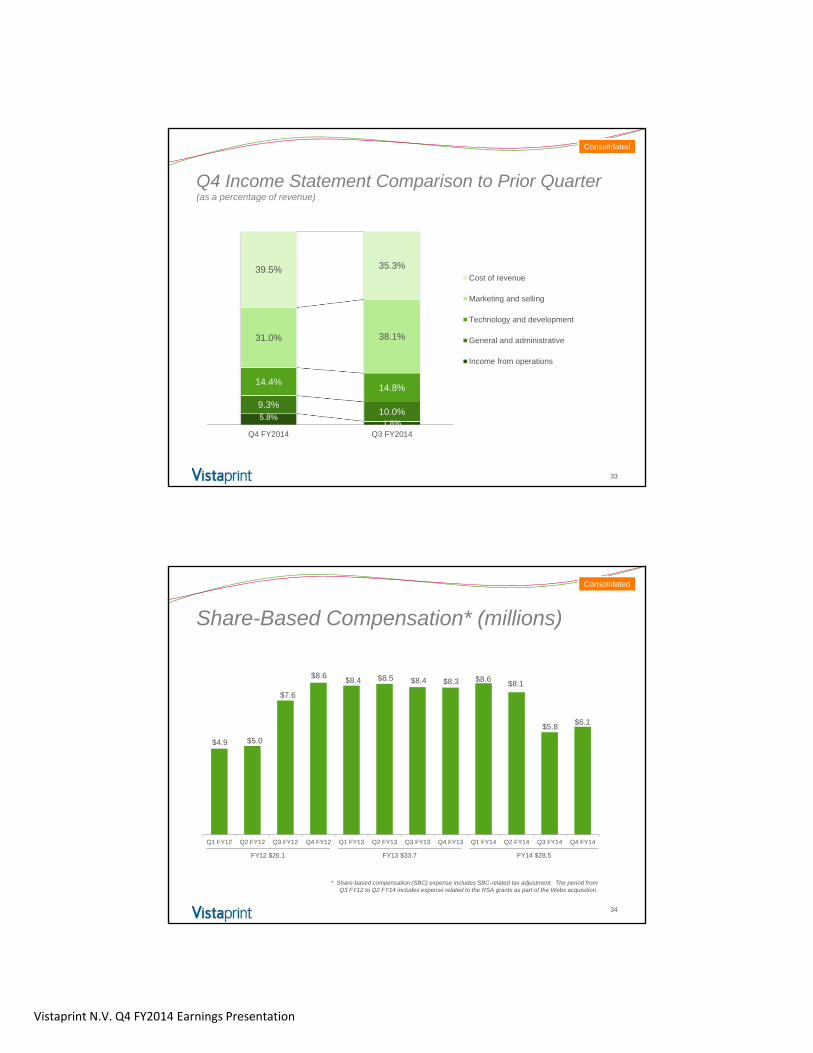
Q4 Income Statement Comparison to Prior Quarter(as a percentage of revenue)
5.8%1.8%
9.3%10.0%
14.4%14.8%
31.0% 38.1%
39.5% 35.3%
Q4 FY2014 Q3 FY2014
Cost of revenue
Marketing and selling
Technology and development
General and administrative
Income from operations
33
Consolidated
$4.9 $5.0
$7.6
$8.6 $8.4 $8.5 $8.4 $8.3 $8.6
$8.1
$5.8 $6.1
Q1 FY12 Q2 FY12 Q3 FY12 Q4 FY12 Q1 FY13 Q2 FY13 Q3 FY13 Q4 FY13 Q1 FY14 Q2 FY14 Q3 FY14 Q4 FY14
Share-Based Compensation* (millions)
* Share-based compensation (SBC) expense includes SBC-related tax adjustment. The period from Q3 FY12 to Q2 FY14 includes expense related to the RSA grants as part of the Webs acquisition.
34
FY12 $26.1
Consolidated
FY13 $33.7 FY14 $28.5
Vistaprint N.V. Q4 FY2014 Earnings Presentation
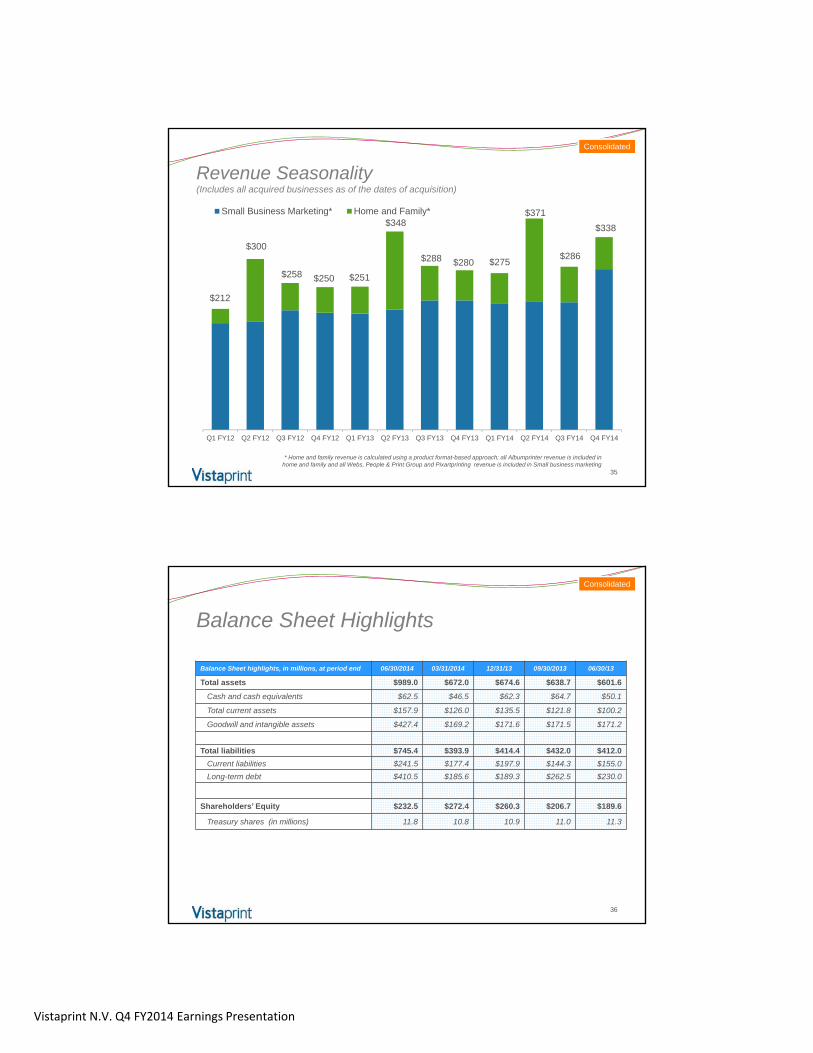
$212
$300
$258 $250 $251
$348
$288 $280 $275
$371
$286
Q1 FY12 Q2 FY12 Q3 FY12 Q4 FY12 Q1 FY13 Q2 FY13 Q3 FY13 Q4 FY13 Q1 FY14 Q2 FY14 Q3 FY14 Q4 FY14
Small Business Marketing* Home and Family*
Revenue Seasonality(Includes all acquired businesses as of the dates of acquisition)
* Home and family revenue is calculated using a product format-based approach; all Albumprinter revenue is included in home and family and all Webs, People & Print Group and Pixartprinting revenue is included in Small business marketing
35
Consolidated
$338
Balance Sheet Highlights
Balance Sheet highlights, in millions, at period end 06/30/2014 03/31/2014 12/31/13 09/30/2013 06/30/13
Total assets $989.0 $672.0 $674.6 $638.7 $601.6
Cash and cash equivalents $62.5 $46.5 $62.3 $64.7 $50.1
Total current assets $157.9 $126.0 $135.5 $121.8 $100.2
Goodwill and intangible assets $427.4 $169.2 $171.6 $171.5 $171.2
Total liabilities $745.4 $393.9 $414.4 $432.0 $412.0
Current liabilities $241.5 $177.4 $197.9 $144.3 $155.0
Long-term debt $410.5 $185.6 $189.3 $262.5 $230.0
Shareholders’ Equity $232.5 $272.4 $260.3 $206.7 $189.6
Treasury shares (in millions) 11.8 10.8 10.9 11.0 11.3
36
Consolidated
Vistaprint N.V. Q4 FY2014 Earnings Presentation
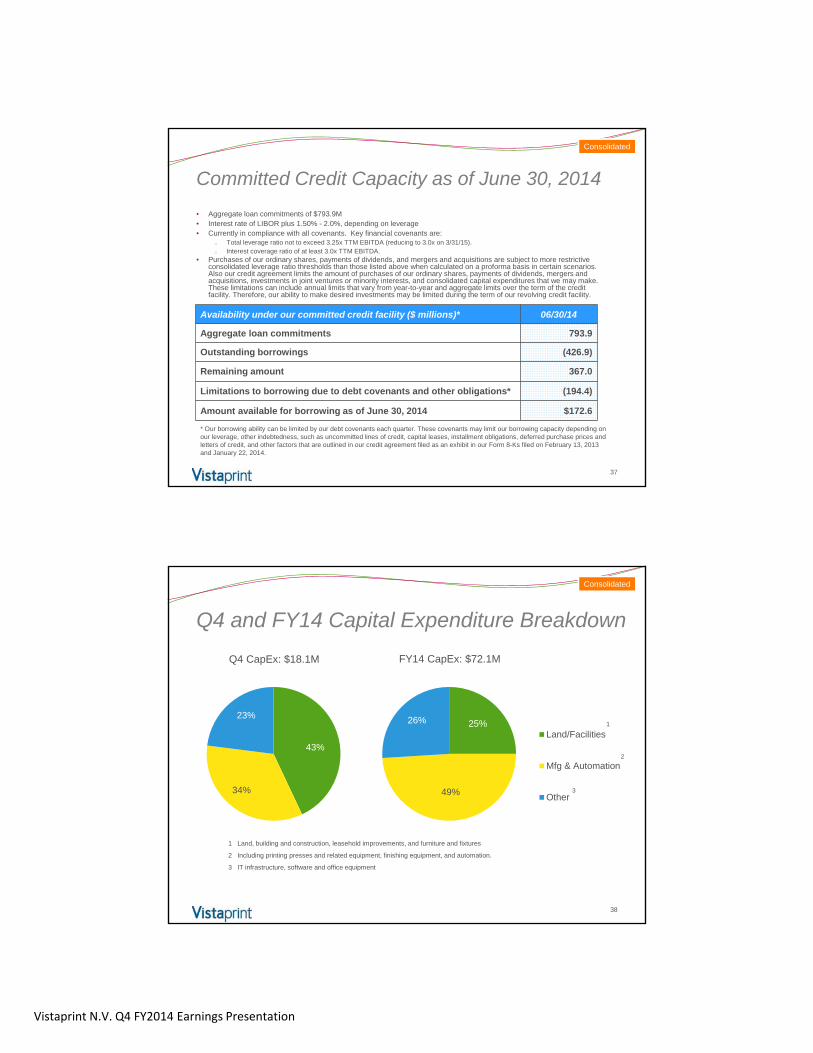
Committed Credit Capacity as of June 30, 2014
Availability under our committed credit facility ($ millions)* 06/30/14
Aggregate loan commitments 793.9
Outstanding borrowings (426.9)
Remaining amount 367.0
Limitations to borrowing due to debt covenants and other obligations* (194.4)
Amount available for borrowing as of June 30, 2014 $172.6
37
Consolidated
• Aggregate loan commitments of $793.9M • Interest rate of LIBOR plus 1.50% - 2.0%, depending on leverage• Currently in compliance with all covenants. Key financial covenants are:
o Total leverage ratio not to exceed 3.25x TTM EBITDA (reducing to 3.0x on 3/31/15).o Interest coverage ratio of at least 3.0x TTM EBITDA.
• Purchases of our ordinary shares, payments of dividends, and mergers and acquisitions are subject to more restrictive consolidated leverage ratio thresholds than those listed above when calculated on a proforma basis in certain scenarios. Also our credit agreement limits the amount of purchases of our ordinary shares, payments of dividends, mergers and acquisitions, investments in joint ventures or minority interests, and consolidated capital expenditures that we may make. These limitations can include annual limits that vary from year-to-year and aggregate limits over the term of the credit facility. Therefore, our ability to make desired investments may be limited during the term of our revolving credit facility.
* Our borrowing ability can be limited by our debt covenants each quarter. These covenants may limit our borrowing capacity depending on our leverage, other indebtedness, such as uncommitted lines of credit, capital leases, installment obligations, deferred purchase prices and letters of credit, and other factors that are outlined in our credit agreement filed as an exhibit in our Form 8-Ks filed on February 13, 2013 and January 22, 2014.
43%
34%
23%
Q4 and FY14 Capital Expenditure Breakdown
Q4 CapEx: $18.1M
1
3
2
1 Land, building and construction, leasehold improvements, and furniture and fixtures
2 Including printing presses and related equipment, finishing equipment, and automation.
3 IT infrastructure, software and office equipment
38
Consolidated
FY14 CapEx: $72.1M
25%
49%
26%
Land/Facilities
Mfg & Automation
Other
Vistaprint N.V. Q4 FY2014 Earnings Presentation
AppendixIncluding a Reconciliation of GAAP to Non-GAAP Financial Measures
About non-GAAP financial measures
To supplement Vistaprint’s consolidated financial statements presented in accordance with U.S. generally accepted accounting principles, or GAAP, Vistaprint has used the following measures defined as non-GAAP financial measures by Securities and Exchange Commission, or SEC, rules: non-GAAP adjusted net income, non-GAAP adjusted net income per diluted share, free cash flow, trailing twelve month return on invested capital, constant-currency revenue growth and constant-currency revenue growth excluding revenue from fiscal 2014 acquisitions. Please see the next slide for definitions of these items.
The presentation of non-GAAP financial information is not intended to be considered in isolation or as a substitute for the financial information prepared and presented in accordance with GAAP. For more information on these non-GAAP financial measures, please see the tables captioned “Reconciliations of Non-GAAP Financial Measures” included at the end of this release. The tables have more details on the GAAP financial measures that are most directly comparable to non-GAAP financial measures and the related reconciliation between these financial measures.
Vistaprint’s management believes that these non-GAAP financial measures provide meaningful supplemental information in assessing our performance and liquidity by excluding certain items that may not be indicative of our recurring core business operating results, which could be non-cash charges or discrete cash charges that are infrequent in nature. These non-GAAP financial measures also have facilitated management’s internal comparisons to Vistaprint’s historical performance and our competitors’ operating results.
40
Vistaprint N.V. Q4 FY2014 Earnings Presentation
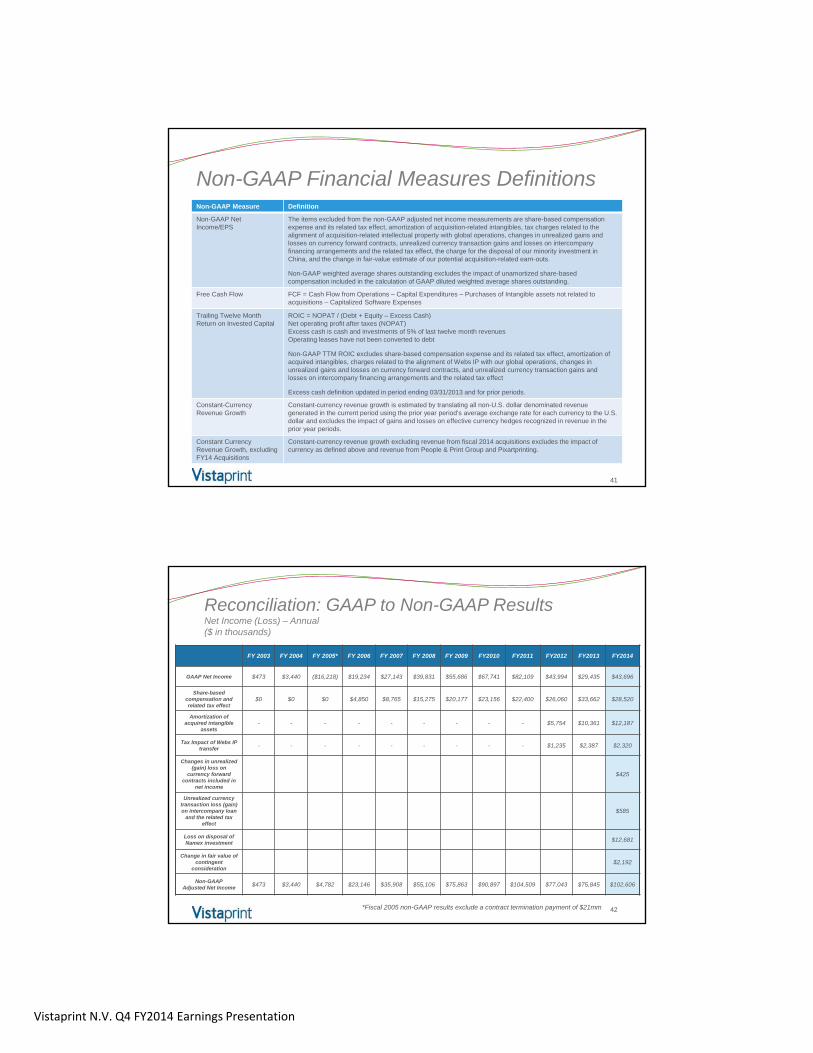
Non-GAAP Financial Measures Definitions
41
Non-GAAP Measure Definition
Non-GAAP Net Income/EPS
The items excluded from the non-GAAP adjusted net income measurements are share-based compensation expense and its related tax effect, amortization of acquisition-related intangibles, tax charges related to the alignment of acquisition-related intellectual property with global operations, changes in unrealized gains and losses on currency forward contracts, unrealized currency transaction gains and losses on intercompany financing arrangements and the related tax effect, the charge for the disposal of our minority investment in China, and the change in fair-value estimate of our potential acquisition-related earn-outs.
Non-GAAP weighted average shares outstanding excludes the impact of unamortized share-based compensation included in the calculation of GAAP diluted weighted average shares outstanding.
Free Cash Flow FCF = Cash Flow from Operations – Capital Expenditures – Purchases of Intangible assets not related to acquisitions – Capitalized Software Expenses
Trailing Twelve Month Return on Invested Capital
ROIC = NOPAT / (Debt + Equity – Excess Cash)Net operating profit after taxes (NOPAT)Excess cash is cash and investments of 5% of last twelve month revenuesOperating leases have not been converted to debt
Non-GAAP TTM ROIC excludes share-based compensation expense and its related tax effect, amortization of acquired intangibles, charges related to the alignment of Webs IP with our global operations, changes in unrealized gains and losses on currency forward contracts, and unrealized currency transaction gains and losses on intercompany financing arrangements and the related tax effect
Excess cash definition updated in period ending 03/31/2013 and for prior periods.
Constant-CurrencyRevenue Growth
Constant-currency revenue growth is estimated by translating all non-U.S. dollar denominated revenue generated in the current period using the prior year period’s average exchange rate for each currency to the U.S. dollar and excludes the impact of gains and losses on effective currency hedges recognized in revenue in the prior year periods.
Constant Currency Revenue Growth, excluding FY14 Acquisitions
Constant-currency revenue growth excluding revenue from fiscal 2014 acquisitions excludes the impact of currency as defined above and revenue from People & Print Group and Pixartprinting.
*Fiscal 2005 non-GAAP results exclude a contract termination payment of $21mm 42
Reconciliation: GAAP to Non-GAAP ResultsNet Income (Loss) – Annual($ in thousands)
FY 2003 FY 2004 FY 2005* FY 2006 FY 2007 FY 2008 FY 2009 FY2010 FY2011 FY2012 FY2013 FY2014
GAAP Net Income $473 $3,440 ($16,218) $19,234 $27,143 $39,831 $55,686 $67,741 $82,109 $43,994 $29,435 $43,696
Share-based compensation and related tax effect
$0 $0 $0 $4,850 $8,765 $15,275 $20,177 $23,156 $22,400 $26,060 $33,662 $28,520
Amortization of acquired intangible
assets- - - - - - - - - $5,754 $10,361 $12,187
Tax Impact of Webs IP transfer - - - - - - - - - $1,235 $2,387 $2,320
Changes in unrealized (gain) loss on
currency forward contracts included in
net income
$425
Unrealized currency transaction loss (gain) on intercompany loan
and the related tax effect
$585
Loss on disposal of Namex investment $12,681
Change in fair value of contingent
consideration$2,192
Non-GAAPAdjusted Net Income $473 $3,440 $4,782 $23,146 $35,908 $55,106 $75,863 $90,897 $104,509 $77,043 $75,845 $102,606
Vistaprint N.V. Q4 FY2014 Earnings Presentation
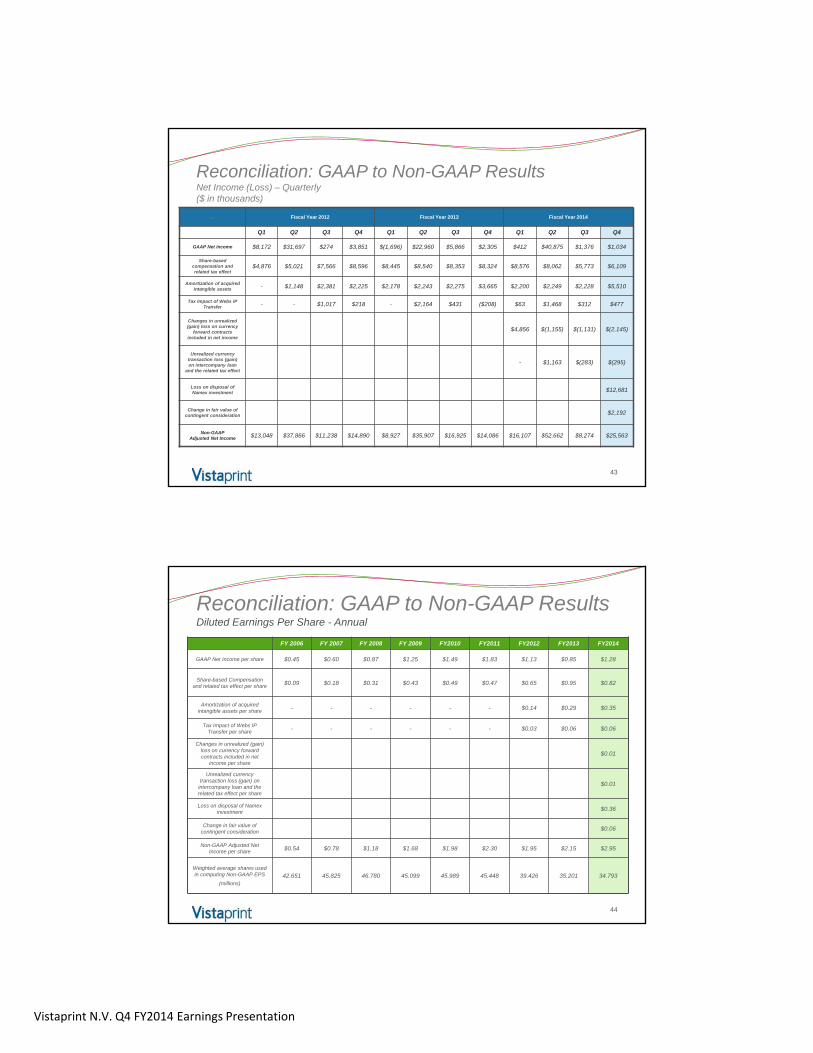
Reconciliation: GAAP to Non-GAAP ResultsNet Income (Loss) – Quarterly($ in thousands)
43
. Fiscal Year 2012 Fiscal Year 2013 Fiscal Year 2014
Q1 Q2 Q3 Q4 Q1 Q2 Q3 Q4 Q1 Q2 Q3 Q4
GAAP Net Income $8,172 $31,697 $274 $3,851 $(1,696) $22,960 $5,866 $2,305 $412 $40,875 $1,376 $1,034
Share-based compensation and related tax effect
$4,876 $5,021 $7,566 $8,596 $8,445 $8,540 $8,353 $8,324 $8,576 $8,062 $5,773 $6,109
Amortization of acquired intangible assets - $1,148 $2,381 $2,225 $2,178 $2,243 $2,275 $3,665 $2,200 $2,249 $2,228 $5,510
Tax Impact of Webs IP Transfer - - $1,017 $218 - $2,164 $431 ($208) $63 $1,468 $312 $477
Changes in unrealized (gain) loss on currency
forward contracts included in net income
$4,856 $(1,155) $(1,131) $(2,145)
Unrealized currency transaction loss (gain) on intercompany loan
and the related tax effect
- $1,163 $(283) $(295)
Loss on disposal of Namex investment $12,681
Change in fair value of contingent consideration $2,192
Non-GAAPAdjusted Net Income $13,048 $37,866 $11,238 $14,890 $8,927 $35,907 $16,925 $14,086 $16,107 $52,662 $8,274 $25,563
Reconciliation: GAAP to Non-GAAP ResultsDiluted Earnings Per Share - Annual
44
FY 2006 FY 2007 FY 2008 FY 2009 FY2010 FY2011 FY2012 FY2013 FY2014
GAAP Net Income per share $0.45 $0.60 $0.87 $1.25 $1.49 $1.83 $1.13 $0.85 $1.28
Share-based Compensation and related tax effect per share $0.09 $0.18 $0.31 $0.43 $0.49 $0.47 $0.65 $0.95 $0.82
Amortization of acquired intangible assets per share - - - - - - $0.14 $0.29 $0.35
Tax Impact of Webs IP Transfer per share - - - - - - $0.03 $0.06 $0.06
Changes in unrealized (gain) loss on currency forward contracts included in net
income per share
$0.01
Unrealized currency transaction loss (gain) on
intercompany loan and the related tax effect per share
$0.01
Loss on disposal of Namexinvestment $0.36
Change in fair value of contingent consideration $0.06
Non-GAAP Adjusted Net Income per share $0.54 $0.78 $1.18 $1.68 $1.98 $2.30 $1.95 $2.15 $2.95
Weighted average shares used in computing Non-GAAP EPS
(millions)42.651 45.825 46.780 45.099 45.989 45.448 39.426 35.201 34.793
Vistaprint N.V. Q4 FY2014 Earnings Presentation
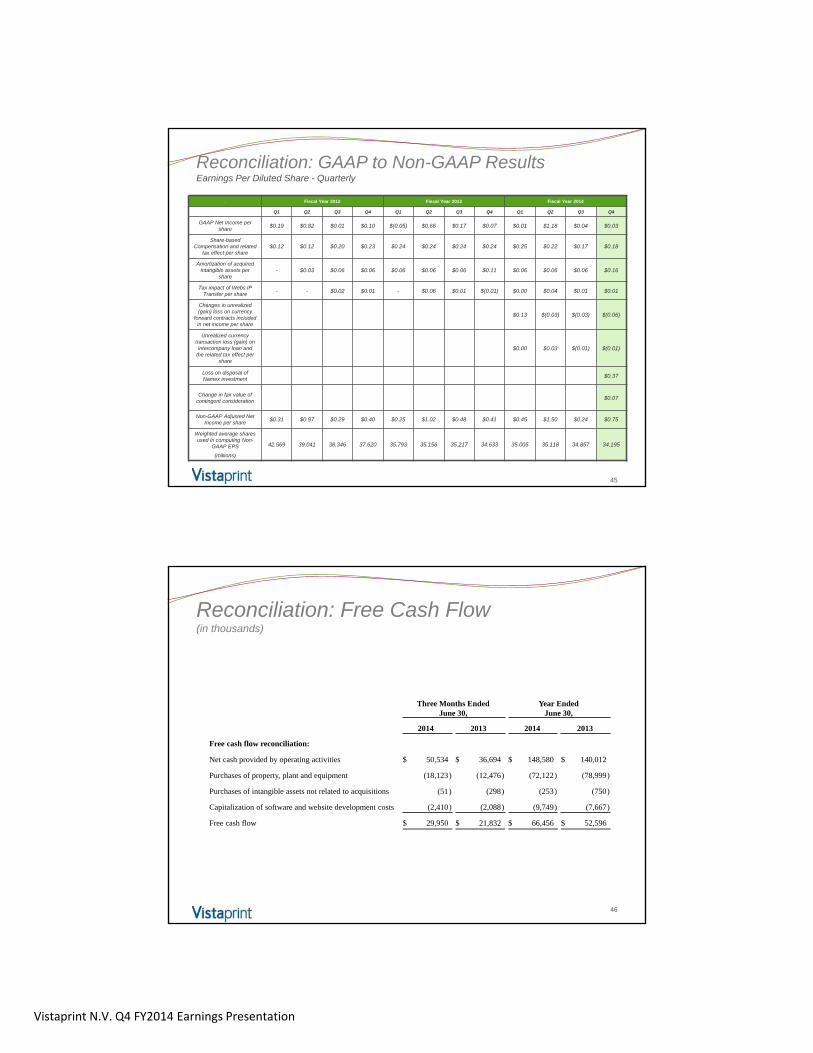
Reconciliation: GAAP to Non-GAAP ResultsEarnings Per Diluted Share - Quarterly
45
. Fiscal Year 2012 Fiscal Year 2013 Fiscal Year 2014
Q1 Q2 Q3 Q4 Q1 Q2 Q3 Q4 Q1 Q2 Q3 Q4
GAAP Net Income per share
$0.19 $0.82 $0.01 $0.10 $(0.05) $0.66 $0.17 $0.07 $0.01 $1.18 $0.04 $0.03
Share-based Compensation and related
tax effect per share$0.12 $0.12 $0.20 $0.23 $0.24 $0.24 $0.24 $0.24 $0.25 $0.22 $0.17 $0.18
Amortization of acquired intangible assets per
share- $0.03 $0.06 $0.06 $0.06 $0.06 $0.06 $0.11 $0.06 $0.06 $0.06 $0.16
Tax impact of Webs IP Transfer per share
- - $0.02 $0.01 - $0.06 $0.01 $(0.01) $0.00 $0.04 $0.01 $0.01
Changes in unrealized (gain) loss on currency
forward contracts included in net income per share
$0.13 $(0.03) $(0.03) $(0.06)
Unrealized currency transaction loss (gain) on intercompany loan and
the related tax effect per share
$0.00 $0.03 $(0.01) $(0.01)
Loss on disposal of Namex investment
$0.37
Change in fair value of contingent consideration
$0.07
Non-GAAP Adjusted Net Income per share
$0.31 $0.97 $0.29 $0.40 $0.25 $1.02 $0.48 $0.41 $0.45 $1.50 $0.24 $0.75
Weighted average shares used in computing Non-
GAAP EPS
(millions)
42.569 39.041 38.346 37.620 35.793 35.156 35.217 34.633 35.005 35.118 34.857 34.195
Reconciliation: Free Cash Flow(in thousands)
46
Three Months EndedJune 30,
Year EndedJune 30,
2014 2013 2014 2013
Free cash flow reconciliation:
Net cash provided by operating activities $ 50,534 $ 36,694 $ 148,580 $ 140,012
Purchases of property, plant and equipment (18,123) (12,476) (72,122) (78,999)
Purchases of intangible assets not related to acquisitions (51) (298) (253) (750)
Capitalization of software and website development costs (2,410) (2,088) (9,749) (7,667)
Free cash flow $ 29,950 $ 21,832 $ 66,456 $ 52,596
Vistaprint N.V. Q4 FY2014 Earnings Presentation
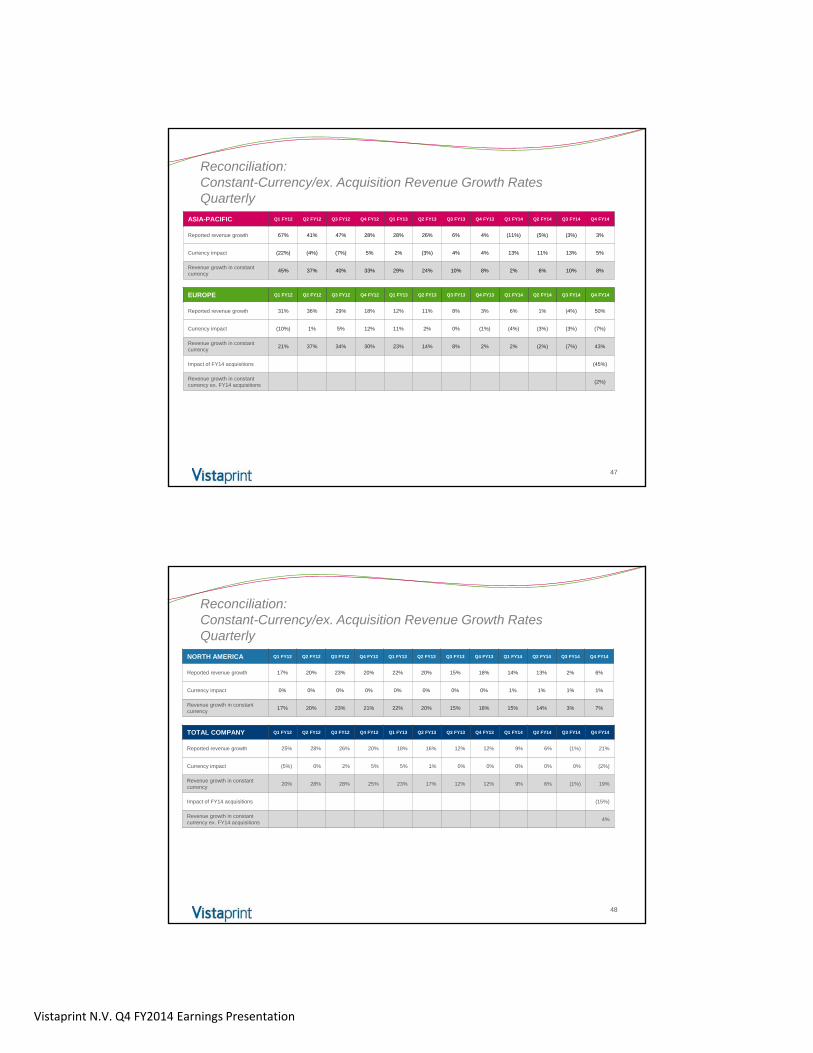
Reconciliation:Constant-Currency/ex. Acquisition Revenue Growth RatesQuarterly
47
ASIA-PACIFIC Q1 FY12 Q2 FY12 Q3 FY12 Q4 FY12 Q1 FY13 Q2 FY13 Q3 FY13 Q4 FY13 Q1 FY14 Q2 FY14 Q3 FY14 Q4 FY14
Reported revenue growth 67% 41% 47% 28% 28% 26% 6% 4% (11%) (5%) (3%) 3%
Currency impact (22%) (4%) (7%) 5% 2% (3%) 4% 4% 13% 11% 13% 5%
Revenue growth in constant currency
45% 37% 40% 33% 29% 24% 10% 8% 2% 6% 10% 8%
EUROPE Q1 FY12 Q2 FY12 Q3 FY12 Q4 FY12 Q1 FY13 Q2 FY13 Q3 FY13 Q4 FY13 Q1 FY14 Q2 FY14 Q3 FY14 Q4 FY14
Reported revenue growth 31% 36% 29% 18% 12% 11% 8% 3% 6% 1% (4%) 50%
Currency impact (10%) 1% 5% 12% 11% 2% 0% (1%) (4%) (3%) (3%) (7%)
Revenue growth in constant currency
21% 37% 34% 30% 23% 14% 8% 2% 2% (2%) (7%) 43%
Impact of FY14 acquisitions (45%)
Revenue growth in constant currency ex. FY14 acquisitions
(2%)
Reconciliation:Constant-Currency/ex. Acquisition Revenue Growth RatesQuarterly
48
NORTH AMERICA Q1 FY12 Q2 FY12 Q3 FY12 Q4 FY12 Q1 FY13 Q2 FY13 Q3 FY13 Q4 FY13 Q1 FY14 Q2 FY14 Q3 FY14 Q4 FY14
Reported revenue growth 17% 20% 23% 20% 22% 20% 15% 18% 14% 13% 2% 6%
Currency impact 0% 0% 0% 0% 0% 0% 0% 0% 1% 1% 1% 1%
Revenue growth in constant currency
17% 20% 23% 21% 22% 20% 15% 18% 15% 14% 3% 7%
TOTAL COMPANY Q1 FY12 Q2 FY12 Q3 FY12 Q4 FY12 Q1 FY13 Q2 FY13 Q3 FY13 Q4 FY13 Q1 FY14 Q2 FY14 Q3 FY14 Q4 FY14
Reported revenue growth 25% 28% 26% 20% 18% 16% 12% 12% 9% 6% (1%) 21%
Currency impact (5%) 0% 2% 5% 5% 1% 0% 0% 0% 0% 0% (2%)
Revenue growth in constant currency
20% 28% 28% 25% 23% 17% 12% 12% 9% 6% (1%) 19%
Impact of FY14 acquisitions (15%)
Revenue growth in constant currency ex. FY14 acquisitions
4%
Vistaprint N.V. Q4 FY2014 Earnings Presentation
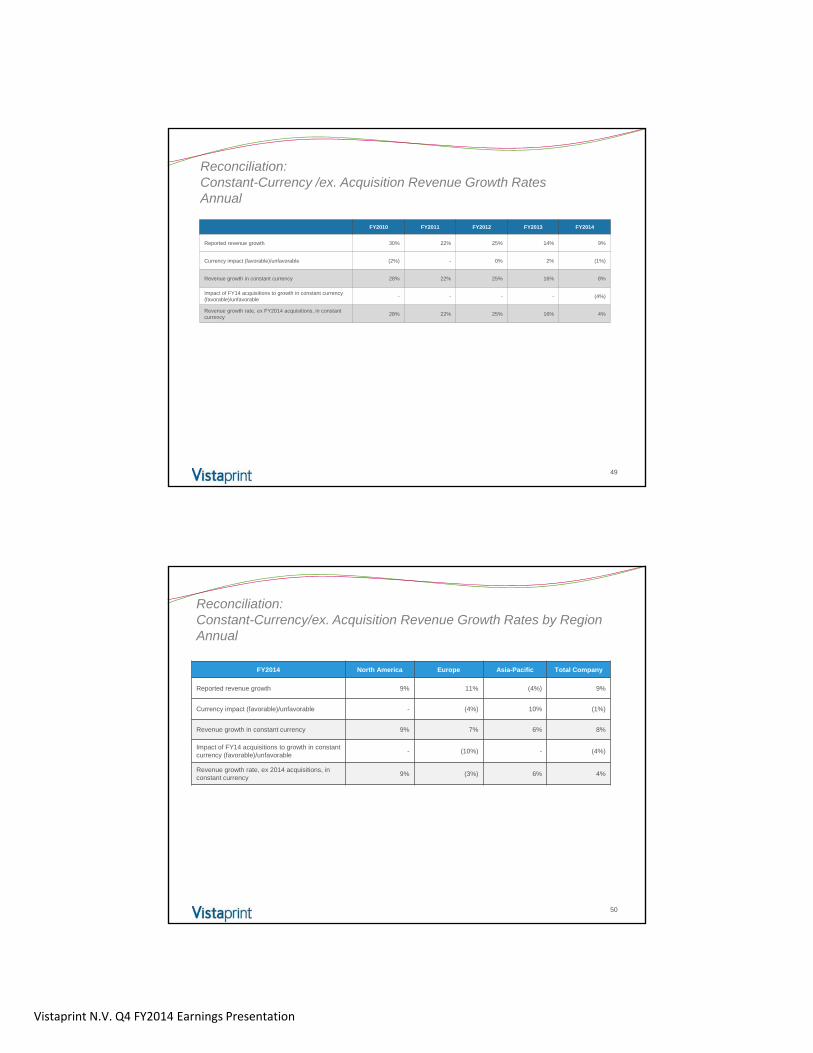
Reconciliation:Constant-Currency /ex. Acquisition Revenue Growth RatesAnnual
49
FY2010 FY2011 FY2012 FY2013 FY2014
Reported revenue growth 30% 22% 25% 14% 9%
Currency impact (favorable)/unfavorable (2%) - 0% 2% (1%)
Revenue growth in constant currency 28% 22% 25% 16% 8%
Impact of FY14 acquisitions to growth in constant currency (favorable)/unfavorable
- - - - (4%)
Revenue growth rate, ex FY2014 acquisitions, in constant currency
28% 22% 25% 16% 4%
50
FY2014 North America Europe Asia-Pacific Total Company
Reported revenue growth 9% 11% (4%) 9%
Currency impact (favorable)/unfavorable - (4%) 10% (1%)
Revenue growth in constant currency 9% 7% 6% 8%
Impact of FY14 acquisitions to growth in constant currency (favorable)/unfavorable
- (10%) - (4%)
Revenue growth rate, ex 2014 acquisitions, in constant currency
9% (3%) 6% 4%
Reconciliation:Constant-Currency/ex. Acquisition Revenue Growth Rates by RegionAnnual