Embed Size (px)
Citation preview
Q2 2016 ResultsJuly 21, 2016

Newmont Mining Corporation I Q2 2016 earnings I Slide 2July 21, 2016
Cautionary statement
This presentation contains “forward-looking statements” within the meaning of Section 27A of the Securities Act of 1933, as amended, and Section 21E of
the Securities Exchange Act of 1934, as amended, which are intended to be covered by the safe harbor created by such sections and other applicable
laws. Such forward-looking statements may include, without limitation: (i) estimates of future production and sales; (ii) estimates of future costs applicable
to sales and all-in sustaining costs; (iii) estimates of future capital expenditures; (iv) estimates of future cost reductions and efficiencies; (v) expectations
regarding the development, growth and potential of the Company’s operations, projects and investment, including, without limitation, returns, IRR,
schedule, commercial start and first production and upside; (vi) expectations regarding future debt repayments and reductions; (vii) expectations regarding
future free cash flow generation, liquidity and balance sheet strength; and (viii) expectations regarding the completion of the sale of the Company’s
interest in PTNNT, including, without limitation, the timing of closing, expected use of proceeds, anticipated receipt of sale consideration and contingent
payments, expected accounting impacts resulting from the proposed transaction, future operation and transition of Batu Hijau (including Phase 7) and
future development of Elang. Estimates or expectations of future events or results are based upon certain assumptions, which may prove to be incorrect.
Such assumptions, include, but are not limited to: (i) there being no significant change to current geotechnical, metallurgical, hydrological and other
physical conditions; (ii) permitting, development, operations and expansion of the Company’s operations and projects being consistent with current
expectations and mine plans, including without limitation receipt of export approvals; (iii) political developments in any jurisdiction in which the Company
operates being consistent with its current expectations; (iv) certain exchange rate assumptions for the Australian dollar to the U.S. dollar, as well as other
the exchange rates being approximately consistent with current levels; (v) certain price assumptions for gold, copper and oil; (vi) prices for key supplies
being approximately consistent with current levels; (vii) the accuracy of our current mineral reserve and mineralized material estimates; (viii) the
acceptable outcome of negotiation of the amendment to the Contract of Work and/or resolution of export issues in Indonesia; and (ix) other assumptions
noted herein. Investors are cautioned that no assurances can be made with respect to the closing of the pending sale of the Company’s interest in
PTNNT, which remains contingent on the receipt of regulatory approvals, buyer shareholder approval, and satisfaction of other conditions precedent,
including, without limitation, government approval of the PTNNT share transfer, maintenance of valid export license at closing, the concurrent closing of
the PTMDB sale of its 24 percent stake to the buyer, resolution of certain tax matters, and no occurrence of material adverse events that would
substantially impact the future value of Batu Hijau. Potential additional risks include other political, regulatory or legal challenges and community and labor
issues. The amount of contingent payment will also remain subject to risks and uncertainties, including copper prices and future production and
development at Batu Hijau and Elang. Where the Company expresses or implies an expectation or belief as to future events or results, such expectation
or belief is expressed in good faith and believed to have a reasonable basis. However, such statements are subject to risks, uncertainties and other
factors, which could cause actual results to differ materially from future results expressed, projected or implied by the “forward-looking statements”. Other
risks relating to forward looking statements in regard to the Company’s business and future performance may include, but are not limited to, gold and
other metals price volatility, currency fluctuations, increased production costs and variances in ore grade or recovery rates from those assumed in mining
plans, political and operational risks, community relations, conflict resolution and outcome of projects or oppositions and governmental regulation and
judicial outcomes. For a more detailed discussion of such risks and other factors, see the Company’s 2015 Annual Report on Form 10-K, filed on February
17, 2016, with the Securities and Exchange Commission (SEC), as well as the Company’s other SEC filings. The Company does not undertake any
obligation to release publicly revisions to any “forward-looking statement,” including, without limitation, outlook, to reflect events or circumstances after the
date of this presentation, or to reflect the occurrence of unanticipated events, except as may be required under applicable securities laws. Investors
should not assume that any lack of update to a previously issued “forward-looking statement” constitutes a reaffirmation of that statement. Continued
reliance on “forward-looking statements” is at investors' own risk. Investors are reminded that this presentation should be read in conjunction with
Newmont’s Form 10-Q expected to be filed on or about July 20, 2016 with the SEC (also available at www.newmont.com).

Overview – Gary Goldberg
Newmont Mining Corporation I Q2 2016 earnings I Slide 4July 21, 2016
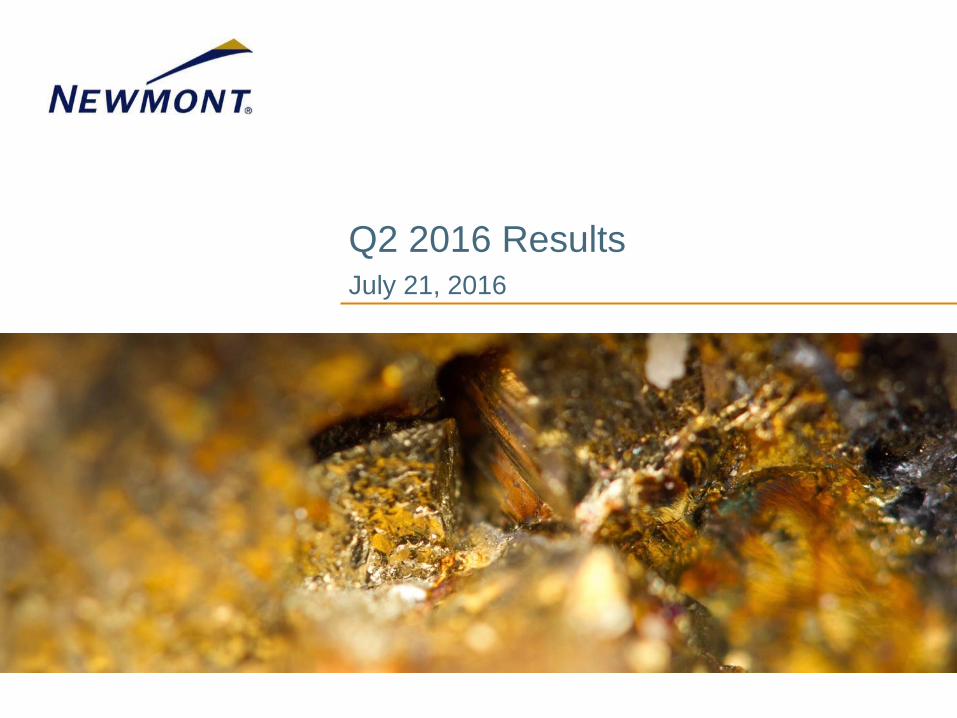
Continuing to improve performance and portfolio
Cripple Creek & Victor – Valley Leach facility
Improve
the
underlying
business
6% reduction in total injury rates from prior year quarter
$876/oz AISC1 down 4% from prior year quarter; 2016 outlook lowered $10/oz
1.3 Moz of attributable gold production up 7% from prior year quarter
Strengthen
the
portfolio
$2.8B in non-core asset sales upon closing of PTNNT sale
2 new mines, 3 expansions proceeding on schedule and at or below budget
Northwest Exodus approved and projected to produce first gold in Q3 2016
Create value
for
shareholders
$486M in free cash flow2 up $367M from prior year quarter
$804M in adjusted EBITDA3, up 16% from prior year quarter
13% reduction in net debt from prior year quarter and dividend maintained
Newmont Mining Corporation I Q2 2016 earnings I Slide 5July 21, 2016
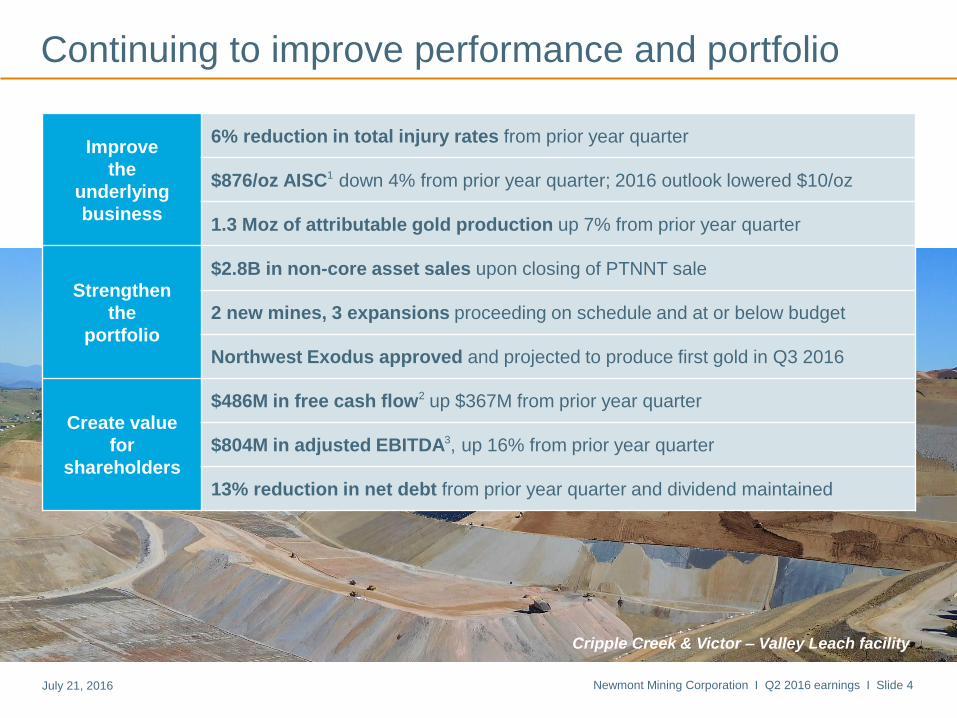
Recognized leaders in safety and sustainability
Injury rates (total recordable injuries per 200,000 hours worked)
Down 54% since 2012
0.65
0.470.39
0.32 0.31
0.00
0.20
0.40
0.60
0.80
2012 2013 2014 2015 2016YTD
Phoenix maintenance crew reaches 3 years working without injury
Newmont Mining Corporation I Q2 2016 earnings I Slide 6July 21, 2016
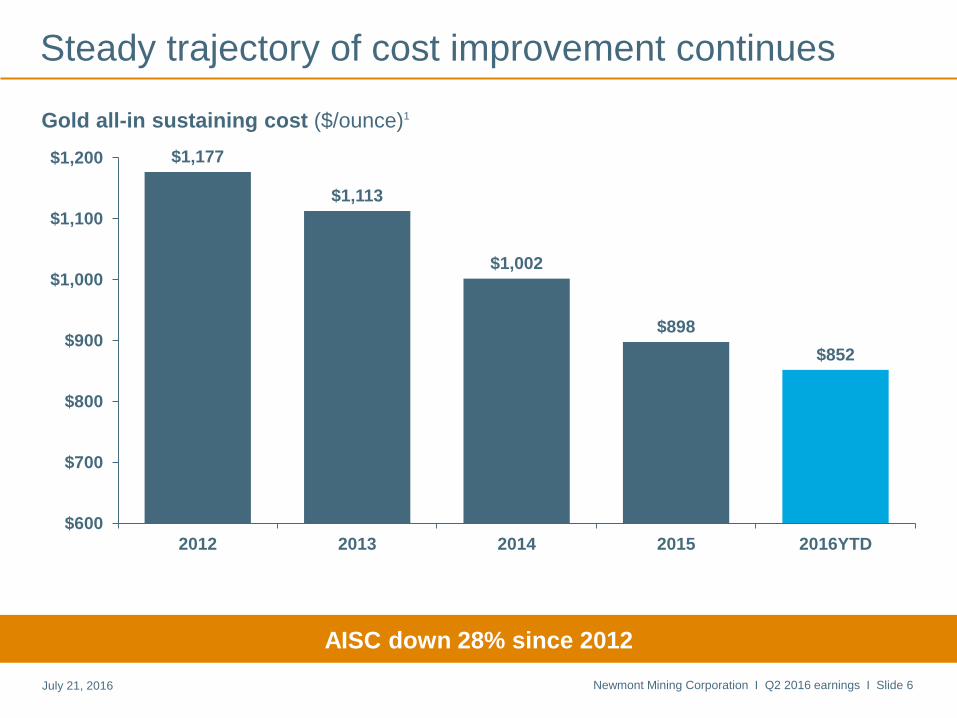
Steady trajectory of cost improvement continues
Gold all-in sustaining cost ($/ounce)1
Down 30% since 2012
$1,177
$1,113
$1,002
$898
$852
$600
$700
$800
$900
$1,000
$1,100
$1,200
2012 2013 2014 2015 2016YTD
AISC down 28% since 2012
Newmont Mining Corporation I Q2 2016 earnings I Slide 7July 21, 2016
0
1,000
2,000
3,000
4,000
5,000
2016 outlook(initial)
2016 outlook(w/o Batu Hijau)
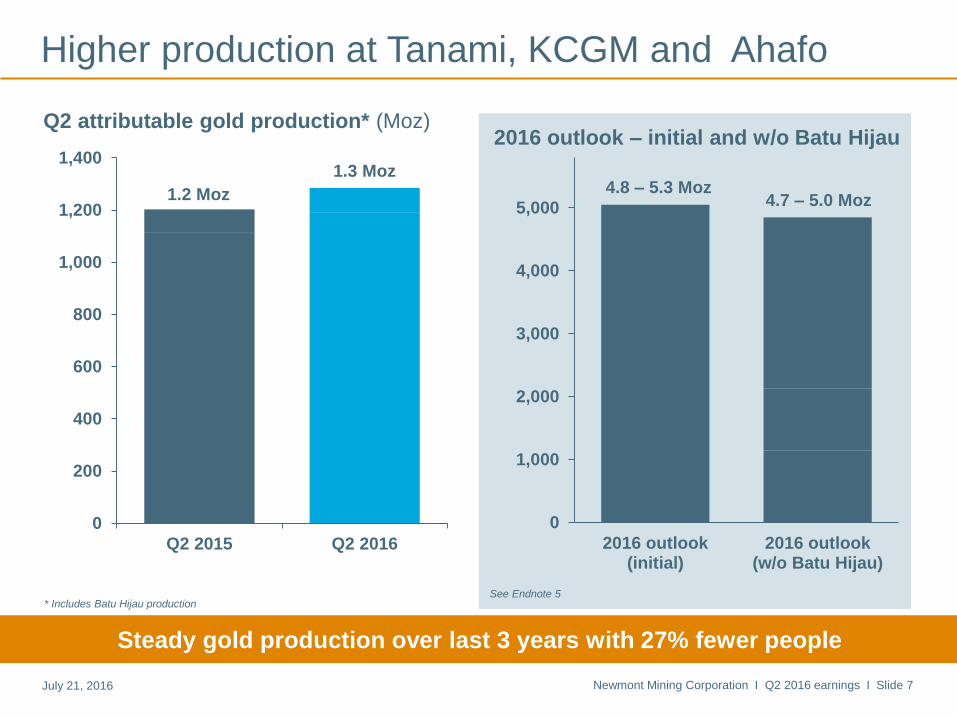
Higher production at Tanami, KCGM and Ahafo
Q2 attributable gold production* (Moz)2016 outlook – initial and w/o Batu Hijau
0
200
400
600
800
1,000
1,200
1,400
Q2 2015 Q2 2016
1.2 Moz
1.3 Moz
See Endnote 5
4.8 – 5.3 Moz4.7 – 5.0 Moz
Steady gold production over last 3 years with 27% fewer people
* Includes Batu Hijau production
Newmont Mining Corporation I Q2 2016 earnings I Slide 8July 21, 2016
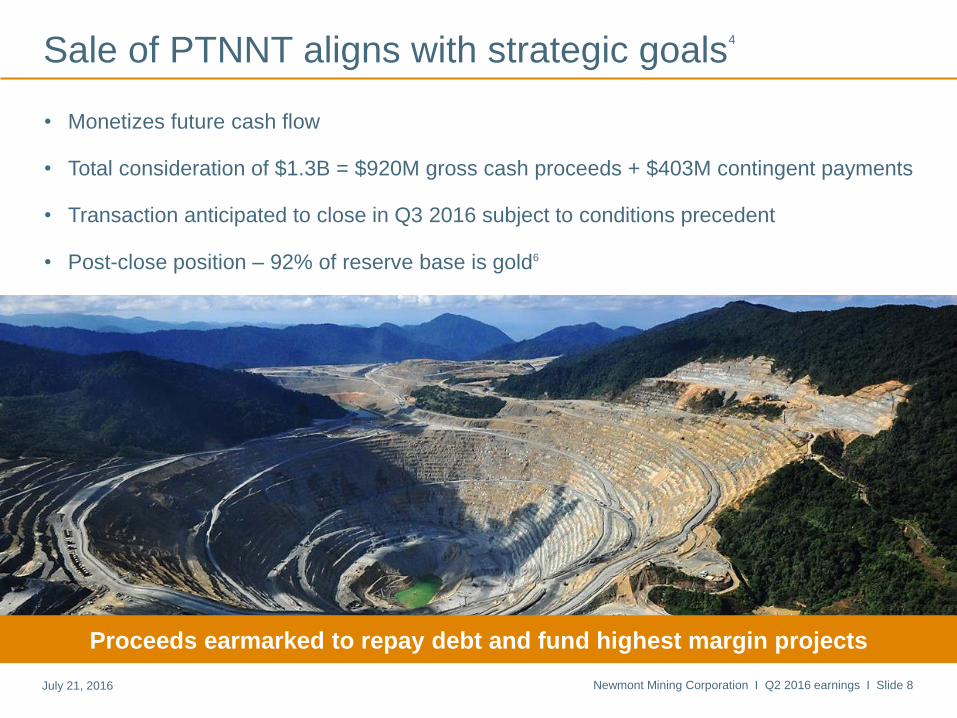
Sale of PTNNT aligns with strategic goals4
• Monetizes future cash flow
• Total consideration of $1.3B = $920M gross cash proceeds + $403M contingent payments
• Transaction anticipated to close in Q3 2016 subject to conditions precedent
• Post-close position – 92% of reserve base is gold6
Proceeds earmarked to repay debt and fund highest margin projects

Newmont Mining Corporation I Q2 2016 earnings I Slide 9July 21, 2016
Adding profitable production from two new mines
Expected life of mine average. See Endnote 5. Expected average for first five years of production. See Endnote 5.
Merian ~ 90% complete
Production 400 – 500 Koz (100%)
AISC $650 – $700/oz
Commercial start H2 2016
Long Canyon ~ 80% complete
Production 100 – 150 Koz
AISC $500 – $600/oz
Commercial start H1 2017
Newmont Mining Corporation I Q2 2016 earnings I Slide 10July 21, 2016
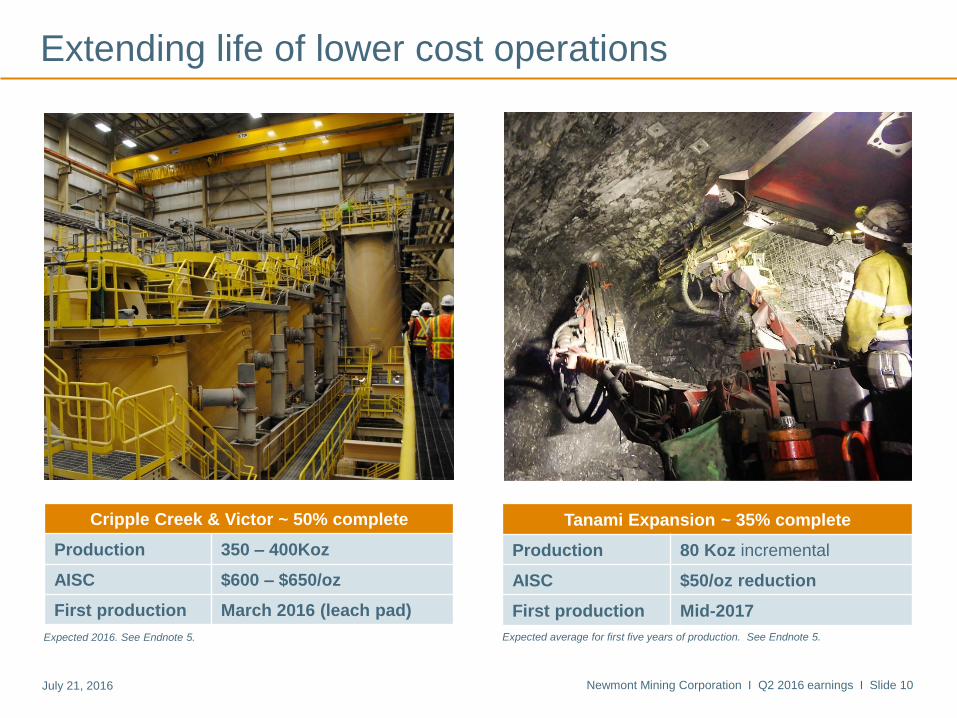
Extending life of lower cost operations
Expected average for first five years of production. See Endnote 5.Expected 2016. See Endnote 5.
Cripple Creek & Victor ~ 50% complete
Production 350 – 400Koz
AISC $600 – $650/oz
First production March 2016 (leach pad)
Tanami Expansion ~ 35% complete
Production 80 Koz incremental
AISC $50/oz reduction
First production Mid-2017
Financial results – Laurie Brlas
Newmont Mining Corporation I Q2 2016 earnings I Slide 12July 21, 2016
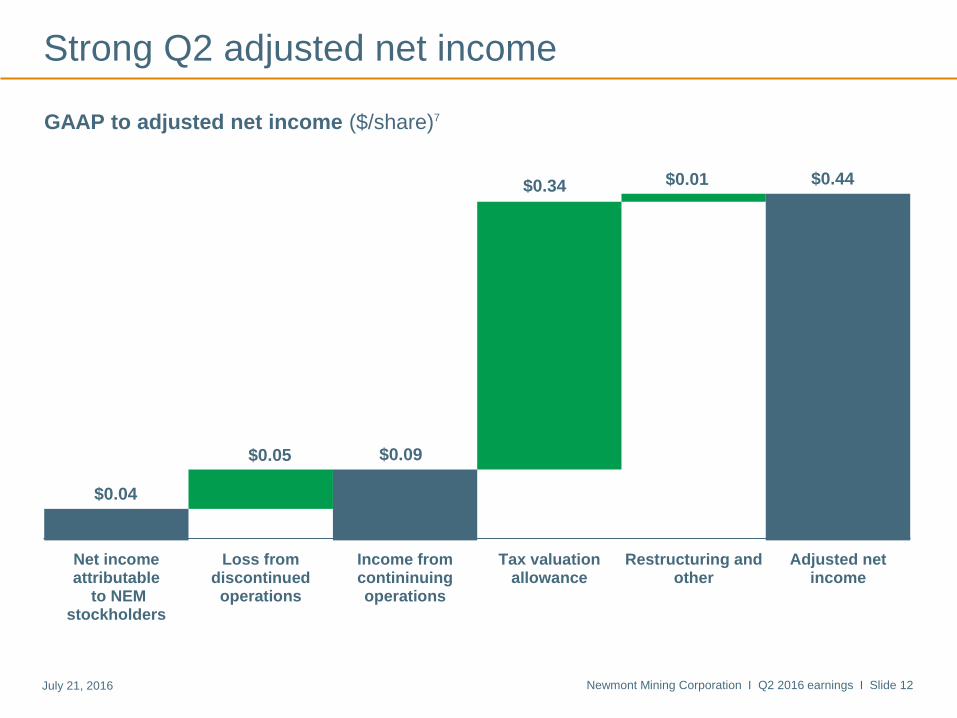
$0.04
$0.05
$0.34 $0.01 $0.44
$0.09
Net incomeattributable
to NEMstockholders
Loss fromdiscontinuedoperations
Income fromcontininuingoperations
Tax valuationallowance
Restructuring andother
Adjusted netincome
Strong Q2 adjusted net income
GAAP to adjusted net income ($/share)7
Newmont Mining Corporation I Q2 2016 earnings I Slide 13July 21, 2016
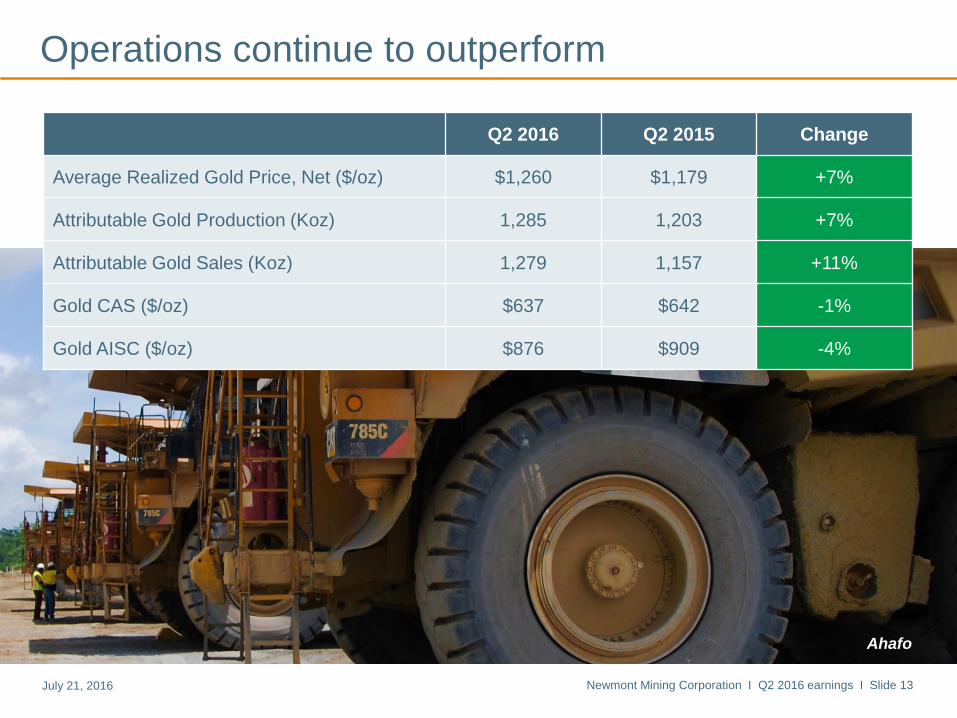
Operations continue to outperform
Q2 2016 Q2 2015 Change
Average Realized Gold Price, Net ($/oz) $1,260 $1,179 +7%
Attributable Gold Production (Koz) 1,285 1,203 +7%
Attributable Gold Sales (Koz) 1,279 1,157 +11%
Gold CAS ($/oz) $637 $642 -1%
Gold AISC ($/oz) $876 $909 -4%
Ahafo
Newmont Mining Corporation I Q2 2016 earnings I Slide 14July 21, 2016
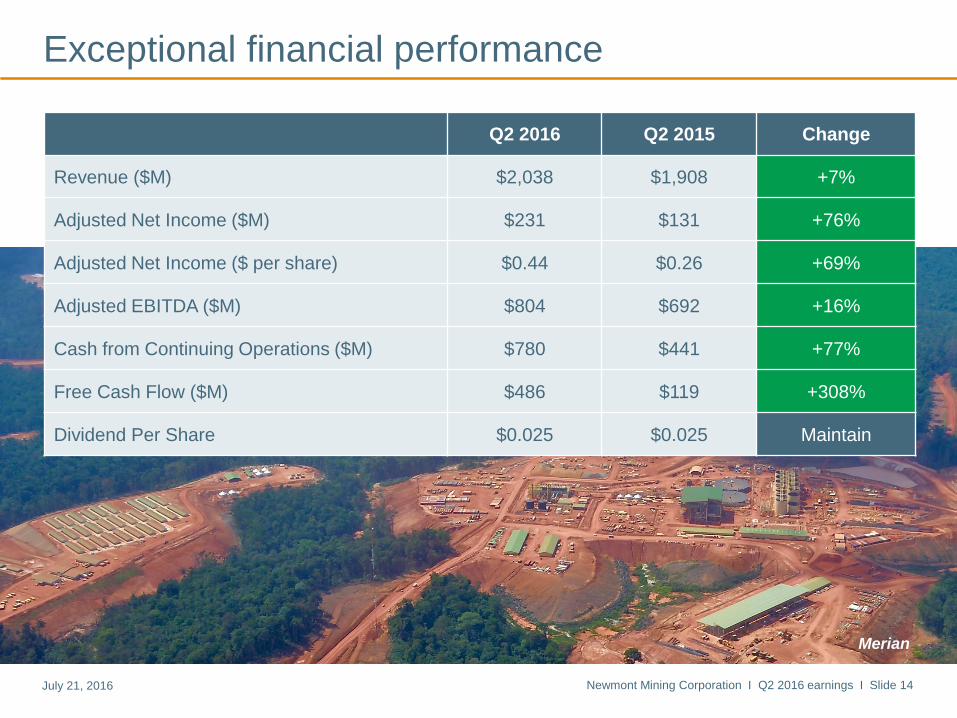
Exceptional financial performance
Q2 2016 Q2 2015 Change
Revenue ($M) $2,038 $1,908 +7%
Adjusted Net Income ($M) $231 $131 +76%
Adjusted Net Income ($ per share) $0.44 $0.26 +69%
Adjusted EBITDA ($M) $804 $692 +16%
Cash from Continuing Operations ($M) $780 $441 +77%
Free Cash Flow ($M) $486 $119 +308%
Dividend Per Share $0.025 $0.025 Maintain
Merian
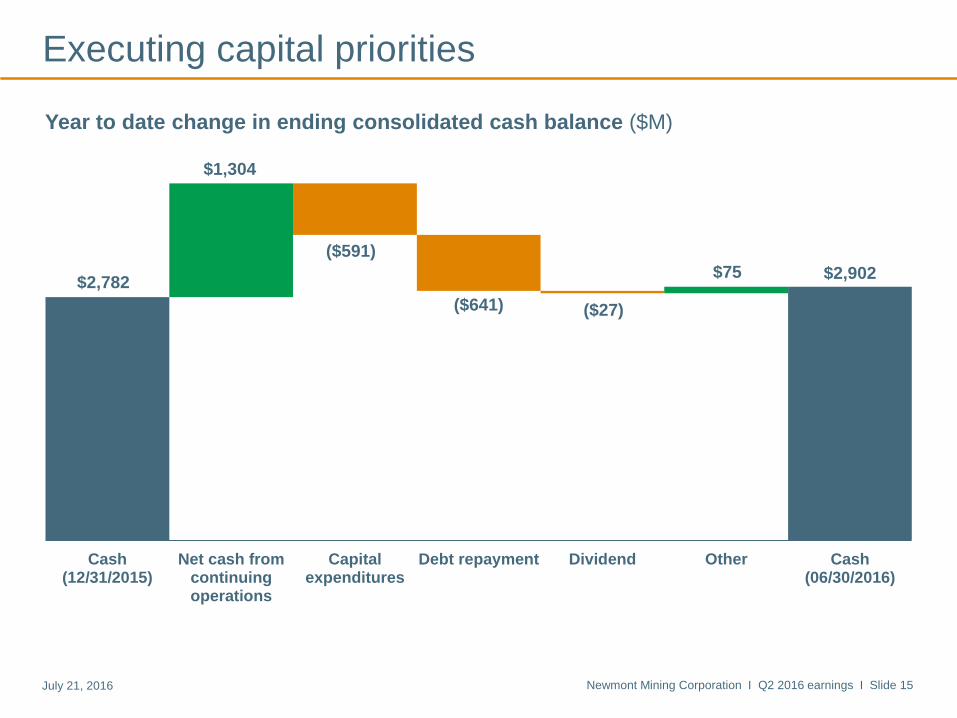
Newmont Mining Corporation I Q2 2016 earnings I Slide 15July 21, 2016
$2,782$2,902
$1,304
($591)
($641) ($27)
$75
Cash(12/31/2015)
Net cash fromcontinuingoperations
Capitalexpenditures
Debt repayment Dividend Other Cash(06/30/2016)
Executing capital priorities
Year to date change in ending consolidated cash balance ($M)

Newmont Mining Corporation I Q2 2016 earnings I Slide 16July 21, 2016
$2,902$2,758
($715)
$2,187
$920
($349)
Consolidated cash(06/30/2016)
Cash attributableto noncontrolling
interests
Cash attributableto Newmont
Gross cashproceeds to
Newmont fromPTNNT sale
PTNNT attributablecash
(06/30/2016)
Adjustedattributable cash
(06/30/2016)
PTNNT sale close expected to improve liquidity
Cash balance post PTNNT transaction4 ($M)
Newmont Mining Corporation I Q2 2016 earnings I Slide 17July 21, 2016
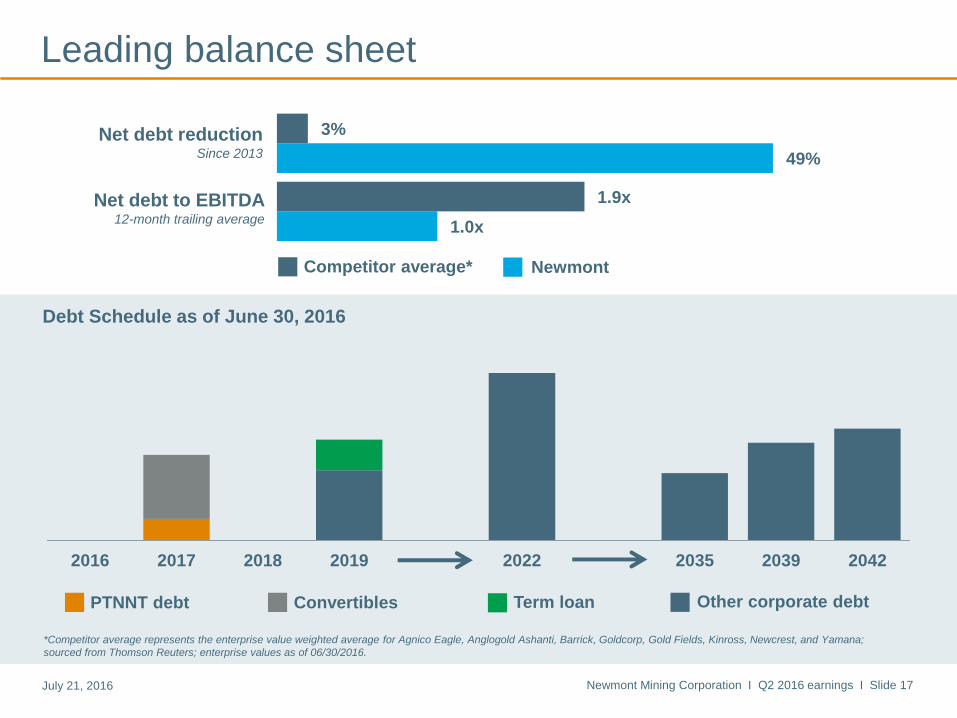
2016 2017 2018 2019 2022 2035 2039 2042
1.0x
49%
1.9x
3%
PTNNT debt Convertibles Term loan Other corporate debt
Leading balance sheet
Debt Schedule as of June 30, 2016
Net debt reductionSince 2013
Net debt to EBITDA12-month trailing average
Competitor average* Newmont
*Competitor average represents the enterprise value weighted average for Agnico Eagle, Anglogold Ashanti, Barrick, Goldcorp, Gold Fields, Kinross, Newcrest, and Yamana;
sourced from Thomson Reuters; enterprise values as of 06/30/2016.
Newmont Mining Corporation I Q2 2016 earnings I Slide 18July 21, 2016
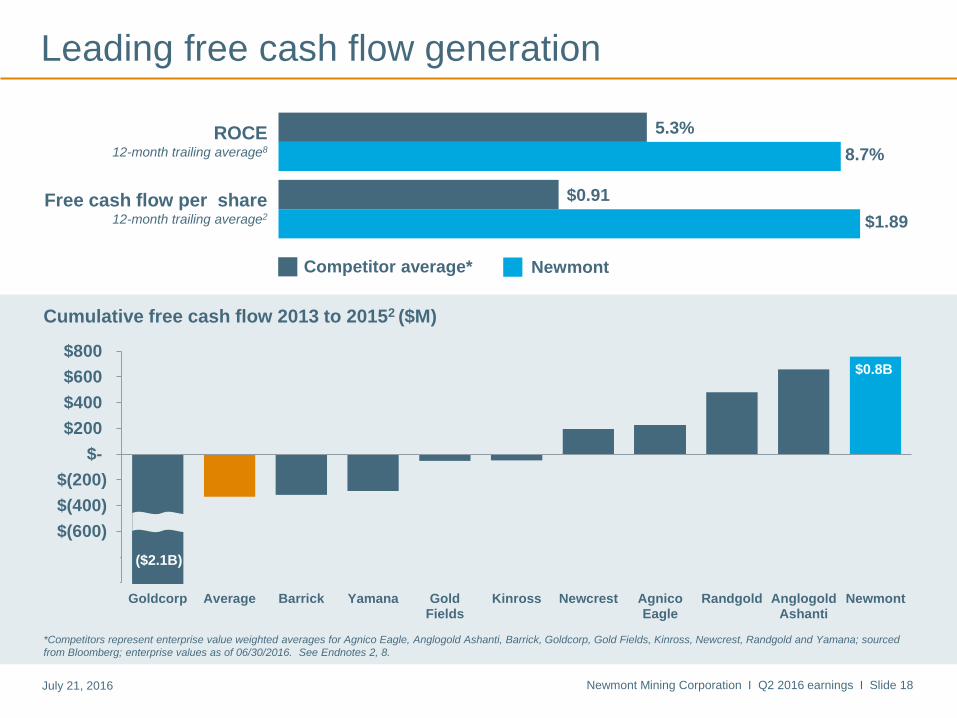
Competitor average*
Leading free cash flow generation
*Competitors represent enterprise value weighted averages for Agnico Eagle, Anglogold Ashanti, Barrick, Goldcorp, Gold Fields, Kinross, Newcrest, Randgold and Yamana; sourced
from Bloomberg; enterprise values as of 06/30/2016. See Endnotes 2, 8.
Free cash flow per share12-month trailing average2
ROCE12-month trailing average8
Cumulative free cash flow 2013 to 20152 ($M)
$1.89
8.7%
$0.91
5.3%
Newmont
$(1,000)
$(800)
$(600)
$(400)
$(200)
$-
$200
$400
$600
$800
Goldcorp Average Barrick Yamana GoldFields
Kinross Newcrest AgnicoEagle
Randgold AnglogoldAshanti
Newmont
($2.1B)
$0.8B
Outlook – Gary Goldberg
Newmont Mining Corporation I Q2 2016 earnings I Slide 20July 21, 2016
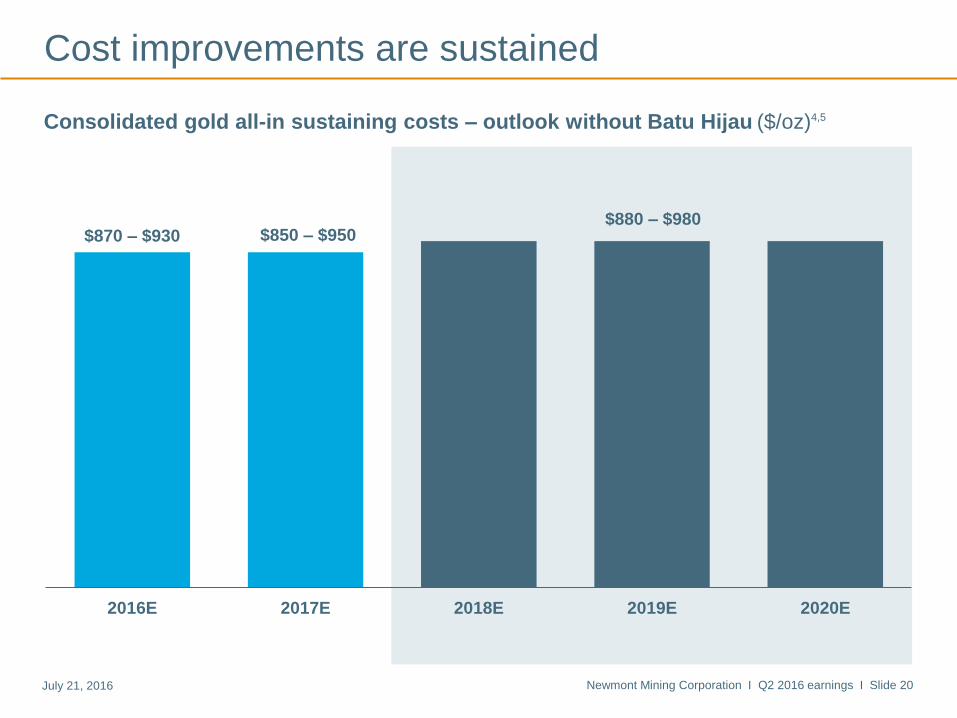
$870 – $930 $850 – $950$880 – $980
2016E 2017E 2018E 2019E 2020E
Cost improvements are sustained
Consolidated gold all-in sustaining costs – outlook without Batu Hijau ($/oz)4,5
Newmont Mining Corporation I Q2 2016 earnings I Slide 21July 21, 2016
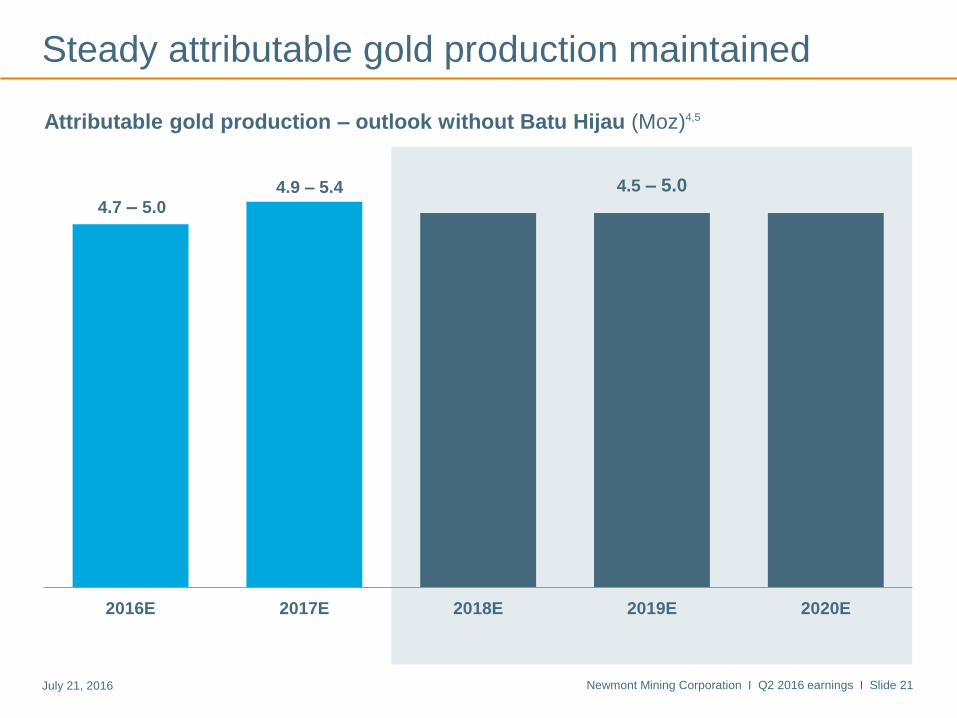
4.7 – 5.04.9 – 5.4 4.5 – 5.0
2016E 2017E 2018E 2019E 2020E
Attributable gold production – outlook without Batu Hijau (Moz)4,5
Steady attributable gold production maintained
Newmont Mining Corporation I Q2 2016 earnings I Slide 22July 21, 2016
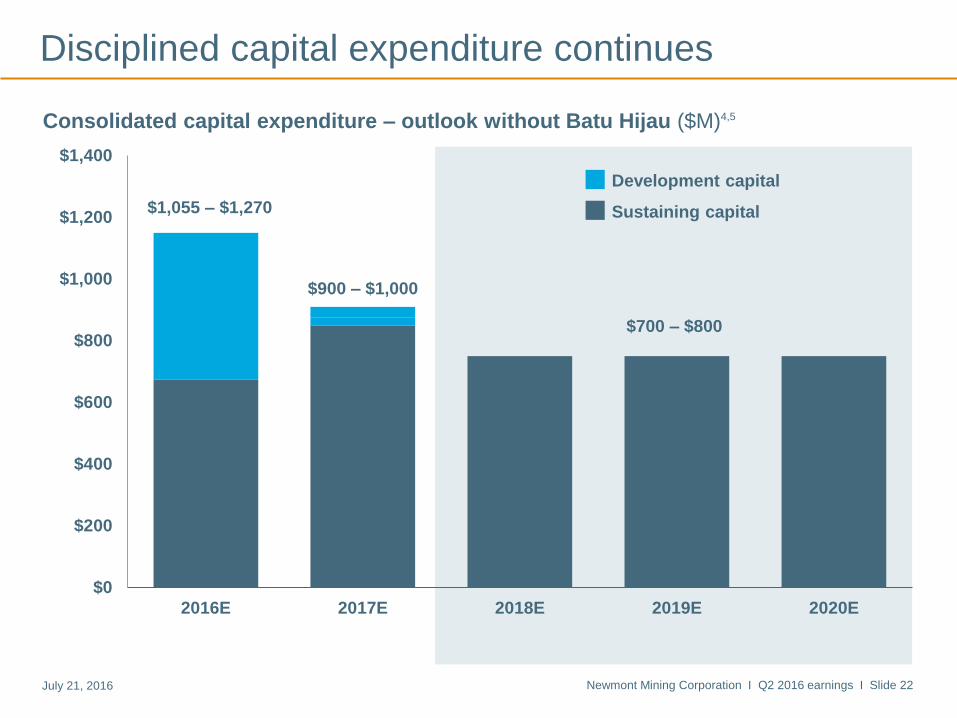
$1,055 – $1,270
$900 – $1,000
$700 – $800
$0
$200
$400
$600
$800
$1,000
$1,200
$1,400
2016E 2017E 2018E 2019E 2020E
Disciplined capital expenditure continues
Consolidated capital expenditure – outlook without Batu Hijau ($M)4,5
Development capital
Sustaining capital
Newmont Mining Corporation I Q2 2016 earnings I Slide 23July 21, 2016
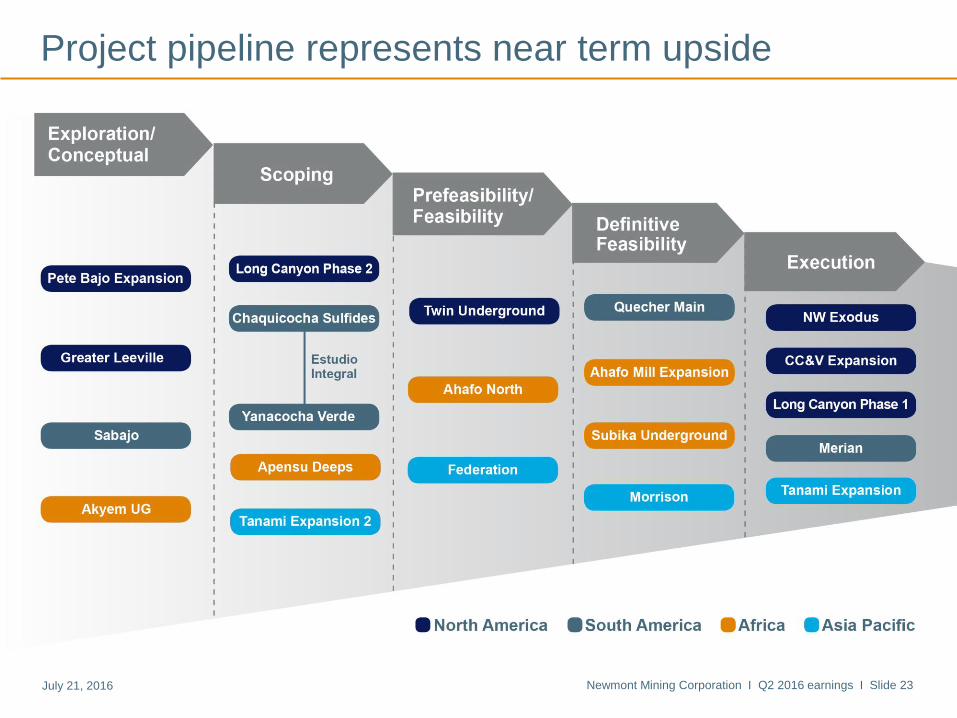
Project pipeline represents near term upside
Newmont Mining Corporation I Q2 2016 earnings I Slide 24July 21, 2016
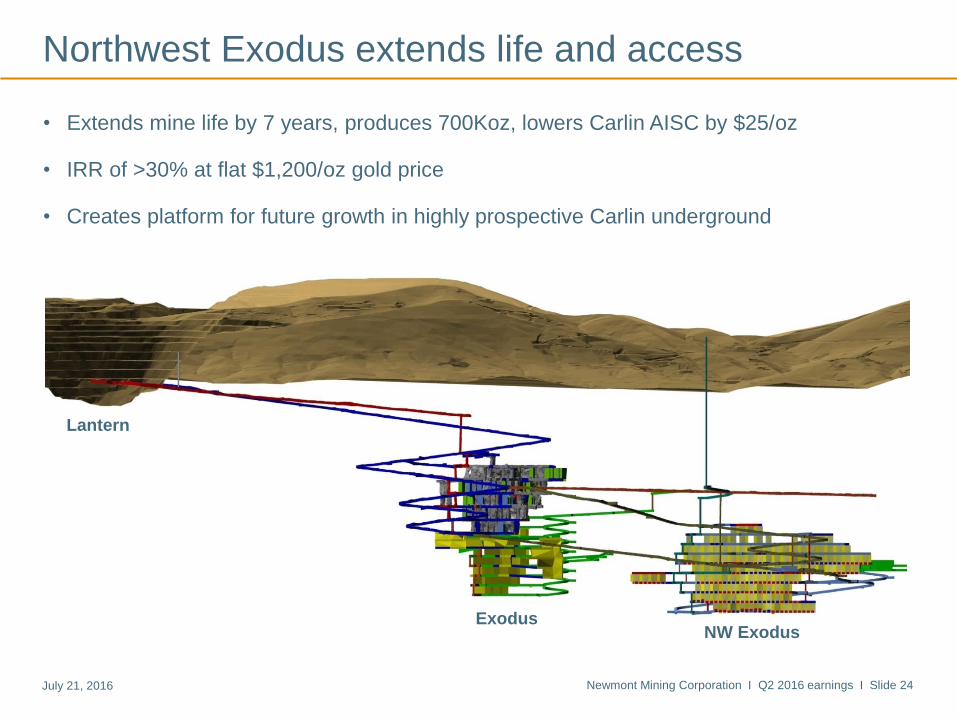
Northwest Exodus extends life and access
• Extends mine life by 7 years, produces 700Koz, lowers Carlin AISC by $25/oz
• IRR of >30% at flat $1,200/oz gold price
• Creates platform for future growth in highly prospective Carlin underground
Lantern
ExodusNW Exodus
Newmont Mining Corporation I Q2 2016 earnings I Slide 25July 21, 2016
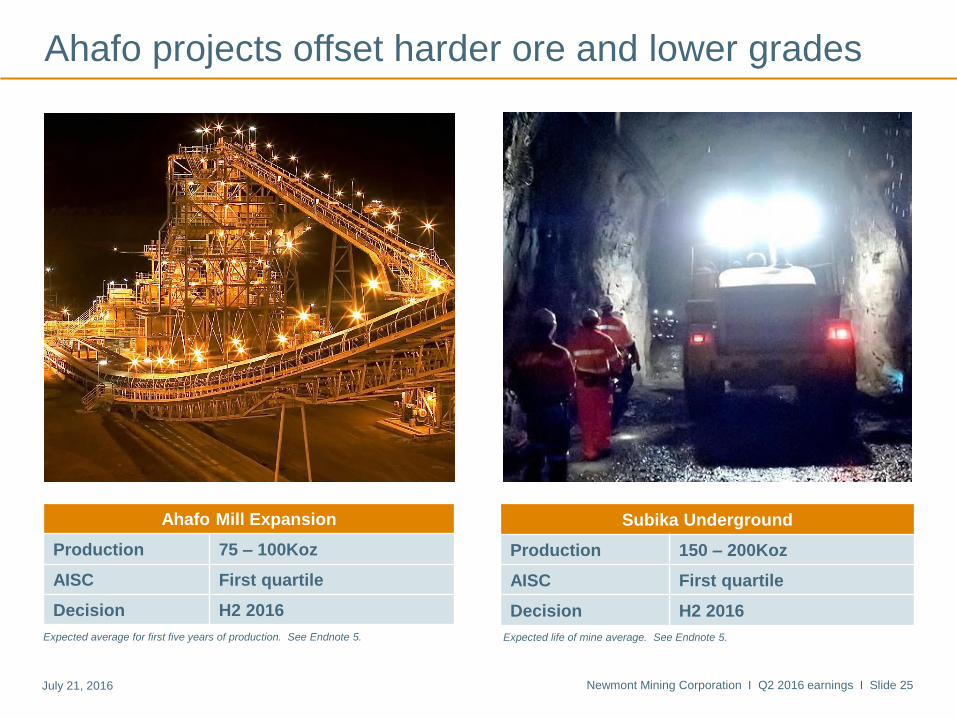
Ahafo projects offset harder ore and lower grades
Ahafo Mill Expansion
Production 75 – 100Koz
AISC First quartile
Decision H2 2016
Subika Underground
Production 150 – 200Koz
AISC First quartile
Decision H2 2016
Expected average for first five years of production. See Endnote 5. Expected life of mine average. See Endnote 5.
Newmont Mining Corporation I Q2 2016 earnings I Slide 26July 21, 2016
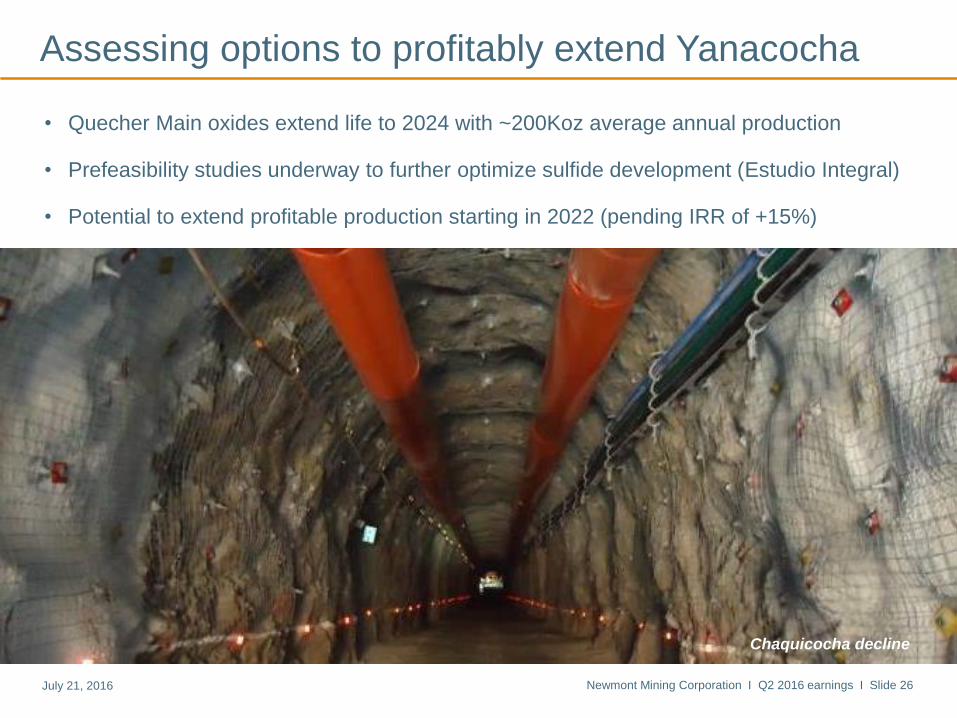
Assessing options to profitably extend Yanacocha
• Quecher Main oxides extend life to 2024 with ~200Koz average annual production
• Prefeasibility studies underway to further optimize sulfide development (Estudio Integral)
• Potential to extend profitable production starting in 2022 (pending IRR of +15%)
Chaquicocha decline
Newmont Mining Corporation I Q2 2016 earnings I Slide 27July 21, 2016
-3%
-2%
-1%
0%
1%
2%
3%
4%
5%
6%
2008 2010 2012 2014 2016 2018
CPI (headline)
CPI (core)
PCE (core)
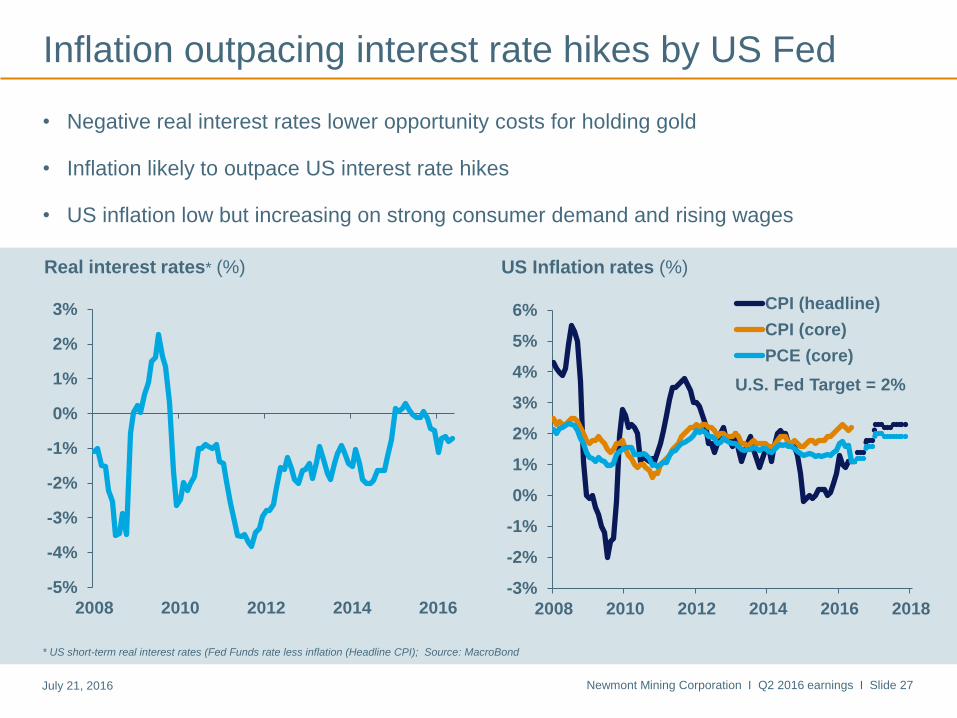
Inflation outpacing interest rate hikes by US Fed
US Inflation rates (%)
* US short-term real interest rates (Fed Funds rate less inflation (Headline CPI); Source: MacroBond
U.S. Fed Target = 2%
-5%
-4%
-3%
-2%
-1%
0%
1%
2%
3%
2008 2010 2012 2014 2016
Real interest rates* (%)
• Negative real interest rates lower opportunity costs for holding gold
• Inflation likely to outpace US interest rate hikes
• US inflation low but increasing on strong consumer demand and rising wages
Newmont Mining Corporation I Q2 2016 earnings I Slide 28July 21, 2016
0.0
0.5
1.0
1.5
2.0
2.5
3.0
3.5
1-D
ay
1-M
on
th3-M
on
th
6-M
on
th1-Y
ear
3-Y
ear
5-Y
ea
r
10
-Year
20
-Year
30
-Year
Dec. 31, 2015
Current
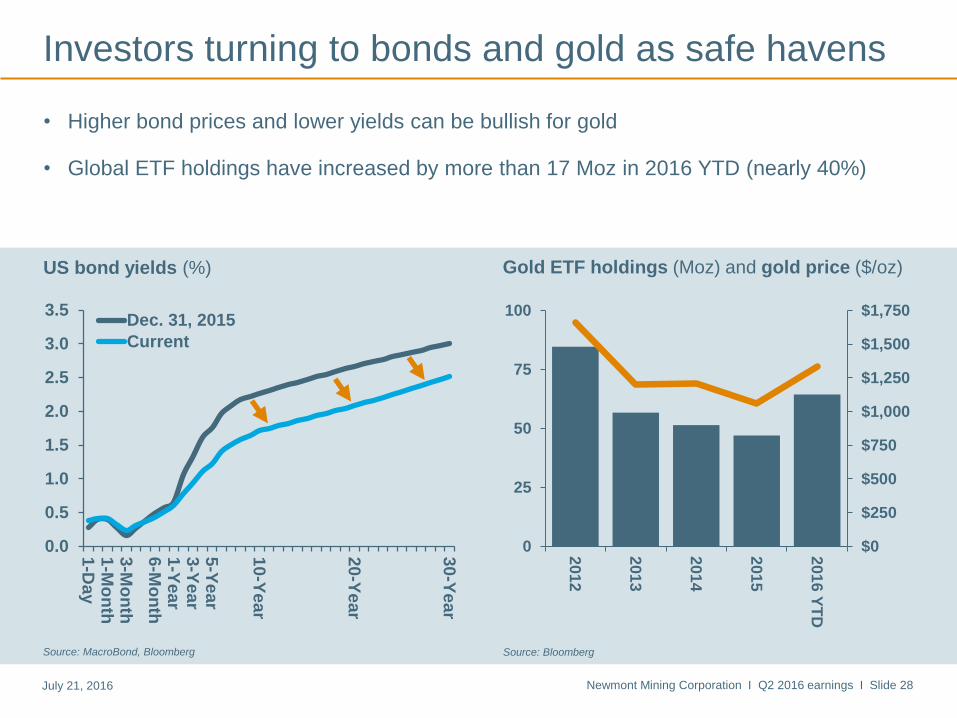
Investors turning to bonds and gold as safe havens
Source: MacroBond, Bloomberg
US bond yields (%)
• Higher bond prices and lower yields can be bullish for gold
• Global ETF holdings have increased by more than 17 Moz in 2016 YTD (nearly 40%)
Gold ETF holdings (Moz) and gold price ($/oz)
Source: Bloomberg
$0
$250
$500
$750
$1,000
$1,250
$1,500
$1,750
0
25
50
75
100
201
2
201
3
201
4
201
5
201
6 Y
TD
Newmont Mining Corporation I Q2 2016 earnings I Slide 29July 21, 2016
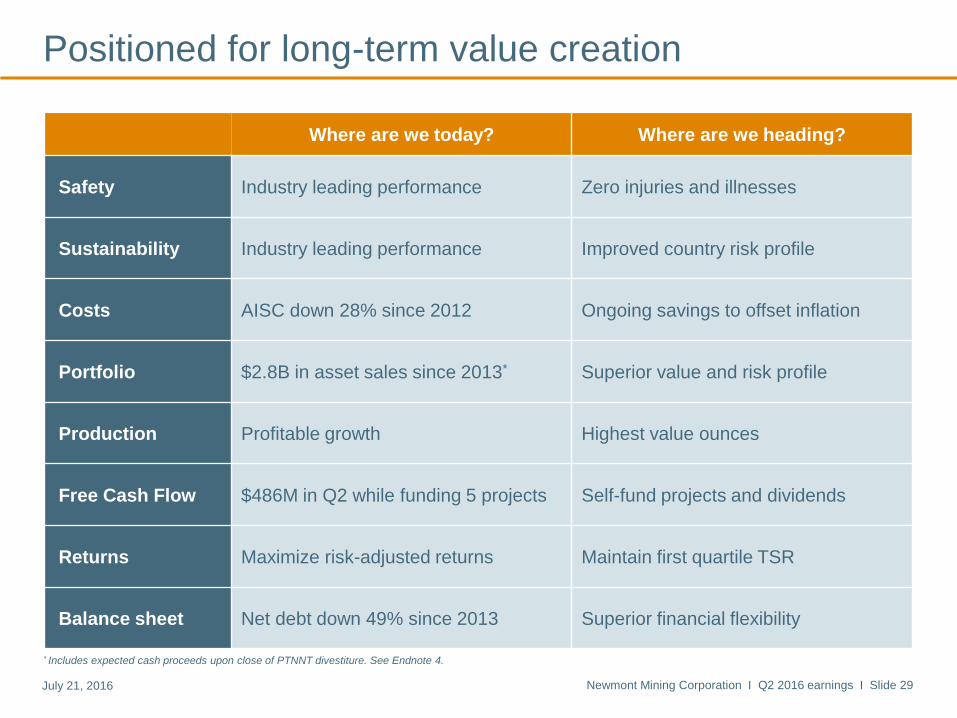
Positioned for long-term value creation
Where are we today? Where are we heading?
Safety Industry leading performance Zero injuries and illnesses
Sustainability Industry leading performance Improved country risk profile
Costs AISC down 28% since 2012 Ongoing savings to offset inflation
Portfolio $2.8B in asset sales since 2013* Superior value and risk profile
Production Profitable growth Highest value ounces
Free Cash Flow $486M in Q2 while funding 5 projects Self-fund projects and dividends
Returns Maximize risk-adjusted returns Maintain first quartile TSR
Balance sheet Net debt down 49% since 2013 Superior financial flexibility
* Includes expected cash proceeds upon close of PTNNT divestiture. See Endnote 4.
Appendix
Newmont Mining Corporation I Q2 2016 earnings I Slide 31July 21, 2016
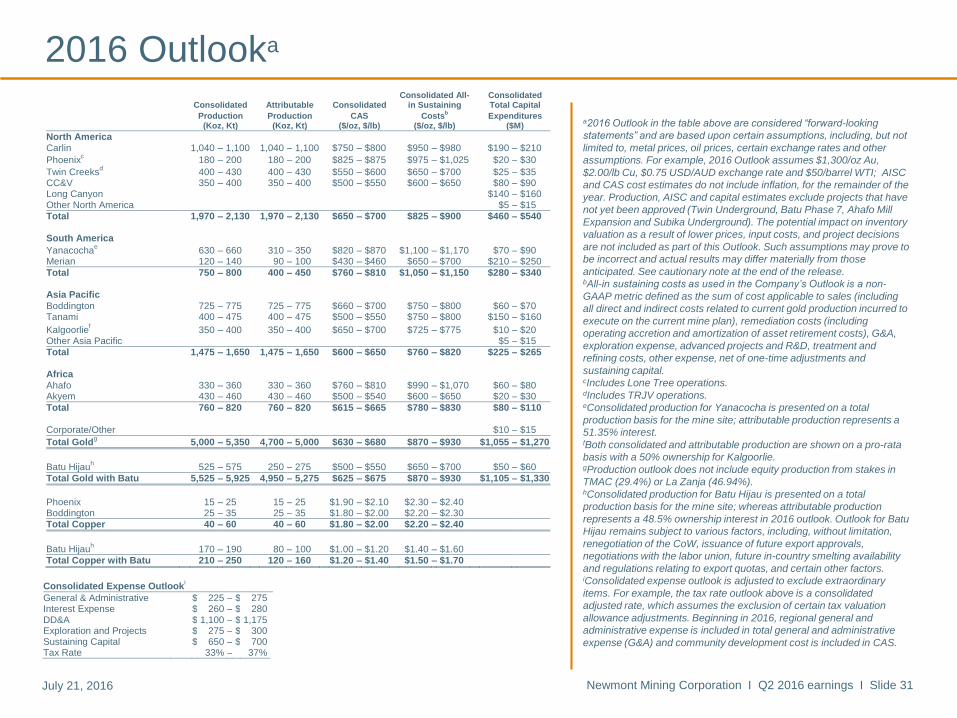
2016 Outlooka
a2016 Outlook in the table above are considered “forward-looking
statements” and are based upon certain assumptions, including, but not
limited to, metal prices, oil prices, certain exchange rates and other
assumptions. For example, 2016 Outlook assumes $1,300/oz Au,
$2.00/lb Cu, $0.75 USD/AUD exchange rate and $50/barrel WTI; AISC
and CAS cost estimates do not include inflation, for the remainder of the
year. Production, AISC and capital estimates exclude projects that have
not yet been approved (Twin Underground, Batu Phase 7, Ahafo Mill
Expansion and Subika Underground). The potential impact on inventory
valuation as a result of lower prices, input costs, and project decisions
are not included as part of this Outlook. Such assumptions may prove to
be incorrect and actual results may differ materially from those
anticipated. See cautionary note at the end of the release.bAll-in sustaining costs as used in the Company’s Outlook is a non-
GAAP metric defined as the sum of cost applicable to sales (including
all direct and indirect costs related to current gold production incurred to
execute on the current mine plan), remediation costs (including
operating accretion and amortization of asset retirement costs), G&A,
exploration expense, advanced projects and R&D, treatment and
refining costs, other expense, net of one-time adjustments and
sustaining capital.cIncludes Lone Tree operations.dIncludes TRJV operations. eConsolidated production for Yanacocha is presented on a total
production basis for the mine site; attributable production represents a
51.35% interest.fBoth consolidated and attributable production are shown on a pro-rata
basis with a 50% ownership for Kalgoorlie.gProduction outlook does not include equity production from stakes in
TMAC (29.4%) or La Zanja (46.94%).hConsolidated production for Batu Hijau is presented on a total
production basis for the mine site; whereas attributable production
represents a 48.5% ownership interest in 2016 outlook. Outlook for Batu
Hijau remains subject to various factors, including, without limitation,
renegotiation of the CoW, issuance of future export approvals,
negotiations with the labor union, future in-country smelting availability
and regulations relating to export quotas, and certain other factors.iConsolidated expense outlook is adjusted to exclude extraordinary
items. For example, the tax rate outlook above is a consolidated
adjusted rate, which assumes the exclusion of certain tax valuation
allowance adjustments. Beginning in 2016, regional general and
administrative expense is included in total general and administrative
expense (G&A) and community development cost is included in CAS.
Consolidated Attributable Consolidated
Consolidated All-in Sustaining
Consolidated Total Capital
Production Production CAS Costsb Expenditures
(Koz, Kt) (Koz, Kt) ($/oz, $/lb) ($/oz, $/lb) ($M)
North America Carlin 1,040 – 1,100 1,040 – 1,100 $750 – $800 $950 – $980 $190 – $210
Phoenixc 180 – 200 180 – 200 $825 – $875 $975 – $1,025 $20 – $30
Twin Creeksd 400 – 430 400 – 430 $550 – $600 $650 – $700 $25 – $35
CC&V 350 – 400 350 – 400 $500 – $550 $600 – $650 $80 – $90 Long Canyon $140 – $160 Other North America $5 – $15
Total 1,970 – 2,130 1,970 – 2,130 $650 – $700 $825 – $900 $460 – $540 South America
Yanacochae 630 – 660 310 – 350 $820 – $870 $1,100 – $1,170 $70 – $90
Merian 120 – 140 90 – 100 $430 – $460 $650 – $700 $210 – $250
Total 750 – 800 400 – 450 $760 – $810 $1,050 – $1,150 $280 – $340 Asia Pacific Boddington 725 – 775 725 – 775 $660 – $700 $750 – $800 $60 – $70 Tanami 400 – 475 400 – 475 $500 – $550 $750 – $800 $150 – $160
Kalgoorlief 350 – 400 350 – 400 $650 – $700 $725 – $775 $10 – $20
Other Asia Pacific $5 – $15
Total 1,475 – 1,650 1,475 – 1,650 $600 – $650 $760 – $820 $225 – $265 Africa Ahafo 330 – 360 330 – 360 $760 – $810 $990 – $1,070 $60 – $80 Akyem 430 – 460 430 – 460 $500 – $540 $600 – $650 $20 – $30
Total 760 – 820 760 – 820 $615 – $665 $780 – $830 $80 – $110
Corporate/Other $10 – $15
Total Goldg 5,000 – 5,350 4,700 – 5,000 $630 – $680 $870 – $930 $1,055 – $1,270
Batu Hijauh 525 – 575 250 – 275 $500 – $550 $650 – $700 $50 – $60
Total Gold with Batu 5,525 – 5,925 4,950 – 5,275 $625 – $675 $870 – $930 $1,105 – $1,330
Phoenix 15 – 25 15 – 25 $1.90 – $2.10 $2.30 – $2.40 Boddington 25 – 35 25 – 35 $1.80 – $2.00 $2.20 – $2.30
Total Copper 40 – 60 40 – 60 $1.80 – $2.00 $2.20 – $2.40
Batu Hijauh 170 – 190 80 – 100 $1.00 – $1.20 $1.40 – $1.60
Total Copper with Batu 210 – 250 120 – 160 $1.20 – $1.40 $1.50 – $1.70
Consolidated Expense Outlook
i
General & Administrative $ 225 – $ 275 Interest Expense $ 260 – $ 280 DD&A $ 1,100 – $ 1,175 Exploration and Projects $ 275 – $ 300 Sustaining Capital $ 650 – $ 700 Tax Rate 33% – 37%
Newmont Mining Corporation I Q2 2016 earnings I Slide 32July 21, 2016
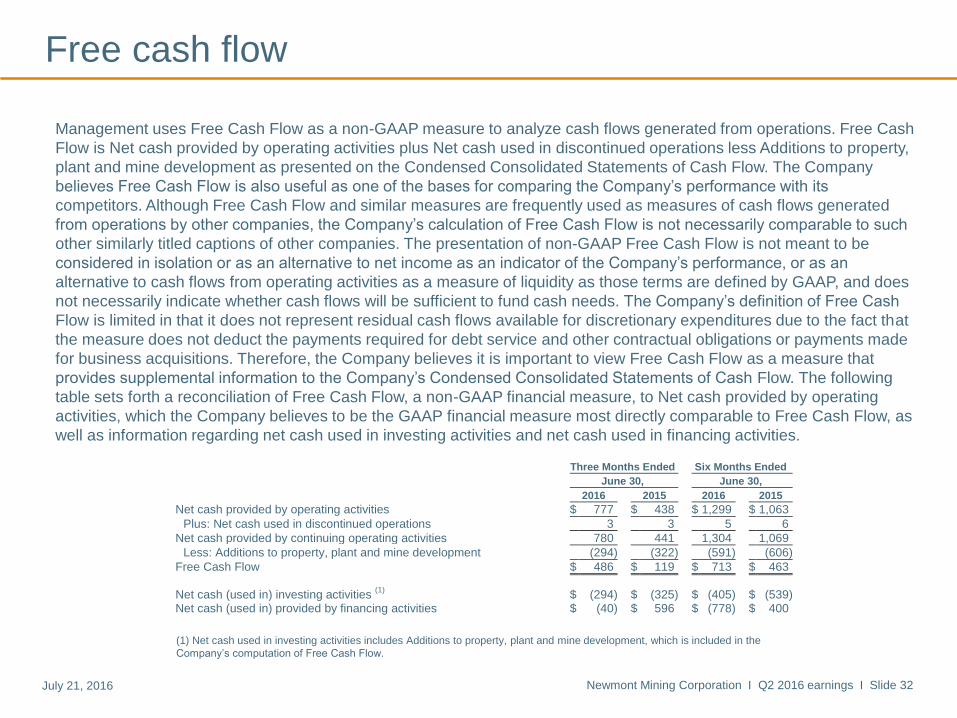
Free cash flow
Management uses Free Cash Flow as a non-GAAP measure to analyze cash flows generated from operations. Free Cash
Flow is Net cash provided by operating activities plus Net cash used in discontinued operations less Additions to property,
plant and mine development as presented on the Condensed Consolidated Statements of Cash Flow. The Company
believes Free Cash Flow is also useful as one of the bases for comparing the Company’s performance with its
competitors. Although Free Cash Flow and similar measures are frequently used as measures of cash flows generated
from operations by other companies, the Company’s calculation of Free Cash Flow is not necessarily comparable to such
other similarly titled captions of other companies. The presentation of non-GAAP Free Cash Flow is not meant to be
considered in isolation or as an alternative to net income as an indicator of the Company’s performance, or as an
alternative to cash flows from operating activities as a measure of liquidity as those terms are defined by GAAP, and does
not necessarily indicate whether cash flows will be sufficient to fund cash needs. The Company’s definition of Free Cash
Flow is limited in that it does not represent residual cash flows available for discretionary expenditures due to the fact that
the measure does not deduct the payments required for debt service and other contractual obligations or payments made
for business acquisitions. Therefore, the Company believes it is important to view Free Cash Flow as a measure that
provides supplemental information to the Company’s Condensed Consolidated Statements of Cash Flow. The following
table sets forth a reconciliation of Free Cash Flow, a non-GAAP financial measure, to Net cash provided by operating
activities, which the Company believes to be the GAAP financial measure most directly comparable to Free Cash Flow, as
well as information regarding net cash used in investing activities and net cash used in financing activities.
(1) Net cash used in investing activities includes Additions to property, plant and mine development, which is included in the
Company’s computation of Free Cash Flow.
Three Months Ended Six Months Ended
June 30, June 30,
2016 2015 2016 2015
Net cash provided by operating activities $ 777 $ 438 $ 1,299 $ 1,063
Plus: Net cash used in discontinued operations 3 3 5 6
Net cash provided by continuing operating activities 780 441 1,304 1,069
Less: Additions to property, plant and mine development (294) (322) (591) (606)
Free Cash Flow $ 486 $ 119 $ 713 $ 463
Net cash (used in) investing activities (1)
$ (294) $ (325) $ (405) $ (539) Net cash (used in) provided by financing activities $ (40) $ 596 $ (778) $ 400
Newmont Mining Corporation I Q2 2016 earnings I Slide 33July 21, 2016
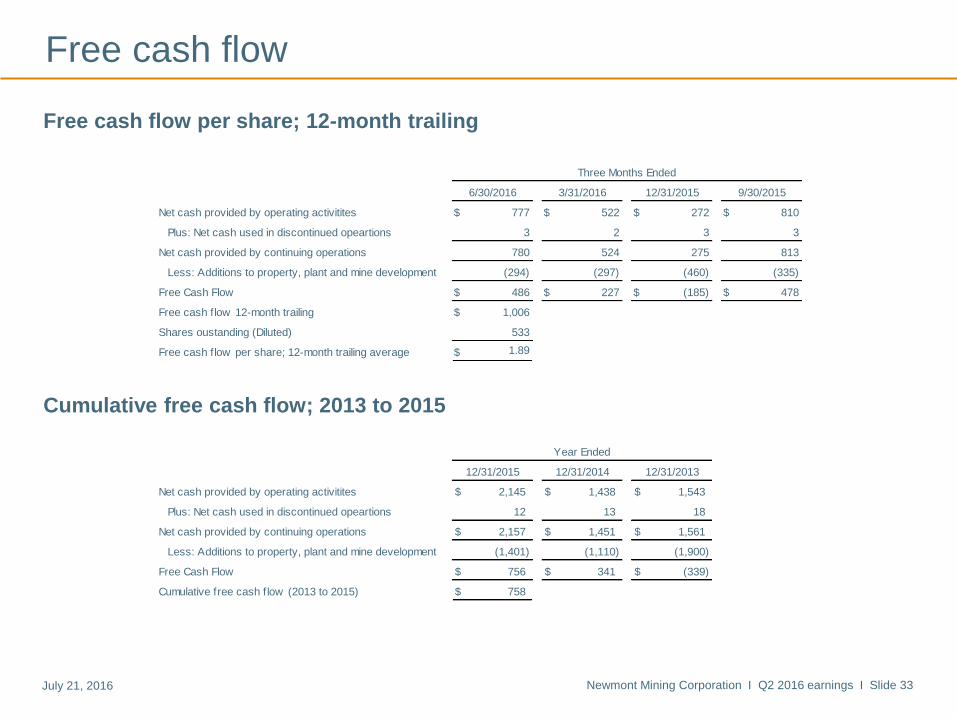
Free cash flow
Free cash flow per share; 12-month trailing
Cumulative free cash flow; 2013 to 2015
Net cash provided by operating activitites $ 2,145 $ 1,438 $ 1,543
Plus: Net cash used in discontinued opeartions 12 13 18
Net cash provided by continuing operations $ 2,157 $ 1,451 $ 1,561
Less: Additions to property, plant and mine development (1,401) (1,110) (1,900)
Free Cash Flow $ 756 $ 341 $ (339)
Cumulative free cash flow (2013 to 2015) $ 758
Year Ended
12/31/2015 12/31/2014 12/31/2013
Net cash provided by operating activitites $ 777 $ 522 $ 272 $ 810
Plus: Net cash used in discontinued opeartions 3 2 3 3
Net cash provided by continuing operations 780 524 275 813
Less: Additions to property, plant and mine development (294) (297) (460) (335)
Free Cash Flow $ 486 $ 227 $ (185) $ 478
Free cash flow 12-month trailing $ 1,006
Shares oustanding (Diluted) 533
Free cash flow per share; 12-month trailing average $ 1.89
Three Months Ended
6/30/2016 3/31/2016 12/31/2015 9/30/2015
Newmont Mining Corporation I Q2 2016 earnings I Slide 34July 21, 2016
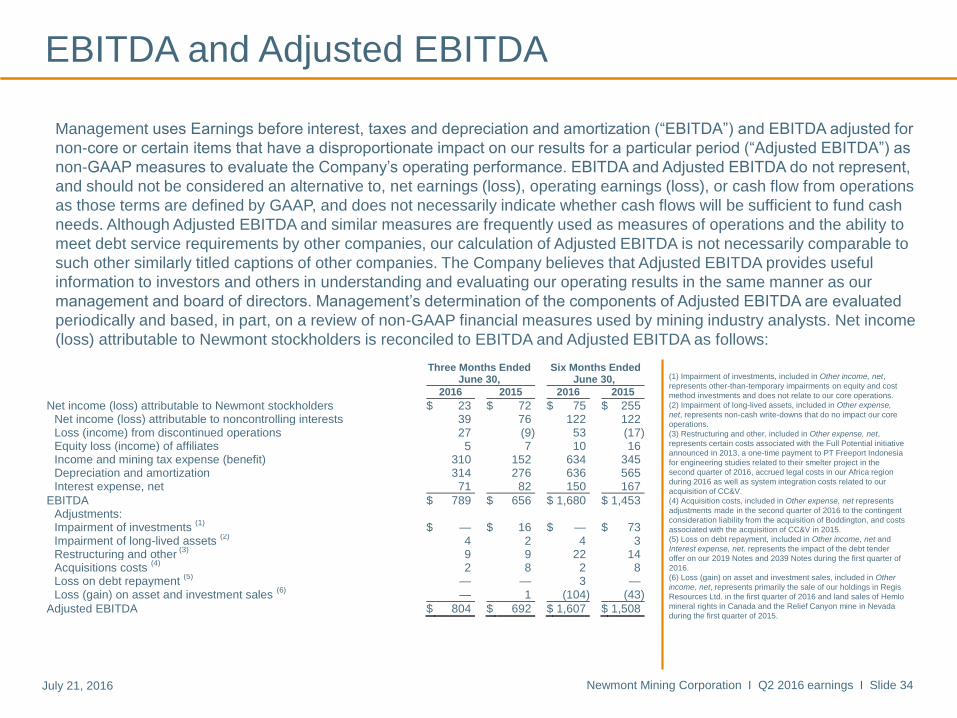
EBITDA and Adjusted EBITDA
Management uses Earnings before interest, taxes and depreciation and amortization (“EBITDA”) and EBITDA adjusted for
non-core or certain items that have a disproportionate impact on our results for a particular period (“Adjusted EBITDA”) as
non-GAAP measures to evaluate the Company’s operating performance. EBITDA and Adjusted EBITDA do not represent,
and should not be considered an alternative to, net earnings (loss), operating earnings (loss), or cash flow from operations
as those terms are defined by GAAP, and does not necessarily indicate whether cash flows will be sufficient to fund cash
needs. Although Adjusted EBITDA and similar measures are frequently used as measures of operations and the ability to
meet debt service requirements by other companies, our calculation of Adjusted EBITDA is not necessarily comparable to
such other similarly titled captions of other companies. The Company believes that Adjusted EBITDA provides useful
information to investors and others in understanding and evaluating our operating results in the same manner as our
management and board of directors. Management’s determination of the components of Adjusted EBITDA are evaluated
periodically and based, in part, on a review of non-GAAP financial measures used by mining industry analysts. Net income
(loss) attributable to Newmont stockholders is reconciled to EBITDA and Adjusted EBITDA as follows:
(1) Impairment of investments, included in Other income, net,
represents other-than-temporary impairments on equity and cost
method investments and does not relate to our core operations.
(2) Impairment of long-lived assets, included in Other expense,
net, represents non-cash write-downs that do no impact our core
operations.
(3) Restructuring and other, included in Other expense, net,
represents certain costs associated with the Full Potential initiative
announced in 2013, a one-time payment to PT Freeport Indonesia
for engineering studies related to their smelter project in the
second quarter of 2016, accrued legal costs in our Africa region
during 2016 as well as system integration costs related to our
acquisition of CC&V.
(4) Acquisition costs, included in Other expense, net represents
adjustments made in the second quarter of 2016 to the contingent
consideration liability from the acquisition of Boddington, and costs
associated with the acquisition of CC&V in 2015.
(5) Loss on debt repayment, included in Other income, net and
Interest expense, net, represents the impact of the debt tender
offer on our 2019 Notes and 2039 Notes during the first quarter of
2016.
(6) Loss (gain) on asset and investment sales, included in Other
income, net, represents primarily the sale of our holdings in Regis
Resources Ltd. in the first quarter of 2016 and land sales of Hemlo
mineral rights in Canada and the Relief Canyon mine in Nevada
during the first quarter of 2015.
Three Months Ended Six Months Ended June 30, June 30,
2016 2015 2016 2015
Net income (loss) attributable to Newmont stockholders $ 23 $ 72 $ 75 $ 255 Net income (loss) attributable to noncontrolling interests 39 76 122 122 Loss (income) from discontinued operations 27 (9) 53 (17) Equity loss (income) of affiliates 5 7 10 16 Income and mining tax expense (benefit) 310 152 634 345 Depreciation and amortization 314 276 636 565 Interest expense, net 71 82 150 167
EBITDA $ 789 $ 656 $ 1,680 $ 1,453 Adjustments: Impairment of investments
(1) $ — $ 16 $ — $ 73
Impairment of long-lived assets (2)
4 2 4 3 Restructuring and other
(3) 9 9 22 14
Acquisitions costs (4)
2 8 2 8 Loss on debt repayment
(5) — — 3 —
Loss (gain) on asset and investment sales (6)
— 1 (104) (43)
Adjusted EBITDA $ 804 $ 692 $ 1,607 $ 1,508
Newmont Mining Corporation I Q2 2016 earnings I Slide 35July 21, 2016
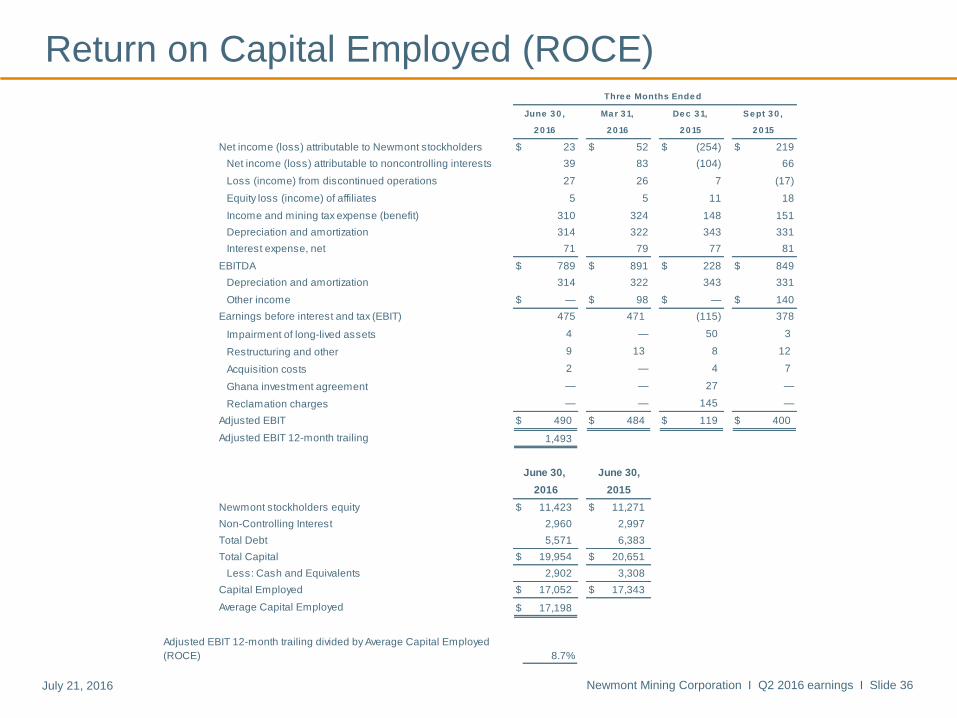
Return on Capital Employed (ROCE)
Management uses Return on Capital Employed (“ROCE”) as a non-GAAP measure to evaluate the Company’s operating
performance. ROCE does not represent, and should not be considered an alternative to, net earnings (loss), operating
earnings (loss), or cash flow from operations as those terms are defined by GAAP, and does not necessarily indicate
whether cash flows will be sufficient to fund cash needs. Although ROCE and similar measures are frequently used as
measures of operations by other companies, our calculation of ROCE is not necessarily comparable to such other
similarly titled captions of other companies. The Company believes that ROCE provides useful information to investors
and others in understanding and evaluating our operating results in the same manner as our management and board of
directors. Management’s determination of the components of ROCE are evaluated periodically and based, in part, on a
review of non-GAAP financial measures used by mining industry analysts. Net income (loss) attributable to Newmont
stockholders is reconciled to ROCE as follows on the next slide.
Newmont Mining Corporation I Q2 2016 earnings I Slide 36July 21, 2016
Return on Capital Employed (ROCE)
Net income (loss) attributable to Newmont stockholders $ 23 $ 52 $ (254) $ 219
Net income (loss) attributable to noncontrolling interests 39 83 (104) 66
Loss (income) from discontinued operations 27 26 7 (17)
Equity loss (income) of affiliates 5 5 11 18
Income and mining tax expense (benefit) 310 324 148 151
Depreciation and amortization 314 322 343 331
Interest expense, net 71 79 77 81
EBITDA $ 789 $ 891 $ 228 $ 849
Depreciation and amortization 314 322 343 331
Other income $ — $ 98 $ — $ 140
Earnings before interest and tax (EBIT) 475 471 (115) 378
Impairment of long-lived assets 4 — 50 3
Restructuring and other 9 13 8 12
Acquisition costs 2 — 4 7
Ghana investment agreement — — 27 —
Reclamation charges — — 145 —
Adjusted EBIT $ 490 $ 484 $ 119 $ 400
Adjusted EBIT 12-month trailing 1,493
Newmont stockholders equity $ 11,423 $ 11,271
Non-Controlling Interest 2,960 2,997
Total Debt 5,571 6,383
Total Capital $ 19,954 $ 20,651
Less: Cash and Equivalents 2,902 3,308
Capital Employed $ 17,052 $ 17,343
Average Capital Employed $ 17,198
8.7%
June 30, June 30,
2016 2015
Adjusted EBIT 12-month trailing divided by Average Capital Employed
(ROCE)
Thre e Months Ende d
2 0 16 2 0 152 0 16 2 0 15
Se pt 3 0 ,De c 3 1,Ma r 3 1,June 3 0 ,
Newmont Mining Corporation I Q2 2016 earnings I Slide 37July 21, 2016
Adjusted net income
Adjusted net income (loss)
Management of the Company uses Adjusted net income (loss) to evaluate the Company’s operating
performance, and for planning and forecasting future business operations. The Company believes the
use of Adjusted net income (loss) allows investors and analysts to understand the results of the
continuing operations of the Company and its direct and indirect subsidiaries relating to the production
and sale of minerals, by excluding certain items that have a disproportionate impact on our results for a
particular period. The net income (loss) adjustments are presented net of tax generally at Company’s
statutory effective tax rate of 35% and net of our partners’ noncontrolling interests when applicable. The
corollary impact of the adjustments through the Company’s Valuation allowance is shown separately.
The tax valuation allowance adjustment includes items such as foreign tax credits, alternative minimum
tax credits, capital losses and disallowed foreign losses. Management’s determination of the
components of Adjusted net income (loss) are evaluated periodically and based, in part, on a review of
non-GAAP financial measures used by mining industry analysts.
Newmont Mining Corporation I Q2 2016 earnings I Slide 38July 21, 2016
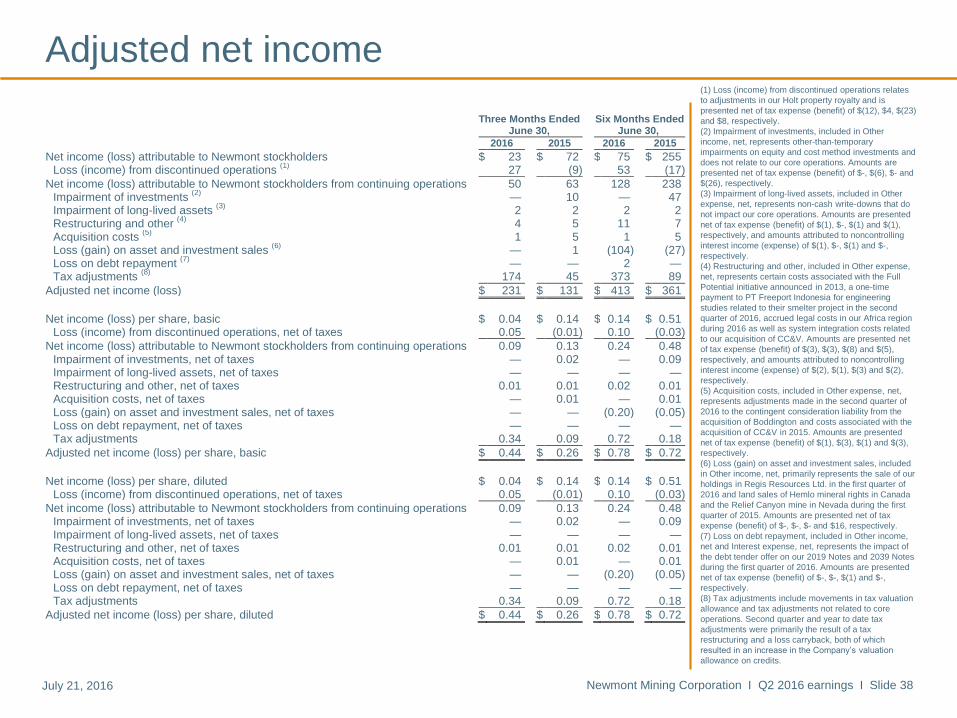
(1) Loss (income) from discontinued operations relates
to adjustments in our Holt property royalty and is
presented net of tax expense (benefit) of $(12), $4, $(23)
and $8, respectively.
(2) Impairment of investments, included in Other
income, net, represents other-than-temporary
impairments on equity and cost method investments and
does not relate to our core operations. Amounts are
presented net of tax expense (benefit) of $-, $(6), $- and
$(26), respectively.
(3) Impairment of long-lived assets, included in Other
expense, net, represents non-cash write-downs that do
not impact our core operations. Amounts are presented
net of tax expense (benefit) of $(1), $-, $(1) and $(1),
respectively, and amounts attributed to noncontrolling
interest income (expense) of $(1), $-, $(1) and $-,
respectively.
(4) Restructuring and other, included in Other expense,
net, represents certain costs associated with the Full
Potential initiative announced in 2013, a one-time
payment to PT Freeport Indonesia for engineering
studies related to their smelter project in the second
quarter of 2016, accrued legal costs in our Africa region
during 2016 as well as system integration costs related
to our acquisition of CC&V. Amounts are presented net
of tax expense (benefit) of $(3), $(3), $(8) and $(5),
respectively, and amounts attributed to noncontrolling
interest income (expense) of $(2), $(1), $(3) and $(2),
respectively.
(5) Acquisition costs, included in Other expense, net,
represents adjustments made in the second quarter of
2016 to the contingent consideration liability from the
acquisition of Boddington and costs associated with the
acquisition of CC&V in 2015. Amounts are presented
net of tax expense (benefit) of $(1), $(3), $(1) and $(3),
respectively.
(6) Loss (gain) on asset and investment sales, included
in Other income, net, primarily represents the sale of our
holdings in Regis Resources Ltd. in the first quarter of
2016 and land sales of Hemlo mineral rights in Canada
and the Relief Canyon mine in Nevada during the first
quarter of 2015. Amounts are presented net of tax
expense (benefit) of $-, $-, $- and $16, respectively.
(7) Loss on debt repayment, included in Other income,
net and Interest expense, net, represents the impact of
the debt tender offer on our 2019 Notes and 2039 Notes
during the first quarter of 2016. Amounts are presented
net of tax expense (benefit) of $-, $-, $(1) and $-,
respectively.
(8) Tax adjustments include movements in tax valuation
allowance and tax adjustments not related to core
operations. Second quarter and year to date tax
adjustments were primarily the result of a tax
restructuring and a loss carryback, both of which
resulted in an increase in the Company’s valuation
allowance on credits.
Adjusted net income
Three Months Ended Six Months Ended June 30, June 30,
2016 2015 2016 2015
Net income (loss) attributable to Newmont stockholders $ 23 $ 72 $ 75 $ 255 Loss (income) from discontinued operations
(1) 27 (9) 53 (17)
Net income (loss) attributable to Newmont stockholders from continuing operations 50 63 128 238 Impairment of investments
(2) — 10 — 47
Impairment of long-lived assets (3)
2 2 2 2 Restructuring and other
(4) 4 5 11 7
Acquisition costs (5)
1 5 1 5 Loss (gain) on asset and investment sales
(6) — 1 (104) (27)
Loss on debt repayment (7)
— — 2 — Tax adjustments
(8) 174 45 373 89
Adjusted net income (loss) $ 231 $ 131 $ 413 $ 361
Net income (loss) per share, basic $ 0.04 $ 0.14 $ 0.14 $ 0.51
Loss (income) from discontinued operations, net of taxes 0.05 (0.01) 0.10 (0.03)
Net income (loss) attributable to Newmont stockholders from continuing operations 0.09 0.13 0.24 0.48 Impairment of investments, net of taxes — 0.02 — 0.09 Impairment of long-lived assets, net of taxes — — — — Restructuring and other, net of taxes 0.01 0.01 0.02 0.01 Acquisition costs, net of taxes — 0.01 — 0.01 Loss (gain) on asset and investment sales, net of taxes — — (0.20) (0.05) Loss on debt repayment, net of taxes — — — — Tax adjustments 0.34 0.09 0.72 0.18
Adjusted net income (loss) per share, basic $ 0.44 $ 0.26 $ 0.78 $ 0.72
Net income (loss) per share, diluted $ 0.04 $ 0.14 $ 0.14 $ 0.51
Loss (income) from discontinued operations, net of taxes 0.05 (0.01) 0.10 (0.03)
Net income (loss) attributable to Newmont stockholders from continuing operations 0.09 0.13 0.24 0.48 Impairment of investments, net of taxes — 0.02 — 0.09 Impairment of long-lived assets, net of taxes — — — — Restructuring and other, net of taxes 0.01 0.01 0.02 0.01 Acquisition costs, net of taxes — 0.01 — 0.01 Loss (gain) on asset and investment sales, net of taxes — — (0.20) (0.05) Loss on debt repayment, net of taxes — — — — Tax adjustments 0.34 0.09 0.72 0.18
Adjusted net income (loss) per share, diluted $ 0.44 $ 0.26 $ 0.78 $ 0.72
Newmont Mining Corporation I Q2 2016 earnings I Slide 39July 21, 2016
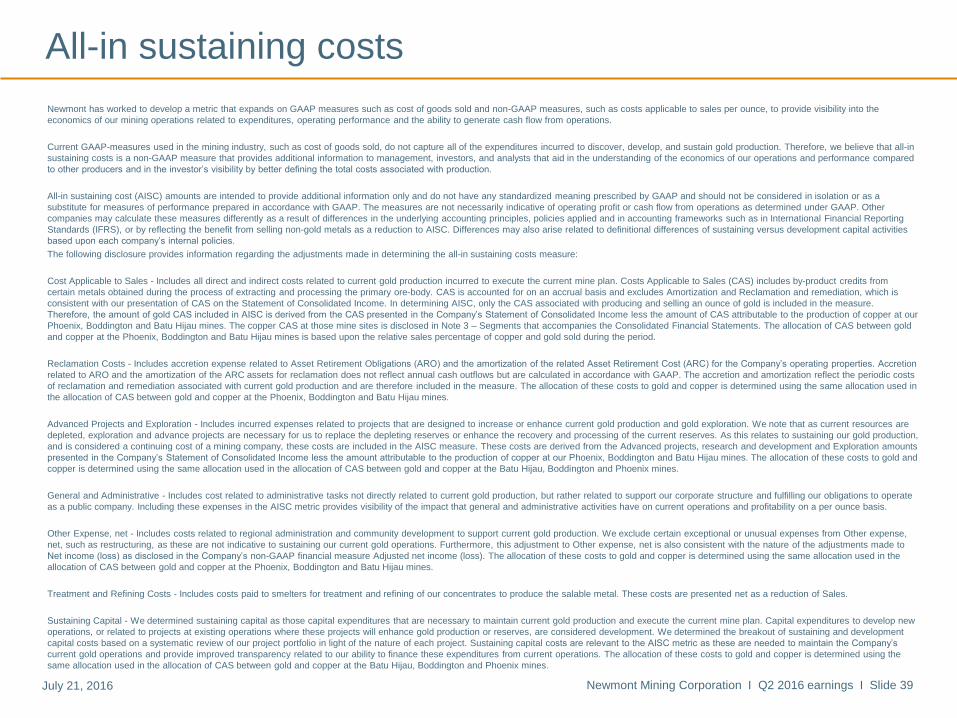
Newmont has worked to develop a metric that expands on GAAP measures such as cost of goods sold and non-GAAP measures, such as costs applicable to sales per ounce, to provide visibility into the
economics of our mining operations related to expenditures, operating performance and the ability to generate cash flow from operations.
Current GAAP-measures used in the mining industry, such as cost of goods sold, do not capture all of the expenditures incurred to discover, develop, and sustain gold production. Therefore, we believe that all-in
sustaining costs is a non-GAAP measure that provides additional information to management, investors, and analysts that aid in the understanding of the economics of our operations and performance compared
to other producers and in the investor’s visibility by better defining the total costs associated with production.
All-in sustaining cost (AISC) amounts are intended to provide additional information only and do not have any standardized meaning prescribed by GAAP and should not be considered in isolation or as a
substitute for measures of performance prepared in accordance with GAAP. The measures are not necessarily indicative of operating profit or cash flow from operations as determined under GAAP. Other
companies may calculate these measures differently as a result of differences in the underlying accounting principles, policies applied and in accounting frameworks such as in International Financial Reporting
Standards (IFRS), or by reflecting the benefit from selling non-gold metals as a reduction to AISC. Differences may also arise related to definitional differences of sustaining versus development capital activities
based upon each company’s internal policies.
The following disclosure provides information regarding the adjustments made in determining the all-in sustaining costs measure:
Cost Applicable to Sales - Includes all direct and indirect costs related to current gold production incurred to execute the current mine plan. Costs Applicable to Sales (CAS) includes by-product credits from
certain metals obtained during the process of extracting and processing the primary ore-body. CAS is accounted for on an accrual basis and excludes Amortization and Reclamation and remediation, which is
consistent with our presentation of CAS on the Statement of Consolidated Income. In determining AISC, only the CAS associated with producing and selling an ounce of gold is included in the measure.
Therefore, the amount of gold CAS included in AISC is derived from the CAS presented in the Company’s Statement of Consolidated Income less the amount of CAS attributable to the production of copper at our
Phoenix, Boddington and Batu Hijau mines. The copper CAS at those mine sites is disclosed in Note 3 – Segments that accompanies the Consolidated Financial Statements. The allocation of CAS between gold
and copper at the Phoenix, Boddington and Batu Hijau mines is based upon the relative sales percentage of copper and gold sold during the period.
Reclamation Costs - Includes accretion expense related to Asset Retirement Obligations (ARO) and the amortization of the related Asset Retirement Cost (ARC) for the Company’s operating properties. Accretion
related to ARO and the amortization of the ARC assets for reclamation does not reflect annual cash outflows but are calculated in accordance with GAAP. The accretion and amortization reflect the periodic costs
of reclamation and remediation associated with current gold production and are therefore included in the measure. The allocation of these costs to gold and copper is determined using the same allocation used in
the allocation of CAS between gold and copper at the Phoenix, Boddington and Batu Hijau mines.
Advanced Projects and Exploration - Includes incurred expenses related to projects that are designed to increase or enhance current gold production and gold exploration. We note that as current resources are
depleted, exploration and advance projects are necessary for us to replace the depleting reserves or enhance the recovery and processing of the current reserves. As this relates to sustaining our gold production,
and is considered a continuing cost of a mining company, these costs are included in the AISC measure. These costs are derived from the Advanced projects, research and development and Exploration amounts
presented in the Company’s Statement of Consolidated Income less the amount attributable to the production of copper at our Phoenix, Boddington and Batu Hijau mines. The allocation of these costs to gold and
copper is determined using the same allocation used in the allocation of CAS between gold and copper at the Batu Hijau, Boddington and Phoenix mines.
General and Administrative - Includes cost related to administrative tasks not directly related to current gold production, but rather related to support our corporate structure and fulfilling our obligations to operate
as a public company. Including these expenses in the AISC metric provides visibility of the impact that general and administrative activities have on current operations and profitability on a per ounce basis.
Other Expense, net - Includes costs related to regional administration and community development to support current gold production. We exclude certain exceptional or unusual expenses from Other expense,
net, such as restructuring, as these are not indicative to sustaining our current gold operations. Furthermore, this adjustment to Other expense, net is also consistent with the nature of the adjustments made to
Net income (loss) as disclosed in the Company’s non-GAAP financial measure Adjusted net income (loss). The allocation of these costs to gold and copper is determined using the same allocation used in the
allocation of CAS between gold and copper at the Phoenix, Boddington and Batu Hijau mines.
Treatment and Refining Costs - Includes costs paid to smelters for treatment and refining of our concentrates to produce the salable metal. These costs are presented net as a reduction of Sales.
Sustaining Capital - We determined sustaining capital as those capital expenditures that are necessary to maintain current gold production and execute the current mine plan. Capital expenditures to develop new
operations, or related to projects at existing operations where these projects will enhance gold production or reserves, are considered development. We determined the breakout of sustaining and development
capital costs based on a systematic review of our project portfolio in light of the nature of each project. Sustaining capital costs are relevant to the AISC metric as these are needed to maintain the Company’s
current gold operations and provide improved transparency related to our ability to finance these expenditures from current operations. The allocation of these costs to gold and copper is determined using the
same allocation used in the allocation of CAS between gold and copper at the Batu Hijau, Boddington and Phoenix mines.
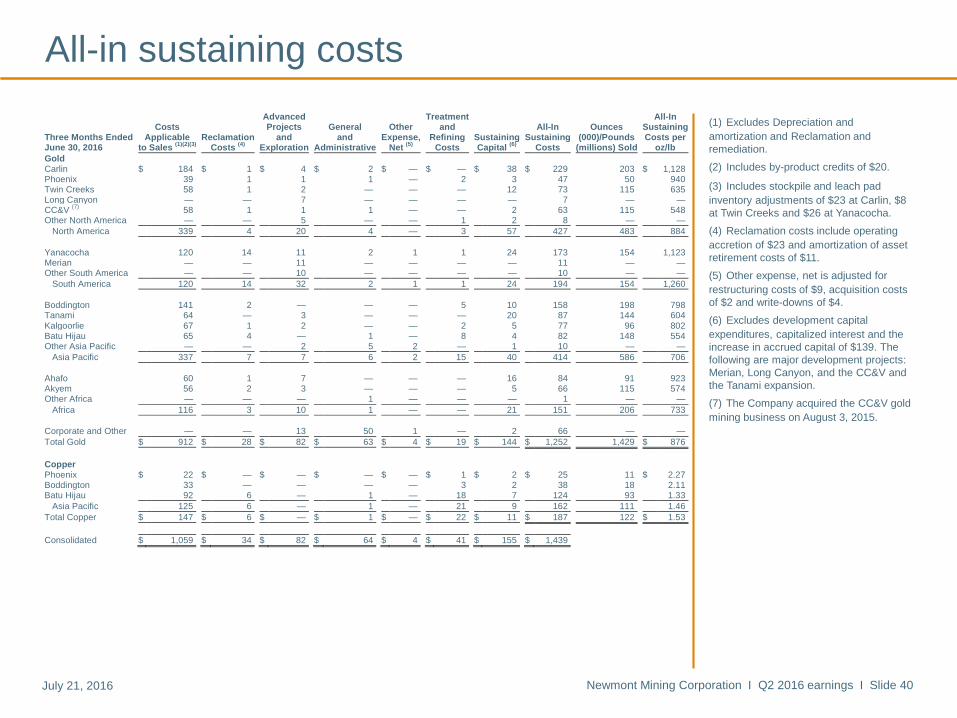
All-in sustaining costs
Newmont Mining Corporation I Q2 2016 earnings I Slide 40July 21, 2016
(1) Excludes Depreciation and
amortization and Reclamation and
remediation.
(2) Includes by-product credits of $20.
(3) Includes stockpile and leach pad
inventory adjustments of $23 at Carlin, $8
at Twin Creeks and $26 at Yanacocha.
(4) Reclamation costs include operating
accretion of $23 and amortization of asset
retirement costs of $11.
(5) Other expense, net is adjusted for
restructuring costs of $9, acquisition costs
of $2 and write-downs of $4.
(6) Excludes development capital
expenditures, capitalized interest and the
increase in accrued capital of $139. The
following are major development projects:
Merian, Long Canyon, and the CC&V and
the Tanami expansion.
(7) The Company acquired the CC&V gold
mining business on August 3, 2015.
All-in sustaining costs
Advanced Treatment All-In Costs Projects General Other and All-In Ounces Sustaining Three Months Ended Applicable Reclamation and and Expense, Refining Sustaining Sustaining (000)/Pounds Costs per June 30, 2016 to Sales
(1)(2)(3) Costs
(4) Exploration Administrative Net
(5) Costs Capital
(6) Costs (millions) Sold oz/lb
Gold Carlin $ 184 $ 1 $ 4 $ 2 $ — $ — $ 38 $ 229 203 $ 1,128 Phoenix 39 1 1 1 — 2 3 47 50 940 Twin Creeks 58 1 2 — — — 12 73 115 635 Long Canyon — — 7 — — — — 7 — — CC&V
(7) 58 1 1 1 — — 2 63 115 548
Other North America — — 5 — — 1 2 8 — —
North America 339 4 20 4 — 3 57 427 483 884
Yanacocha 120 14 11 2 1 1 24 173 154 1,123 Merian — — 11 — — — — 11 — — Other South America — — 10 — — — — 10 — —
South America 120 14 32 2 1 1 24 194 154 1,260
Boddington 141 2 — — — 5 10 158 198 798 Tanami 64 — 3 — — — 20 87 144 604
Kalgoorlie 67 1 2 — — 2 5 77 96 802 Batu Hijau 65 4 — 1 — 8 4 82 148 554 Other Asia Pacific — — 2 5 2 — 1 10 — —
Asia Pacific 337 7 7 6 2 15 40 414 586 706
Ahafo 60 1 7 — — — 16 84 91 923 Akyem 56 2 3 — — — 5 66 115 574 Other Africa — — — 1 — — — 1 — —
Africa 116 3 10 1 — — 21 151 206 733
Corporate and Other — — 13 50 1 — 2 66 — —
Total Gold $ 912 $ 28 $ 82 $ 63 $ 4 $ 19 $ 144 $ 1,252 1,429 $ 876
Copper Phoenix $ 22 $ — $ — $ — $ — $ 1 $ 2 $ 25 11 $ 2.27 Boddington 33 — — — — 3 2 38 18 2.11 Batu Hijau 92 6 — 1 — 18 7 124 93 1.33
Asia Pacific 125 6 — 1 — 21 9 162 111 1.46
Total Copper $ 147 $ 6 $ — $ 1 $ — $ 22 $ 11 $ 187 122 $ 1.53
Consolidated $ 1,059 $ 34 $ 82 $ 64 $ 4 $ 41 $ 155 $ 1,439
Newmont Mining Corporation I Q2 2016 earnings I Slide 41July 21, 2016
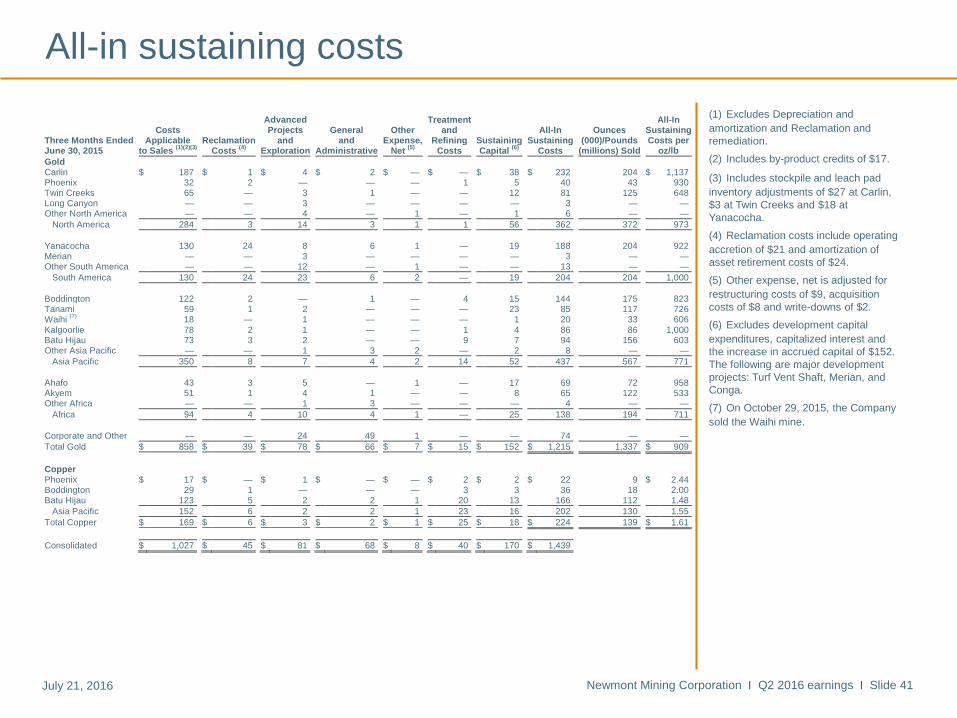
All-in sustaining costs
(1) Excludes Depreciation and
amortization and Reclamation and
remediation.
(2) Includes by-product credits of $17.
(3) Includes stockpile and leach pad
inventory adjustments of $27 at Carlin,
$3 at Twin Creeks and $18 at
Yanacocha.
(4) Reclamation costs include operating
accretion of $21 and amortization of
asset retirement costs of $24.
(5) Other expense, net is adjusted for
restructuring costs of $9, acquisition
costs of $8 and write-downs of $2.
(6) Excludes development capital
expenditures, capitalized interest and
the increase in accrued capital of $152.
The following are major development
projects: Turf Vent Shaft, Merian, and
Conga.
(7) On October 29, 2015, the Company
sold the Waihi mine.
Advanced Treatment All-In
Costs Projects General Other and All-In Ounces Sustaining Three Months Ended Applicable Reclamation and and Expense, Refining Sustaining Sustaining (000)/Pounds Costs per June 30, 2015 to Sales
(1)(2)(3) Costs
(4) Exploration Administrative Net
(5) Costs Capital
(6) Costs (millions) Sold oz/lb
Gold Carlin $ 187 $ 1 $ 4 $ 2 $ — $ — $ 38 $ 232 204 $ 1,137 Phoenix 32 2 — — — 1 5 40 43 930 Twin Creeks 65 — 3 1 — — 12 81 125 648 Long Canyon — — 3 — — — — 3 — — Other North America — — 4 — 1 — 1 6 — —
North America 284 3 14 3 1 1 56 362 372 973
Yanacocha 130 24 8 6 1 — 19 188 204 922 Merian — — 3 — — — — 3 — — Other South America — — 12 — 1 — — 13 — —
South America 130 24 23 6 2 — 19 204 204 1,000
Boddington 122 2 — 1 — 4 15 144 175 823 Tanami 59 1 2 — — — 23 85 117 726 Waihi
(7) 18 — 1 — — — 1 20 33 606
Kalgoorlie 78 2 1 — — 1 4 86 86 1,000 Batu Hijau 73 3 2 — — 9 7 94 156 603 Other Asia Pacific — — 1 3 2 — 2 8 — —
Asia Pacific 350 8 7 4 2 14 52 437 567 771
Ahafo 43 3 5 — 1 — 17 69 72 958 Akyem 51 1 4 1 — — 8 65 122 533 Other Africa — — 1 3 — — — 4 — —
Africa 94 4 10 4 1 — 25 138 194 711
Corporate and Other — — 24 49 1 — — 74 — —
Total Gold $ 858 $ 39 $ 78 $ 66 $ 7 $ 15 $ 152 $ 1,215 1,337 $ 909
Copper Phoenix $ 17 $ — $ 1 $ — $ — $ 2 $ 2 $ 22 9 $ 2.44 Boddington 29 1 — — — 3 3 36 18 2.00 Batu Hijau 123 5 2 2 1 20 13 166 112 1.48
Asia Pacific 152 6 2 2 1 23 16 202 130 1.55
Total Copper $ 169 $ 6 $ 3 $ 2 $ 1 $ 25 $ 18 $ 224 139 $ 1.61
Consolidated $ 1,027 $ 45 $ 81 $ 68 $ 8 $ 40 $ 170 $ 1,439
Newmont Mining Corporation I Q2 2016 earnings I Slide 42July 21, 2016
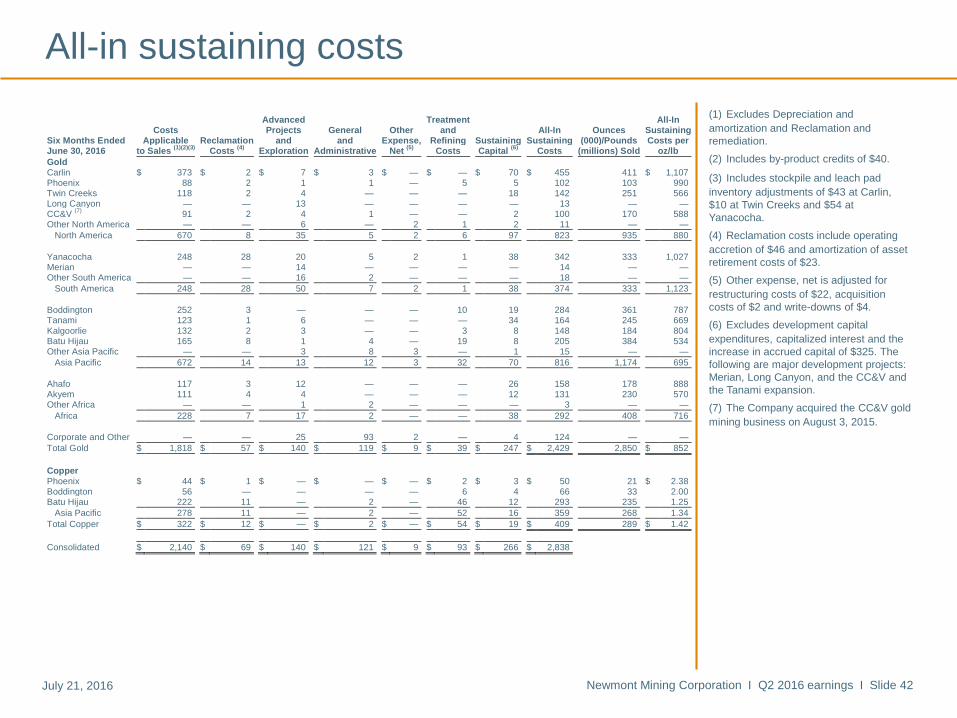
All-in sustaining costs
(1) Excludes Depreciation and
amortization and Reclamation and
remediation.
(2) Includes by-product credits of $40.
(3) Includes stockpile and leach pad
inventory adjustments of $43 at Carlin,
$10 at Twin Creeks and $54 at
Yanacocha.
(4) Reclamation costs include operating
accretion of $46 and amortization of asset
retirement costs of $23.
(5) Other expense, net is adjusted for
restructuring costs of $22, acquisition
costs of $2 and write-downs of $4.
(6) Excludes development capital
expenditures, capitalized interest and the
increase in accrued capital of $325. The
following are major development projects:
Merian, Long Canyon, and the CC&V and
the Tanami expansion.
(7) The Company acquired the CC&V gold
mining business on August 3, 2015.
Advanced Treatment All-In Costs Projects General Other and All-In Ounces Sustaining Six Months Ended Applicable Reclamation and and Expense, Refining Sustaining Sustaining (000)/Pounds Costs per June 30, 2016 to Sales
(1)(2)(3) Costs
(4) Exploration Administrative Net
(5) Costs Capital
(6) Costs (millions) Sold oz/lb
Gold Carlin $ 373 $ 2 $ 7 $ 3 $ — $ — $ 70 $ 455 411 $ 1,107 Phoenix 88 2 1 1 — 5 5 102 103 990 Twin Creeks 118 2 4 — — — 18 142 251 566 Long Canyon — — 13 — — — — 13 — — CC&V
(7) 91 2 4 1 — — 2 100 170 588
Other North America — — 6 — 2 1 2 11 — —
North America 670 8 35 5 2 6 97 823 935 880
Yanacocha 248 28 20 5 2 1 38 342 333 1,027 Merian — — 14 — — — — 14 — — Other South America — — 16 2 — — — 18 — —
South America 248 28 50 7 2 1 38 374 333 1,123
Boddington 252 3 — — — 10 19 284 361 787 Tanami 123 1 6 — — — 34 164 245 669
Kalgoorlie 132 2 3 — — 3 8 148 184 804 Batu Hijau 165 8 1 4 — 19 8 205 384 534 Other Asia Pacific — — 3 8 3 — 1 15 — —
Asia Pacific 672 14 13 12 3 32 70 816 1,174 695
Ahafo 117 3 12 — — — 26 158 178 888 Akyem 111 4 4 — — — 12 131 230 570 Other Africa — — 1 2 — — — 3 — —
Africa 228 7 17 2 — — 38 292 408 716
Corporate and Other — — 25 93 2 — 4 124 — —
Total Gold $ 1,818 $ 57 $ 140 $ 119 $ 9 $ 39 $ 247 $ 2,429 2,850 $ 852
Copper Phoenix $ 44 $ 1 $ — $ — $ — $ 2 $ 3 $ 50 21 $ 2.38 Boddington 56 — — — — 6 4 66 33 2.00 Batu Hijau 222 11 — 2 — 46 12 293 235 1.25
Asia Pacific 278 11 — 2 — 52 16 359 268 1.34
Total Copper $ 322 $ 12 $ — $ 2 $ — $ 54 $ 19 $ 409 289 $ 1.42
Consolidated $ 2,140 $ 69 $ 140 $ 121 $ 9 $ 93 $ 266 $ 2,838
Newmont Mining Corporation I Q2 2016 earnings I Slide 43July 21, 2016
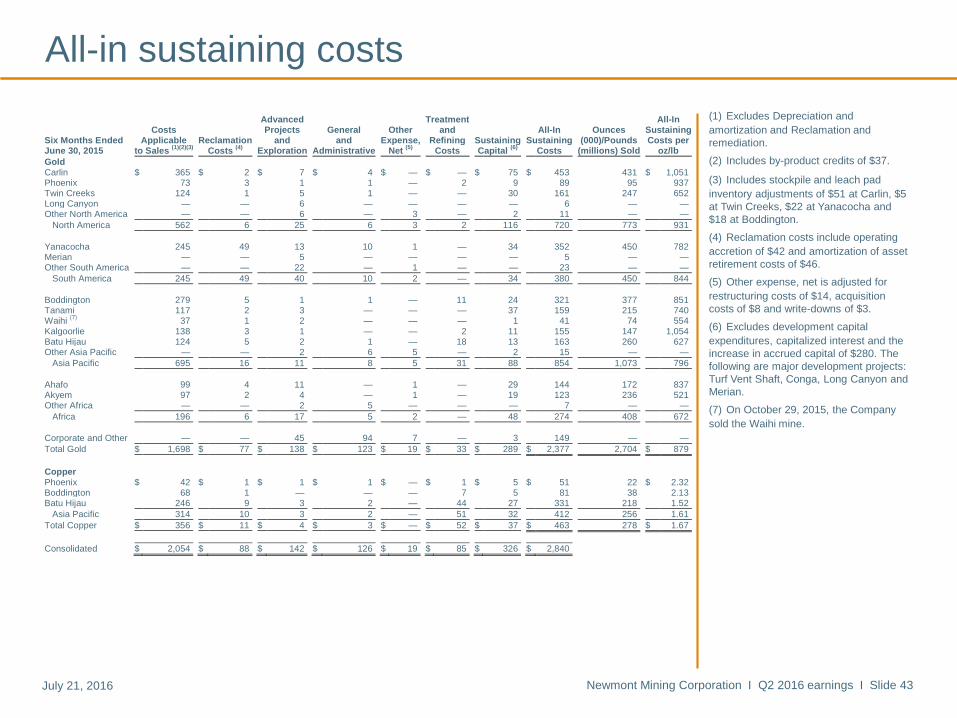
All-in sustaining costs
(1) Excludes Depreciation and
amortization and Reclamation and
remediation.
(2) Includes by-product credits of $37.
(3) Includes stockpile and leach pad
inventory adjustments of $51 at Carlin, $5
at Twin Creeks, $22 at Yanacocha and
$18 at Boddington.
(4) Reclamation costs include operating
accretion of $42 and amortization of asset
retirement costs of $46.
(5) Other expense, net is adjusted for
restructuring costs of $14, acquisition
costs of $8 and write-downs of $3.
(6) Excludes development capital
expenditures, capitalized interest and the
increase in accrued capital of $280. The
following are major development projects:
Turf Vent Shaft, Conga, Long Canyon and
Merian.
(7) On October 29, 2015, the Company
sold the Waihi mine.
Advanced Treatment All-In Costs Projects General Other and All-In Ounces Sustaining Six Months Ended Applicable Reclamation and and Expense, Refining Sustaining Sustaining (000)/Pounds Costs per June 30, 2015 to Sales
(1)(2)(3) Costs
(4) Exploration Administrative Net
(5) Costs Capital
(6) Costs (millions) Sold oz/lb
Gold Carlin $ 365 $ 2 $ 7 $ 4 $ — $ — $ 75 $ 453 431 $ 1,051 Phoenix 73 3 1 1 — 2 9 89 95 937 Twin Creeks 124 1 5 1 — — 30 161 247 652 Long Canyon — — 6 — — — — 6 — — Other North America — — 6 — 3 — 2 11 — —
North America 562 6 25 6 3 2 116 720 773 931
Yanacocha 245 49 13 10 1 — 34 352 450 782 Merian — — 5 — — — — 5 — — Other South America — — 22 — 1 — — 23 — —
South America 245 49 40 10 2 — 34 380 450 844
Boddington 279 5 1 1 — 11 24 321 377 851 Tanami 117 2 3 — — — 37 159 215 740 Waihi
(7) 37 1 2 — — — 1 41 74 554
Kalgoorlie 138 3 1 — — 2 11 155 147 1,054 Batu Hijau 124 5 2 1 — 18 13 163 260 627 Other Asia Pacific — — 2 6 5 — 2 15 — —
Asia Pacific 695 16 11 8 5 31 88 854 1,073 796
Ahafo 99 4 11 — 1 — 29 144 172 837 Akyem 97 2 4 — 1 — 19 123 236 521 Other Africa — — 2 5 — — — 7 — —
Africa 196 6 17 5 2 — 48 274 408 672
Corporate and Other — — 45 94 7 — 3 149 — —
Total Gold $ 1,698 $ 77 $ 138 $ 123 $ 19 $ 33 $ 289 $ 2,377 2,704 $ 879
Copper Phoenix $ 42 $ 1 $ 1 $ 1 $ — $ 1 $ 5 $ 51 22 $ 2.32 Boddington 68 1 — — — 7 5 81 38 2.13 Batu Hijau 246 9 3 2 — 44 27 331 218 1.52
Asia Pacific 314 10 3 2 — 51 32 412 256 1.61
Total Copper $ 356 $ 11 $ 4 $ 3 $ — $ 52 $ 37 $ 463 278 $ 1.67
Consolidated $ 2,054 $ 88 $ 142 $ 126 $ 19 $ 85 $ 326 $ 2,840
Newmont Mining Corporation I Q2 2016 earnings I Slide 44July 21, 2016
EndnotesInvestors are encouraged to read the information contained in this presentation in conjunction with the following notes, the Cautionary Statement on slide 2 and the factors described under the “Risk Factors”
section of the Company’s Form 10-K, filed with the SEC on or about February 17, 2016, and disclosure in the Company’s recent SEC filings.
1. Historical AISC or All-in sustaining cost is a non-GAAP metric. See slides 39 to 43 for more information and a reconciliation to the nearest GAAP metric. All-in sustaining cost (“AISC”) as used in the
Company’s Outlook is a non-GAAP metric defined as the sum of cost applicable to sales (including all direct and indirect costs related to current gold production incurred to execute on the current mine
plan), remediation costs (including operating accretion and amortization of asset retirement costs), G&A, exploration expense, advanced projects and R&D, treatment and refining costs, other expense, net
of one-time adjustments and sustaining capital. See also note 6 below.
2. Free cash flow is a non-GAAP metric and is generated from Net cash provided from continuing operations less Additions to property, plant and mine development. See slide 32 and 33 for more information
and for a reconciliation to the nearest GAAP metric. Newmont’s Free Cash Flow Per Share is calculated using company disclosures and competitors’ Free Cash Flow Per Share is calculated using Cash
From Operations less Capital Expenditures as sourced from Thomson Reuters.
3. EBITDA is a non-GAAP financial measure calculated as Earnings before interest, taxes and depreciation and amortization. The EBITDA figures for competitors used in this presentation were calculated by
Thomson Reuters. For management’s EBITDA calculations and reconciliation to the nearest GAAP metric, please see slide 34 for more information. Adjusted EBITDA is also a non-GAAP metric. Please
refer also to slide 34 for a reconciliation of Adjusted EBITDA to the nearest GAAP metric.
4. Investors are cautioned that no assurances can be made with respect to the closing of the pending sale of the Company’s interest in PTNNT, which remains contingent on conditions precedent – certain of
which are outside of the control of the Company. Conditions precedent include the receipt of regulatory approvals, buyer shareholder approval, government approval of the PTNNT share transfer,
maintenance of valid export license at closing, the concurrent closing of the PTMDB sale of its 24 percent stake to the buyer, resolution of certain tax matters, and no occurrence of material adverse events
that would substantially impact the future value of Batu Hijau. Potential additional risks include other political, regulatory or legal challenges and community and labor issues. The amount of contingent
payment will also remain subject to risks and uncertainties, including copper prices and future production and development at Batu Hijau and Elang. Gross cash proceeds to Newmont from PTNNT
represents total cash to be received upon closing of the transaction and is not intended to represent cash proceeds net of closing costs. See also slide 2 for the cautionary note regarding forward-looking
statements.
5. Outlook projections used in this presentation are considered “forward-looking statements” and represent management’s good faith estimates or expectations of future production results as of July 20, 2016.
Outlook is based upon certain assumptions, including, but not limited to, metal prices, oil prices, certain exchange rates and other assumptions. For example, 2016 Outlook assumes $1,300/oz Au, $2.00/lb
Cu, $0.75 USD/AUD exchange rate and $50/barrel WTI; AISC and CAS cost estimates do not include inflation, for the remainder of the year. Production, AISC and capital estimates exclude projects that
have not yet been approved (NW Exodus, Twin Underground, Batu Phase 7, Ahafo Mill Expansion and Subika Underground). The potential impact on inventory valuation as a result of lower prices, input
costs, and project decisions are not included as part of this Outlook. Such assumptions may prove to be incorrect and actual results may differ materially from those anticipated. Consequently, Outlook
cannot be guaranteed. As such, investors are cautioned not to place undue reliance upon Outlook and forward-looking statements as there can be no assurance that the plans, assumptions or expectations
upon which they are placed will occur.
6. U.S. investors are reminded that reserves were prepared in compliance with Industry Guide 7 published by the SEC. Whereas, the term resource, measured resource, indicated resources and inferred
resources are not SEC recognized terms. Newmont has determined that such resources would be substantively the same as those prepared using the Guidelines established by the Society of Mining,
Metallurgy and Exploration and defined as Mineral Resource. Estimates of resources are subject to further exploration and development, are subject to additional risks, and no assurance can be given that
they will eventually convert to future reserves. Inferred resources, in particular, have a great amount of uncertainty as to their existence and their economic and legal feasibility. Investors are cautioned not
to assume that any part or all of the inferred resource exists, or is economically or legally mineable. Inventory and upside potential have a greater amount of uncertainty. Investors are cautioned that drill
results illustrated in certain graphics in this presentation are not necessarily indicative of future results or future production. Even if significant mineralization is discovered and converted to reserves, during
the time necessary to ultimately move such mineralization to production the economic and legal feasibility of production may change. As such, investors are cautioned against relying upon those estimates.
For more information regarding the Company’s reserves, see the Company’s Annual Report filed with the SEC on February 17, 2016 for the Proven and Probable Reserve tables prepared in compliance
with the SEC’s Industry Guide 7, which is available at www.sec.gov or on the Company’s website. Investors are further reminded that the reserve and resource estimates used in this presentation are
estimates as of December 31, 2015.
7. Adjusted Net Income is a non-GAAP metric. See slides 37 and 38 for more information and reconciliation to the nearest GAAP metric.
8. ROCE is a non-GAAP metric and utilizes rolling 12 month adjusted earnings before interest and taxes (Adjusted EBIT) over average total capital less average cash & equivalents. Competitor average is
weighted based on total enterprise value (June 30, 2016). Newmont’s ROCE is calculated as shown on slides 35 and 36 and competitor’s Adjusted EBIT, Total Capital and Cash & Equivalents are sourced
from Bloomberg.