Embed Size (px)
Citation preview
Quality Assurance Project Plan: Bioretention Capture
Efficacy of PCBs from Stormwater–
RSMP Effectiveness Study
December 2016
Alternate Formats Available

Quality Assurance Project Plan: Bioretention Capture Efficacy of PCBs from Stormwater–RSMP Effectiveness Study
Prepared for:
Washington State Department of Ecology In partial fulfillment of Interagency Agreement C1700015
Submitted by:
Richard Jack King County Water and Land Resources Division Department of Natural Resources and Parks
Funded by:
Pooled Resources of the Regional Stormwater Monitoring Program

Quality Assurance Project Plan: Bioretention Capture Efficacy of PCBs from Stormwater–RSMP Effectiveness Study
King County Science and Technical Support Section i December 2016
Citation
King County. 2016. Quality Assurance Project Plan: Bioretention Capture Efficacy of PCBs
from Stormwater–RSMP Effectiveness Study. Prepared by Richard Jack, Water and
Land Resources Division. Seattle, Washington.
Quality Assurance Project Plan: Bioretention Capture Efficacy of PCBs from Stormwater–RSMP Effectiveness Study
King County Science and Technical Support Section ii December 2016
Table of Contents
Approvals ................................................................................................................................................................. v
1.0 Background ............................................................................................................................................... 1
1.1 PCBs Background and Relevant Environmental Behavior ................................................ 1
2.0 Project Objectives ................................................................................................................................... 3
3.0 Project Description ................................................................................................................................ 7
3.1 Study Area ............................................................................................................................................. 9
3.2 Contaminants of Interest ..............................................................................................................10
4.0 Organization and Schedule ...............................................................................................................12
5.0 Quality Objectives .................................................................................................................................15
5.1 Precision ..............................................................................................................................................15
5.2 Bias ........................................................................................................................................................15
5.3 Sensitivity............................................................................................................................................15
5.4 Accuracy ..............................................................................................................................................15
6.0 Sampling Design ....................................................................................................................................17
6.1 Site Description .................................................................................................................................17
6.2 Mesocosm System Design ............................................................................................................... 3
6.3 Qualifying Storm Event Criteria for Sampling ......................................................................17
6.4 Measured Parameters ....................................................................................................................18
6.5 Representativeness .........................................................................................................................18
6.6 Comparability ....................................................................................................................................18
6.7 Completeness ....................................................................................................................................19
7.0 Sampling and Monitoring Procedures ..........................................................................................20
7.1 Pump Rate and Flow Meter Installation and Confirmation .............................................20
7.2 Sample Collection – Influent and Effluent ..............................................................................20
7.3 Sample Collection – Soils ...............................................................................................................21
7.4 Sampling Initiation ..........................................................................................................................21
7.4.1 Monitoring Forecast ..................................................................................................................21
7.4.2 Sampling Initiation Procedures ............................................................................................21
7.5 Installation Considerations ..........................................................................................................21
7.6 Additional Field Equipment .........................................................................................................21
Quality Assurance Project Plan: Bioretention Capture Efficacy of PCBs from Stormwater–RSMP Effectiveness Study
King County Science and Technical Support Section iii December 2016
7.7 Sample Handling Procedures ......................................................................................................22
7.7.1 Sample Delivery and Storage .................................................................................................22
7.7.2 Chain of Custody .........................................................................................................................24
7.7.3 Sample Documentation ............................................................................................................24
7.8 Decontamination Procedures......................................................................................................25
7.9 Collection of QA/QC Samples ......................................................................................................25
7.10 Periodic Preventative Maintenance ..........................................................................................26
8.0 Measurement Procedures .................................................................................................................27
8.1 PCB Congener Analytical Methods and Detection Limits .................................................27
9.0 Quality Control .......................................................................................................................................30
9.1 PCB Congeners ..................................................................................................................................31
9.2 Corrective Action for QC Problems ...........................................................................................32
9.3 Flow Data ............................................................................................................................................32
9.4 Audits ....................................................................................................................................................32
10.0 Data Management, Verification, and Reporting ........................................................................33
10.1 Data Storage .......................................................................................................................................33
10.2 Analytical Data Verification and Validation ...........................................................................33
10.2.1 Flow Data ......................................................................................................................................33
10.2.2 Analytical Data ............................................................................................................................33
10.2.3 Rain Gauge Data ..........................................................................................................................34
10.3 Data Reduction, Review, and Reporting ..................................................................................34
11.0 Data Quality Assessment and Data Analysis ..............................................................................35
12.0 References ...............................................................................................................................................37
Figures
Figure 1. Study Area Location in Seattle, Washington....................................................................10
Figure 2. Layout of WSDOT Ship Canal Stormwater Research Facility with vault inlet-
drain lines shown. See Figure 3 for pump piping ............................................................ 4
Figure 3. Schematic of Mesocosm Placement Area; mesocosms not sampled during
this study are part of the Taylor et al. (2016) study. ..................................................... 5
Quality Assurance Project Plan: Bioretention Capture Efficacy of PCBs from Stormwater–RSMP Effectiveness Study
King County Science and Technical Support Section iv December 2016
Tables
Sample types collected by project quarter ......................................................................... 8 Table 1.
Team Member Contact Information ...................................................................................13 Table 2.
Schedule of Tasks .......................................................................................................................13 Table 3.
Parameter List with Sample Volume, Container, Preservation, Storage, and Table 4.
Holding Time Requirements..................................................................................................24
QA/QC Samples Required .......................................................................................................25 Table 5.
Soil and Water Detection Limits for PCB Congeners ....................................................28 Table 6.
Labeled Surrogates and Recovery Standards Used for EPA Method 1668C Table 7.
PCB Congener Analysis ............................................................................................................31
PCBs QA/QC Frequency and Acceptance Criteria .........................................................31 Table 8.
Pacific Rim Laboratory Data Qualifiers .............................................................................33 Table 9.
Appendix
Chain of Custody Forms .................................................................................................................................. A-1
Quality Assurance Project Plan: Bioretention Capture Efficacy of PCBs from Stormwater–RSMP Effectiveness Study
King County Science and Technical Support Section v December 2016
APPROVALS
Richard Jack, King County Date
Project Manager
Deb Lester, King County Date
Toxicology and Contaminant Assessment Unit Supervisor
Colin Elliott, King County Date
Environmental Laboratory Quality Assurance Officer
Brandi Lubliner, Washington State Department of Ecology Date
Bill Moore, Washington State Department of Ecology Date
Certification
I certify under penalty of law, that this document and all attachments were prepared under
my direction or supervision in accordance with a system designed to assure that qualified
personnel properly gathered and evaluated the information submitted. Based on my
inquiry of the person or persons who manage the system or those persons directly
responsible for gathering information, the information submitted is, to the best of my
knowledge and belief, true, accurate, and complete. I am aware that there are significant
penalties for submitting false information, including the possibility of fine and
imprisonment for willful violations.
Distribution List
Brandi Lubliner ...............................Washington State Department of Ecology
Karen Dinicola ................................Washington State Department of Ecology
Fritz Grothkopp ...............................King County Environmental Laboratory
Jay Davis .........................................U.S. Fish and Wildlife Service
Jenifer McIntyre ..............................Washington State University
Alex Taylor .....................................Washington State University

Quality Assurance Project Plan: Bioretention Capture Efficacy of PCBs from Stormwater–RSMP Effectiveness Study
King County Science and Technical Support Section vi December 2016
This page intentionally left blank.

Quality Assurance Project Plan: Bioretention Capture Efficacy of PCBs from Stormwater–RSMP Effectiveness Study
King County Science and Technical Support Section 1 December 2016
1.0 BACKGROUND
The Regional Stormwater Monitoring Program (RSMP) is a collaboration of western
Washington municipal stormwater permittees, state, and federal agencies. The Stormwater
Work Group (SWG) oversees the implementation of the RSMP. The RSMP was designed to
meet MS4 permittee stormwater monitoring needs. Further, the RSMP provides a structure
that allows permittees to pool resources and conduct effectiveness studies to improve
municipal stormwater management. The goals of RSMP effectiveness studies are to
measure the effectiveness of various stormwater management activities, best management
practices (BMPs), and to communicate findings to the regions’ professionals.
The 2013–2018 Western Washington Phase I and Phase II Municipal Stormwater General
Permits (permits) require the use of Low Impact Development (LID) where feasible and
bioretention is a commonly utilized LID BMP in Western Washington. Some jurisdictions
also use the term “rain gardens,” which are informally designed and built bioretention-like
structures. Because rain gardens are not engineered structures under the stormwater
permits, their variable properties are not the focus of this project. Bioretention facilities
have design specifications which are described under BMP T7.30 in the Washington State
Department of Ecology’s (Ecology) Stormwater Management Manual for Western
Washington (SMMWW). The default bioretention soil mixture (BSM) is 60% sand, 40%
compost (Ecology, 2012). The focus of this study is to evaluate the degree to which the
default BSM removes polychlorinated biphenyls (PCBs) from stormwater. The study goals
are to determine if PCBs are captured from stormwater by the BSM, and to estimate the
efficacy of capture and retention of PCBs over a two-year period. The degree to which PCB’s
are captured and retained by BSM in the Pacific Northwest is currently unknown.
Funding for this project comes from the municipal stormwater permittees via the RSMP.
Results are also intended to inform regional stormwater managers, Ecology, and other
researchers conducting studies on bioretention soil mixtures.
1.1 PCBs Background and Relevant Environmental
Behavior
Production of PCBs was banned in the United States under the Toxic Substances Control
Act in 1977 (15 USC 2605[e]); they are typically considered a legacy contaminant.
However, despite this ban, PCBs remain in current use products (like caulks and paints
[SAIC 2011]) and persist in a variety of environmental reservoirs such as contaminated
soils, sediments, water bodies, and fish tissue due to their long half-lives (i.e., months to
years) (Ayris and Harrad 1999). Individual chlorinated biphenyl molecules are called
congeners and are identified by the number and position of the chlorine atoms around the
biphenyl rings. There are 209 possible PCB congeners. When manufactured, PCBs were
made by passing chlorine gas over a mixture of biphenyl molecules; this produced a mix of
congeners and these mixtures were sold as products called Aroclors. Some individual PCB
congeners are still incidentally produced during the manufacture of other chemicals
Quality Assurance Project Plan: Bioretention Capture Efficacy of PCBs from Stormwater–RSMP Effectiveness Study
King County Science and Technical Support Section 2 December 2016
(Rodenburg et al. 2010). These congeners can be found at low levels in numerous products;
yellow inks are particularly noteworthy for their incidental PCB content.
PCBs are semi-volatile, meaning they can volatilize from environmental reservoirs and
consumer products. Atmospheric transport and redeposition of PCBs is a well-documented
phenomenon, especially in colder northern climates where snow scavenging of
atmospheric PCBs is especially prominent (Wania et al. 1998, Daly and Wania 2004).
Atmospheric PCBs also readily sorb onto the “organic film” on urban surfaces (Diamond
et al. 2000, Simpson et al. 2005). These physical and chemical attributes contribute to the
prevalence of PCBs in urban stormwater and substantial urban stormwater loads (Parsons
and Terragraphics 2007, King County 2013).
Over 180 water bodies in Washington State are classified as impaired due to elevated PCB
concentrations in sediment, water, and fish tissue. In addition, the Washington Department
of Health (WADOH) has established 14 fish consumption advisories based on elevated PCB
levels in fish or shellfish. A recent study determined that urban stormwater contributes
roughly 60% of the total PCB load to Lake Washington, while direct atmospheric deposition
of PCBs contributes 14%; combined they represent about three-quarters of the total
loading (King County 2013). Four quarterly samples in 2011–2012 documented total PCB
concentrations in runoff from the I-90 floating bridge between 3,300 and 16,000 pg/L.
Literature on the PCB load reducing performance of bioretention BMPs is limited. One rain
garden study in San Francisco documented the successful removal of 80+% of the PCBs
from urban stormwaters (Gilbreath et al. 2012). Dissolved PCBs bind to their organic
carbon fraction of BSM, usually provided by compost, while the highly permeable sand
filters out particulate associated PCBs. However, a number of laboratory, field, and
chemical modeling studies have demonstrated that PCBs can also readily volatilize from
soils to the atmosphere (Harner et al. 1995, Kurt-Karakus and Jones 2006, Cabrerizo et al.
2011, Hippelein and McLachlan 1998, Hippelein and McLachlan 2000). No study to date
has addressed the question of overall year-to-year effectiveness of BSM to capture and
retain PCBs from stormwater. Soil loss studies and models further suggest that PCBs
captured by bioretention soils will in part volatilize and cycle back to the urban
environment.
To understand BSM capability to remove and retain PCBs, this project will document the
retention of PCBs in BSM by measuring PCBs levels in bioretention soils over time and the
stormwater flowing into and out of a bioretention study cell (also called a mesocosm).
There will likely be loss of PCBs from the BSM due to volatilization; however, this project
will not directly measure PCB losses. The goal of this study is to evaluate for the first time: a
common stormwater BMP’s efficacy to remove PCBs from Western Washington urban
stormwater, and document the multiyear effectiveness of PCB sequestration in BSM.
There is significant regional interest in developing and understanding bioretention soil
mixes that effectively treat common stormwater pollutants. This project shares a study
design and facilities with another RSMP project looking at improving the default BSM with
fungal soil amendments. The companion study is being conducted by Washington State

Quality Assurance Project Plan: Bioretention Capture Efficacy of PCBs from Stormwater–RSMP Effectiveness Study
King County Science and Technical Support Section 3 December 2016
University and the US Fish and Wildlife Service (WSU/USFWS). Taylor et al. (2016)
describes their project.
Because the chemical properties of PCBs vary by congener, evaluation of PCB losses from
the mesocosms through volatilization or outflows will be based on both an individual
congener basis, as well as total PCBs (sum of detected congeners). The congener specific
mass balance will provide a conceptual model of PCB congener behavior in the mesocom
bioretention cells with and without plants. Combined, the conceptual model and mass
balance will describe the potential effectiveness of Western Washington bioretention cells
to reduce PCB loadings to receiving water bodies. PCB degradation in soils is minimal due
to the approximately seven-year half-life of PCBs in soils (Sinkkonen and Paasivirta 2000).
Soil degradation rates in the conceptual model may be estimated using published
literature.
Ensuring that bioretention BMPs address PCBs, a stormwater pollutant of high public
health concern, is important to ensure that investments in retrofits reduce the circulation
of PCBs in the environment. The project will inform Ecology and stormwater permittees
regarding the efficacy of the bioretention BMP (T7.30) in the SMMWW (Ecology 2014) and
the Rain Garden Design Manual (Hinman 2013). These guidance documents are heavily
utilized by permit writers and municipal stormwater managers. This information will help
Ecology and permittees use state-of-the-art technology and the best available science.
1.2 Mesocosm System Design
This study is using biorentention mesocosms built by WSU/USFWS (Taylor et al. 2016).
Briefly, they are stainless steel 55-gallon drums with BSM, a gravel underdrain, and a 2-
inch slotted PVC outlet. Approximately 18-inches of 60/40 BSM is above the underdrain
layer. All sands, composts, and gravels used in their construction, along with their
compaction and permeability, conform to SMMWWW BMP T7.30 specifications.
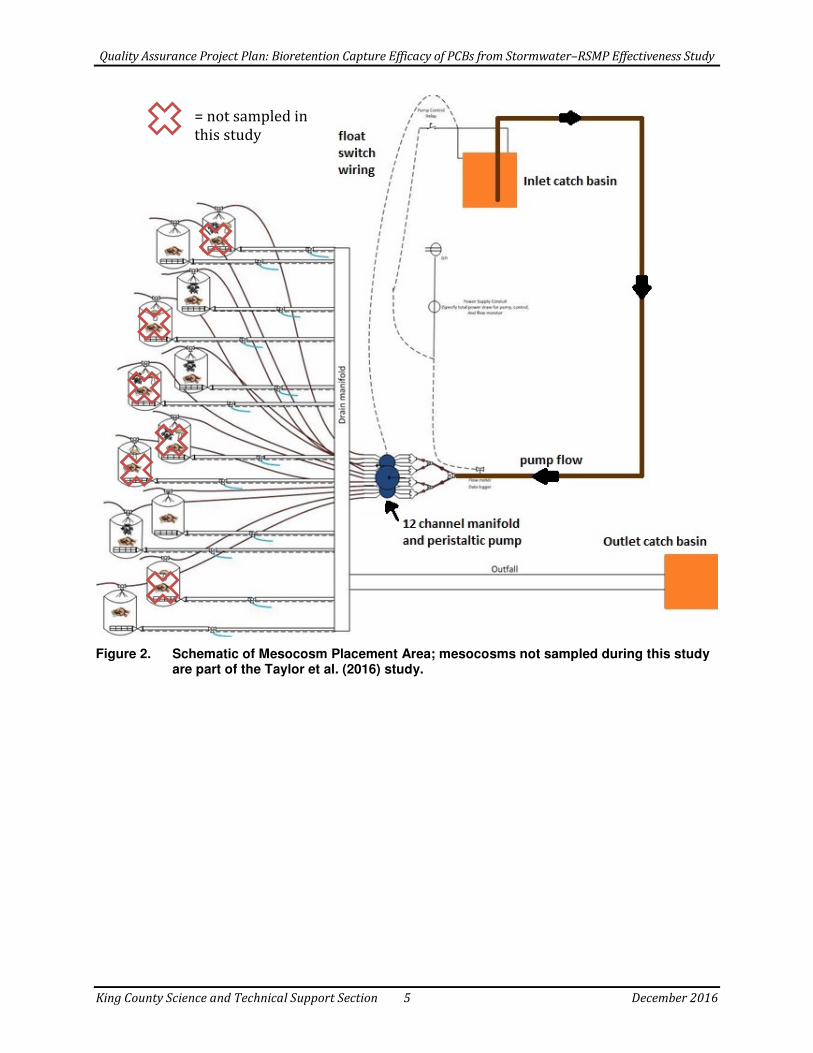
This study will use a multichannel pump to deliver the equivalent of a 6 month 24-hour
storm event to each mesocosm whenever there is 2 cm or more of water in the vault
(Figure 2). Based on the surface area of each 55-gallon drum, this is 117mL/min per
mesocosm (Taylor et al. 2016). A float switch located inside the vault will trigger the
pumps (Figure 3). A flow totalizer on the pump inlet will confirm that desired flow rates
are being achieved and measure the total quantity of stormwater dosed. Flow will be
continuously monitored at the pump inlet throughout the project period.
Quality Assurance Project Plan: Bioretention Capture Efficacy of PCBs from Stormwater–RSMP Effectiveness Study
King County Science and Technical Support Section 4 December 2016
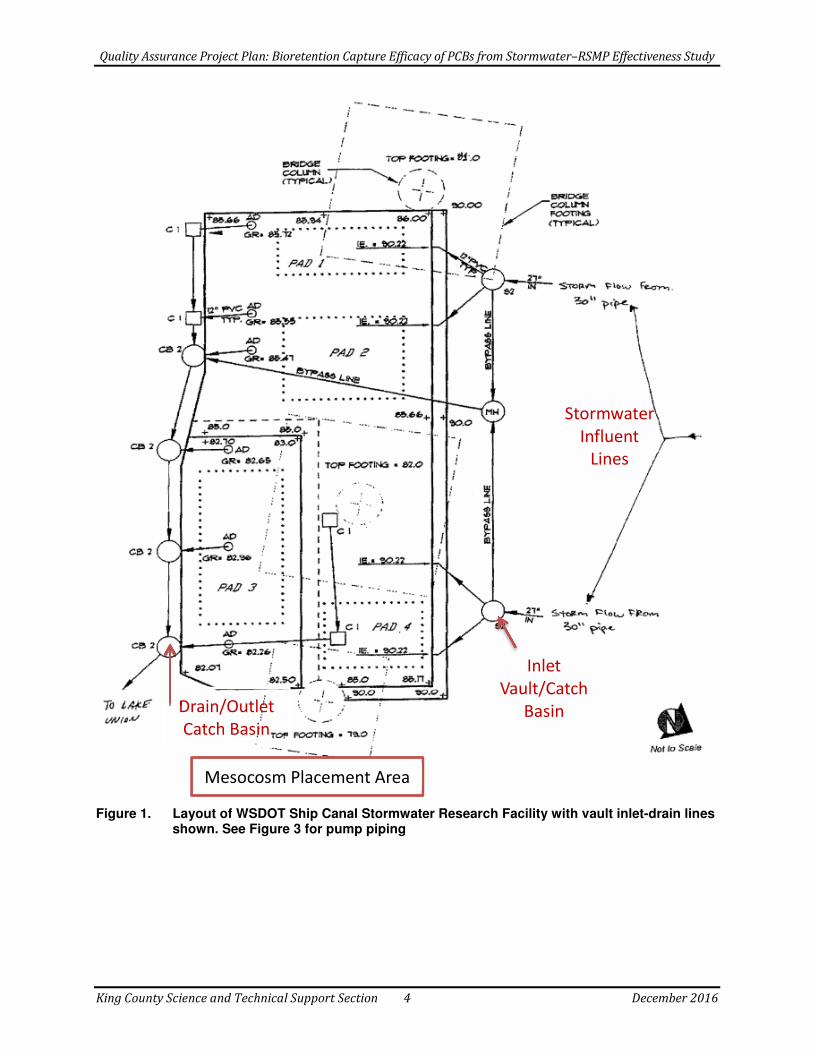
Figure 1. Layout of WSDOT Ship Canal Stormwater Research Facility with vault inlet-drain lines shown. See Figure 3 for pump piping
Mesocosm Placement Area
Stormwater
Influent
Lines
Inlet
Vault/Catch
Basin Drain/Outlet
Catch Basin
Quality Assurance Project Plan: Bioretention Capture Efficacy of PCBs from Stormwater–RSMP Effectiveness Study
King County Science and Technical Support Section 5 December 2016
Figure 2. Schematic of Mesocosm Placement Area; mesocosms not sampled during this study are part of the Taylor et al. (2016) study.
= not sampled in
this study
Quality Assurance Project Plan: Bioretention Capture Efficacy of PCBs from Stormwater–RSMP Effectiveness Study
King County Science and Technical Support Section 6 December 2016
2.0 PROJECT OBJECTIVES
This study will evaluate PCB sequestration in mesocosms which are designed to represent
bioretention BMPs. The ultimate objective is to develop a better understanding of how well
BSM captures and retains PCBs across seasons over a two-year period.
The project will address the following specific questions using the data analysis tools
noted:
1. What is the PCB removal (capture) rate in BSM, and does it vary by congener?
a. Evaluated by comparison of paired influent and effluent PCB concentrations
(both as total PCBs and individual congeners) measured during storm
events.
b. Evaluate removal differences with and without plants.
2. What is the wet season PCB sequestration (retention over multiple storm events) in
BSM, and does this vary by congener?
a. Evaluated by comparison of PCB soil concentrations at the beginning of the
wet season (October) relative to end of the wet season concentrations
(May).
b. Evaluate sequestration differences with and without plants.
c. Compare sequestered mass of PCBs with estimated stormwater loads.
3. What is the PCB retention in BSM during the dry season, and does it vary by
congener?
a. Evaluated by comparisons of PCB soil concentrations at the beginning of the
dry season (May) relative to end of the dry season concentrations (October).
b. Evaluate removal differences with and without plants.
Quality Assurance Project Plan: Bioretention Capture Efficacy of PCBs from Stormwater–RSMP Effectiveness Study
King County Science and Technical Support Section 7 December 2016
3.0 PROJECT DESCRIPTION
The study will be conducted in conjunction with the WSU/USFWS bioretention
performance project (Taylor et al. 2016) using mesocosms to evaluate the influence of
plants and fungi on nutrient, metal, and polycyclic aromatic hydrocarbon (PAH) removal
rates (four treatment types total1). Stormwater, from a downspout draining from
Interstate-5 (I-5), will be dispersed to mesocosms constructed in 55-gallon barrels. For the
purposes of this study, only two of WSU/USFWS’s four mesocosm types will be tested:
1. BSM only, and
2. BSM with plants
The influent, effluent, and BSM from the two treatments will be analyzed for PCB
congeners. Three replicate mesocosms for each treatment type will be used (a total of six
mesocosms). Results will be used to calculate a PCB mass balance in the mesocosms over a
two-year period. The mass balance information will answer these questions:
1. What fraction of the PCBs entering the mesocosm from stormwater is sequestered
into BSM? and,
2. To what extent is this PCB removal permanent or seasonal?
Answering these questions will help estimate both seasonal losses of PCBs from BSM and
the lifetime PCB accumulation in a bioretention cell.
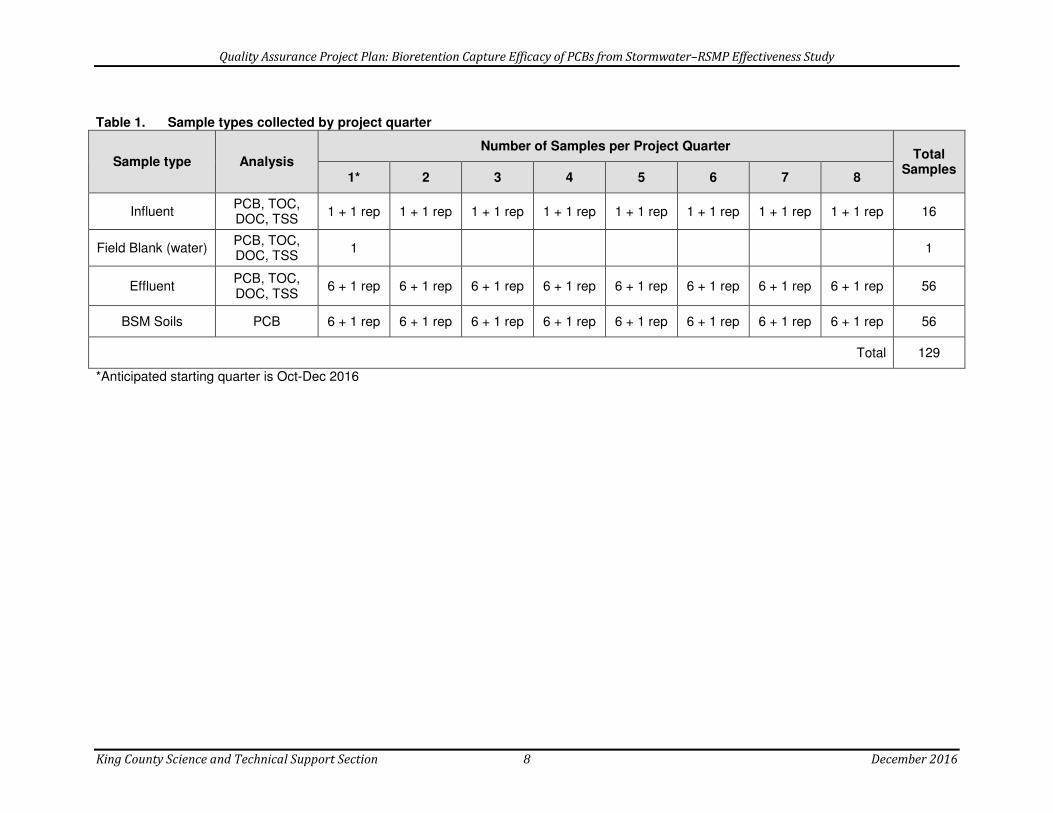
Sampling will be conducted quarterly during eight storm events over a two-year period. An
influent sample and field replicate will be collected during each event for a total of 16
influent samples. Effluent samples will be collected at the same time from each of the
mesocosm replicates. One effluent field replicate will be collected during each sampling
event. With three mesocosms per treatment, eight quarterly events, and one effluent
replicate per event, this is a total of 56 effluent samples. Prior to initiation of sampling, one
pump system field blank2 will be analyzed using laboratory supplied deionized water. No
effluent field blank will be collected. A summary of the type and number of influent and
effluent samples to be collected is presented in Table 1.
1 The four total treatment types are BSM only, BSM with plants, BSM with fungi and no plants, BSM with
plants and fungi. 2 Deionized laboratory water will be pumped from supply jars through all inlet piping, the 12 channel
manifold, peristaltic tubing, and distribution tubing to a new proofed clean sampling jar.
Quality Assurance Project Plan: Bioretention Capture Efficacy of PCBs from Stormwater–RSMP Effectiveness Study
King County Science and Technical Support Section 8 December 2016
Sample types collected by project quarter Table 1.
Sample type Analysis Number of Samples per Project Quarter
Total Samples
1* 2 3 4 5 6 7 8
Influent PCB, TOC, DOC, TSS
1 + 1 rep 1 + 1 rep 1 + 1 rep 1 + 1 rep 1 + 1 rep 1 + 1 rep 1 + 1 rep 1 + 1 rep 16
Field Blank (water) PCB, TOC, DOC, TSS
1 1
Effluent PCB, TOC, DOC, TSS
6 + 1 rep 6 + 1 rep 6 + 1 rep 6 + 1 rep 6 + 1 rep 6 + 1 rep 6 + 1 rep 6 + 1 rep 56
BSM Soils PCB 6 + 1 rep 6 + 1 rep 6 + 1 rep 6 + 1 rep 6 + 1 rep 6 + 1 rep 6 + 1 rep 6 + 1 rep 56
Total 129
*Anticipated starting quarter is Oct-Dec 2016
Quality Assurance Project Plan: Bioretention Capture Efficacy of PCBs from Stormwater–RSMP Effectiveness Study
King County Science and Technical Support Section 9 December 2016
Bioretention soil mix samples will be collected quarterly for two years; BSM samples will
not be collected during storm events. Samples will be collected from the entire 18-inch soil
column, excluding the gravel underdrain portions, using a small (10 mm-diameter)
stainless steel tube driven into the soil (Haglof Soiltax model soil sampler). Each BSM
sample will be composited from at least two tube insertions. Any holes remaining will be
backfilled with BSM to ensure that preferential flow pathways are not created. One field
replicate per treatment type will be collected each quarter. A summary of the number and
type of mesocosm soil samples to be collected is presented above in Table 1.
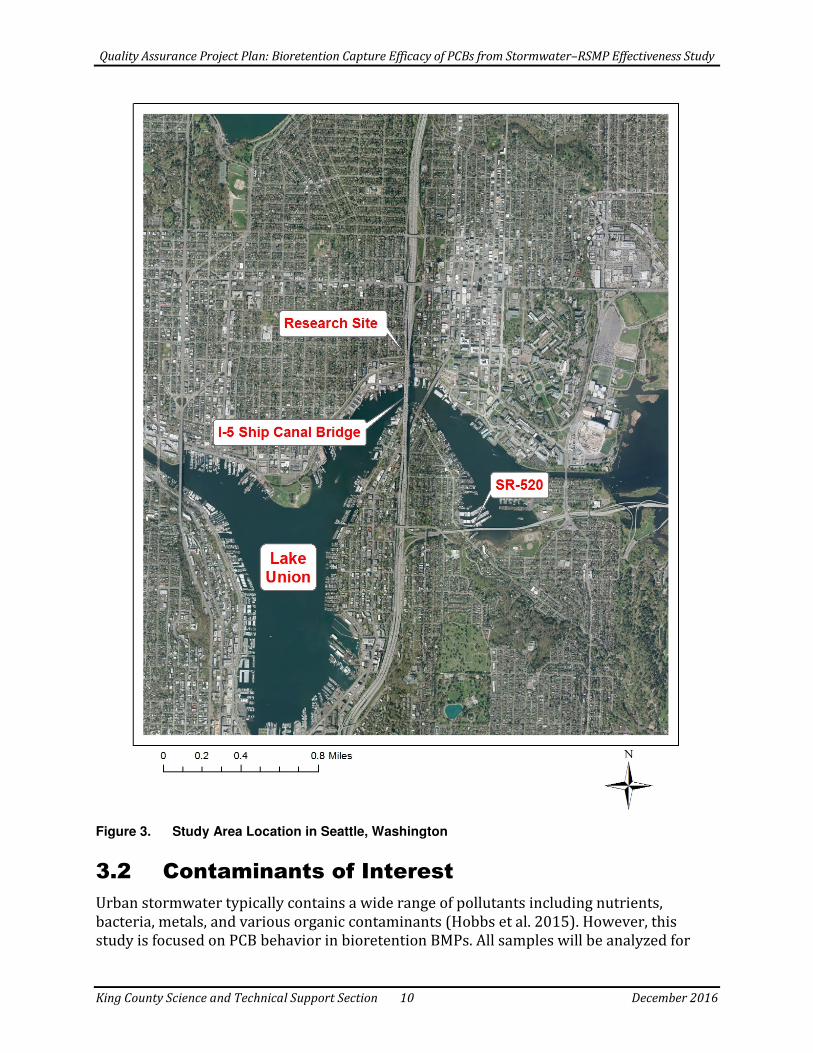
3.1 Study Area
The bioretention mesocosms will be located at the Washington State Department of
Transportation (WSDOT) “Lake Union Ship Canal Research Facility,” located at 650 NE 40th
St., Seattle WA (Figure 1) underneath the north end of the I-5 Ship Canal Bridge. The
mesocosms will receive runoff from a 12.8 hectare (31.6 acres) drainage area including 9.2
hectares (22.7 acres) of I-5 pavement and 3.6 hectares (8.9 acres) of roadside landscaping.
I-5 through Seattle is a major transportation corridor with approximately 250,000 vehicles
per weekday using the Ship Canal Bridge.
Quality Assurance Project Plan: Bioretention Capture Efficacy of PCBs from Stormwater–RSMP Effectiveness Study
King County Science and Technical Support Section 10 December 2016
Figure 3. Study Area Location in Seattle, Washington
3.2 Contaminants of Interest
Urban stormwater typically contains a wide range of pollutants including nutrients,
bacteria, metals, and various organic contaminants (Hobbs et al. 2015). However, this
study is focused on PCB behavior in bioretention BMPs. All samples will be analyzed for
Quality Assurance Project Plan: Bioretention Capture Efficacy of PCBs from Stormwater–RSMP Effectiveness Study
King County Science and Technical Support Section 11 December 2016
PCB congeners. Total suspended solids (TSS), total organic carbon (TOC), and dissolved
organic carbon (DOC) will also be analyzed in the stormwater influent and effluent. These
parameters may help explain the behavior of the PCBs. Measurement of TSS, TOC and DOC
will be conducted by the WSU/USFWS contract laboratory. The measurement quality
objectives for these parameters are covered in the WSU/USFWS QAPP (Taylor et al. 2016)
Quality Assurance Project Plan: Bioretention Capture Efficacy of PCBs from Stormwater–RSMP Effectiveness Study
King County Science and Technical Support Section 12 December 2016
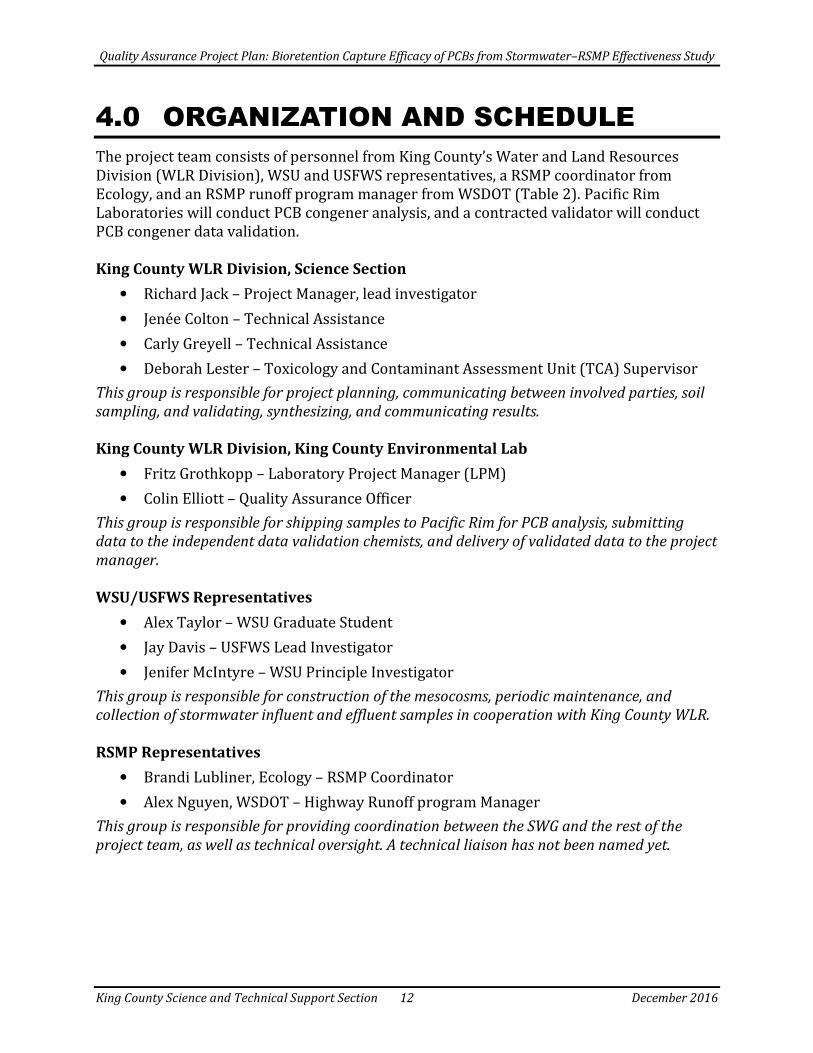
4.0 ORGANIZATION AND SCHEDULE
The project team consists of personnel from King County’s Water and Land Resources
Division (WLR Division), WSU and USFWS representatives, a RSMP coordinator from
Ecology, and an RSMP runoff program manager from WSDOT (Table 2). Pacific Rim
Laboratories will conduct PCB congener analysis, and a contracted validator will conduct
PCB congener data validation.
King County WLR Division, Science Section
• Richard Jack – Project Manager, lead investigator
• Jenée Colton – Technical Assistance
• Carly Greyell – Technical Assistance
• Deborah Lester – Toxicology and Contaminant Assessment Unit (TCA) Supervisor
This group is responsible for project planning, communicating between involved parties, soil
sampling, and validating, synthesizing, and communicating results.
King County WLR Division, King County Environmental Lab
• Fritz Grothkopp – Laboratory Project Manager (LPM)
• Colin Elliott – Quality Assurance Officer
This group is responsible for shipping samples to Pacific Rim for PCB analysis, submitting
data to the independent data validation chemists, and delivery of validated data to the project
manager.
WSU/USFWS Representatives
• Alex Taylor – WSU Graduate Student
• Jay Davis – USFWS Lead Investigator
• Jenifer McIntyre – WSU Principle Investigator
This group is responsible for construction of the mesocosms, periodic maintenance, and
collection of stormwater influent and effluent samples in cooperation with King County WLR.
RSMP Representatives
• Brandi Lubliner, Ecology – RSMP Coordinator
• Alex Nguyen, WSDOT – Highway Runoff program Manager
This group is responsible for providing coordination between the SWG and the rest of the
project team, as well as technical oversight. A technical liaison has not been named yet.

Quality Assurance Project Plan: Bioretention Capture Efficacy of PCBs from Stormwater–RSMP Effectiveness Study
King County Science and Technical Support Section 13 December 2016
Team Member Contact Information Table 2.
Organization Name Contact Information
King County Richard Jack 206-477-4715; [email protected]
King County Carly Greyell 206-477-4703; [email protected]
King County Jenée Colton 206-477-4075; [email protected]
King County Deborah Lester 206-477-4752; [email protected]
King County Fritz Grothkopp 206-477-7114; [email protected]
King County Colin Elliott 206-477-7113; [email protected]
WSU Alex Taylor 360-890-5306; [email protected]
USFWS Jay Davis 360-753-9568; [email protected]
WSU Jenifer McIntyre 206-445-4650; [email protected]
Ecology Brandi Lubliner 360-407-7140; [email protected]
WSDOT Alex Nguyen 206-440-4537; [email protected]
Pacific Rim Laboratories David Hope 604-532-8711; [email protected]
Table 3 details the project schedule and deliverable due dates.
Schedule of Tasks Table 3.
Activity Anticipated
Initiation Date
Anticipated Completion
Date Deliverable
Deliverable Due Date
TASK 2.0 – Water and soil sampling and analysis
Storm Sampling
(8 quarterly storm events) Nov. 2016 June 2018
Documenting Progress Reports
Semi-annually
Soil Sampling
(8 quarterly sampling events) Nov. 2016 June 2018
Documenting Progress Reports
Semi-annually
Analysis at Pacific Rim Laboratories Dec. 2016 July 2018 Documenting Progress Reports
Semi-annually
TASK 3.0 – Data validation, compilation, and database
Data validation Jan. 2017 August 2018 Documenting Progress Reports
Semi-annually
Database Jan. 2017 July-August
2018 Documenting Progress Reports
Semi-annually
TASK 4.0 – Conceptual model, draft and final report
Draft Report Sept. 2018 Oct. 2018 Draft Report Nov 2018
Final Report Nov. 2018 Jan. 2019 Final Report Jan 2019
Quality Assurance Project Plan: Bioretention Capture Efficacy of PCBs from Stormwater–RSMP Effectiveness Study
King County Science and Technical Support Section 14 December 2016
Activity Anticipated
Initiation Date
Anticipated Completion
Date Deliverable
Deliverable Due Date
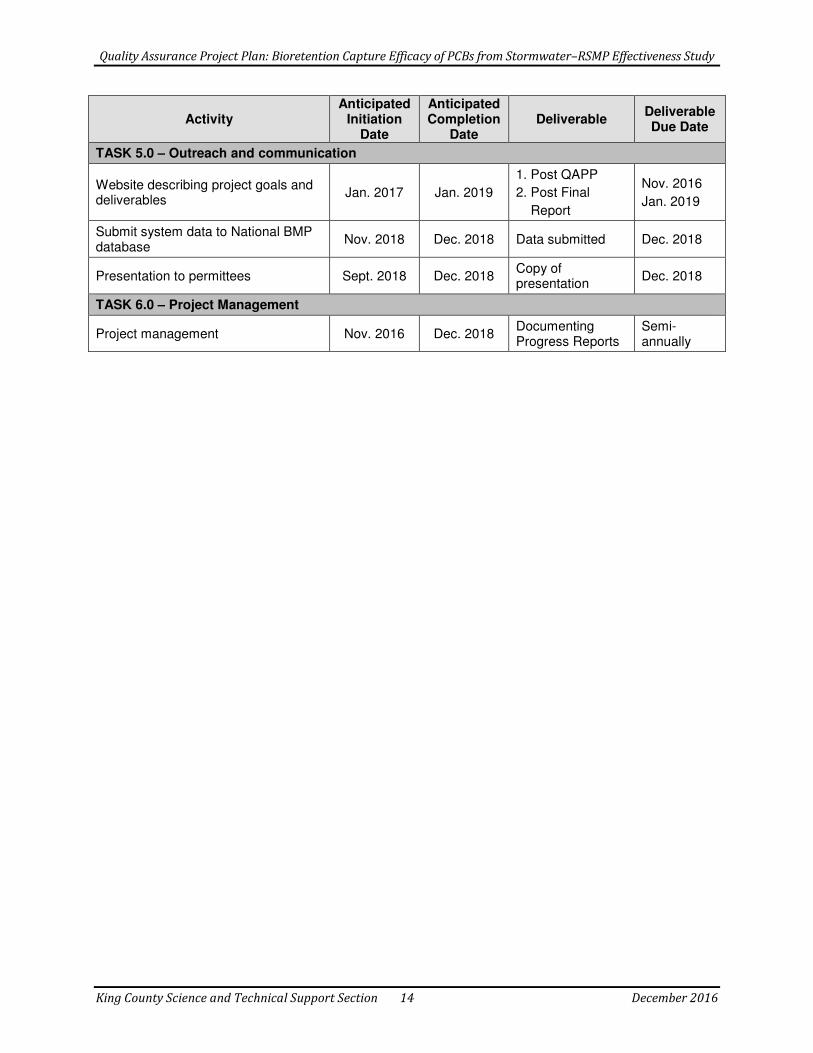
TASK 5.0 – Outreach and communication
Website describing project goals and deliverables
Jan. 2017 Jan. 2019
1. Post QAPP
2. Post Final
Report
Nov. 2016
Jan. 2019
Submit system data to National BMP database
Nov. 2018 Dec. 2018 Data submitted Dec. 2018
Presentation to permittees Sept. 2018 Dec. 2018 Copy of presentation
Dec. 2018
TASK 6.0 – Project Management
Project management Nov. 2016 Dec. 2018 Documenting Progress Reports
Semi-annually

Quality Assurance Project Plan: Bioretention Capture Efficacy of PCBs from Stormwater–RSMP Effectiveness Study
King County Science and Technical Support Section 15 December 2016
5.0 QUALITY OBJECTIVES
The data quality objectives (DQOs) for this effort are to collect data of known and sufficient
quality to meet study goals. The data quality indicators of precision, bias, sensitivity and
accuracy are described within this section, while representativeness, comparability,
completeness are described in Section 6, after the details of the sampling design. Detailed
descriptions and specific limits for quality assurance/quality control (QA/QC) samples are
discussed in Section 9.
5.1 Precision
Precision is the agreement of a set of results among themselves and is a measure of the
ability to reproduce a result. For this project, evaluation of precision will be based on field
replicates, laboratory duplicates or triplicates and matrix spike duplicates. The QA/QC
criteria presented in Section 9 shall be met for precision. Should criteria not be met, data
will be flagged accordingly and conclusions qualified.
5.2 Bias
Bias is a measure of the difference, due to a systematic factor, between an analytical result
and the true value of an analyte. Bias will be evaluated by analyzing field blanks, method
blanks, spike blanks, matrix spikes, certified reference materials, laboratory control
samples and/or surrogates, along with ongoing recovery sample control charts. Results for
these QA/QC samples must be within the criteria presented in Section 9.
5.3 Sensitivity
Sensitivity is a measure of the capability of analytical methods to meet the study goal. The
analytical method being used for PCB congeners is a rigorous, low-level method for water
samples. The analytical method detection limits (MDLs) presented in Section 8 are
sensitive enough to detect low level PCB congeners at concentrations sufficient to increase
the understanding of the effect of bioretention treatments on concentrations and loadings.
While PCBs have not previously been analyzed in effluent from Washington bioretention
BMPs receiving highway runoff, it is expected that many congeners will be detected in
influent and soil samples based on comparable data from the I-90 Bridge (King County
2013). Fewer congeners are expected to be detected in effluent samples, but this should not
limit the study’s ability to describe PCB behavior in the bioretention mesocosms during
individual storms and multiple seasons
5.4 Accuracy
Accuracy is an estimate of the difference between the true value and the measured value.
The accuracy of a result is affected by both systematic and random errors. Accuracy of the
pump rate will be verified by checking the flow rate by measuring the output over 5
Quality Assurance Project Plan: Bioretention Capture Efficacy of PCBs from Stormwater–RSMP Effectiveness Study
King County Science and Technical Support Section 16 December 2016
minutes with a stopwatch and volumetric flask during storm event sampling. Flow rate
checks will occur at least quarterly. Total flow measurements will also be reviewed
(Section 7.1).
Accuracy of the analytical results will be evaluated using field blanks, method blanks,
and/or laboratory control samples, along with ongoing recovery sample control charts.
Results for the analytical QA/QC samples must be within the criteria presented in Section 9.
Additionally, the isotopic dilution method for PCBs is the most rigorous method for
congener analysis and uses isotopically labeled congeners, to track recovery performance
of the range of congeners. Thus, each congener concentration is theoretically adjusted for
the extraction efficiency and analytical performance of that specific sample.

Quality Assurance Project Plan: Bioretention Capture Efficacy of PCBs from Stormwater–RSMP Effectiveness Study
King County Science and Technical Support Section 17 December 2016
6.0 SAMPLING DESIGN
The goal of this study is to evaluate the effectiveness of bioretention to remove and
sequester PCBs from stormwater on both an individual storm and seasonal basis. The
following sections describe the sampling design to achieve the study objectives described
above in Section 2.
6.1 Site Description
Twelve bioretention mesocosms will be located at the WSDOT “Lake Union Ship Canal
Research Facility,” underneath the north end of the Ship Canal Bridge (Figure 1). Only six of
the mesocosms will be used for this study: three with BSM only, and three with BSM and
plants. The remaining mesocosms are for the companion WSU/USFWS study investigating
the influence of fungi on BSM.
The site is gated and secured with a six-foot-tall chain link and barbed wire fence. The
mesocosms will be receiving runoff from a 12.8 hectare (31.6 acres) drainage area
including 9.2 hectares (22.7 acres) of pavement and 3.6 hectares (8.9 acres) of roadside
landscaping. Stormwater drains from the roadway and roadside areas into a large (1.5m x
1.5m) concrete flow splitting vault (Figure 2) before being gravity fed to other existing test
facility catch basins and structures. The stormwater vault is partially below ground;
therefore, it will be necessary to pump the influent from the vault to the mesocosms.
6.2 Qualifying Storm Event Criteria for Sampling
One challenging aspect of stormwater sampling is storm variability. The pump will be float-
triggered to dose the mesocosms continuously whenever stormwater is present in the
supply vault above the switch. The float switch will be set as low as practical within the
vault which is approximately 2 cm above the bottom. This depth is also the minimum water
depth necessary to ensure that air is not entrained into the inlet.
Influent and effluent storm samples will only be collected during rain event conditions as
defined below. The sampling criteria presented below have been adapted from the
Technology Assessment Protocol – Ecology (TAPE) Guidance for Evaluating Emerging
Stormwater Treatment Technologies (Ecology 2011).
Storm Event Conditions to Trigger Effluent/Influent Sampling:
• At least 0.15 inches of rainfall, no fixed maximum
• A minimum one hour storm duration, no fixed maximum
• No antecedent dry period required
• Effluent must be flowing through vault
Quality Assurance Project Plan: Bioretention Capture Efficacy of PCBs from Stormwater–RSMP Effectiveness Study
King County Science and Technical Support Section 18 December 2016
There are no other conditions on the quarterly influent and effluent sample collection and
any storm meeting these goals during the quarter may be sampled. The sampling criteria
described here are less rigorous than those for the Taylor et al. (2016) companion study,
but because samples will typically be collected concurrently, those storm guidelines will
likely dictate the storms sampled for this study. The Seattle Rain Watch program
(http://atmos.washington.edu/SPU/) is the primary source for storm information for this
project. Additional weather and storm information is provided in Taylor et al. (2016). To
the extent possible, influent and effluent samples will be collected during storms of varying
intensity to represent a variety of conditions.
6.3 Measured Parameters
PCB congeners will be analyzed by Pacific Rim Laboratories. The following conventional
parameters will be analyzed by the WSU contracted laboratory (Taylor et al. 2016) for each
stormwater influent and effluent sample:
• Total suspended solids
• Total organic carbon
• Dissolved organic carbon.
6.4 Representativeness
Representativeness expresses the degree to which sample data accurately and precisely
represent a characteristic of a population, parameter variations at the sampling point, or an
environmental condition. Samples are to be collected in such a manner as to minimize
potential contamination and chemical degradation in the water and soils. This can be
achieved by following guidelines for sample carboy decontamination, sample acceptability
criteria, sample processing, observing proper hold-times, preservation, and sample storage,
as described in Sections 7 and 9. In order to reduce the risk of cross-contamination
between mesocosms, all tubing (sampling and sample splitting tubing) will be pre-cleaned
and either new or dedicated to a particular mesocosm, as described in Sections 7.2 and 7.3.
In order to better estimate average PCB concentrations in influent and effluent samples, a
range of storm intensities will be targeted. The samples are intended to generate data of
sufficient quality to allow analysis of treatment effectiveness and seasonal retention of both
total PCBs and individual PCB congeners.
6.5 Comparability
Comparability is a qualitative parameter expressing the confidence with which one data set
can be compared with another. Comparability is addressed through use of standard
techniques to collect and analyze representative samples, along with standardized data
verification and reporting procedures described in this QAPP. Changes or updates to
analytical methods and sampling techniques midway into the project must be tested,
validated, and shown to be equivalent to existing methods. This validation must be
approved by the project manager and QA officers before being implemented.
Quality Assurance Project Plan: Bioretention Capture Efficacy of PCBs from Stormwater–RSMP Effectiveness Study
King County Science and Technical Support Section 19 December 2016
The mesocosms tested here are intended to represent an Ecology-approved stormwater
treatment BMP incorporated into an urban highway retrofit project. Although every retrofit
project is unique due to site considerations, this project will provide transferable
information in the form of (1) PCB removal and retention performance of a common
treatment feature installed under western Washington geological and climate conditions in
an area of high impervious surface, and (2) the collective PCB performance of this
treatment feature and on both stormwater and soil quality over a two year period.
To ensure study findings are relevant to regional needs, the BMP design and sample
analysis should be comparable to those used in other jurisdictions. This will be achieved by
using Ecology-specified BSM to a depth of 18 inches with and without plants. Under the
BSM a gravel layer with an underdrain will mimic a full-scale bioretention BMP (T7.30 as
designed in Ecology’s SMMWW). The influent and effluent collection methods and
reporting limits used in this study are comparable to the 2011 TAPE protocol, except that
approximately 75-minute time-weighted influent and effluent composites will be collected
instead of TAPE specified flow-weighted composites. The number of storm samples
collected in this study will not provide the statistical power achievable through the TAPE
protocols. However, given the variability in highway stormwater PCB concentrations (King
County 2013) it is not cost effective to provide this power for this effort. All sample
containers, preservation methods and holding times, and analytical methods are
comparable or more stringent than those required by the 2011 TAPE protocol.
6.6 Completeness
Completeness is defined as the total number of samples analyzed for which acceptable
analytical data are generated, compared to the total number of samples submitted for
analysis. Sampling according to storm criteria, along with adherence to standardized
sampling and testing protocols outlined in this QAPP, will aid in providing a complete set of
data for this project. The goal is the collection of samples during eight storm events, which
is 100% completeness. BSM sample collection methods may be adapted or modified if
collecting the required number samples by push probe is problematic. If completeness
goals are not achieved, the project team will evaluate if the DQOs can still be met or if
additional samples may be needed.
Quality Assurance Project Plan: Bioretention Capture Efficacy of PCBs from Stormwater–RSMP Effectiveness Study
King County Science and Technical Support Section 20 December 2016
7.0 SAMPLING AND MONITORING
PROCEDURES
Sample collection and flow monitoring procedures are presented here. The following
sections also describe additional sampling considerations, equipment, sampling initiation,
sample handling, decontamination procedures, collection of QA/QC samples, and
preventative maintenance.
7.1 Pump Rate and Flow Meter Installation and
Confirmation
Two Masterflex peristaltic pumps (L/S model with variable speed using a combined 4 and a
2 channel head) will be wired in series with a float switch. The in-series wiring will prevent
both pumps from operating should an electrical failure occur in either pump. The two
pumps will draw water from a common inlet and simultaneously provide 117mL/min of
stormwater influent to all mesocosms. The flow rate will be confirmed before initiation of
sampling by timing the rate laboratory grade water is pumped through the tubing during
the collection of a blank sample. Flow rate will also be confirmed when stormwater influent
and effluent samples are collected by recording the volume of influent pumped over a set
period of time into a volumetric flask.
Total flow data will be downloaded from the flow totalizer (Cole Palmer model EW-32615-
62) at least monthly and whenever storm influents and effluents are collected. Because the
flow meter will be attached to the single inlet tube leading to the 12 channel pumps
(Figure 3), total flow divided by 12 is the volume dosed to each mesocosm since the last
download. Total flow (liters) will be compared with the total runtime (minutes) to double
check that each of the 12 legs of the pump manifold have been dosing at 117mL/min.
7.2 Sample Collection – Influent and Effluent
The pump distribution system (Figure 3) is below the vault inlet. This means that once the
pump has actuated and primed the inlet tubing, influent will potentially siphon from the
vault. The peristaltic pump will prevent more than 117mL/min from dosing each
mesocosm, but the siphon will be used to collect influent samples by installing a diverter
tap before the pump manifold. This study will collect approximately 300mL of influent
from the inlet diverter tap at time zero (minutes), time 25, and time 50 (Taylor et al. 2016).
Taylor et al. (2016) describes the time-paced water sampling in greater detail, although
they are collecting influent samples from different points than this study. This study will
collect two 900-1,000 mL influent samples from the diverter tap during each event to allow
for archiving extra influent samples and required field and laboratory duplicates.
Taylor et al. (2016) describes the effluent composite sampling protocol in detail. Briefly
this involves collecting 2,340 mL aliquots of effluent from each mesocosm’s underdrain
Quality Assurance Project Plan: Bioretention Capture Efficacy of PCBs from Stormwater–RSMP Effectiveness Study
King County Science and Technical Support Section 21 December 2016
with glass carboys. Three aliquots are to be collected total, one from 5 to 25 minutes, one
from 30 to 50 minutes, and on from 55 to 75 minutes. All three aliquots are collected into
the same glass carboy. These carboys will be iced and brought back the laboratory for
splitting. A magnetic stir bar will continuously agitate the carboys will the required sample
jars are filled using a Teflon siphon tube. Two 1L effluent samples will be collected per
mesocosm to provide sufficient effluent for archiving and required field and laboratory
duplicates.
7.3 Sample Collection – Soils
Mesocosm soils will be collected quarterly over a two-year period using a narrow 10mm
diameter stainless steel soil corer (Haglöf Soiltax brand). The corer will be inserted the full
depth (approximately 18 inches) of BSM to collect each sample and any holes remaining
will be backfilled with BSM. The core will be homogenized in a stainless steel bowl using a
pre-cleaned spoon that was wrapped in aluminum foil then transferred to the proofed
clean glass sampling jars.
7.4 Sampling Initiation
7.4.1 Monitoring Forecast
Although it is ideal to randomize sampling days, this is unrealistic for the personnel
resources. Alternatively, the project manager and field team will plan sampling events
around the weather forecast and available personnel. When a qualifying storm is forecast
(as defined in Section 6.2), field personnel will prepare for the upcoming event after a
discussion with the project manager.
7.4.2 Sampling Initiation Procedures
Once the decision is made to initiate sampling, the field staff will gather all materials for
deployment, which may include decontaminated containers, and ice, and proceed to
sampling sites. When collecting or handling sample containers, field personnel will wear
powder-free nitrile gloves for safe handling to prevent cross contamination of samples.
7.5 Installation Considerations
Sampling inlet tube and float switch in the vault may require entering this confined space.
This will be done by personnel who have the training and experience to safely enter these
spaces.
7.6 Additional Field Equipment
Sampling and safety supplies include the following:
• Pre-cleaned stainless steel bowls and spoons
• Ziploc® bags

Quality Assurance Project Plan: Bioretention Capture Efficacy of PCBs from Stormwater–RSMP Effectiveness Study
King County Science and Technical Support Section 22 December 2016
• Cooler with ice
• Nitrile gloves
• Field notebook
• Sample labels
• Chain-of-custody forms
• Camera
• Hard hats
• Safety vests
• Safety shoes
• Safety glasses
When visiting the sampling site, field personnel will record the following information on
field forms that are maintained in a waterproof field notebook:
• Date and time of sample collection/visit
• Name(s) of sampling personnel
• Weather conditions
• Number and type of samples collected
• Pump flow check procedures
• Sequence of events (order of sites sampled)
• Time of flow data download
• Log of photographs taken3
• Comments on the working condition of the sampling equipment
• Deviations from sampling procedures
• Unusual conditions (e.g., water color or turbidity, presence of oil sheen, odors, and
land disturbances)
7.7 Sample Handling Procedures
7.7.1 Sample Delivery and Storage
After sampling is completed, all samples will be stored on ice. Water sample carboys will be
transported back to WSU-Puyallup for splitting into sample containers. Soil samples will be
transported back to KCEL for storage until ready for shipment to the analytical laboratory.
Water samples will be transported from WSU-Puyallup to KCEL on ice and/or ice packs.
3 At a minimum, photos should document the mesocosms, pump outlets, and plant status. Any deviations
from the QAPP or unusual conditions must also be photographed.
Quality Assurance Project Plan: Bioretention Capture Efficacy of PCBs from Stormwater–RSMP Effectiveness Study
King County Science and Technical Support Section 23 December 2016
Containers for PCB congener analysis will be delivered to Pacific Rim Laboratories within
one to three months of sample collection. Samples will be held at KCEL at 4 degrees C in
darkness until shipping. Samples will either be driven to Pacific Rim Laboratories or
shipped via overnight express delivery service.
Table 4 shows sample handling and storage requirements for PCB congeners in soil and
water. Sample handling, preservation, and storage requirements for TOC, DOC, and TSS are
shown in Table 6 of Taylor et al. (2016).

Quality Assurance Project Plan: Bioretention Capture Efficacy of PCBs from Stormwater–RSMP Effectiveness Study
King County Science and Technical Support Section 24 December 2016
Parameter List with Sample Volume, Container, Preservation, Storage, and Holding Table 4.Time Requirements
PCB Congeners
Container
Storage Prior to
Preservation
Preservation Holding Time
Preservation Technique Analysis Holding
Time
Water 2 1-L amber glass
Cool to ≤4° C
NA Cool to ≤4° C in the dark 1 year
Soil 8 oz wide mouth glass
Cool to ≤4° C
NA Cool to ≤4° C in the dark 1 year
7.7.2 Chain of Custody
Chain of custody (COC) will commence at the time the mesocosms are constructed and
installed. Mesocosms and the associated stormwater dosing pumps will be secured behind
a locked chain link and barbed wire fence to ensure no tampering occurs. Thus, all samples
will be under direct possession and control of WSU or King County field personnel. For COC
purposes, closed/latched storm drains, fenced areas, and field vehicles will be considered
“controlled areas.” All sample information will be recorded on a COC form, an example of
which is included as Appendix B. This form will be completed in the field and will
accompany all samples during transport and final delivery to KCEL. Upon arrival at KCEL,
the samples will be preserved as needed, then logged into the laboratory data management
system and stored in a secure refrigerator. The date and time of sample delivery will be
recorded and the COC form will be signed off in the appropriate sections at this time. Once
completed, original COC forms will be archived in the project file.
Samples delivered after regular business hours will be split as needed and stored in a
secure refrigerator until the next day. Samples delivered to the contract laboratory, Pacific
Rim Laboratories, will be accompanied by a properly-completed KCEL COC form and
custody seals will be placed on the shipping cooler. Pacific Rim Laboratories will be
expected to provide a copy of the completed COC form as part of their analytical data
package.
7.7.3 Sample Documentation
Sampling information and sample metadata will be documented using the methods
described below:
• Field sheets generated by King County’s Laboratory Information Management
System (LIMS) will be used at all stations and will include the following information:
1. Sample ID number
2. Locator/station name
3. In-vault water depth at initiation and termination of sample collection.
4. Date and time of sample collection (start and end times of the compositing
period)
5. Initials of all sampling personnel
Quality Assurance Project Plan: Bioretention Capture Efficacy of PCBs from Stormwater–RSMP Effectiveness Study
King County Science and Technical Support Section 25 December 2016
• LIMS-generated container labels will identify each container with a unique sample
number, station and site names, collect date, analyses required, and preservation
method.
• The field sheet will contain records of collection times, general weather, and the
names of field crew.
• COC documentation will consist of the Lab’s standard COC form, which is used to
track release and receipt of each sample from collection to arrival at the lab.
7.8 Decontamination Procedures
Before mesocosms are dosed, all equipment in contact with influents or effluents will be
decontaminated. Carboys and their associated Teflon® tubing shall be cleaned with:
(1) Alconox® or other suitable laboratory detergent; (2) a sulfuric acid rinse; (3) a
deionized water rinse; and only for non-tubing surfaces, (4) an acetone rinse. In a previous
study, it was determined that acetone lingering in autosampler tubing can interfere with
TOC and DOC analysis (King County 2014b); therefore, tubing will not be rinsed with
acetone. All tubing, fittings, and connectors are either nylon, Teflon®, or platinum-cured
silicon4 and are to be cleaned in the same manner. Composite sample bottles tubing will be
cleaned prior to each sampling event. Acetone solvent rinses shall be used for carboys per
Environmental Protection Agency (EPA) methods 1668C and 1613.
The soil corer, homogenization bowls, and spoons will be precleaned according to steps 1
through 4 above. After air drying, equipment will be wrapped in aluminum foil until use in
the field.
Proofed clean PCB sampling containers will be supplied by the contract laboratory. Proper
personal protective equipment (new powder-free gloves for each site) should be worn
during sampling activities and during decontamination processes.
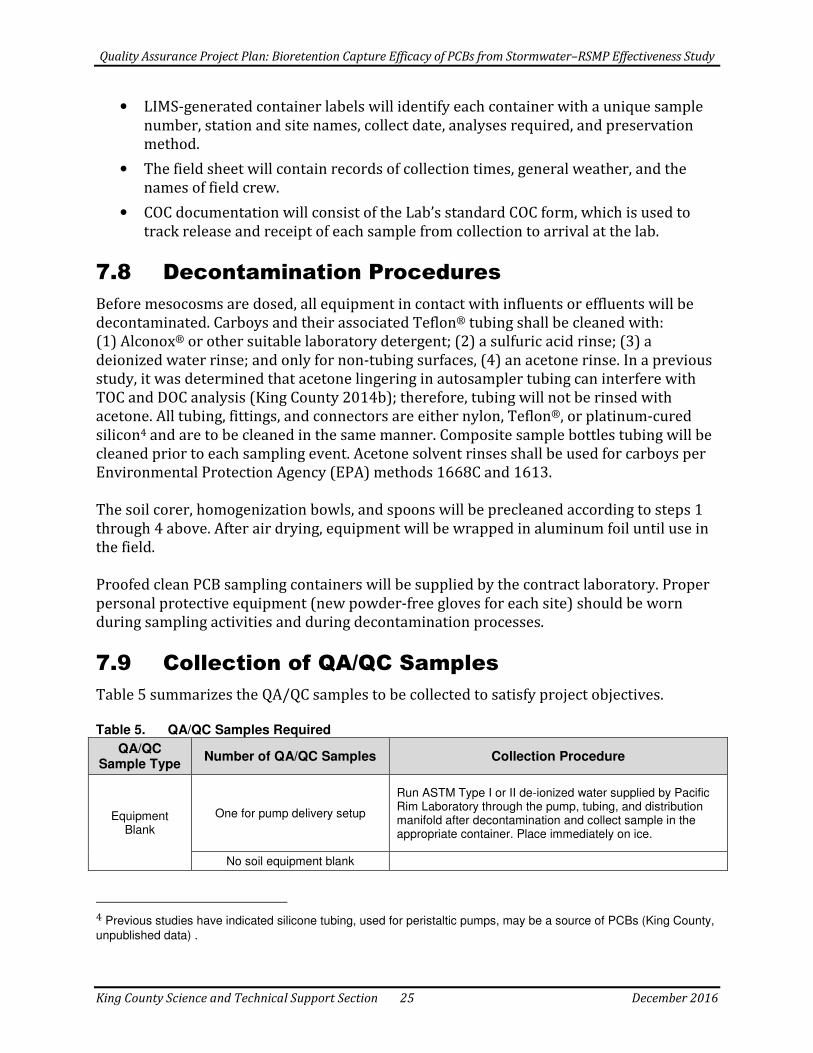
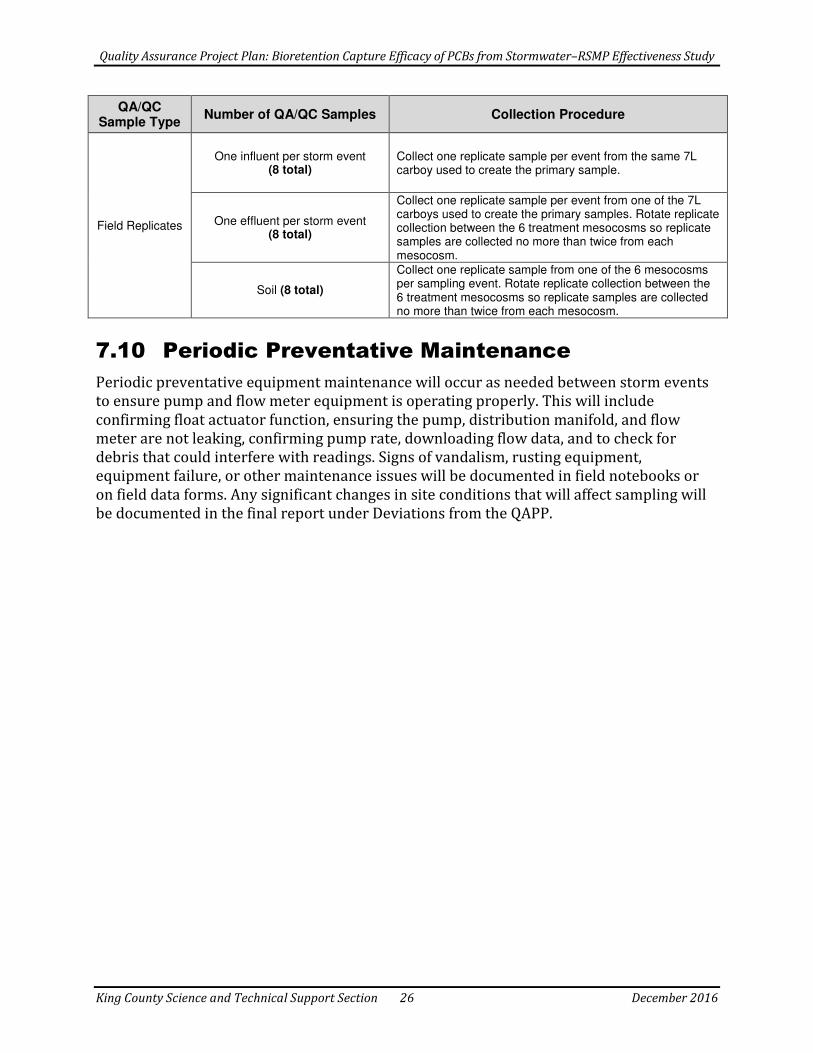
7.9 Collection of QA/QC Samples
Table 5 summarizes the QA/QC samples to be collected to satisfy project objectives.
QA/QC Samples Required Table 5.
QA/QC Sample Type
Number of QA/QC Samples Collection Procedure
Equipment Blank
One for pump delivery setup
Run ASTM Type I or II de-ionized water supplied by Pacific Rim Laboratory through the pump, tubing, and distribution manifold after decontamination and collect sample in the appropriate container. Place immediately on ice.
No soil equipment blank
4 Previous studies have indicated silicone tubing, used for peristaltic pumps, may be a source of PCBs (King County,
unpublished data) .
Quality Assurance Project Plan: Bioretention Capture Efficacy of PCBs from Stormwater–RSMP Effectiveness Study
King County Science and Technical Support Section 26 December 2016
QA/QC Sample Type
Number of QA/QC Samples Collection Procedure
Field Replicates
One influent per storm event (8 total)
Collect one replicate sample per event from the same 7L carboy used to create the primary sample.
One effluent per storm event (8 total)
Collect one replicate sample per event from one of the 7L carboys used to create the primary samples. Rotate replicate collection between the 6 treatment mesocosms so replicate samples are collected no more than twice from each mesocosm.
Soil (8 total)
Collect one replicate sample from one of the 6 mesocosms per sampling event. Rotate replicate collection between the 6 treatment mesocosms so replicate samples are collected no more than twice from each mesocosm.
7.10 Periodic Preventative Maintenance
Periodic preventative equipment maintenance will occur as needed between storm events
to ensure pump and flow meter equipment is operating properly. This will include
confirming float actuator function, ensuring the pump, distribution manifold, and flow
meter are not leaking, confirming pump rate, downloading flow data, and to check for
debris that could interfere with readings. Signs of vandalism, rusting equipment,
equipment failure, or other maintenance issues will be documented in field notebooks or
on field data forms. Any significant changes in site conditions that will affect sampling will
be documented in the final report under Deviations from the QAPP.
Quality Assurance Project Plan: Bioretention Capture Efficacy of PCBs from Stormwater–RSMP Effectiveness Study
King County Science and Technical Support Section 27 December 2016
8.0 MEASUREMENT PROCEDURES
WSU will be measuring TOC, DOC, and TSS as part of a companion study. Taylor et al.
(2016) describes these methods and the applicable MDLs, and the data will be shared and
used in this project. This study will collect and analyze influent, effluent and bioretention
mesocosm soils for PCB congeners.
8.1 PCB Congener Analytical Methods and
Detection Limits
PCB congeners will be analyzed following EPA Method 1668 Revision C (EPA 2010a), which
is a high-resolution gas chromatography/high-resolution mass spectroscopy
(HRGC/HRMS) method using an isotope dilution internal standard quantification. Method
and reporting detection limits are not applicable for this method because limits of sample
quantitation are derived from calibration capabilities and ubiquitous, but typically low
level, equipment and laboratory blank contamination. Additional reporting limit terms
used particularly for PCB congener analyses are “sample specific detection limits” and
“lowest method calibration limits”. The sample specific detection limit (SDL) is determined
by converting the area equivalent to 2.5 times the estimated chromatographic noise height
to a concentration. For each sample analysis run, SDLs are determined for each individual
congener and account for any effect of matrix on the detection system and recovery
achieved through the analytical work-up. Lowest method calibration limits (LMCL), also
called estimated quantitation limits (EQL), are based on calibration points from standard
solutions. They are prorated by sample size and are supported by statistically derived
method reporting limit (MRL) values.
The PCB congener data will be reported to LMCLs and flagged down to the SDL value. In
many cases the SDL may be below the LMCL. Method 1668C defines a Minimum Level (ML)
value for each congener. The ML value is used to evaluate levels in the method blank. The
ML is based on the LMCL and any laboratory performing the method should be able to
achieve at least that level. Pacific Rim Laboratories uses an additional calibration point that
is lower than the calibration points specified in the method; as such they are able to
quantify congeners below the ML specified in the method.
Pacific Rim Laboratories will perform this analysis according to their SOP LAB02. A one-
liter sample will be extracted followed by standard method cleanup, which includes an acid
wash followed by Acid Silica and Alumina column chromatography. Analysis is performed
with an SGE HT-8 column. Method 1668C requires that if a sample contains more than 1%
total solids, the solids and liquid will be extracted and analyzed separately.
Table 6 lists the 209 PCB congeners and typical SDL and EQL (lower calibration limit)
values for waters and soils. The reporting limits for individual samples may differ from
those in Table 5 since they are determined by signal to noise rations and changes to final

Quality Assurance Project Plan: Bioretention Capture Efficacy of PCBs from Stormwater–RSMP Effectiveness Study
King County Science and Technical Support Section 28 December 2016
volumes. Note that several of the congeners co-elute and a single SDL or EQL value is
provided for the congeners in aggregate.
Soil and Water Detection Limits for PCB Congeners Table 6.
Analyte PCB
Soil Water
MDL EQL MDL EQL
ng/kg pg/L
2-MoCB PCB-1 0.6 4 6.0 10
4-MoCB PCB-3 1.2 4 6.1 10
2,2'-DiCB PCB-4 2.2 4 6.5 10
2,4'-DiCB PCB-8 2.8 4 10 10
2,6-DiCB PCB-10 2.2 4 7.5 10
4,4'-DiCB PCB-15 2.1 4 3.6 10
2,2',5-TrCB PCB-18 1.2 4 1.8 10
2,2',6-TrCB PCB-19 1.0 4 9 10
2,3,4'-TrCB PCB-22 0.9 4 12 10
2,4,4'-TrCB PCB-28 0.9 4 4.7 10
2',3,4'-TrCB PCB-33 0.8 4 2.5 10
3,4,4'-TrCB PCB-37 1.3 4 2.1 10
2,2',3,3'-TeCB PCB-40 2.0 4 1.8 10
2,2',3,4-TeCB PCB-41 2.4 4 5.8 10
2,2',3,5-TeCB PCB-44 1.3 4 3.9 10
2,2',4,5'-TeCB PCB-49 2.0 4 3.2 10
2,2',5,5'-TeCB PCB-52 1.3 4 2.7 10
2,2',6,6'-TeCB PCB-54 0.9 4 1.4 10
2,3,4,4'-TeCB PCB-60 1.6 4 1.9 10
2,3',4,4'-TeCB PCB-66 2.2 4 3.6 10
2,3',4',5-TeCB PCB-70 2.2 4 2.3 10
2,4,4',5-TeCB PCB-74 1.3 4 2.3 10
3,3',4,4'-TeCB PCB-77 0.13 4 1.2 10
3,4,4',5-TeCB PCB-81 0.06 4 0.76 10
2,2',3,4,5'-PeCB PCB-87 1.6 4 3.6 10
2,2',3,4',5-PeCB PCB-90 2.0 4 12.9 10
2,2',3,5',6-PeCB PCB-95 0.9 4 6.0 10
2,2',4,4',5-PeCB PCB-99 2.3 4 5.4 10
2,2',4,5,5'-PeCB PCB-101 1.4 4 3.7 10
2,2',4,6,6'-PeCB PCB-104 0.5 4 2.4 10
2,3,3',4,4'-PeCB PCB-105 0.12 4 5.7 10
2,3,3',4',6'-PeCB PCB-110 1.0 4
6.2 10
2,3,4,4',5-PeCB PCB-114 0.09 4 1.5 10
2,3',4,4',5-PeCB PCB-118 0.19 4 2.9 10
2,3',4,4',6-PeCB PCB-119 0.7 4 1.3 10

Quality Assurance Project Plan: Bioretention Capture Efficacy of PCBs from Stormwater–RSMP Effectiveness Study
King County Science and Technical Support Section 29 December 2016
Analyte PCB
Soil Water
MDL EQL MDL EQL
ng/kg pg/L
2',3,4,4',5-PeCB PCB-123 0.13 4 1.9 10
3,3',4,4',5-PeCB PCB-126 0.10 4 1.4 10
2,2',3,3',4,4'-HxCB PCB-128 0.6 4 2.9 10
2,2',3,3',4,5-HxCB PCB-129 1.5 4 9.0 10
2,2',3,4,4',5-HxCB PCB-137 1.1 4 13 10
2,2',3,4,4',5'-HxCB PCB-138 1.6 4 2.0 10
2,2',3,4,5,5'-HxCB PCB-141 0.9 4 8.0 10
2,2',3,4,5',6-HxCB PCB-149 1.0 4 1.4 10
2,2',3,5,5',6-HxCB PCB-151 1.4 4 1.2 10
2,2',4,4',5,5'-HxCB PCB-153 0.9 4 4.1 10
2,2',4,4',6,6'-HxCB PCB-155 0.8 4 2.2 10
2,3,3',4,4',5-HxCB PCB-156 0.07 4 1.5 10
2,3,3',4,4',5'-HxCB PCB-157 0.08 4 1.9 10
2,3,3',4,4',6-HxCB PCB-158 0.6 4 1.9 10
2,3',4,4',5,5'-HxCB PCB-167 0.05 4 1.1 10
2,3',4,4',5',6-HxCB PCB-168 0.9 4 1.3 10
3,3',4,4',5,5'-HxCB PCB-169 0.09 4 1.3 10
2,2',3,3',4,4',5-HpCB PCB-170 0.9 4 2.1 10
2,2',3,3',4,4',6-HpCB PCB-171 0.9 4 3.3 10
2,2',3,3',4',5,6-HpCB PCB-177 1.3 4 3.7 10
2,2',3,3',5,5',6-HpCB PCB-178 0.7 4 3.7 10
2,2',3,4,4',5,5'-HpCB PCB-180 1.8 4 3.6 10
2,2',3,4,4',5',6-HpCB PCB-183 0.9 4 3.9 10
2,2',3,4',5,5',6-HpCB PCB-187 1.0 4 5.3 10
2,2',3,4',5,6,6'-HpCB PCB-188 1.1 4 9.8 10
2,3,3',4,4',5,5'-HpCB PCB-189 0.09 4 2.3 10
2,3,3',4,4',5',6-HpCB PCB-191 0.5 4 6.3 10
2,3,3',4',5,5',6-HpCB PCB-193 1.8 4 1.1 10
2,2',3,3',4,4',5,5'-OcCB PCB-194 0.2 4 1.8 10
2,2',3,3',4,5,6,6'-OcCB PCB-199 0.9 4 1.0 10
2,2',3,3',4,5,5'6'-OcCB PCB-201 0.7 4 2.6 10
2,2',3,3',5,5',6,6'-OcCB PCB-202 0.9 4 3.5 10
2,2',3,4,4',5,5',6-OcCB PCB-203 0.9 4 2.2 10
2,3,3',4,4',5,5',6-OcCB PCB-205 1.2 4 1.3 10
2,2',3,3',4,4',5,5',6-NoCB PCB-206 0.09 4 3.8 10
2,2',3,3',4',5,5',6,6'-NoCB PCB-208 1.1 4 1.9 10
Decachlorobiphenyl PCB-209 0.08 4 3.4 10 * - EQL based on 10 g/ 1 L sample size and final volume of 200/50 µL

Quality Assurance Project Plan: Bioretention Capture Efficacy of PCBs from Stormwater–RSMP Effectiveness Study
King County Science and Technical Support Section 30 December 2016
9.0 QUALITY CONTROL
This section describes the laboratory QC required for this project with the exception of
conventional parameters. The laboratory QC for these parameters are described in Taylor
et al. (2016). Field replicates and equipment blanks are described previously in Sections
7.2 through 7.4. Details regarding the frequency and control limits of required QC samples
are provided in Tables 6 through 8. Below are general descriptions of types of laboratory
QC samples.
• Analysis of method blanks is used to evaluate the levels of contamination that might
be associated with the processing and analysis of samples in the laboratory and
introduce bias into the sample result. Method blank results will be compared to
environmental sample concentrations and validated per EPA Region 10 guidelines
(EPA 1995)
• A laboratory duplicate is a second aliquot of a sample, processed concurrently and
in an identical manner with the original sample. The laboratory duplicate is
processed through the entire analytical procedure along with the original sample in
the same quality control batch. Laboratory duplicate results are used to assess the
precision of the analytical method and the relative percent difference (RPD)
between the results should be within method-specified or performance-based
quality control limits.
• A laboratory control sample is a sample of known analyte concentration(s) that is
prepared in the lab from a separate source of analyte(s) relative to the calibration
standards. Since the laboratory control sample analysis should follow the entire
analytical process, it should be stored and prepared following the same procedures
as a field sample. Analysis of a laboratory control sample is used as an indicator of
method accuracy and long-term analytical precision.
• A spike blank is a spiked aliquot of clean reference matrix used for the method
blank. The spiked aliquot is processed through the entire analytical procedure.
Analysis of the spike blank is used as an indicator of method accuracy. It may be
conducted in lieu of a laboratory control sample. A spike blank duplicate should be
analyzed whenever there is insufficient sample volume to include a sample
duplicate in the batch.
• A surrogate is a known concentration of non-target analyte which is added to each
sample (both analytical and QC samples) prior to extraction and analysis for all
trace organic analyses. Surrogate recovery is used as a sample-specific indication of
method or matrix bias for target analytes. The surrogate is selected to behave in a
similar manner to the target analytes.
• The ongoing precision and recovery (OPR) samples must show acceptable
recoveries, according to the respective methods for data to be reported without
qualification.
Quality Assurance Project Plan: Bioretention Capture Efficacy of PCBs from Stormwater–RSMP Effectiveness Study
King County Science and Technical Support Section 31 December 2016
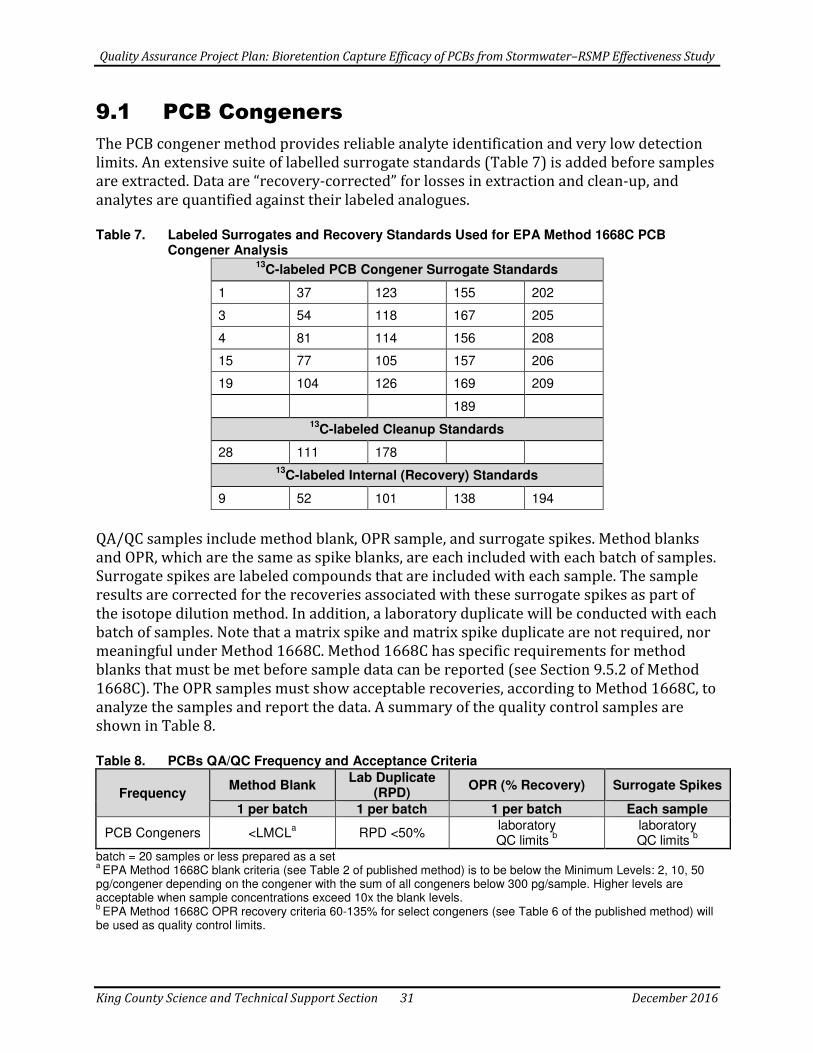
9.1 PCB Congeners
The PCB congener method provides reliable analyte identification and very low detection
limits. An extensive suite of labelled surrogate standards (Table 7) is added before samples
are extracted. Data are “recovery-corrected” for losses in extraction and clean-up, and
analytes are quantified against their labeled analogues.
Labeled Surrogates and Recovery Standards Used for EPA Method 1668C PCB Table 7.
Congener Analysis 13
C-labeled PCB Congener Surrogate Standards
1 37 123 155 202
3 54 118 167 205
4 81 114 156 208
15 77 105 157 206
19 104 126 169 209
189
13C-labeled Cleanup Standards
28 111 178
13C-labeled Internal (Recovery) Standards
9 52 101 138 194
QA/QC samples include method blank, OPR sample, and surrogate spikes. Method blanks
and OPR, which are the same as spike blanks, are each included with each batch of samples.
Surrogate spikes are labeled compounds that are included with each sample. The sample
results are corrected for the recoveries associated with these surrogate spikes as part of
the isotope dilution method. In addition, a laboratory duplicate will be conducted with each
batch of samples. Note that a matrix spike and matrix spike duplicate are not required, nor
meaningful under Method 1668C. Method 1668C has specific requirements for method
blanks that must be met before sample data can be reported (see Section 9.5.2 of Method
1668C). The OPR samples must show acceptable recoveries, according to Method 1668C, to
analyze the samples and report the data. A summary of the quality control samples are
shown in Table 8.
PCBs QA/QC Frequency and Acceptance Criteria Table 8.
Frequency Method Blank
Lab Duplicate (RPD)
OPR (% Recovery) Surrogate Spikes
1 per batch 1 per batch 1 per batch Each sample
PCB Congeners <LMCLa RPD <50%
laboratory QC limits
b
laboratory QC limits
b
batch = 20 samples or less prepared as a set a
EPA Method 1668C blank criteria (see Table 2 of published method) is to be below the Minimum Levels: 2, 10, 50 pg/congener depending on the congener with the sum of all congeners below 300 pg/sample. Higher levels are acceptable when sample concentrations exceed 10x the blank levels. b
EPA Method 1668C OPR recovery criteria 60-135% for select congeners (see Table 6 of the published method) will be used as quality control limits.
Quality Assurance Project Plan: Bioretention Capture Efficacy of PCBs from Stormwater–RSMP Effectiveness Study
King County Science and Technical Support Section 32 December 2016
9.2 Corrective Action for QC Problems
Corrective action for field measurements and laboratory analysis will follow those
described in each SOP. Examples of corrective action include:
• Re-analyzing the samples
• Re-extracting the samples
• Re-preparing of the calibration verification standard for laboratory analyses
• Re-calibrating the field equipment
• Qualifying results as described in Section 10.2
9.3 Flow Data
Flow data will be checked by timing the amount of water through the peristaltic pumps per
minute to confirm that the current speed setting is generating a flow of 117 mL/min per
mesocosm. Results will be documented in the field sheets and the pump rotation rate
adjusted as needed to maintain the proper flow rate.
9.4 Audits
Audits can help verify data quality by ensuring the QAPP is implemented correctly, and the
quality of data is acceptable. To verify samples are collected according to the methods
described in the QAPP, the project manager will conduct a field audit by supervising at least
one sampling event for this project. Documentation will include field notes and pictures
taken by the project manager. The project manager will also conduct an analytical audit by
a preliminary data review; comparing analytical results, including detection limits, to the
QAPP-specified goals. If review of chemistry data suggests sampling or method revisions
are required, outside of those allowed in the cited methods and SOPs, an addendum to this
QAPP will be prepared.

Quality Assurance Project Plan: Bioretention Capture Efficacy of PCBs from Stormwater–RSMP Effectiveness Study
King County Science and Technical Support Section 33 December 2016
10.0 DATA MANAGEMENT, VERIFICATION,
AND REPORTING
This section explains the standard practices for managing, verifying, and reporting data
collected or analyzed as part of this study.
10.1 Data Storage
King County will retain records of all monitoring information, including all calibration and
maintenance records and all original recordings from the flow data logger, copies of all
reports generated for this study, and records of all data used in this study, for a period of at
least five years.
10.2 Analytical Data Verification and Validation
10.2.1 Flow Data
Flow data will be verified by comparing metered flow rates with known volumes of water
or pump run times as checks. The flow totalizer value will be used as a seasonal total. When
a discrepancy is found with a pumped rate due to wear and tear on the tubing and other
inefficiencies, the total volume from the totalizer (divided by time and the 12 mesocosms)
will be used as the definitive value.
10.2.2 Analytical Data
Data reported by the by both WSU and Pacific Rim Laboratories, must pass a review
process before final results are used. All necessary data needed for independent review of
PCB congener data will be provided by Pacific Rim Laboratories. A subcontracted data
validator will review the PCB congener data following EPA Level III guidelines (EPA 1995).
Both data validation sets will be based on QA/QC samples and included in the final report
as an appendix.
Qualifiers will be applied to analytical data during the data quality review process, and are
presented in Table 10.
Pacific Rim Laboratory Data Qualifiers Table 9.
Qualifier Description EIM Qualifier
U Indicates the compound was not detected at the concentration listed. U
J Indicates the sample concentration is less than the lowest point on the calibration curve.
J
N Indicates the compound was not detected due to not meeting all identification criteria. The concentration is reported as the estimated maximum possible concentration (EMPC)
U, with description in
Comment Field

Quality Assurance Project Plan: Bioretention Capture Efficacy of PCBs from Stormwater–RSMP Effectiveness Study
King County Science and Technical Support Section 34 December 2016
Qualifier Description EIM Qualifier
B Indicates the compound was detected in the associated method blank.
Depends on data validation (UJ, JL, or Null)
B1 Indicates the sample concentration is less than five times the concentration found in the method blank.
UJ
Additionally, equipment blank and field replicate results will be presented in the final
report. If these results indicate a problem with precision or accuracy, data qualifiers may
be applied based on the National Functional Guidelines (EPA 2010b and EPA 2014) and
best professional judgment.
10.2.3 Rain Gauge Data
Rainfall data from the sources listed in Taylor et al. (2016) will be used to describe the
magnitude and range of storm conditions during sampling events. All of these data sources
provide provisional data which will only be used for project review and audit purposes.
Only final data as issued by the gauge owner will be used for final analysis and reports. The
primary source of rain fall data is the University of Washington’s Harris Hydraulics
Laboratory gauge which is approximately 800m from the study area.
10.3 Data Reduction, Review, and Reporting
Pacific Rim and WSU Laboratory personnel will be responsible for internal quality control
verification, proper data transfer, and reporting data to the project manager by electronic
data deliverable.
The final report of this study will include:
• A summary of TOC, DOC, TSS, and PCB concentrations in the influent and effluent.
• A summary of PCB concentrations in soils.
• A summary of storm event rainfall conditions during sampling.
• A discussion of treatment effectiveness based on data analysis.
• An appendix discussing QA/QC for the data.
• An appendix including all raw analytical data with laboratory qualifiers.
• Final data will be entered into the relational database developed by Taylor et al.
2016 by the close of the project.
• Ecology and WSU Puyallup representatives will provide a technical review of the
final report.
• Final report will be available on Ecology’s RSMP website
http://www.ecy.wa.gov/programs/wq/stormwater/municipal/rsmp/rsmp.html.
Quality Assurance Project Plan: Bioretention Capture Efficacy of PCBs from Stormwater–RSMP Effectiveness Study
King County Science and Technical Support Section 35 December 2016
11.0 DATA QUALITY ASSESSMENT AND
DATA ANALYSIS
After data verification and validation, the project manager will conduct a data quality
assessment to ensure the data satisfies the MQOs and is of sufficient quality to meet study
goals. The following list outlines the steps in this process, as described in the Data Quality
Assessment Guidelines (EPA 2006):
1. Review the project’s objectives and sampling design.
The first step in this process is to verify whether the execution of the sampling
design satisfies the project objectives. Deviations from the QAPP and site condition
anomalies will be considered as part of this step.
2. Conduct a preliminary data review.
By reviewing the QA reports and data validation memos, the project manager can
assess whether the goals of precision, bias, sensitivity, accuracy, representativeness,
comparability, and completeness have been achieved, as defined in Sections 5 and 6
of this QAPP. The project manager will then explore the data by generating
summary statistics and basic graphs. Any observed anomalies will be investigated.
The MDL value (sample-specific) will be used as a surrogate for any non-detect
results for conventional parameters. Non-detect congeners will be treated as not
present (null). In general, this results in a high bias for conventional parameters,
which will be addressed as appropriate in the final report. Because the PCB
congener method is so sensitive relative to expected total PCB concentrations, the
absence of pg/L concentrations for particular congeners is assumed to be a true
condition, i.e., they are absent. Many congeners were never produced as part of
commercial PCB mixtures (Aroclors) so to include all non-detect congeners using a
surrogate value results in an inappropriate high bias to the data.
3. Select the statistical method.
A rank sum test will be used for comparison between influent and effluent results,
with a Wilcoxon signed-rank test for the individual mesocosms, as recommended by
Ecology (2011). This will be examined on both a total PCB and individual congener
basis. Since the mesocosms are expected to reduce contaminant concentrations, a
one-tailed test will be used; however, if the preliminary data review suggests a
possible increase in contaminant concentration, a two-tailed test will be used. Two-
tailed tests may also be used to compare the new dataset to historical stormwater
quality data. The project manager may decide not to include statistical analysis for
congeners with low frequency of detection, due to increased uncertainty.
Results may be pooled by storm event to increase statistical power if results are
similar across the two mesocosm types (BSM alone and BSM with plants). This will
be based on best professional judgment, but any conclusions will be qualified,
Quality Assurance Project Plan: Bioretention Capture Efficacy of PCBs from Stormwater–RSMP Effectiveness Study
King County Science and Technical Support Section 36 December 2016
acknowledging these are not true replicates, despite comparable designs and
identical stormwater inputs.
4. Verify the assumptions of the statistical method.
The distribution of the datasets will determine whether parametric or non-
parametric statistical tests will be implemented. The number of samples proposed
for this project is not based on a power analysis, but instead on the maximum
number of samples that can be collected within a reasonable budget. If variability is
high within the dataset, it may result in low statistical power, meaning lower
probability of detecting differences between the populations (e.g., influent vs.
effluent sample results or soil concentration changes). Statistical power will be
reported.
5. Draw conclusions from the data.
In this step, statistical tests will be conducted and uncertainty of the results will also
be assessed. In the final report, visual representations of the data may include
scatter plots, box plots, or bar charts with error bars representing standard
deviations or confidence intervals. The report will also include descriptions and
detailed interpretations of the statistical results. This will include estimates of the
PCB loads dosed to the mesocosms and the capacity of the mesocosms and BSM to
capture those loads on both a storm by storm basis and to sequester them over
multiple seasons. Suggested amendments to the sampling design for future use will
also be discussed.
6. Recommendations for BMP use to treat PCBs
The final report will discuss the utility of BSM (60/40 mix) to reduce PCB loadings
from stormwater in Western Washington. Recommendations will be made based on
both the removal effectiveness observed as well as the ability of BSM to sequester
PCBs and prevent their release.
Quality Assurance Project Plan: Bioretention Capture Efficacy of PCBs from Stormwater–RSMP Effectiveness Study
King County Science and Technical Support Section 37 December 2016
12.0 REFERENCES
APHA 1998. Standard Methods for the Examination of Water and Wastewater, 20th Edition.
American Public Health Association. Washington, D.C.
Ayris, S. and S. Harrad. 1999. The Fate and Persistence of Polychlorinated Biphenyls in Soil.
J. Env. Monit. 1:395-401.
Cabrerizo, A. J. Dachs, C. Moeckel, M.J. Ojeda, G. Caballero, D. Barceló, K.C. Jones. 2011.
Factors Influencing the Soil – Air Partitioning and the Strength of Soils as a
Secondary Source of Polychlorinated Biphenyls to the Atmosphere. Env. Sci. Tech.
45:4785-4792.
Daly, G.L. and F. Wania. 2004. Simulating the Influence of Snow on the Fate of Organic
Chemicals. Env. Sci Tech. 38: 4176-4186.
Diamond, M.L., S.E. Gingrich, K. Fertuck, B.E. McCarry, G.A. Stern, B. Billeck, B. Grift, D.
Brooker, T.D. Yager. 2000. Evidence for Organic Film on an Impervious Urban
Surface: Characterization and Potential for Teratogenic Effects. Env. Sci. Tech.
34:2900-2908.
Ecology. 2014. Stormwater Management Manual for Western Washington (SWMMWW).
Publication No. 14-05-055.
Ecology. 2011. Guidance for Evaluating Emerging Stormwater Treatment Technologies.
Technology Assessment Protocol – Ecology. Publication No. 11-10-061.
Ecology. 2012. Stormwater Management Manual for Western Washington (SWMMWW) as
Amended in December 2014. Publication No. 14-10-055.
EPA. 1995. EPA Region 10 SOP For the Validation of Method 1668 Toxic, Dioxin-like, PCB
Data. Revision 1, December 8, 1995. Prepared by EPA Region 10 Environmental
Services Division, Seattle, WA 98101.
EPA. 1999. Preliminary data summary of urban stormwater best management practices.
United States Environmental Protection Agency, Office of Water, Washington DC.
EPA-821-R-99-012.
EPA. 2006. Data Quality Assessment: A Reviewer’s Guide. U.S. Environmental Protection
Agency, Office of Environmental Information, Washington DC. EPA-240-B-06-002.
Quality Assurance Project Plan: Bioretention Capture Efficacy of PCBs from Stormwater–RSMP Effectiveness Study
King County Science and Technical Support Section 38 December 2016
EPA. 2010a. Method 1668C, Chlorinated biphenyl congeners in water, soil, sediment
biosolids, and tissue by HRGC/HRMS. U.S. Environmental Protection Agency, Office
of Water, Office Science and Technology, Washington, D.C. EPA-820-R-10-005
EPA. 2014. National Functional Guidelines for Superfund Organic Methods Data Review.
U.S. Environmental Protection Agency, Office of Superfund Remediation and
Technology Innovation. Washington, D.C. OSWER 9355.0-132, EPA-540-R-014-002.
Gilbreath, A.N., S.P. Pearce, L.J. McKee. 2012. Monitoring and Results for El Cerrito Rain
Gardens. San Francisco Estuary Institute 4911 Central Ave. Richmond, CA 94804 .
Contribution Number 683.
Harner, T., D. Mackay, K.C. Jones. Model of the Long-Term Exchange of PCBs between Soil
and the Atmosphere in the Southern U.K. Env. Sci. Tech. 29:1200-1209.
Hippelein, M. and M.S. McLachlan. 1998. Soil/Air Partitioning of Semivolatile Organic
Compounds. 1. Method Development and Influence of Physical-Chemical Properties.
Env. Sci. Tech. 32:310-316.
Hippelein, M. and M.S. McLachlan. 2000. Soil/Air Partitioning of Semivolatile Organic
Compounds. 2. Influence of Temperature and Relative Humidity. Env. Sci. Tech.
34:3521-3526.
Hobbs, B., B. Lubliner, N. Kale, and E. Newell. 2015. Western Washington NPDES Phase
Stormwater, Permit: Final Data Characterization 2009-2013. Washington State
Department of Ecology, Olympia, WA. Publication No. 15-03-001.
King County. 2013. PCB/PBDE loading estimates for the Greater Lake Washington
Watershed. Prepared by Curtis DeGasperi, Water and Land Resources Division.
Seattle, Washington.
Kurt-Karakus, P. and K.C. Jones. 2006. Microcosm Studies on the Air-Soil Exchange of
Hexachlorobenzene and Polychlorinated Biphenyls. J. Env. Monit. 8:1227-1234.
Parsons and Terragraphics. 2007. Spokane River PCB TMDL Stormwater Loading Analysis:
Final Technical Report. Ecology Publication Number 07-03-055
SAIC. 2011. Lower Duwamish Waterway Survey of Potential PCB-Containing Building
Material Sources: Summary Report. Prepared for Ecology by Science Applications
International Corporation, Bothell, WA.
Quality Assurance Project Plan: Bioretention Capture Efficacy of PCBs from Stormwater–RSMP Effectiveness Study
King County Science and Technical Support Section 39 December 2016
Rodenburg, L.A., J. Guo, S. Du, and G.J. Cavallo. 2010. Evidence for Unique and Ubiquitous
Environmental Sources of 3-3´-Dichlorobiphenyl (PCB 11). Env. Sci. Tech. 44:2816-
2821.
Sinkkonen, S. and J. Paasivirta. 2000. Degradation half-life times of PCDDs, PCDFs and PCBs
for environmental fate modeling. Chemosphere 40:943-949.
Taylor, A., T. Knappenberger, and J. McIntyre. 2016. Quality Assurance Project Plan: Field
Test of Plants and Fungi on Bioretention Over Time. Prepared for Ecology in Partial
Fulfillment of Interagency Agreement C1600135.
Wania, F., J.E. Haugen, Y.D. Lei, D. Mackay. 1998. Temperature Dependence of Atmospheric
Concentrations of Semivolatile Organic Compounds. Env. Sci. Tech. 32(8):1013-
1021.

Quality Assurance Project Plan: Bioretention Capture Efficacy of PCBs from Stormwater–RSMP Effectiveness Study
King County Science and Technical Support Section 40 December 2016
This page intentionally left blank.
Quality Assurance Project Plan: Bioretention Capture Efficacy of PCBs from Stormwater–RSMP Effectiveness Study
King County Science and Technical Support Section A-1 December 2016
Appendix: Chain of Custody Forms


![Bioretention Brownbag 072412.pptx [Read-Only]iswm.nctcog.org/training/Bioretention_PPT/Bioretention_booklet.pdfJuly 23, 2011 Bioretention Design 2 Basics of Bioretention • Also called](https://img.pdfslide.net/doc/110x75/5ae800237f8b9ae1578fcfc3/bioretention-brownbag-read-onlyiswmnctcogorgtrainingbioretentionpptbioretentionbookletpdfjuly.jpg)