Embed Size (px)
Citation preview

R I C K M U N C R I E F , C H A I R M A N & C E O
A U G U S T 6 , 2 0 1 9

WPX Delivering As Planned
2Q COMPANY HIGHLIGHTS
▪ CFFO increased 48% 1H 2019 vs. 1H 2018
▪ 2Q Delaware oil realizations of WTI plus $0.23 including Midland
basis swaps
▪ Received proceeds from Oryx II monetization
▪ Second 200 MMCF/D train came online at Delaware JV plant
SECOND HALF 2019
▪ Reaffirming existing 2019 CAPEX guidance
▪ Raising full-year oil guidance by 4% and full-year total volume
guidance by 5%
▪ Projecting free cash flow in 3Q and 4Q1
1. Free cash flow includes CFFO (excluding working capital changes) minus DC&F, non operated and midstream opportunities capital.
2
ACCELERATING RETURN OF CAPITAL
▪ Returning capital to shareholders in the form of a stock
repurchase program
▪ Initiating program to repurchase up to $400MM of shares over
the next 24 months

-$200
-$150
-$100
-$50
$0
$50
$100
$150
2016 2019E
0%
10%
20%
30%
2016 2019E
-
1
2
3
4
5
2016 2019E
3
A Lookback Since RKI Acquisition
F R E E
C A S H F L O W 2 , 3N E T L E V E R A G E 1 P R O D U C T I O N
NET
DEB
T/A
DJ.
EB
ITD
AX
$M
M
68%REDUCTION IN TRAILING
12-MONTH NET LEVERAGE SINCE 2016
$200MM+INCREASE IN FREE CASH FLOW
SINCE 2016
51%INCREASE IN PRODUCTION GROWTH
PER DEBT ADJ. SHARE SINCE 2016
1. Net debt/trailing 12-month EBITDAX. 2. 2016 free cash flow is based on cash flow from operating activities of $268 million plus net working capital changes of $82 million less capital expenditures incurred of $500 million. The capital expenditures incurred exclude $84 million of land acquisitions.3. 2019 FCST free cash flow is based on estimated CFFO less forecasted capital expenditures including operated and non-operated drilling and completions, facilities and midstream opportunities. Estimated CFFO is based on forecasted adjusted EBITDAX further adjusted for other items such as interest and stock-based compensation.4. Annual production growth that is normalized for any changes in debt or equity. This metric monitors a company’s ability to grow production responsibly in a shareholder friendly manner. Share price based on YE 2016 and held constant.
2
ESTIMATED
RANGE3
3
GROWTH PER DEBT ADJUSTED SHARE4

C L A Y G A S P A R , P R E S I D E N T & C H I E F O P E R A T I N G O F F I C E R
OPERATIONS

5.0
5.5
6.0
6.5
7.0
7.5
2018 Avg. 2Q 2019
WILLISTON 2-MILE WELL COSTS
5%
4
7
10
13
2018 Avg. 2Q 2019
Pecos State Test Benefitting Both Basins
5
WELL
CO
ST
$M
M
DELAWARE 2-MILE WELL COSTS
22%
0
4
8
12
16
20
2Q 2018 2Q 2019
WILLISTON DAYS FROM SPUD
TO RIG RELEASE (2-MILE)
31%14%
DELAWARE DAYS FROM SPUD
TO RIG RELEASE (2-MILE)
16
20
24
28
2Q 2018 2Q 2019
Applied learnings to first Williston pads
Project description
Applied learnings to first Delaware pad (CBR 41-44) Coring additional 1,240 ft in
Stateline from 2nd Bone Spring to
3rd Bone Spring bench for CBR 10
• Contiguous 806 ft core running from bottom of 3rd Bone Spring through Wolfcamp B • Equipped with microseismic geophones and external pressure & temperature
gauges • Strategically placed to monitor fracs during completion, overall well performance &
drainage through life of the well• Permanent DAS-DTS fiberoptic installation
• Lower well costs• Improved early production
2 0 1 9
• Improved completion/cluster design• Fine tuned well spacing, landing targets, and artificial lift
L O W E R C O S T S M O R E E F F I C I E N T
2 0 1 8
WELL
CO
ST
$M
M
AV
G.
DA
YS F
RO
M S
PU
D
AV
G.
DA
YS F
RO
M S
PU
D

Delaware Activity 2019
6
STATELINERUSTLER
BREAKS
SAND
LAKESHALEY
3RD BONE
SPRING5 1
UPPER
WOLFCAMP19 4 5 5
LOWER
WOLFCAMP1 2 4 1
Total 25 6 9 7
1 H 2 0 1 9 F I R S T S A L E S
STATELINE
RUSTLER BREAKS
SANDLAKES
HALEY
WPX ACTIVITY BY AREA 2 H 2 0 1 9 F I R S T S A L E S
S T A T E L I N E A C T I V I T Y1H: 53% 2H: 68%
R U S T L E R B R E A K S
A C T I V I T Y1H: 13% 2H: 6.5%
S A N D L A K E S A C T I V I T Y1H: 19% 2H: 6.5%
H A L E Y A C T I V I T Y1H: 15% 2H: 19%
1 H 2 0 1 9 F I R S T S A L E S
• Average lateral length of ~7,650’
• Average wells per visit ~2.1 wells
• 83% of completions were in Upper
Wolfcamp benches and 3BS
• Completed wells in 8 different benches
• 53% of activity in Stateline
2 H 2 0 1 9 F I R S T S A L E S
• Average lateral length of ~7,700’
• Average wells per visit ~2.8 wells
• 100% of completions will be in Upper
Wolfcamp benches and 3BS
• Will complete wells in 6 different benches
• 68% of activity will be in StatelineR I G C O U N T
1H: ~5.6 RIGS 2H: 5 RIGS
Upper Wolfcamp includes Wolfcamp XY and A
Lower Wolfcamp includes Wolfcamp B,C, & D
STATELINERUSTLER
BREAKS
SAND
LAKESHALEY
3RD BONE
SPRING5
UPPER
WOLFCAMP16 2 2 6
LOWER
WOLFCAMP
Total 21 2 2 6

$50.00
$52.00
$54.00
$56.00
$58.00
$60.00
$62.00
$64.00
$66.00
Apr-19 May-19 June-19
-$0.50
$0.00
$0.50
$1.00
$1.50
$2.00
$2.50
$3.00
$3.50
Apr-19 May-19 Jun-19
N Y M E X
WPX REALIZED PRICE INC. COMMODITY MGMT UPLIFT2
Delaware Midstream Continues to Drive Value
71. Realized prices includes basis hedges.2. Commodity management uplift represents the combination of WPX realized price and the net margin from utilizing excess capacity over production volumes.
STRONG 2Q DELAWARE
PRICE REAL IZAT IONS
$2.05$60.052Q’19 AVG. REALIZED
OIL PRICE INCLUDING BASIS HEDGES
2Q’19 AVG. REALIZED
GAS PRICE INCLUDING BASIS HEDGES
D E L A W A R E O I L D E L A W A R E G A S
$2.992Q’19 AVG. REALIZED
GAS PRICE INCLUDING BASIS HEDGES &
COMMODITY MANAGEMENT UPLIFT

0
20
40
60
80
100
120
0 10 20 30 40 50
Tho
usa
nd
s
Williston: Continued Outperformance
NORMALIZED DAYS ON PRODUCTION
CU
MU
LATI
VE O
IL (
MB
BLS
)
DELIVERING ON RESULTS
1
2
3
2019 WELLS OUTPERFORMING TYPE CURVE
LOWER YEAR-OVER-YEAR WELL COSTS
SETTING NEW PRODUCTION RECORDS
2019 OPERATIONS2Q 2019 WELL RESULTS
SETTING PRODUCTION RECORDS24-HOUR INITIAL PRODUCTION
MINOT GRADY 26-35HD
MINOT GRADYDELORES SAND
5,862BARRELS OF OIL EQUIVALENT PER DAY
8

K E V I N V A N N , C H I E F F I N A N C I A L O F F I C E R
FINANCIALS

2019 Updated Full-Year Guidance
10
0
10
20
30
40
50
80
90
100
110
120
1QA 2QA 3QE 4QE
2019 OIL PRODUCTION AND FIRST SALES GUIDANCE BY QUARTER
FIR
ST S
ALE
S
• RAISING FULL-YEAR PRODUCTION
GUIDANCE BY 5%
• 160 -165 MBOE/D
• RAISING FULL-YEAR OIL PRODUCTION
GUIDANCE BY 4%
• 101 -103 MBBL/D
2019 PRODUCTION GUIDANCE
MB
BL/
D
Note: Land funded with sales proceeds, excluded from FY capital guidance of $1.1-1.275B
• AS PLANNED, 55% OF FULL-YEAR
CAPITAL SPENT IN 1H 2019
• REITERATING FULL-YEAR CAPITAL
GUIDANCE
• $1,100 - $1,275MM
2019 CAPITAL GUIDANCE2019 CAPITAL GUIDANCE BY QUARTER
$0
$50
$100
$150
$200
$250
$300
$350
$400
$450
1QA 2QA 3QE 4QE
D&C Infrastructure Land Other Capex Range Guidance
$M
M
Oil Oil Range Guidance First Sales

11
2Q 2019 Results
2Q YTD
2019 2018 2019 2018
Average Daily Production
Oil (Mbbl/d) 97.9 80.8 97.0 73.3
Gas (MMcf/d) 205.9 152.2 204.1 142.3
NGLs (Mbbl/d) 27.4 18.8 26.4 16.9
Equivalent (MBOE/d) 159.6 125.0 157.4 113.9
Adjusted EBITDAX $ 339 $ 287 $ 651 $ 487
Adjusted Net Income (Loss) from Continuing Operations $ 37 $ 23 $ 59 $ 0
Capital Expenditures $ 341 $ 355 $ 766 $ 705
Note: Adjusted EBITDAX and adjusted net income are non-GAAP measures. A reconciliation to relevant GAAP measures is provided in this presentation.
21% GROWTH IN OIL VOLUMES 2Q’19 vs. 2Q’18
GROWTH IN ADJ. EBITDAX 2Q’19 vs. 2Q’18
18%

Positioned for Sustainable Value Creation
12
OUR DRIVE
OUR FOCUS
OUR PORTFOLIOPERMIAN - WILLISTON - MIDSTREAM
FINANCIAL DISCIPLINE - OIL GROWTH - VALUE CREATION
STRONG EXECUTION - CREATE OPPORTUNITIES - REMAIN DISCIPLINED

APPENDIX

2019 Full-Year Guidance
Capital Plan Production FY 2019
Oil Mbbl/d 101 – 103
Natural Gas MMcf/d 205 – 210
NGL Mbbl/d 25 – 27
Total MBOE/d 160 – 165Net Realized Price3 FY 2019
NGL – % of WTI 20% – 25%
Avg. Price Differentials2 FY 2019
Oil – WTI per barrel ($2.00) – ($3.00)
NYMEX – Nat. Gas (Mcf) ($1.25) – ($1.75)
1. Land capital is funded with proceeds from asset sales in 2019.2. Average price differentials for oil and natural gas exclude hedges, but include basis differential and revenue adjustments.3. Percentage of realized price ranges for NGLs excludes hedges, but includes basis differential and revenue adjustments.4. Rate does not reflect any potential valuation allowance or other adjustments to deferred tax assets.
Expenses FY 2019
$ per BOE
Lease & Facility Operating $6.10 – $6.30
GP&T $3.00 – $3.50
DD&A $15.00 – $16.00
G&A – Cash $2.40 – $2.60
G&A – Non-Cash $0.60 – $0.70
Exploration $1.25 – $1.50
Interest Expense $2.55 – $2.65
Production Tax 7% – 9%
Tax Provision4 21% – 25%
Capital Plan ($ in Millions) FY 2019
D&C / Facilities Capital $1,000 – $1,100
D&C Non-Operated $50 – $75
Midstream Opportunities $50 – $100
Total Development Capital $1,100 – $1,275
Land Capital1 $100
14

15
Domestic Price Realization for 2019
1. Natural gas revenue adjustments are primarily related to field compression fuel. NGL revenue adjustments include T&F and revenue sharing. Gathering deductions represent $(.25) of the oil revenue
adjustments.
2 .“Net Price” equals income statement product revenues by commodity, divided by volume.
3 .Represents the realized settlement on derivatives that occurred during each quarter.
Oil ($/bbl) Gas ($/Mcf) NGL ($/bbl)
1Q ’19 2Q’19 3Q’19 4Q ’19 1Q ’19 2Q’19 3Q’19 4Q ’19 1Q ’19 2Q’19 3Q’19 4Q ’19
Weighted-Average Sales
Price$52.35 $57.50 $2.60 $1.74 $16.81 $13.66
Revenue Adjustments1 $(0.43) $(0.08) $(1.24) $(0.86) $(2.34) $(1.45)
Net Price2 $51.92 $57.42 $1.36 $0.88 $14.47 $12.21
Realized Portion of
Derivatives3 $0.04 $(2.98) $0.42 $0.88
Net Price Including
Derivatives$51.96 $54.44 $1.78 $1.76 $14.47 $12.21

WPX Hedges Updated: August 5, 2019
1 In addition to several crude oil swaps, WPX entered into calendar monthly average(CMA) NYMEX roll swaps which provide pricing adjustments to the trade month versus the delivery month
for contract pricing. 16
Jul – Dec 2019 2020 2021
Volume/Day Average Price Volume/Day Average Price Volume/Day Average Price
Crude Oil (bbl)
Fixed Price Swaps1 60,500 $55.29 40,000 $57.48 - -
Fixed Price Calls 5,000 $54.08 - - - -
Fixed Price Collars 8,000 $50.00 - $60.19 20,000 $53.33 - $63.48 - -
Crude Oil Basis (bbl)
Midland Basis Swaps 22,000 ($1.37) 7,486 ($1.31) - -
Magellan East Houston 1,663 $4.63 - - - -
Magellan East Houston vs. Midland Swaps 5,652 $6.47 - - - -
Magellan East Houston vs. Argus LLS WTI 1,663 $0.75 - - - -
Argus LLS WTI vs. Midland WTI Swaps 1,663 $8.60 - - - -
Clearbrook Bakken 8,000 ($3.23) - - - -
Brent/WTI Spread Basis Swaps - - 5,000 $8.36 1,000 $8.00
Natural Gas (MMBtu)
Fixed Price Swaps 110,000 $3.07 - - - -
Natural Gas Basis (MMBtu)
Houston Ship Channel Basis Swaps 30,000 ($0.09) - - - -
Permian Basis Swaps 25,000 ($0.39) - - - -
West Texas Waha Basis Swaps 15,000 $2.94 60,000 ($0.79) 70,000 ($0.59)
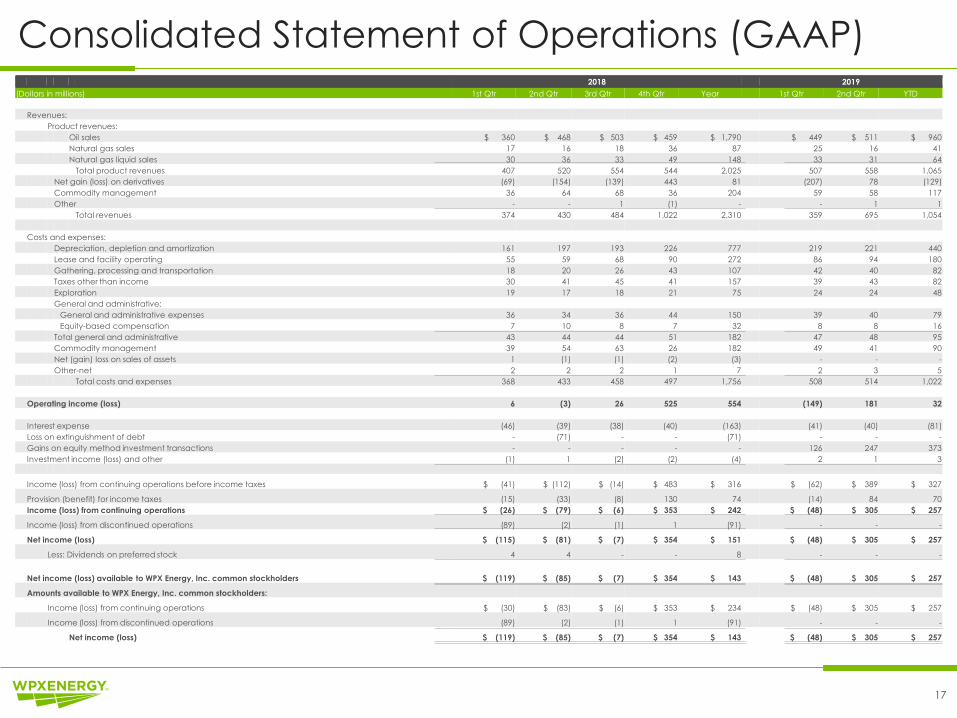
2018 2019
(Dollars in millions) 1st Qtr 2nd Qtr 3rd Qtr 4th Qtr Year 1st Qtr 2nd Qtr YTD
Revenues:
Product revenues:
Oil sales $ 360 $ 468 $ 503 $ 459 $ 1,790 $ 449 $ 511 $ 960
Natural gas sales 17 16 18 36 87 25 16 41
Natural gas liquid sales 30 36 33 49 148 33 31 64
Total product revenues 407 520 554 544 2,025 507 558 1,065
Net gain (loss) on derivatives (69) (154) (139) 443 81 (207) 78 (129)
Commodity management 36 64 68 36 204 59 58 117
Other - - 1 (1) - - 1 1
Total revenues 374 430 484 1,022 2,310 359 695 1,054
Costs and expenses:
Depreciation, depletion and amortization 161 197 193 226 777 219 221 440
Lease and facility operating 55 59 68 90 272 86 94 180
Gathering, processing and transportation 18 20 26 43 107 42 40 82
Taxes other than income 30 41 45 41 157 39 43 82
Exploration 19 17 18 21 75 24 24 48
General and administrative:
General and administrative expenses 36 34 36 44 150 39 40 79
Equity-based compensation 7 10 8 7 32 8 8 16
Total general and administrative 43 44 44 51 182 47 48 95
Commodity management 39 54 63 26 182 49 41 90
Net (gain) loss on sales of assets 1 (1) (1) (2) (3) - - -
Other-net 2 2 2 1 7 2 3 5
Total costs and expenses 368 433 458 497 1,756 508 514 1,022
Operating income (loss) 6 (3) 26 525 554 (149) 181 32
Interest expense (46) (39) (38) (40) (163) (41) (40) (81)
Loss on extinguishment of debt - (71) - - (71) - - -
Gains on equity method investment transactions - - - - - 126 247 373
Investment income (loss) and other (1) 1 (2) (2) (4) 2 1 3
Income (loss) from continuing operations before income taxes $ (41) $ (112) $ (14) $ 483 $ 316 $ (62) $ 389 $ 327
Provision (benefit) for income taxes (15) (33) (8) 130 74 (14) 84 70
Income (loss) from continuing operations $ (26) $ (79) $ (6) $ 353 $ 242 $ (48) $ 305 $ 257
Income (loss) from discontinued operations (89) (2) (1) 1 (91) - - -
Net income (loss) $ (115) $ (81) $ (7) $ 354 $ 151 $ (48) $ 305 $ 257
Less: Dividends on preferred stock 4 4 - - 8 - - -
Net income (loss) available to WPX Energy, Inc. common stockholders $ (119) $ (85) $ (7) $ 354 $ 143 $ (48) $ 305 $ 257
Amounts available to WPX Energy, Inc. common stockholders:
Income (loss) from continuing operations $ (30) $ (83) $ (6) $ 353 $ 234 $ (48) $ 305 $ 257
Income (loss) from discontinued operations (89) (2) (1) 1 (91) - - -
Net income (loss) $ (119) $ (85) $ (7) $ 354 $ 143 $ (48) $ 305 $ 257
Consolidated Statement of Operations (GAAP)
17

2018 2019
(Dollars in millions, except per share amounts) 1st Qtr 2nd Qtr 3rd Qtr 4th Qtr Year 1st Qtr 2nd Qtr YTD
Reconciliation of adjusted income (loss) from continuing operations available to common stockholders:
Income (loss) from continuing operations available to WPX Energy, Inc. common stockholders - reported $ (30) $ (83) $ (6) $ 353 $ 234 $ (48) $ 305 $ 257
Pre-tax adjustments:
Net (gains) losses on sales of assets and equity method investment transactions $ 1 $ (1) $ (1) $ (2) $ (3) $ (126) $ (247) $ (373)
Loss on extinguishment of debt $ - $ 71 $ - $ - $ 71 $ - $ - $ -
Net (gain) loss on derivatives $ 69 $ 154 $ 139 $ (443) $ (81) $ 207 $ (78) $ 129
Net cash received (paid) related to settlement of derivatives $ (55) $ (78) $ (85) $ (19) $ (237) $ 9 $ (10) $ (1)
Total pre-tax adjustments $ 15 $ 146 $ 53 $ (464) $ (250) $ 90 $ (335) $ (245)
Less tax effect for above items $ (3) $ (33) $ (13) $ 107 $ 58 $ (20) $ 76 $ 56
Impact of state deferred tax rate change $ (4) $ - $ - $ (1) $ (5) $ - $ - $ -
Impact of tax valuation allowance (annual effective tax rate method) $ - $ - $ - $ 2 $ 2 $ 1 $ (9) $ (8)
Impact of state related adjustment $ - $ - $ - $ - $ - $ (1) $ - $ (1)
Adjustment for estimated annual effective tax rate method $ - $ (7) $ (5) $ 12 $ - $ - $ - $ -
Total adjustments, after tax $ 8 $ 106 $ 35 $ (344) $ (195) $ 70 $ (268) $ (198)
Adjusted income (loss) from continuing operations availableto common stockholders $ (22) $ 23 $ 29 $ 9 $ 39 $ 22 $ 37 $ 59
Reconciliation-Adjusted Income (Loss) from Continuing Operations (Non-GAAP)
18

Reconciliation – Adjusted Diluted Income (Loss) Per Common Share
19
1. Per share impact is based on adjusted diluted weighted average shares.
2018 2019
(Dollars in millions, except per share amounts) 1st Qtr 2nd Qtr 3rd Qtr 4th Qtr Year 1st Qtr 2nd Qtr YTD
Reconciliation of adjusted diluted income (loss) per common share:
Income (loss) from continuing operations - diluted earnings per share - reported $ (0.07) $ (0.21) $ (0.01) $ 0.83 $ 0.57 $ (0.11) $ 0.72 $ 0.61
Impact of adjusted diluted weighted-average shares $ - $ 0.01 $ - $ - $ - $ - $ - $ -
Pretax adjustments (1):
Net (gains) losses on sales of assets and equity method investment transactions $ - $ - $ - $ - $ (0.01) $ (0.30) $ (0.58) $ (0.88)
Loss on extinguishment of debt $ - $ 0.18 $ - $ - $ 0.17 $ - $ - $ -
Net (gain) loss on derivatives $ 0.17 $ 0.38 $ 0.33 $ (1.04) $ (0.20) $ 0.49 $ (0.19) $ 0.30
Net cash received (paid) related to settlement of derivatives $ (0.13) $ (0.20) $ (0.20) $ (0.06) $ (0.57) $ 0.02 $ (0.02) $ -
Total pretax adjustments $ 0.04 $ 0.36 $ 0.13 $ (1.10) $ (0.61) $ 0.21 $ (0.79) $ (0.58)
Less tax effect for above items $ (0.02) $ (0.08) $ (0.04) $ 0.26 $ 0.14 $ (0.05) $ 0.18 $ 0.13
Impact of state tax rate change $ (0.01) $ - $ - $ - $ (0.01) $ - $ - $ -
Impact of tax valuation allowance (annual effective tax rate method) $ - $ - $ - $ - $ - $ - $ (0.02) $ (0.02)
Impact of state related adjustment $ - $ - $ - $ - $ - $ - $ - $ -
Adjustment for estimated annual effective tax rate method $ - $ (0.02) $ (0.01) $ 0.03 $ - $ - $ - $ -
Total adjustments, after-tax $ 0.01 $ 0.26 $ 0.08 $ (0.81) $ (0.48) $ 0.16 $ (0.63) $ (0.47)
Adjusted diluted income (loss) per common share $ (0.06) $ 0.06 $ 0.07 $ 0.02 $ 0.09 $ 0.05 $ 0.09 $ 0.14
Reported diluted weighted-average shares (millions) 398.6 400.0 414.0 424.0 411.7 421.0 423.5 423.6
Effect of dilutive securities due to adjusted income (loss) from continuing operations available to common stockholders - 3.1 3.7 - - 2.6 - -
Adjusted diluted weighted-average shares (millions) 398.6 403.1 417.7 424.0 411.7 423.6 423.5 423.6

2018 2019
(Dollars in millions, except per share amounts) 1st Qtr 2nd Qtr 3rd Qtr 4th Qtr Year 1st Qtr 2nd Qtr YTD
Reconciliation of Adjusted EBITDAX
Net income (loss) - reported $ (115) $ (81) $ (7) $ 354 $ 151 $ (48) $ 305 $ 257
Interest expense 46 39 38 40 163 41 40 81
Provision (benefit) for income taxes (15) (33) (8) 130 74 (14) 84 70
Depreciation, depletion and amortization 161 197 193 226 777 219 221 440
Exploration expenses 19 17 18 21 75 24 24 48
EBITDAX 96 139 234 771 1,240 222 674 896
Net (gains) losses on sales of assets and equity method investment transactions 1 (1) (1) (2) (3) (126) (247) (373)
Loss on extinguishment of debt - 71 - - 71 - - -
Net (gain) loss on derivatives 69 154 139 (443) (81) 207 (78) 129
Net cash received (paid) related to settlement of derivatives (55) (78) (85) (19) (237) 9 (10) (1)
(Income) loss from discontinued operations 89 2 1 (1) 91 - - -
Adjusted EBITDAX $ 200 $ 287 $ 288 $ 306 $ 1,081 $ 312 $ 339 $ 651
Reconciliation – Adjusted EBITDAX (Non-GAAP)
20

Disclaimers
The information contained in this summary has been prepared to assist you in making your own evaluation of the Company and does not purport to contain all of the information you may consider
important in deciding whether to invest in shares of the Company’s common stock. In all cases, it is your obligation to conduct your own due diligence. All information contained herein, including any
estimates or projections, is based upon information provided by the Company. Any estimates or projections with respect to future performance have been provided to assist you in your evaluation but
should not be relied upon as an accurate representation of future results. No persons have been authorized to make any representations other than those contained in this summary, and if given or made,
such representations should not be considered as authorized.
Certain statements, estimates and financial information contained in this summary constitute forward-looking statements or information. Such forward-looking statements or information involve known and
unknown risks and uncertainties that could cause actual events or results to differ materially from the results implied or expressed in such forward-looking statements or information. While presented with
numerical specificity, certain forward-looking statements or information are based (1) upon assumptions that are inherently subject to significant business, economic, regulatory, environmental, seasonal,
competitive uncertainties, contingencies and risks including, without limitation, the ability to obtain debt and equity financings, capital costs, construction costs, well production performance, operating
costs, commodity pricing, differentials, royalty structures, field upgrading technology, and other known and unknown risks, all of which are difficult to predict and many of which are beyond the
Company's control, and (2) upon assumptions with respect to future business decisions that are subject to change.
There can be no assurance that the results implied or expressed in such forward-looking statements or information or the underlying assumptions will be realized and that actual results of operations or
future events will not be materially different from the results implied or expressed in such forward-looking statements or information. Under no circumstances should the inclusion of the forward-looking
statements or information be regarded as a representation, undertaking, warranty or prediction by the Company or any other person with respect to the accuracy thereof or the accuracy of the
underlying assumptions, or that the Company will achieve or is likely to achieve any particular results. The forward-looking statements or information are made as of the date hereof and the Company
disclaims any intent or obligation to update publicly or to revise any of the forward-looking statements or information, whether as a result of new information, future events or otherwise. Recipients are
cautioned that forward-looking statements or information are not guarantees of future performance and, accordingly, recipients are expressly cautioned not to put undue reliance on forward-looking
statements or information due to the inherent uncertainty therein.
21
The SEC requires oil and gas companies, in filings made with the SEC, to disclose proved reserves, which are those quantities of oil and gas, which, by analysis of geoscience and engineering data, can be
estimated with reasonable certainty to be economically producible – from a given date forward, from known reservoirs, under existing economic conditions, operating methods, and governmental
regulations. The SEC permits the optional disclosure of probable and possible reserves. We have elected to use in this presentation “probable” reserves and “possible” reserves, excluding their valuation.
The SEC defines “probable” reserves as “those additional reserves that are less certain to be recovered than proved reserves but which, together with proved reserves, are as likely as not to be recovered.”
The SEC defines “possible” reserves as “those additional reserves that are less certain to be recovered than probable reserves.” The Company has applied these definitions in estimating probable and
possible reserves. Statements of reserves are only estimates and may not correspond to the ultimate quantities of oil and gas recovered. Any reserve estimates provided in this presentation that are not
specifically designated as being estimates of proved reserves may include estimated reserves not necessarily calculated in accordance with, or contemplated by, the SEC’s reserves reporting guidelines.
Investors are urged to consider closely the disclosure regarding our business that may be accessed through the SEC’s website at www.sec.gov.
The SEC’s rules prohibit us from filing resource estimates. Our resource estimations include estimates of hydrocarbon quantities for (i) new areas for which we do not have sufficient information to date to
classify as proved, probable or even possible reserves, (ii) other areas to take into account the low level of certainty of recovery of the resources and (iii) uneconomic proved, probable or possible reserves.
Resource estimates do not take into account the certainty of resource recovery and are therefore not indicative of the expected future recovery and should not be relied upon. Resource estimates might
never be recovered and are contingent on exploration success, technical improvements in drilling access, commerciality and other factors.
This presentation may include certain financial measures, including adjusted EBITDAX (earnings before interest, taxes, depreciation, depletion, amortization and exploration expenses), that are non-
GAAP financial measures as defined under the rules of the Securities and Exchange Commission.
This presentation is accompanied by a reconciliation of these non-GAAP financial measures to their nearest GAAP financial measures. Management uses these financial measures because they
are widely accepted financial indicators used by investors to compare a company’s performance. Management believes that these measures provide investors an enhanced perspective of the
operating performance of the company and aid investor understanding. Management also believes that these non-GAAP measures provide useful information regarding our ability to meet future
debt service, capital expenditures and working capital requirements. These non-GAAP financial measures should not be considered in isolation or as substitutes for a measure of performance
prepared in accordance with United States generally accepted accounting principles.
Reserves Disclaimer
WPX Non-GAAP Disclaimer


![Oct 2014 Broadcast Web... · [Web Edition 25-10-2014] Oakwood Church Springwood Road Leeds LS8 2QA Roundhay St John and Roundhay Methodist Thorner Methodist Church Main Street Thorner](https://img.pdfslide.net/doc/110x75/60a827d03d07791210652832/oct-2014-broadcast-web-web-edition-25-10-2014-oakwood-church-springwood-road.jpg)