Embed Size (px)
Citation preview

Report on the
LIVELIHOOD ANALYSIS
In the Rayagada Block of the Gajapati District, Orissa
A Joint Effort of
Centre for Community Development (CCD) &
International Development Enterprises (India)
IDEI
CPHP Livelihood Analysis 1
Index Contents Page Number
Acknowledgement
1. Introduction
2. Background of the Study
3. Objective of the Study
5
5
6
4. Livelihood Analysis Framework 6
5. Investigative Team
6. Time Frame of the Study
6
7
7. Methodology 7
8. Sample Size & Criteria for Sample Selection 8
9. Observations & Analysis 9
Human Capital
Social Capital
Natural Capital
Physical Capital
Financial Capital
Market Analysis
10
17
22
26
27
30
10. SWOT and BEEM Analysis of Livelihood System 37
11. Suggestions 38
12. Limitations of the Study 40
13. References 40
CPHP Livelihood Analysis 2
List of Charts 1. Occupational Breakup of Population in the Sample Villages
2. Levels of Literacy
3. Sources of Information (market, agronomic)
4. Gender Division of On-farm Activities
5. Gender Division of Off-farm Activities
6. Type of Social Institutions
7. Opinion Leaders
8. Sources of Irrigation
9. Expenditure Heads
CPHP Livelihood Analysis 3
List of Annexures 1. Annexure I: Investigative Team for Livelihood Analysis
2. Annexure II: Map of Rayagada Block
3. Annexure III: Summary of Sample Villages
4. Annexure IV: Crop acreage and Irrigation Profile of Sample Villages
5. Annexure V: Crop Calendar
6. Annexure VI: Cost-Benefit Analysis of Main Crops
Pineapple
Lemon
Cashew
Guava
7. Annexure VII: Structure and Dynamics of Market System
8. Annexure VIII: Problem Tree- Cause & Effect of Main Livelihood Constraints
9. Annexure IX: Pictorial depiction of the Pineapple Harvesting and Selling
10. Annexure X: Livelihood Analysis Questionnaire
CPHP Livelihood Analysis 4
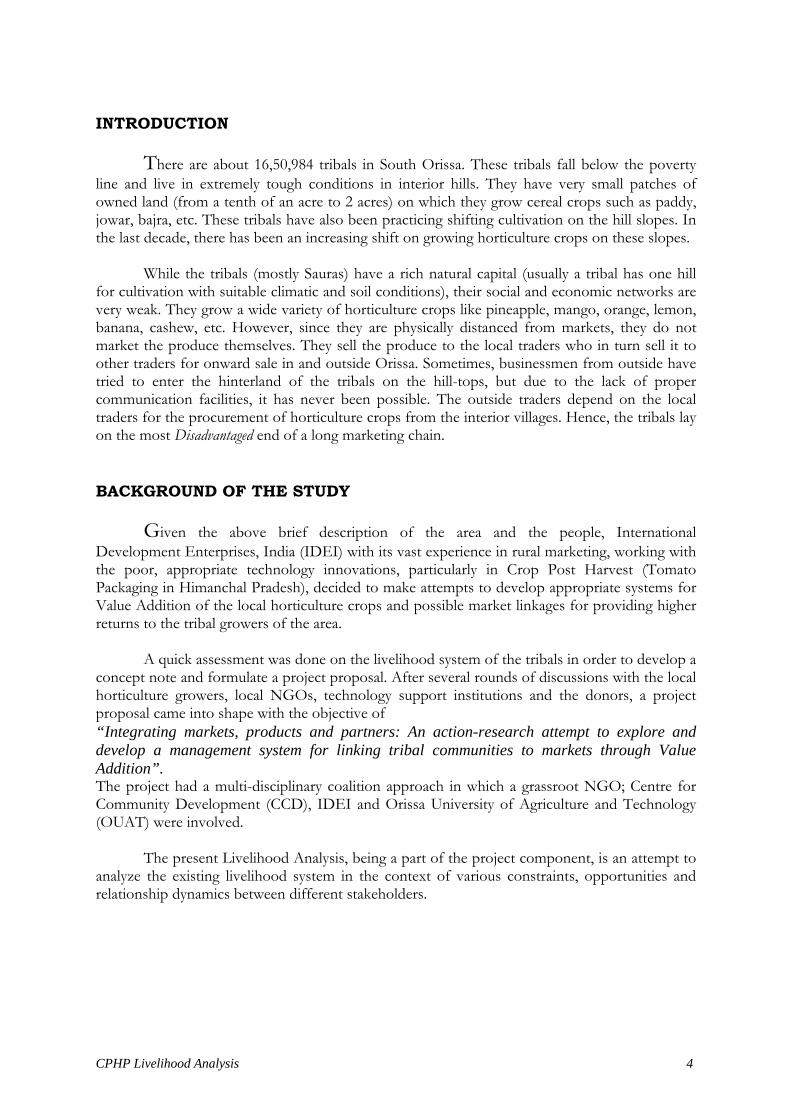
INTRODUCTION
There are about 16,50,984 tribals in South Orissa. These tribals fall below the poverty line and live in extremely tough conditions in interior hills. They have very small patches of owned land (from a tenth of an acre to 2 acres) on which they grow cereal crops such as paddy, jowar, bajra, etc. These tribals have also been practicing shifting cultivation on the hill slopes. In the last decade, there has been an increasing shift on growing horticulture crops on these slopes. While the tribals (mostly Sauras) have a rich natural capital (usually a tribal has one hill for cultivation with suitable climatic and soil conditions), their social and economic networks are very weak. They grow a wide variety of horticulture crops like pineapple, mango, orange, lemon, banana, cashew, etc. However, since they are physically distanced from markets, they do not market the produce themselves. They sell the produce to the local traders who in turn sell it to other traders for onward sale in and outside Orissa. Sometimes, businessmen from outside have tried to enter the hinterland of the tribals on the hill-tops, but due to the lack of proper communication facilities, it has never been possible. The outside traders depend on the local traders for the procurement of horticulture crops from the interior villages. Hence, the tribals lay on the most Disadvantaged end of a long marketing chain. BACKGROUND OF THE STUDY Given the above brief description of the area and the people, International Development Enterprises, India (IDEI) with its vast experience in rural marketing, working with the poor, appropriate technology innovations, particularly in Crop Post Harvest (Tomato Packaging in Himanchal Pradesh), decided to make attempts to develop appropriate systems for Value Addition of the local horticulture crops and possible market linkages for providing higher returns to the tribal growers of the area. A quick assessment was done on the livelihood system of the tribals in order to develop a concept note and formulate a project proposal. After several rounds of discussions with the local horticulture growers, local NGOs, technology support institutions and the donors, a project proposal came into shape with the objective of “Integrating markets, products and partners: An action-research attempt to explore and develop a management system for linking tribal communities to markets through Value Addition”. The project had a multi-disciplinary coalition approach in which a grassroot NGO; Centre for Community Development (CCD), IDEI and Orissa University of Agriculture and Technology (OUAT) were involved. The present Livelihood Analysis, being a part of the project component, is an attempt to analyze the existing livelihood system in the context of various constraints, opportunities and relationship dynamics between different stakeholders.
CPHP Livelihood Analysis 5
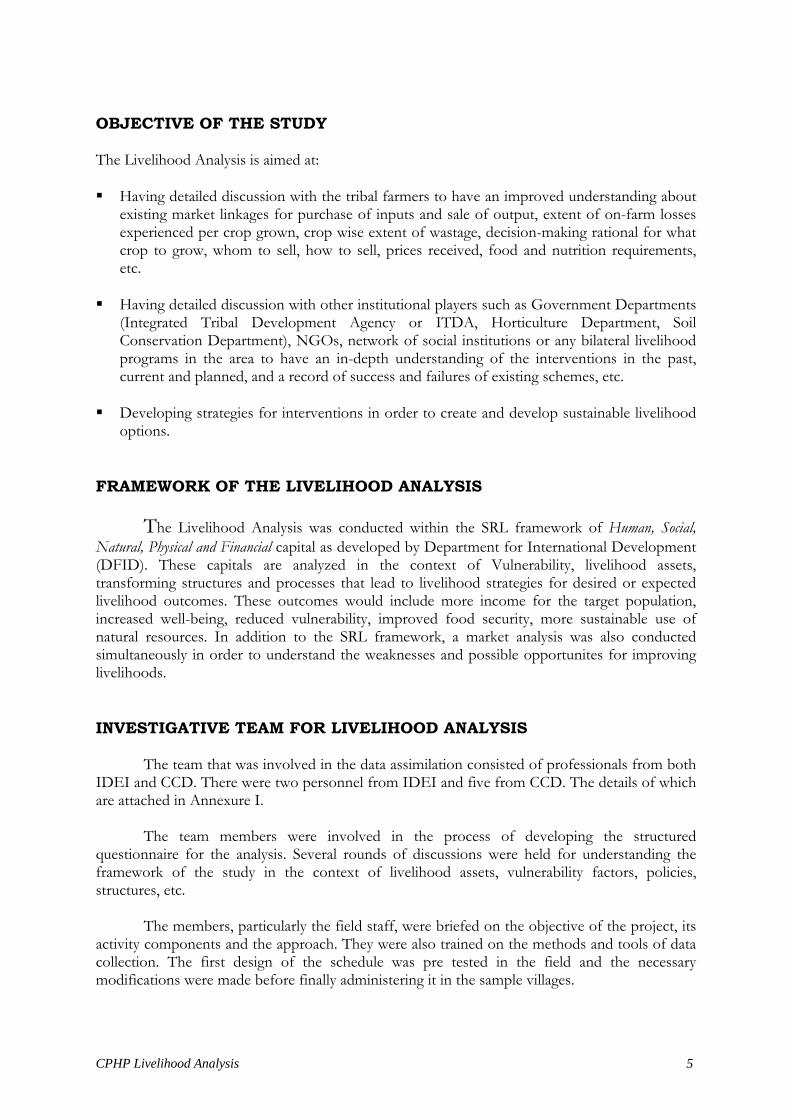
OBJECTIVE OF THE STUDY The Livelihood Analysis is aimed at: Having detailed discussion with the tribal farmers to have an improved understanding about
existing market linkages for purchase of inputs and sale of output, extent of on-farm losses experienced per crop grown, crop wise extent of wastage, decision-making rational for what crop to grow, whom to sell, how to sell, prices received, food and nutrition requirements, etc.
Having detailed discussion with other institutional players such as Government Departments
(Integrated Tribal Development Agency or ITDA, Horticulture Department, Soil Conservation Department), NGOs, network of social institutions or any bilateral livelihood programs in the area to have an in-depth understanding of the interventions in the past, current and planned, and a record of success and failures of existing schemes, etc.
Developing strategies for interventions in order to create and develop sustainable livelihood
options. FRAMEWORK OF THE LIVELIHOOD ANALYSIS The Livelihood Analysis was conducted within the SRL framework of Human, Social, Natural, Physical and Financial capital as developed by Department for International Development (DFID). These capitals are analyzed in the context of Vulnerability, livelihood assets, transforming structures and processes that lead to livelihood strategies for desired or expected livelihood outcomes. These outcomes would include more income for the target population, increased well-being, reduced vulnerability, improved food security, more sustainable use of natural resources. In addition to the SRL framework, a market analysis was also conducted simultaneously in order to understand the weaknesses and possible opportunites for improving livelihoods. INVESTIGATIVE TEAM FOR LIVELIHOOD ANALYSIS The team that was involved in the data assimilation consisted of professionals from both IDEI and CCD. There were two personnel from IDEI and five from CCD. The details of which are attached in Annexure I. The team members were involved in the process of developing the structured questionnaire for the analysis. Several rounds of discussions were held for understanding the framework of the study in the context of livelihood assets, vulnerability factors, policies, structures, etc. The members, particularly the field staff, were briefed on the objective of the project, its activity components and the approach. They were also trained on the methods and tools of data collection. The first design of the schedule was pre tested in the field and the necessary modifications were made before finally administering it in the sample villages.
CPHP Livelihood Analysis 6
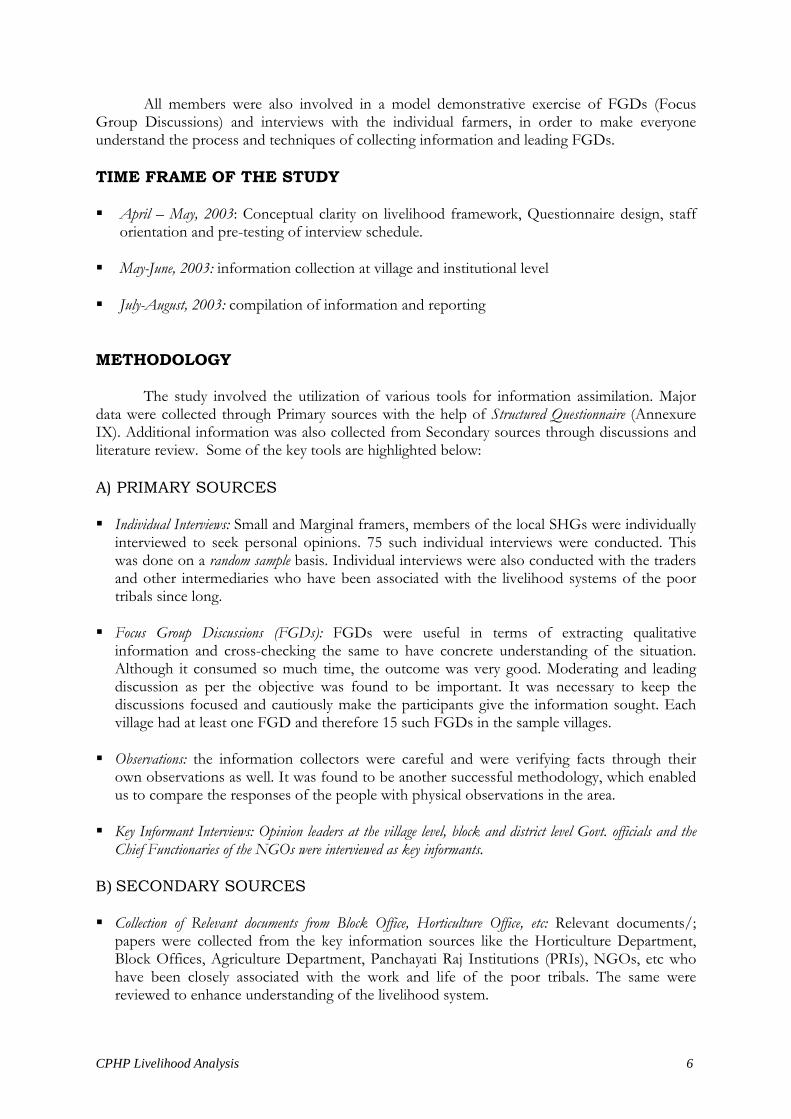
All members were also involved in a model demonstrative exercise of FGDs (Focus Group Discussions) and interviews with the individual farmers, in order to make everyone understand the process and techniques of collecting information and leading FGDs. TIME FRAME OF THE STUDY April – May, 2003: Conceptual clarity on livelihood framework, Questionnaire design, staff
orientation and pre-testing of interview schedule. May-June, 2003: information collection at village and institutional level
July-August, 2003: compilation of information and reporting
METHODOLOGY
The study involved the utilization of various tools for information assimilation. Major data were collected through Primary sources with the help of Structured Questionnaire (Annexure IX). Additional information was also collected from Secondary sources through discussions and literature review. Some of the key tools are highlighted below: A) PRIMARY SOURCES Individual Interviews: Small and Marginal framers, members of the local SHGs were individually
interviewed to seek personal opinions. 75 such individual interviews were conducted. This was done on a random sample basis. Individual interviews were also conducted with the traders and other intermediaries who have been associated with the livelihood systems of the poor tribals since long.
Focus Group Discussions (FGDs): FGDs were useful in terms of extracting qualitative
information and cross-checking the same to have concrete understanding of the situation. Although it consumed so much time, the outcome was very good. Moderating and leading discussion as per the objective was found to be important. It was necessary to keep the discussions focused and cautiously make the participants give the information sought. Each village had at least one FGD and therefore 15 such FGDs in the sample villages.
Observations: the information collectors were careful and were verifying facts through their
own observations as well. It was found to be another successful methodology, which enabled us to compare the responses of the people with physical observations in the area.
Key Informant Interviews: Opinion leaders at the village level, block and district level Govt. officials and the
Chief Functionaries of the NGOs were interviewed as key informants. B) SECONDARY SOURCES Collection of Relevant documents from Block Office, Horticulture Office, etc: Relevant documents/;
papers were collected from the key information sources like the Horticulture Department, Block Offices, Agriculture Department, Panchayati Raj Institutions (PRIs), NGOs, etc who have been closely associated with the work and life of the poor tribals. The same were reviewed to enhance understanding of the livelihood system.
CPHP Livelihood Analysis 7
SAMPLE SIZE
The population statistics (as per Census 1991) of Rayagada Block is as follows:
Total Number of GPs Total Number of Villages Total Population
18 218 SC: 1,637 ST: 43,864 Others: 11,361 TOTAL: 56,862
Out of these 218 villages, a handful of villages had to be selected for the Livelihood
analysis as per the following criteria. Criteria for Village Selection: i. Village should have significant production of horticultural crops.
ii. High production figures for the district
iii. Should have inadequate market linkages for the Horticultural produces
iv. Receiving low price or facing price fluctuation.
v. Willingness and interest to accept changes and cooperate.
vi. Existence of people’s organizations like SHG
vii. Participation of women members in the SHGs
viii. Cooperation of the Govt. Departments for the village.
ix. Should have access to primary market places and approachable road communication
x. Presence of NGO, SHGs, Government departments in the area.
CPHP Livelihood Analysis 8
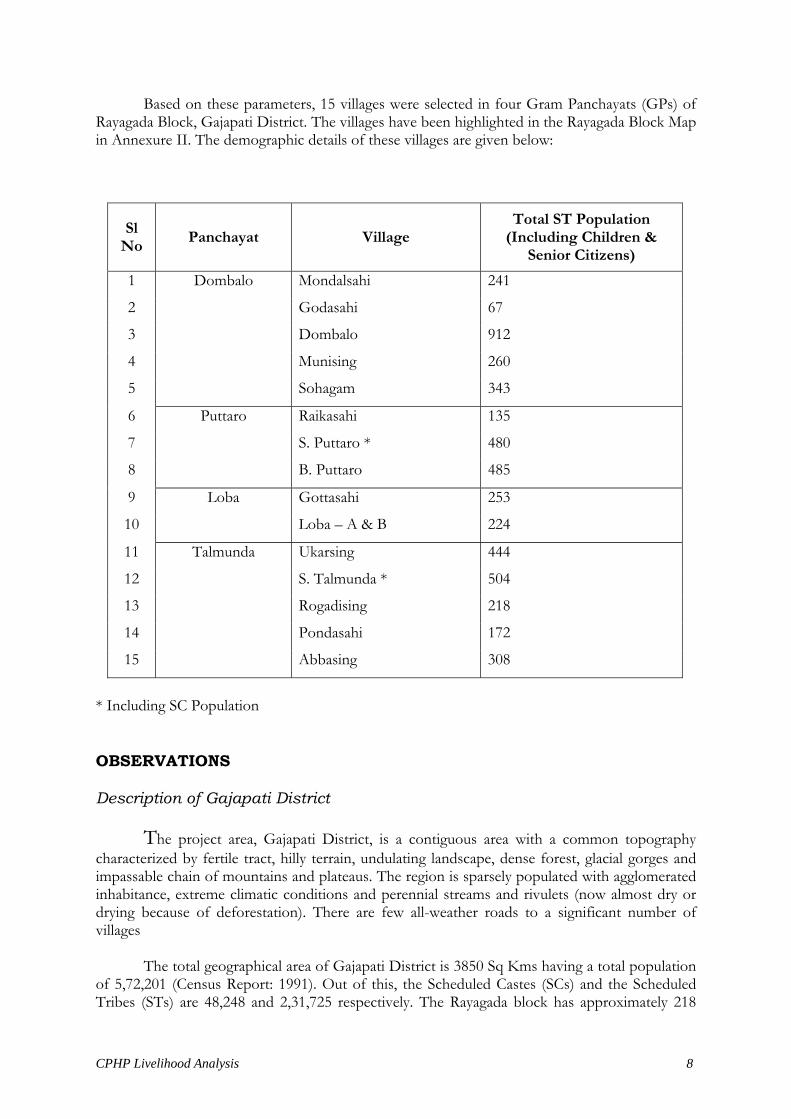
Based on these parameters, 15 villages were selected in four Gram Panchayats (GPs) of Rayagada Block, Gajapati District. The villages have been highlighted in the Rayagada Block Map in Annexure II. The demographic details of these villages are given below:
Sl No Panchayat Village
Total ST Population (Including Children &
Senior Citizens) 1 Dombalo Mondalsahi 241
2 Godasahi 67
3 Dombalo 912
4 Munising 260
5 Sohagam 343
6 Puttaro Raikasahi 135
7 S. Puttaro * 480
8 B. Puttaro 485
9 Loba Gottasahi 253
10 Loba – A & B 224
11 Talmunda Ukarsing 444
12 S. Talmunda * 504
13 Rogadising 218
14 Pondasahi 172
15 Abbasing 308
* Including SC Population OBSERVATIONS Description of Gajapati District
The project area, Gajapati District, is a contiguous area with a common topography characterized by fertile tract, hilly terrain, undulating landscape, dense forest, glacial gorges and impassable chain of mountains and plateaus. The region is sparsely populated with agglomerated inhabitance, extreme climatic conditions and perennial streams and rivulets (now almost dry or drying because of deforestation). There are few all-weather roads to a significant number of villages
The total geographical area of Gajapati District is 3850 Sq Kms having a total population of 5,72,201 (Census Report: 1991). Out of this, the Scheduled Castes (SCs) and the Scheduled Tribes (STs) are 48,248 and 2,31,725 respectively. The Rayagada block has approximately 218
CPHP Livelihood Analysis 9
villages. The Gajapati District is regarded as one of the poorest districts in the state, where over 68% of the population is living below the official poverty line.
To understand the extent of poverty and social deprivation in the district in a
comparative context, it is imperative to compare some of the key economic, social and development indicators with the major districts of the state. Whether one talks of per hectare productivity in agricultural dependence of the people or the secondary or tertiary sector, employment scenario, per capita income, efforts for social modernization and other issues, the district is far below the national average and remains well behind the other districts in most respects. The vulnerable groups are the women, scheduled castes, scheduled tribes and other communities.
Gajapati District is malaria endemic zone. Emerging health problems are the Falciparum
Malaria and Meningcoccal Meningitis, severe forms of brain malaria. The district is struggling to keep this in check.
Description of Rayagada Block
The block map is shown in Annexure II. Topographically the land can be classified into three main categories: High Land (Boguda), Middle Land (Podurao) and Low Land (Billo). The block receives an average annual rainfall of 1300 mm. The major precipitation period is between June to October, during which there are normally 60 rainy days and the rainfall is around 1050 mm. The area also receives rains during October to November which helps Rabi crop under residual moisture conditions. The humidity varies from 85% to 95%. Rayagada Block offers substantial potential for horticulture crops. Out of total geographical area of 51,778 hectares, net area sown is only 10,056 hectares. Remaining about 40,000 ha is available either as forestland or barren land. Podu cultivation (slash and burn) is quite rampant and through this form, the tribals have converted substantial amount of forestland into cultivable land. Most of these areas have been put to horticulture cultivation for orange, pineapple, guava, cashew, lemon, etc. One of the major observations of this form of cultivation was that, the tribals do not touch the fruit plants thus indicating future potential of agro-horticulture in the area. About 50% of the cereal and pulse production and 90% of fruit and vegetable production is sold by the tribals for obtaining cash. However, neither they have access to organized marketing structures nor the crop prices have been encouraging so far. With proper marketing facilities and a coordinated system, there will be enough scope for increasing area under cultivation, productivity and quality of horticultural produce and assuring poor tribals of a higher share of the consumer’s rupee. Human Capital Traditional Skills of the People Most tribal people possess traditional skills of agricultural practices that comprise water harvesting and management skills, inter culture & cropping skills, skills of harvesting, post harvesting practices, skills of storage and transportation, etc. However, it was observed that these people had adopted few modern agricultural practices. About 10% of the population in these 15
CPHP Livelihood Analysis 10
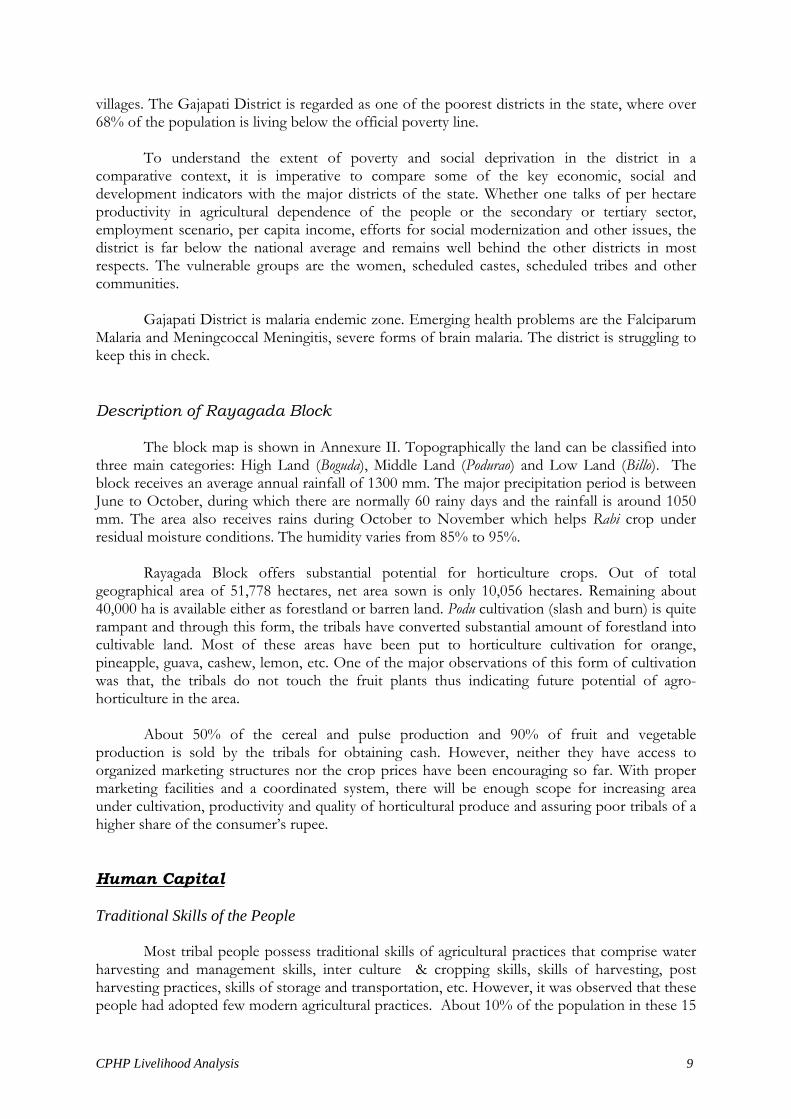
villages have been able to acquire and adopt some of the new skills and technologies. This has been possible due to their exposure to outside farms and trainings, by the initiative of the local NGO and Government departments. There are still many tribals who are clinging on to their traditional skills and are not receptive to change or adoption of new skills. Most tribals are lagging behind in the overall development of their livelihoods due to the absence of different skills like: crop management skills, land management, water management, skills of multi and inter-cropping, introduction of new crops, marketing acumen or non-farm activities, etc. Occupational Breakup of Households The following pie chart is drawn from the statistics collected from the sample villages. It shows the breakup of the Households (HHs). As shown, 61% households are Marginal farmer households and 15% are small farmer households. An equal percent, i.e. 15% of the households are landless. Just 6% households are of medium farmers and small percent of the households have people involved in own business or are into Government services. A few households also had Panchayati Raj Institutions (PRIs) members.
Occupational Breakup of HHs
61%15%
6%
15%1% 2%
Marginal Farmer HHs
Small Farmer HHs
Medium Farmer HHs
Landless HHs
Service
Business
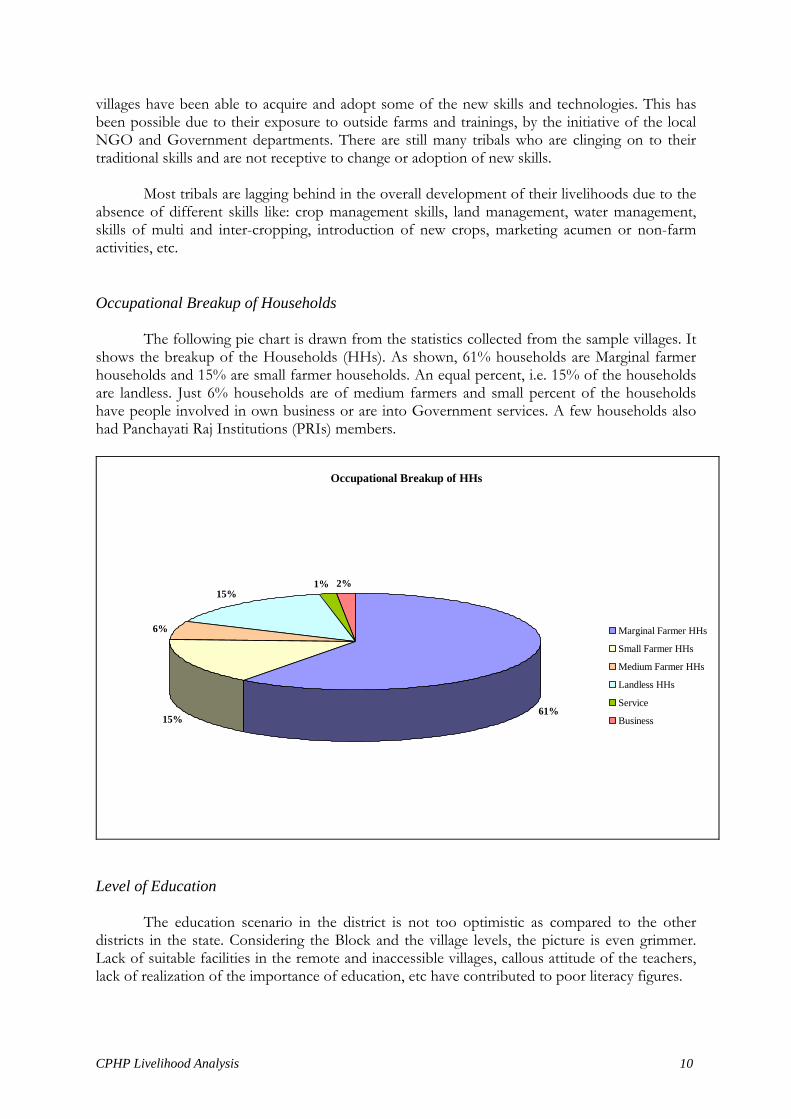
Level of Education
The education scenario in the district is not too optimistic as compared to the other districts in the state. Considering the Block and the village levels, the picture is even grimmer. Lack of suitable facilities in the remote and inaccessible villages, callous attitude of the teachers, lack of realization of the importance of education, etc have contributed to poor literacy figures.

CPHP Livelihood Analysis 11
Out of total adult population of 4095 of these 15 villages selected for analysis, 1416 male and 951 female are literate. 31% are just literate, meaning that these people are just able to put their signatures, but not able to read and write otherwise. 23% have received education upto Primary and Middle school level. A mere 4% of the population has gone above High school level for college education. It is also observed that low levels of literacy has affected the awareness and bargaining power of the marginalized tribals. The following table shows the literacy figures in the sample villages. The Lower Primary and Upper Primary have been clubbed together under one heading of ‘Middle School’. As already mentioned, ‘Just Literate’ are the people who can just write their names or put their signatures.
Literacy Levels
42%
31%
23%
4%
IlliterateJust LiterateMiddle SchoolSeconadry & above
This chart clearly shows that as more and more people are dropping out in successive higher levels of education.
The following Case Study will highlight the positive impact of education in the overall development of the village. This case study is drawn from the Loba Village of Loba panchayat.
CPHP Livelihood Analysis 12
Sources of Information for the Village Farmers
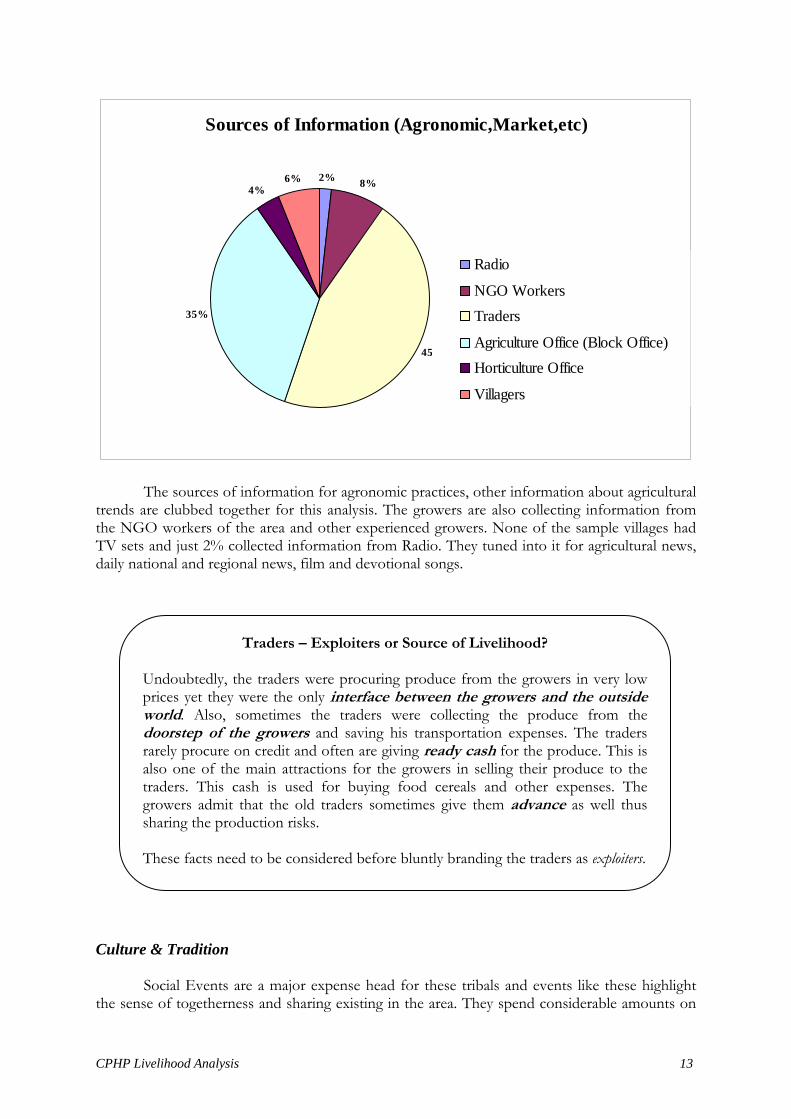
Most of the farmers revert to the Agriculture Department of the Block Office in Rayagada for information regarding Agronomic practices. Very often during the haat day, they visited the Block Office along with other errands earmarked for that day and rarely visited the Block Office otherwise.
Even though, horticulture crops are the high return crops for the farmers, yet they rarely invest the desirable efforts into it. The study showed that there are rare occasions when the growers visit the Horticulture Office in Jerango in order to obtain specific information regarding new trends or better practices for increased crop production. They relied on age-old practices and whatever information they could obtain from Village Agriculture Workers (VAWs).
For market information, the farmers were depended on the traders. They had no information regarding the final market prices and settled for whatever price that was offered by the traders. They did not make personal efforts to obtain market information from other sources. Cumulating all information obtained from the sample villages, the trend obtained is shown in the following table:
Impact of Education on Human Capital LOBA, the Kashmir of Gajapati, is the most unique village in the area. Unique- for not only its altitude, climatic conditions, but also the demography. This village is based on a hilltop and is distanced from the adjacent areas. There is no means of public transport to this village. Commuting to the village is only through private vehicles or through your own god-gifted vehicle. Nearest market, Mandalsahi, is 10 km from this village. The winters are extreme here, the temperature dipping as low as minus 1 to 2 degree C. Visiting this village in the summers is a relief because it is noticeably cooler than the rest of the adjacent villages. The area has the highest production of Oranges during the season and a couple of growers from this village had been sent to observe the cultivation practices in the Orange rich region of Nagpur. However, the most interesting fact is that this village boasts of 4 OAS (Orissa Administrative Officers). One will also find upto 12 Post Graduate students from this village. The younger son of the Sarpanch is a Medical Officer in Udayagiri and the brother of the most progressive farmer of the village is also an OAS officer. Consequently, convincing and involving these villagers during village intervention will be an added advantage and may be used as a hallmark for other villagers. However Loba is a rare village in the locality which has acquired such a level of educational impact.
CPHP Livelihood Analysis 13
Sources of Information (Agronomic,Market,etc)
2% 8%
45%
35%
4%6%
Radio
NGO WorkersTraders
Agriculture Office (Block Office)Horticulture Office
Villagers
The sources of information for agronomic practices, other information about agricultural trends are clubbed together for this analysis. The growers are also collecting information from the NGO workers of the area and other experienced growers. None of the sample villages had TV sets and just 2% collected information from Radio. They tuned into it for agricultural news, daily national and regional news, film and devotional songs. Culture & Tradition
Social Events are a major expense head for these tribals and events like these highlight the sense of togetherness and sharing existing in the area. They spend considerable amounts on
Traders – Exploiters or Source of Livelihood?
Undoubtedly, the traders were procuring produce from the growers in very low prices yet they were the only interface between the growers and the outside world. Also, sometimes the traders were collecting the produce from the doorstep of the growers and saving his transportation expenses. The traders rarely procure on credit and often are giving ready cash for the produce. This is also one of the main attractions for the growers in selling their produce to the traders. This cash is used for buying food cereals and other expenses. The growers admit that the old traders sometimes give them advance as well thus sharing the production risks. These facts need to be considered before bluntly branding the traders as exploiters.

CPHP Livelihood Analysis 14
festivals like, Dusshera, Christmas, Good Friday, New Year, Nua Khai. Their expenses are met either through the community funds or their own savings. They sometimes have to turn to the local money-lender with their credit requirements for a coming occasion or special events like marriage, etc. As observed, the villages showed examples of togetherness and sharing in events like house construction, death ceremony of a tribal, marriage etc. where all households contribute in the form of labour or kind. However these concepts have never been extended to the creation of productive assets or activities of economic returns. Such contributions will have direct effect in improving the status of their livelihoods.
Local level NGOs like CCD have made efforts to consolidate these concepts in the form
of SHGs for strengthening livelihoods of the poor tribals. This process has picked up momentum in the surveyed villages. Fruitful results have been achieved in terms of finding solutions to common problems, individual economic and social concerns through these forums. The reasons of success are the NGO’s initiatives in escorting, guiding and leading the people towards such objectives. Capacity building trainings organised by the local NGOs have significant contribution towards effective management of such groups. Gender Analysis
The activities of these tribals can be broadly classified as farm and off-farm. They could include the following chores:
On-Farm Activities Off-Farm Activities Land Preparation Cooking Sowing Child Care Weeding Animal Rearing Inter-Culture Health Care Harvesting Purchase of Essential Commodities
Purchase of Input Selling of Output
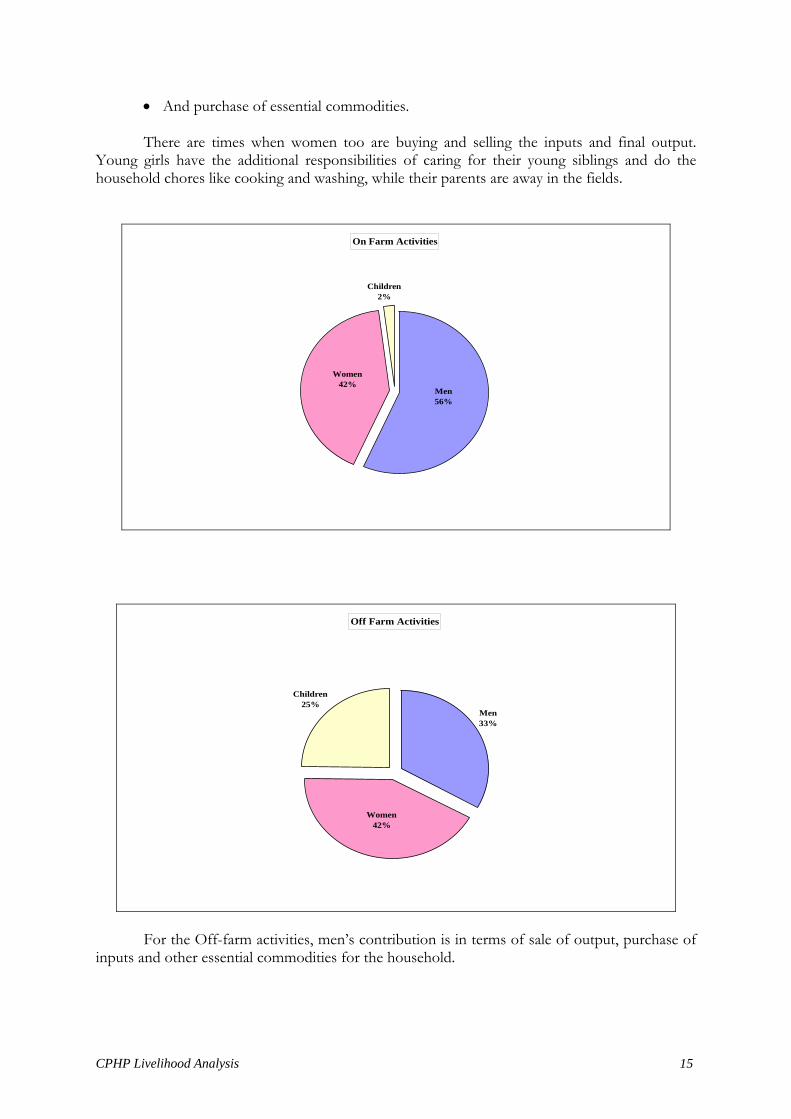
The following tables shows the contribution of men and women in on-farm and off-farm
activities. Women have about 42% contribution in the on-farm activities like: • Sowing • Weeding • Harvesting • Inter-culture
Children also are rarely involved in harvesting and weeding. However, males do 56%
work in on-farm activities. For the off-farm activities, women do most of the activities like: • Cooking • Child care • Animal rearing • Health care • Purchase of inputs • Sale of output
CPHP Livelihood Analysis 15
• And purchase of essential commodities. There are times when women too are buying and selling the inputs and final output.
Young girls have the additional responsibilities of caring for their young siblings and do the household chores like cooking and washing, while their parents are away in the fields.
On Farm Activities
Children2%
Women42%
Men56%
Off Farm Activities
Women42%
Children25%
Men33%
For the Off-farm activities, men’s contribution is in terms of sale of output, purchase of inputs and other essential commodities for the household.
CPHP Livelihood Analysis 16
Migration It was observed that very often the landless and marginal farmers in the age group 35-45 years migrated to places like Camey (Arunachal Pradesh), Mumbai (Maharashtra), Raipur (Madhya Pradesh), Bangalore (Karnataka), Guwahati (Assam), Hyderabad (Andhra Pradesh) and Chennai (Tamil Nadu). The migration usually took place after the Kharif crop in search of temporary employment. There have been cases also, where people once gone did not come back to their native villages. Those who came back brought HIV or AIDS and other diseases with them. These cases are limited, yet there is no denying the fact that they are present. The main reason for migration is the lack of sustainable income source and the failure of existing livelihood system to support their food security and cash requirements. Consistent employment throughout the year is also affected by factors like degradation of forests, drying of old streams and rivulets, erratic rainfall, soil erosion, decline in soil fertility, etc. Out of the 15 surveyed villages, regular cases of migration have been observed in Dombalo, Raikasahi, Ragadising villages. This number is increasing day-by-day and more youth are attracted to urban cities in search of livelihood. Creation of employment opportunities and alternative income options will help to mitigate this problem. Social Capital Types of Institutions in the Villages
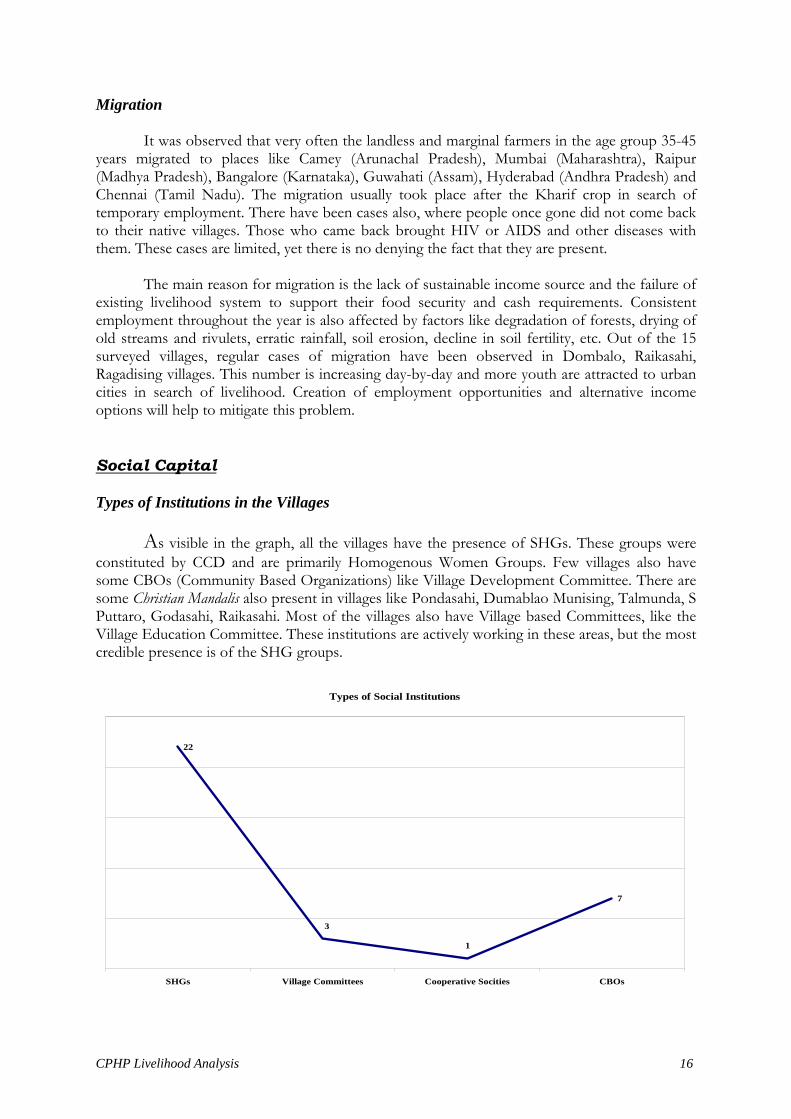
As visible in the graph, all the villages have the presence of SHGs. These groups were constituted by CCD and are primarily Homogenous Women Groups. Few villages also have some CBOs (Community Based Organizations) like Village Development Committee. There are some Christian Mandalis also present in villages like Pondasahi, Dumablao Munising, Talmunda, S Puttaro, Godasahi, Raikasahi. Most of the villages also have Village based Committees, like the Village Education Committee. These institutions are actively working in these areas, but the most credible presence is of the SHG groups.
Types of Social Institutions
22
7
1
3
SHGs Village Committees Cooperative Socities CBOs

CPHP Livelihood Analysis 17
The SHGs are on an average 5-6 years old and have been involved in activities like:
Liasioning with the government: groups have taken initiatives in liasioning activities like; Mobilization of government funds for village roads, Setting up stalls, etc
Thrift and Credit Activities: most of the groups have experience in thrift and credit and have
their own bank accounts with considerable amount of savings. Lending is common within the group and the loan sanctions are decided unanimously by the group members.
Capacity Building Activities: the SHGs have been involved in capacity building activities like
leadership training, agriculture and horticulture skill development trainings, etc.
Develop Market Linkages: the SHGs of the area will soon start market linkage activities for the main horticulture crops of the area. The SHG of Mandalsahi have decided to set up their own vegetable stall in the weekly haat. The produce of the members will be sold through this stall and the earnings divided accordingly.
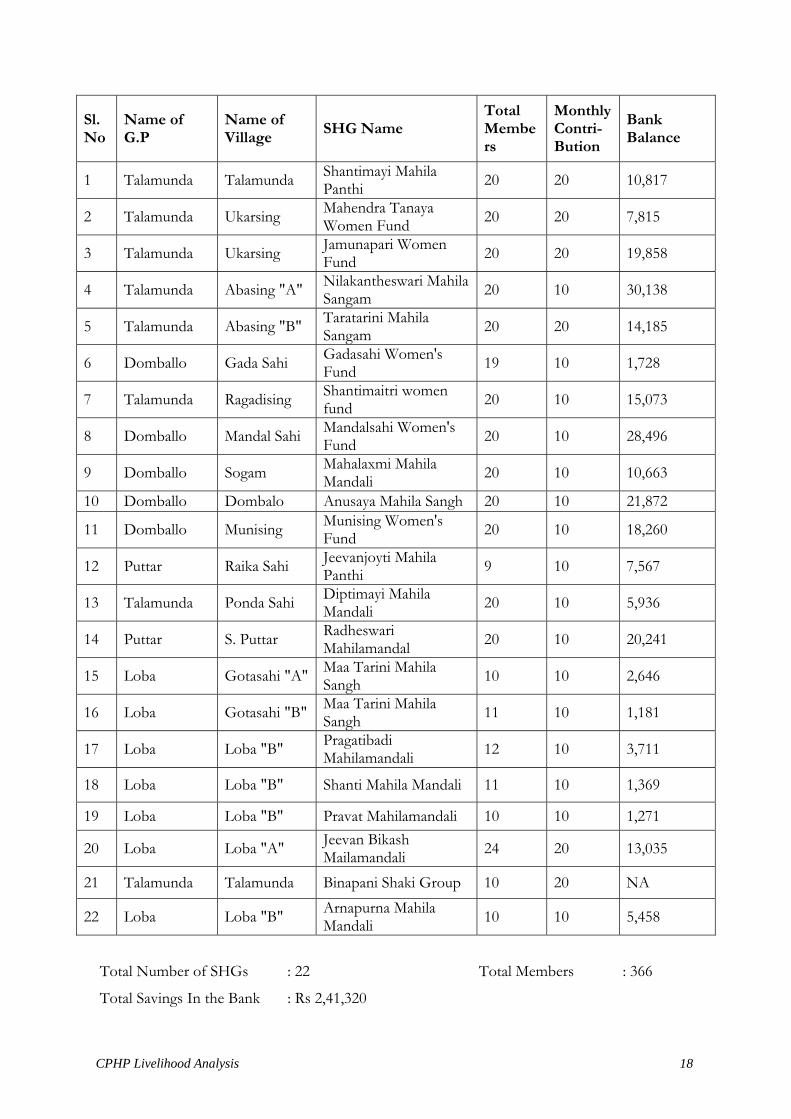
Following table shows the name and other details of the SHGs operational in the sample villages formed by CCD.
“Nobody can Stop us. This is our Village..”
Sanoputtar, a tribal village in Rayagada Block, consisting of 54 households with total population of 389. Most of the people are laborers and depend on Non-Timbre Forest Produces (NTFPs) for an additional source of income. Seasonally, they are depended upon Podu (Slash and Burn) cultivation.
To overcome from this grim situation, the local women came forward, inspired by CCD, to form a SHG to improve their socio-economic condition. They formed a self-help group namely “Radheswari Mahila Sangha” with total of 20 members and decided to focus their activities for the overall development of the village.
With financial support from UNDP, they decided to restart the defunct Non-Formal Education Centre (NFE Centre). They put an appeal before the BDO, Rayagada to handover the responsibility of renovation and restarting the NFE to the Group. Seeing their interest and commitment, the BDO willingly consented to cooperate with the Group members. The centre was promptly repaired and renovated with the available financial support.
Now the village and SHG meetings are regularly held in this building. Impressed with their initiatives, the BDO has decided to provide support to the Mahila Mandal for starting fish cultivation, in the village pond. In addition, the group members have been instrumental in getting the first Rope & Washer pump of IDE installed in their village for improving the water accessibility.
CPHP Livelihood Analysis 18
Sl. No
Name of G.P
Name of Village SHG Name
Total Members
Monthly Contri- Bution
Bank Balance
1 Talamunda Talamunda Shantimayi Mahila Panthi 20 20 10,817
2 Talamunda Ukarsing Mahendra Tanaya Women Fund 20 20 7,815
3 Talamunda Ukarsing Jamunapari Women Fund 20 20 19,858
4 Talamunda Abasing "A" Nilakantheswari Mahila Sangam 20 10 30,138
5 Talamunda Abasing "B" Taratarini Mahila Sangam 20 20 14,185
6 Domballo Gada Sahi Gadasahi Women's Fund 19 10 1,728
7 Talamunda Ragadising Shantimaitri women fund 20 10 15,073
8 Domballo Mandal Sahi Mandalsahi Women's Fund 20 10 28,496
9 Domballo Sogam Mahalaxmi Mahila Mandali 20 10 10,663
10 Domballo Dombalo Anusaya Mahila Sangh 20 10 21,872
11 Domballo Munising Munising Women's Fund 20 10 18,260
12 Puttar Raika Sahi Jeevanjoyti Mahila Panthi 9 10 7,567
13 Talamunda Ponda Sahi Diptimayi Mahila Mandali 20 10 5,936
14 Puttar S. Puttar Radheswari Mahilamandal 20 10 20,241
15 Loba Gotasahi "A" Maa Tarini Mahila Sangh 10 10 2,646
16 Loba Gotasahi "B" Maa Tarini Mahila Sangh 11 10 1,181
17 Loba Loba "B" Pragatibadi Mahilamandali 12 10 3,711
18 Loba Loba "B" Shanti Mahila Mandali 11 10 1,369
19 Loba Loba "B" Pravat Mahilamandali 10 10 1,271
20 Loba Loba "A" Jeevan Bikash Mailamandali 24 20 13,035
21 Talamunda Talamunda Binapani Shaki Group 10 20 NA
22 Loba Loba "B" Arnapurna Mahila Mandali 10 10 5,458
Total Number of SHGs : 22 Total Members : 366
Total Savings In the Bank : Rs 2,41,320
CPHP Livelihood Analysis 19
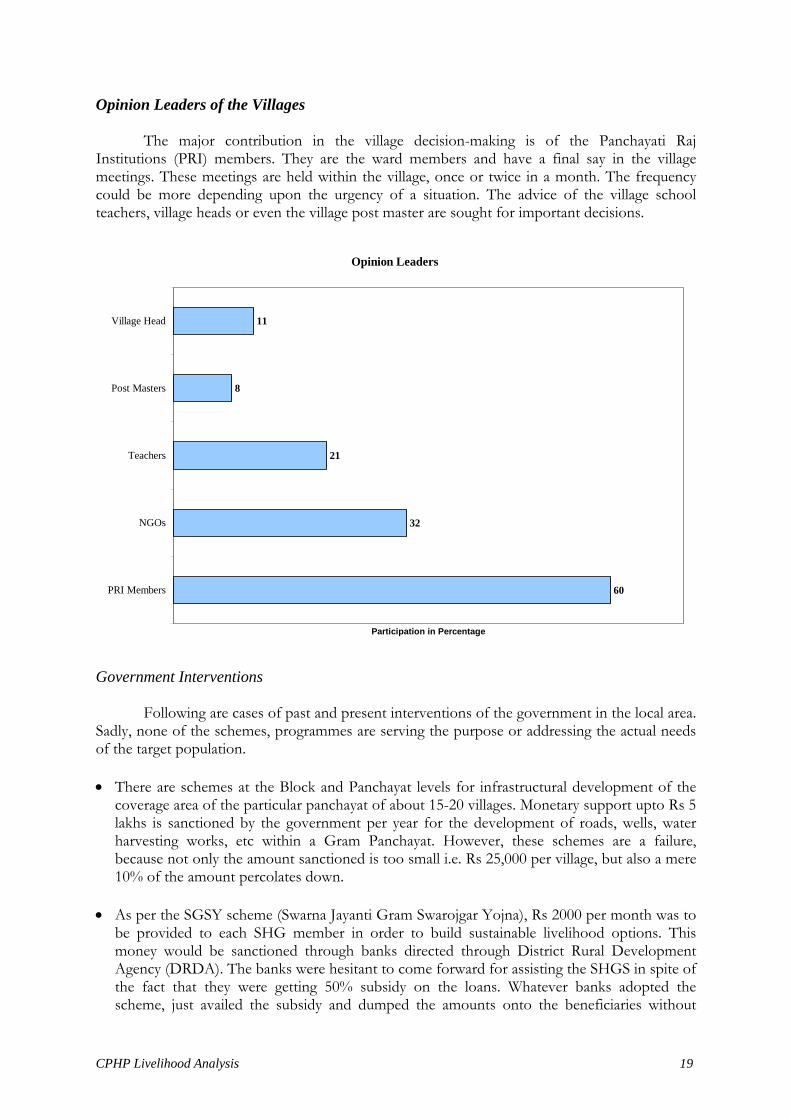
Opinion Leaders of the Villages
The major contribution in the village decision-making is of the Panchayati Raj Institutions (PRI) members. They are the ward members and have a final say in the village meetings. These meetings are held within the village, once or twice in a month. The frequency could be more depending upon the urgency of a situation. The advice of the village school teachers, village heads or even the village post master are sought for important decisions.
Opinion Leaders
60
32
21
8
11
PRI Members
NGOs
Teachers
Post Masters
Village Head
Participation in Percentage
Government Interventions Following are cases of past and present interventions of the government in the local area. Sadly, none of the schemes, programmes are serving the purpose or addressing the actual needs of the target population. • There are schemes at the Block and Panchayat levels for infrastructural development of the
coverage area of the particular panchayat of about 15-20 villages. Monetary support upto Rs 5 lakhs is sanctioned by the government per year for the development of roads, wells, water harvesting works, etc within a Gram Panchayat. However, these schemes are a failure, because not only the amount sanctioned is too small i.e. Rs 25,000 per village, but also a mere 10% of the amount percolates down.
• As per the SGSY scheme (Swarna Jayanti Gram Swarojgar Yojna), Rs 2000 per month was to
be provided to each SHG member in order to build sustainable livelihood options. This money would be sanctioned through banks directed through District Rural Development Agency (DRDA). The banks were hesitant to come forward for assisting the SHGS in spite of the fact that they were getting 50% subsidy on the loans. Whatever banks adopted the scheme, just availed the subsidy and dumped the amounts onto the beneficiaries without
CPHP Livelihood Analysis 20
bothering about repayment. Also, for availing the loan it was important to show a BPL card (Below Poverty Line). That too was not easy as people who owned an asset like a cycle, were in the APL (Above Poverty Line) category or having a tin roof instead of a thatched roof was an indicator of being in the APL category. Thus, this scheme too like many other ambitious schemes never benefited the needy.
Other Interventions by NGOs Social organizations like, CCD and CARE, have taken up initiatives to develop the livelihood status of the community. Although these organizations are working in limited Gram Panchayats with limited resources, yet they had been able to provide livelihood support to the people on priority basis. CCD has been instrumental in establishing SHGs (Each sample village had at least one) and improving the social and economic status of the women of the area. CARE through its ‘Food for Work’ program is providing access to food in one panchayat in the area.
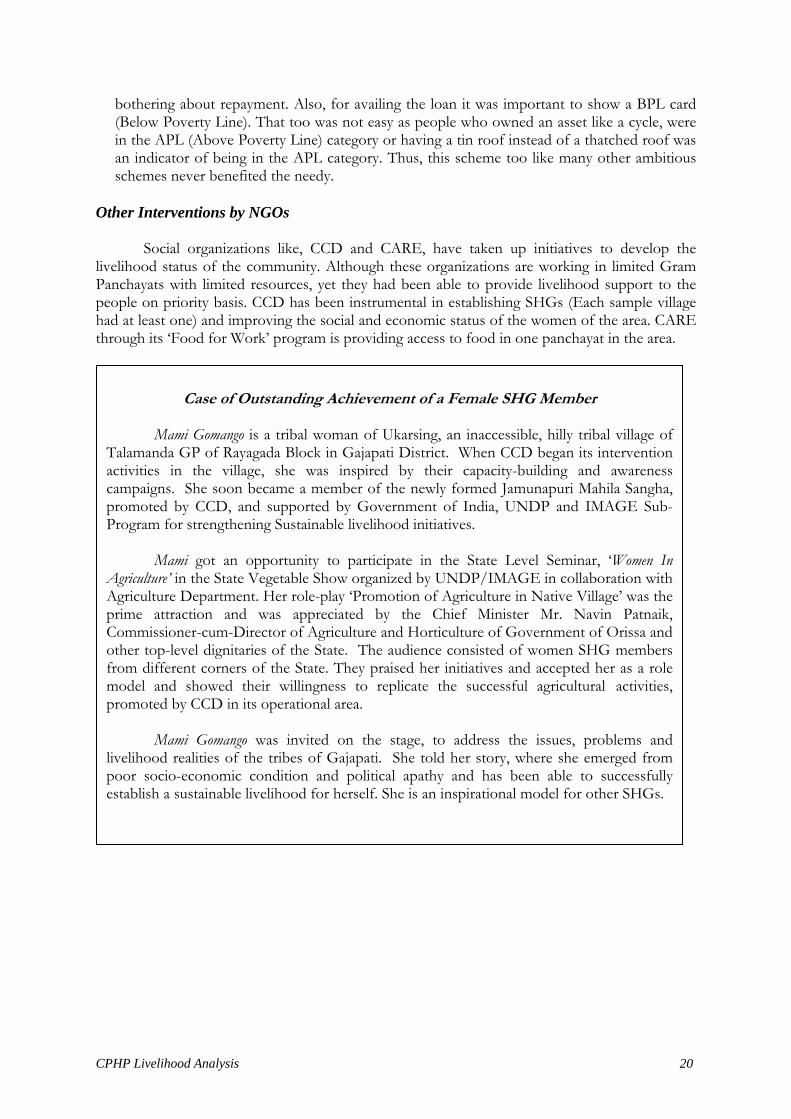
Case of Outstanding Achievement of a Female SHG Member
Mami Gomango is a tribal woman of Ukarsing, an inaccessible, hilly tribal village of
Talamanda GP of Rayagada Block in Gajapati District. When CCD began its intervention activities in the village, she was inspired by their capacity-building and awareness campaigns. She soon became a member of the newly formed Jamunapuri Mahila Sangha, promoted by CCD, and supported by Government of India, UNDP and IMAGE Sub-Program for strengthening Sustainable livelihood initiatives.
Mami got an opportunity to participate in the State Level Seminar, ‘Women In
Agriculture’ in the State Vegetable Show organized by UNDP/IMAGE in collaboration with Agriculture Department. Her role-play ‘Promotion of Agriculture in Native Village’ was the prime attraction and was appreciated by the Chief Minister Mr. Navin Patnaik, Commissioner-cum-Director of Agriculture and Horticulture of Government of Orissa and other top-level dignitaries of the State. The audience consisted of women SHG members from different corners of the State. They praised her initiatives and accepted her as a role model and showed their willingness to replicate the successful agricultural activities, promoted by CCD in its operational area.
Mami Gomango was invited on the stage, to address the issues, problems and livelihood realities of the tribes of Gajapati. She told her story, where she emerged from poor socio-economic condition and political apathy and has been able to successfully establish a sustainable livelihood for herself. She is an inspirational model for other SHGs.

CPHP Livelihood Analysis 21
Natural Capital
The natural capital of the area can be broadly classified in three main categories of:
1. Land Resources 2. Water Resource 3. Forest Resources
Land Resources
The topography of the area can be classified broadly into three main land types. Treatment of the land as tilling, irrigation, application of agricultural inputs, thus differs for each land level. The land types are as follows: • High Land (Boguda): the villages under Loba, Puttaro, Dambolo, Jeerango GPs are on hilly
lands with a cool climate. The minimum temperature at times goes below 5 degree Celsius. Generally, the temperature varies between 10- 14 degree Celsius. The soil types are red laterites in the slopes and yellow loamy type in the medium and low lands. The vegetative cover is relatively better and hence soil erosion is not so rampant.
• Middle Land (Podurao): these areas are warmer with the temperature varying between 13-45
degree Celsius. The soil type is red loamy. These lands have been exposed to severe soil erosion.
• Low Land (Billo): villages under Naranyanpur, Rayagada GPs are generally plain lands with
lesser proportion of hilly terrain. The soil types are black cotton and sandy loamy type. These areas have a number of ponds and water harvesting structures. Here, the level of soil erosion is lesser as compared to other areas.
The main source of income is from the horticulture crops cultivated on the hilltops and the agricultural crops like cereal and paddy, cultivated on the plain land and the hilly slopes. The main crops of the area of the sampled 15 villages and the land they are cultivated in can be understood from the following table. Some of these horticulture crops are being intercropped with other high value crops. Example, Cashew plantations are intercropped with pineapple or orange trees.
High Land Crops Medium Land Crops Low Land Crops
Ragi Ragi Ragi Gonga Maize Paddy Kangu Ginger Vegetables Jona Pineapple Burigudi Jackfruit Kandul Lemon Suana Guava Pineapple Mango Cashew Papaya Turmeric Mango

CPHP Livelihood Analysis 22
The area under horticulture crops is more than that under agricultural crops. However, over the years, horticulture crop production is declining due to factors like, soil erosion, inadequate rainfall, rampant degradation of forest cover, reducing soil fertility, etc. and these factors are affecting the quality of produce and the income obtained.
The hilly terrain gives little opportunity for the introduction of agricultural equipments. However, there is potentional in main land where the soil fertility is better and water resources are more. Nevertheless, this area is limited in size and has no scope for further expansion. Therefore, people with some amount of plain land are in a better condition than those with hilly slopes only.
The plain land is mainly used for paddy cultivation, which does not insure high income
returns but only food security for about five months. Practices of vegetable cultivation, multi-cropping, inter-cropping, land usage throughout the season, etc are rare. Ironically, there are no other livelihood options thus almost forcing the tribals into permanent or temporary migration. Also, the acreage for main and horticulture crops, irrigation sources and coverage, etc are represented village-wise in Annexure IV.
The following table represents the main horticulture and vegetable crops of the sample villages. It also shows the average income per acre and the price band of the produce. This is a holistic representation for all 15 villages and should be a reference source only. Crop-wise details are given in Annexure VI.
Seasonal Price Band (in Rs) Crop Type Harvest
Season
Avg. Income/ Acre Start Middle End
Average Price
(in Rs) Horticulture Pineapple May-July 12000 7 6 4 5-6
Guava July-Sept.
Lemon July-Sept. 1000 0.50 0.30 0.15 0.30
Jackfruit May-July 50 Pcs 8 6 2 5-6
Cashew April-May 300 30 28 25 28
Vegetable
Tomato June-Sept. 8000 12 8 6 8
Beans June-Sept. 8000 12 10 5 10
Horticulture Crops As already mentioned, horticulture forms the main livelihood opportunity for the tribals. Annexure IV shows the main crops and the area cultivated under each. The orange plantation in the area is believed to have started more than 100 years back. The Gram Panchayat Loba, has the highest area under orange cultivation and from here this practice had spread to other villages. The Rayagada Orange is of superior quality and fetches a price of Rs 1 to 2 per fruit. Market arrivals begin in the first week of October, peaks around middle of November and ends in the middle of January.
CPHP Livelihood Analysis 23
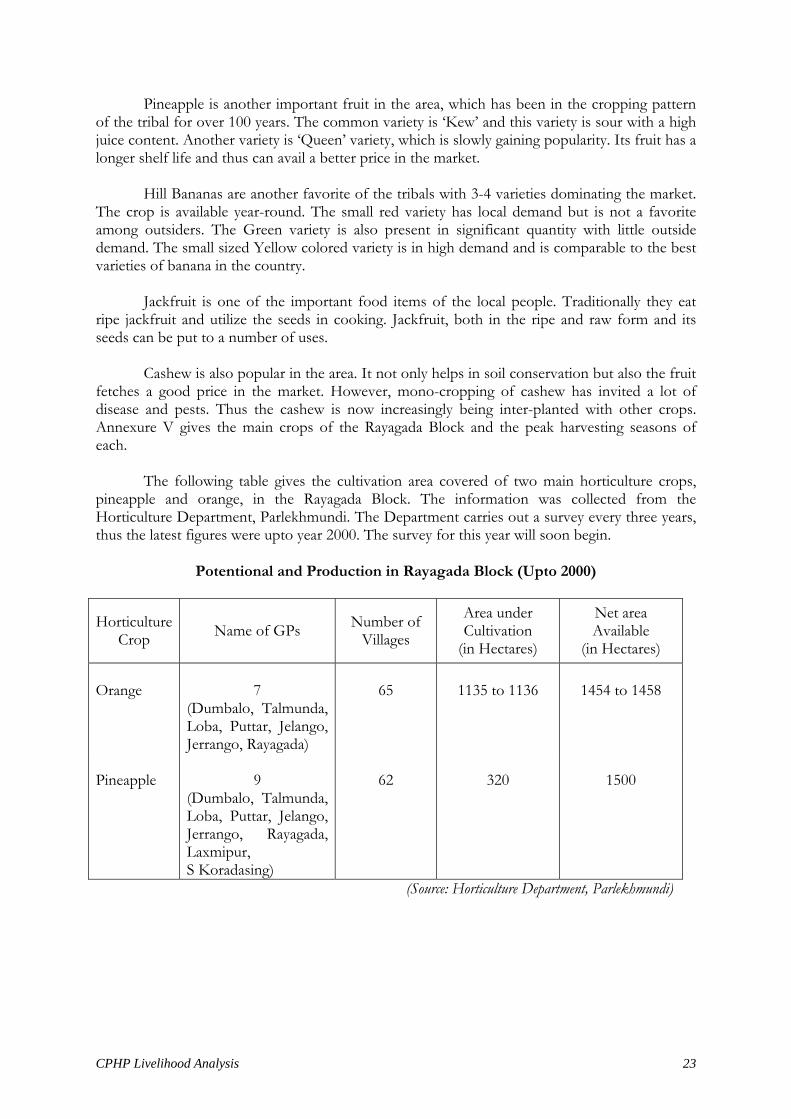
Pineapple is another important fruit in the area, which has been in the cropping pattern of the tribal for over 100 years. The common variety is ‘Kew’ and this variety is sour with a high juice content. Another variety is ‘Queen’ variety, which is slowly gaining popularity. Its fruit has a longer shelf life and thus can avail a better price in the market. Hill Bananas are another favorite of the tribals with 3-4 varieties dominating the market. The crop is available year-round. The small red variety has local demand but is not a favorite among outsiders. The Green variety is also present in significant quantity with little outside demand. The small sized Yellow colored variety is in high demand and is comparable to the best varieties of banana in the country. Jackfruit is one of the important food items of the local people. Traditionally they eat ripe jackfruit and utilize the seeds in cooking. Jackfruit, both in the ripe and raw form and its seeds can be put to a number of uses. Cashew is also popular in the area. It not only helps in soil conservation but also the fruit fetches a good price in the market. However, mono-cropping of cashew has invited a lot of disease and pests. Thus the cashew is now increasingly being inter-planted with other crops. Annexure V gives the main crops of the Rayagada Block and the peak harvesting seasons of each. The following table gives the cultivation area covered of two main horticulture crops, pineapple and orange, in the Rayagada Block. The information was collected from the Horticulture Department, Parlekhmundi. The Department carries out a survey every three years, thus the latest figures were upto year 2000. The survey for this year will soon begin.
Potentional and Production in Rayagada Block (Upto 2000)
Horticulture Crop Name of GPs Number of
Villages
Area under Cultivation
(in Hectares)
Net area Available
(in Hectares) Orange
7
(Dumbalo, Talmunda, Loba, Puttar, Jelango, Jerrango, Rayagada)
65
1135 to 1136
1454 to 1458
Pineapple
9
(Dumbalo, Talmunda, Loba, Puttar, Jelango, Jerrango, Rayagada, Laxmipur, S Koradasing)
62
320
1500
(Source: Horticulture Department, Parlekhmundi)
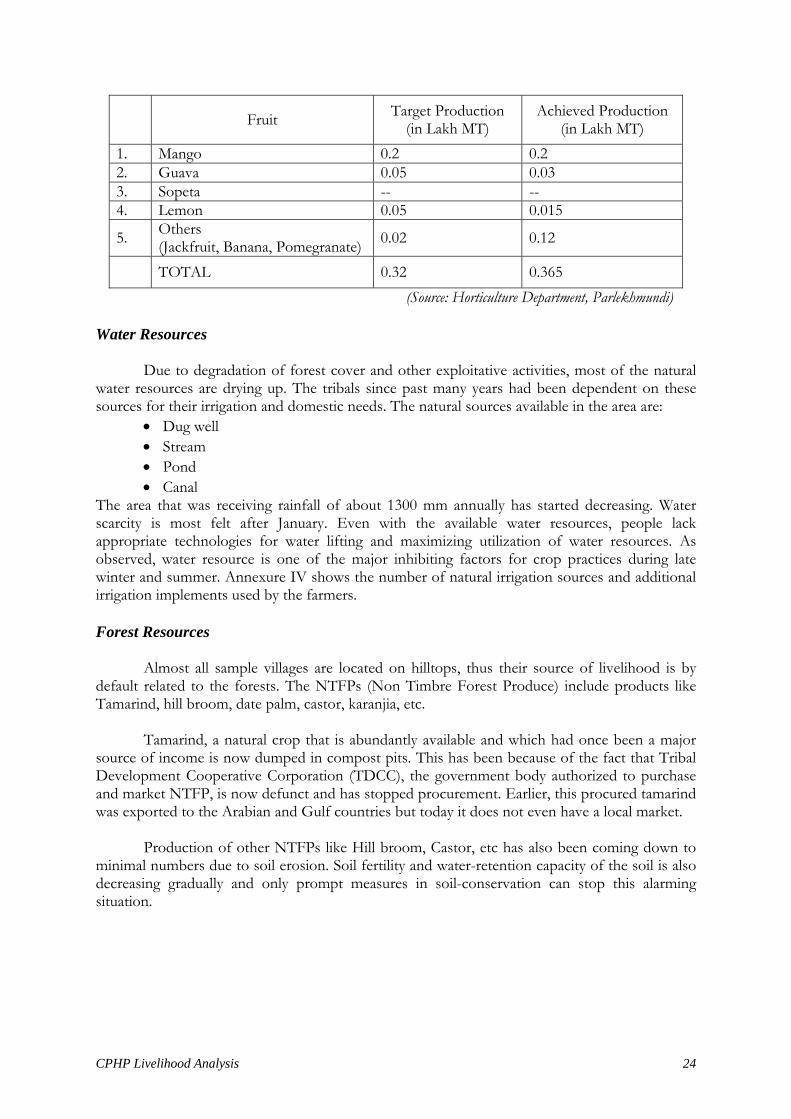
CPHP Livelihood Analysis 24
Fruit Target Production
(in Lakh MT) Achieved Production
(in Lakh MT) 1. Mango 0.2 0.2 2. Guava 0.05 0.03 3. Sopeta -- -- 4. Lemon 0.05 0.015
5. Others (Jackfruit, Banana, Pomegranate) 0.02 0.12
TOTAL 0.32 0.365 (Source: Horticulture Department, Parlekhmundi)
Water Resources Due to degradation of forest cover and other exploitative activities, most of the natural water resources are drying up. The tribals since past many years had been dependent on these sources for their irrigation and domestic needs. The natural sources available in the area are:
• Dug well • Stream • Pond • Canal
The area that was receiving rainfall of about 1300 mm annually has started decreasing. Water scarcity is most felt after January. Even with the available water resources, people lack appropriate technologies for water lifting and maximizing utilization of water resources. As observed, water resource is one of the major inhibiting factors for crop practices during late winter and summer. Annexure IV shows the number of natural irrigation sources and additional irrigation implements used by the farmers. Forest Resources Almost all sample villages are located on hilltops, thus their source of livelihood is by default related to the forests. The NTFPs (Non Timbre Forest Produce) include products like Tamarind, hill broom, date palm, castor, karanjia, etc.
Tamarind, a natural crop that is abundantly available and which had once been a major source of income is now dumped in compost pits. This has been because of the fact that Tribal Development Cooperative Corporation (TDCC), the government body authorized to purchase and market NTFP, is now defunct and has stopped procurement. Earlier, this procured tamarind was exported to the Arabian and Gulf countries but today it does not even have a local market.
Production of other NTFPs like Hill broom, Castor, etc has also been coming down to
minimal numbers due to soil erosion. Soil fertility and water-retention capacity of the soil is also decreasing gradually and only prompt measures in soil-conservation can stop this alarming situation.
CPHP Livelihood Analysis 25
Physical Capital
The key observations during this study in terms of Physical Capital are as follows: None of the villages had a Grain Bank. Also, there were no Agro-Service centers in the
vicinity or accessibility to any such centers. The land topography made it impossible to use large Agriculture Inputs like, Tractor, Power
Tiller. The farmers were using basic agricultural tools like wooden plough, kudi, sabolo and other manual implements for agriculture.
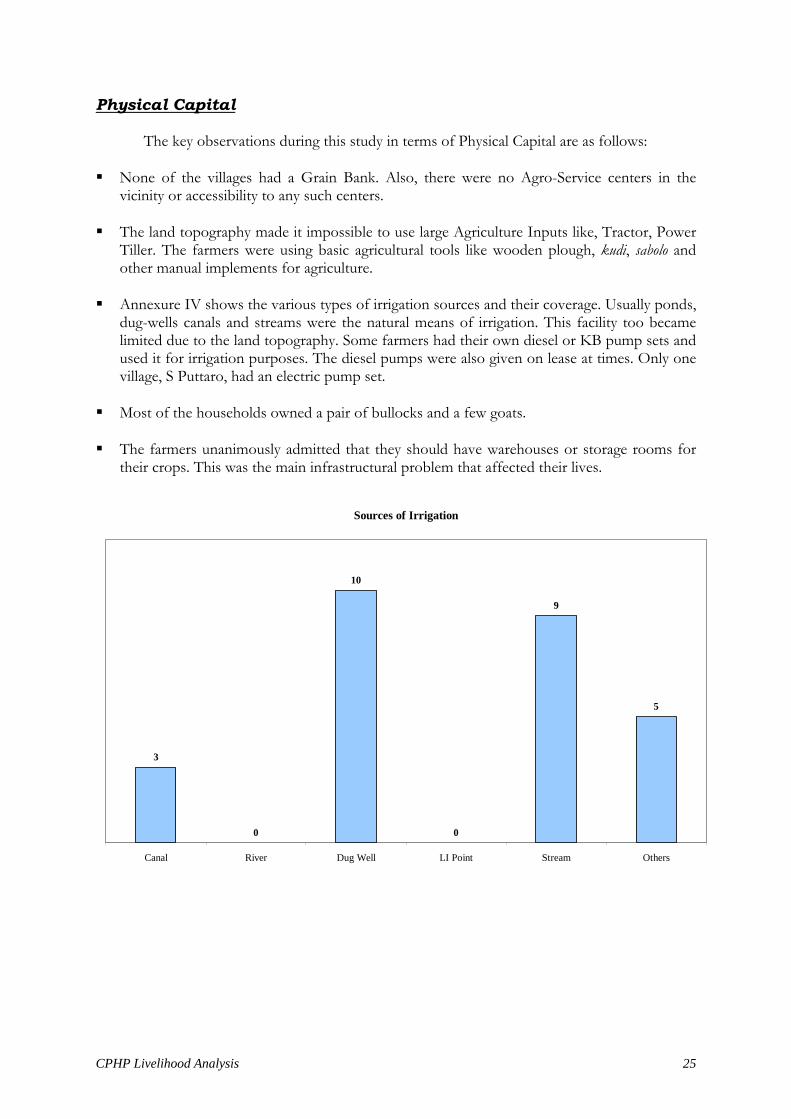
Annexure IV shows the various types of irrigation sources and their coverage. Usually ponds,
dug-wells canals and streams were the natural means of irrigation. This facility too became limited due to the land topography. Some farmers had their own diesel or KB pump sets and used it for irrigation purposes. The diesel pumps were also given on lease at times. Only one village, S Puttaro, had an electric pump set.
Most of the households owned a pair of bullocks and a few goats.
The farmers unanimously admitted that they should have warehouses or storage rooms for
their crops. This was the main infrastructural problem that affected their lives.
Sources of Irrigation
3
0
10
0
9
5
Canal River Dug Well LI Point Stream Others
CPHP Livelihood Analysis 26
Financial Capital Annual Income Sources
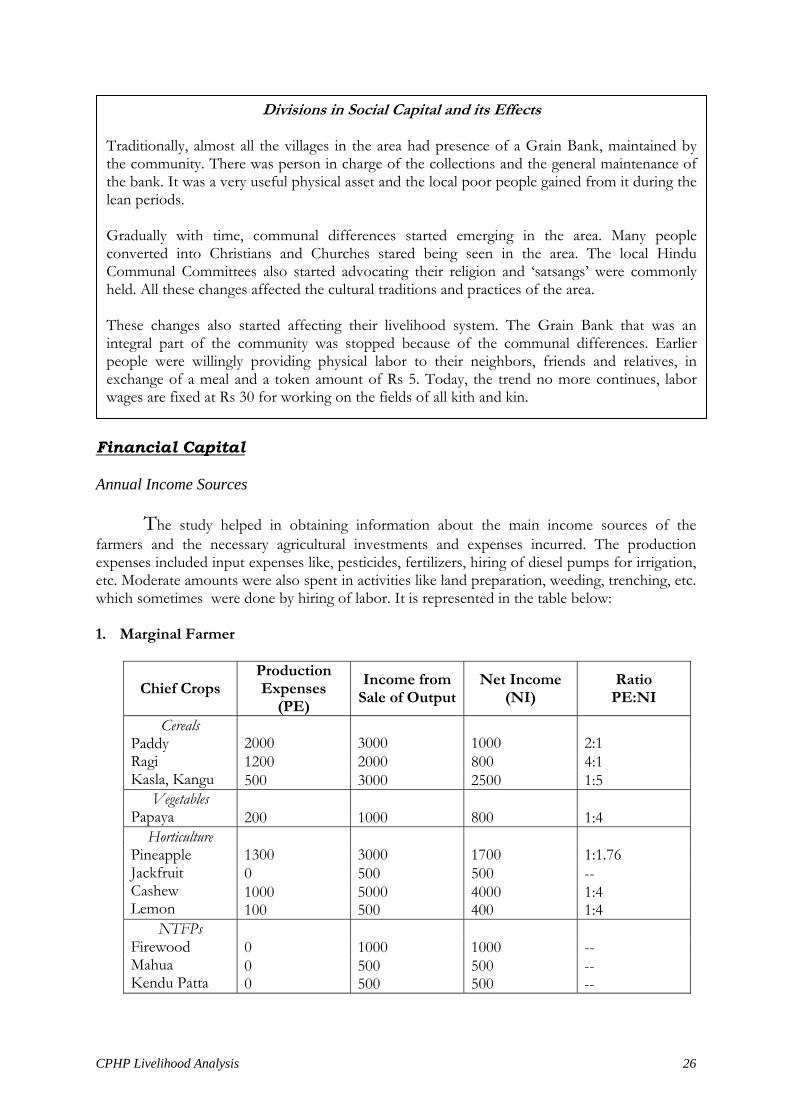
The study helped in obtaining information about the main income sources of the farmers and the necessary agricultural investments and expenses incurred. The production expenses included input expenses like, pesticides, fertilizers, hiring of diesel pumps for irrigation, etc. Moderate amounts were also spent in activities like land preparation, weeding, trenching, etc. which sometimes were done by hiring of labor. It is represented in the table below: 1. Marginal Farmer
Chief Crops Production Expenses
(PE)
Income from Sale of Output
Net Income (NI)
Ratio PE:NI
2000
3000
1000
2:1
1200 2000 800 4:1
Cereals Paddy Ragi Kasla, Kangu 500 3000 2500 1:5
Vegetables Papaya 200 1000 800 1:4
1300 3000 1700 1:1.76 0 500 500 --
Horticulture Pineapple Jackfruit Cashew Lemon
1000 100
5000 500
4000 400
1:4 1:4
0 1000 1000 --
NTFPs Firewood Mahua Kendu Patta
0 0
500 500
500 500
-- --
Divisions in Social Capital and its Effects Traditionally, almost all the villages in the area had presence of a Grain Bank, maintained by the community. There was person in charge of the collections and the general maintenance of the bank. It was a very useful physical asset and the local poor people gained from it during the lean periods. Gradually with time, communal differences started emerging in the area. Many people converted into Christians and Churches stared being seen in the area. The local Hindu Communal Committees also started advocating their religion and ‘satsangs’ were commonly held. All these changes affected the cultural traditions and practices of the area. These changes also started affecting their livelihood system. The Grain Bank that was an integral part of the community was stopped because of the communal differences. Earlier people were willingly providing physical labor to their neighbors, friends and relatives, in exchange of a meal and a token amount of Rs 5. Today, the trend no more continues, labor wages are fixed at Rs 30 for working on the fields of all kith and kin.

CPHP Livelihood Analysis 27
2. Small Farmer
Chief Crops Production Expenses
(PE)
Income from Sale of Output
Net Income (NI)
Ratio PE:NI
3000
5000
2000
1.5:1
1500 2500 1000 1.5:1
Cereals Paddy Ragi Kasla, Kangu 1000 5000 4000 1:4
Vegetables Papaya 500 1500 1000 1:2
2300 5000 2700 1:1.85 0 1000 1000 --
Horticulture Pineapple Jackfruit Cashew Lemon
1000 200
5000 700
4000 500
1:4 1:1.4
0 0 1000 --
NTFPs Firewood Mahua Kendu Patta
0 0
0 0
500 500
-- --
The two tables will show an interesting trend. While, the net income from cereals is more
than the horticulture crops, yet the production expenses are higher. Thus the PE:NI ratio gets reversed for the horticulture crops. This fact should act as an incentive for the local farmers to adopt more extensive production of horticulture crops. They obtain higher gain from horticulture crops with minimal investments. Vegetables crops also require less investment and are thus more profitable. Annual Spending Pattern
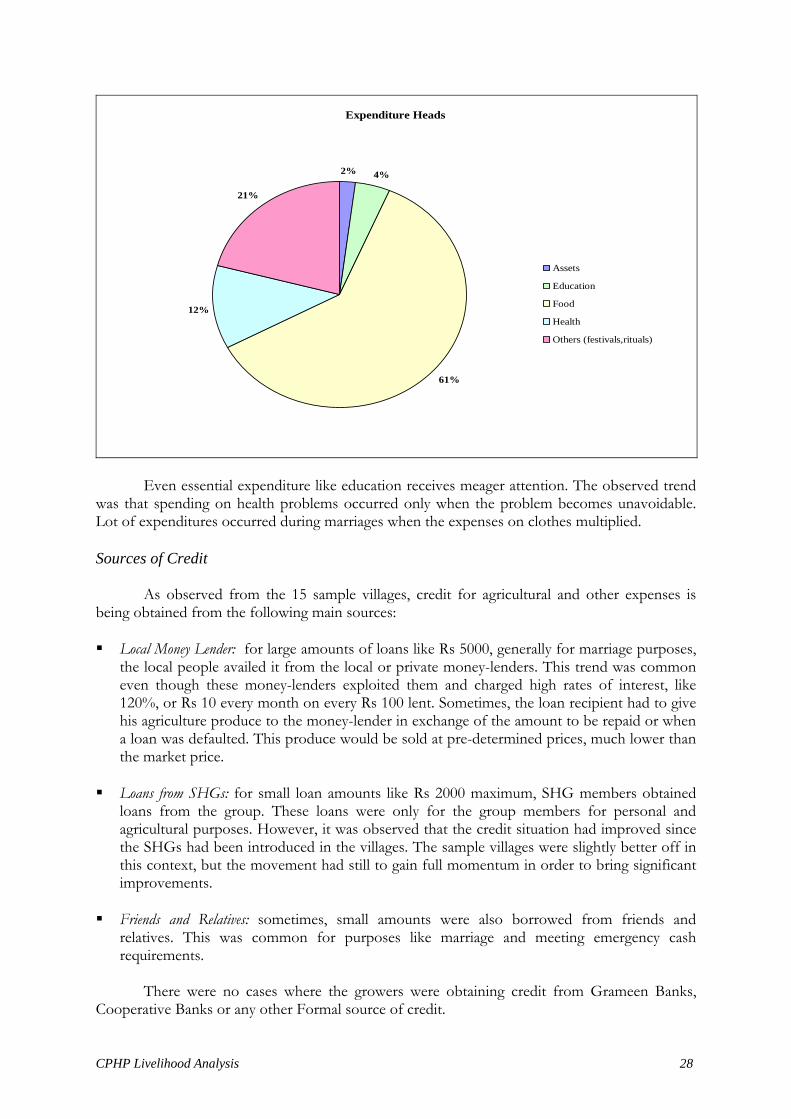
Unlike the common belief, the tribals do not spend much on assets, luxury items or agricultural items. Rather, they spend maximum on purchase of food. They have to buy food items like cereals and vegetables from the haats. Their own production is not even enough for their annual consumption. They grow paddy but it is only in small quantities and rarely have any marketable surplus. The following chart shows the main spending heads and the approximate percentage under each expenditure head.
CPHP Livelihood Analysis 28
Expenditure Heads
2% 4%
61%
12%
21%
Assets
Education
Food
Health
Others (festivals,rituals)
Even essential expenditure like education receives meager attention. The observed trend was that spending on health problems occurred only when the problem becomes unavoidable. Lot of expenditures occurred during marriages when the expenses on clothes multiplied. Sources of Credit
As observed from the 15 sample villages, credit for agricultural and other expenses is being obtained from the following main sources: Local Money Lender: for large amounts of loans like Rs 5000, generally for marriage purposes,
the local people availed it from the local or private money-lenders. This trend was common even though these money-lenders exploited them and charged high rates of interest, like 120%, or Rs 10 every month on every Rs 100 lent. Sometimes, the loan recipient had to give his agriculture produce to the money-lender in exchange of the amount to be repaid or when a loan was defaulted. This produce would be sold at pre-determined prices, much lower than the market price.
Loans from SHGs: for small loan amounts like Rs 2000 maximum, SHG members obtained
loans from the group. These loans were only for the group members for personal and agricultural purposes. However, it was observed that the credit situation had improved since the SHGs had been introduced in the villages. The sample villages were slightly better off in this context, but the movement had still to gain full momentum in order to bring significant improvements.
Friends and Relatives: sometimes, small amounts were also borrowed from friends and
relatives. This was common for purposes like marriage and meeting emergency cash requirements.
There were no cases where the growers were obtaining credit from Grameen Banks,
Cooperative Banks or any other Formal source of credit.
CPHP Livelihood Analysis 29
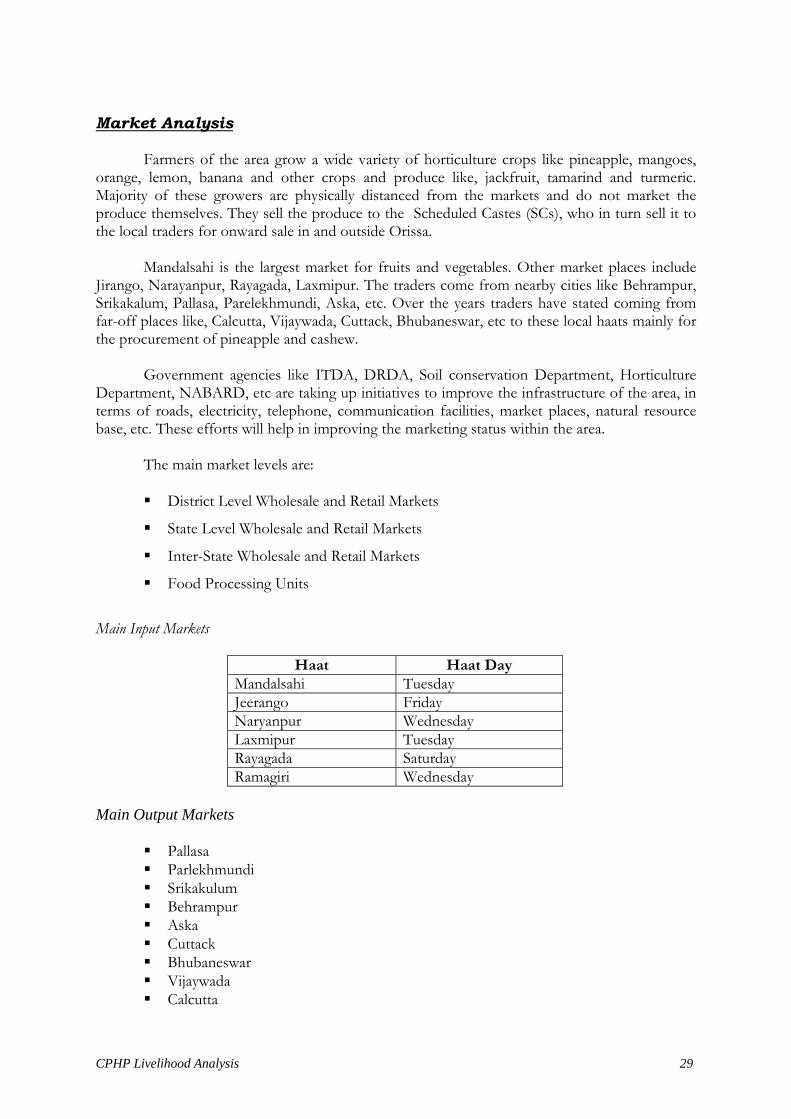
Market Analysis
Farmers of the area grow a wide variety of horticulture crops like pineapple, mangoes, orange, lemon, banana and other crops and produce like, jackfruit, tamarind and turmeric. Majority of these growers are physically distanced from the markets and do not market the produce themselves. They sell the produce to the Scheduled Castes (SCs), who in turn sell it to the local traders for onward sale in and outside Orissa.
Mandalsahi is the largest market for fruits and vegetables. Other market places include
Jirango, Narayanpur, Rayagada, Laxmipur. The traders come from nearby cities like Behrampur, Srikakalum, Pallasa, Parelekhmundi, Aska, etc. Over the years traders have stated coming from far-off places like, Calcutta, Vijaywada, Cuttack, Bhubaneswar, etc to these local haats mainly for the procurement of pineapple and cashew.
Government agencies like ITDA, DRDA, Soil conservation Department, Horticulture
Department, NABARD, etc are taking up initiatives to improve the infrastructure of the area, in terms of roads, electricity, telephone, communication facilities, market places, natural resource base, etc. These efforts will help in improving the marketing status within the area.
The main market levels are: District Level Wholesale and Retail Markets
State Level Wholesale and Retail Markets
Inter-State Wholesale and Retail Markets
Food Processing Units
Main Input Markets
Haat Haat Day Mandalsahi Tuesday Jeerango Friday Naryanpur Wednesday Laxmipur Tuesday Rayagada Saturday Ramagiri Wednesday
Main Output Markets
Pallasa Parlekhmundi Srikakulum Behrampur Aska Cuttack Bhubaneswar Vijaywada Calcutta

CPHP Livelihood Analysis 30
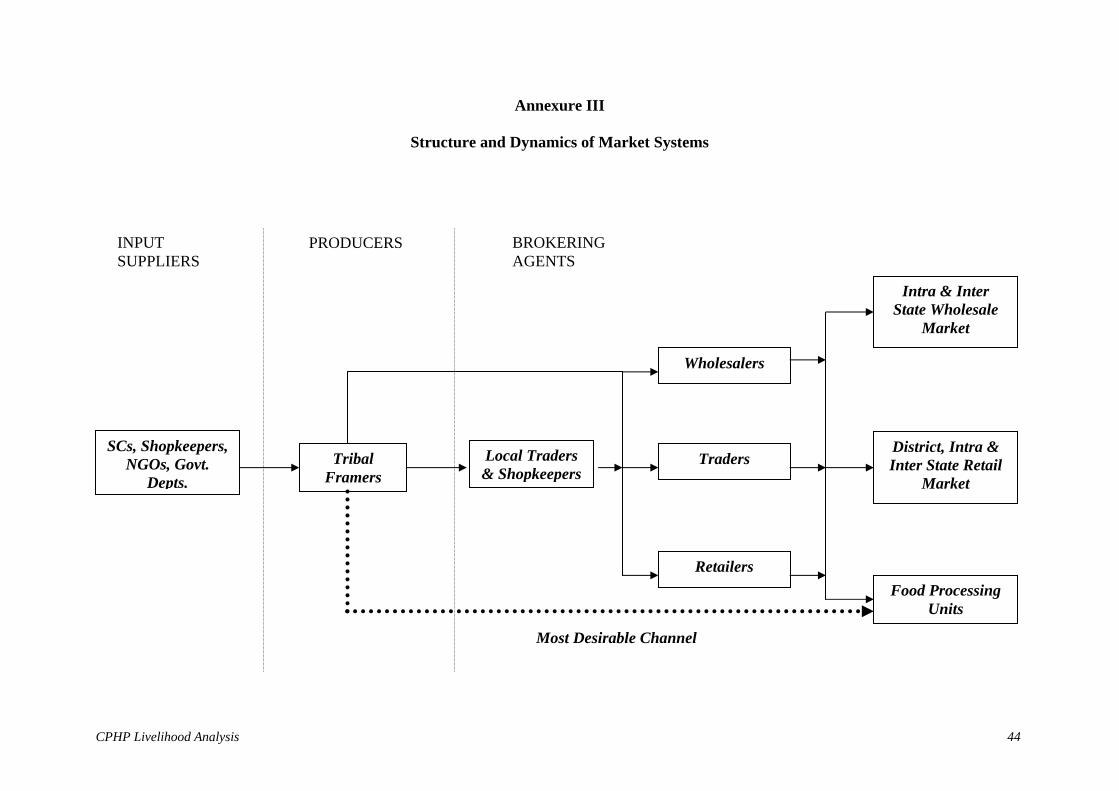
Actors of the Market
The marketing chain of horticulture crops is complex and involves a number of
intermediaries. This chain is illustrated in Annexre VII and the various Channel Members are discussed below:
Input Suppliers: the input suppliers include; State Horticulture Department, Integrated
Tribal Development Agency (ITDA), NGOs, private traders, shopkeepers, etc. These suppliers provide agri-inputs, seedlings and seeds, short-term loans, knowledge and skills for horticulture cultivation.
Growers: the small and marginal tribals of the area are the main horticulture growers.
Some are dependent only on horticulture crops and some households also grow paddy and other minor cereals.
Local Traders: they are the locals SCs and shopkeepers. They are the main link
between the farmers and the wholesale agents. They contact the farmers in advance, make the necessary payments and fix the date and place for produce delivery.
Outside Traders: some traders come from neighboring main cities and states for bulk
procurement of produce for onward trading.
Wholesalers: they are from important cities and towns of Orissa and other neighboring states. Wholesalers either come by themselves or send their agents who stay in the area and make the necessary arrangements for the collection and lifting of produce.
Food Processing Units: some times representatives from Food Processing Units of
Orissa and other neighboring states come directly to the Mandalsahi market for bulk procurement of fruits like Pineapple, Mango, Orange, Lemon, etc. OMFED (Orissa Milk Federation) and the State Horticulture Department make bulk procurement of pineapple and orange from the area. OMFED has recently entered the market of Fruit RTS (Ready To Serve), Squash, Jams, etc and takes the required Raw Material to its processing unit in Bhubaneswar. They procure directly from the growers or the traders. A committee consisting of local grower, representative of district administration, OMFED representative and the village headman decides the procurement price. OMFED procured 10 Metric Tonn (MT) and 17 MT during 2001-02 and 2002-03 respectively. The average procurement price was Rs 3.28 and 4.09 respectively.
Retailers: retailers from the district level market, important cities and towns of Orissa
and the neighboring States come for fruit procurement. They include fruit shop vendors or the seasonal retailers who have temporary stalls on roadside.
Supply Chain and Product Flow The traders and wholesalers coming from different places within Orissa and the
neighboring states send their representatives well in advance to make the necessary arrangements for crop procurement. They contact the local traders or the village headmen and fix the procurement price, date and delivery of produce. At times, they also make advance payments for
CPHP Livelihood Analysis 31
a specified quantity. On these specified dates, the farmers come with their produce at the pre-decided point. Sometimes the grower gets the entire produce in headloads and sometimes he has to employ additional labor for delivering his produce to the market place. The labor might be also involved for harvesting the produce. In case of pineapples, the growers sometimes have to employ labor for plucking of pineapples at the rate of Rs 0.25 per piece. Taking the pieces to the market costs an additional Rs 1 per piece.
The traders too sometimes come directly to the village for procurement. They stay from
a week to a fortnight until the procurement transaction is completed. The local traders too procure produce for supplying it to other wholesalers and retailers. Otherwise, they may take the produce directly to the urban market for retail sale. Some traders have permanent agents in the area. These agents procure the seasonal crops and continue supplying it to the bigger traders all year round.
The local traders sometimes extend credit to the growers for meeting the necessary
production expenses. The amount is adjusted during the purchase of the produce. In case of Pineapples, the rate is fixed piece-wise. If the size of the pineapple is small
then two to three pieces are counted as equivalent to one. Traders also adopt a system called ‘Salga ’, where the farmer has to give the buyer 5 free pieces for every 100 pieces purchased. These pieces could be either to make-up for the damaged pineapple pieces or the compulsory trade incentive.
Food Processing Units also visit the area for bulk procurement of horticulture crops.
These are then transported to their processing units. The processed food products have a ready and profitable market, but the margins do not reach the growers.
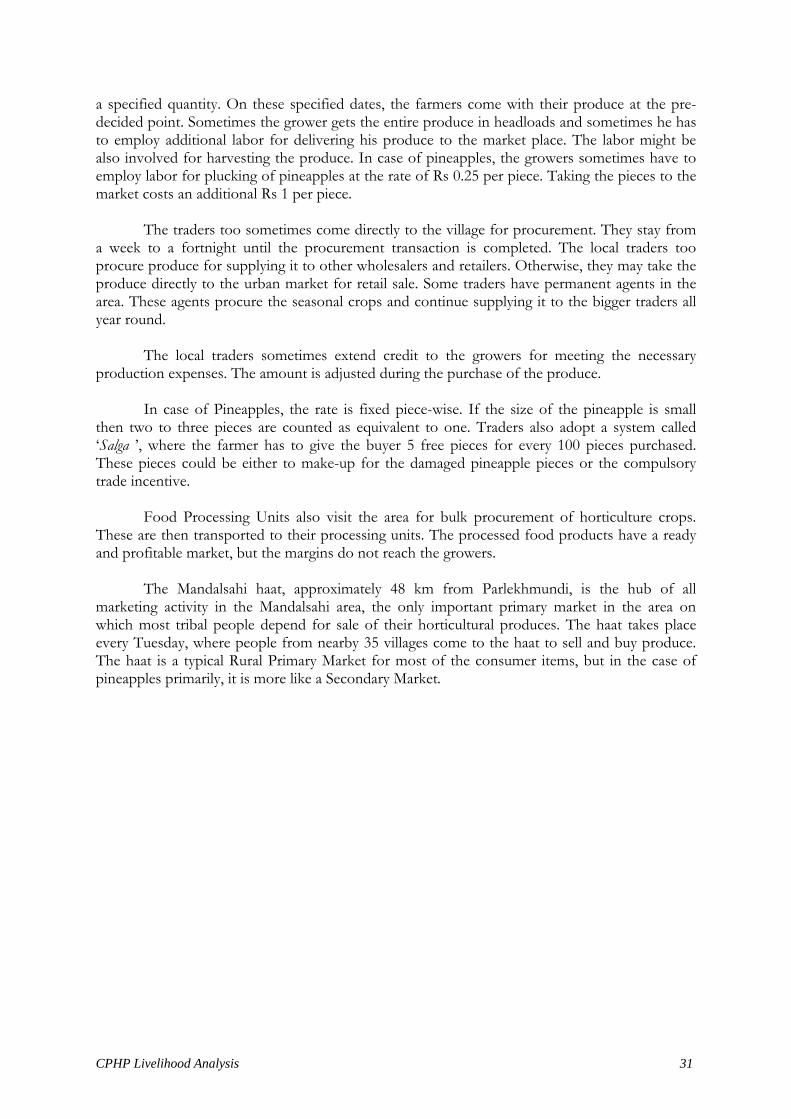
The Mandalsahi haat, approximately 48 km from Parlekhmundi, is the hub of all
marketing activity in the Mandalsahi area, the only important primary market in the area on which most tribal people depend for sale of their horticultural produces. The haat takes place every Tuesday, where people from nearby 35 villages come to the haat to sell and buy produce. The haat is a typical Rural Primary Market for most of the consumer items, but in the case of pineapples primarily, it is more like a Secondary Market.
CPHP Livelihood Analysis 32
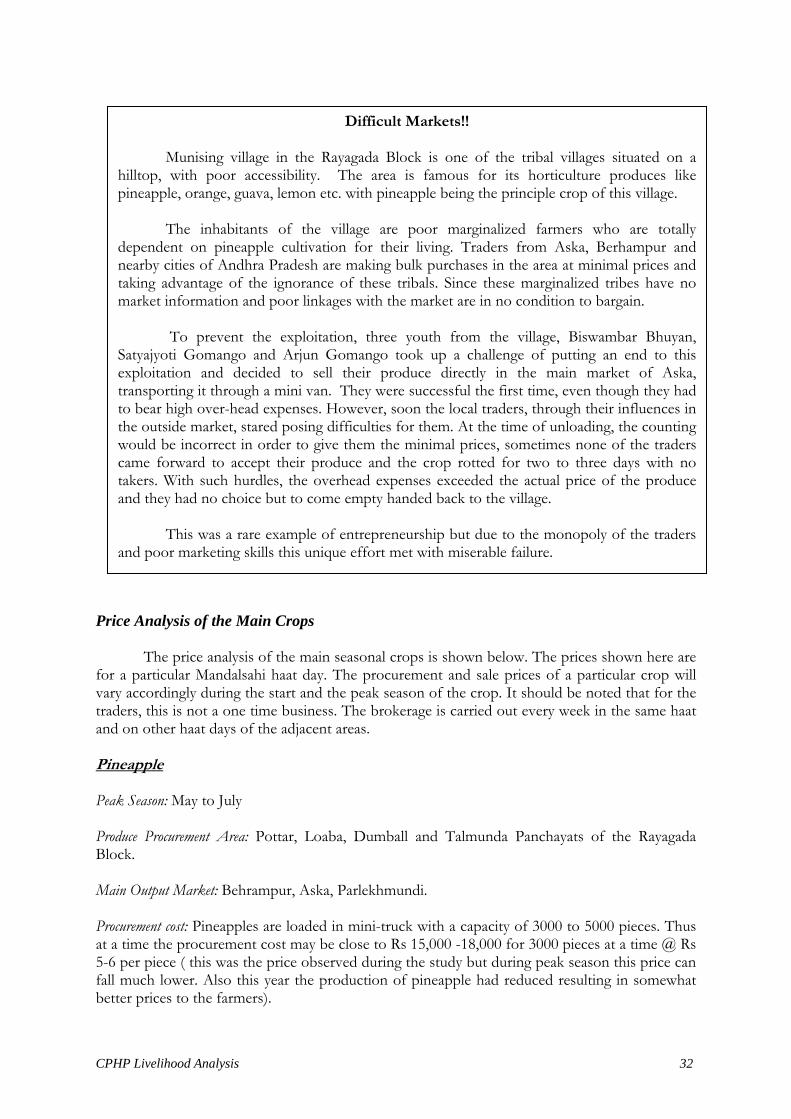
Price Analysis of the Main Crops The price analysis of the main seasonal crops is shown below. The prices shown here are for a particular Mandalsahi haat day. The procurement and sale prices of a particular crop will vary accordingly during the start and the peak season of the crop. It should be noted that for the traders, this is not a one time business. The brokerage is carried out every week in the same haat and on other haat days of the adjacent areas. Pineapple Peak Season: May to July Produce Procurement Area: Pottar, Loaba, Dumball and Talmunda Panchayats of the Rayagada Block. Main Output Market: Behrampur, Aska, Parlekhmundi. Procurement cost: Pineapples are loaded in mini-truck with a capacity of 3000 to 5000 pieces. Thus at a time the procurement cost may be close to Rs 15,000 -18,000 for 3000 pieces at a time @ Rs 5-6 per piece ( this was the price observed during the study but during peak season this price can fall much lower. Also this year the production of pineapple had reduced resulting in somewhat better prices to the farmers).
Difficult Markets!!
Munising village in the Rayagada Block is one of the tribal villages situated on a hilltop, with poor accessibility. The area is famous for its horticulture produces like pineapple, orange, guava, lemon etc. with pineapple being the principle crop of this village.
The inhabitants of the village are poor marginalized farmers who are totally dependent on pineapple cultivation for their living. Traders from Aska, Berhampur and nearby cities of Andhra Pradesh are making bulk purchases in the area at minimal prices and taking advantage of the ignorance of these tribals. Since these marginalized tribes have no market information and poor linkages with the market are in no condition to bargain.
To prevent the exploitation, three youth from the village, Biswambar Bhuyan, Satyajyoti Gomango and Arjun Gomango took up a challenge of putting an end to this exploitation and decided to sell their produce directly in the main market of Aska, transporting it through a mini van. They were successful the first time, even though they had to bear high over-head expenses. However, soon the local traders, through their influences in the outside market, stared posing difficulties for them. At the time of unloading, the countingwould be incorrect in order to give them the minimal prices, sometimes none of the traders came forward to accept their produce and the crop rotted for two to three days with no takers. With such hurdles, the overhead expenses exceeded the actual price of the produce and they had no choice but to come empty handed back to the village.
This was a rare example of entrepreneurship but due to the monopoly of the traders and poor marketing skills this unique effort met with miserable failure.
CPHP Livelihood Analysis 33
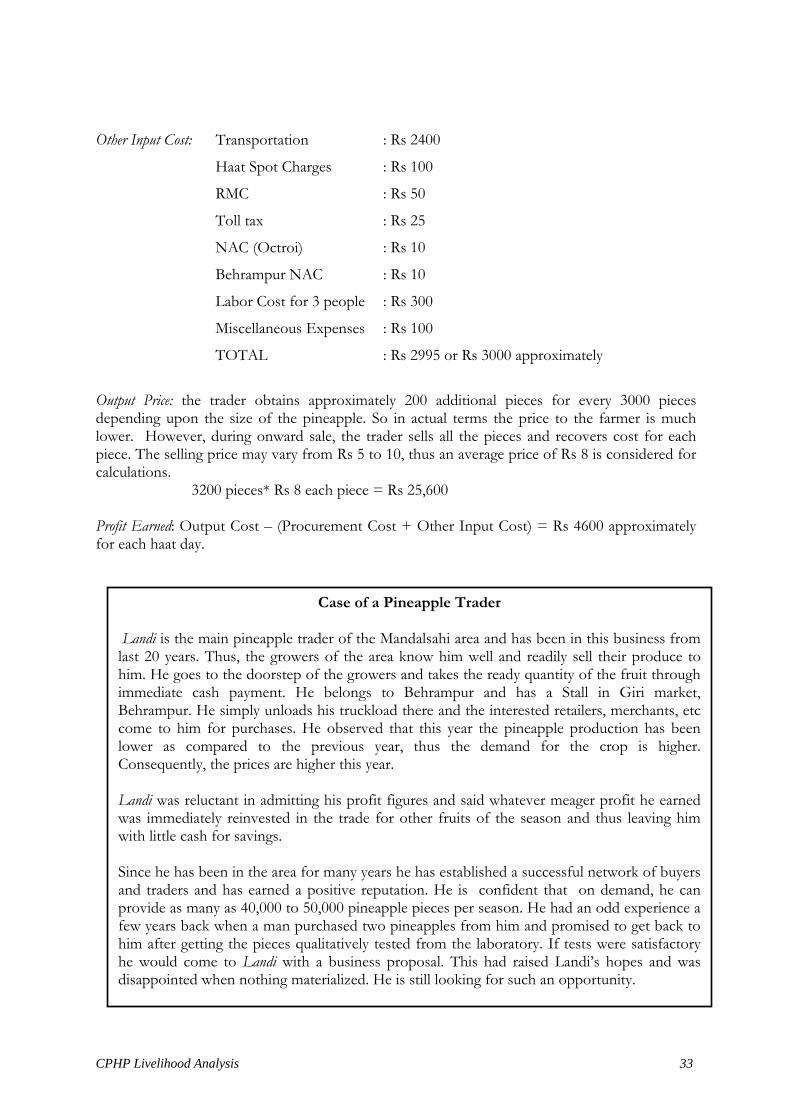
Other Input Cost: Transportation : Rs 2400
Haat Spot Charges : Rs 100
RMC : Rs 50
Toll tax : Rs 25
NAC (Octroi) : Rs 10
Behrampur NAC : Rs 10
Labor Cost for 3 people : Rs 300
Miscellaneous Expenses : Rs 100
TOTAL : Rs 2995 or Rs 3000 approximately
Output Price: the trader obtains approximately 200 additional pieces for every 3000 pieces depending upon the size of the pineapple. So in actual terms the price to the farmer is much lower. However, during onward sale, the trader sells all the pieces and recovers cost for each piece. The selling price may vary from Rs 5 to 10, thus an average price of Rs 8 is considered for calculations.
3200 pieces* Rs 8 each piece = Rs 25,600 Profit Earned: Output Cost – (Procurement Cost + Other Input Cost) = Rs 4600 approximately for each haat day.
Case of a Pineapple Trader
Landi is the main pineapple trader of the Mandalsahi area and has been in this business from last 20 years. Thus, the growers of the area know him well and readily sell their produce to him. He goes to the doorstep of the growers and takes the ready quantity of the fruit through immediate cash payment. He belongs to Behrampur and has a Stall in Giri market, Behrampur. He simply unloads his truckload there and the interested retailers, merchants, etc come to him for purchases. He observed that this year the pineapple production has been lower as compared to the previous year, thus the demand for the crop is higher. Consequently, the prices are higher this year. Landi was reluctant in admitting his profit figures and said whatever meager profit he earned was immediately reinvested in the trade for other fruits of the season and thus leaving him with little cash for savings. Since he has been in the area for many years he has established a successful network of buyers and traders and has earned a positive reputation. He is confident that on demand, he can provide as many as 40,000 to 50,000 pineapple pieces per season. He had an odd experience a few years back when a man purchased two pineapples from him and promised to get back to him after getting the pieces qualitatively tested from the laboratory. If tests were satisfactory he would come to Landi with a business proposal. This had raised Landi’s hopes and was disappointed when nothing materialized. He is still looking for such an opportunity.
CPHP Livelihood Analysis 34
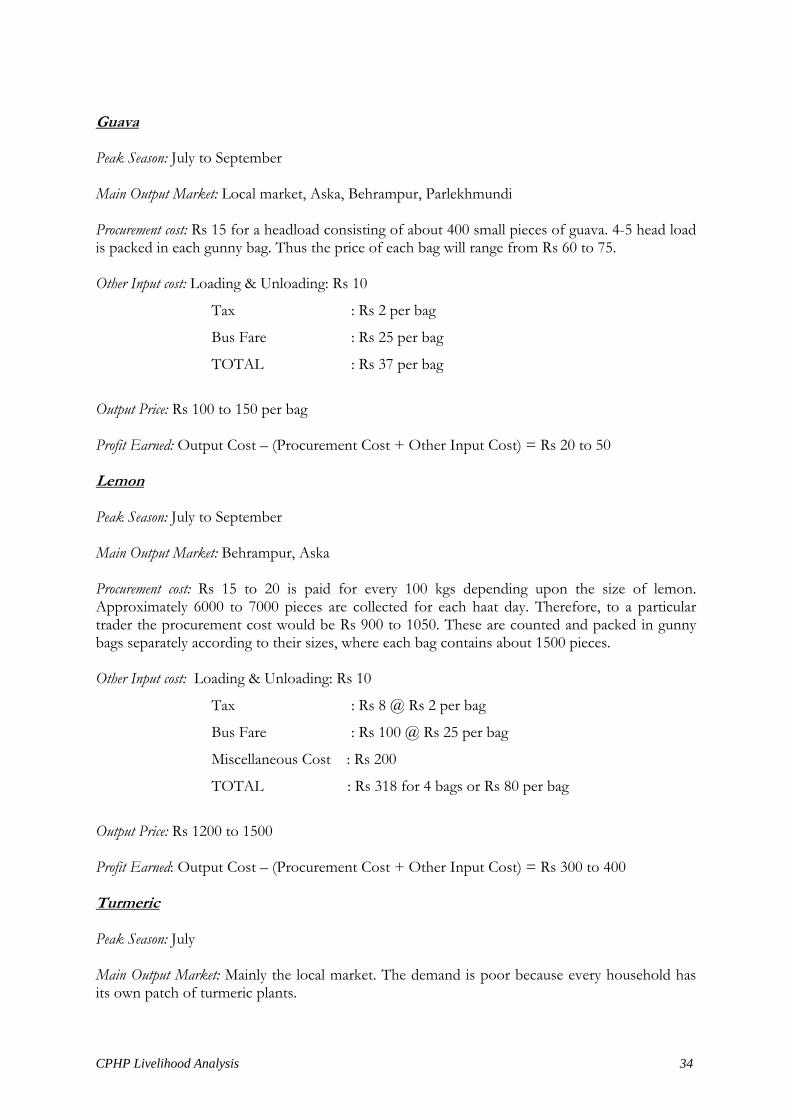
Guava Peak Season: July to September Main Output Market: Local market, Aska, Behrampur, Parlekhmundi Procurement cost: Rs 15 for a headload consisting of about 400 small pieces of guava. 4-5 head load is packed in each gunny bag. Thus the price of each bag will range from Rs 60 to 75. Other Input cost: Loading & Unloading: Rs 10
Tax : Rs 2 per bag
Bus Fare : Rs 25 per bag
TOTAL : Rs 37 per bag
Output Price: Rs 100 to 150 per bag Profit Earned: Output Cost – (Procurement Cost + Other Input Cost) = Rs 20 to 50 Lemon Peak Season: July to September Main Output Market: Behrampur, Aska Procurement cost: Rs 15 to 20 is paid for every 100 kgs depending upon the size of lemon. Approximately 6000 to 7000 pieces are collected for each haat day. Therefore, to a particular trader the procurement cost would be Rs 900 to 1050. These are counted and packed in gunny bags separately according to their sizes, where each bag contains about 1500 pieces. Other Input cost: Loading & Unloading: Rs 10
Tax : Rs 8 @ Rs 2 per bag
Bus Fare : Rs 100 @ Rs 25 per bag
Miscellaneous Cost : Rs 200
TOTAL : Rs 318 for 4 bags or Rs 80 per bag
Output Price: Rs 1200 to 1500 Profit Earned: Output Cost – (Procurement Cost + Other Input Cost) = Rs 300 to 400 Turmeric Peak Season: July Main Output Market: Mainly the local market. The demand is poor because every household has its own patch of turmeric plants.
CPHP Livelihood Analysis 35
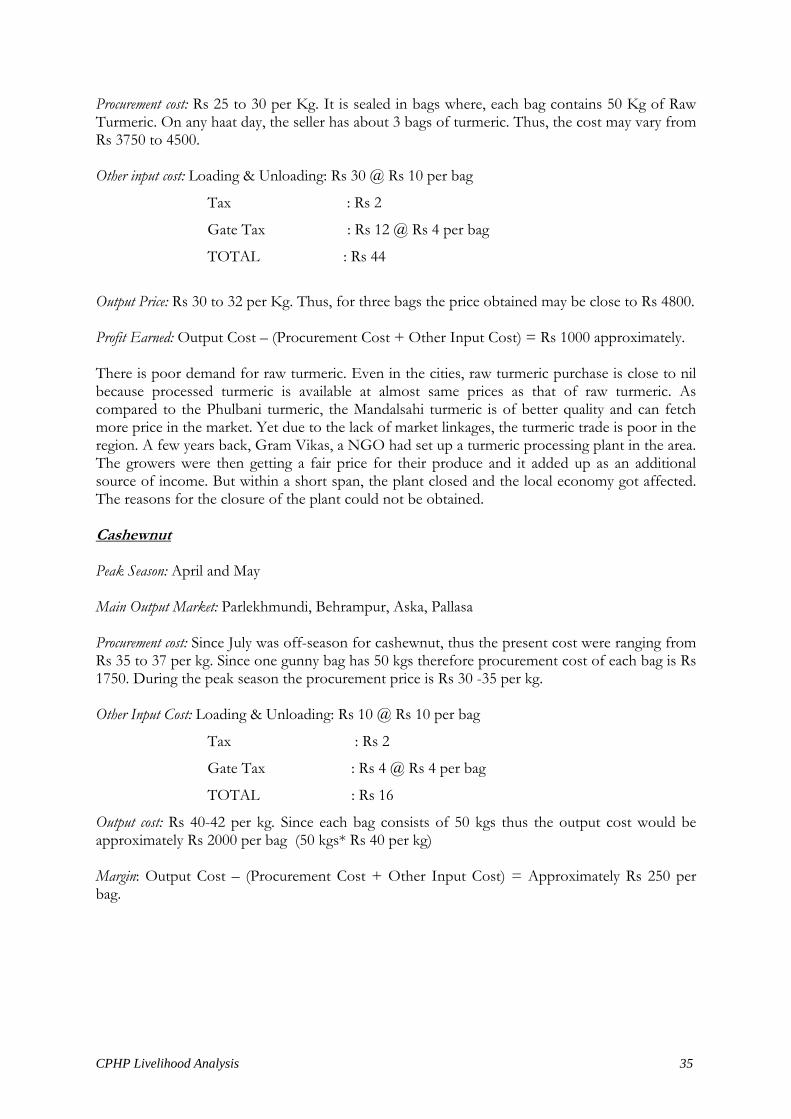
Procurement cost: Rs 25 to 30 per Kg. It is sealed in bags where, each bag contains 50 Kg of Raw Turmeric. On any haat day, the seller has about 3 bags of turmeric. Thus, the cost may vary from Rs 3750 to 4500. Other input cost: Loading & Unloading: Rs 30 @ Rs 10 per bag
Tax : Rs 2
Gate Tax : Rs 12 @ Rs 4 per bag
TOTAL : Rs 44
Output Price: Rs 30 to 32 per Kg. Thus, for three bags the price obtained may be close to Rs 4800. Profit Earned: Output Cost – (Procurement Cost + Other Input Cost) = Rs 1000 approximately. There is poor demand for raw turmeric. Even in the cities, raw turmeric purchase is close to nil because processed turmeric is available at almost same prices as that of raw turmeric. As compared to the Phulbani turmeric, the Mandalsahi turmeric is of better quality and can fetch more price in the market. Yet due to the lack of market linkages, the turmeric trade is poor in the region. A few years back, Gram Vikas, a NGO had set up a turmeric processing plant in the area. The growers were then getting a fair price for their produce and it added up as an additional source of income. But within a short span, the plant closed and the local economy got affected. The reasons for the closure of the plant could not be obtained. Cashewnut Peak Season: April and May Main Output Market: Parlekhmundi, Behrampur, Aska, Pallasa Procurement cost: Since July was off-season for cashewnut, thus the present cost were ranging from Rs 35 to 37 per kg. Since one gunny bag has 50 kgs therefore procurement cost of each bag is Rs 1750. During the peak season the procurement price is Rs 30 -35 per kg. Other Input Cost: Loading & Unloading: Rs 10 @ Rs 10 per bag
Tax : Rs 2
Gate Tax : Rs 4 @ Rs 4 per bag
TOTAL : Rs 16
Output cost: Rs 40-42 per kg. Since each bag consists of 50 kgs thus the output cost would be approximately Rs 2000 per bag (50 kgs* Rs 40 per kg) Margin: Output Cost – (Procurement Cost + Other Input Cost) = Approximately Rs 250 per bag.
CPHP Livelihood Analysis 36
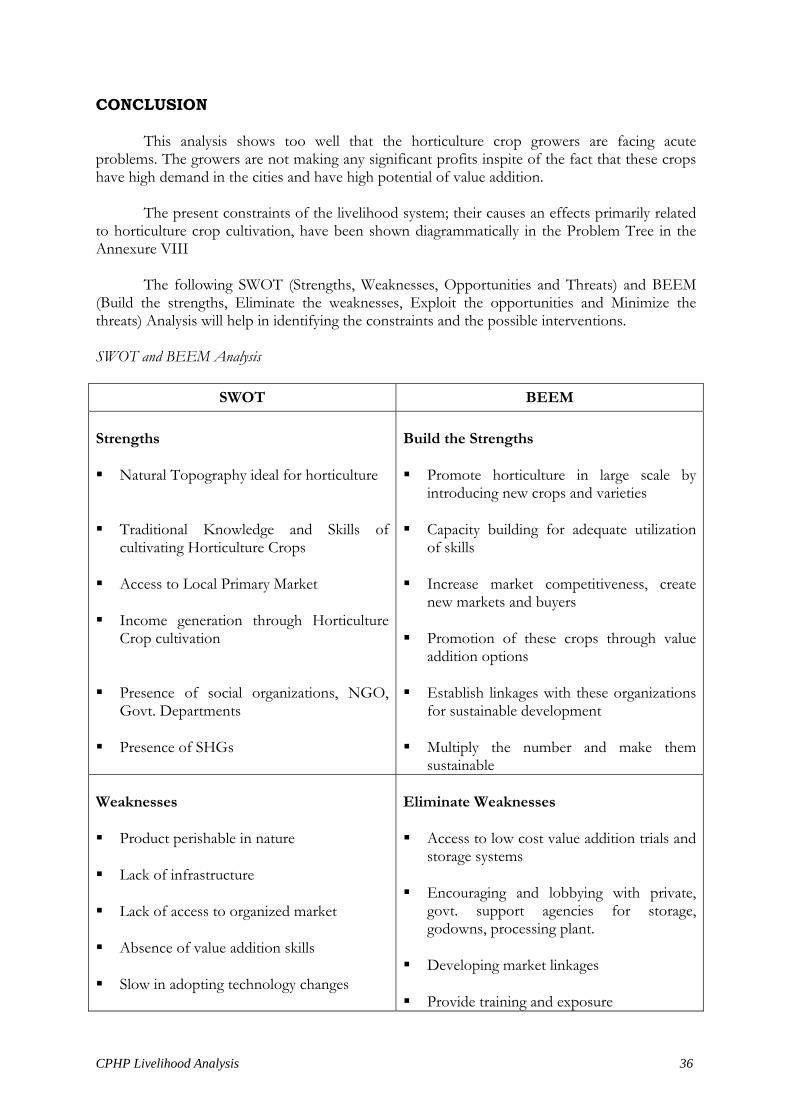
CONCLUSION
This analysis shows too well that the horticulture crop growers are facing acute problems. The growers are not making any significant profits inspite of the fact that these crops have high demand in the cities and have high potential of value addition.
The present constraints of the livelihood system; their causes an effects primarily related
to horticulture crop cultivation, have been shown diagrammatically in the Problem Tree in the Annexure VIII
The following SWOT (Strengths, Weaknesses, Opportunities and Threats) and BEEM
(Build the strengths, Eliminate the weaknesses, Exploit the opportunities and Minimize the threats) Analysis will help in identifying the constraints and the possible interventions.
SWOT and BEEM Analysis
SWOT BEEM
Strengths Natural Topography ideal for horticulture
Traditional Knowledge and Skills of
cultivating Horticulture Crops Access to Local Primary Market
Income generation through Horticulture
Crop cultivation Presence of social organizations, NGO,
Govt. Departments Presence of SHGs
Build the Strengths Promote horticulture in large scale by
introducing new crops and varieties Capacity building for adequate utilization
of skills Increase market competitiveness, create
new markets and buyers Promotion of these crops through value
addition options Establish linkages with these organizations
for sustainable development Multiply the number and make them
sustainable Weaknesses Product perishable in nature
Lack of infrastructure
Lack of access to organized market
Absence of value addition skills
Slow in adopting technology changes
Eliminate Weaknesses Access to low cost value addition trials and
storage systems Encouraging and lobbying with private,
govt. support agencies for storage, godowns, processing plant.
Developing market linkages
Provide training and exposure
CPHP Livelihood Analysis 37
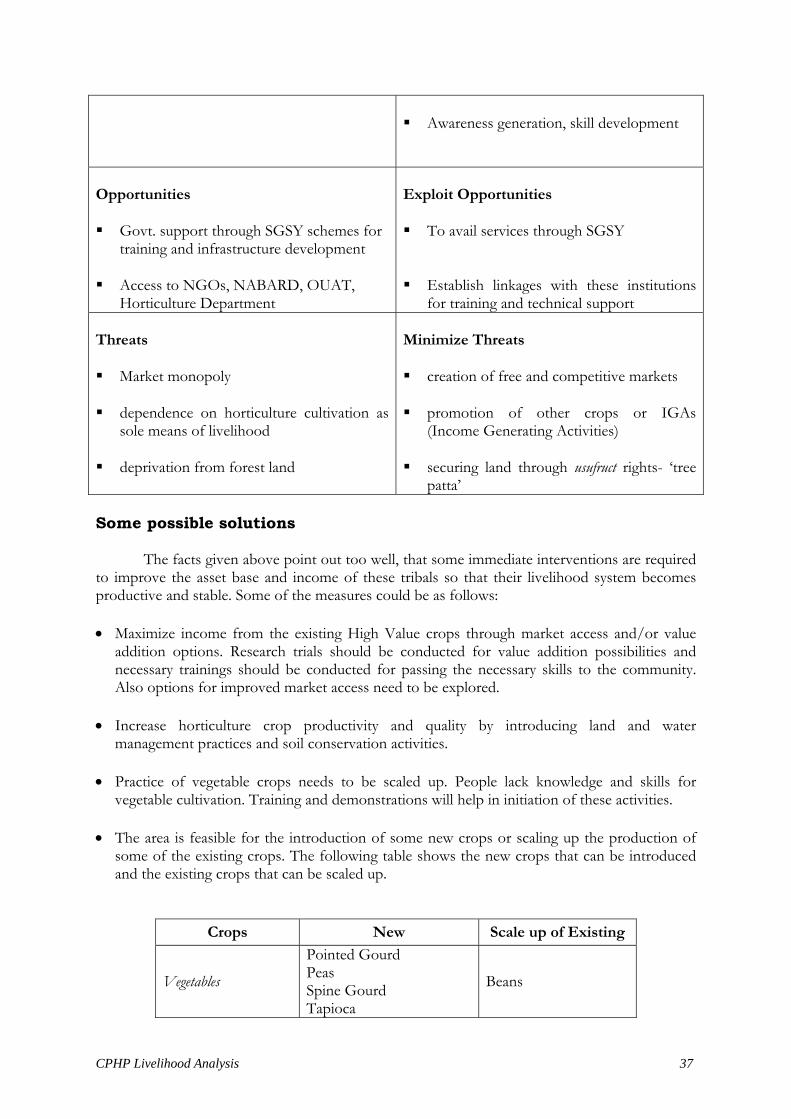
Awareness generation, skill development
Opportunities Govt. support through SGSY schemes for
training and infrastructure development Access to NGOs, NABARD, OUAT,
Horticulture Department
Exploit Opportunities To avail services through SGSY
Establish linkages with these institutions
for training and technical support Threats Market monopoly
dependence on horticulture cultivation as
sole means of livelihood deprivation from forest land
Minimize Threats creation of free and competitive markets
promotion of other crops or IGAs
(Income Generating Activities) securing land through usufruct rights- ‘tree
patta’ Some possible solutions The facts given above point out too well, that some immediate interventions are required to improve the asset base and income of these tribals so that their livelihood system becomes productive and stable. Some of the measures could be as follows: • Maximize income from the existing High Value crops through market access and/or value
addition options. Research trials should be conducted for value addition possibilities and necessary trainings should be conducted for passing the necessary skills to the community. Also options for improved market access need to be explored.
• Increase horticulture crop productivity and quality by introducing land and water
management practices and soil conservation activities. • Practice of vegetable crops needs to be scaled up. People lack knowledge and skills for
vegetable cultivation. Training and demonstrations will help in initiation of these activities. • The area is feasible for the introduction of some new crops or scaling up the production of
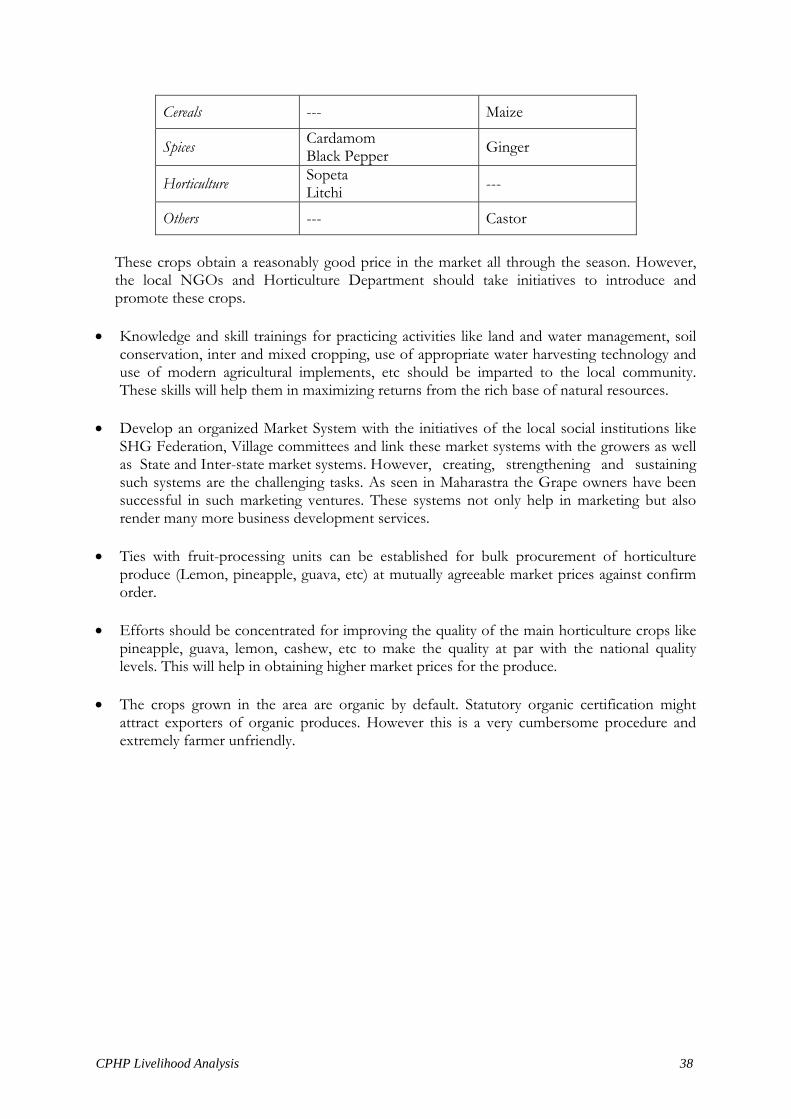
some of the existing crops. The following table shows the new crops that can be introduced and the existing crops that can be scaled up.
Crops New Scale up of Existing
Vegetables
Pointed Gourd Peas Spine Gourd Tapioca
Beans
CPHP Livelihood Analysis 38
Cereals --- Maize
Spices Cardamom Black Pepper Ginger
Horticulture Sopeta Litchi ---
Others --- Castor These crops obtain a reasonably good price in the market all through the season. However, the local NGOs and Horticulture Department should take initiatives to introduce and promote these crops.
• Knowledge and skill trainings for practicing activities like land and water management, soil conservation, inter and mixed cropping, use of appropriate water harvesting technology and use of modern agricultural implements, etc should be imparted to the local community. These skills will help them in maximizing returns from the rich base of natural resources.
• Develop an organized Market System with the initiatives of the local social institutions like
SHG Federation, Village committees and link these market systems with the growers as well as State and Inter-state market systems. H owever, creating, strengthening and sustaining such systems are the challenging tasks. As seen in Maharastra the Grape owners have been successful in such marketing ventures. These systems not only help in marketing but also render many more business development services.
• Ties with fruit-processing units can be established for bulk procurement of horticulture
produce (Lemon, pineapple, guava, etc) at mutually agreeable market prices against confirm order.
• Efforts should be concentrated for improving the quality of the main horticulture crops like
pineapple, guava, lemon, cashew, etc to make the quality at par with the national quality levels. This will help in obtaining higher market prices for the produce.
• The crops grown in the area are organic by default. Statutory organic certification might
attract exporters of organic produces. However this is a very cumbersome procedure and extremely farmer unfriendly.
CPHP Livelihood Analysis 39
Concluding remarks As can be seen from the suggestions above that there are a variety of interventions to choose from for improving livelihoods of the tribal farmers from existing crops. However, given the objectives and purpose of the project, the time frame and the project design as well as the fact that the tribals depend of a few key horticulture crops for their livelihood, this project will focus on the option of improved market access and value addition to their existing horticulture crops. REFERENCES CPHP Project Memorandum Form
CPHP Project Inception Report
DFID Framework of Sustainable Livelihoods
DFID Guidelines for the Sustainable Livelihood Framework
Marketing, Storage and Extension Services: State of Agriculture in India- Gokul Patnaik
Orissa State Development Directory
CPHP Livelihood Analysis 40
Annexure I
Investigative Team of Livelihood Analysis
Centre for Community Development (CCD) Team Mr A J Raju, Director
Mr Dhananjay Pattanaik, Cluster Promoter
Mr Jagannah Rao, Cluster Promoter
Ms Sukanti Maharana, Cluster Promoter
International Development Enterprises, India (IDEI) Team:
Mr S S Barik, Area Manager
Ms Priyanka Dikshit, Area Manager

CPHP Livelihood Analysis 42
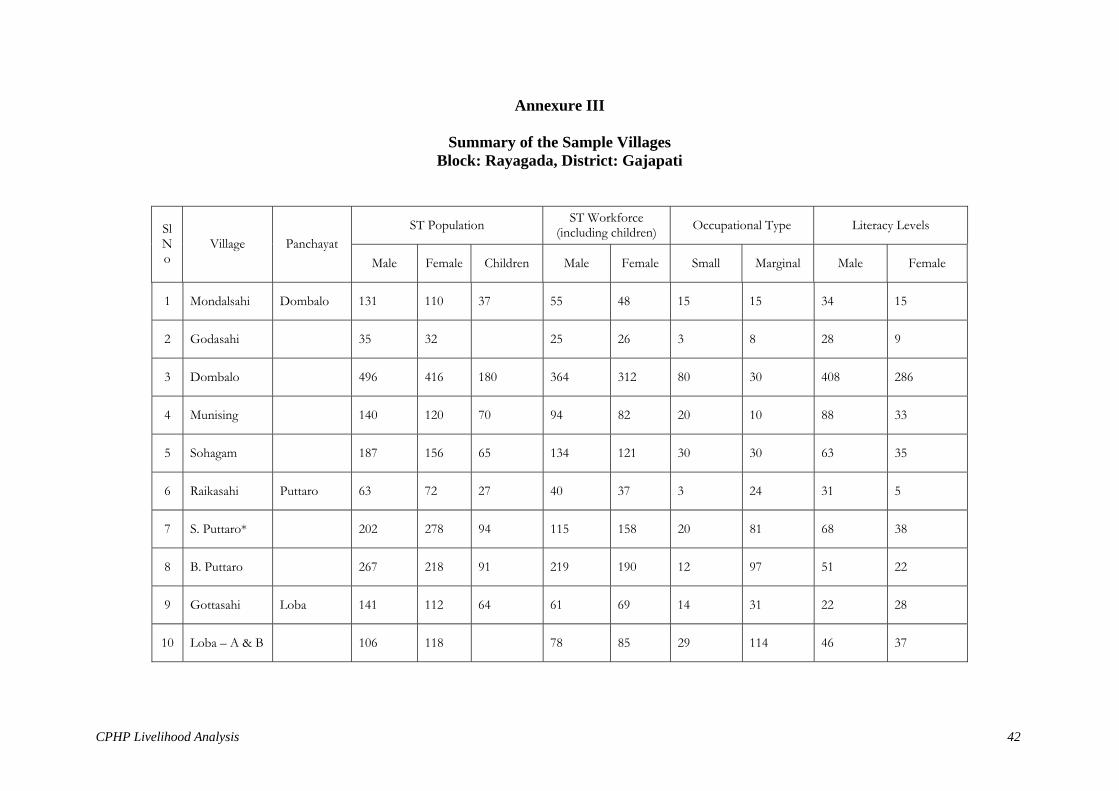
Annexure III
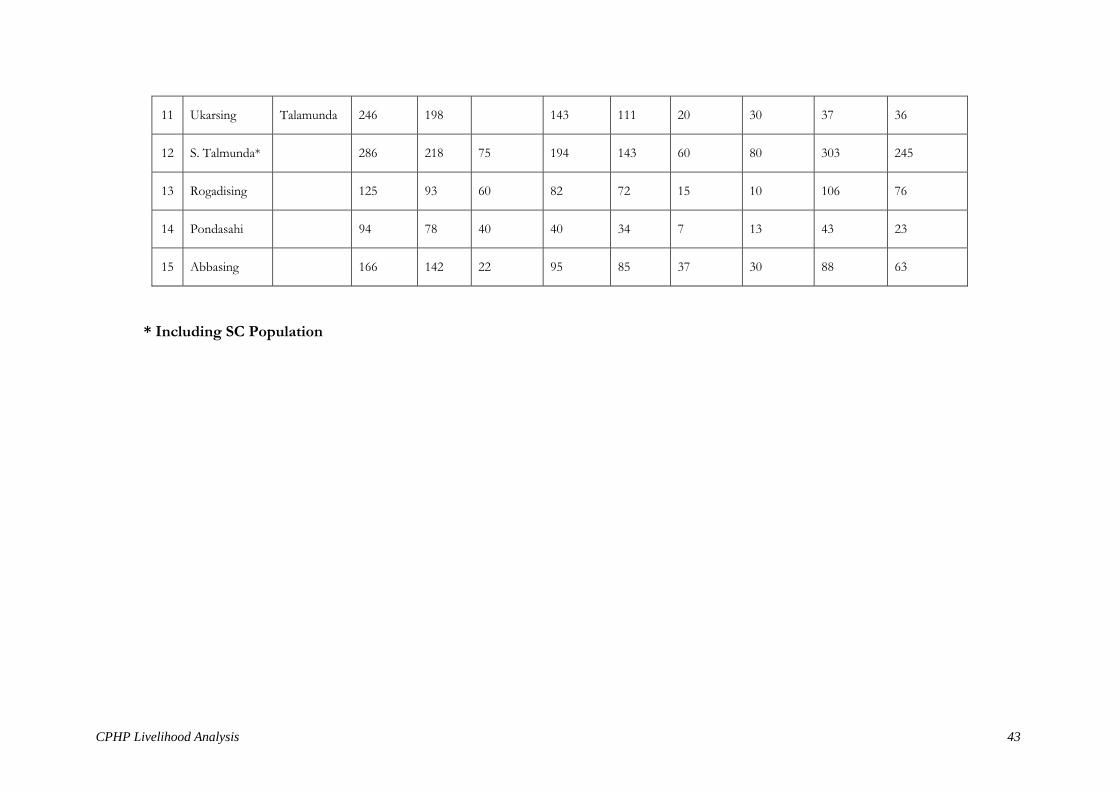
Summary of the Sample Villages Block: Rayagada, District: Gajapati
ST Population ST Workforce (including children) Occupational Type Literacy Levels Sl
No
Village Panchayat Male Female Children Male Female Small Marginal Male Female
1 Mondalsahi Dombalo 131 110 37 55 48 15 15 34 15
2 Godasahi 35 32 25 26 3 8 28 9
3 Dombalo 496 416 180 364 312 80 30 408 286
4 Munising 140 120 70 94 82 20 10 88 33
5 Sohagam 187 156 65 134 121 30 30 63 35
6 Raikasahi Puttaro 63 72 27 40 37 3 24 31 5
7 S. Puttaro* 202 278 94 115 158 20 81 68 38
8 B. Puttaro 267 218 91 219 190 12 97 51 22
9 Gottasahi Loba 141 112 64 61 69 14 31 22 28
10 Loba – A & B 106 118 78 85 29 114 46 37
CPHP Livelihood Analysis 43
11 Ukarsing Talamunda 246 198 143 111 20 30 37 36
12 S. Talmunda* 286 218 75 194 143 60 80 303 245
13 Rogadising 125 93 60 82 72 15 10 106 76
14 Pondasahi 94 78 40 40 34 7 13 43 23
15 Abbasing 166 142 22 95 85 37 30 88 63
* Including SC Population
CPHP Livelihood Analysis 44
Annexure III
Structure and Dynamics of Market Systems
SCs, Shopkeepers, NGOs, Govt.
Depts.
Food Processing Units
Retailers
Tribal Framers
Local Traders & Shopkeepers
Traders District, Intra & Inter State Retail
Market
Intra & Inter State Wholesale
Market
Wholesalers
Most Desirable Channel
INPUT SUPPLIERS
PRODUCERS BROKERING AGENTS
CPHP Livelihood Analysis 45
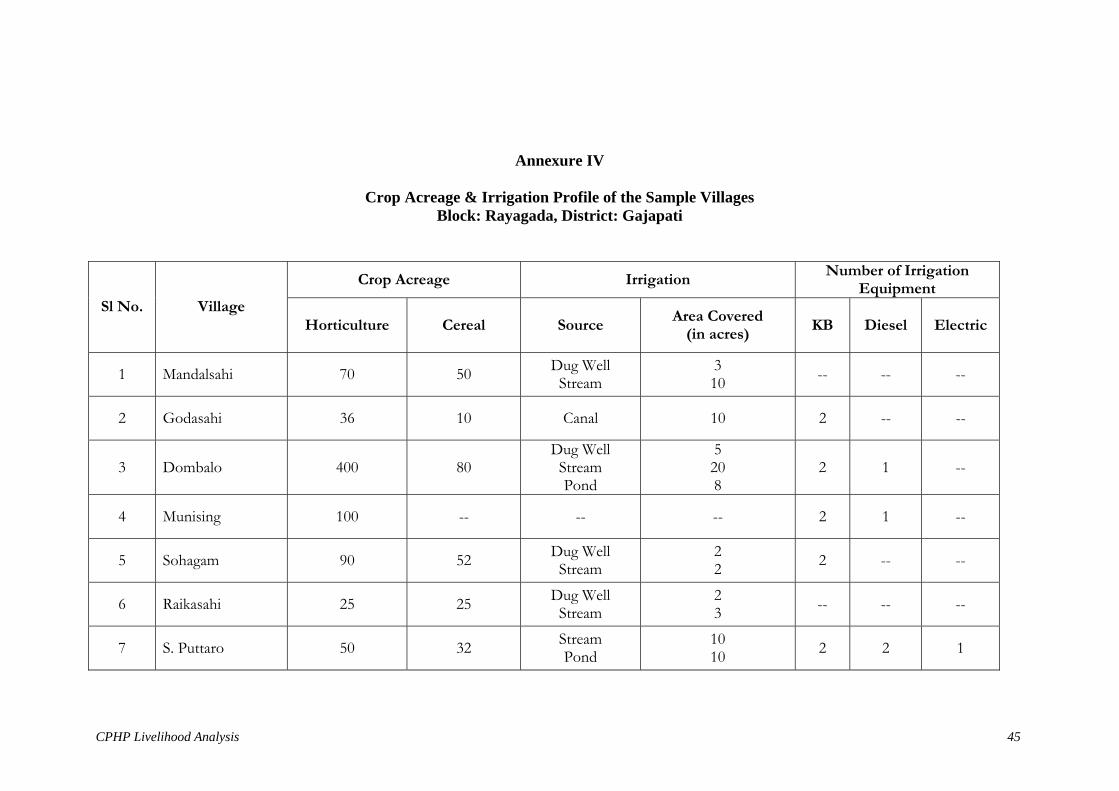
Annexure IV
Crop Acreage & Irrigation Profile of the Sample Villages Block: Rayagada, District: Gajapati
Crop Acreage Irrigation Number of Irrigation Equipment
Sl No. Village Horticulture Cereal Source Area Covered
(in acres)
KB
Diesel Electric
1 Mandalsahi 70 50 Dug Well Stream
3 10 -- -- --
2 Godasahi 36 10 Canal 10 2 -- --
3 Dombalo 400 80 Dug Well
Stream Pond
5 20 8
2 1 --
4 Munising 100 -- -- -- 2 1 --
5 Sohagam 90 52 Dug Well Stream
2 2 2 -- --
6 Raikasahi 25 25 Dug Well Stream
2 3 -- -- --
7 S. Puttaro 50 32 Stream Pond
10 10 2 2 1
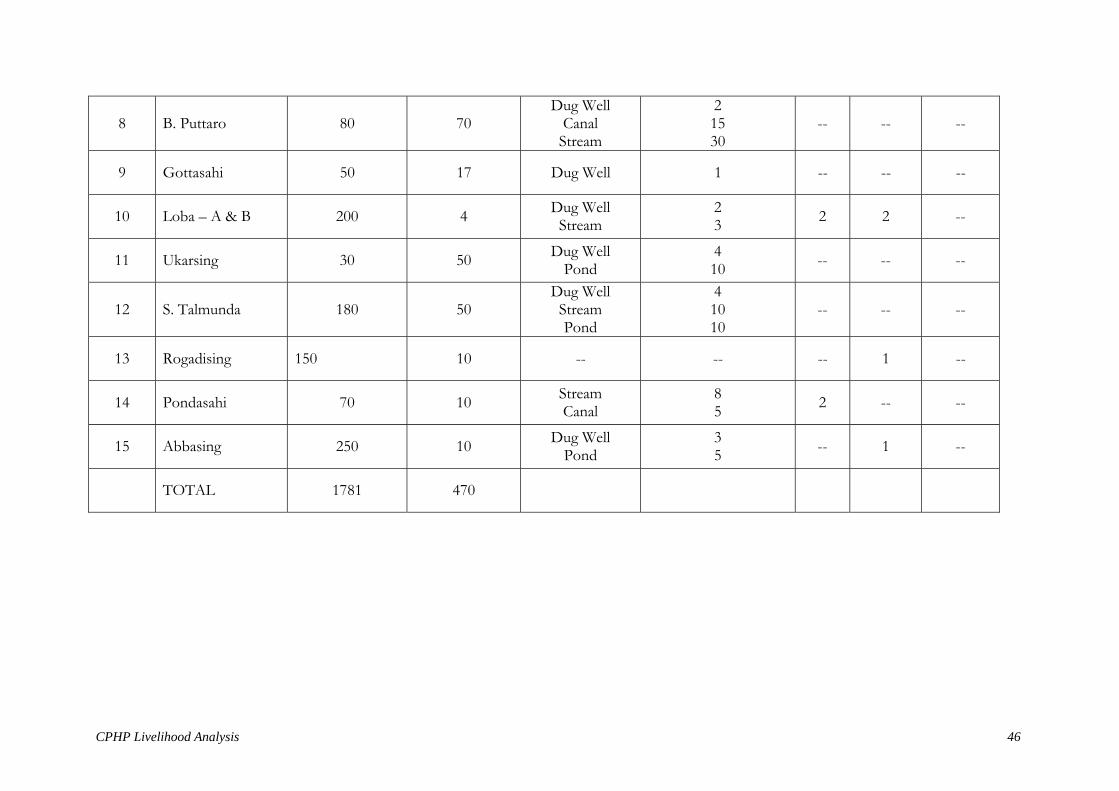
CPHP Livelihood Analysis 46
8 B. Puttaro 80 70 Dug Well
Canal Stream
2 15 30
-- -- --
9 Gottasahi 50 17 Dug Well 1 -- -- --
10 Loba – A & B 200 4 Dug Well Stream
2 3 2 2 --
11 Ukarsing 30 50 Dug Well Pond
4 10 -- -- --
12 S. Talmunda 180 50 Dug Well
Stream Pond
4 10 10
-- -- --
13 Rogadising 150 10 -- -- -- 1 --
14 Pondasahi 70 10 Stream Canal
8 5 2 -- --
15 Abbasing 250 10 Dug Well Pond
3 5 -- 1 --
TOTAL 1781 470
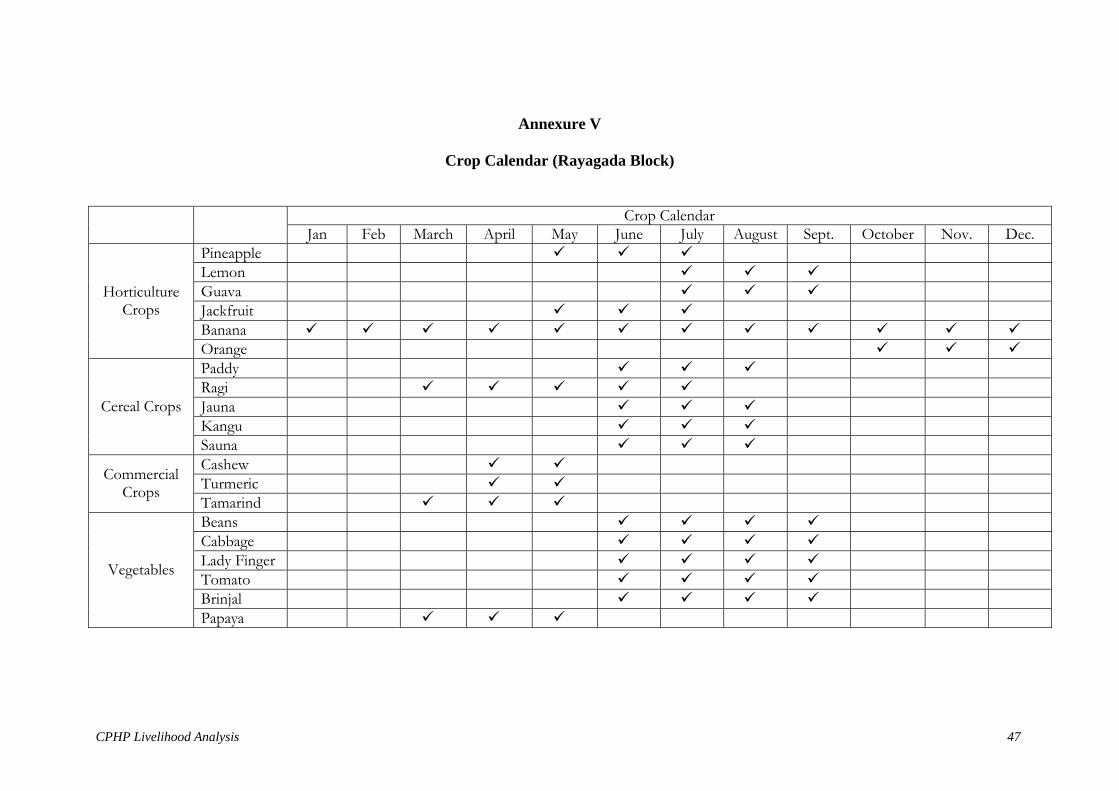
CPHP Livelihood Analysis 47
Annexure V
Crop Calendar (Rayagada Block)
Crop Calendar Jan Feb March April May June July August Sept. October Nov. Dec.
Pineapple Lemon Guava Jackfruit Banana
Horticulture Crops
Orange Paddy Ragi Jauna Kangu
Cereal Crops
Sauna Cashew Turmeric Commercial
Crops Tamarind Beans Cabbage Lady Finger Tomato Brinjal
Vegetables
Papaya
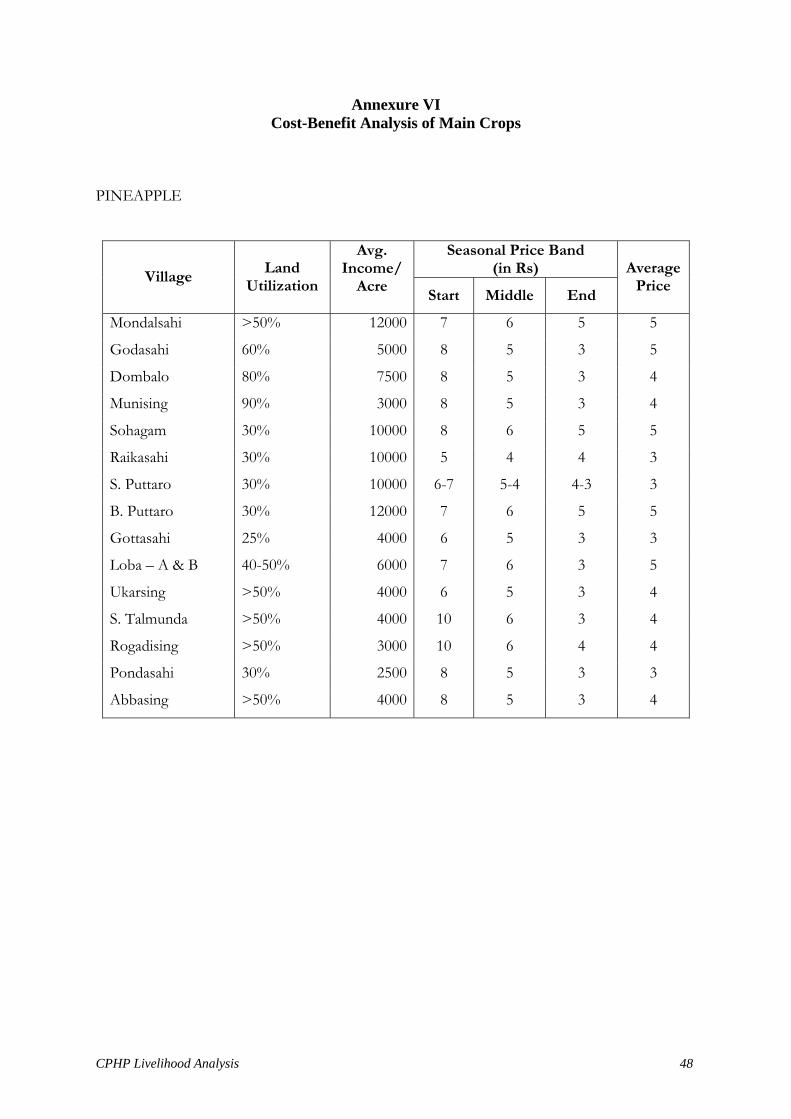
CPHP Livelihood Analysis 48
Annexure VI Cost-Benefit Analysis of Main Crops
PINEAPPLE
Seasonal Price Band (in Rs) Village Land
Utilization
Avg. Income/
Acre Start Middle End
Average Price
Mondalsahi >50% 12000 7 6 5 5
Godasahi 60% 5000 8 5 3 5
Dombalo 80% 7500 8 5 3 4
Munising 90% 3000 8 5 3 4
Sohagam 30% 10000 8 6 5 5
Raikasahi 30% 10000 5 4 4 3
S. Puttaro 30% 10000 6-7 5-4 4-3 3
B. Puttaro 30% 12000 7 6 5 5
Gottasahi 25% 4000 6 5 3 3
Loba – A & B 40-50% 6000 7 6 3 5
Ukarsing >50% 4000 6 5 3 4
S. Talmunda >50% 4000 10 6 3 4
Rogadising >50% 3000 10 6 4 4
Pondasahi 30% 2500 8 5 3 3
Abbasing >50% 4000 8 5 3 4
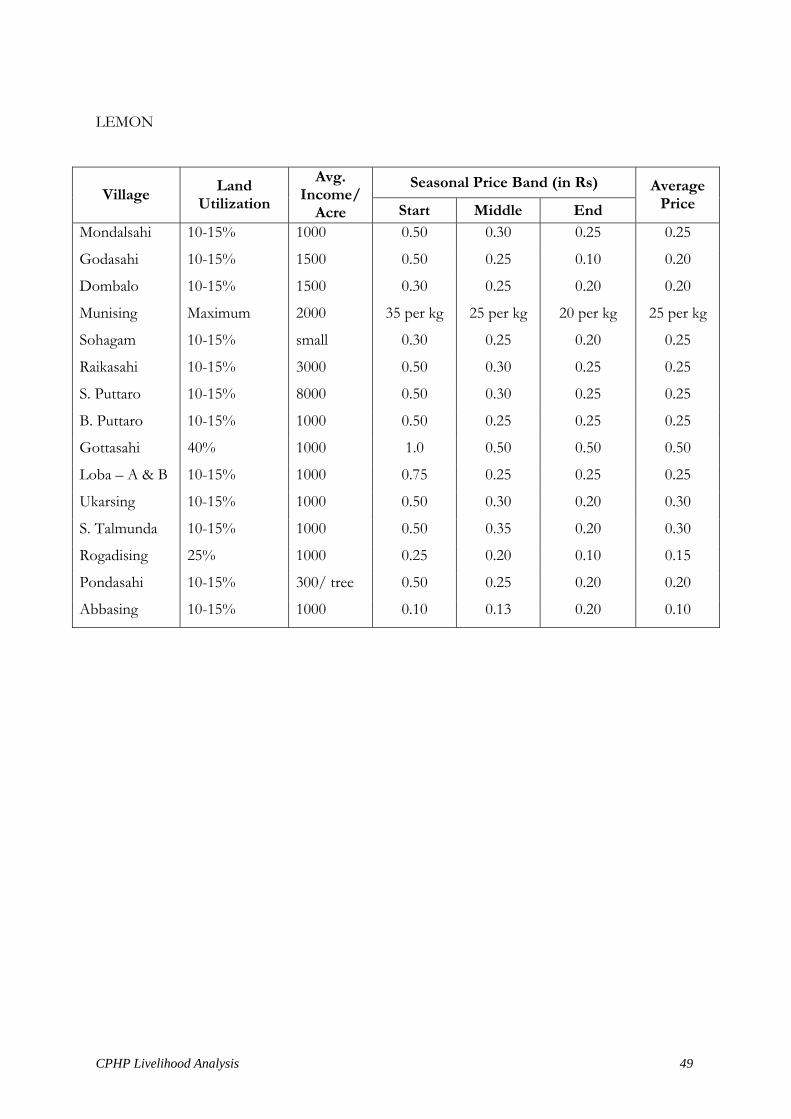
CPHP Livelihood Analysis 49
LEMON
Seasonal Price Band (in Rs) Village Land
Utilization
Avg. Income/
Acre Start Middle End Average
Price
Mondalsahi 10-15% 1000 0.50 0.30 0.25 0.25
Godasahi 10-15% 1500 0.50 0.25 0.10 0.20
Dombalo 10-15% 1500 0.30 0.25 0.20 0.20
Munising Maximum 2000 35 per kg 25 per kg 20 per kg 25 per kg
Sohagam 10-15% small 0.30 0.25 0.20 0.25
Raikasahi 10-15% 3000 0.50 0.30 0.25 0.25
S. Puttaro 10-15% 8000 0.50 0.30 0.25 0.25
B. Puttaro 10-15% 1000 0.50 0.25 0.25 0.25
Gottasahi 40% 1000 1.0 0.50 0.50 0.50
Loba – A & B 10-15% 1000 0.75 0.25 0.25 0.25
Ukarsing 10-15% 1000 0.50 0.30 0.20 0.30
S. Talmunda 10-15% 1000 0.50 0.35 0.20 0.30
Rogadising 25% 1000 0.25 0.20 0.10 0.15
Pondasahi 10-15% 300/ tree 0.50 0.25 0.20 0.20
Abbasing 10-15% 1000 0.10 0.13 0.20 0.10
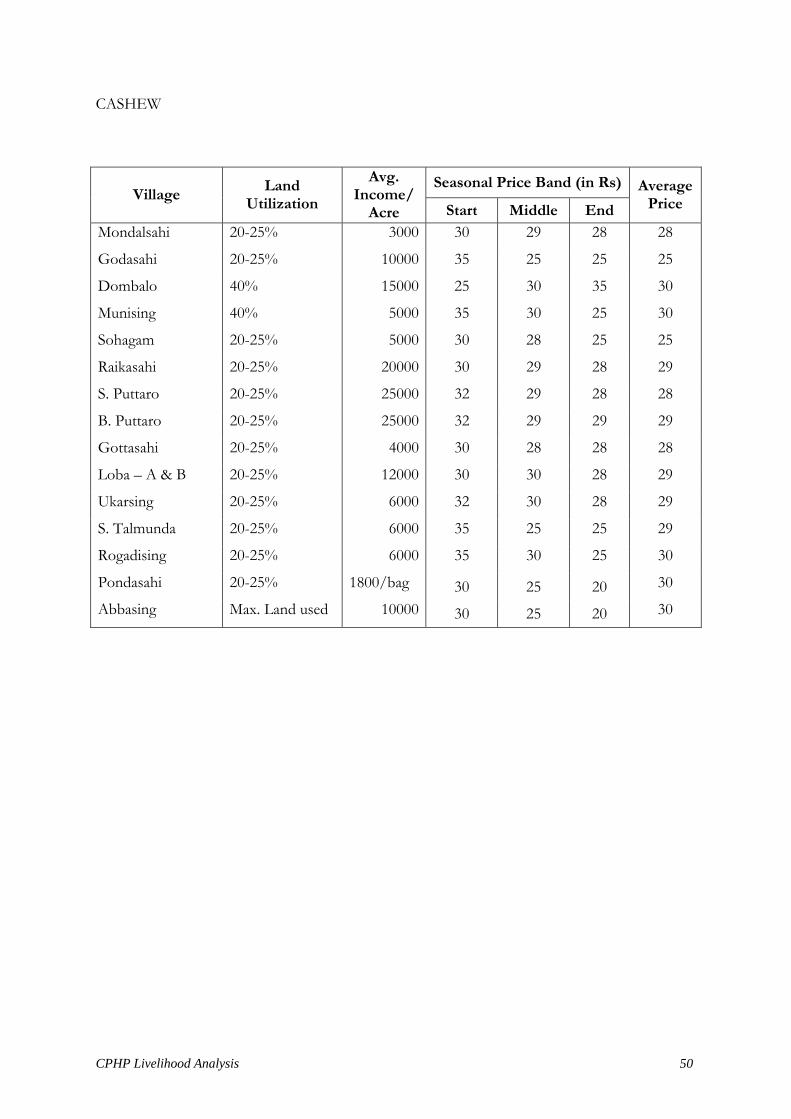
CPHP Livelihood Analysis 50
CASHEW
Seasonal Price Band (in Rs) Village Land
Utilization
Avg. Income/
Acre Start Middle End Average
Price
Mondalsahi 20-25% 3000 30 29 28 28
Godasahi 20-25% 10000 35 25 25 25
Dombalo 40% 15000 25 30 35 30
Munising 40% 5000 35 30 25 30
Sohagam 20-25% 5000 30 28 25 25
Raikasahi 20-25% 20000 30 29 28 29
S. Puttaro 20-25% 25000 32 29 28 28
B. Puttaro 20-25% 25000 32 29 29 29
Gottasahi 20-25% 4000 30 28 28 28
Loba – A & B 20-25% 12000 30 30 28 29
Ukarsing 20-25% 6000 32 30 28 29
S. Talmunda 20-25% 6000 35 25 25 29
Rogadising 20-25% 6000 35 30 25 30
Pondasahi 20-25% 1800/bag 30 25 20 30
Abbasing Max. Land used 10000 30 25 20 30
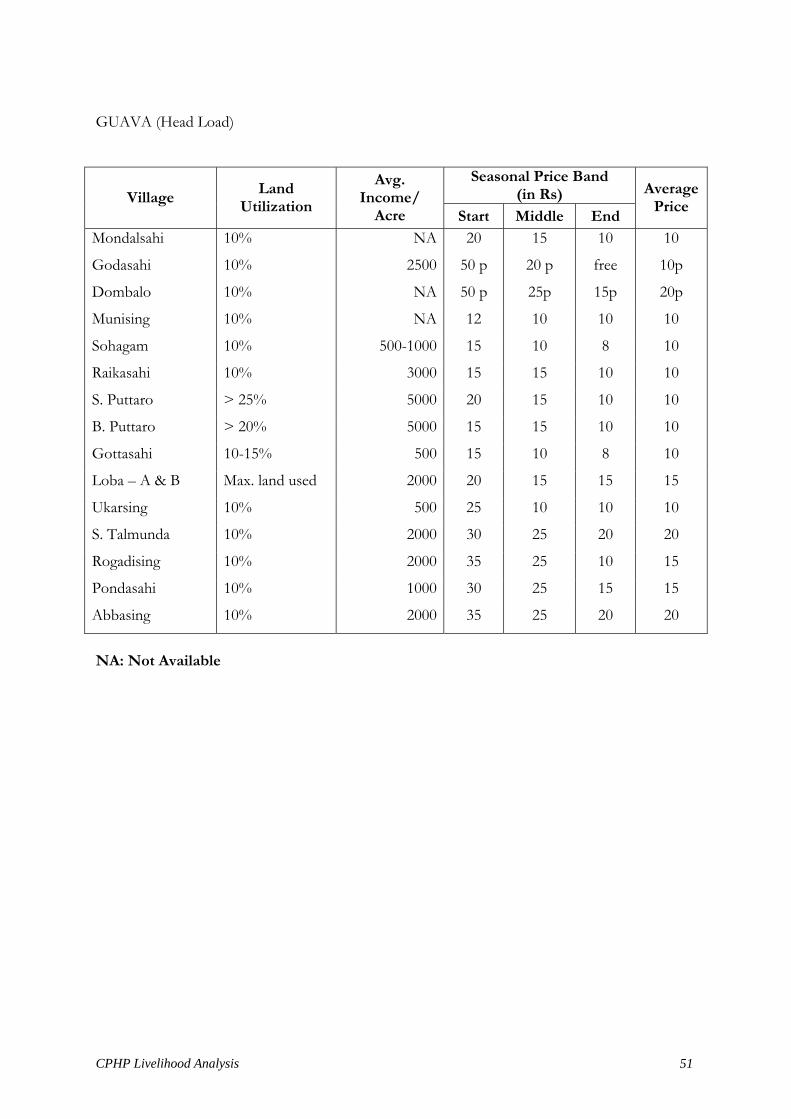
CPHP Livelihood Analysis 51
GUAVA (Head Load)
Seasonal Price Band (in Rs) Village Land
Utilization
Avg. Income/
Acre Start Middle End
Average Price
Mondalsahi 10% NA 20 15 10 10
Godasahi 10% 2500 50 p 20 p free 10p
Dombalo 10% NA 50 p 25p 15p 20p
Munising 10% NA 12 10 10 10
Sohagam 10% 500-1000 15 10 8 10
Raikasahi 10% 3000 15 15 10 10
S. Puttaro > 25% 5000 20 15 10 10
B. Puttaro > 20% 5000 15 15 10 10
Gottasahi 10-15% 500 15 10 8 10
Loba – A & B Max. land used 2000 20 15 15 15
Ukarsing 10% 500 25 10 10 10
S. Talmunda 10% 2000 30 25 20 20
Rogadising 10% 2000 35 25 10 15
Pondasahi 10% 1000 30 25 15 15
Abbasing 10% 2000 35 25 20 20
NA: Not Available