Embed Size (px)
Citation preview
Race And Race And
EducationEducation
Four Species Of Capital
Four Species Of Capital
Economic • Human • Social • Cultural
Economic • Human • Social • Cultural
Performance Differences
Performance Differences
Potential Explanations For Differences
Potential Explanations For Differences
Genetics?Genetics?
Ethnic Culture?
Ethnic Culture?
Structure?Structure?
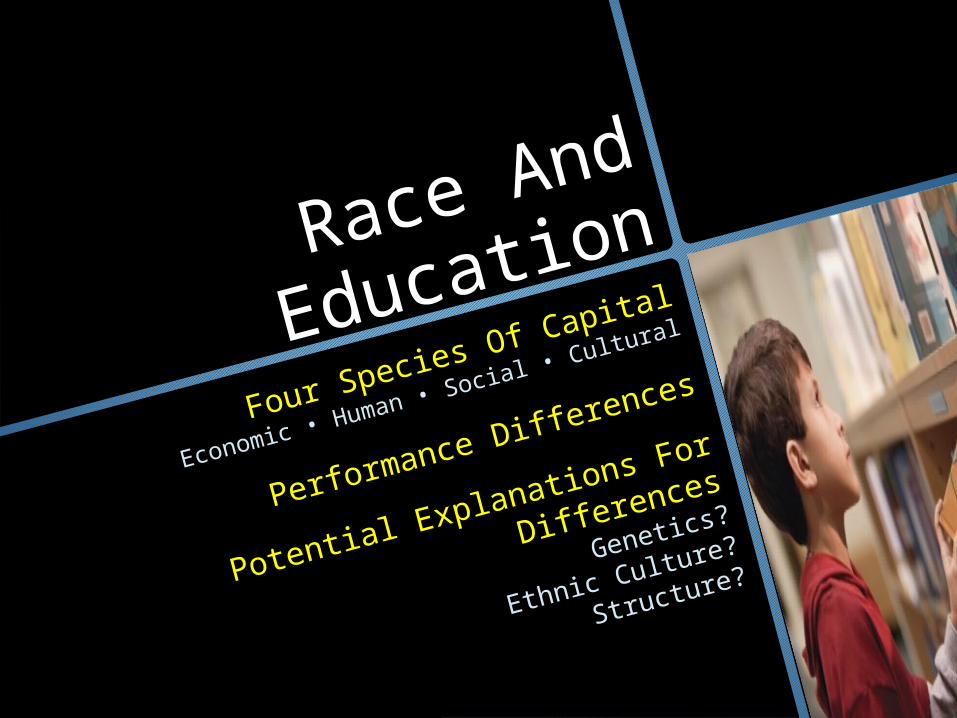
Speci
es
Of
Speci
es
Of
Capit
al
Capit
al
Transf
err
ed F
rom
Genera
tion T
o
Transf
err
ed F
rom
Genera
tion T
o
Genera
tion
Genera
tion
Able
To B
e E
xchanged F
or
Oth
er
Able
To B
e E
xchanged F
or
Oth
er
Reso
urc
es
Reso
urc
es
• • Economic Capital:
Economic Capital:
Control of fControl of financial resources (e.g., cash, assets)
• • Human Capital:
Human Capital:Accumulated knowledge, skills, and physical
Accumulated knowledge, skills, and physical
capabilities gained through education
capabilities gained through education
• • Social Capital:
Social Capital:The collective value of all social networks (who
The collective value of all social networks (who
you know) and the inclinations that arise from
you know) and the inclinations that arise from
these networks to do things for each other.
these networks to do things for each other.
• • Cultural Capital:
Cultural Capital:Linguistic and cultural competencies (primarily
Linguistic and cultural competencies (primarily
tastes, and dispositions) valued but not taught
tastes, and dispositions) valued but not taught
in schools. You learn them at home.
in schools. You learn them at home.
George BeckerPierre Bourdieu
DeceasedDeceasedAbsenteeAbsentee
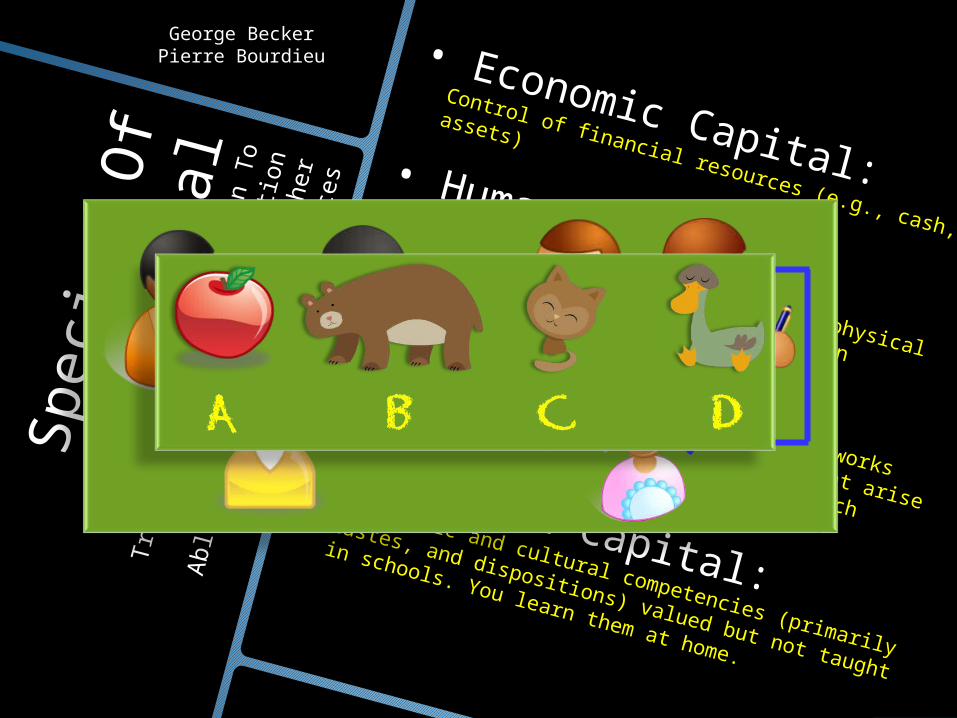
Performance DifferencesPerformance Differences
Fact: Fact: A A
17yo Black 17yo Black
senior has senior has
the the
average average
reading reading
proficiency proficiency
of a 13yo of a 13yo
White 8White 8thth
gradergrader
SCORE SCORE THE SAME THE SAME ON READING/MATH ON READING/MATH TESTSTESTS
Performance DifferencesPerformance Differences
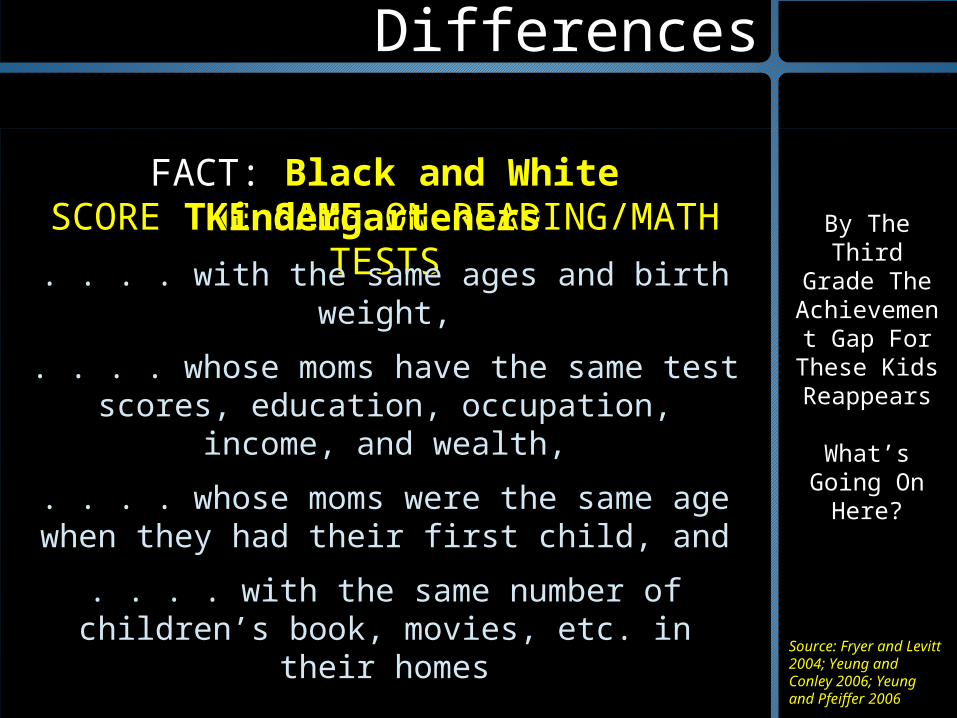
FACT: FACT: Black and White Black and White Kindergarteners Kindergarteners
. . . . with the same ages and birth weight,. . . . with the same ages and birth weight,
. . . . whose moms have the same test . . . . whose moms have the same test scores, education, occupation, income, and scores, education, occupation, income, and
wealth,wealth,
. . . . whose moms were the same age when . . . . whose moms were the same age when they had their first child, andthey had their first child, and
. . . . with the same number of children’s . . . . with the same number of children’s book, movies, etc. in their homesbook, movies, etc. in their homes
Source: Fryer and Source: Fryer and Levitt 2004; Yeung Levitt 2004; Yeung and Conley 2006; and Conley 2006; Yeung and Pfeiffer Yeung and Pfeiffer 20062006
By The By The Third Grade Third Grade
The The AchievemenAchievemen
t Gap For t Gap For These Kids These Kids ReappearsReappears
What’s What’s Going On Going On
Here?Here?
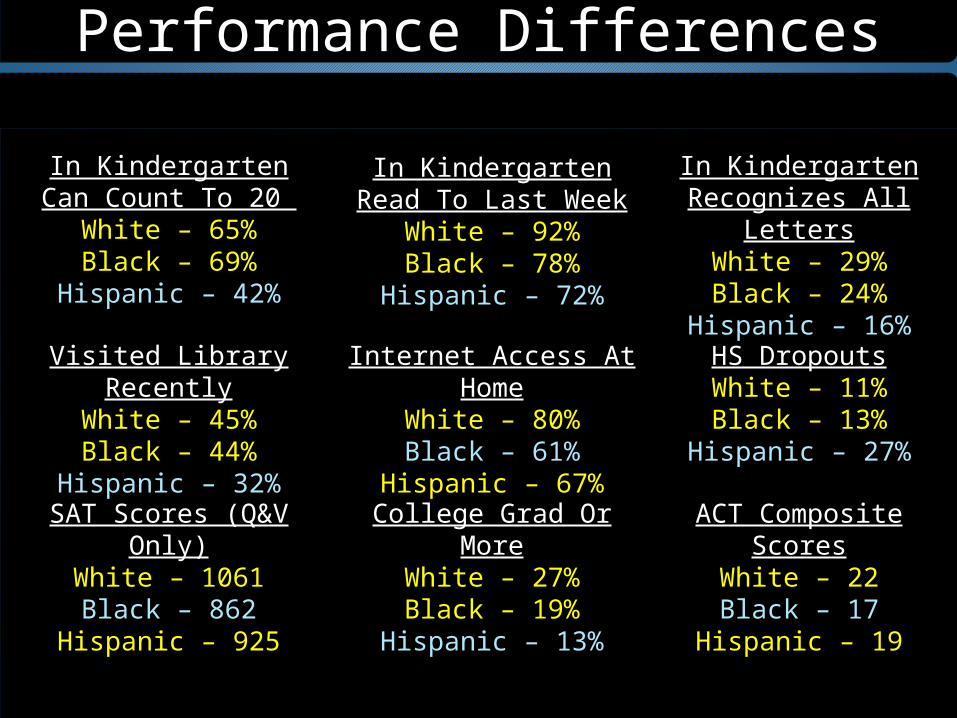
Performance DifferencesPerformance Differences
Internet Access At Home
White – 80%Black – 61%
Hispanic – 67%
Visited Library Recently
White – 45%Black – 44%
Hispanic – 32%
In KindergartenCan Count To 20
White – 65%Black – 69%
Hispanic – 42%
In KindergartenRead To Last Week
White – 92%Black – 78%
Hispanic – 72%
In KindergartenRecognizes All
LettersWhite – 29%Black – 24%
Hispanic – 16%HS DropoutsWhite – 11%Black – 13%
Hispanic – 27%
SAT Scores (Q&V Only)
White – 1061Black – 862
Hispanic – 925
College Grad Or More
White – 27%Black – 19%
Hispanic – 13%
ACT Composite Scores
White – 22Black – 17
Hispanic – 19
Is It
Geneti
cs?
Is It
Geneti
cs?
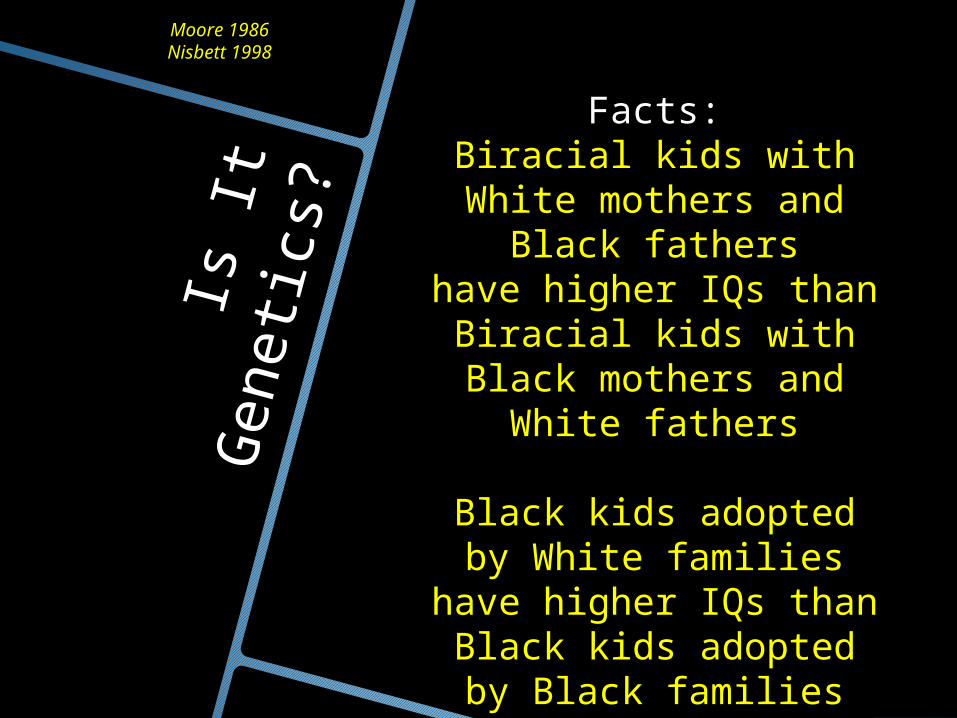
Facts:Biracial kids with White
mothers and Black fathers
have higher IQs thanBiracial kids with Black
mothers and White fathers
Black kids adopted by White families
have higher IQs thanBlack kids adopted by
Black families
Moore 1986Moore 1986Nisbett 1998Nisbett 1998
Is It
Eth
nic
Is
It
Eth
nic
C
ult
ure
?C
ult
ure
?
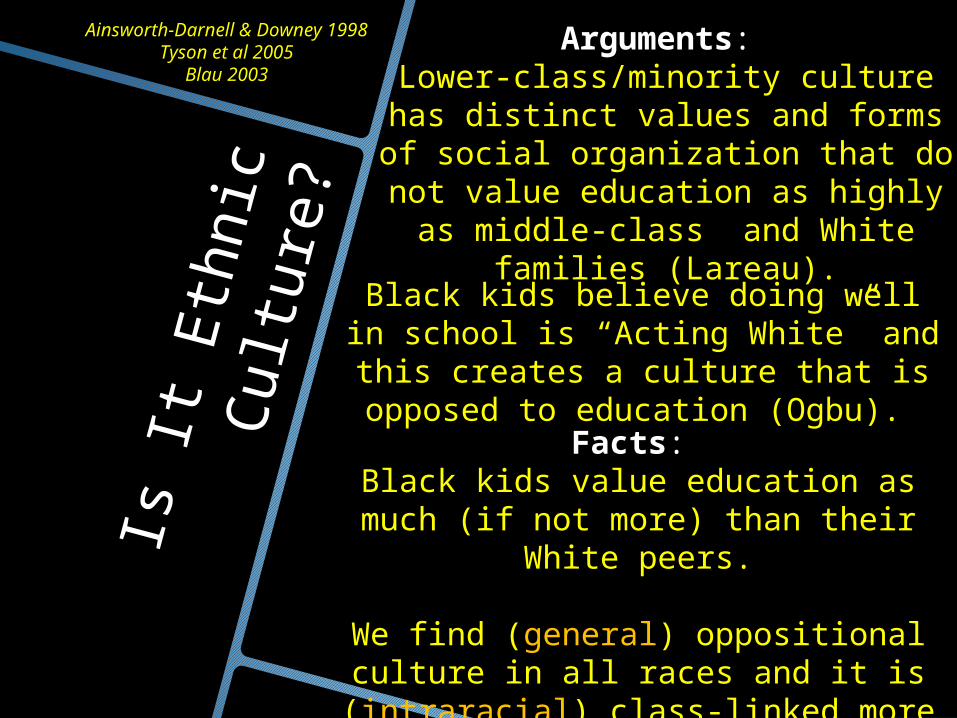
Facts: Black kids value education as much (if
not more) than their White peers.
We find (general) oppositional culture in all races and it is (intraracial) class-
linked more than (racialized) race-linked
Ainsworth-Darnell & Downey Ainsworth-Darnell & Downey 19981998
Tyson et al 2005Tyson et al 2005Blau 2003Blau 2003
Arguments: Lower-class/minority culture has
distinct values and forms of social organization that do not value
education as highly as middle-class and White families (Lareau).
Black kids believe doing well in school is “Acting White” and this
creates a culture that is opposed to education (Ogbu).
Is It
Diff
ere
nce
s In
Is It
Diff
ere
nce
s In
O
pport
unit
y?
Opport
unit
y?
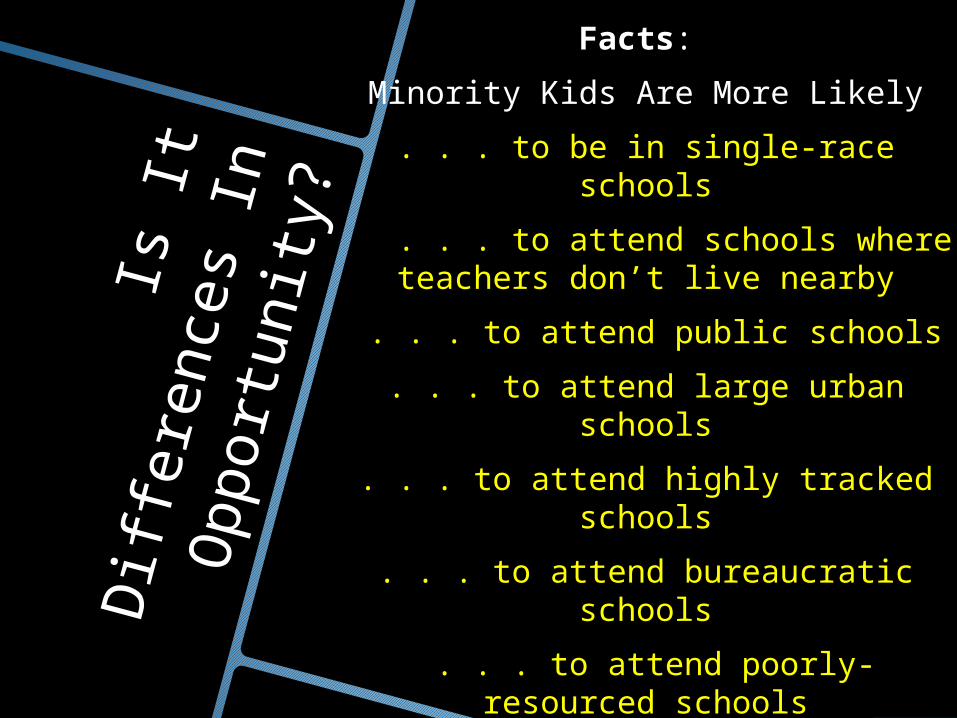
Facts:
Minority Kids Are More Likely
. . . to be in single-race schools
. . . to attend schools where teachers don’t live nearby
. . . to attend public schools
. . . to attend large urban schools
. . . to attend highly tracked schools
. . . to attend bureaucratic schools
. . . to attend poorly-resourced schools
. . . to be taught by uncertified teachers
And To Face Micro-Expectations In These Environments