Embed Size (px)
Citation preview
Racial Rioting in the 1960S: An Event History Analysis of Local ConditionsAuthor(s): Daniel J. MyersReviewed work(s):Source: American Sociological Review, Vol. 62, No. 1 (Feb., 1997), pp. 94-112Published by: American Sociological AssociationStable URL: http://www.jstor.org/stable/2657454 .
Accessed: 21/01/2013 18:26
Your use of the JSTOR archive indicates your acceptance of the Terms & Conditions of Use, available at .http://www.jstor.org/page/info/about/policies/terms.jsp
.JSTOR is a not-for-profit service that helps scholars, researchers, and students discover, use, and build upon a wide range ofcontent in a trusted digital archive. We use information technology and tools to increase productivity and facilitate new formsof scholarship. For more information about JSTOR, please contact [email protected].
.
American Sociological Association is collaborating with JSTOR to digitize, preserve and extend access toAmerican Sociological Review.
http://www.jstor.org
This content downloaded on Mon, 21 Jan 2013 18:26:05 PMAll use subject to JSTOR Terms and Conditions
RACIAL RIOTING IN THE 1960S: AN EVENT HISTORY ANALYSIS OF LOCAL CONDITIONS*
Daniel J. Myers University of Wisconsin, Madison
Using Spilerman's (1970b) data on the timing and locations of race riots from 1961 to 1968, I use event history analysis to investigate the effects of local conditions on city-level hazard rates of rioting. First, several struc- tural strain and social-psychological arguments, which were the focus of Spilerman's original studies, are reexamined in light of event history analy- sis. Second, I reinterpret ethnic competition arguments recently used to ex- plain a wide variety of collective violence, and apply these ideas to the 1960s' riots. Third, I test two models of the diffusion of rioting. Like previous analyses, my findings fail to support structural strain theories. Contrary to previous analyses however, the size of the non-White population is not the singular predictor found for the 1960s' riot locations. Instead, my results support both competition and diffusion arguments.
D uring the 1970s, Spilerman (1970a, 1971, 1972, 1976) published an influ-
ential set of studies examining racial rioting in the 1960s. For many, this research became the definitive word on the 1960s riots, and it remains influential today (McPhail 1994). Spilerman examined a number of theoretical explanations for the occurrence and severity of riots, including structural strain arguments (Smelser 1962), absolute deprivation (Dow- nes 1968), relative deprivation (Gurr 1968, 1970), unresponsive political structures (Lie- berson and Silverman 1965), and geographi- cal contagion (National Advisory Commis- sion on Civil Disorders 1968). In summary, he concluded that differences among cities were unrelated to the frequency and severity of rioting. In fact, only two variables, the size of the non-White population and a dummy variable for region in the United
States, were better predictors of riots and their severity than the 16 theoretical indica- tors combined.
Despite the apparent clarity of Spilerman's findings, scholars did not abandon the theo- retical constructs he tested. Much subsequent research has attempted to challenge his find- ings and revive older explanations of the 1960s riots (for reviews, see Bryan 1979; McPhail 1994; McPhail and Wohlstein 1983; Schneider 1992). Despite slight deviations, however, the results of these studies gener- ally support Spilerman's findings: The size of the non-White population accounted for the majority of the variance of riot frequency explained, and other theoretical variables ex- plained only small increments beyond it.
Ultimately, however, there is still a consid- erable lack of agreement about what factors should remain under consideration as poten- tial causes of rioting. Some scholars con- clude that structural strain explanations and other social-psychological explanations have been thoroughly trounced and that new ap- proaches must be developed to identify the underlying determinants of rioting and other collective behaviors (McPhail 1994). Others maintain the worthiness of grievance and deprivation explanations and continue to in- voke slightly recast versions of these theo- ries (Heskin 1985; Koomen and Frankel
* Direct correspondence to Daniel J. Myers, Department of Sociology, 1180 Observatory Drive, Madison, WI 53706 ([email protected]. edu). I thank Pamela Oliver, Gerald Marwell, Charles Halaby, Seymour Spilerman, Robert Mare, Alberto Palloni, Ronald Wohlstein, Ralph Turner, Alexandra Corning, and the ASR review- ers for comments on earlier drafts. Parts of this paper were presented at the 1995 annual meeting of the American Sociological Association in Washington, D.C.
94 American Sociological Review, 1997, Vol. 62 (February:94- 12)
This content downloaded on Mon, 21 Jan 2013 18:26:05 PMAll use subject to JSTOR Terms and Conditions
RACIAL RIOTING IN THE 1960S 95
1992; Polletta 1992). These ideas may con- tinue to be popular in part because of the ambiguity resulting from different samples and methods, or simply because "it is very difficult to abandon old explanations" (Mc- Phail 1994:5). However, the continued at- tractiveness of these previous explanations may hint that the empirical examinations that tested them were inadequate analyses of the processes underlying rioting. This question can be answered by critically examining pre- vious empirical work using new analytical procedures and recent theoretical develop- ments that are better suited to the problem.
Thus, I reexamine Spilerman's data on ra- cial rioting in the 1960s using event history analysis. First, I closely follow his analysis, re-examining his conclusions regarding the structural strain and deprivation arguments. Then, I investigate two additional explana- tions for rioting-one based on notions of social diffusion and the other based on Olzak's (1987, 1992) recent work on ethnic competition.
BACKGROUND
Structural Strain and Deprivation
Spilerman (1970a, 1971, 1976) conducted his analysis of the outbreak and severity of riots by grouping structural strain and other related structural explanations into four basic clus- ters and adopting indices for each cluster of arguments (Spilerman's variable clusters ap- pear in the stub of Table 2 on page 103). His first variable cluster tested the "social disor- ganization thesis"-that poorly integrated in- dividuals are outside the general control of community norms and have less access to tra- ditional mechanisms for addressing social grievances (Downes 1968). Spilerman's sec- ond and third clusters of variables examined the "absolute" and "relative" versions of dep- rivation arguments. The absolute deprivation argument posits that the most severely dis- possessed in society will be the ones who engage in collective violence (Downes 1968). The relative deprivation argument (Gurr 1968, 1970) states that a disadvantaged group determines its own level of social and eco- nomic deprivation by comparing itself to some reference group; in the case of Spilerman's studies, Blacks would develop a
sense of relative deprivation by comparing their situation to that of proximal Whites.
Spilerman's third variable cluster tested the "expectations" argument (Berkowitz 1968) in which expectations for improved social and economic conditions increase as the disad- vantaged group's position improves, thereby leading to heightened frustration if the rising expectations are not met. In this argument, the opposite relationship between deprivation variables and racial rioting is hypothesized: As conditions improve for Blacks, an increase in expectations, frustration, and ultimately the number of riot events occurs.
Finally, Spilerman tested the idea that the lack of access to political representation in- creases rioting (Lieberson and Silverman 1965): With no way to address grievances or to have group interests represented in gov- ernmental decision-making bodies, Blacks may turn to violence as a method of express- ing their demands. As noted above, Spiler- man (1970a) found little or no support for any of these arguments in his initial work, in which the frequency of rioting was the de- pendent variable. When riot severity was the dependent variable and also failed to show support (Spilerman 1976), these ideas were further discredited.
In addition to the original four arguments, Spilerman (1970a) also noted several other potential sources of the tendency to riot, but he provided only partial tests. Of these, I ex- amine competition and diffusion.
Competition Models
Competition for scarce resources is often as- sumed to be a key process underlying most conflicts. When two or more groups compete for a common pool of resources, they inevi- tably come into conflict, and as the demand for a good increases and the supply de- creases, the conflict will increase. Park (1950) applied such an economic model to ethnic and racial conflict. His faith, however, that assimilation would in time relieve eth- nic conflict and lead to peaceful accommo- dation has not been substantiated; thus, the continued application of economic competi- tion models to ethnic conflict in general and ethnic collective violence in particular (Lieb- erson and Silverman 1965; Nielsen 1985; Olzak 1987, 1992; Olzak and Nagel 1986;
This content downloaded on Mon, 21 Jan 2013 18:26:05 PMAll use subject to JSTOR Terms and Conditions
96 AMERICAN SOCIOLOGICAL REVIEW
Shorter and Tilly 1974; Spilerman 1970a, 1971, 1976; Tilly, Tilly, and Tilly 1975; Tolnay and Beck 1995).
Olzak's (1992) recent work offers a prom- ising model that connects economic pro- cesses with collective action using ethnic competition as its main mechanism. Her study of ethnic conflict and protest supports three main competition mechanisms: (1) The breakdown of labor market segmentation leads to increased competition between eth- nic groups, thereby leading to increased con- flict and collective action; (2) immigration increases competition directly (Bonacich 1972; Lieberson 1980) and also through its effects on labor market segmentation; and (3) economic contraction exacerbates competi- tion and conflict as it increases competition for employment.
While Olzak's analysis is compelling, the collective violence she and others attempt to explain is predominantly that of Whites against ethnic and racial minorities. Rioting in the 1960s, however, was an exception to that pattern. Therefore, if ethnic competition arguments are to be used to explain the Black-initiated property riots of the 1960s, the arguments must be congruent with mi- nority-initiated as well as majority-initiated collective violence.
I propose that while changes in competi- tion may in fact change the levels of collec- tive violence, predicting who will initiate the violence and who will be the target of vio- lence requires knowledge of the outcomes of increased competition. In the cases examined by Olzak, White-initiated violence in re- sponse to labor market de-segregation makes intuitive sense because White advantage is threatened by desegregation. However, apply- ing the labor market desegregation argument to Black riots is problematic because it is not clear that Blacks would respond to improved market positions with violence against Whites. Yet it is possible that decreased labor market segregation could lead to violence by Blacks if desegregation led to worse market positions for Blacks. Consider the possibility that desegregation resulted from White inva- sion of labor niches traditionally dominated by Blacks; the result for some Blacks thus would be unemployment. Rather than an im- proved labor market position for Blacks, de- segregation would have the opposite effect.
Black-initiated violence is more easily under- stood under such circumstances.
Using the above insight, I treat non-White unemployment as an indicator of competitive labor market outcomes that disadvantage Blacks. I also incorporate variables indicat- ing increased competition in the traditionally Black labor market stemming from non- White migration to a city and all immigra- tion to a city from outside the United States. Both of these variables are particularly rel- evant to the 1960s because of high levels of interstate migration of Blacks and increasing immigration throughout the 1950s and 1960s. And because competition theory pre- dicts that economic downturns exacerbate any competition-driven ethnic violence, I in- clude indicators of general economic con- tractions in the analysis. Finally, I examine interactions between immigration and eco- nomic conditions implied by competition ar- guments. Intuitively, the effect of any in-mi- gration should be greater when the economic situation is poor in a particular city (Olzak 1989b). Conversely, an influx of foreign im- migrants or American non-Whites should have a smaller effect on competition and sub- sequent violence when the economy is far- ing well.'
Diffusion of Rioting
Diffusion refers to a process in which the oc- currence of an event to one member of a population changes the likelihood of such an event occurring to other members of the population (Strang 1991). So when a riot oc- curs in one city in the United States, the rates of future rioting in other cities are hypoth- esized to increase as a result. Many analysts have recognized that collective protests and collective violence tend to cluster both tem- porally and geographically (McAdam 1982; Pitcher, Hamblin, and Miller 1978; Olzak 1987; Koopmans 1993; Lichbach 1985; Diek- mann 1979). This is not imitation or mindless copying, (as was the view in early contagion theories (see McPhail 1991 for a review). In- stead, it is viewed as a social learning process in which the favorable outcomes of others'
I For a complementary analysis of racial riot- ing that also supports competition theory, see Olzak and Shanahan (1996).
This content downloaded on Mon, 21 Jan 2013 18:26:05 PMAll use subject to JSTOR Terms and Conditions
RACIAL RIOTING IN THE 1960S 97
collective behaviors provides a model for subsequent protests (Pitcher et al. 1978).
The process of social diffusion is driven by a variety of communication processes among established social networks (Hamblin, Jacob- sen, and Miller 1973; McPhail and Wohlstein 1983; Paige 1971). These networks may be defined by friendship and family connec- tions, or they may be more dispersed, as when individuals are connected through the mass media (Oliver 1989). For example, Rude (1964, 1972) documented that rebel- lion in England and France during the eigh- teenth and nineteenth centuries diffused along major transportation routes suggesting that information about collective actions was being communicated by travelers along trade routes. More recently, the mass media and the telephone have been considered to be the most prominent communication modes driv- ing the diffusion of collective behavior (Spilerman 1970a; Morris 1984). Clearly, the telephone is more apt to be used by networks of acquaintances, while the mass media has a more widely dispersed influence governed in scope by its audience (i.e., a national or local audience) (Oliver 1989).
I assume that these communication net- works are geographically concentrated. Friends and family (and thus their face-to- face and telephone contacts) are likely to be geographically concentrated. And, although some riots receive national media attention, media coverage of riots and civil violence is generally concentrated in the regions where they occurred. Thus, while a large riot in De- troit may receive national newspaper and television coverage, news broadcasters and newspaper editors in and around Michigan would devote higher proportions of their cov- erage to the riot than would the media in Texas or Florida. Small riots that receive re- gional media attention may not be covered nationally and therefore may be completely unknown to people in distant regions.
Any adequate model of a diffusion process must identify the underlying factors that ac- count for variation in the "contagiousness" of a social phenomenon. The two most impor- tant of these factors are temporal proximity and spatial proximity (Hamblin et al. 1973; Rogers 1983; Brown 1981; Mahajan and Petersen 1985; Strang and Tuma 1993). In the case of riots and other collective events,
spatial proximity is usually indicated by geo- graphic distance (Hedstrom 1994; Spilerman 1970a), and temporal proximity is indicated by the amount of time that has passed since a collective event (Olzak 1987, 1992). I use spatial and temporal proximity to create three diffusion indicators.
The first diffusion variable is a declining function of geographical distance between a given city and each city that experienced a riot at time t - 1. The amount of contagion, c,, experienced by a given city at time t is thus given by:
ct =Xd7mti , (1 ) j
where di1 is the distance in miles between two cities, i and j, and m is a dummy vari- able indicating whether or not a riot occurred in city j at time t - 1. This contagion variable tests the hypothesis that riots in one city in- crease the likelihood of rioting in other cit- ies and that other riots are more likely in cit- ies closest to where the original rioting oc- curred.
Given that diffusion is driven by commu- nication processes, the media in particular, an alternative pattern of diffusion may have operated in the 1960's rioting. Given the sub- stantial national media coverage of the riots, particularly of large riots, rioting may have diffused nationally rather than regionally. In other words, the proximity of cities may have been irrelevant if all cities nationally re- ceived equivalent information about the riots as they occurred. To test for this possibility, I examined two additional diffusion vari- ables. The first variable measures the num- ber of riots in the United States at time t - 1 (M,_1 where Mt-1 = Ymj1t,). This variable as- sumes that a riot in any city has an equal ef- fect on other cities, regardless of relative lo- cations. The effect of the number of riots at time t - I may not be linear however. The first riot at t - 1 may contribute substantially to the occurrence of additional riots, but the tenth riot may contribute little more beyond that contributed by the ninth riot or may even decrease the likelihood of rioting. To reflect this possibility, I incorporate the number of riots squared, (M,_1)2, in the analysis.
Unlike other social diffusion processes, such as the adoption of a new technology (Hamblin et al. 1973; Rogers 1983), disrup-
This content downloaded on Mon, 21 Jan 2013 18:26:05 PMAll use subject to JSTOR Terms and Conditions
98 AMERICAN SOCIOLOGICAL REVIEW
tive protest activities do not continue to dif- fuse unabated. Rather, protest activity ini- tially accelerates, then peaks, and then be- gins to decline. In the case of rioting, each riot subsequent to the apex slows the rate of rioting, almost as if the process were becom- ing distasteful to its participants. This ex- haustion effect has been hypothesized to re- sult from either the tiring and calming of the participants or the increase in repressive mechanisms by agents of social control (Kel- ly and Isaac 1984; Koopmans 1993; Ober- schall 1978). Several analyses have sug- gested that the diffusion and exhaustion pro- cesses for collective violence require rela- tively brief periods. Olzak (1987) found the diffusion-exhaustion cycle to be completed within a period of 30 days. With regard to the 1960s rioting, the Kerner Commission report (National Advisory Commission on Civil Disorders 1968) suggested that events clustered in two-week periods. Given these observations and the nature of the data on 1960s riots, I estimate four sets of models using rioting in the past one week, the past two weeks, and the past four weeks. Models using the one-week period were clearly su- perior; the addition of longer time periods did not improve prediction over the one- week model. Therefore, here I present only models using the one-week measures.
What Can and Cannot Be Explained
Every analysis is bounded by the scope of the data examined, and the current study is no exception. As were previous studies of the 1960s riots, this analysis is also limited by two key aspects of the data: their temporal scope and their units of analysis. Because the data I examine are limited to the 1960s and compare city-level characteristics, they can- not explain the rise of the unprecedented wave of Black-initiated rioting that occurred in the 1960s. A different type of data set, which provides information on long-term na- tional conditions, is necessary to explain the riot wave (see McAdam 1982; Jenkins and Eckert 1986; and Kelly and Isaac 1984 for empirical investigations of these long-term trends and contexts). In fact, it is exactly this limitation that led Spilerman (1970a) to con- jecture about the causes of Black-initiated ri- oting in the 1960s. Given that Spilerman did
not find any city-level differences, he con- cluded that rioting must be the product of a national phenomenon. Drawing on Tom- linson (1968), Spilerman suggested that the process was actually driven by nationwide conditions that affected all Blacks and by the acceptance of a "riot ideology" among all Blacks; therefore riots would break out ran- domly, and when and where were governed only by the number of available rioters.
Thus, the current data cannot provide for comprehensive tests of theories about the causes of racial rioting; but they can be more appropriately applied to the question of which cities were more likely to experi- ence rioting given that the riot wave was oc- curring. Conclusions drawn from this data must take into account these limitations. Thus, my aim is to examine differences in local conditions and to determine if these differences contributed in any systematic way to the pattern of rioting observed dur- ing the 1960s.2
DATA
The riot data were collected by Spilerman (1970b), who cataloged urban riots in the United States for the years 1961 through 1968. He used these in three important stud- ies that tested alternative explanations of riot frequency and riot severity (Spilerman 1970a, 1971, 1976). His original data were drawn from a number of sources, including the Congressional Quarterly's Civil Disorder Chronology, the New York Times Index, the Report of the National Advisory Commission on Civil Disorders, and the Lemberg Center's Riot Data Review (for details, see Spilerman 1970a, 1970b). The 673 cities in- cluded in the data are located in the contigu- ous United States and had populations of at least 25,000 in 1960. For each city, the weeks in which a riot occurred are recorded from the beginning of 1961 through the end of 1968.
2 Although the data I analyze do not speak to long-term cycles of collective behavior, evidence is mounting indicating that competition processes contribute to long-term patterns of collective vio- lence (Olzak 1992). Olzak's work and the results of the present study suggest that competition ar- guments provide strong hypotheses for explain- ing long-term patterns of racial rioting.
This content downloaded on Mon, 21 Jan 2013 18:26:05 PMAll use subject to JSTOR Terms and Conditions
RACIAL RIOTING IN THE 1960S 99
150 134 141
z 100
0 5
0 ~~~~~~~~~~~~~36
.0 0
1961 1962 1963 1964 1965 1966 1967 1968
Year
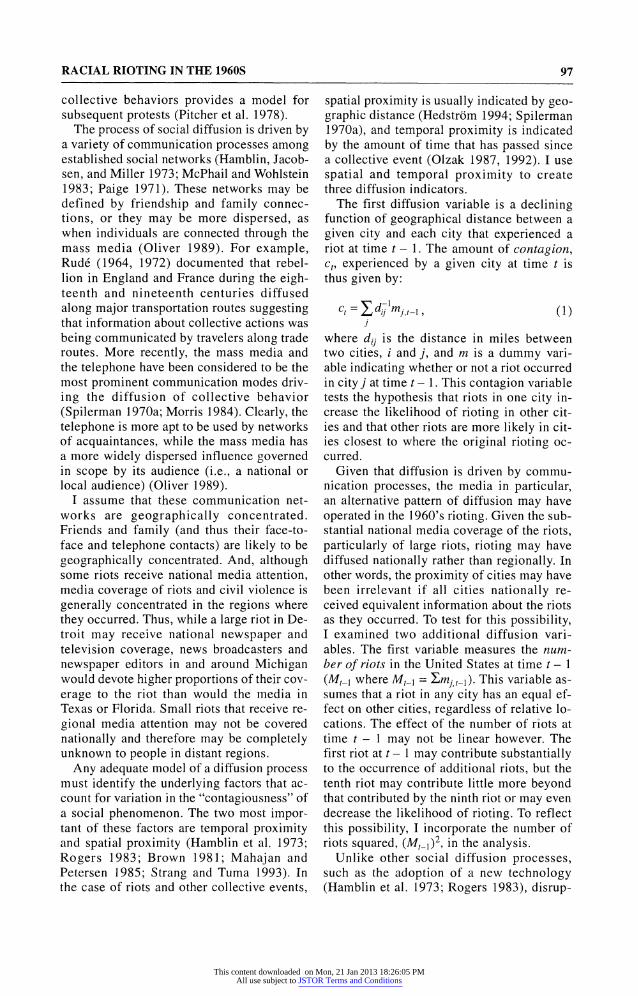
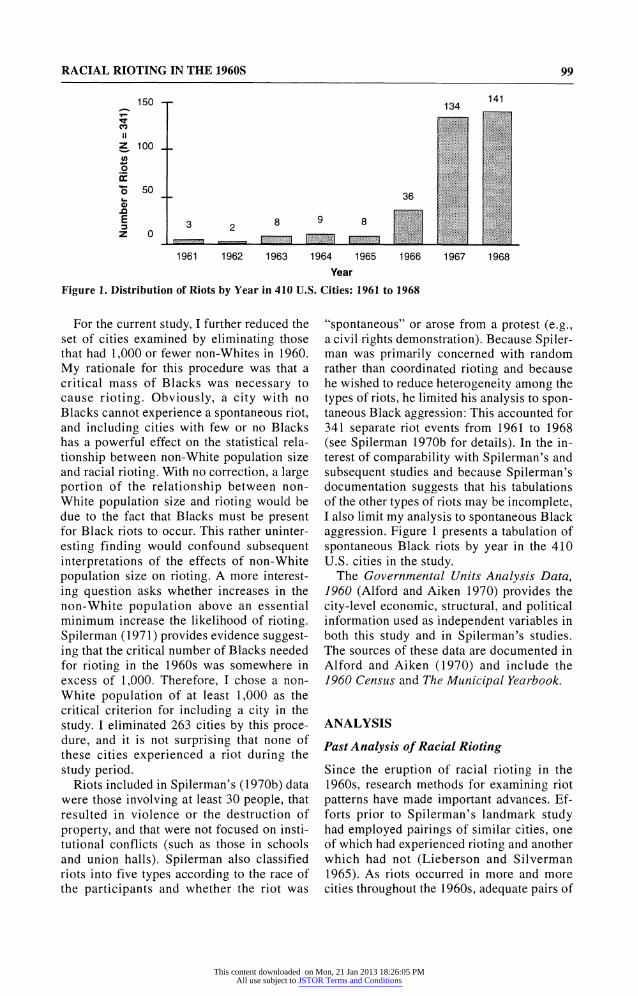
Figure 1. Distribution of Riots by Year in 410 U.S. Cities: 1961 to 1968
For the current study, I further reduced the set of cities examined by eliminating those that had 1,000 or fewer non-Whites in 1960. My rationale for this procedure was that a critical mass of Blacks was necessary to cause rioting. Obviously, a city with no Blacks cannot experience a spontaneous riot, and including cities with few or no Blacks has a powerful effect on the statistical rela- tionship between non-White population size and racial rioting. With no correction, a large portion of the relationship between non- White population size and rioting would be due to the fact that Blacks must be present for Black riots to occur. This rather uninter- esting finding would confound subsequent interpretations of the effects of non-White population size on rioting. A more interest- ing question asks whether increases in the non-White population above an essential minimum increase the likelihood of rioting. Spilerman (1971) provides evidence suggest- ing that the critical number of Blacks needed for rioting in the 1960s was somewhere in excess of 1,000. Therefore, I chose a non- White population of at least 1,000 as the critical criterion for including a city in the study. I eliminated 263 cities by this proce- dure, and it is not surprising that none of these cities experienced a riot during the study period.
Riots included in Spilerman's (1970b) data were those involving at least 30 people, that resulted in violence or the destruction of property, and that were not focused on insti- tutional conflicts (such as those in schools and union halls). Spilerman also classified riots into five types according to the race of the participants and whether the riot was
"spontaneous" or arose from a protest (e.g., a civil rights demonstration). Because Spiler- man was primarily concerned with random rather than coordinated rioting and because he wished to reduce heterogeneity among the types of riots, he limited his analysis to spon- taneous Black aggression: This accounted for 341 separate riot events from 1961 to 1968 (see Spilerman 1970b for details). In the in- terest of comparability with Spilerman's and subsequent studies and because Spilerman's documentation suggests that his tabulations of the other types of riots may be incomplete, I also limit my analysis to spontaneous Black aggression. Figure 1 presents a tabulation of spontaneous Black riots by year in the 410 U.S. cities in the study.
The Governmental Units Analysis Data, 1960 (Alford and Aiken 1970) provides the city-level economic, structural, and political information used as independent variables in both this study and in Spilerman's studies. The sources of these data are documented in Alford and Aiken (1970) and include the 1960 Census and The Municipal Yearbook.
ANALYSIS
Past Analysis of Racial Rioting
Since the eruption of racial rioting in the 1960s, research methods for examining riot patterns have made important advances. Ef- forts prior to Spilerman's landmark study had employed pairings of similar cities, one of which had experienced rioting and another which had not (Lieberson and Silverman 1965). As riots occurred in more and more cities throughout the 1960s, adequate pairs of
This content downloaded on Mon, 21 Jan 2013 18:26:05 PMAll use subject to JSTOR Terms and Conditions
100 AMERICAN SOCIOLOGICAL REVIEW
riot and non-riot cities matched on region and population size became increasingly dif- ficult to find. Furthermore, these paired-city studies allowed only a dichotomous classifi- cation of cities (riot or non-riot), thereby ig- noring differences among cities in which more than one riot had occurred. In response to these problems, Spilerman (1970a) took a large step forward when he used multivariate analysis in which the number of riots in a city was the dependent variable. Since that study and his subsequent examination of riot severity (Spilerman 1976), most studies have used some version of multivariate linear re- gression to examine both riot occurrence and riot severity (Carter 1986, 1990, 1992; Dot- son 1974; Jiobu 1971; McElroy and Singell 1973).
Despite the advances of the multivariate approach, the techniques used were not ide- ally suited for examining riot data. The first problem arises from using frequencies as the dependent variable. While this approach in- cludes more information than does a dichoto- mous indicator, it nonetheless represents the set of riots as more homogenous than it actu- ally is. In particular, any temporal relation- ship within the riots is ignored. That is, a dif- ferent underlying process may operate for ri- ots that are temporally clustered than for those that are spread evenly across the time period studied.
A second important shortcoming of previ- ous analyses is their inability to introduce covariates that change over time, a particu- larly difficult problem when attempting to understand diffusion processes (Olzak 1992). Faced with such a limitation, Spilerman (1970a) selected one major riot incident and attempted to discern geographic diffusion ef- fects. Although his results did not support geographic diffusion, the method itself makes the results unconvincing. In addition to limiting the analysis to only one incident, Spilerman also chose a large, nationally pub- licized riot (in Newark, New Jersey) as the incident hypothesized to produce diffusion. Because of the large amount of publicity as- sociated with this riot, geographic diffusion effects would be much less apparent than in the case of riots that warranted less national publicity. Furthermore, Spilerman's proce- dure ignored the possibility that a riot other than a large, nationally publicized one could
have diffusion effects. In short, to draw a le- gitimate conclusion, a comprehensive analy- sis of the data must incorporate explanatory variables that change as functions of both geographic proximity and time.
Event History Analysis
In response to some of the shortcomings of earlier approaches to rioting, I apply survival analysis or event history analysis to the data described above (Tuma and Hannan 1984; Allison 1984; Yamaguchi 1991). Rather than differentiating cities on the basis of the pres- ence or the number of riots, event history analysis focuses on the duration of time be- tween riot events for each individual city. By approaching the analysis of events in this way, researchers can examine processes that cluster differently in time and use time-vary- ing covariates to examine dynamic processes (see Olzak 1989a and 1992 for a complete discussion of using event history analysis to analyze collective action events).3 Recently, Olzak (1989b,1990, 1992; Olzak and West 1991) has successfully applied event history analysis to a number of different types of collective events, including labor strikes, eth- nic violence, lynching and the establishment of ethnic newspapers.
Formally, an event history analysis that models an event that can occur at any point in continuous time specifies the instanta- neous rate of transition from one state to an- other; it is defined as
A(t) = lim P(t ? T<t+ At It< T At--->o At
where T is the time of the event and A(t) is the hazard rate. In other words, the instanta- neous hazard rate (the hazard rate at a given instant) is a function of the probability that an event will occur between t and t + At, given that it has not yet occurred at time t. In this study, this hazard rate is the instanta- neous probability that a riot will occur in a given city, given that the city is not rioting as it enters the time point in question.
3 As in many studies, limitations in the current data prevent broad application of time-varying covariates. Therefore, time-varying variables are limited to the control variable for prior rioting and the variables critical to representing diffusion processes.
This content downloaded on Mon, 21 Jan 2013 18:26:05 PMAll use subject to JSTOR Terms and Conditions
RACIAL RIOTING IN THE 1960S 101
I model the hazard of rioting using the pro- portional hazards model and estimate param- eters using the method of partial-likelihood (Cox 1972).4 Parameters are estimated using an ordinary maximization routine such as the Newton-Raphson algorithm by maximizing
- S.
I exp[ J&Xik (ti )] j
PL Y k ---
IL Xexp[XfPkXk (0)]
where t1 is the time of occurrence of either an event or censoring, the Pls are coefficients es- timating the effects of the k hypothesized ex- planatory variables, and 3i is a dummy vari- able that indicates whether the event associ- ated with case i was censored (8i = 0) or was a failure (3i = 1). The coefficients generated are most readily understood by interpreting eP (the hazard ratio) as the amount by which the hazard is multiplied for each unit increase in the related independent variable.
In event history analysis, the effects of un- observed heterogeneity must be carefully considered (Allison 1984; Yamaguchi 1991). Of particular concern here is the lack of in- dependence among repeated observations made on the same city that occurs when all sources of inter-city dependence are not ac- counted for in the estimated models. Because it is impossible to know if all relevant vari- ables have been included, unobserved hetero- geneity usually introduces a downward bias in standard error estimates. In the data stud- ied here, 76 cities experienced more than one spontaneous Black-initiated riot (up to a maximum of 11 in Chicago), therefore the present analysis is highly susceptible to this problem.
Many methods have been suggested to cor- rect for bias introduced by unobserved het- erogeneity in survival analysis (Allison 1984; Flinn and Heckman 1982a, 1982b; Heckman and Singer 1982, 1984; Yamaguchi 1986; Tuma 1985; Trussell and Richards 1985). Of these, a number of general methods require
assumptions either about the distribution of unobserved characteristics or the functional form of the baseline hazard; none of which are tenable for the present analysis. There- fore, I correct for unobserved heterogeneity by incorporating a control variable: the num- ber of prior riots that have occurred in a city. Including variables that represent the prior history of the individual city is a practical procedure which minimizes the effects due to correlation within the same city and does not demand the restrictive assumptions of more general methods (Allison 1984).5
RESULTS
Spilerman 's Analysis Revisited: Disorganization, Deprivation, and Political Structure
Spilerman's (1970a) analysis of riot fre- quency led him to draw a number of conclu- sions about propensities to riot. In summary, he found that non-White population size and region (south versus non-south) were by far the most powerful predictors of riot fre- quency. These two variables subsumed near- ly all the effects of the variables represent- ing social disorganization, deprivation, and political structure arguments. He concluded that ". . . the racial disturbances of the 1960s were not responses to conditions in the local community," and that non-White population size was really the only relevant variable: "[T]he larger the Negro population, the greater the likelihood of a disorder. Little else appears to matter" (p. 645).
Tables 1 and 2 present analyses that paral- lel those conducted by Spilerman (1970a). Table 1 reiterates a portion of Spilerman's Table 6, reporting the increments in the vari- ance of riot frequency explained. It also pre- sents an event history analysis analogous to Spilerman's. I tested the same variables ac-
4 For the basics of survival analysis and par- tial-likelihood estimation see Tuma and Hannan (1984), Cox (1972), Allison (1984), and Yama- guchi (1991). Details on the application of event history and partial likelihood to the riot data used herein are available from the author.
5 False duration dependence due to different risk levels among unidentified strata within the sample also can arise in survival analysis. How- ever, this problem is not relevant here because the approach to repeated events does not allow the membership of the population at risk to vary over time. Details regarding this issue as well as alter- native methods considered for controlling unob- served heterogeneity in the riot data are available from the author.
This content downloaded on Mon, 21 Jan 2013 18:26:05 PMAll use subject to JSTOR Terms and Conditions
102 AMERICAN SOCIOLOGICAL REVIEW
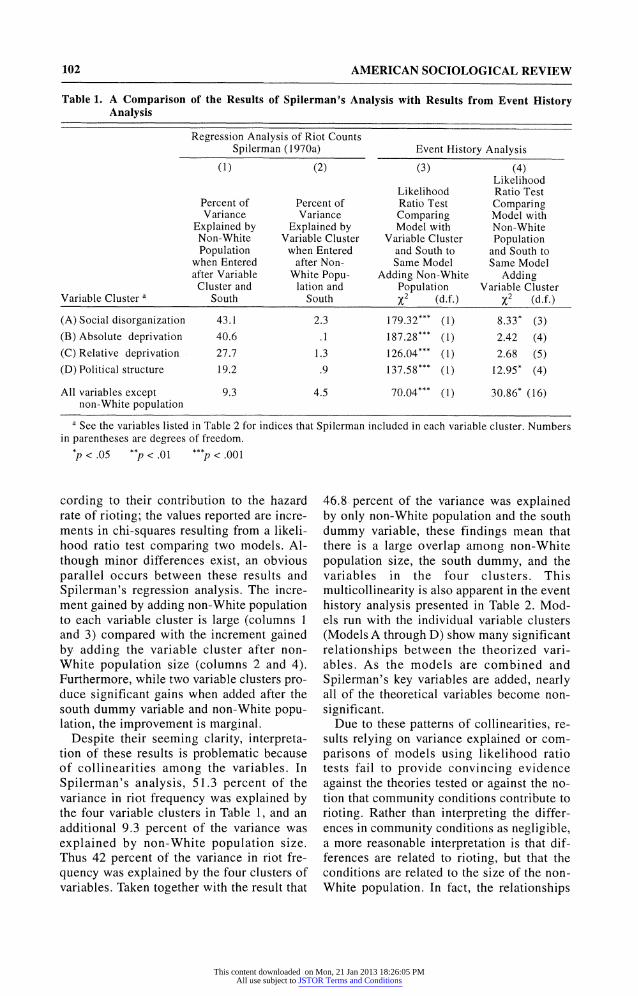
Table 1. A Comparison of the Results of Spilerman's Analysis with Results from Event History Analysis
Regression Analysis of Riot Counts Spilerman (1970a) Event History Analysis
(1) (2) (3) (4) Likelihood
Likelihood Ratio Test Percent of Percent of Ratio Test Comparing Variance Variance Comparing Model with
Explained by Explained by Model with Non-White Non-White Variable Cluster Variable Cluster Population Population when Entered and South to and South to
when Entered after Non- Same Model Same Model after Variable White Popu- Adding Non-White Adding
Cluster and lation and Population Variable Cluster Variable Cluster a South South x2 (d.f.) x2 (d.f.)
(A) Social disorganization 43.1 2.3 179.32*** (1) 8.33* (3) (B) Absolute deprivation 40.6 .1 187.28*** (1) 2.42 (4)
(C) Relative deprivation 27.7 1.3 126.04*** (1) 2.68 (5)
(D) Political structure 19.2 .9 137.58*** (1) 12.95* (4)
All variables except 9.3 4.5 70.04*** (1) 30.86* (16) non-White population
a See the variables listed in Table 2 for indices that Spilerman included in each variable cluster. Numbers in parentheses are degrees of freedom.
* .05 **< .01 ***< .001
cording to their contribution to the hazard rate of rioting; the values reported are incre- ments in chi-squares resulting from a likeli- hood ratio test comparing two models. Al- though minor differences exist, an obvious parallel occurs between these results and Spilerman's regression analysis. The incre- ment gained by adding non-White population to each variable cluster is large (columns 1 and 3) compared with the increment gained by adding the variable cluster after non- White population size (columns 2 and 4). Furthermore, while two variable clusters pro- duce significant gains when added after the south dummy variable and non-White popu- lation, the improvement is marginal.
Despite their seeming clarity, interpreta- tion of these results is problematic because of collinearities among the variables. In Spilerman's analysis, 51.3 percent of the variance in riot frequency was explained by the four variable clusters in Table 1, and an additional 9.3 percent of the variance was explained by non-White population size. Thus 42 percent of the variance in riot fre- quency was explained by the four clusters of variables. Taken together with the result that
46.8-percent of the variance was explained by only non-White population and the south dummy variable, these findings mean that there is a large overlap among non-White population size, the south dummy, and the variables in the four clusters. This multicollinearity is also apparent in the event history analysis presented in Table 2. Mod- els run with the individual variable clusters (Models A through D) show many significant relationships between the theorized vari- ables. As the models are combined and Spilerman's key variables are added, nearly all of the theoretical variables become non- significant.
Due to these patterns of collinearities, re- sults relying on variance explained or com- parisons of models using likelihood ratio tests fail to provide convincing evidence against the theories tested or against the no- tion that community conditions contribute to rioting. Rather than interpreting the differ- ences in community conditions as negligible, a more reasonable interpretation is that dif- ferences are related to rioting, but that the conditions are related to the size of the non- White population. In fact, the relationships
This content downloaded on Mon, 21 Jan 2013 18:26:05 PMAll use subject to JSTOR Terms and Conditions
RACIAL RIOTING IN THE 1960S 103
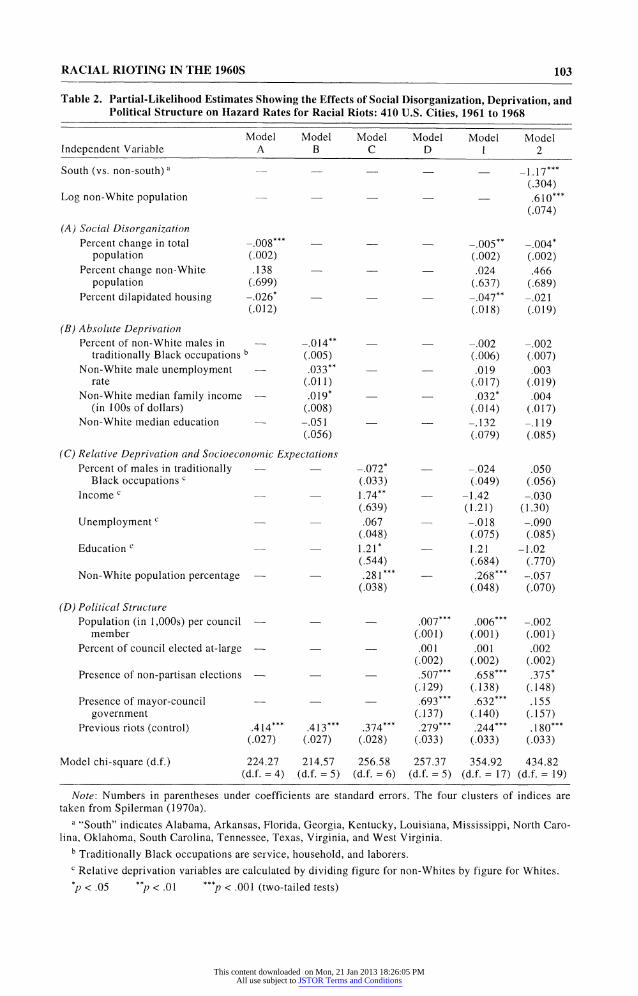
Table 2. Partial-Likelihood Estimates Showing the Effects of Social Disorganization, Deprivation, and Political Structure on Hazard Rates for Racial Riots: 410 U.S. Cities, 1961 to 1968
Model Model Model Model Model Model Independent Variable A B C D 1 2
South (vs. non-south) a - 1.17 *** (.304)
Log non-White population .610*** (.074)
(A) Social Disorganization Percent change in total -.008*** - -.005** -.004*
population (.002) (.002) (.002) Percent change non-White .138 .024 .466
population (.699) (.637) (.689) Percent dilapidated housing -.026* -.047** -.021
(.012) (.018) (.019)
(B) Absolute Deprivation Percent of non-White males in -.014** -.002 -.002
traditionally Black occupations b (.005) (.006) (.007) Non-White male unemployment .033** - .019 .003
rate (.011) (.017) (.019) Non-White median family income .019* .032* .004
(in 100s of dollars) (.008) (.014) (.017) Non-White median education -.051 -.132 -.119
(.056) (.079) (.085)
(C) Relative Deprivation and Socioeconomic Expectations Percent of males in traditionally -.072* -.024 .050
Black occupations C (.033) (.049) (.056) Income - 1.74** -1.42 -.030
(.639) (1.21) (1.30) Unemployment C - .067 -.018 -.090
(.048) (.075) (.085) Education - 1.21* - 1.21 -1.02
(.544) (.684) (.770) Non-White population percentage - .281*** - .268*** --.057
(.038) (.048) (.070)
(D) Political Structure Population (in 1,000s) per council -- .007*** .006*** -.002
member (.001) (.001) (.001) Percent of council elected at-large - .001 .001 .002
(.002) (.002) (.002) Presence of non-partisan elections - .507*** .658*** .375*
(.129) (.138) (.148) Presence of mayor-council .693*** .632*** .155
government (.137) (.140) (.157) Previous riots (control) ,414*** ,413*** .374*** .279*** .244*** .180***
(.027) (.027) (.028) (.033) (.033) (.033)
Model chi-square (d.f.) 224.27 214.57 256.58 257.37 354.92 434.82 (d.f. = 4) (d.f. = 5) (d.f. = 6) (d.f. = 5) (d.f. = 17) (d.f. = 19)
Note: Numbers in parentheses under coefficients are standard errors. The four clusters of indices are taken from Spilerman (1970a).
a "South" indicates Alabama, Arkansas, Florida, Georgia, Kentucky, Louisiana, Mississippi, North Caro- lina, Oklahoma, South Carolina, Tennessee, Texas, Virginia, and West Virginia.
b Traditionally Black occupations are service, household, and laborers. C Relative deprivation variables are calculated by dividing figure for non-Whites by figure for Whites.
n<.05 "n <.01 "p < .001 (two-tailed tests)
This content downloaded on Mon, 21 Jan 2013 18:26:05 PMAll use subject to JSTOR Terms and Conditions
104 AMERICAN SOCIOLOGICAL REVIEW
between the non-White population size and the various city characteristics are them- selves of considerable theoretical interest.
In the end, the comparison reported in Table 1 does little to either refute or validate the theories tested. It is the pattern of coeffi- cients associated with the theoretical vari- ables in Table 2 that provides evidence against the structural and deprivation theo- ries examined by Spilerman. In each theo- retical cluster, some significant coefficients are in the predicted direction, but others are not. Across the four clusters approximately one-half of the theoretical variables produce coefficients with signs opposite those which the theories would have predicted. Because none of the four theories finds reasonable support in the data, alternative explanations must be pursued.
Competition Models
To test intergroup competition perspectives, I adopted variables to indicate three central notions of competition models: economic af- fects of Blacks, general economic factors. and minority group migration. First, I in- clude non-White unemployment rates and raw numbers of non-Whites unemployed as indicators of labor market competition out- comes that affect primarily Blacks. Both variables are predicted to have positive rela- tionships with riot risk. Although non-White unemployment rate is often used in such analyses, I introduce the absolute number of unemployed non-Whites because it may have different effects in cities where the unem- ployment rate is the same. Larger numbers of unemployed non-Whites may make the unemployed segment of the group more vis- ible and thus exacerbate feelings of competi- tion with other groups.
The general economic factors included are the median manufacturing worker's wage and the overall unemployment rate. Higher manufacturing wages signal a growing econ- omy, which according to competition theory would reduce competition and thereby re- duce intergroup collective conflict. Unem- ployment indicators are predicted to have positive effects on rioting.
Minority group migration is represented by two variables, percent foreign-born and the change in non-White population from 1950
to 1960. Both variables increase the level of competition for jobs in labor market seg- ments occupied by Blacks and thus are pre- dicted to have positive effects on rioting.
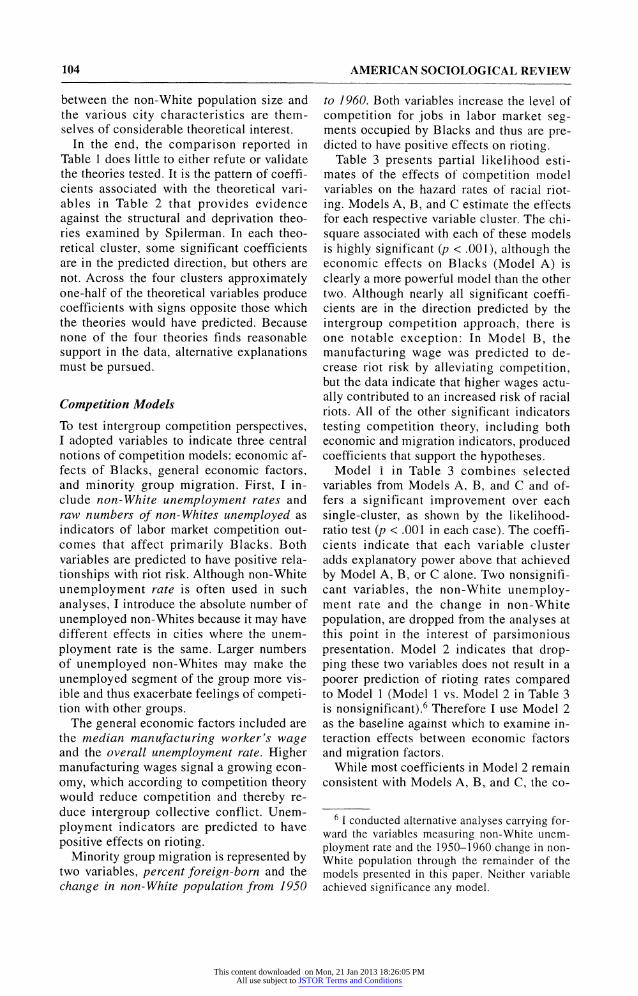
Table 3 presents partial likelihood esti- mates of the effects of competition model variables on the hazard rates of racial riot- ing. Models A, B, and C estimate the effects for each respective variable cluster. The chi- square associated with each of these models is highly significant (p < .001), although the economic effects on Blacks (Model A) is clearly a more powerful model than the other two. Although nearly all significant coeffi- cients are in the direction predicted by the intergroup competition approach, there is one notable exception: In Model B, the manufacturing wage was predicted to de- crease riot risk by alleviating competition, but the data indicate that higher wages actu- ally contributed to an increased risk of racial riots. All of the other significant indicators testing competition theory, including both economic and migration indicators, produced coefficients that support the hypotheses.
Model 1 in Table 3 combines selected variables from Models A, B, and C and of- fers a significant improvement over each single-cluster, as shown by the likelihood- ratio test (p < .001 in each case). The coeffi- cients indicate that each variable cluster adds explanatory power above that achieved by Model A, B, or C alone. Two nonsignifi- cant variables, the non-White unemploy- ment rate and the change in non-White population, are dropped from the analyses at this point in the interest of parsimonious presentation. Model 2 indicates that drop- ping these two variables does not result in a poorer prediction of rioting rates compared to Model I (Model I vs. Model 2 in Table 3 is nonsignificant).6 Therefore I use Model 2 as the baseline against which to examine in- teraction effects between economic factors and migration factors.
While most coefficients in Model 2 remain consistent with Models A, B, and C, the co-
6 I conducted alternative analyses carrying for- ward the variables measuring non-White unem- ployment rate and the 1950-1960 change in non- White population through the remainder of the models presented in this paper. Neither variable achieved significance any model.
This content downloaded on Mon, 21 Jan 2013 18:26:05 PMAll use subject to JSTOR Terms and Conditions
RACIAL RIOTING IN THE 1960S 105
Table 3. Partial-Likelihood Estimates Showing the Effects of Competition Variables on Hazard Rates for Racial Riots: 410 U.S. Cities, 1961 to 1968
Model Model Model Model Model Model Independent Variable A B C 1 2 3
(A) Economic Effects on Blacks Non-White unemployment rate -.005 .002
(.012) (.014)
Ln of number of non-White .497*** .504*** .500*** .629*** unemployed (in lOGOs) (.037) (.039) (.038) (.059)
(B) General Economic Factors Median manufacturing wage .029* .028*** 029*** .0268**
(in lOs of dollars) (.007) (.008) (.008) (.008)
Unemployment rate - .0838** -.088* -.085* -.090* (.030) (.042) (.035) (.035)
(C) Minority Group Migration Change in non-White population, -.574 .313
1950-1960 (in 1,OOOs) (.628) (.560)
Percent foreign-born - 048*** .029 * .030** .026* (.010) (.01 1) (.01 1) (.01 1)
Ln non-White unemployed x - - - -.016** percent foreign-born (.0055)
Prior rioting (control) .214*** .430*** .399*** .188*** .188*** .205*** (.031) (.026) (.027) (.032) (.032) (.033)
Model chi-square (d.f.) 359.86 208.25 202.04 387.26 386.96 395.32 (d.f. = 3) (d.f. = 3) (d.f. = 3) (d.f. = 7) (d.f. =5) (d.f. = 6)
Likelihood Ratio Tests Chi-Square d.f.
Model A vs. Model 1 27.40** 4
Model B vs. Model 1 179.01*** 4
Model C vs. Model 1 185.22*** 4
Model 1 vs. Model 2 .30 2
Model 2 vs. Model 3 8.36*** 1
Note: Numbers in parentheses under coefficients are standard errors.
*p < .05 ** < .01 ***p < .001 (two-tailed tests)
efficient for the general unemployment rate becomes negative in Model 2, indicating that lower unemployment leads to increased riot- ing. It is apparent that the change in sign re- sults from adding the (In) number of non- White unemployed to Model B. Thus, the coefficient for the general unemployment rate in Model 2 represents its independent effect when holding non-White unemploy- ment constant, an effect that must be due largely to White unemployment. While gen- eral unemployment may produce the rela- tionship predicted by competition theory,
singling out White unemployment reveals a completely different effect.
I also examined a series of interaction ef- fects suggested by competition theory. I ex- amine interactions between economic con- traction and migration because the effect of migration on rioting should differ at varying levels of economic contraction. Specifically, when the economy is faring poorly, migra- tion into a city should have greater effects on competition and violence than when the economy is healthy. Thus, I predict a posi- tive coefficient for interactions between the
This content downloaded on Mon, 21 Jan 2013 18:26:05 PMAll use subject to JSTOR Terms and Conditions
106 AMERICAN SOCIOLOGICAL REVIEW
unemployment variables and the migration variables, and a negative coefficient for the interaction between manufacturing wages and the migration variables.
In general, the data do not support the theory in this respect. Of the three possible interactions, two (unemployment rate x per- cent foreign-born and manufacturing wage x percent foreign-born) do not achieve statisti- cal significance (results not shown). Further, the one significant interaction term (In num- ber of non-Whites unemployed x percent for- eign-born) is in the opposite direction of that predicted. The negative coefficient indicates that increases in the percentage of immi- grants has a lower effect on rioting when non-White unemployment is high and a greater effect when Black unemployment is low. The coefficients for the model contain- ing this significant interaction term is pre- sented in Model 3 in Table 3. Instead of these economic and migration variables compoun- ding each other, the effect of one appears to attenuate the effect of the other, thereby sup- pressing the main effects of both. In sum, however, the interaction effects I have exam- ined contribute little to the prediction or ex- planation of racial rioting.
Diffusion of Rioting
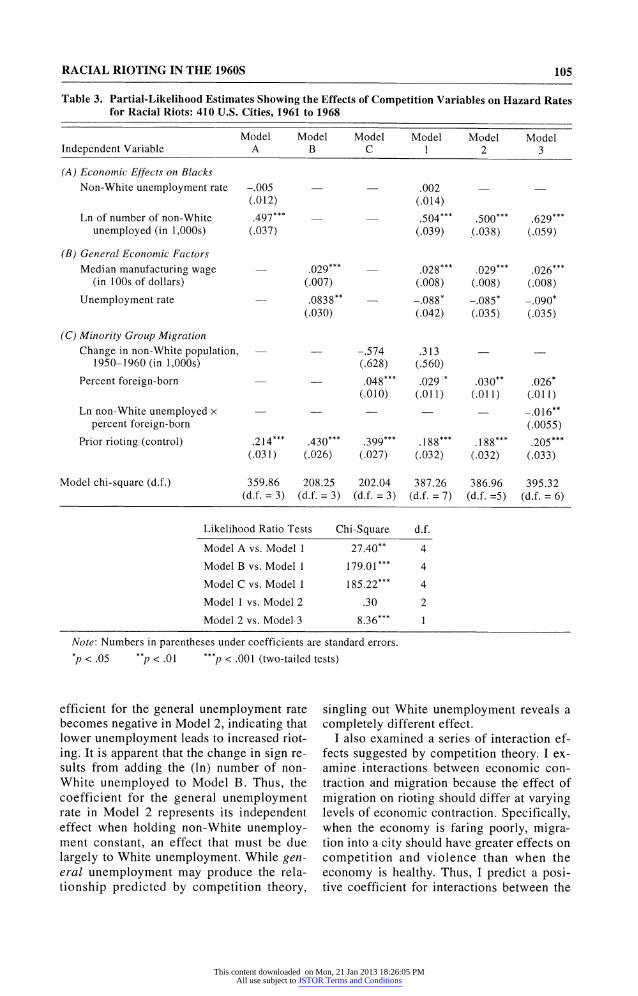
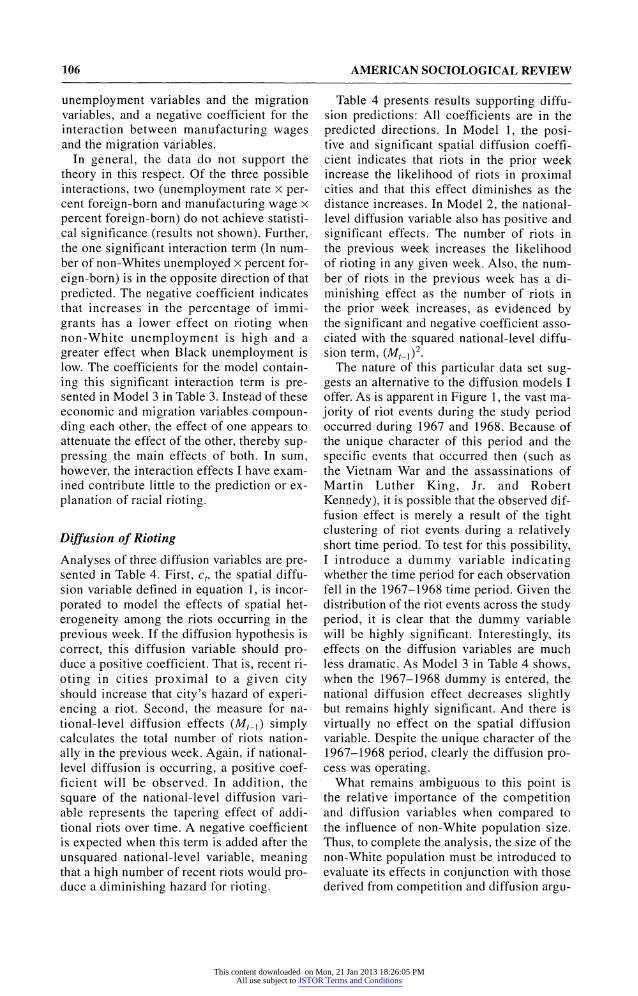
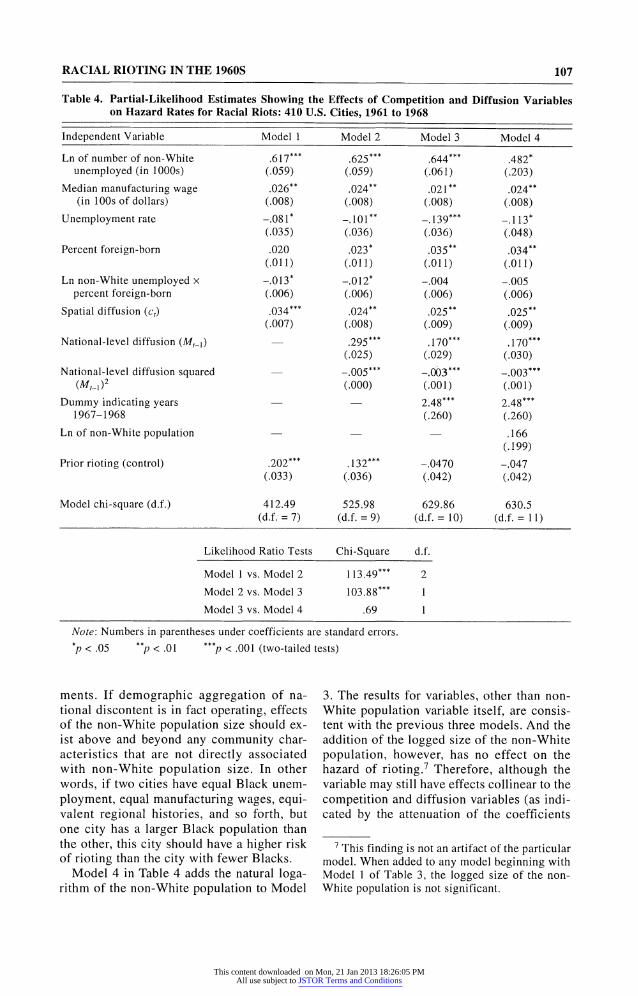
Analyses of three diffusion variables are pre- sented in Table 4. First, c,, the spatial diffu- sion variable defined in equation 1, is incor- porated to model the effects of spatial het- erogeneity among the riots occurring in the previous week. If the diffusion hypothesis is correct, this diffusion variable should pro- duce a positive coefficient. That is, recent ri- oting in cities proximal to a given city should increase that city's hazard of experi- encing a riot. Second, the measure for na- tional-level diffusion effects (Mti) simply calculates the total number of riots nation- ally in the previous week. Again, if national- level diffusion is occurring, a positive coef- ficient will be observed. In addition, the square of the national-level diffusion vari- able represents the tapering effect of addi- tional riots over time. A negative coefficient is expected when this term is added after the unsquared national-level variable, meaning that a high number of recent riots would pro- duce a diminishing hazard for rioting.
Table 4 presents results supporting diffu- sion predictions: All coefficients are in the predicted directions. In Model 1, the posi- tive and significant spatial diffusion coeffi- cient indicates that riots in the prior week increase the likelihood of riots in proximal cities and that this effect diminishes as the distance increases. In Model 2, the national- level diffusion variable also has positive and significant effects. The number of riots in the previous week increases the likelihood of rioting in any given week. Also, the num- ber of riots in the previous week has a di- minishing effect as the number of riots in the prior week increases, as evidenced by the significant and negative coefficient asso- ciated with the squared national-level diffu- sion term, (Mt-1)2.
The nature of this particular data set sug- gests an alternative to the diffusion models I offer. As is apparent in Figure 1, the vast ma- jority of riot events during the study period occurred during 1967 and 1968. Because of the unique character of this period and the specific events that occurred then (such as the Vietnam War and the assassinations of Martin Luther King, Jr. and Robert Kennedy), it is possible that the observed dif- fusion effect is merely a result of the tight clustering of riot events during a relatively short time period. To test for this possibility, I introduce a dummy variable indicating whether the time period for each observation fell in the 1967-1968 time period. Given the distribution of the riot events across the study period, it is clear that the dummy variable will be highly significant. Interestingly, its effects on the diffusion variables are much less dramatic. As Model 3 in Table 4 shows, when the 1967-1968 dummy is entered, the national diffusion effect decreases slightly but remains highly significant. And there is virtually no effect on the spatial diffusion variable. Despite the unique character of the 1967-1968 period, clearly the diffusion pro- cess was operating.
What remains ambiguous to this point is the relative importance of the competition and diffusion variables when compared to the influence of non-White population size. Thus, to complete the analysis, the size of the non-White population must be introduced to evaluate its effects in conjunction with those derived from competition and diffusion argu-
This content downloaded on Mon, 21 Jan 2013 18:26:05 PMAll use subject to JSTOR Terms and Conditions
RACIAL RIOTING IN THE 1960S 107
Table 4. Partial-Likelihood Estimates Showing the Effects of Competition and Diffusion Variables on Hazard Rates for Racial Riots: 410 U.S. Cities, 1961 to 1968
Independent Variable Model 1 Model 2 Model 3 Model 4
Ln of number of non-White .617*** .625*** .644*** .482* unemployed (in 1000s) (.059) (.059) (.061) (.203)
Median manufacturing wage .026** .024** .021** .024** (in 100s of dollars) (.008) (.008) (.008) (.008)
Unemployment rate -.081 * -.101** -. 139*** -.113* (.035) (.036) (.036) (.048)
Percent foreign-born .020 .023* .035** .034** (.01 1) (.01 1) (.01 1) (.01 1)
Ln non-White unemployed x -.013* -.012* -.004 -.005 percent foreign-born (.006) (.006) (.006) (.006)
Spatial diffusion (c,) .034*** .024** .025** .025** (.007) (.008) (.009) (.009)
National-level diffusion (M,-1) .295*** .170*** .170*** (.025) (.029) (.030)
National-level diffusion squared -.005*** -.003*** -.003*** (M_ l)2 (.000) (.001) (.001)
Dummy indicating years 2.48*** 2.48*** 1967-1968 (.260) (.260)
Ln of non-White population .166 (.199)
Prior rioting (control) .202*** .132*** -.0470 -.047 (.033) (.036) (.042) (.042)
Model chi-square (d.f.) 412.49 525.98 629.86 630.5 (d.f. = 7) (d.f. = 9) (d.f. = 10) (d.f. = 11)
Likelihood Ratio Tests Chi-Square d.f.
Model 1 vs. Model 2 113.49 2
Model 2 vs. Model 3 103.88 1
Model 3 vs. Model 4 .69 1
Note: Numbers in parentheses under coefficients are standard errors.
*p < .05 p < .01 *** < .001 (two-tailed tests)
ments. If demographic aggregation of na- tional discontent is in fact operating, effects of the non-White population size should ex- ist above and beyond any community char- acteristics that are not directly associated with non-White population size. In other words, if two cities have equal Black unem- ployment, equal manufacturing wages, equi- valent regional histories, and so forth, but one city has a larger Black population than the other, this city should have a higher risk of rioting than the city with fewer Blacks.
Model 4 in Table 4 adds the natural loga- rithm of the non-White population to Model
3. The results for variables, other than non- White population variable itself, are consis- tent with the previous three models. And the addition of the logged size of the non-White population, however, has no effect on the hazard of rioting.7 Therefore, although the variable may still have effects collinear to the competition and diffusion variables (as indi- cated by the attenuation of the coefficients
I This finding is not an artifact of the particular model. When added to any model beginning with Model 1 of Table 3, the logged size of the non- White population is not significant.
This content downloaded on Mon, 21 Jan 2013 18:26:05 PMAll use subject to JSTOR Terms and Conditions
108 AMERICAN SOCIOLOGICAL REVIEW
for non-White unemployment and general unemployment), the demographic aggrega- tion argument is not supported here because no additional effect is shown.
SUMMARY AND DISCUSSION
Contrary to the conclusions drawn by Spiler- man (1970a, 1971, 1976) in his classic stud- ies, I demonstrate that local. conditions did indeed contribute to the occurrence of racial rioting in the 1960s. The propensity to riot was a function of far more than simply the number of Blacks available for rioting in a particular city. I find strong support for argu- ments drawn from ethnic competition and conflict literature and for the existence of riot diffusion processes. Economic and migration pressures in U.S. cities created different lev- els of intergroup competition, which in turn contributed to the chances of experiencing racial riots. Once a riot broke out, that event increased the likelihood that other riots would break out elsewhere in the near future-par- ticularly in cities geographically close to the original riot. These results are robust across a variety of models, including models contain- ing very conservative control variables.
The structural strain arguments originally examined by Spilerman (1970a) again failed to find support. The arguments do not fail, however, because of the lack of significant relationships between individual variables and rioting. The variables associated with structural strain arguments actually do have important relationships with collective racial violence. Although these relationships are often obscured in multivariate analysis due to collinearity among the variables, this is not the important finding-instead, it is the lack of a coherent pattern among these vari- ables relative to any of the tested theories that stands out. Thus I do not conclude that community characteristics have no relation- ships with rioting, but rather that the rela- tionships which do exist do not form a co- herent pattern to support the specific theories Spilerman tested.
Diffusion
My conclusions regarding the diffusion of racial rioting are quite straightforward, as strong evidence emerged for both national
and regional diffusion processes. Although the definitions of diffusion I used here are robust, many questions remain regarding the exact nature of the diffusion process. First, given that the process appears to trail off quickly over a two-week period, a more de- tailed approach that examines riot data on a daily rather than on a weekly level may pro- vide a fuller picture of this dynamic process. Models incorporating various decaying func- tions of time may also be useful. Second, al- though the measure for proximity I used here has proven effective in other studies (Hed- strom 1994), future work should test mea- sures that recognize boundaries that may fil- ter or limit diffusion processes. Third, het- erogeneity within the diffusion phenomenon suggests interesting possibilities for model- ing diffusion. What differences among riots can cause them to contribute more or less to the diffusion process? Size, severity, amount and type of media attention, and repressive responses are all possible riot characteristics that could affect the diffusion process. Fi- nally, advances in understanding riot and col- lective action diffusion processes will also depend on learning more about the different communication processes and networks that transmit the information driving the process itself. It may be that information communi- cated through acquaintance networks has dif- ferent effects at different rates than does in- formation gained through the mass media. Furthermore, the dynamic interaction of all these possible factors suggests fascinating complexities and hypotheses for future mod- els of collective violence diffusion.
Competition
The hypotheses derived from competition theory found support here, although the in- teractions suggested by the theory were not important. A city9s median manufacturing wage does not appear at first to support com- petition notions. Because manufacturing wage is taken as an indicator of a healthy city economy, it was predicted to reduce inter- group competition and thus to decrease col- lective violence. The apparently contradic- tory finding can be explained easily if it is understood how economic conditions may effect Blacks and Whites differently. While high manufacturing wages may indicate that
This content downloaded on Mon, 21 Jan 2013 18:26:05 PMAll use subject to JSTOR Terms and Conditions
RACIAL RIOTING IN THE 1960S 109
the economy is generally strong, labor mar- ket segregation causes a strong manufactur- ing sector to benefit Whites more than Blacks. As Olzak (1992) and Thernstrom (1973) point out, Whites (both foreign-born and native-born) dominate skilled occupa- tions and expanding industries. Thus, when manufacturing wages are high, Whites dis- proportionately reap the benefits. Further- more, Olzak's analysis supports the idea that during periods of expansion, foreign-born Whites are able to move up and out of segre- gated occupations, which has the effect of increasing the concentration of Blacks in low-paid and low-prestige jobs. Thus, one can see how general economic expansion, which might be expected to lower competi- tion, could actually increase the likelihood of collective violence on the part of Blacks.
Second, while greater overall unemploy- ment would seem to indicate greater compe- tition for jobs, my analysis suggests that Black unemployment and White unemploy- ment have very different effects on rioting, particularly in segregated labor markets. While White unemployment may cause more White aggression against Blacks, and Black unemployment can be expected to cause more Black aggression against Whites, it is much less reasonable to expect that White unemployment would cause Black aggres- sion. Thus, overall unemployment must be decomposed by race to make sense of its ef- fects on the 1960s rioting. If unemployment is viewed as an outcome of losing to corn- petitors in the market place, then Black un- employment, not White unemployment, would be expected to increase Black collec- tive violence.
Non-White Population Size and Unemployment
In this study, the combination of competition and diffusion provides a model that most co- herently accounts for differences in riot risks among U.S. cities in the 1960s. This model is superior to models using structural-strain variables and to a model dependent only on non-White population size. The competition/ diffusion model is superior to the non-White population size argument because it illumi- nates theoretical explanations for rioting. The notion of demographic aggregation or
opportunity (via non-White population size) as the sole source of rioting variability is not supported because increases in population size do not increase riot propensity beyond that of other explanatory variables. Clearly, the argument that 1960s rioting was an es- sentially random process once the demo- graphic aggregation of potential rioters was controlled is not adequate.
A detailed stepwise examination of Model 4 in Table 4 reveals that one of the main vari- ables superseding the size of the non-White population variable is the number of non- Whites unemployed in a given city. In this analysis, regardless of the percent unem- ployed, it is the number unemployed that has the most powerful effect on riot rates. Three tempting interpretations come to mind. The first is that the non-White unemployment rate is simply a proxy for the non-White population size. While this interpretation is partially true and clearly plausible in the case of cities with similar unemployment rates but different numbers of Blacks (those with higher populations will experience higher rates of rioting), the interpretation breaks down when Black unemployment rates vary. Under such circumstances, cities with larger Black populations and lower unemployment rates could have lower raw numbers of un- employed Blacks than some cities with smal- ler Black populations and higher Black un- employment rates. Given the results pre- sented here, the cities with larger Black populations would experience less rioting than cities with smaller Black populations, a result which is exactly the opposite of what would be predicted from the proxy argument.
The position I take, however, is not that the size of the Black population is unimportant to riot rates. In fact, the models presented in Table 4 demonstrate that the number of non- Whites unemployed and the size of the non- White population are collinear with regard to their ability to predict rioting. Nevertheless, the parameter estimate for the number of un- employed non-Whites is significant, indicat- ing that there are important differences in riot rates that cannot be explained simply by the overlap between these two variables.
A second interpretation of the relationship between the numbers of non-White unem- ployed and riot rates is that rioting requires biographical availability, and the unem-
This content downloaded on Mon, 21 Jan 2013 18:26:05 PMAll use subject to JSTOR Terms and Conditions
110 AMERICAN SOCIOLOGICAL REVIEW
ployed, given the lack of demands on their time, are the most available segment of the population. While biographical availability has proven to be an extremely useful variable in social movement and collective behavior research (particularly with regard to student protest movements), it is less useful in this context. Many studies conducted on riot par- ticipants have found no significant differ- ences in employment status between rioters and non-rioters. For example, Opp (1989) found that unemployment had no relationship to illegal protest and a negative relationship to legal protest. Similar relationships have been found in a number of surveys of partici- pants and nonparticipants of the 1960s riots (Rodgers and Bullock 1974; Caplan 1970; Mason and Murtagh 1985). Furthermore, many studies have established that urban ri- ots occur "at times when (e.g., after working hours or on weekends) people are available" (McPhail 1994:9; also see McPhail and Mil- ler 1973; Burbeck, Raine, and Stark 1978). Because the unemployed are not constrained by working hours, their availability for riot- ing is continual. Therefore, if the unemployed were largely responsible for rioting, this tem- poral pattern of rioting would not exist.
A third explanation of the importance of non-White unemployment to rioting reasons that the unemployed are the most discontent and therefore would be the more likely than the employed to lash out in violence. Again evidence that the unemployed no more con- stitute the body of rioters than they do the general population contradicts this explana- tion. Furthermore, few studies have estab- lished any attitudinal differences between those who participate in riots and those who do not (Rodgers and Bullock 1974).
In short, the reason that the number of un- employed is so important to riot rates is not presently clear. It may be that even though the unemployed are not overrepresented among riot participants, they may be over- represented among those who initiate rioting. If this were true, biographical availability, severe discontent, or both could be operat- ing. On the other hand, it may be that higher numbers of unemployed Blacks make Blacks' economic problems highly visible and thus highly salient. Such a condition would increase the likelihood of riots inde- pendent of biographical availability or par-
ticipation by the unemployed specifically. At present, available empirical data are not ad- equate to assess these two possibilities. This study, however, strongly suggests that the role of unemployment is one key to under- standing riot outbreaks, and that further re- search should focus on determining exactly how unemployment contributes to civil un- rest.
Daniel Myers is a Ph.D. candidate in Sociology at the University of Wisconsin-Madison. His re- search interests include collective violence, for- inal models of collective action, game theory, and media coverage of protest activity. His disserta- tion research focuses on developing and testing models of the diffusion of collective violence.
REFERENCES
Alford, Robert and Michael Aiken. 1970. Gov- ernmental Units Analysis, 1960 [MRDF]. Uni- versity of Wisconsin, Data and Program Li- brary Service, Madison, WI.
Allison, Paul D. 1984. Event History Anahlysis: Regression for Longitudinal Event Data. New- bury Park, CA: Sage Publications.
Berkowitz, Leonard. 1968. "The Study of Urban Violence: Some Implications of Laboratory Studies of Frustration and Aggression." Ameri- can Behavioral Scientist 2:14-17.
Bonacich, Edna. 1972. "A Theory of Ethnic An- tagonism: The Split Labor Market." American Sociological Review 37:547-59.
Brown, Lawrence A. 1981. Innovation Diffusion: A New Perspective. London, England: Meth- uen.
Bryan, Marguerite. 1979. "The Social Psychology of Riot Participation." Research in Race and Ethnic Relations 1: 169-89.
Burbeck, Stephen L., Walter J. Raine, and M. J. Abudu Stark. 1978. "The Dynamics of Riot Growth: An Epidemiological Approach." Jour- nal of Mathematical Sociology 6:1-22.
Caplan, Nathan. 1970. "The New Ghetto Man: A Review of Recent Empirical Studies." Journal of Social Issues 26:59-73.
Carter, Gregg Lee. 1986. "The 1960s Black Riots Revisited: City Level Explanations of Their Se- verity." Sociological Inquiry 210-28.
1990. "Collective Violence and the Prob- lem of Group Size in Aggregate-Level Stud- ies." Sociological Focus 23:287-300.
.1992. "Hispanic Rioting During the Civil Rights Era." Sociological Forum 7:301-22.
Cox, D. R. 1972. "Regression Models and Life Tables." Journal of the Royal Statistical Soci- ety Series B 34:187-202.
Diekmann, Andreas. 1979. "A Dynamic Stochas-
This content downloaded on Mon, 21 Jan 2013 18:26:05 PMAll use subject to JSTOR Terms and Conditions
RACIAL RIOTING IN THE 1960S 111
tic Version of the Pitcher-Hamblin-Miller Model of 'Collective Violence."' Journal of Mathematical Sociology 6:277-82.
Dotson, A. Bruce. 1974. "Social Planning and Urban Violence: An Extension of McElroy and Singell." Urban Affairs Quarterly 9:283-301.
Downes, Bryan T. 1968. "Social and Political Characteristics of Riot Cities: A Comparative Study." Social Science Quarterly 49:504-20.
Flinn, Christopher J. and James J. Heckman. 1982a. "Models for the Analysis of Labor Force Dynamics." Advances in Econometrics 1:35-95.
. 1982b. "New Methods for Analyzing In- dividual Event Histories." Sociological Meth- odology 11:99-140.
Gurr, Ted R. 1968. "Urban Disorder: Perspectives from the Comparative Study of Civil Strife." American Behavioral Scientist 2:50-55.
. 1970. Why Men Rebel. Princeton, NJ: Princeton University Press.
Hamblin, Robert L., R. Brooke Jacobsen, and Jerry L. L. Miller. 1973. A Mathematical Theory of Social Change. New York: John Wiley and Sons.
Heckman, James J. and Burton Singer. 1982. "The Identification Problem in Economic Mod- els for Duration Data." Pp. 35-95 in Advances in Econometrics, edited by J. Hildebrand. Cam- bridge, England: Cambridge University Press.
. 1984. "A Method for Minimizing the Im- pact of Distributional Assumptions in Econo- metric Models for Duration Data." Econo- metrica 52:271-320.
Hedstr6m, Peter. 1994. "Contagious Collectivi- ties: On the Spatial Diffusion of Swedish Trade Unions, 1890-1940." American Journal of So- ciology 99:1157-79.
Heskin, Ken. 1985. "Political Violence in North- ern Ireland." Journal of Psychology, 119:481- 94.
Jenkins, J. Craig and Craig M. Eckert. 1986. "Channeling Black Insurgency: Elite Patronage and Professional Social Movement Organiza- tions in the Development of the Black Move- ment." American Sociological Review 51:812- 29.
Jiobu, Robert M. 1971. "City Characteristics and Racial Violence." Social Science Quarterly 55:52-64.
Kelly, William R. and Larry Isaac. 1984. "The Rise and Fall of Urban Racial Violence in the U.S.: 1948-1979." Research in Social Move- ments Conflict and Change 7:203-33.
Koomen, Willem and Erik G. Frankel. 1992. "Ef- fects of Experienced Discrimination and Dif- ferent Forms of Relative Deprivation among Surinamese, a Dutch Ethnic Minority Group." Journal of Community and Applied Social Psy- chology 2:63-7 1.
Koopmans, Ruud. 1993. "The Dynamics of Pro- test Waves: West Germany, 1965 to 1989." American Sociological Review 58:637-58.
Lichbach, Mark. 1985. "Protest: Random or Con- tagious: The Postwar United Kingdom." Armed Forces and Society 11: 581-608.
Lieberson, Stanley. 1980. A Piece of the Pie: Blacks and White Immigrants since 1880. Ber- keley, CA: University of California Press.
Lieberson, Stanley and Arnold R. Silverman. 1965. "The Precipitants and Underlying Con- ditions of Race Riots." American Sociological Review 30:887-98.
Mahajan, Vijay and Robert A. Peterson. 1985. Models for Innovation Diffusion. Beverly Hills, CA: Sage Publications.
Mason, David T. and Jerry A. Murtagh. 1985. "Who Riots? An Empirical Examination of the 'New Urban Black' versus the Social Margin- ality Hypotheses." Political Behavior 7:352- 73.
McAdam, Doug. 1982. Political Process and the Development of Black Insurgency, 1930-1970. Chicago, IL: University of Chicago Press.
McElroy, Jerome L. and Larry D. Singell. 1973. "Riot and Nonriot Cities: An Examination of Structural Contours." Urban Affairs Quarterly 8:28 1-302.
McPhail, Clark. 1991. The Myth of the Madding Crowd. New York: DeGruyter.
. 1994. "Presidential Address-The Dark Side of Purpose: Individual and Collective Vio- lence in Riots." The Sociological Quarterly 35:1-32.
McPhail, Clark and David L. Miller. 1973. "The Assembling Process: A Theoretical and Em- pirical Examination." American Sociological Review 38:721-35.
McPhail, Clark and Ronald T. Wohistein. 1983. "Individual and Collective Behavior within Gatherings, Demonstrations and Riots." An- nual Review of Sociology 9:579-600.
Morris, Aldon D. 1984. The Origins of Civil Rights Movement: Black Communities Orga- nizing for Change. New York: Free press.
National Advisory Commission on Civil Disor- ders. 1968. Report of the National Advisory Commission on Civil Disorders. New York: Bantam Books.
Nielsen, Francois. 1985. "Toward a Theory of Ethnic Solidarity in Modern Societies." Ameri- can Sociological Review 50:133-49.
Oberschall, Anthony. 1978. "The Decline of the 1960s Social Movements." Research In Social Movements, Conflict and Change 1:257-89.
Oliver, Pamela E. 1989. "Bringing the Crowd Back In: The Nonorganizational Elements of Social Movements." Research in Social Move- ments, Conflict and Change 1 1:1-30.
Olzak, Susan. 1987. "Causes of Ethnic Protest
This content downloaded on Mon, 21 Jan 2013 18:26:05 PMAll use subject to JSTOR Terms and Conditions
112 AMERICAN SOCIOLOGICAL REVIEW
and Conflict in Urban America, 1877-1889." Social Science Research 16:185-210.
. 1989a. "Analysis of Events in the Study of Collective Action." Annual Review of Soci- ology 15:119-41.
. 1989b. "Labor Unrest, Immigration, and Ethnic Conflict in Urban America, 1880-1914." American Journal of Sociology 94: 1303-33.
. 1990. "The Political Context of Competi- tion: Lynching and Urban Racial Violence, 1882-1914." Social Forces 69:395-421.
. 1992. The Dynamics of Ethnic Competi- tion and Conflict. Stanford, CA: Stanford Uni- versity Press.
Olzak, Susan and Joane Nagel. 1986. Competitive Ethnic Relations. Orlando, FL: Academic.
Olzak, Susan and Suzanne Shanahan. 1996. "Dep- rivation Race Riots: An Extension of Spiler- man's Analysis." Social Forces 74:931-61.
Olzak, Susan and Elizabeth West. 1991. "Ethnic Conflict and the Rise and Fall of Ethnic News- papers." American Sociological Review 56: 458-74.
Opp, Karl-Dieter. 1989. The Rationality of Politi- cal Protest: A Comparative Analysis of Ratio- nal Choice Theory. Boulder, CO: Westview.
Paige, Jeffrey M. 1971. "Political Orientation and Riot Participation." American Sociological Re- view 36:810-20.
Park, Robert. 1950. Race and Culture. Glencoe, IL: Free Press.
Pitcher, Brian L., Robert L. Hamblin, and Jerry L. L. Miller. 1978. "Diffusion of Collective Violence." American Sociological Review 43: 23-35.
Polletta, Francesca. 1992. "Politicizing Child- hood: The 1980 Zurich Burns Movement." So- cial Text 33:82-102.
Rodgers, Harrell R. and Charles S. Bullock III. 1974. "Political and Racial Attitudes: Black versus White." Journal of Black Studies 4:463- 85.
Rogers, Everett M. 1983. Diffusion of Innova- tions. New York: Free Press.
Rud6, George. 1964. The Crowd in History: A Study of Popular Disturbances in France and England, 1730-1848. New York: Wiley.
.1972. Europe in the Eighteenth Century: Aristocracy and the Bourgeois Challenge. New York: Praeger.
Schneider, Hans Joachim. 1992. "Criminology of Riots." International Journal of Offender Ther- apy and Comparative Criminology 36:173-86.
Shorter, Edward and Charles Tilly. 1974. Strikes in France: 1830-1968. New York: Cambridge University Press.
Smelser, Neil. 1962. Theory of Collective Behav- ior. New York: Free Press.
Spilerman, Seymour. 1970a. "The Causes of Ra- cial Disturbances: A Comparison of Alterna- tive Explanations." American Sociological Re- view 35:627-49
. 1970b. Governmental Units Analysis Data, 1960: Urban Racial Disorders, 1961- 1968 [MRDF]. University of Wisconsin, Data and Program Library Service, Madison, WI.
. 1971. "The Causes of Racial Distur- bances: Test of an Explanation." American So- ciological Review 36:427-42.
. 1972. "Strategic Considerations in Ana- lyzing the Distribution of Racial Disturbances." American Sociological Review 37:493-99.
. 1976. "Structural Characteristics of Cit- ies and the Severity of Racial Disorders." American Sociological Review 41:771-93.
Strang, David. 1991. "Adding Social Structure to Diffusion Models: An Event History Frame- work." Sociological Methods and Research 19:324-53.
Strang, David and Nancy Brandon Tuma. 1993. "Spatial and Temporal Heterogeneity in Diffu- sion." American Journal of Sociology 99:614- 39.
Thernstrom, S. 1973. The Other Bostonians: Pov- erty and Progress in the American Metropolis, 1880-1970. Cambridge, MA: Harvard Univer- sity Press.
Tilly, Charles, Louise Tilly, and Richard Tilly. 1975. The Rebellious Century: 1830-1975. Cambridge, MA: Harvard University Press.
Tolnay, Stewart E. and E. M. Beck. 1995. A Fes- tival of Violence: An Analysis of Southern Lynchings, 1882-1930. Urbana, IL: University of Illinois Press.
Tomlinson, T. M. 1968. "The Development of a Riot Ideology among Urban Negros." Ameri- can Behavioral Scientist 11: 27-3 1.
Trussell, James and Toni Richards. 1985. "Cor- recting for Unmeasured Heterogeneity in Haz- ard models Using the Heckman-Singer Proce- dure." Sociological Methodology 14:242-76.
Tuma, Nancy Brandon. 1985. "Effects of Labor Market Structure on Job-Shift Patterns." Pp. 327-363 in Longitudinal Analysis of Labor Market Data, edited by J. J. Heckman and B. Singer. Cambridge, England: Cambridge Uni- versity Press.
Tuma,. Nancy Brandon and Michael T. Hannan. 1984. Social Dynamics: Models and Methods. San Diego, CA: Academic.
Yamaguchi, Kazuo. 1986. "Alternative App- roaches to Unobserved Heterogeneity in the Analysis of Repeatable Events." Sociological Methodology 16:213-49.
. 1991. Event History Analysis. Newbury Park, CA: Sage.
This content downloaded on Mon, 21 Jan 2013 18:26:05 PMAll use subject to JSTOR Terms and Conditions