Embed Size (px)
Citation preview

Introduction Identi�cation Empirical strategy Growth and Channels GVCs Conclusion
Trade and Growth in the Age of Global Value Chains
Carlo Altomonte∗ Laura Bonacorsi+ Italo Colantone∗
∗Bocconi University
+FEEM
2017 Conference of the Global Forum on Productivity - June 26, 2017

Introduction Identi�cation Empirical strategy Growth and Channels GVCs Conclusion
Introduction
◦ International trade and economic growth are positively related.
◦ Assessing the causal impact of trade on growth is di�cult, due toendogeneity.
◦ Since the seminal paper of Frankel and Romer (1999) several IVattempts.
(e.g. Feyrer, 2009; Felbermayr and Groschl, 2013; Pascali, 2014)
◦ However, none of these studies considers the increasing role ofGlobal Value Chains:
⇒ they exploit historical shocks for identi�cation, dating before thesurge of GVCs;
⇒ they focus solely on gross exports data, which are not informative ofthe value added contribution of each country to trade.

Introduction Identi�cation Empirical strategy Growth and Channels GVCs Conclusion
In this paper
We make 3 contributions:
1 We develop a new geography-based, time-varying instrument fortrade, exploiting:
(a) A transport technology shock: sharp increase in the maximum size ofcontainer ships in 1995-2007...
(b) ... that impacted bilateral trade �ows asymmetrically, depending on thepresence of Deep Water Ports (DWPs) across countries.
2 We exploit this novel instrument to investigate the impact of tradeon economic growth and its channels (i.e. productivity and capitaldeepening).
3 We study whether di�erences in the value-added composition ofexports have implications on growth.

Introduction Identi�cation Empirical strategy Growth and Channels GVCs Conclusion
Main �ndings
Using WIOD data for 40 countries and 34 industries, over 1995-2007, we�nd that:
◦ Our novel instrument is a good predictor of exports.
◦ Exports have a positive e�ect on income per capita growth, throughboth productivity and capital deepening.
◦ Higher growth e�ects for:
(a) countries upgrading their positioning in GVCs;
(b) countries increasing their participation to GVCs.
⇒ Key message: the extent and modalities through which a countryparticipates to GVCs matter for the trade-growth nexus.

Introduction Identi�cation Empirical strategy Growth and Channels GVCs Conclusion
Related literature
◦ Studies on the relationship between trade and growth.
[Frankel and Romer (1999); Rodriguez and Rodrik (2001); Feyrer (2009);Felbermayr and Groschl (2013); Pascali (2014)]
◦ Literature on GVCs, especially export decomposition andapplications.
[Johnson and Noguera (2012); Koopman et al. (2014); Wang et al.(2013); Nagengast and Stehrer (2015); Johnson (2014)]

Introduction Identi�cation Empirical strategy Growth and Channels GVCs Conclusion
Identi�cation

Introduction Identi�cation Empirical strategy Growth and Channels GVCs Conclusion
Overview of the identi�cation issue
◦ Frankel and Romer (1999): use geographic variables as IVs in agravity framework. Intuition: isolating the variation in bilateralexport �ows due to exogenous geographic characteristics.
◦ Critique (Rodriguez and Rodrik, 2001): geography may a�ectincome through channels other than trade => violation of theexclusion restriction.
◦ Solution: develop time-varying instruments for trade, since �xede�ects allow to control for time invariant determinants of income.
◦ Recent panel studies exploit exogenous shocks to transportationtechnology, which have an asymmetric impact on di�erent trade�ows, due to geographic characteristics (Feyrer, 2009; Pascali,2014).
◦ Our novel instrument for trade follows a similar strategy.

Introduction Identi�cation Empirical strategy Growth and Channels GVCs Conclusion
Intuition
Messina Strait, between Sicily and Calabria
Suez Canal
Northern ItalySouthern France
Ports in the area (20 km)
Messina
Villa S.G.
Gioia Tauro

Introduction Identi�cation Empirical strategy Growth and Channels GVCs Conclusion
Intuition
1980s ‐ 1990s 2000s
Possible ports of call: Messina, Gioia Tauro Possible port of call: Gioia Tauro

Introduction Identi�cation Empirical strategy Growth and Channels GVCs Conclusion
The instrument
The transportation shock is the sharp increase (more than doubling) inthe maximum size of container ships between the mid-1990s and themid-2000s.

Introduction Identi�cation Empirical strategy Growth and Channels GVCs Conclusion
The instrument
New larger ships are widely adopted: the average capacity of the worldcargo �eet doubles between 1995 and 2007.

Introduction Identi�cation Empirical strategy Growth and Channels GVCs Conclusion
The instrument
◦ The transportation shock a�ects exports towards di�erent partnercountries in a di�erent way.
◦ After 1997, the new larger ships (draft>=15m) can only accessports with depth>=16m, i.e. Deep Water Ports (DWPs).
◦ Thus, the transport shock increases exports relatively more towardspartner countries that are more endowed with DWPs.
◦ Notice: the number of DWPs in each country is �xed over time inour sample, i.e. a time-invariant geographical feature.
Introduction Identi�cation Empirical strategy Growth and Channels GVCs Conclusion
The instrument
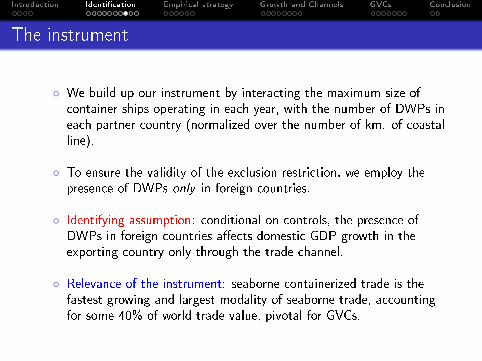
◦ We build up our instrument by interacting the maximum size ofcontainer ships operating in each year, with the number of DWPs ineach partner country (normalized over the number of km. of coastalline).
◦ To ensure the validity of the exclusion restriction, we employ thepresence of DWPs only in foreign countries.
◦ Identifying assumption: conditional on controls, the presence ofDWPs in foreign countries a�ects domestic GDP growth in theexporting country only through the trade channel.
◦ Relevance of the instrument: seaborne containerized trade is thefastest growing and largest modality of seaborne trade, accountingfor some 40% of world trade value, pivotal for GVCs.

Introduction Identi�cation Empirical strategy Growth and Channels GVCs Conclusion
The instrument
As a result of the shock, from the mid 90s a restricted group of less than100 ports (DWPs) has become increasingly relevant for world trade �ows.
Total number of
ports
Non-commercial
ports
Commercial ports
Ports with depth<13m
Ports with depth >=13 m &
Container terminal
Panamax Ports
Ports with depth>=13m
3,529 2,413
17
Source: authors' elaboration on data from Worldportsource.com and secondary sources
1,116 888
228 106
52
Ports with depth >=16 m &
Container terminal
82
Post-Panamax Deep Water Ports (DWP)
Ports with depth >=16m
Introduction Identi�cation Empirical strategy Growth and Channels GVCs Conclusion
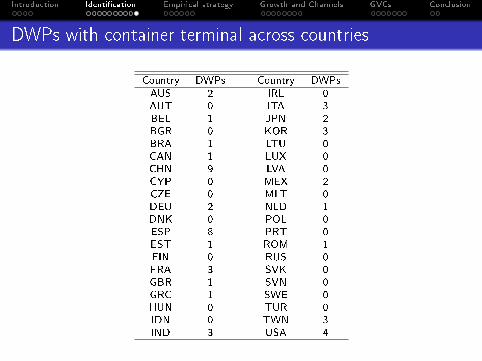
DWPs with container terminal across countries
Country DWPs Country DWPsAUS 2 IRL 0AUT 0 ITA 3BEL 1 JPN 2BGR 0 KOR 3BRA 1 LTU 0CAN 1 LUX 0CHN 9 LVA 0CYP 0 MEX 2CZE 0 MLT 0DEU 2 NLD 1DNK 0 POL 0ESP 8 PRT 0EST 1 ROM 1FIN 0 RUS 0FRA 3 SVK 0GBR 1 SVN 0GRC 1 SWE 0HUN 0 TUR 0IDN 0 TWN 3IND 3 USA 4

Introduction Identi�cation Empirical strategy Growth and Channels GVCs Conclusion
Empirical strategy

Introduction Identi�cation Empirical strategy Growth and Channels GVCs Conclusion
Empirical strategy
Our empirical strategy has three steps:
1 We estimate gravity equations for exports from country i to countryj in sector z at time t (Tijz,t),
including DWPj × ln(MaxSizet) on the RHS.
2 We then aggregate up at the exporting-country level to obtain theinstrument: PredictedTradei,t .
3 We use PredictedTradei,t as an IV in the income regressions.

Introduction Identi�cation Empirical strategy Growth and Channels GVCs Conclusion
Step 1a - Gravity à la Frankel and Romer (1999)
Separately for each industry z , we estimate:
lnTij,t = β0 + β1 lnDistij + β2Contigij + β3Landlockij + β4 lnPopi,t
+ β5 lnPopj,t + β6DWPj ∗ lnMaxSizet + Zij,tδ′ + αi + αj + αt + εij,t
Where:
- Tij,t : bilateral trade �ow from exporting country i to importing country j,in year t.
- Distij : bilateral distance.
- Contigij : dummy equal 1 for countries sharing common border.
- Landlockij : dummy equal 1 if one country in the pair is landlocked.
- Popi,t , Popj,t : home country and partner country population in year t
- DWPj ∗ ln MaxSizet =#Deep water portsjKm Coastal Linej
∗ ln MaxSizet .
- Zij,t : vector of interactions between DWPj ∗ ln MaxSizet and: distance,contiguity, landlocked, population.
- αi , αj and αt : exporter-industry, importer, and year �xed e�ects.

Introduction Identi�cation Empirical strategy Growth and Channels GVCs Conclusion
Step 1b - Gravity with Multilateral Resistance
Separately for each industry z , we estimate:
lnTij,t = β0 + β1 lnDistij + β2Contigij + β3Landlockij
+ Zij,tδ′ + αit + αjt + εij,t
Where:
- Zij,t : vector of interactions between DWPj ∗ ln MaxSizet and: distance,contiguity, landlocked, population.
- αit and αjt : exporter-year and importer-year �xed e�ects.
Notice: here DWPj ∗ ln MaxSizet (like population) is absorbed by αjt .Only the interactions are left.

Introduction Identi�cation Empirical strategy Growth and Channels GVCs Conclusion
Step 2 - Aggregation
We retrieve the instrument for trade at the country level as follows:
PredictedTradei,t =∑j
∑z
(T̂ijz,t)
Notice: In constructing the IV, one can keep or exclude �xed e�ects. Wedo both.
Introduction Identi�cation Empirical strategy Growth and Channels GVCs Conclusion
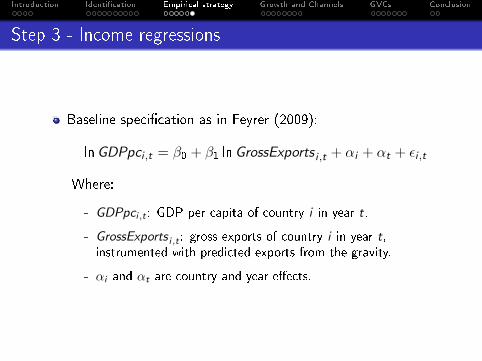
Step 3 - Income regressions
Baseline speci�cation as in Feyrer (2009):
lnGDPpci ,t = β0 + β1 lnGrossExports i ,t + αi + αt + εi ,t
Where:
- GDPpci,t : GDP per capita of country i in year t.
- GrossExports i,t : gross exports of country i in year t,instrumented with predicted exports from the gravity.
- αi and αt are country and year e�ects.

Introduction Identi�cation Empirical strategy Growth and Channels GVCs Conclusion
Results

Introduction Identi�cation Empirical strategy Growth and Channels GVCs Conclusion
Data
◦ Bilateral export data from WIOD (Timmer et al., 2015).
◦ Data cover 40 countries (and 34 industries), accounting for around85% of global trade.
◦ Value added decomposition from Wang, Wei and Zhu (2013).
◦ Time-span: 1995-2007.
Introduction Identi�cation Empirical strategy Growth and Channels GVCs Conclusion
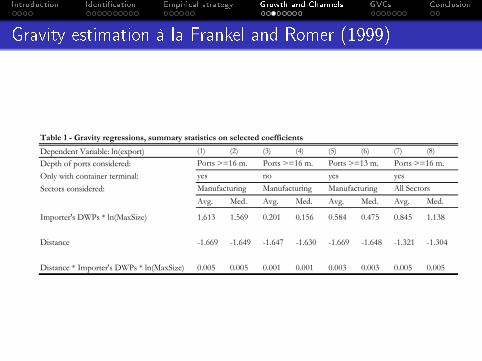
Gravity estimation à la Frankel and Romer (1999)
Dependent Variable: ln(export) (1) (2) (3) (4) (5) (6) (7) (8)
Depth of ports considered:Only with container terminal:Sectors considered:
Avg. Med. Avg. Med. Avg. Med. Avg. Med.
Importer's DWPs * ln(MaxSize) 1.613 1.569 0.201 0.156 0.584 0.475 0.845 1.138
Distance -1.669 -1.649 -1.647 -1.630 -1.669 -1.648 -1.321 -1.304
Distance * Importer's DWPs * ln(MaxSize) 0.005 0.005 0.001 0.001 0.003 0.003 0.005 0.005
Contiguity 0.549 0.582 0.560 0.602 0.545 0.580 0.617 0.578
Landlockedness -0.313 -0.151 -0.359 -0.183 -0.311 -0.150 0.200 -0.136
Contiguity*Importer's DWP*MaxSize(log) -0.004 -0.004 -0.005 -0.006 -0.002 -0.002 -0.003 -0.004
Landlockedness*Importer's DWP*MaxSize(log 0.003 0.002 0.004 0.004 0.001 0.001 0.003 0.003
yes no yes yesManufacturing Manufacturing Manufacturing All Sectors
Table 1 - Gravity regressions, summary statistics on selected coefficients
Ports >=16 m. Ports >=16 m. Ports >=13 m. Ports >=16 m.

Introduction Identi�cation Empirical strategy Growth and Channels GVCs Conclusion
Growth regressions - IV à la Frankel and Romer (1999)
Table 2 - Country growth regression
Dependent Variable: GDP p.c. (1) (2)
Gross exports 0.270*** 0.347***
[0.051] [0.061]
Estimator OLS 2SLS
Country effects yes yes
Year effects yes yes
Obs. 507 507
R2 0.82 -
First-stage results 0.642***
Predicted trade flows from country gravity - [0.092]
-Kleibergen-Paap F-Statistic 49.23
Introduction Identi�cation Empirical strategy Growth and Channels GVCs Conclusion
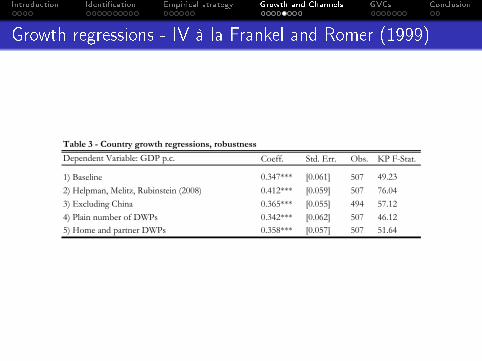
Growth regressions - IV à la Frankel and Romer (1999)
Dependent Variable: GDP p.c. Coeff. Std. Err. Obs. KP F-Stat.
1) Baseline 0.347*** [0.061] 507 49.23
2) Helpman, Melitz, Rubinstein (2008) 0.412*** [0.059] 507 76.04
3) Excluding China 0.365*** [0.055] 494 57.12
4) Plain number of DWPs 0.342*** [0.062] 507 46.125) Home and partner DWPs 0.358*** [0.057] 507 51.64
Table 3 - Country growth regressions, robustness

Introduction Identi�cation Empirical strategy Growth and Channels GVCs Conclusion
Growth regressions - IV from gravity with MRT
Dependent Variable: GDP p.c. Coeff. Std. Err. Obs. KP F-Stat.a) Including fixed effects in predicted trade
1) Baseline 0.321*** [0.029] 507 570.72) PPML estimator 0.301*** [0.024] 507 15503) Helpman, Melitz, Rubinstein (2008) 0.355*** [0.033] 507 129.44) Excluding China 0.283*** [0.029] 494 581.95) Plain number of DWPs 0.312*** [0.029] 507 556.06) Home and partner DWPs 0.321*** [0.029] 507 572.4
b) Excluding fixed effects from predicted trade
7) Baseline 0.354*** [0.079] 507 14.888) PPML estimator 0.389*** [0.086] 507 28.089) Helpman, Melitz, Rubinstein (2008) 0.244*** [0.079] 507 28.2610) Excluding China 0.355*** [0.077] 494 15.8511) Plain number of DWPs 0.294*** [0.043] 507 21.8212) Home and partner DWPs 0.355*** [0.063] 507 28.56
Table 3 - Country growth regressions
Introduction Identi�cation Empirical strategy Growth and Channels GVCs Conclusion
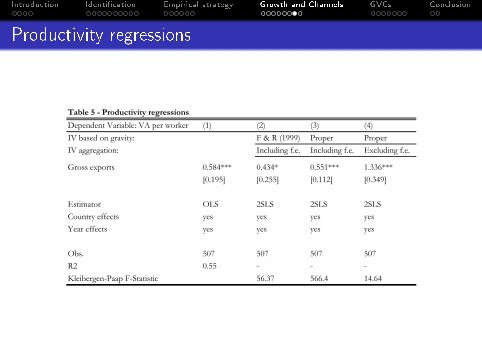
Productivity regressions
Table 5 - Productivity regressions
Dependent Variable: VA per worker (1) (2) (3) (4)
IV based on gravity: F & R (1999) Proper Proper
IV aggregation: Including f.e. Including f.e. Excluding f.e.
Gross exports 0.584*** 0.434* 0.551*** 1.336***
[0.195] [0.255] [0.112] [0.349]
Estimator OLS 2SLS 2SLS 2SLS
Country effects yes yes yes yes
Year effects yes yes yes yes
Obs. 507 507 507 507
R2 0.55 - - -
Kleibergen-Paap F-Statistic 56.37 566.4 14.64

Introduction Identi�cation Empirical strategy Growth and Channels GVCs Conclusion
Capital deepening regressions
Table 6 - Capital deepening regressions
Dependent Variable: Inv. per worker (1) (2) (3) (4)
IV based on gravity: F & R (1999) Proper Proper
IV aggregation: Including f.e. Including f.e. Excluding f.e.
Gross exports 0.183** 0.318*** 0.255*** 0.511***
[0.072] [0.084] [0.045] [0.127]
Estimator OLS 2SLS 2SLS 2SLS
Country effects yes yes yes yes
Year effects yes yes yes yes
Obs. 507 507 507 507
R2 0.72 - - -
Kleibergen-Paap F-Statistic 56.37 566.4 14.64

Introduction Identi�cation Empirical strategy Growth and Channels GVCs Conclusion
Value Added Trade

Introduction Identi�cation Empirical strategy Growth and Channels GVCs Conclusion
Export decomposition
Using Wang et al. (2013), we decompose each yearly gross export �owfrom each country -and each industry- to any partner country. Four mainterms:
Gross Exports
Domestic value-added
absorbed abroad (DVA)
Value-added first exported but eventually returned home
(RDV)
Foreign value-added
(FVA)
Pure doubled counted terms
(PDC)

Introduction Identi�cation Empirical strategy Growth and Channels GVCs Conclusion
GVC covariates
In Wang et al. (2013) FVA and PDC can be further decomposed as:
We build 3 GVC-related covariates:
◦ VS/GrossExport: vertical specialization share, i.e. overall foreign valueembodied in exports (Hummels, 2001).
◦ FVA_INT/VS : proxy for positioning, increasing as countries upgradefrom simple assembling (Wang et al., 2013).
◦ FDC/VS : proxy for participation, increasing as countries get moreembedded in GVCs (Wang et al., 2013).
Introduction Identi�cation Empirical strategy Growth and Channels GVCs Conclusion
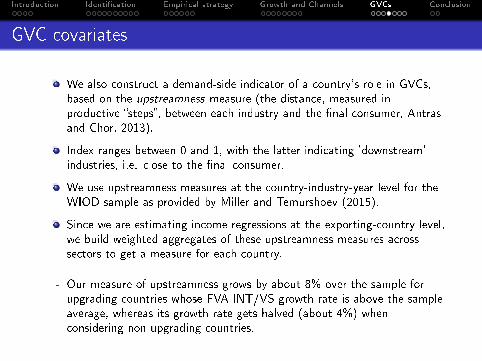
GVC covariates
We also construct a demand-side indicator of a country's role in GVCs,based on the upstreamness measure (the distance, measured inproductive �steps�, between each industry and the �nal consumer, Antrasand Chor, 2013).
Index ranges between 0 and 1, with the latter indicating 'downstream'industries, i.e. close to the �nal consumer.
We use upstreamness measures at the country-industry-year level for theWIOD sample as provided by Miller and Temurshoev (2015).
Since we are estimating income regressions at the exporting-country level,we build weighted aggregates of these upstreamness measures acrosssectors to get a measure for each country.
- Our measure of upstreamness grows by about 8% over the sample forupgrading countries whose FVA INT/VS growth rate is above the sampleaverage, whereas its growth rate gets halved (about 4%) whenconsidering non-upgrading countries.

Introduction Identi�cation Empirical strategy Growth and Channels GVCs Conclusion
Augmented growth regressions
IV Regressions - Gravity à la Frankel and Romer (1999)Dependent Variable: GDP p.c. (1) (2) (3) (4) (5)
Gross exports 0.347*** 0.419*** 0.317*** 0.512*** 0.425***[0.061] [0.085] [0.093] [0.112] [0.085]
Gross exports * Dummy high growth of VS share -0.067** -0.067** -0.094** -0.077**[0.031] [0.034] [0.038] [0.031]
Gross exports * Dummy increased participation (FDC/VS) 0.100***[0.021]
Gross exports * Dummy upgraded positioning (FVA_INT/VS) 0.138***[0.044]
Gross exports * Dummy increased upstreamness 0.046**[0.022]
Country and Year effects yes yes yes yes yesObs. 507 507 507 507 507Kleibergen-Paap F-Statistic 49.23 16.28 9.525 5.445 9.692
Table 7 - Growth and GVCs
Where GVC dummies take value 1 if growth in a given indicator is abovesample mean, at the country-level, between 1995 and 2007.
Introduction Identi�cation Empirical strategy Growth and Channels GVCs Conclusion
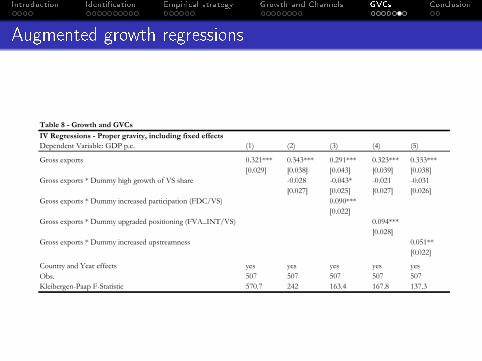
Augmented growth regressions
IV Regressions - Proper gravity, including fixed effectsDependent Variable: GDP p.c. (1) (2) (3) (4) (5)
Gross exports 0.321*** 0.343*** 0.291*** 0.323*** 0.333***[0.029] [0.038] [0.043] [0.039] [0.038]
Gross exports * Dummy high growth of VS share -0.028 -0.043* -0.021 -0.031[0.027] [0.025] [0.027] [0.026]
Gross exports * Dummy increased participation (FDC/VS) 0.090***[0.022]
Gross exports * Dummy upgraded positioning (FVA_INT/VS) 0.094***[0.028]
Gross exports * Dummy increased upstreamness 0.051**[0.022]
Country and Year effects yes yes yes yes yesObs. 507 507 507 507 507Kleibergen-Paap F-Statistic 570.7 242 163.4 167.8 137.3
Table 8 - Growth and GVCs

Introduction Identi�cation Empirical strategy Growth and Channels GVCs Conclusion
Augmented growth regressions
IV Regressions - Proper gravity, excluding fixed effectsDependent Variable: GDP p.c. (1) (2) (3) (4) (5)
Gross exports 0.354*** 0.403*** 0.336*** 0.437*** 0.335***[0.079] [0.124] [0.119] [0.143] [0.117]
Gross exports * Dummy high growth of VS share -0.048 -0.053 -0.067 -0.036[0.048] [0.047] [0.056] [0.048]
Gross exports * Dummy increased participation (FDC/VS) 0.078***[0.027]
Gross exports * Dummy upgraded positioning (FVA_INT/VS) 0.090*[0.050]
Gross exports * Dummy increased upstreamness 0.063**[0.027]
Country and Year effects yes yes yes yes yesObs. 507 507 507 507 507Kleibergen-Paap F-Statistic 14.88 5.7 3.8 2.5 4.3
Table 9 - Growth and GVCs

Introduction Identi�cation Empirical strategy Growth and Channels GVCs Conclusion
Conclusion

Introduction Identi�cation Empirical strategy Growth and Channels GVCs Conclusion
Conclusion
◦ We have developed a new instrument for trade.
◦ This exploits a recent shock to transportation technology, pivotalfor GVCs.
◦ We �nd a positive e�ect of trade on growth, through bothproductivity growth and capital deepening.
◦ The trade-growth nexus is moderated by the extent and modalitiesthrough which a country participates to GVCs.
◦ Controlling for domestic vs. foreign content of exports, strongergrowth e�ect for countries upgrading their positioning andincreasing their participation to GVCs.
◦ The instrument allows for a wide range of applications.
◦ Our results motivate further analysis on the economic e�ects ofheterogeneous value-added trade �ows.