Embed Size (px)
Citation preview
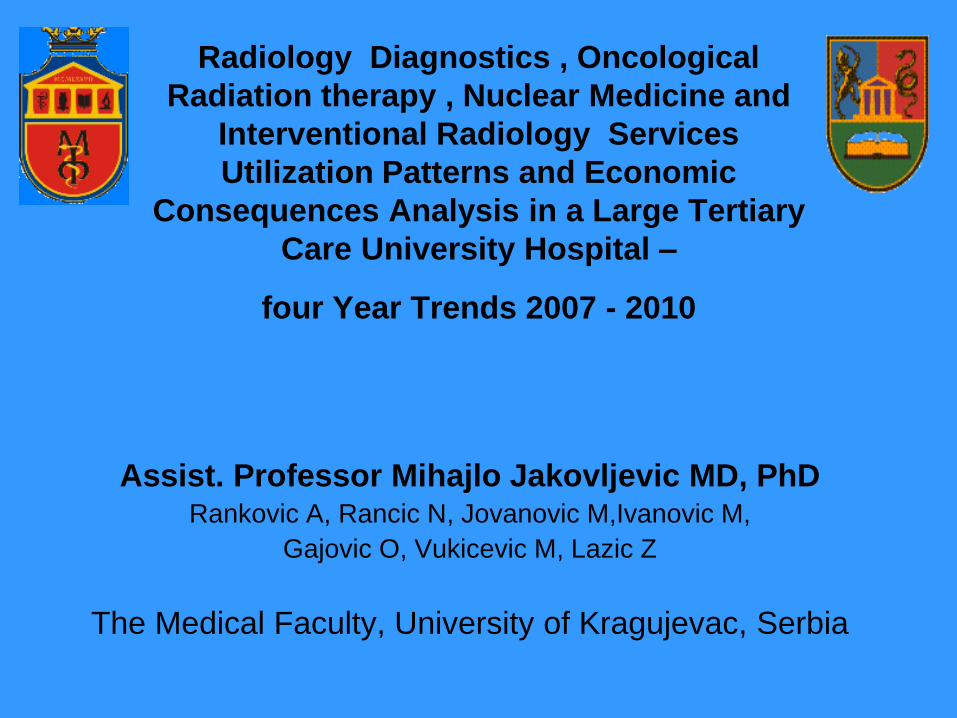
Assist. Professor Mihajlo Jakovljevic MD, PhD Rankovic A, Rancic N, Jovanovic M,Ivanovic M,
Gajovic O, Vukicevic M, Lazic Z
The Medical Faculty, University of Kragujevac, Serbia
Radiology Diagnostics , Oncological
Radiation therapy , Nuclear Medicine and
Interventional Radiology Services
Utilization Patterns and Economic
Consequences Analysis in a Large Tertiary
Care University Hospital –
four Year Trends 2007 - 2010

Short introduction to the Serbian
health care system • Serbia is upper middle income eastern European transitional economy
$11,255 (2011 estimate, Purchase Power Parity basis) (IMF)
• Total health expenditure measured in percents of gross national income 8-9% (WHO), which is significantly lower than OECD average (OECD Health Statistical Exctracts, 2010)
• Serbian national health care sector has been influenced by socialist macroeconomic milleu inherited by near past
• Public health care of state owned sector and part of private owned are financed by one main core Fund – National health Insurance Institute
• Accessibility and equity of health care are provided through compulsory and general health insurance of the employees (mostly in public sector) to all the residents regardless of their income
• Last decade package of voluntary health insurance was introduced, which means a big changes in treatment of outpatients, and cheaper services for the inpatients, contrary to the private health sector
• Health-economic assessment based decision making as a tool for resource allocation still has to pave its way among local policy makers
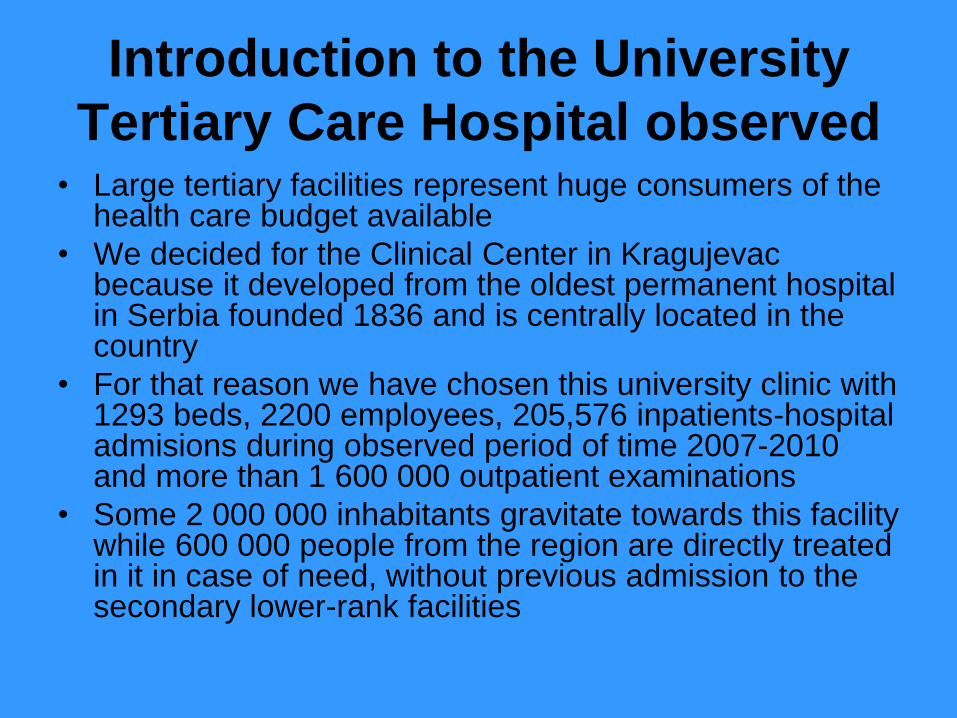
Introduction to the University
Tertiary Care Hospital observed • Large tertiary facilities represent huge consumers of the
health care budget available
• We decided for the Clinical Center in Kragujevac because it developed from the oldest permanent hospital in Serbia founded 1836 and is centrally located in the country
• For that reason we have chosen this university clinic with 1293 beds, 2200 employees, 205,576 inpatients-hospital admisions during observed period of time 2007-2010 and more than 1 600 000 outpatient examinations
• Some 2 000 000 inhabitants gravitate towards this facility while 600 000 people from the region are directly treated in it in case of need, without previous admission to the secondary lower-rank facilities
Why should we raise the issue of radiology
services consumption patterns and costs ?
• Diversity of radiological examinations and treatment options provided is increasing worldwide due to technology advances in medicine
• Impact these services impose to the contemporary hospital budgets is becoming more important than in past decades
• Health economic estimates of radiation-mediated medical procedures are seldom in literature
• This trial would be among the few ones to compare all these interventions in a large scale trial
• We need to determine and describe prescribing patterns of radiology services prescribing as core cost drivers of these departments
• It could provide insight into roots of clinical decision making process contributing to unacceptable allocation of health care resources
Material • General administrative and invoice database of clinical
center created by regular updating of goods/services consumed during outpatient and/or inpatient care provided by ward clerks from 2007-2010
• Clinical data provided by attending physicians (450 employed, mostly specialists of particular branches) from 2007-2010
• Patient hospital admission files were sorted related to final diagnosis at discharge (ICD-10 codes), other clinical and demographic features of patients (205,576 files present)
• Researchers splitted Health Insurance Fund code, so called “the blue book” , chapter with radiology-related goods and services offered, into 45 classes – allowing for an in depth analysis of utilization patterns
Methods
• An in depth, retrospective, bottom-up, trend analysis of services consumption patterns and expenses relative to diagnosis at discharge conducted from perspective of Third party payer
• The 4-year-long time span of observation 2007-2010 of the expenditure trends of the total radiologic services from the spheres of the classical radiographics, high tech imaging diagnostics, interventional radiology, radiation therapy and procedures of nuclear medicine
• By the cooperation of the clinics and departments in charge the extraction of the main database was obtained
• Analysis and interpretation of data were provided by help of radiologist, pharmacoeconomist, software engineer, mechanical engineer, statistician and few clinicians
Division of general medical care
services observed • Hospital admission
• Consultations (both
GP and specialist’s)
• Surgical Interventions
• Psychotherapeutic
techniques
• Physiatric treatment
• Pharmaceutical care
• Nursing care
• Laboratory analysis
• Patohystology ,
Cytology tests
• Dialysis provision
• Law medicine ,
Forensic services
• Other services eg
social care , transport
• Administrative
expenses
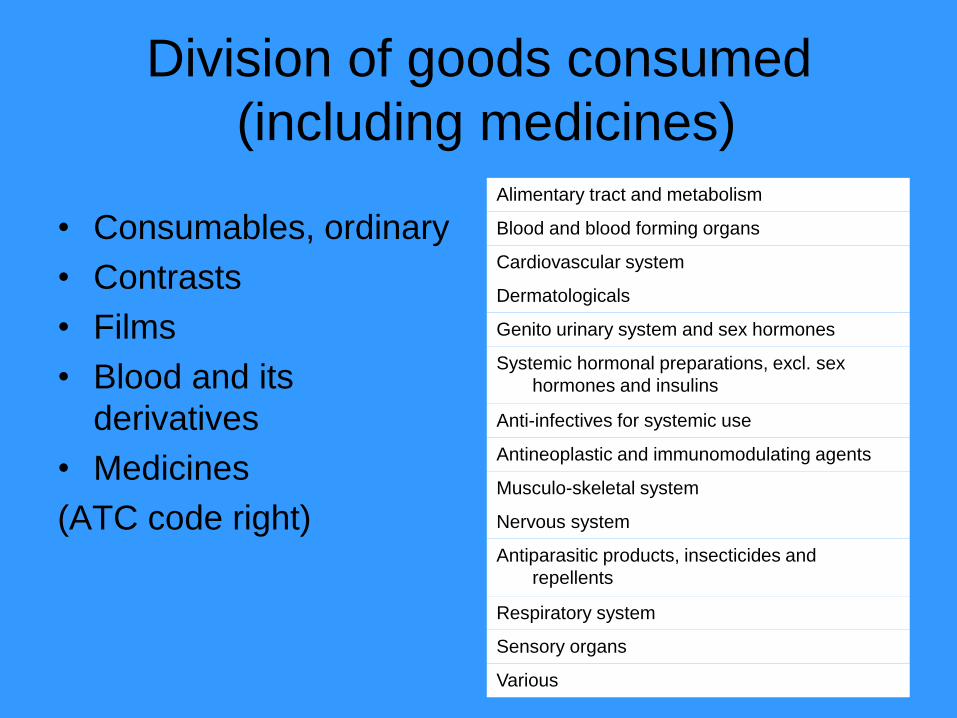
Division of goods consumed
(including medicines)
• Consumables, ordinary
• Contrasts
• Films
• Blood and its
derivatives
• Medicines
(ATC code right)
Alimentary tract and metabolism
Blood and blood forming organs
Cardiovascular system
Dermatologicals
Genito urinary system and sex hormones
Systemic hormonal preparations, excl. sex
hormones and insulins
Anti-infectives for systemic use
Antineoplastic and immunomodulating agents
Musculo-skeletal system
Nervous system
Antiparasitic products, insecticides and
repellents
Respiratory system
Sensory organs
Various
Radiology
related
Examinations
and
Treatment
Procedures
Radiology
Diagnostic
Services
Interventional
Radiology
Services
Nuclear
medicine
procedures
Radiation
Therapy
Classical
radiographics
High tech
imaging
diagnostics
*Cardial
*Vascular
*Orthopaedic
*Urological
*Neurosurgical
*Rest (invasive
procedures)
Diagnostics Treatment
Brachy
therapy
(intracavitary
applications
of emission
sources)
Teletherapy
Division of core services observed
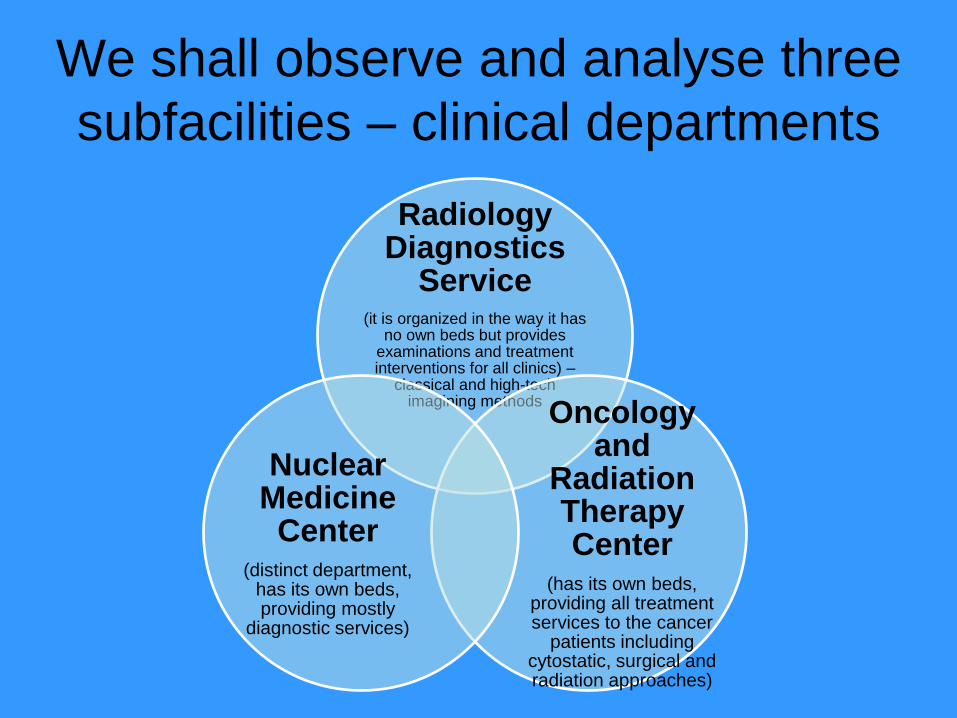
We shall observe and analyse three
subfacilities – clinical departments
Radiology Diagnostics
Service (it is organized in the way it has
no own beds but provides examinations and treatment interventions for all clinics) –
classical and high-tech imagining methods
Oncology and
Radiation Therapy Center
(has its own beds, providing all treatment services to the cancer
patients including cytostatic, surgical and radiation approaches)
Nuclear Medicine
Center (distinct department,
has its own beds, providing mostly
diagnostic services)
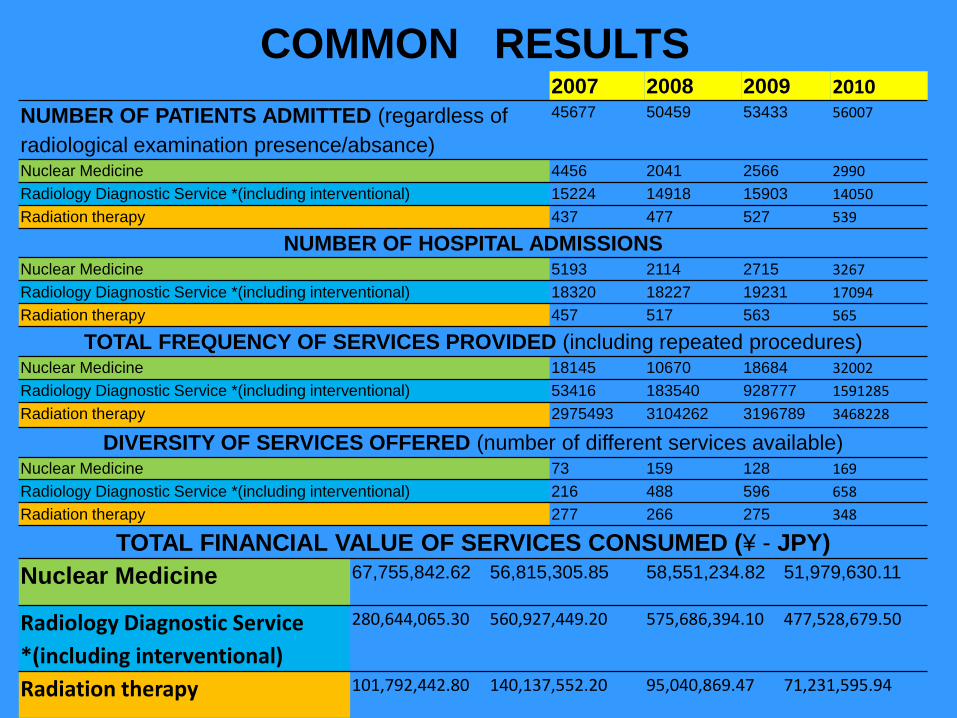
2007 2008 2009 2010
NUMBER OF PATIENTS ADMITTED (regardless of
radiological examination presence/absance)
45677 50459 53433 56007
Nuclear Medicine 4456 2041 2566 2990
Radiology Diagnostic Service *(including interventional) 15224 14918 15903 14050
Radiation therapy 437 477 527 539
NUMBER OF HOSPITAL ADMISSIONS Nuclear Medicine 5193 2114 2715 3267
Radiology Diagnostic Service *(including interventional) 18320 18227 19231 17094
Radiation therapy 457 517 563 565
TOTAL FREQUENCY OF SERVICES PROVIDED (including repeated procedures) Nuclear Medicine 18145 10670 18684 32002
Radiology Diagnostic Service *(including interventional) 53416 183540 928777 1591285
Radiation therapy 2975493 3104262 3196789 3468228
DIVERSITY OF SERVICES OFFERED (number of different services available) Nuclear Medicine 73 159 128 169
Radiology Diagnostic Service *(including interventional) 216 488 596 658
Radiation therapy 277 266 275 348
TOTAL FINANCIAL VALUE OF SERVICES CONSUMED (¥ - JPY)
Nuclear Medicine 67,755,842.62 56,815,305.85 58,551,234.82 51,979,630.11
Radiology Diagnostic Service
*(including interventional)
280,644,065.30 560,927,449.20 575,686,394.10 477,528,679.50
Radiation therapy 101,792,442.80 140,137,552.20 95,040,869.47 71,231,595.94
COMMON RESULTS
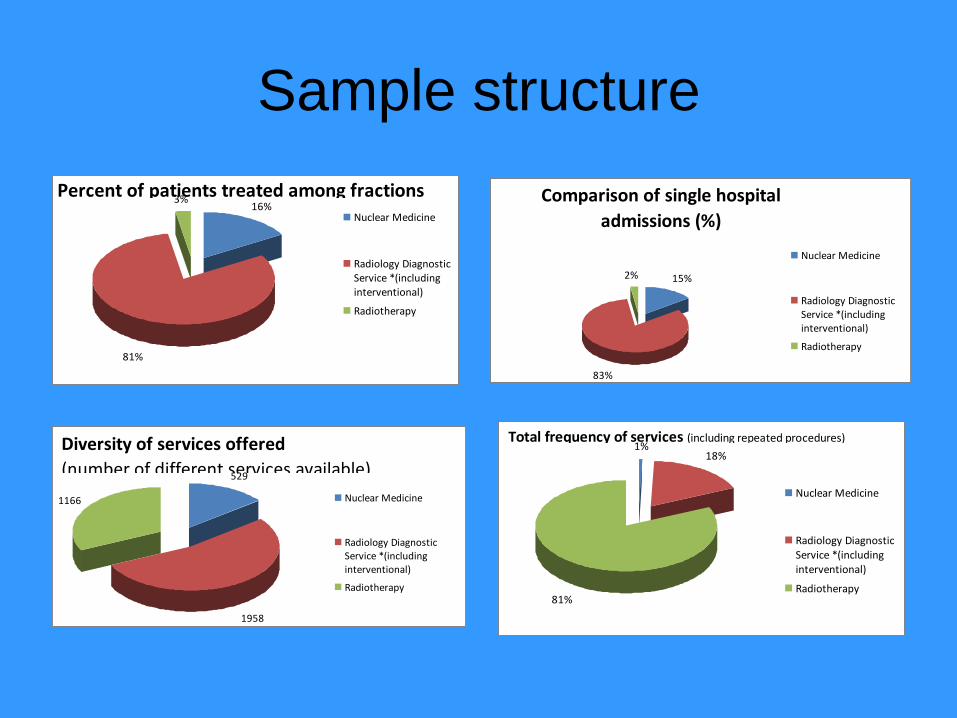
Sample structure
16%
81%
3%
Nuclear Medicine
Radiology DiagnosticService *(includinginterventional)
Radiotherapy
Percent of patients treated among fractions Comparison of single hospital
admissions (%)
15%
83%
2%
Nuclear Medicine
Radiology DiagnosticService *(includinginterventional)
Radiotherapy
529
1958
1166 Nuclear Medicine
Radiology DiagnosticService *(includinginterventional)
Radiotherapy
Diversity of services offered
(number of different services available)
1%18%
81%
Nuclear Medicine
Radiology DiagnosticService *(includinginterventional)
Radiotherapy
Total frequency of services (including repeated procedures)
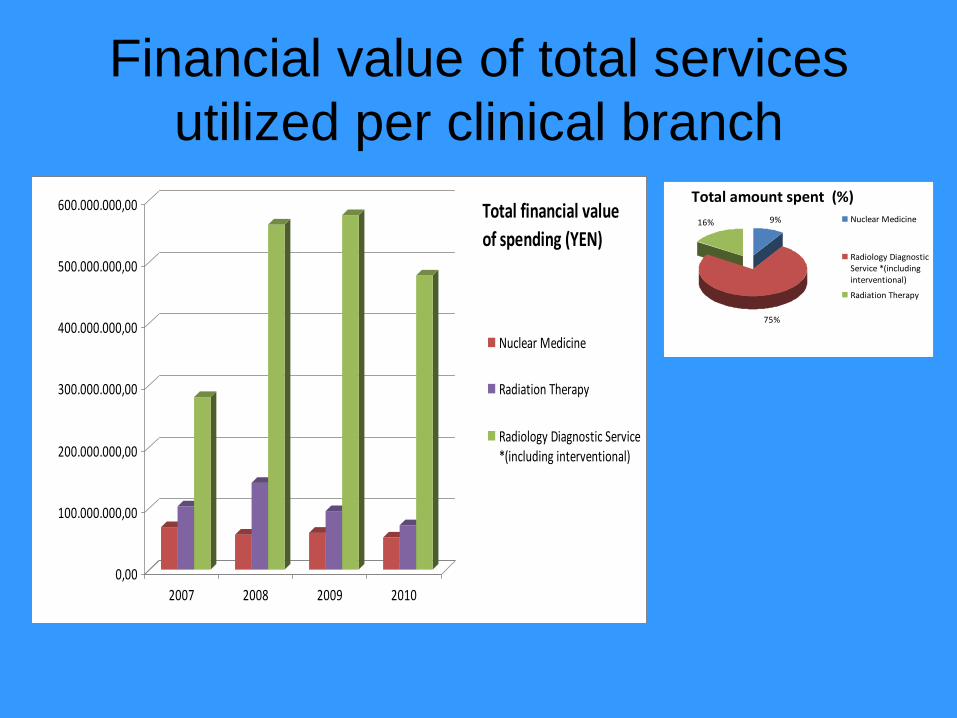
Financial value of total services
utilized per clinical branch
9%
75%
16% Nuclear Medicine
Radiology DiagnosticService *(includinginterventional)
Radiation Therapy
Total amount spent (%)
0,00
100.000.000,00
200.000.000,00
300.000.000,00
400.000.000,00
500.000.000,00
600.000.000,00
2007 2008 2009 2010
Nuclear Medicine
Radiation Therapy
Radiology Diagnostic Service*(including interventional)
Total financial value
of spending (YEN)
Radiology Diagnostics
Service
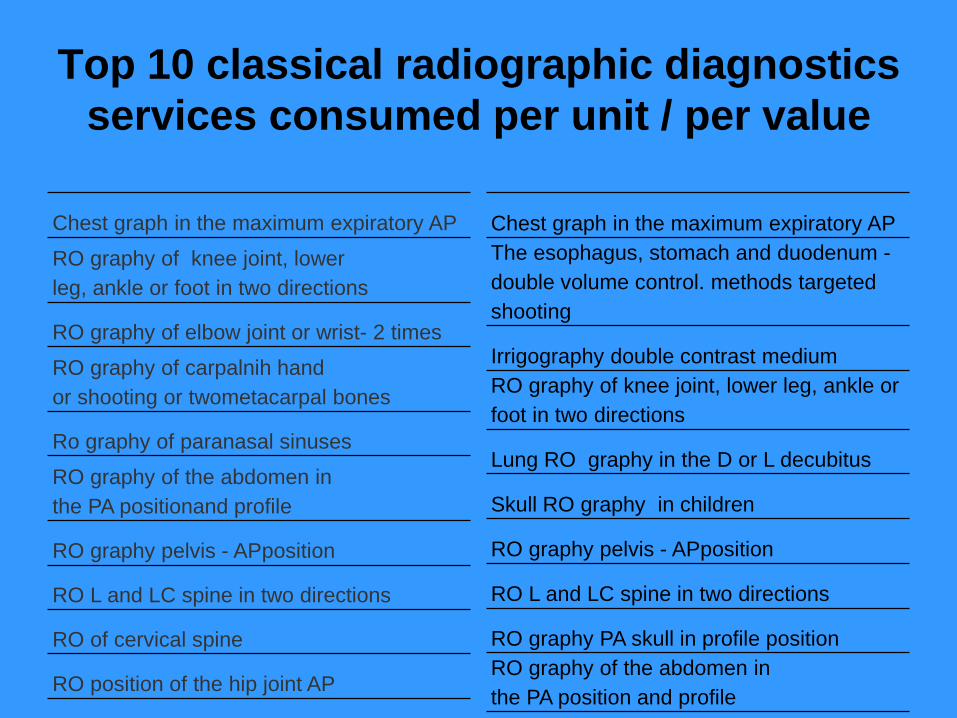
Top 10 classical radiographic diagnostics
services consumed per unit / per value
Chest graph in the maximum expiratory AP
RO graphy of knee joint, lower
leg, ankle or foot in two directions
RO graphy of elbow joint or wrist- 2 times
RO graphy of carpalnih hand
or shooting or twometacarpal bones
Ro graphy of paranasal sinuses
RO graphy of the abdomen in
the PA positionand profile
RO graphy pelvis - APposition
RO L and LC spine in two directions
RO of cervical spine
RO position of the hip joint AP
Chest graph in the maximum expiratory AP
The esophagus, stomach and duodenum -
double volume control. methods targeted
shooting
Irrigography double contrast medium
RO graphy of knee joint, lower leg, ankle or
foot in two directions
Lung RO graphy in the D or L decubitus
Skull RO graphy in children
RO graphy pelvis - APposition
RO L and LC spine in two directions
RO graphy PA skull in profile position
RO graphy of the abdomen in
the PA position and profile
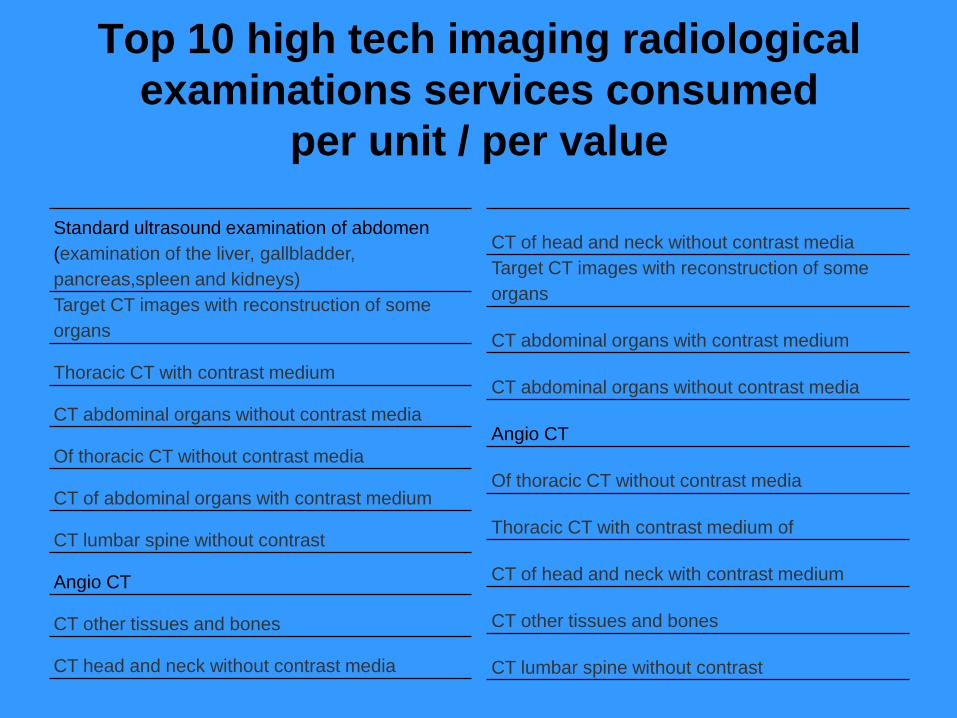
Top 10 high tech imaging radiological
examinations services consumed
per unit / per value
CT of head and neck without contrast media
Target CT images with reconstruction of some
organs
CT abdominal organs with contrast medium
CT abdominal organs without contrast media
Angio CT
Of thoracic CT without contrast media
Thoracic CT with contrast medium of
CT of head and neck with contrast medium
CT other tissues and bones
CT lumbar spine without contrast
Standard ultrasound examination of abdomen
(examination of the liver, gallbladder,
pancreas,spleen and kidneys)
Target CT images with reconstruction of some
organs
Thoracic CT with contrast medium
CT abdominal organs without contrast media
Of thoracic CT without contrast media
CT of abdominal organs with contrast medium
CT lumbar spine without contrast
Angio CT
CT other tissues and bones
CT head and neck without contrast media
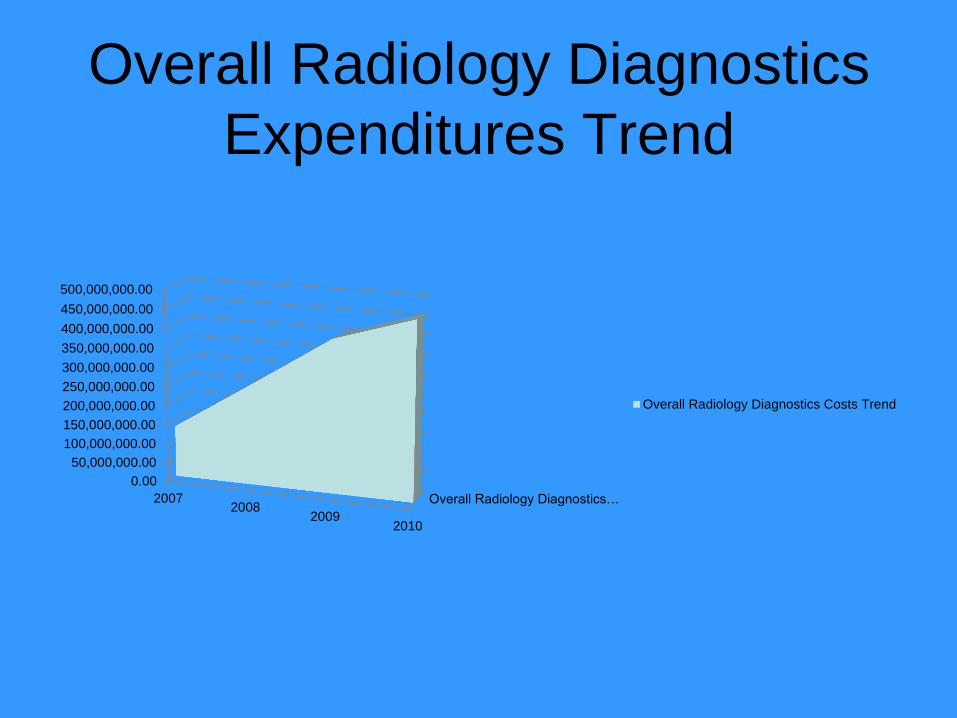
Overall Radiology Diagnostics
Expenditures Trend
Overall Radiology Diagnostics…
0.00
50,000,000.00
100,000,000.00
150,000,000.00
200,000,000.00
250,000,000.00
300,000,000.00
350,000,000.00
400,000,000.00
450,000,000.00
500,000,000.00
20072008
20092010
Overall Radiology Diagnostics Costs Trend
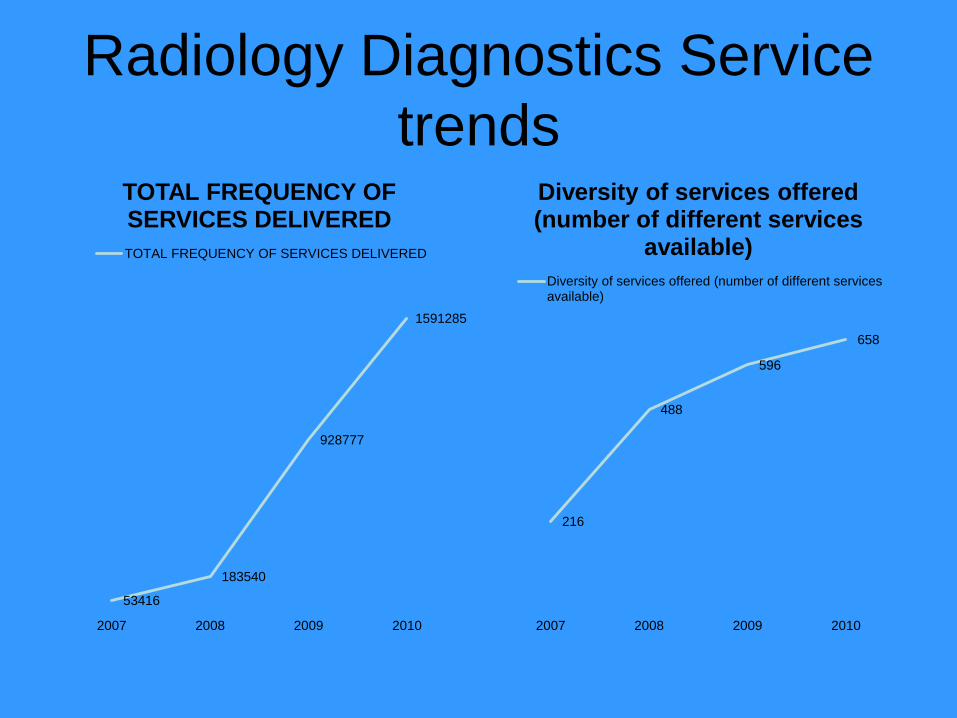
Radiology Diagnostics Service
trends
53416
183540
928777
1591285
2007 2008 2009 2010
TOTAL FREQUENCY OF SERVICES DELIVERED
TOTAL FREQUENCY OF SERVICES DELIVERED
216
488
596
658
2007 2008 2009 2010
Diversity of services offered (number of different services
available)
Diversity of services offered (number of different servicesavailable)
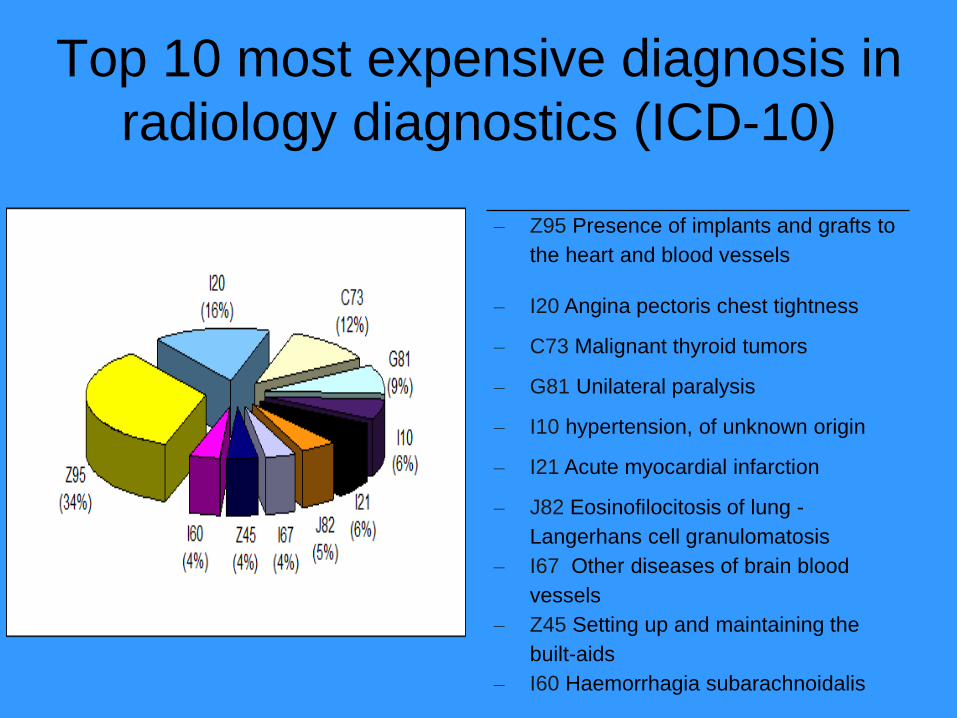
Top 10 most expensive diagnosis in
radiology diagnostics (ICD-10)
– Z95 Presence of implants and grafts to
the heart and blood vessels
– I20 Angina pectoris chest tightness
– C73 Malignant thyroid tumors
– G81 Unilateral paralysis
– I10 hypertension, of unknown origin
– I21 Acute myocardial infarction
– J82 Eosinofilocitosis of lung -
Langerhans cell granulomatosis
– I67 Other diseases of brain blood
vessels
– Z45 Setting up and maintaining the
built-aids
– I60 Haemorrhagia subarachnoidalis
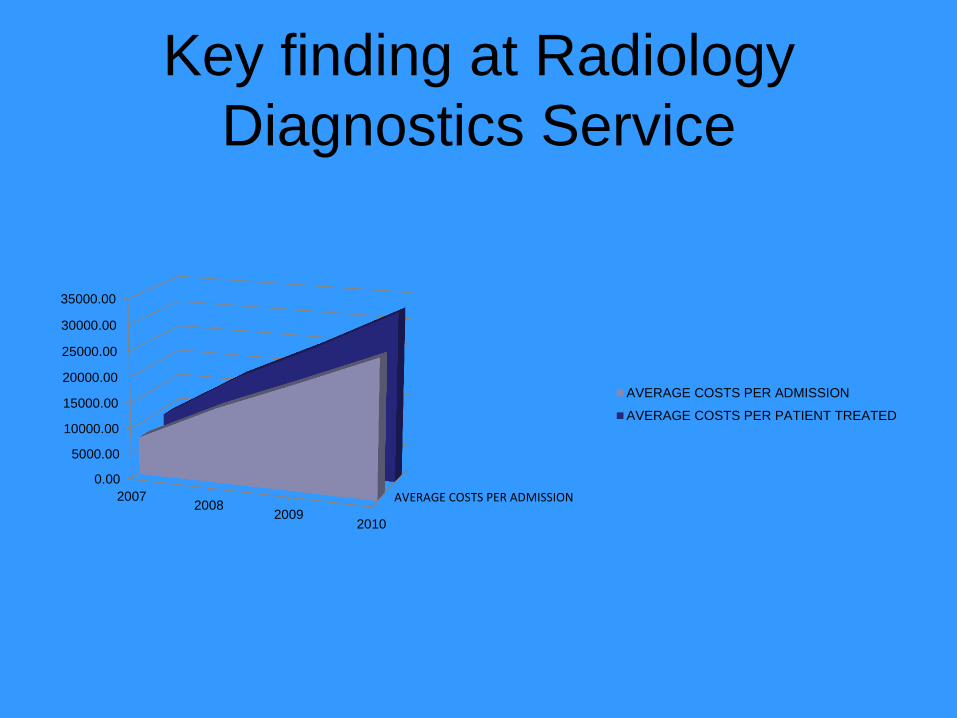
Key finding at Radiology
Diagnostics Service
AVERAGE COSTS PER ADMISSION
0.00
5000.00
10000.00
15000.00
20000.00
25000.00
30000.00
35000.00
20072008
20092010
AVERAGE COSTS PER ADMISSION
AVERAGE COSTS PER PATIENT TREATED
Nuclear Medicine Center
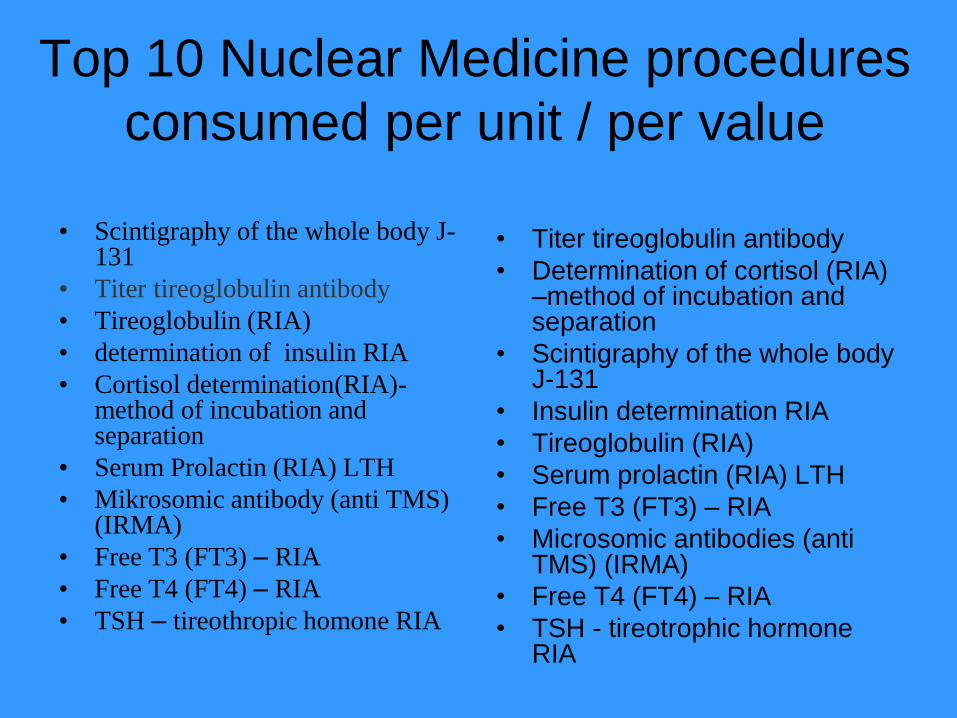
Top 10 Nuclear Medicine procedures
consumed per unit / per value
• Scintigraphy of the whole body J-131
• Titer tireoglobulin antibody
• Tireoglobulin (RIA)
• determination of insulin RIA
• Cortisol determination(RIA)-method of incubation and separation
• Serum Prolactin (RIA) LTH
• Mikrosomic antibody (anti TMS) (IRMA)
• Free T3 (FT3) – RIA
• Free T4 (FT4) – RIA
• TSH – tireothropic homone RIA
• Titer tireoglobulin antibody
• Determination of cortisol (RIA) –method of incubation and separation
• Scintigraphy of the whole body J-131
• Insulin determination RIA
• Tireoglobulin (RIA)
• Serum prolactin (RIA) LTH
• Free T3 (FT3) – RIA
• Microsomic antibodies (anti TMS) (IRMA)
• Free T4 (FT4) – RIA
• TSH - tireotrophic hormone RIA
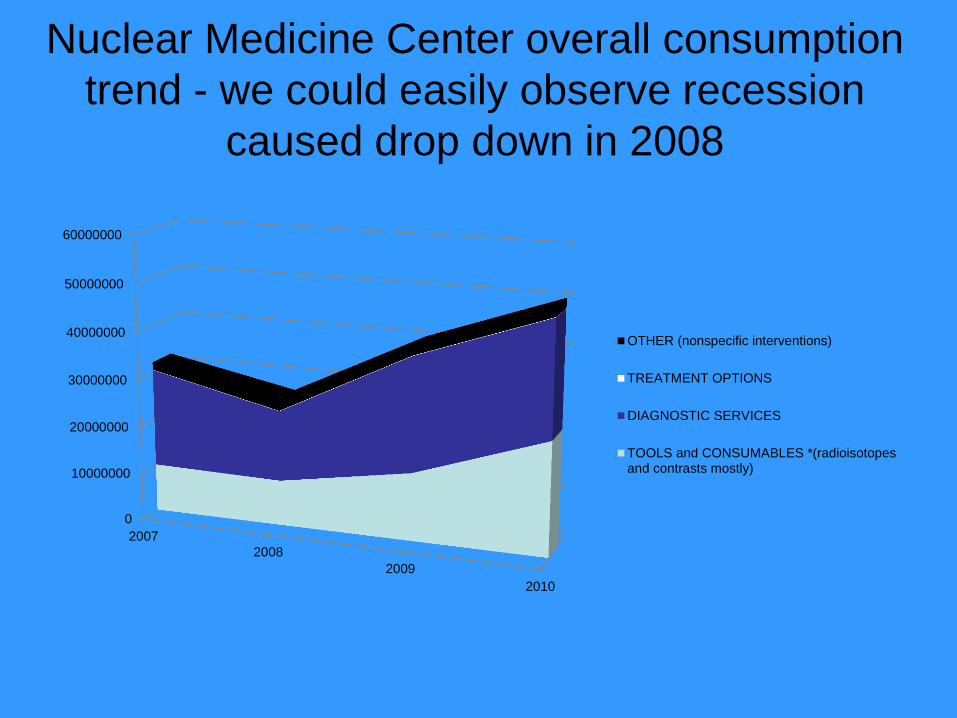
Nuclear Medicine Center overall consumption
trend - we could easily observe recession
caused drop down in 2008
0
10000000
20000000
30000000
40000000
50000000
60000000
2007
2008
2009
2010
OTHER (nonspecific interventions)
TREATMENT OPTIONS
DIAGNOSTIC SERVICES
TOOLS and CONSUMABLES *(radioisotopesand contrasts mostly)
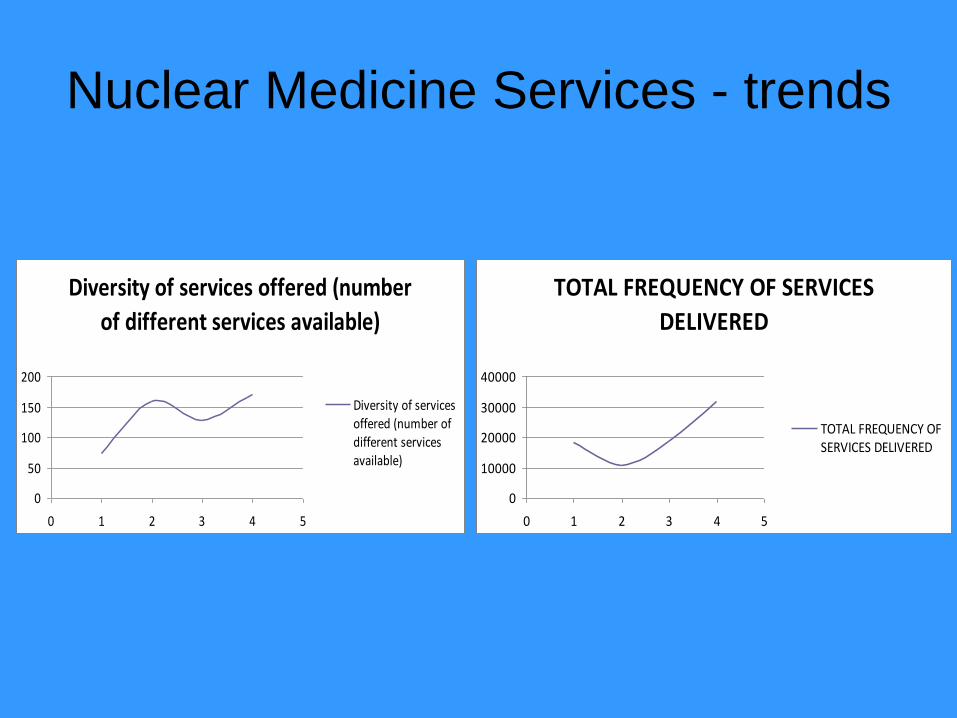
Nuclear Medicine Services - trends
Diversity of services offered (number
of different services available)
0
50
100
150
200
0 1 2 3 4 5
Diversity of servicesoffered (number ofdifferent servicesavailable)
TOTAL FREQUENCY OF SERVICES
DELIVERED
0
10000
20000
30000
40000
0 1 2 3 4 5
TOTAL FREQUENCY OFSERVICES DELIVERED
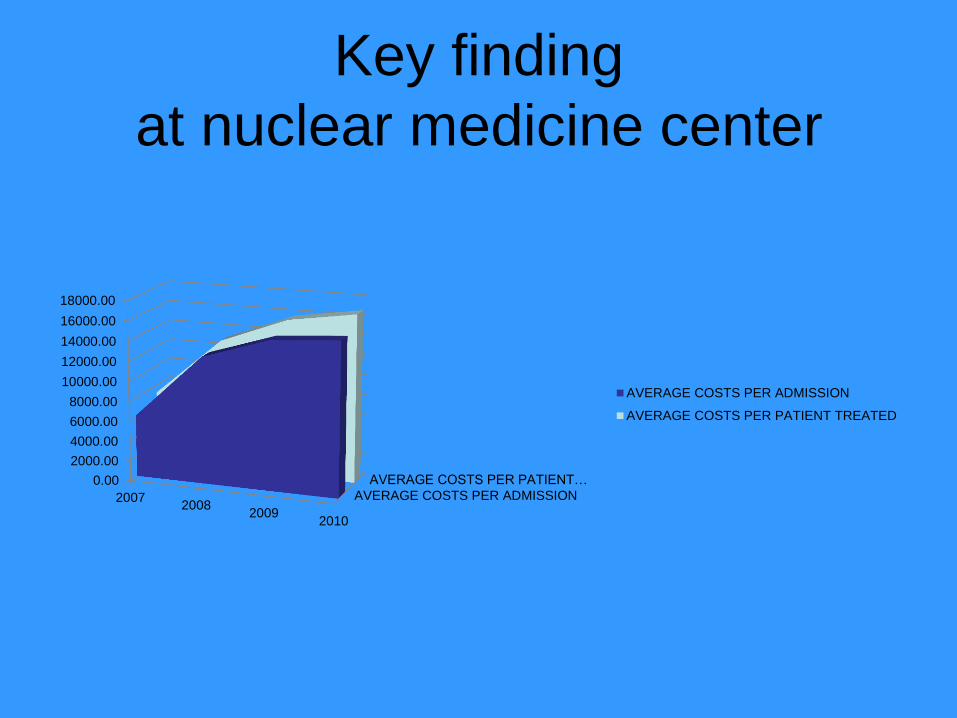
Key finding
at nuclear medicine center
AVERAGE COSTS PER ADMISSION
AVERAGE COSTS PER PATIENT…0.00
2000.00
4000.00
6000.00
8000.00
10000.00
12000.00
14000.00
16000.00
18000.00
20072008
20092010
AVERAGE COSTS PER ADMISSION
AVERAGE COSTS PER PATIENT TREATED

Oncology and Radiation
Therapy Center
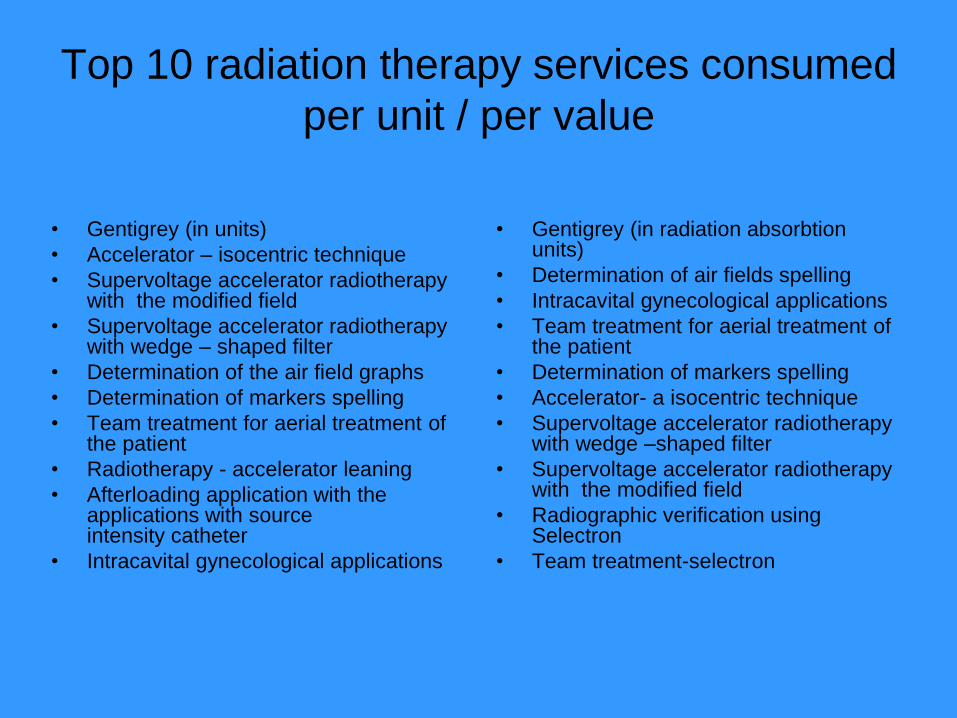
Top 10 radiation therapy services consumed
per unit / per value
• Gentigrey (in units)
• Accelerator – isocentric technique
• Supervoltage accelerator radiotherapy with the modified field
• Supervoltage accelerator radiotherapy with wedge – shaped filter
• Determination of the air field graphs
• Determination of markers spelling
• Team treatment for aerial treatment of the patient
• Radiotherapy - accelerator leaning
• Afterloading application with the applications with source intensity catheter
• Intracavital gynecological applications
• Gentigrey (in radiation absorbtion units)
• Determination of air fields spelling
• Intracavital gynecological applications
• Team treatment for aerial treatment of the patient
• Determination of markers spelling
• Accelerator- a isocentric technique
• Supervoltage accelerator radiotherapy with wedge –shaped filter
• Supervoltage accelerator radiotherapy with the modified field
• Radiographic verification using Selectron
• Team treatment-selectron
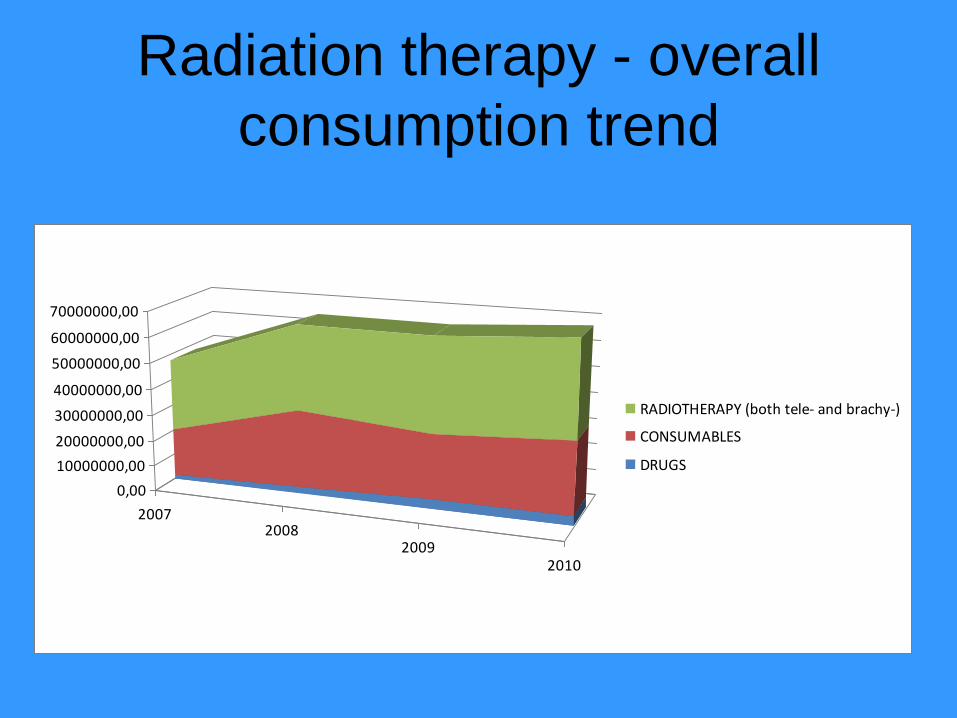
Radiation therapy - overall
consumption trend
20072008
20092010
0,00
10000000,00
20000000,00
30000000,00
40000000,00
50000000,00
60000000,00
70000000,00
RADIOTHERAPY (both tele- and brachy-)
CONSUMABLES
DRUGS
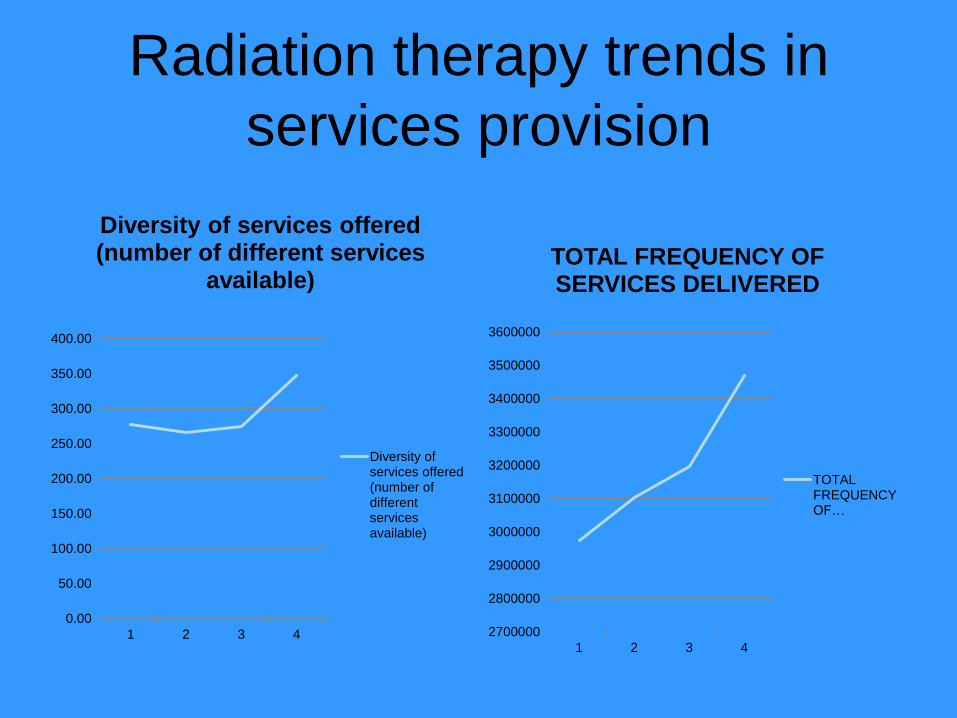
Radiation therapy trends in
services provision
2700000
2800000
2900000
3000000
3100000
3200000
3300000
3400000
3500000
3600000
1 2 3 4
TOTAL FREQUENCY OF SERVICES DELIVERED
TOTALFREQUENCYOF…
0.00
50.00
100.00
150.00
200.00
250.00
300.00
350.00
400.00
1 2 3 4
Diversity of services offered (number of different services
available)
Diversity ofservices offered(number ofdifferentservicesavailable)
Key finding at Oncology and
Radiation Therapy Center
AVERAGE COSTS PER ADMISSION0.00
2000.00
4000.00
6000.00
8000.00
10000.00
1 2 3 4
AVERAGE COSTS per HOSPITAL ADMISSION
AVERAGECOSTS PERADMISSION
AVERAGE…0.00
20000.00
40000.00
60000.00
80000.00
100000.00
120000.00
140000.00
1 2 3 4
AVERAGE COSTS PER PATIENT TREATED
AVERAGECOSTS PERPATIENTTREATED
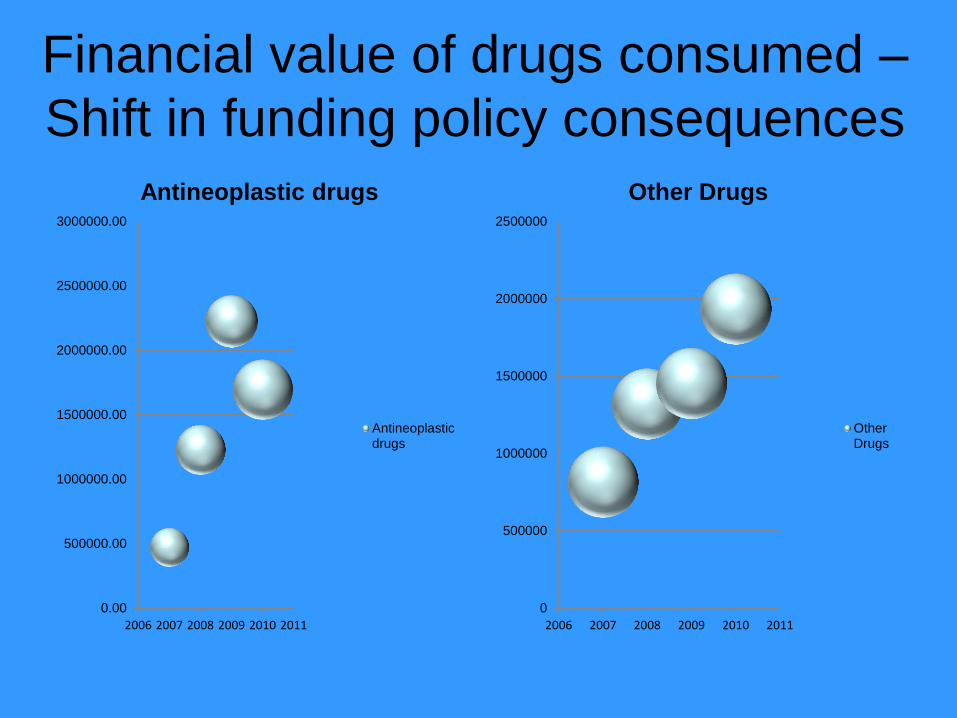
Financial value of drugs consumed –
Shift in funding policy consequences
0.00
500000.00
1000000.00
1500000.00
2000000.00
2500000.00
3000000.00
2006 2007 2008 2009 2010 2011
Antineoplastic drugs
Antineoplasticdrugs
0
500000
1000000
1500000
2000000
2500000
2006 2007 2008 2009 2010 2011
Other Drugs
OtherDrugs
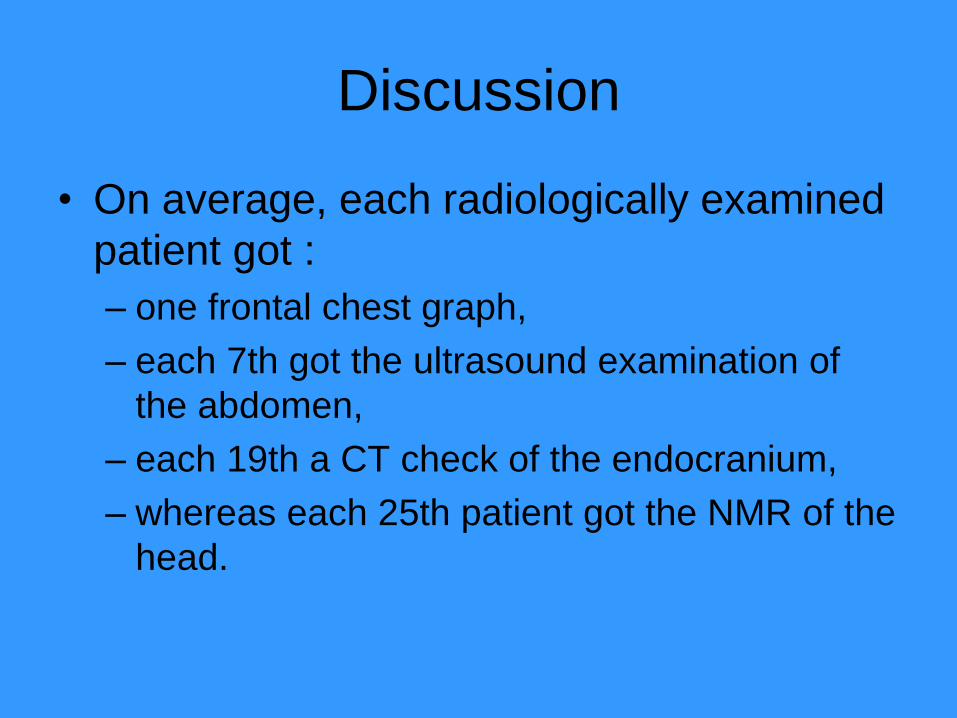
Discussion
• On average, each radiologically examined
patient got :
– one frontal chest graph,
– each 7th got the ultrasound examination of
the abdomen,
– each 19th a CT check of the endocranium,
– whereas each 25th patient got the NMR of the
head.
Thyroid gland examinations dominate
nuclear medicine services
• In Serbia the thyroid gland diseases are increasing
• This is most evident when we look at nuclear medicine
services to the first top 10 services,and the volume and
consumption, 6-7 are connected with the examination of
thyroid gland
• It is believed that the main reason for this poor economic
status of the population (upper middle gross national
income per capita), therefore, poor diet, modern life style
• In the last decade a five-fold increase is marked in
thyroid gland diseases and other endocrine glands
Radiation therapy
• The leap of the malignant diseases which require the
radiotherapy is rising as well
• Thus, although the percentage share of these services
expenditure in relation to the entire annual consumption
decreased, consumed value of these services increased
by one third
• The most of the services provided at The Oncology
Clinic were from the radiotherapy domain
• On the other side, core Republican health insurance
Fund imposed strict limitations on prescribed cytostatic
drugs reimbursement (indication – first choice medicines
should be more affordable ones although often not
clinically most efficient ones…)
Classical Radiographics
Examinations • Levin et al study in Pennsylvania at about 6
million health insurance holders, stated
significantly higher expenses incurred in total, on
the radiologic check-ups, out of which 62% were
non-radiologic expenses
• It could be considered relatively modest
consumption of these services, but it still
represents an enormous expense in scenario of
upper middle income country health budget and
prevents necessary investments for other
purposes
Comparison of utilization frequency
with other author’s reports • The devastating fact is that regardless of the
discharge diagnosis each patient gets a lung
graph or every 19th gets a CT of the
endocranium on average -
• This is a dubious piece of information and when
it is compared with other studies Mytherey
Bhargavan and Jonathan H. Sunshine where out
of the total 4 176 diagnosed radiologic
procedures, 49,3% goes to all the radiologic
check ups, and 9,36 % to all the CTs
Health risks imposed by harmful
irradiation of patients • Among the top 10 most expensive methods is simple RO
chest graph ranked second,
• The reason for this being its irrational prescription, which
has to be stopped not only because of huge expenses
but also due to the unnecessary irradiation of patients
• It is a well known fact that the dosage during the CT
treatment is 300 times bigger than during the ordinary
cat scan-graph, and here lies the danger of the possible
tumor development which originate from the mutations
caused by such radiation
An example of selected Japanese
study results • In 1994 Japanese annual costs of MR imaging were $713,500
• The total number of procedures required per year to break even financially was calculated to be 3568, which was far greater than the actual number reported (1893)
• Therefore, the income from most units fell below the break-even point
• This was contrary to the US, were MR showed a net profit instead of net costs
• This financial deficit for MR imaging in Japan was due to the low level of the fee, as well as inefficient utilization
• The profitability of operating MR imaging units is sensitive to the number of patients examined. Japan’s physicians were trying to compensate for the low fee for MR imaging by expanding the volume of services
• The charge for MR imaging in Japan that time ($200) was one fifth of that in the United States (Hisahige A, AJR 1994;162:507-510)
Conclusion
• Due to the recession impact and consequtive local health policy measures, diversity of health care services has suffered short decline and recovered providing increase in total during time span observed
• Total expenditure related to services offered has increased likely due to aging population and rise of overall morbidity
• Consumption patterns noticed, should give an important momentum for policy makers to intervene and provide higher clinician’s guidelines adherence
• These findings confirm irrational prescribing of diagnostic procedures and necessities of introducing cost containment strategies
Interventions to promote guidelines
adherence and cut costs • Adoption of hospital level clinical protocols – algorythms considered
binding for attending physicians,
• Suggesting frequency of repeated examinations in particular conditions (e.g. fresh cerebrovascualr event, head CT at 0 point, 24 , 48, 96 hours only)
• Delivering to the clinicians short summaries of evidence on cost/effectiveness of particular diagnostic tests (RCT and meta analysis findings, NICE reports on certain medical technologies and procedures)
• Radiologists and radiotherapists should not be the only aimed specialist branches – to consider neurologists, neurosurgeons, cardiologists and oncology surgeons as well
• Provide comparison with better managed tertiary care facilities providing similar level of care with net profit incurred instead of costs
Acknowledgements
• Authors would like to thanks for financial support and assistance in this research project to:
– The Hosei University , Tokyo , Japan
– The University Clinical Center Kragujevac Serbia
– Ministry for Education and Science, The Republic of Serbia Grant N°175014
– Japanese people and government for the donated medical equipment to this particular hospital in total value of over $1,000,000
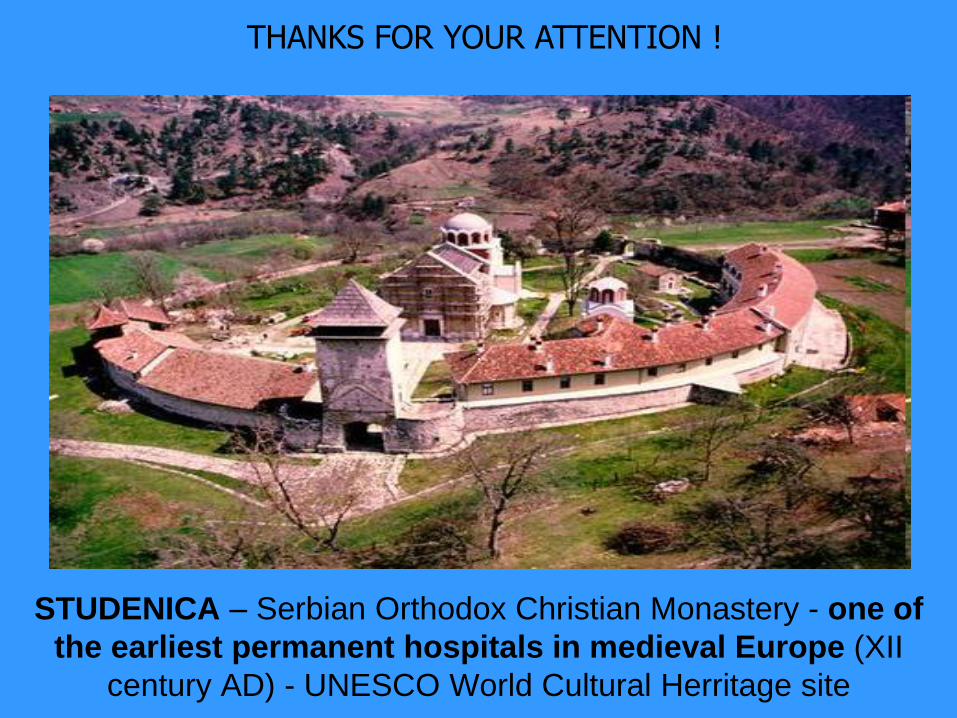
STUDENICA – Serbian Orthodox Christian Monastery - one of
the earliest permanent hospitals in medieval Europe (XII
century AD) - UNESCO World Cultural Herritage site
THANKS FOR YOUR ATTENTION !