Embed Size (px)
DESCRIPTION
Letter to shareholders for half year ended September 2009.
Citation preview


Fin a nci a l summ a ry
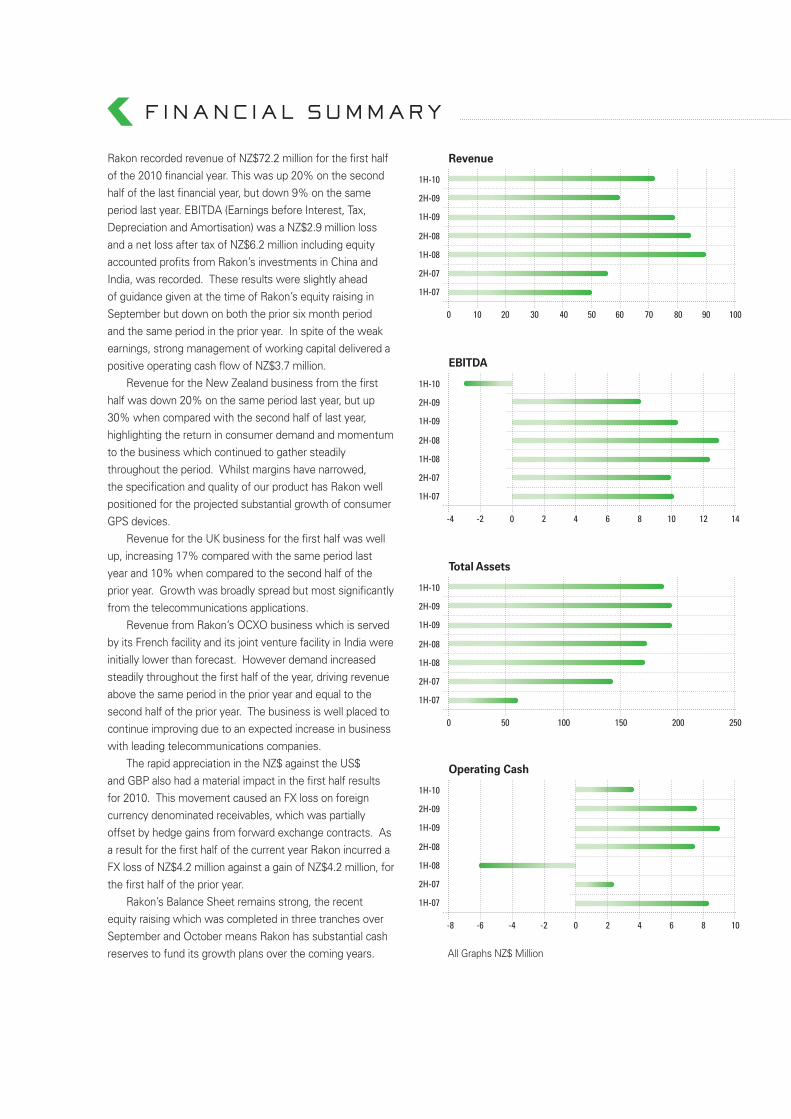
Rakon recorded revenue of NZ$72.2 million for the first half of the 2010 financial year. This was up 20% on the second half of the last financial year, but down 9% on the same period last year. EBITDA (Earnings before Interest, Tax, Depreciation and Amortisation) was a NZ$2.9 million loss and a net loss after tax of NZ$6.2 million including equity accounted profits from Rakon’s investments in China and India, was recorded. These results were slightly ahead of guidance given at the time of Rakon’s equity raising in September but down on both the prior six month period and the same period in the prior year. In spite of the weak earnings, strong management of working capital delivered a positive operating cash flow of NZ$3.7 million.
Revenue for the New Zealand business from the first half was down 20% on the same period last year, but up 30% when compared with the second half of last year, highlighting the return in consumer demand and momentum to the business which continued to gather steadily throughout the period. Whilst margins have narrowed, the specification and quality of our product has Rakon well positioned for the projected substantial growth of consumer GPS devices.
Revenue for the UK business for the first half was well up, increasing 17% compared with the same period last year and 10% when compared to the second half of the prior year. Growth was broadly spread but most significantly from the telecommunications applications.
Revenue from Rakon’s OCXO business which is served by its French facility and its joint venture facility in India were initially lower than forecast. However demand increased steadily throughout the first half of the year, driving revenue above the same period in the prior year and equal to the second half of the prior year. The business is well placed to continue improving due to an expected increase in business with leading telecommunications companies.
The rapid appreciation in the NZ$ against the US$ and GBP also had a material impact in the first half results for 2010. This movement caused an FX loss on foreign currency denominated receivables, which was partially offset by hedge gains from forward exchange contracts. As a result for the first half of the current year Rakon incurred a FX loss of NZ$4.2 million against a gain of NZ$4.2 million, for the first half of the prior year.
Rakon’s Balance Sheet remains strong, the recent equity raising which was completed in three tranches over September and October means Rakon has substantial cash reserves to fund its growth plans over the coming years.
Revenue
1H-10
2H-09
1H-09
2H-08
1H-08
2H-07
1H-07
0 10 20 30 40 50 60 70 80 90 100
EBITDA
1H-10
2H-09
1H-09
2H-08
1H-08
2H-07
1H-07
-4 -2 0 2 4 6 8 10 12 14
Total Assets
1H-10
2H-09
1H-09
2H-08
1H-08
2H-07
1H-07
0 50 100 150 200 250
Operating Cash
1H-10
2H-09
1H-09
2H-08
1H-08
2H-07
1H-07
-8 -6 -4 -2 0 2 4 6 8 10
All Graphs NZ$ Million
Fin a nci a l s
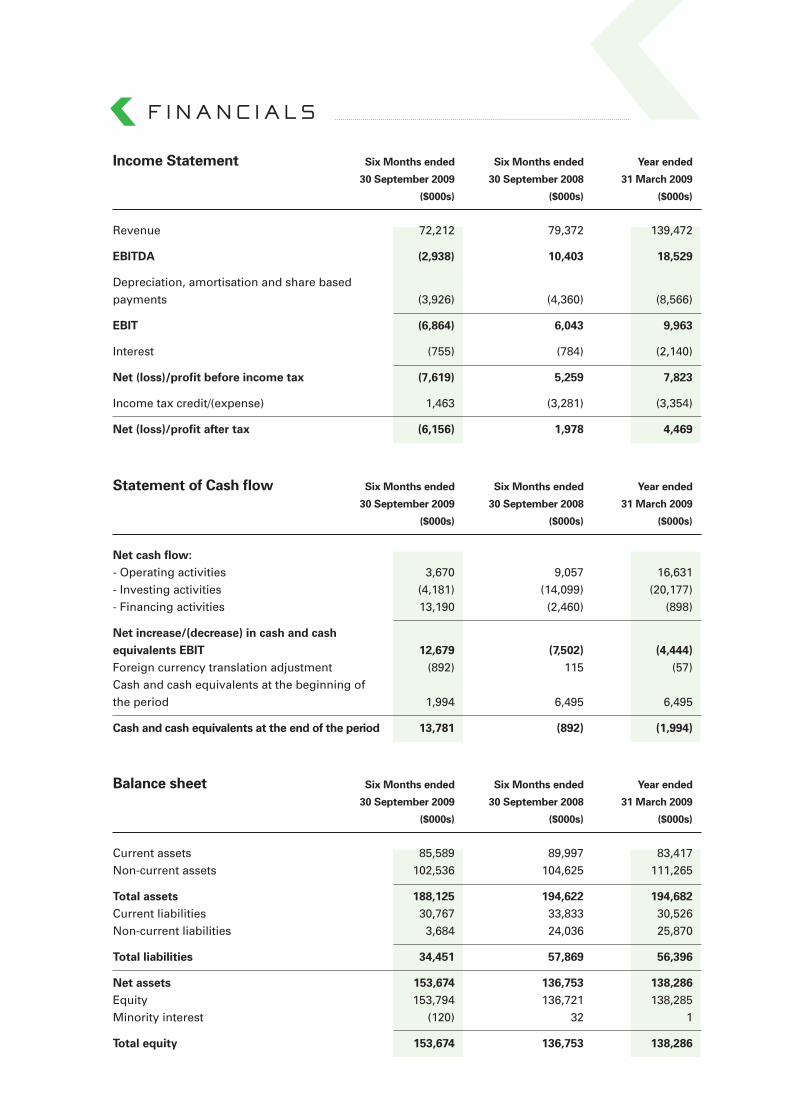
Income Statement Six Months ended Six Months ended Year ended
30 September 2009 30 September 2008 31 March 2009
($000s) ($000s) ($000s)
Revenue 72,212 79,372 139,472
EBITDA (2,938) 10,403 18,529
Depreciation,amortisationandsharebasedpayments (3,926) (4,360) (8,566)
EBIT (6,864) 6,043 9,963
Interest (755) (784) (2,140)
Net (loss)/profit before income tax (7,619) 5,259 7,823
Incometaxcredit/(expense) 1,463 (3,281) (3,354)
Net (loss)/profit after tax (6,156) 1,978 4,469
Statement of Cash flow Six Months ended Six Months ended Year ended
30 September 2009 30 September 2008 31 March 2009
($000s) ($000s) ($000s)
Net cash flow:-Operatingactivities 3,670 9,057 16,631-Investingactivities (4,181) (14,099) (20,177)-Financingactivities 13,190 (2,460) (898)
Net increase/(decrease) in cash and cash equivalents EBIT 12,679 (7,502) (4,444)Foreigncurrencytranslationadjustment (892) 115 (57)Cashandcashequivalentsatthebeginningoftheperiod 1,994 6,495 6,495
Cash and cash equivalents at the end of the period 13,781 (892) (1,994)
Balance sheet Six Months ended Six Months ended Year ended
30 September 2009 30 September 2008 31 March 2009
($000s) ($000s) ($000s)
Currentassets 85,589 89,997 83,417Non-currentassets 102,536 104,625 111,265
Total assets 188,125 194,622 194,682Currentliabilities 30,767 33,833 30,526Non-currentliabilities 3,684 24,036 25,870
Total liabilities 34,451 57,869 56,396
Net assets 153,674 136,753 138,286Equity 153,794 136,721 138,285Minorityinterest (120) 32 1
Total equity 153,674 136,753 138,286