Embed Size (px)
Citation preview
Rangeland Responses to Climate Change
Research Report #3 Prepared For:
Alberta Sustainable Resource Development
Prepared By: E.W. Bork1, J.F. Cahill, S.X. Chang, H. Proctor, S. Wilson, B. Shore,
B. Attaeian, S. White, S. Nyanumba & J. Newton
1Address is Room 410E
Dept. of Agricultural, Food & Nutritional Science Agriculture/Forestry Center
University of Alberta Edmonton, Alberta, Canada
T6G 2P5
March 25, 2009
2
TABLE of CONTENTS
1. Introduction … 10
2. Summary of Research Objectives, Experimental Design, and Scientific Methods in the Primary Rangeland Carbon Study … 12
2.1. Summary … 12 2.2. Specific Objectives … 14 2.3. Research Questions … 14 2.4. Background and Current Developments … 15 2.5. Research Team … 18 2.6. General Experimental Design … 19 2.7. Subproject 1: Enhancing the sustainability of biomass production
during climate change … 21 2.8. Subproject 2: Climate-induced shifts in C and N fluxes and
microbial activity … 23 2.9. Subproject 3: Effects of climate change and grazing pressure on
biodiversity and trophic structure of soil mesofauna … 24 2.10. Synthesis … 26
2.11. Project Work Plan and Communication … 26 2.12. Access to Equipment, Field Sites, and Infrastructure … 27 2.13. Training of HQP … 28 2.14. Supporting Organizations … 29 2.15. Benefits to Canada … 31 2.16. References … 32 3. Summary of Second Year Results in the Study Examining Climate Change Impacts on Rangeland Function … 34 3.1. Environmental Responses … 34 3.1.1. Precipitation … 34 3.1.2. Air Temperature … 34 3.1.3. Relative Humidity … 35 3.1.4. Soil Temperature … 36 3.1.5. Soil Moisture … 37 3.2. Plant Species Diversity and Composition … 38 3.3. Range Health … 41 3.4. Vegetation Biomass … 42 3.5. Soil Carbon and Nitrogen Dynamics … 44 3.5.1. Soil Microbial Biomass Carbon and Nitrogen … 44 3.5.2. Soil Dissolved Organic Carbon and Nitrogen … 45 3.5.3. Soil Greenhouse Gas Efflux … 46 3.6. Litter Decomposition … 48 3.7. Soil Microfauna … 50 3.8. Root Dynamics … 52

3
3.9. Literature Cited … 53
Appendix 1: Summary Data Results for the Second Year Effects of Warming, Precipitation and Defoliation on Rangeland Function … 57 Environmental Responses … 58 Plant Diversity and Composition … 81 Range Health … 89 Vegetation Biomass … 92 Soil Carbon and Nitrogen Dynamics … 94 Litter Decomposition … 103 Soil Microfauna … 109 Root Dynamics … 113
4
LIST of TABLES
Table 1. Monthly significant and near-significant main effects and interactions at α=0.05 of warming, defoliation, and precipitation treatments and time of measurement (3 PM or 3 AM) on air temperature recorded within study plots containing dataloggers. Analyses were conducted using the Proc GLM module of SAS 9.1.3. Individual plot values were averaged over each month. … 58 Table 2. Monthly significant and near-significant main effects and interactions at α=0.05 of warming, defoliation, and precipitation treatments and time of measurement (3 PM or 3 AM) on relative humidity recorded within study plots containing dataloggers. Analyses were conducted using the Proc GLM module of SAS 9.1.3. Individual plot values were averaged over each month. … 59 Table 3. Monthly significant and near-significant main effects and interactions at α=0.05 of warming, defoliation, and precipitation treatments and time of measurement (3 PM or 3 AM) on soil temperature (0-5cm) recorded within study plots containing dataloggers. Analyses were conducted using the Proc GLM module of SAS 9.1.3. Individual plot values were averaged over each month. … 60 Table 4. Monthly significant and near-significant main effects and interactions at α=0.05 of warming, defoliation, and precipitation treatments and time of measurement (3 PM or 3 AM) on soil temperature (5-20cm) recorded within study plots containing dataloggers. Analyses were conducted using the Proc GLM module of SAS 9.1.3. Individual plot values were averaged over each month. … 61 Table 5. Temporal variation in significant and near-significant main effects and interactions at α=0.05 of warming, defoliation, and precipitation treatments and soil depth (0-5 cm or 5-20 cm) on soil moisture recorded within study plots containing dataloggers. Analyses were conducted using the Proc GLM module of SAS 9.1.3. Readings were recorded at 3 PM on each sampling date. … 62 Table 6. Results of one-way PerMANOVAs testing for significance of temperature, defoliation and precipitation treatments. … 81 Table 7. Results of one-way PerMANOVAs pairwise comparisons comparing treatment levels within defoliation and precipitation. … 81 Table 8. Results of Indicator Species Analysis in response to warming, precipitation, and defoliation treatments in July 2008. … 82 Table 9. Summary P-value results from the ANOVA of soil response variables in 2007-2008 using repeated measures. … 94 Table 10. Summary P-values results from the ANOVA of soil CO2, N2O and CH4 efflux in 2007 and 2008 using repeated measures. … 95

5
LIST of FIGURES Figure 1. Long-term variation in annual precipitation in the Edmonton region from 1883 through 2003. … 63 Figure 2. Warming, defoliation, and precipitation treatment effects on mean air temperature recorded at a) 3 PM and b) 3 AM within study plots containing dataloggers during May 2008. All error bars are ±1 S.E. … 64
Figure 3. Warming, defoliation, and precipitation treatment effects on mean air temperature recorded at a) 3 PM and b) 3 AM within study plots containing dataloggers during June 2008. All error bars are ±1 S.E. … 65 Figure 4. Warming, defoliation, and precipitation treatment effects on mean air temperature recorded at a) 3 PM and b) 3 AM within study plots containing dataloggers during July 2008. All error bars are ±1 S.E. … 66 Figure 5. Warming, defoliation, and precipitation treatment effects on mean air temperature recorded at a) 3 PM and b) 3 AM within study plots containing dataloggers during August 2008. All error bars are ±1 S.E. … 67
Figure 6. Warming, defoliation, and precipitation treatment effects on mean relative humidity recorded at a) 3 PM and b) 3 AM within study plots containing dataloggers during May 2008. All error bars are ±1 S.E. … 68 Figure 7. Warming, defoliation, and precipitation treatment effects on mean relative humidity recorded at a) 3 PM and b) 3 AM within study plots containing dataloggers during June 2008. All error bars are ±1 S.E. … 69 Figure 8. Warming, defoliation, and precipitation treatment effects on mean relative humidity recorded at a) 3 PM and b) 3 AM within study plots containing dataloggers during July 2008. All error bars are ±1 S.E. … 70 Figure 9. Warming, defoliation, and precipitation treatment effects on mean relative humidity recorded at a) 3 PM and b) 3 AM within study plots containing dataloggers during August 2008. All error bars are ±1 S.E. … 71 Figure 10. Warming, defoliation, and precipitation treatment effects on mean soil temperature (0-5 cm) recorded at a) 3 PM and b) 3 AM within study plots containing dataloggers during May 2008. All error bars are ±1 S.E. … 72
6
Figure 11. Warming, defoliation, and precipitation treatment effects on mean soil temperature (0-5 cm) recorded at a) 3 PM and b) 3 AM within study plots containing dataloggers during June 2008. All error bars are ±1 S.E. … 73 Figure 12. Warming, defoliation, and precipitation treatment effects on mean soil temperature (0-5 cm) recorded at a) 3 PM and b) 3 AM within study plots containing dataloggers during July 2008. All error bars are ±1 S.E. … 74 Figure 13. Warming, defoliation, and precipitation treatment effects on mean soil temperature (0-5 cm) recorded at a) 3 PM and b) 3 AM within study plots containing dataloggers during August 2008. All error bars are ±1 S.E. … 75 Figure 14. Warming, defoliation, and precipitation treatment effects on mean soil temperature (5-20 cm) recorded at a) 3 PM and b) 3 AM within study plots containing dataloggers during May 2008. All error bars are ±1 S.E. … 76 Figure 15. Warming, defoliation, and precipitation treatment effects on mean soil temperature (5-20 cm) recorded at a) 3 PM and b) 3 AM within study plots containing dataloggers during June 2008. All error bars are ±1 S.E. … 77 Figure 16. Warming, defoliation, and precipitation treatment effects on mean soil temperature (5-20 cm) recorded at a) 3 PM and b) 3 AM within study plots containing dataloggers during July 2008. All error bars are ±1 S.E. … 78 Figure 17. Warming, defoliation, and precipitation treatment effects on mean soil temperature (5-20 cm) recorded at a) 3 PM and b) 3 AM within study plots containing dataloggers during August 2008. All error bars are ±1 S.E. … 79 Figure 18. Temporal variation in precipitation treatment effects on soil moisture at two depths recorded in study plots containing dataloggers during summer 2008, with bars clustered by a) sampling date, and b) precipitation treatment. All error bars are ±1 S.E. … 80 Figure 19. Effect of defoliation and warming on species richness in 2007 (top) and 2008 (bottom). … 83 Figure 20. Effect of defoliation on species evenness during 2007. … 84 Figure 21. Effect of precipitation and warming on species evenness during 2007. … 84 Figure 22. Effect of precipitation on species evenness during 2008. … 85 Figure 23. NMS ordination diagram showing axes 1 and 3 separating community composition among plots receiving the three defoliation treatments. Red symbols represent plots undergoing high defoliation, green triangles low defoliation, and blue triangles the undefoliated treatment. … 86
7
Figure 24. NMS ordination diagram showing axis 1 and 2 separating community composition among plots due to the three precipitation treatments. Red symbols represent plots undergoing high precipitation, green triangles ambient precipitation, and blue triangles the low precipitation treatment. … 87 Figure 25. NMS ordination diagram showing axes 1 and 3 separating community composition among plots receiving the three precipitation treatments. Red symbols represent plots undergoing high precipitation, green triangles ambient precipitation, and blue triangles the low precipitation treatment. … 88 Figure 26. Frequency of plots with unhealthy, healthy with problems, and healthy range assessments within droughted (top) and ambient rainfall (bottom) plots during 2007. … 89 Figure 27. Summary of mean range health scores associated with the main effects of warming, precipitation and defoliation during 2008. Scores of 1, 2 and 3 coincide with unhealthy, healthy with problems, and healthy range, respectively. No plots had a range health score of 1. … 90 Figure 28. Cover of Artemisia frigida (pasture sage) in relation to precipitation, warming and defoliation during August 2008. … 91 Figure 29. Effect of defoliation and precipitation on total productivity in 2007 (top) and 2008 (bottom). … 92 Figure 30. Effect of defoliation, temperature and precipitation on grass productivity in 2007. … 93 Figure 31. Effect of defoliation, temperature and grazing on forb productivity in 2008. … 93 Figure 32. Defoliation, precipitation and warming effects on average soil microbial biomass carbon (MBC) during the 2007 and 2008 growing seasons at 0-5 cm depth (left) and 5-15 cm depth (right). Error bars represent 1 SE. … 96 Figure 33. Defoliation, precipitation and warming effects on average soil microbial biomass nitrogen (MBN) during the 2007 and 2008 growing seasons at 0-5 cm depth (left) and 5-15 cm depth (right). Error bars represent 1 SE. … 97 Figure 34. Defoliation, precipitation and warming effects on average dissolved soil organic carbon (DOC) during the 2007 and 2008 growing seasons at 0-5 cm depth (left) and 5-15 cm depth (right). Error bars represent 1 SE. … 98 Figure 35. Defoliation, precipitation and warming effects on average dissolved soil organic nitrogen (DON) during the 2007 and 2008 growing seasons at 0-5 cm depth (left) and 5-15 cm depth (right). Error bars represent 1 SE. … 99
8
Figure 36. Defoliation, precipitation and warming effects on soil carbon dioxide (CO2) efflux during the 2007 and 2008 growing seasons. Error bars represents 1 SE. … 100 Figure 37. Defoliation, precipitation and warming effects on soil nitrous oxide (N2O) efflux during the 2007 and 2008 growing seasons. Error bars represents 1 SE. … 101 Figure 38. Defoliation, precipitation and warming effects on soil methane (CH4) efflux during the 2007 and 2008 growing seasons. Error bars represents 1 SE. … 102 Figure 39. Aboveground litter mass loss after 6 months within plains rough fescue grassland at the Alberta study site in response to precipitation, warming and defoliation. Error bars represent ± 1 SE. … 103 Figure 40. Aboveground litter mass loss after 6 months within mixed prairie grassland at the Saskatchewan study site in response to precipitation, warming and defoliation. Error bars represent ± 1 SE. … 104
Figure 41. Aboveground litter mass loss after 6 months within grassland at the Manitoba study site in response to precipitation, warming and defoliation. Error bars represent ± 1 SE. … 105
Figure 42. Aboveground litter mass loss after 12 months within plains rough fescue grassland at the Alberta study site in response to precipitation, warming and defoliation. Error bars represent ± 1 SE. … 106 Figure 43. Aboveground litter mass loss after 12 months within mixed prairie grassland at the Saskatchewan study site in response to precipitation, warming and defoliation. Error bars represent ± 1 SE. … 107 Figure 44. Aboveground litter mass loss after 12 months within grassland at the Manitoba study site in response to precipitation, warming and defoliation. Error bars represent ± 1 SE. … 108 Figure 45. Sample images of various micro-organisms, extracted from soil samples in the main climate change study area in July 2007. … 109 Figure 46. 3-D PATN ordination of soil arthropods showing axes 1 and 3. Gray circles represent droughted plots, while black circles represent ambient precipitation treatments. Stress is a measure for how reliable the ordination is, with 0.0873 being in the range of good to very good. … 110 Figure 47. Average abundance of taxa within the ambient and droughted precipitation treatments at the Alberta study site in 2007. Significance is indicated as follows: * p<0.05, ** p<0.01. Error bars are +/- 1 SD. … 111

9
Figure 48. Scatter plot of Tydeidae (gray squares) and oribatid juveniles (black triangles) abundance (y-axis) in relation to volumetric soil moisture (x-axis). … 112 Figure 49. Mean root length measures in response to the main effects of warming (top) and precipitation (bottom), as calculated using images obtained with a root periscope. … 113 Figure 50. Mean root length responses under the 3 defoliation treatments as assessed from images collected with the root periscope. … 114
10
1. Introduction
Canada contains 22 M ha of land dedicated to range and forage production. This land
supports 4 M cow/calf pairs, and overgrazing in some areas has resulted in many areas being in
less than ‘good’ condition. Improving rangeland condition provides direct economic benefits
and since native rangelands typically store more carbon than cropland and tame pasture, this also
leads to increased carbon storage. A healthy rangeland stores equivalent carbon mass per ha as
forested ecosystems, and because this carbon is primarily belowground, it is at a lower risk of
release during fires. Unfortunately, we have a limited understanding of the belowground
processes that drive rangeland dynamics, and a general lack of information on how increased
temperature and/or altered precipitation patterns will impact the sustainability of these systems,
particularly under sustained grazing. Moreover, sound fundamental information on the nature of
climate-grazing interactions within rangelands has the potential to (1) improve carbon storage,
(2) enhance native biodiversity and ecosystem functioning, and (3) provide positive economic
returns.
To mitigate the potential impacts of climate change on the biodiversity and sustainable
production of Canada’s rangelands, it is essential to gain a mechanistic understanding of the
links between temperature, precipitation, soil chemistry, microbial and invertebrate diversity and
activity, primary production, and the dominant land use of livestock grazing. In this study, we
are conducting replicated field experiments at several locations of Alberta, Saskatchewan, and
Manitoba from 2006 to 2009. At each location, we will establish plots subjected to a variety of
treatments, including combinations of defoliation and ambient warming (ambient or +2C using
open-top greenhouses), and in the main study, precipitation (ambient, -70% using rainout
shelters, +70% using watering) treatments as well for three growing seasons. We will measure
primary productivity and range health, with a particular emphasis linking above and
belowground dynamics. Using technology such as mini-rhizotrons (root periscope cameras) will
allow for enhanced accuracy in estimating primary productivity and carbon flow. We will also
measure changes in microbial and invertebrate communities, litter decomposition, and carbon
and nitrogen cycling. We anticipate that changes in plant growth resulting from changed
climatic conditions and management practices will have cascading effects on ecosystem
resilience. From these data, we will identify a set of management recommendations for this

11
sector of the agricultural community on how to alter grazing regimes to mitigate the varied
impacts of future climate change.
This report has 2 objectives, including the following:
1. Provide a summary of the second year responses (i.e. 2008) in the primary study
examining Climate Change Impacts on Rangeland Function, being conducted from 2007
through 2009.
2. Review the preliminary implications of the fore-mentioned results on rangeland
management in the province of Alberta, which in turn, will enable Alberta Sustainable
Resource Development to better meet their mandate for public land stewardship in the
province.
12
2. Summary of Research Objectives, Experimental Design, and Scientific Methods in the Primary Rangeland Carbon Study
2.1. Summary
Canada contains 22 M ha of land dedicated to range and forage production. This land
supports 4 M cow/calf pairs and overgrazing has resulted in less than 50% of this area listed in
“good” condition. Improving rangeland condition provides direct economic benefits, and
because native rangelands store more carbon (C) than annual cropland, this should also lead to
increased C storage, with implications for feedback to climate systems both locally and globally.
Globally, grasslands store more than twice as much soil C as forest, and since this C is primarily
belowground, it is not released by fire. At present, we have a limited understanding of the
belowground processes that drive rangeland dynamics, and a specific lack of information on how
the increased temperature and altered precipitation patterns predicted to occur with climate
change will impact the sustainability of these systems, particularly under grazing. Understanding
climate-grazing interactions in rangelands has the potential to (1) increase C storage, (2) improve
our understanding of ecosystem feedback on climate change, (3) enhance native biodiversity,
ecosystem functioning and sustainability, and (4) provide positive economic returns. In this
project we will identify key linkages between grazing, climate change, carbon storage, and
primary production. Making this project particularly strong is our emphasis on detailed study of
three main components of this system: (1) biomass production under climate change; (2) C and
nitrogen (N) cycling and storage through altered microbial functioning and processes; and (3)
soil invertebrate biodiversity and trophic structure. By emphasizing linkages between these
components, we will identify the critical points at which climate change and land-use decisions
interact, allowing the development of sound adaptation strategies.
We will conduct a replicated field experiment in the Parkland and /or Mixedgrass Prairie
regions of Alberta, Saskatchewan, and Manitoba. At each location, we will establish plots
subjected to combinations of defoliation, warming, and precipitation treatments for three
growing seasons. We will measure primary productivity and range health, with a particular
emphasis on belowground dynamics using mini-rhizotrons. We anticipate that changes in plant
growth from these treatments will have cascading effects on ecosystem function.
13
From these data, we will identify a set of management recommendations for this sector of
the agricultural community on how to alter grazing regimes to mitigate the impacts of climate
change. This project is interdisciplinary by design, and as a group we have diverse research
experiences. Several of the PIs have strong links with producer groups and industries, increasing
our ability to communicate effectively with key stakeholders. The potential for outreach is
further enhanced by having sites in all three prairie provinces, increasing both the generality of
the project’s outcomes as well as the potential number of interested industrial groups. The goals
of this research parallel those of the Biosphere Adaptation to the Climate Change section of the
Healthy Environment and Ecosystems project area. However, this project diverges in that its
focus is on native rangeland, rather than forest or aquatic habitats.
Due to the amount of land area covered by native range, climate change in this habitat
will have significant consequences both for Canada as a whole, as well as industry. An attractive
aspect of addressing climate change impacts in rangelands is that grazing practices are dynamic,
and thus the mitigation strategies developed through this research can be rapidly adopted,
resulting in real benefits to Canada and producers. The long-term objectives of this research are
to understand the ecological interactions present within rangeland ecosystems in the Prairie
biome of western Canada, and how they are affected by changing environmental and
management practices. By doing so, we will provide policy-relevant scientific data for
sustainable management. We will seek further funding to extend the life of this experiment
beyond this 3-year funding cycle, as long-term data are critical to achieve our long-term
objectives.

14
2.2. Specific Objectives
� Determine how temperature, precipitation, and defoliation interact to impact the
sustainability of native rangelands.
� Provide clear management suggestions to supporting organizations for increasing
rangeland drought resistance and to maximize soil carbon storage and nitrogen cycling.
� Develop a synthetic model that incorporates the functional links between climate,
grazing, root demography, soil invertebrate and microbial diversity, and carbon and
nitrogen cycling.
2.3. Research Questions
� Do climate change and defoliation interact to affect root births, deaths, turnover,
decomposition, and belowground carbon storage?
� What combinations of root size and depth distributions are associated with the highest
level of forage production under different combinations of grazing and climate
manipulation?
� How do the dominant forage species respond in situ to warming and precipitation
treatments in terms of water use efficiency and rates of photosynthesis?
� How do rates of soil flux (e.g. soil respiration and N mineralization) change in response
to varied grazing and climate treatments?
� Will climate change alter the diversity, biomass, or trophic function of grassland soil
invertebrates?
� What functional links between climate, grazing, plant growth, microbial activity, and soil
invertebrate diversity and distribution are most strongly associated with controlling
forage production and net carbon storage under varied combinations of defoliation and
climate?
15
2.4. Background and Current Developments
The western provinces are home to 83% of the beef herd. Of the land base used by cattle,
86% is rangeland, including 7.6 M ha in Alberta. The northern portion of this biome (the Aspen
Parkland) is about 750,000 ha in size, and recognized as a ‘tension zone’ with a history of strong
changes in climate and associated vegetation (1). Historical data indicate this region is
susceptible to the influence of altered precipitation and warming associated with climate change.
The temperature in the prairies is increasing. Over the short term, 2005/06 was the warmest
winter since 1948, 4oC above normal (2). Temperatures in most seasons over the last 8 years
have also been above normal (2). Over the long-term, temperatures are expected to increase by
>4oC by 2080, increasing evaporation and reducing soil moisture availability. What remains
unclear is whether precipitation will increase, decrease, or stay constant, though evaporation is
expected to offset precipitation increases and could increase drought frequency and severity (2).
Climate change will have direct and indirect effects on ecosystem sustainability. Our ability to
mitigate potential negative outcomes (e.g. reduced forage production, release of vast stores of
organic C in the Black and Dark Brown soils) is dependent upon a detailed understanding of the
linkages between climate, grazing, plants, microbes, invertebrates, and soils.
Increased warming and drought frequency will reduce forage production over both the
short and long-terms, providing a severe economic strain on rural western communities and
industries. Precipitation is one of the most influential factors regulating plant growth in
grasslands (3), including in the wetter northern prairies (4). However, drought alters not only
current year production, but can change the distribution and size of roots in the soil profile (5)
with functional consequences for the following year. Grazing can also influence root growth,
though whether it reduces (6) or increases root growth (7) is unclear. Increased temperature is
also associated with altered root growth, though the direction of effects is also variable among
studies (8-10). Overall, there is consensus that grazing and climate change alter root growth, but
there have not been enough studies to provide a clear indication of the direction and magnitude
of effect, individually or in combination.
Understanding how warming, drought, and grazing interact to affect root growth is of
critical importance in rangeland, where up to 92% of plant biomass exists belowground (11) and
a healthy root structure is a prerequisite for sustained forage production. Additionally, most
16
plant competition in these systems occurs belowground (12), indicating that root traits will
influence competition (13) and weed invasion. Seemingly minor differences among roots (e.g.
diameter differences of 0.1mm) have dramatic effects on root survival (14) and nutrient uptake
(15). Root turnover rates influence carbon and nitrogen cycling (16). In short, the impacts of
climate change on rangeland sustainability will be determined by what happens belowground.
Changes in root growth can have direct impacts on production, as well as indirect effects
through feedbacks into the soil system (17, 18). The direction of feedbacks will in part be
determined by whether climate change and grazing alters root growth through changes in root
birth rates, or root death rates. For example, 1 kg of roots could be formed from 1 kg of
production (low birth rates) and no root deaths, or from 10 kg of production (high birth rates) and
9 kg of root deaths. Though the standing pools of roots are the same in these scenarios, the
difference in carbon inputs to the soil will have different consequences for carbon storage. To
discriminate among these possibilities, this project uses an innovative technology known as a
minirhizotron, or "root periscope", allowing non-destructive assessment of roots in the soil (11,
19). This approach will enhance our understanding of root characteristics and function in
relation to external abiotic factors and/or management influences.
Carbon inputs into the soil through dead roots, exudates, and leaf litter serve as the base
of soil food webs (20). Changes in litter quantity or quality due to interactive effects of grazing
and climate change can have cascading effects on microbial and soil invertebrate abundances,
species composition and activity (21). This in turn will impact decomposition rates, soil
respiration, and carbon and nitrogen cycling. A diversity of invertebrate animals inhabit soil,
influencing its structure and composition through litter fragmentation, consumption of microbes,
vectoring of fungal spores, and modification of pore-size distribution (20). These activities
influence production and forage quality (22), and affect CO2 generation from soil (23). Grazing
is known to alter soil communities in Alberta grasslands (24), though it is unclear whether these
effects were due to changes in root growth or soil microenvironment associated with litter
removal. The few studies of the effects of changes in temperature and moisture on soil
invertebrates show taxon-specific responses (25, 26). Overall, little is known about the
biodiversity or community ecology of rangeland-dwelling invertebrates, particularly in Canada.
Differentiation of these potential mechanisms of effect and taxonomic difference are critical to

17
understanding the functional links between grazing, soil invertebrates, climate change, forage
production, and carbon cycling.
In Mixed Prairie, studies on the impact of grazing on soil C have shown variable results
(27, 28), and no studies have been conducted in the Aspen Parkland. More broadly, there are
few studies of the warming effects on C and N cycling in rangeland systems (29), and even fewer
focusing on interactions between warming, drought, and defoliation (30). The response of C and
N fluxes to climate change and the resultant changes in ecosystem C and N stocks provide the
feedback mechanism for further climate changes. Carbon and N cycling in the soil is mainly
controlled by microbial processes (31), and how microbial function and diversity in Parkland
regions will respond to climate change is unknown.
The development of mitigation measures for climate change in the Parkland is dependent
upon a mechanistic understanding of the linkages between climate, grazing, plant growth,
microbial activity, and soil fauna. Ecologists know these factors interact, yet studies testing the
functional consequence of those interactions are rare, and non-existent within Canada’s
rangelands. This research will bridge a significant information gap, by linking the impact of
ongoing routine management decisions by producers (i.e., defoliation intensity) with subsequent
belowground root structure and development, and ultimately, with short and long-term forage
production. Additionally, we will be able to measure changes in carbon and nutrient cycling,
which combined with information on microbial activity and soil fauna, will allow us to
determine how changes in management under climate change will impact carbon storage and
turnover. This innovative research will establish a new framework for understanding and
assessing the impact of common management practices, on the potential to improve forage
production and carbon storage, and subsequently mitigate some negative consequences of
climate change.
18
2.5. Research Team
The research team consists of accomplished, well-respected researchers from a diversity
of disciplines, and includes:
1. Dr. J.F. Cahill (Biological Sciences) - University of Alberta
2. Dr. E.W. Bork (Agricultural, Food, and Nutritional Science) - University of Alberta
3. Dr. S.X. Chang (Renewable Resources) - University of Alberta
4. Dr. H.C. Proctor (Biological Sciences) - University of Alberta
5. Dr. S.D. Wilson (Biology) – University of Regina
Cahill , Bork , and Wilson have proven track records in the grasslands of Western
Canada, and are uniquely positioned to conduct the plant component of this project. Cahill and
Wilson have published extensively on root ecology and plant-soil feedbacks, and both use mini-
rhizotrons in their research. Bork , Chang, and Wilson have strong records in applied ecology
and conservation biology. Bork is a rangeland ecologist and grazing management specialist,
with extensive ties to industry partners and other stakeholder groups. Wilson and Chang have
both addressed issues of soil carbon storage and climate change. Proctor and Chang are well
suited to lead the carbon/nitrogen cycling and soil invertebrate diversity components of this
project. Chang has an extensive body of research in understanding climate-soil interactions,
with strong ties to the network of climate change researchers in Canada. He has published
extensively on soil biogeochemistry, soil respiration and microbial functional diversity and is
experienced with basic physiological measurements and stable isotope techniques. Proctor is
one of the world’s experts on soil mites and associated mesofauna. She has a broad
understanding of soil invertebrates, and her ecological knowledge allows for integration of these
data with other aspects of the study. All team members have experience with field experiments
and are familiar with the logistical difficulties involved. All have records of finishing studies on
time and within budget, while emphasizing the training of HQP. The team is committed to this
work and see genuine potential for achieving an integrative understanding of how climate change
will alter rangeland sustainability and the potential feedback mechanisms for regional and global
climate change.

19
2.6. General Experimental Design
Locations: Logistical considerations require us to restrict our research to a few locations
across the Prairie biome, including the Mixedgrass Prairie and Aspen Parkland. The Parkland is
a transition zone between the mixed prairie and boreal forest. Parkland structure is a product of
complex interactions between the plant communities, grazing management, climatic conditions,
and nutrient inputs, and is likely particularly sensitive to climate change. Similarly, the
Mixedgrass is known to be moisture limiting for plant growth, with productivity intricately tied
to the timing and amount of rainfall. Three field sites will be established: (1) Kinsella, AB, in
the Parkland, (2) White Butte, SK, in the Mixed Prairie, and (3) Spruce Woods, MB, in the
Parkland-Boreal transition. All sites are mosaics of grasslands with aspen stands restricted to
moister areas. Grassland areas are more heavily grazed than the aspen stands in all regions, and
are therefore the focus of this work.
Layout: We will use a factorial design to determine the interactive effects of temperature
(2 levels), precipitation (3 levels), and defoliation (3 levels) on a suite of response variables (see
below). Field sites will be chosen in areas with no obvious environmental gradients, allowing
the use of a fully randomized design, with five replicates of each treatment combination. It is not
feasible to increase the number of replicates without reducing the number of locations or
treatment combinations. Each plot (the unit of replication) will be approximately 2 x 2 m in size,
with a 1 m buffer zone separating plots. Plot size is limited by the physical constraints imposed
by our warming treatment (see below). Plots and blocks will be marked immediately after
snowmelt in spring 2007, followed shortly by climate manipulations. Livestock will be excluded
during the experiment.
Warming: Warming will be achieved by the use of open-top chambers (OTC). This
method is used around the world (32), and consists of a 40 cm high x 2 m diameter cone, with
the side made of a fibreglass material positioned at a 60o angle. The fibreglass allows
transmission of visible, but not infra-red light, creating a greenhouse effect within the chambers
of around 2-4o C above ambient (32). The exact warming achieved (along with any confounding
effects) will be measured using HOBO data loggers to record air and soil temperature, humidity,
and soil moisture in 78 of the 210 plots spread across the three locations (3-5 replicates per
treatment combination). The costs associated with data logging all 210 plots are prohibitive
20
($100,000 more). Additional micro-environmental measures (PAR, and more plots for
temperature and soil moisture) will be collected periodically using handheld devices.
Precipitation: Plots will be individually modified to receive approximately ambient, -
70%, or + 70% growing season rainfall using a modified design of Zhou et al. (30). In brief,
water addition is achieved by gravity feeding rainfall collected outside a plot, and water
reduction occurs by using a transparent rainout shelter to intercept approximately 70% of
rainfall. All plots of all treatments will have similar shelters built around them to control for
potential confounding effects of the structures on air temperature and shading, differing in
whether the rain is directed inwards (+70%), outwards (-70%), or allowed to pass through
(control). Micro-climatic effects of the shelters will be determined using data loggers as
described above. This approach will not affect the frequency of rainfall events in the plots, just
their magnitude. The risk of this approach is that the actual precipitation manipulations will
depend upon actual rainfall, a value that is highly variable in rangelands. Due to logistical
constraints the MB and SK sites will not include a water addition treatment.
Defoliation: The presence of OTC devices precludes the use of cattle, and instead we
will defoliate vegetation manually within plots (none, low, high). The low and high intensity
treatments consist of clipping at a stubble height of approximately 7.5 and 2.5 cm, which roughly
corresponds to the removal of 30% and 80% of standing current annual biomass in low and high
intensity plots (exact removal amounts will be determined). These levels coincide with
conservative and excessive use for native rangelands. Defoliation will occur in mid summer
(June 15-30), similar to what is done by local producers.
Plot Disturbance: We are aware that our research activity could negatively impact the
ecological functioning of plots (33). To minimize this risk, there will only be two destructive
harvests in each plot each year. All destructive sampling (clipping, soil coring, etc) will occur in
the same area within a plot at each sampling period, reducing the overall extent of damage to the
plots. Holes left behind will be refilled and their locations marked. Although this reduces our
ability to describe within-year patterns, it is sufficient to make reliable between-treatment
comparisons. Environmental measures will be made with installed probes and handheld devices
and will therefore not cause further disturbance.
21
2.7. Subproject 1: Enhancing the sustainability of biomass production during climate
change (Bork, Wilson, Cahill, and Chang)
The overall goal of this subproject is to determine how climate change and defoliation
will interact to alter biomass production, plant phenology and forage quality. More specifically,
this goal is subdivided into (1) biomass production and C and N pools and (2) root growth and
turnover. A Ph.D. student will lead the project testing the impacts of altered grazing and climate
on forage production and standing C and N pools. In all three locations, a permanent 50 x 50 cm
quadrat will be marked on the surface of all 210 plots in spring 2007, allowing for repeated non-
destructive measurement of plant phenology, and species composition and cover each growing
season. The cover estimates will be converted to rough estimates of biomass using double-
sampled plots located outside the immediate study area. Direct measures of shoot biomass will
be assessed within each plot (but outside the permanent quadrats described above) by clipping a
20 x 50 cm subplot in each plot in May (spring) and late July (peak biomass). Clipped materials
will be sorted to species, dried, and weighed. To provide estimates of forage quality, biomass
samples will be pooled by growth form (grasses, forbs, shrubs) and ground for analysis of %C
and N, and forage quality parameters (neutral and acid detergent fiber). Leaf litter will also be
removed from the clipped plots, dried, weighed, ground, and %C and N determined. Within
each clipped quadrat, root C and N content and biomass will be assessed through the sampling of
replicate bulked 5 cm diameter soil cores at two depths (0-15cm and 15-30cm). Roots will be
sieved/washed from the soil, analyzed for root length (WinRhizo), dried, weighed, and with %C
and N determined. Additional soil cores will be taken for assessment of soil total and available
carbon and nitrogen, pH, moisture content, bulk density, and other chemical and physical
properties.
An M.Sc. student will test the treatment effects on root growth and demography. To
achieve this, we will combine the previously described biomass data with demographic data
obtained with a mini-rhizotron camera system (Bartz Technology). In spring 2007, we will
install a mini-rhizotron tube (5 cm diameter, 1 m long, clear extruded acrylic) at a 45o angle in all
plots. To allow for plant recovery following the disturbance associated with tube installation, we
will not collect root image data until the following growing season (2008). Starting in spring
2008, we will conduct monthly imaging through the rooting zone throughout the growing season
22
for two consecutive years. Images will be collected in a belted transect along the tube, with 13
mm image widths. To limit the number of images requiring processing, we will process only
every fourth image. This choice still provides substantial data (approximately 15-20 images per
tube per month), while reducing the workload associated with image processing. To process an
image, a lab technician needs to trace each root by hand (using a digitizing program), from which
demographic information can be recorded (root birth dates, death dates, length, diameter, etc.).
Prior experience indicates that this takes approximately 1 hour per tube per session. With 210
tubes over two years, this results in substantial computer work. Our experience shows that no
software currently available reliably automates this task.
Statistical analysis will be conducted to achieve two main goals: (1) determination of
how precipitation, temperature and defoliation, alone and in combination, influence a variety of
response variables (e.g., root birth, abundance, growth and death, root and shoot biomass, carbon
storage, range health, species composition, etc.), and (2) determination as to which combination
of root characteristics produces the most desired community function (e.g., biomass production
during drought, carbon storage, etc.). In the former analyses, generalized linear mixed models
(GLMM) will be conducted that include temperature, defoliation, and moisture treatment as
fixed effects. In analyses that include all three locations, location will be included as a random
effect. Repeated measures analyses will be conducted when appropriate. Root demographic
analyses will involve traditional population analyses, such as the use of proportional hazards
models. Tests of treatment effects on community structure will involve a variety of multivariate
approaches such as multi-response permutation procedures and indicator species analyses. To
determine how different rooting characteristics (e.g. depth x length distributions of the
community) are associated with desired ecosystem function (e.g. low abundance of invasive
species, biomass production during reduced precipitation), we will again use generalized linear
models, however, we will also include a variety of measures (e.g. root turnover rate) as
continuous variables in the analysis. We specifically want to know if there are certain rooting
characteristics which are associated with particular community functions (e.g. drought
resistance). If so, then the initial sets of analyses would provide us the management suggestions
necessary to cause those rooting traits to develop.
23
2.8. Subproject 2: Climate-induced shifts in C and N fluxes and microbial activity (Chang
and Cahill)
Two graduate students will be associated with this subproject designed to determine the
impacts of climate change and defoliation on C and N fluxes and microbial activity and
functional diversity. The project will be split into one study (Ph.D) addressing treatment impacts
on decomposition, water use efficiency, respiration, and photosynthesis, and a second study
(M.Sc.) addressing treatment effects on microbial populations, activity, and community
structure.
Carbon and nitrogen stocks in biomass will be quantified as described in Subproject 1.
Additional measures (twice per year) include: microbial C and N, soluble C and N, and net and
gross N mineralization rates. All soil sampling will occur in the clipped quadrats described
above, and will be to a depth of 30 cm, which consists of the main rooting zone in these systems
(Cahill and Wilson, pers. obs.). Soluble C and N concentrations will be extracted with water and
determined on a Shimadzu TOC-TN analyser. Net N mineralization rates will be determined
with the buried bag method and gross N mineralization rates with the 15N pool dilution method,
in-situ (35). Microbial biomass C and N concentrations will be measured using the chloroform-
fumigation extraction (36) as well as by the analysis of the phospholipid fatty acid (PLFA)
profiles (37). The latter method will provide information on the relative composition of bacteria
and fungi in the soil and provide an indication of microbial community composition. Microbial
functional diversity will be assessed with the BiologTM technique based on substrate utilization
patterns (38), and combined with the C and N flux measurements, will allow us to link soil
chemical and microbiological properties with ecosystem functions.
Decomposition rates will be measured using small litter bags filled with known amounts
of roots (buried at 10 cm below soil surface) and shoots (incubated at soil surface) collected in
year 1. Material will be collected and placed in the field each fall in all plots, with replicate bags
retrieved in the spring, summer, and fall. Materials in the bag will be dried, weighed, and
determined for %C and N and ash content. Ash-free dry weight will be determined to correct for
soil contamination. CO2 and N2O fluxes from the soils to the atmosphere will be measured
biweekly throughout each growing season. Due to logistical constraints, these soil-atmosphere
fluxes will only be measured at the Alberta site. Intensive measurements (daily and diurnal

24
measurements) will be conducted following rainfall and extended droughts to characterize the
response of the systems to such events, to allow us to quantify the effects of extreme weather
conditions on C and N fluxes and to scale up the measurements to an annual basis. The Daycent
ecosystem model (34) will be calibrated to model the dynamics of C and N fluxes in the system
and determine how they are affected by the imposed treatments. This will further improve our
ability to scale up the C and N fluxes to an annual basis.
Short-term treatment effects on photosynthesis and stomatal conductance will be
measured using a Li-Cor 6400 at the Alberta site. Longer term effects of the treatments on
stomatal conductance, water stress and use efficiency, and N cycling can be revealed by 13C and
15N concentrations in plant tissues (39). These will be measured in all plots twice each year,
using the material collected in Subproject 1.
Analyses will include the Daycent modeling approach with, as well as series of GLMM
as described in Subproject 1. A full assessment of the impact of climate change and
management practices on ecosystems C and N fluxes and their feedback to the climate system
will be performed.
2.9. Subproject 3: Effects of climate change and grazing pressure on biodiversity and trophic
structure of soil mesofauna (Proctor, Cahill, Wilson)
A Ph.D. student will lead the subproject testing the impact of climate change and
defoliation on soil invertebrate communities. We will target mesofauna (mites and springtails),
the dominant invertebrates documented in arid Alberta grasslands (24). Broad-scale, but coarse,
comparisons of soil invertebrates among locations will be conducted using the mini-rhizotron
images collected within Subproject 1. During image processing, numbers of mesofauna at
different depths will be recorded. This will allow us to see vertical shifts in distribution, but
image quality is too poor to allow identification of taxa beyond “mite” or “collembolan”. A
more detailed understanding of treatment effects on invertebrates requires soil extraction.
Because extraction and identification require substantial time in the laboratory, we will conduct
this aspect of the subproject only at the Alberta site. Two cores (3 cm diameter, 10 cm deep)
will be taken from each plot in each of the sampling periods (spring and peak biomass) each

25
year. Because we predict the influence of treatment to be strongest in the upper layer of soil,
each core will be divided into a 5 cm upper and 5 cm lower section, and invertebrates extracted
separately. Tullgren-style extractors will be used with invertebrates extracted into 70% EtOH.
Because some groups of mesofauna are more resistant to this desiccation-based extraction
method than others, we will also extract a subset of the residual cores via kerosene.
We plan on a rapid approach to biomass estimation. Mesofauna from a set of trial
extractions will be split into groups based on body structure (e.g. collembolans, hard-bodied
mites, soft-bodied mites). For each morphogroup, we will estimate the total area of a gridded
Petri dish that they cover when densely packed. Animals will then be dried and weighed to give
a per-surface-area estimate of biomass. Thus, when a treatment sample is sorted, we will first
arrange the animals into morphogroups, note the area covered, and then continue to sort finely
for taxonomic identification. For identification, animals will be sorted, counted, and
representatives cleared and mounted. We hope to identify to genus, but recognize that in many
cases (e.g. juveniles), family or superfamily may be the finest level possible. Voucher specimens
will be deposited at the Canadian National Collection of Insects and Arachnids in Ottawa. We
will also classify taxa into ‘trophic groups’ to help in construction of the network of plant-soil-
animal interactions. Although omnivory is common, one can often make generalizations about
the most usual diet at the family level. For taxa that ingest solid particles (e.g. most Oribatida),
we will examine gut contents of slide mounted individuals to determine some aspects of their
diet.
The statistical approach will be similar to that described in Subproject 1, a combination
of univariate and multivariate analyses to determine how altered climate and defoliation interact
to affect mesofauna abundance, distribution, biomass and composition. Relationships between
mesofauna abundance and biomass, as well as microbial biomass and diversity, will be explored
to understand the food web and the interrelationships between different components in the
ecosystem.

26
2.10. Synthesis (Cahill, Bork, Wilson, Chang, Proctor)
An innovative aspect of this project is the emphasis on the linkages between soil
chemistry, microbial activity, soil invertebrates, plant growth, grazing, and climate change,
rather than viewing these as discrete projects. A critical analytical objective will be the
integration of the datasets generated in each subproject, allowing us to test broader questions
about the interactions between climate change and ecosystem sustainability. This more synthetic
approach is enhanced by having field sites distributed over a broad geographic area. Synthesis
will be facilitated through integrated database management overseen by the project manager.
We will use a variety of analytical approaches, including Structured Equation Modelling,
Information Theoretic Approaches, and Simulation Building to explore the relative strengths of
the different potential functional links amongst our response variables. For example, we will
develop a model to explore the relative contributions of alternative plausible causal factors (e.g.
root turnover, microbial activity, etc.) which could alter carbon storage with decreased soil
moisture and increased temperatures. This approach will allow us to identify which of the
countless numbers of potential linkages are functionally most critical in this system for any
particular management goal or concern.
2.11. Project Work Plan and Communication
Cahill will serve as the primary group leader and as the direct supervisor of the Project
Manager who we will hire to oversee the logistics of the research and to conduct active research,
such as the synthesis of the datasets. Communication among the team members will happen on a
regular basis (daily or weekly as needed). Team members based in Regina will travel to
Edmonton for meetings twice each year, and will participate via teleconferencing for other
meetings. Communication with supporting organizations and other interested stakeholders will
occur informally throughout the project, as well as more formal annual two-day meetings.
During these meetings, students and PIs will report on progress to date, identify key milestones
yet to be achieved, and welcome input on direction and dissemination. This project will run
from approximately October 2006 – September 2009, allowing for three field seasons (2007,
27
2008, and 2009). The initial priorities will be to hire/recruit students and technical staff, build
research equipment, and install plots in time prior to the first growing season. All analytical
samples from one growing season will be processed prior to the initiation of the next growing
season, such that all students and technical staff will be very active 12 months/year. To facilitate
communication among team members, the general public, potential students, media groups, and
other researchers, the project coordinator will construct a high-quality web page describing this
project and related research. Technology transfer notes will be developed for dissemination of
research results to the collaborating organizations, user groups, and policy makers.
2.12. Access to Equipment, Field Sites, and Infrastructure
We have access to the infrastructure needed for this project, including field sites,
computer labs (UA, UR), plant and soil sample processing facility (UA), biogeochemical
analytical facilities (UA), three mini-rhizotron cameras (UA, UR), a Li-Cor 6400 for measures of
respiration and photosynthesis (UA), and a fabrication shop for building equipment (UA). The
Alberta field site is equipped with trailers, and provides a base of operations for the largest
component of this project. The satellite sites are provincial natural areas that are supportive of
field research and easily accessible. Resource use in this project involves four major areas: (1)
Construction of rainout shelters and OTC units, along with associated data loggers and probes to
measure their effectiveness. Without the ability to manipulate temperature and precipitation,
along with the ability to accurately record the level of manipulation, this project can not be
conducted. (2) People. A strength of this project is that we are using a variety of subdisciplines
to address a single unified question. However, this also means that we need a large group of
diverse HQP to conduct the research. (3) Travel. The field locations in this study span three
provinces, and there will be substantial travel between sites and home universities. Additionally,
numerous students will be living in the field for extended periods. (4) Analytical analyses. We
will be taking a large number of samples for C and N determination and measures of stable
isotopes. We are able to conduct all of these analyses at UA, at a cost greatly below commercial
rates. The comprehensive approach we are taking is a cornerstone of this innovative research
project.
28
2.13. Training of HQP
Over the course of three years, this project will train 2 M.Sc., 3 Ph.D. students, a project
manager, an image analyst (roots), 11 summer field assistants, and 15 undergraduate lab
assistants during the academic year (Total HQP = 33). This is a large number of HQP and
reflects the integrative nature of this research and our commitment to training HQP. Most
graduate students will be co-supervised. Two graduate students are already in place with one
having started in 2005 and the second starting in 2006. We will employ a full time Grade 8
technician (University of Alberta personnel scale) to help with coordination of research across
the field sites, supervision of students in the field, and with sample processing during the
academic year. Prior experiences with multi-investigator projects have taught us that this
position is critical to the integration of communication of information amongst team members
and to help keep all members working towards the same goal.
The supporting organizations will play an important role in the training of the HQP in
this project. Behan-Pelletier of the National Collection will assist with oribatid identifications
and training of the PhD student associated with Subproject 3. Ducks Unlimited and Alberta
Sustainable Resource Development will provide support for the graduate students with hands-on
training on range management issues and techniques. The graduate students in turn will provide
input to upgrade the producers’ knowledge about current developments and particularly results
from this project. Additional interactions with industry and other research will be facilitated
through support from the Agricultural Research and Extension Council of Alberta and the
Alberta Cooperative Conservation Research Unit. Each of the three subproject components will
train people to fill current and future gaps in expertise in our supporting (and other related)
organizations. All HQP will develop skills in plant identification, experimental design, statistical
analysis, and working in a large team. Subproject 1 will create rangeland ecologists able to
assess range health and address long-term rangeland sustainability. Subproject 2 will produce
people skilled in field and laboratory assessment of soil biogeochemistry. The Ph.D. student
from Subproject 3 (invertebrates) will graduate at a time when many of the mite taxonomists in
Canada are retiring or have already retired. Undergraduate technicians involved in all
subprojects would also gain skills that could be applied to research at AAFC stations anywhere
in the country.
29
Overall this project represents an outstanding opportunity for the training of HQP. The
PIs have diverse backgrounds, and established relationships with a variety of supporting
organizations. As a result, students will be trained in numerous technical skills, and more
importantly, they will be trained in an environment which encourages discussion and
communication across disciplines. We are taking a holistic approach with this research project
that will provide an excellent environment for the training of HQP.
2.14. Supporting Organizations
We have received support from various organizations in western Canada concerned with
the sustainable management of rangelands, including Ducks Unlimited Canada (DUC), the
Agricultural Research and Extension Council of Alberta (ARECA), and Alberta Sustainable
Resource Development (ASRD). Ducks Unlimited is Canada’s self-proclaimed “Conservation
Company”, with interest in maintaining habitat through land stewardship, particularly native
rangelands. ASRD and ARECA recognize the importance of rangelands to the economic well-
being of rural communities in western Canada. Additional support from Agriculture and Agri-
Food Canada indicates the realization that an understanding of the organisms which live in
rangelands soil is critical to any realistic long-term plan for sustainable production.
The potential impact of our work to increase understanding of the impacts of climate
change, along with the development of mitigation strategies is in part evidenced by the large
commitment BIOCAP Canada is willing to make to this project. Additional support from the
Faculty of Agriculture, Forestry and Home Economics at the University of Alberta further
highlights the interest in improving sustainable management of rangelands in the face of climate
change. PIs and graduate students will have substantial opportunities to interact with other
BIOCAP research groups, integrating our research focus with their prior and current work. For
example, this project can contribute to the Landscape Scale Research Group whose mandate is to
develop an understanding of how a variety of land use practices interact with climate change and
mitigation efforts. We will also encourage data sharing among groups, increasing the value of
these data through broader access.

30
Our plan for knowledge transfer will take advantage of the centralized research activities
associated with the Kinsella Research Station and its various outreach activities. The Kinsella
station is frequently used for demonstrations, field tours, and special seminars or workshops by
various commodity and interest groups in rural Alberta, as well as other visiting researchers to
the University of Alberta. We will also hold annual field days with invitations extended to all
interest groups, including stakeholder organizations such as ASRD, to review the field sites,
examine and discuss results, and provide feedback on the project. Throughout the research,
frequent communication will be made with provincial Alberta Agriculture, Food, and Rural
Development forage and beef extension specialists, as well as associated interest groups to
ensure they are kept informed of the results of the research. Similar outreach will occur in SK
and MB with producers and provincial and federal agricultural agencies in the communities
surrounding the two satellite field sites. We also anticipate our web page describing the project
will facilitate information dissemination to the general public, media, supporting organizations,
other researchers, and other interested groups.
Interim and final results of this research will be presented at various forums, including
international and national scientific meetings as well as regional meetings such as the annual
ARECA meeting, the Western Range Science Seminar, the Western Canadian Grazing
Conference, the Alberta Soil Science Workshop, and workshops organized by Climate Change
Central and BIOCAP Canada. Final results of this research will be published in peer-reviewed
articles for prompt transfer to other scientists (i.e., Ecology, Ecological Applications, Journal of
Applied Ecology, Soil Biology and Biochemistry, and Rangeland Ecology and Management),
and will be summarized in articles prepared for various popular press media, including
Cattlemen’s Magazine, Alberta Crops and Beef, Country Guide, and Rangelands. Final results
of this research will also be adapted into producer-friendly extension publications (e.g., AgDex
Factsheets on “Strategies to Manipulate Root Growth for Maximum Drought Resistance”), for
dissemination by the AAFRD extension office.
31
2.15. Benefits to Canada
Significant economic benefits are likely to arise from this research, mainly through the
ability to predict and anticipate changes in the quantity and quality of rangeland resources.
These resources are far larger that the 4.7% of Canada’s area occupied by the grassland biome,
because this biome is also the home of 14% of the country’s population, and 15% of its gross
domestic product. At current prices, cattle in the Prairie Provinces are worth nearly $10 billion
(Statistics Canada 2006), a figure that does not include the associated infrastructure such as
farms, feedlots, transportation and packing houses. Thus, increasing the value of this industry by
only a small amount would yield enormous economic benefits (e.g. a 1% increase in the value of
cattle is $100 million). We will contribute value by allowing managers to predict and anticipate
changes in range carrying capacity in response to the now widely-accepted warming trend. For
example, it is possible that drought-adapted prairie grasses will be little affected by small
increases in temperature. If so, then current grazing regimes can be maintained. Alternatively, a
reduced carrying capacity would signal a need for either reduced cattle numbers or alternative
feeding strategies.
A secondary long-term economic benefit will result from the knowledgeable stewardship
of rangeland soils. Environmental benefits will accrue for increasing our ability to store soil
carbon. We will learn how storage can be controlled via grazing, a wide-spread and relatively
easy to manage activity which, in contrast to forest growth, can be altered over relatively short
time frames. Grasslands store significantly more carbon belowground than do other vegetation
types, such as boreal forest. This fact combined with the total area of temperate grasslands,
means that temperate grasslands store 245% more C than boreal forests on a global scale
[grasslands: 119.7 x 10¹⁵ g; boreal forest: 48.7 x 10¹⁵ g (40)]. This information will allow
Canada to make an important contribution to global management of C storage. Canada is in a
unique position to provide information about the northern Great Plains, where lower
temperatures cause C storage to be likely greater than in the well-studied more southern
grasslands of the US. The data and understanding generated in this project will help fill critical
holes in our current understanding of carbon cycling, and will increase our ability to adequately
inventory Canada’s carbon stores.
32
An additional environmental benefit will be the conservation of biodiversity in native
grasslands used for cattle production. The only productive alternative to grazing in this region is
cultivation-based agriculture with consequent losses of habitat and soil organic matter. Social
benefits include an enhanced ability to keep ranchers employed growing livestock and
conserving native grassland, with consequent positive effects on rural prairie communities.
This investigation will also train unique Highly Qualified Personnel at all levels, including
> 10 undergraduate assistants, 5 graduate students and two research technicians. Training of
HQP is of strategic importance to Canada and will benefit the country in technology
development and economic growth in the long run. Good public policy has science as one of its
foundations. As noted above, our understanding of C storage in grassland soils is very weak
compared with that of forests. Much of the scientific literature about grasslands originates from
warmer and wetter climates, and the applicability of these results to Canadian issues is uncertain.
This project will address an important knowledge gap to society and the agriculture community
in particular.
2.16. References
(1.) R.E. Vance, D. Emerson, T. Habgood, Canadian Journal of Earth Sciences 20, 364-376
(1983). (2.) Environment Canada. (2002)
http://www.climatechange.gc.ca/english/publications/ccs/. (3.) W.K. Lauenroth, O.E. Sala,
Ecological Applications 2, 397-403 (1992). (4.) E.W. Bork, T. Thomas, B. McDougall, Journal
of Range Management 54, 243-248 (2001). (5.) J.E. Weaver, Ecological Monographs 28, 56-78
(1958). (6.) A.L. Hild, M.G. Karl, M.R. Haferkamp, R.K. Heitschmidt, Journal of Range
Management 54, 292- 298 (2001). (7.) D.A. Frank, M.M. Kuns, D.R. Guido, Ecology 83, 602-
606 (2002). (8.) A.H. Fitter et al., Oecologia 120, 575-581 (1999). (9.) J.S. Dukes et al., Plos
Biology 3, 1829-1837 (2005). (10.) E.J. Edwards, D.G. Benham, L.A. Marland, A.H. Fitter,
Global Change Biology 10, 209-227 (2004). (11.) D.F. Steinaker, S.D. Wilson, Ecology 86,
2825-2833 (2005). (12.) J.F. Cahill, Journal of Ecology 91, 532-540 (2003). (13.) J.F. Cahill,
S.W. Kembel, D.J. Gustafson, Journal of Ecology 93, 958-967 (2005). (14.) C.E. Wells, D.M.
Eissenstat, Ecology 82, 882-892 (2001). (15.) D.M. Eissenstat, C.E. Wells, R.D. Yanai, J.L.
33
Whitbeck, New Phytologist 147, 33-42 (2000). (16.) R.A. Gill, R.B. Jackson, New Phytologist
147, 13-31 (Jul, 2000). (17.) D.A. Wardle, Communities and ecosystems: Linking the
aboveground and belowground components (Princeton University Press, Princeton, 2002). (18.)
R.D. Bardgett, D.A. Wardle, Ecology 84, 2258-2268 (2003). (19.) J F. Cahill, J. Stacey, M.D.
Coupe, (in prep). (20.) R.D. Bardgett, M.B. Usher, D.W. Hopkins, Biological Diversity and
Function in Soil (Cambridge University Press, Cambridge, 2005). (21.) D.E. Walter, H.C.
Proctor, Mites: Ecology, evolution, and behaviour (University of New South Wales and CAB
International, 1999). (22.) J. Lussenhop, H. BassiriRad, Soil Biology & Biochemistry 37, 645-650
(2005). (23.) X. Ke, K. Winter, J. Filser, Soil Biology & Biochemistry 37, 731-738 (2005). (24.)
M.J. Clapperton, D.A. Kanashiro, V.M. Behan-Pelletier, Pedobiologia 46, 496-511 (2002). (25.)
B. Sohlenius, S. Bostrom, Applied Soil Ecology 12, 113-128 (1999). (26.) N. Lindberg, J.
Bengtsson, Applied Soil Ecology 28, 163-174 (2005). (27.) A.B. Frank, D.L. Tanaka, L.
Hofmann, R.F. Follett, Journal of Range Mngmt. 48, 470-474 (1995). (28.) J.F. Dormaar, B.W.
Adams, W.D. Willms, Journal of Range Management 47, 28-32 (1994). (29.) L.E. Rustad et al.,
Oecologia 126, 543-562 (2001). (30.) X.H. Zhou, R.A. Sherry, Y. An, L.L. Wallace, Y.Q. Luo,
Global Biogeo. Cycles 20 (2006). (31.) E.A. Paul, F.E. Clark, Soil microbiology and
biochemistry (Academic Press, San Diego, 1989). (32.) G.M. Marion, in ITEX Manual U. Molau,
P. Molgaard, Eds. (Danish Polar Center, Copenhagen, 1996). (33.) D.S. Hik, M. Brown, A.
Dabros, J. Weir, J.F. Cahill, American Journal of Botany 90, 270-277 (2003). (34.) W.J. Parton,
M. Hartman, D. Ojima, D. Schimel, Global And Planetary Change 19, 35-48 (1998). (35.) M.
Zaman, S.X. Chang, Biology and Fertility of Soils. 39, 269-279 (2004). (36.) E.D. Vance, P.C.
Brookes, D.S. Jenkinson, Soil Biology and Biochemistry 19, 703-707 (1987). (37.) C.D. Clegg,
Applied Soil Ecology 31, 73-82 (2006). (38.) L. Mariani, S.X. Chang, R. Kabzems, Soil Biology
and Biochemistry (under review). (39.) W.J. Choi, S.X. Chang, H.L. Allen, D.L. Kelting, H.M.
Ro, Forest Ecology and Management. 213, 90-101 (2005). (40.) W. M. Post, W. R. Emanuel, P.
J. Zinke, and A. G. Stangenberger, Nature. 298:156-159.
34
3. Summary of Second Year Results in the Study Examining Climate Change Impacts on Rangeland Function
3.1. Environmental Responses
3.1.1. Precipitation
Mean precipitation reduction in the plots with rainout shelters, and hence mean
precipitation addition to the “augmented rainfall” plots, was calculated at +/-48% rather than
70%, with values ranging from 36% to 59%. Rainfall interception by the rainout shelters was
calculated using the equation:
% reduction = Vol.H2O Collected / Vol.H2O Theoretical * 100%,
where: Vol.H2O Collected = volume of water collected and diverted from each -70% precipitation
plot, and Vol.H2O Theoretical = theoretical volume of ambient precipitation in each plot
The volume of water collected was calculated based on average water height in tanks
containing runoff from the -70% plots, while the theoretical precipitation volume was calculated
as rainfall (mm) recorded on site multiplied by the effective plot area. As there was a
discrepancy in total rainfall recorded by the two rain gauges at the study site, the larger recorded
rainfall was used to calculate the theoretical precipitation volume, ensuring that the estimated
magnitude of treatment effects was conservative.
Although our moisture modification treatments were slightly below anticipated values, a
48% reduction (or increase) in moisture still represents a major perturbation to the plant
communities examined. Moreover, a 50% increase or decrease in rainfall provides moisture
values across our experimental plots that are consistent with deviations considered typical of
variation within and between growing seasons in grasslands of western Canada (Fig. 1).
3.1.2. Air Temperature
Open-top chambers (OTCs) were effective in raising air temperatures 10 cm above the
soil surface. There were significant warming x sampling time interactions on air temperature for
all months, with the presence of OTCs significantly raising air temperatures during the day but
35
not at night (Table 1, Figs. 2-5). The magnitude of the warming effect varied by month, from a
moderate mean daytime increase in air temperature of 1.9°C in June, to a more substantial
increase of 3.2°C in July (Figs. 2-5). There were also significant precipitation x sampling time
and precipitation effects on air temperature in June and July, respectively (Table 1), although the
magnitude of these effects was minimal (Figs. 3, 4).
Observed temperature changes are important because they increase the potential for
evaporation of water during and after rainfall events. In addition, these temperature changes may
impose greater stress on vegetation during peak temperatures at mid afternoon, particularly
within a plant community dominated by cool season C3 species. Conversely, increased mid-day
temperatures may favor warm season C4 species such as Bouteloua gracilis over time.
3.1.3. Relative Humidity
Relative humidity was affected by a variety of main effects and interactions among the
warming, defoliation, and precipitation treatments, as well as sampling time, depending on the
month of assessment (Table 2). Main effects of warming and precipitation were present for all
months, as was a time of day effect. Warming raised relative humidity near the ground surface
by 1.6 - 4.0%, depending on the month (Figs. 6-9). Although the magnitude of differences
among precipitation treatments varied among months, the general trend remained consistent
whereby relative humidity increased from the -70%, through the ambient and +70% precipitation
treatments. Maximum differences in humidity between treatments within a month varied from a
low of 2.0% in May to a high of 7.7% in July (Figs. 6-9). Relative humidity was 35 - 38%
greater at night than during the day (Figs. 6-9). In addition to these effects, there was a
significant precipitation treatment x sampling time effect in June, July, and August. For these
months, the effects of precipitation treatment on relative humidity were more pronounced during
the day than at night. A number of other significant and near-significant effects were observed
for one or two months, and are summarized in Table 2.
Relative humidity is an important factor regulating water use and conservation in
grasslands, with high humidity leading to reduced moisture loss, both through evaporation and
transpiration mechanisms. Conversely, the lower observed humidity associated with reductions
36
in precipitation is more likely to reduce plant growth by forcing water conservation in plants
during photosynthesis, and may account for reductions in yield during drought periods.
3.1.4. Soil Temperature
There were significant warming and sampling time effects on soil temperature in both the
0-5 cm and 5-20 cm soil layers during all months (Tables 3, 4). Warming increased soil
temperature 0.6 – 1.9°C in the 0-5 cm profile depending on month, with a significantly greater
warming effect observed during the day than at night in May and July (Table 3, Figs. 10-13).
Significant warming x time effects at the 5-20 cm depth soil temperature were observed for all
months (Table 4), with OTCs increasing temperatures 1.1 – 1.6°C during the day and 0.2 - 0.6°C
at night (Figs. 14-17).
There were significant defoliation main effects on soil temperatures in both soil depth
layers for all months, with the exception of the 0-5 cm profile in August (Tables 3, 4).
Additionally, there were significant defoliation x time interactions in the 0-5 cm profile in May,
June, and July (Table 3). Increasing defoliation intensity resulted in high soil temperatures in all
months for the 5-20 cm layer, with the maximum variation between treatments ranging from
0.5°C in August to 1.2°C in July (Figs. 14-17). This pattern generally held in the 0-5 cm layer,
but with a significantly greater range in temperatures observed during the day than at night.
Maximum variation between treatments during the day varied from 1.0°C in August to 2.4°C in
July, and from 0.2°C in August to 0.4°C in July at night (Figs. 10-13). Summaries of all
significant and near significant interactions are in Tables 3 and 4.
Increased soil temperatures, particularly in the day during mid-summer, and in the
presence of defoliation, are important as they reinforce the effectiveness of the OTCs in
increasing the temperature that vegetation and soils are exposed to within our warmed plots.
Even small increases of 1-2°C are important in that they greatly increase the potential for
evaporation, as well as influence key biological/ecological processes such as rates of nutrient
cycling (i.e. decomposition). The influence of defoliation in increasing temperatures is not
surprising given that the removal of biomass (both living plant material and litter) is likely to
increasing the amount of solar radiation reaching the soil surface following loss of the protective
insulating layer.
37
3.1.5. Soil Moisture
Not surprisingly, the precipitation treatments significantly affected soil moisture during
all eight sampling times listed here, with significant warming main effects and/or interactions
with precipitation for all eight times as well (Table 5). There was no consistent pattern in soil
moisture for those times where only a precipitation main effect was observed (May 15 and
August 15, 30). However, the May sampling time occurred only 7 days after the precipitation
shelters were installed for the season, so it is likely that these treatments were not in place long
enough to lead to any measurable effect. Patterns for the August sampling times were generally
as expected, with greater than ambient soil moisture in the +70% plots for both times and lower
than ambient soil moisture in the -70% plots during August 30 (August 15: 28.5% VWC
Ambient, 30.1% -70% Precipitation, 34.3% +70% Precipitation) (Fig. 18). As there was
approximately 80 mm of rainfall at the site on August 11, it could be that there was insufficient
time for the drought treatment to re-establish an effect (i.e. produce measurable moisture
deficits) by the time of sampling.
There was a consistent relationship between the +70% and -70% treatments when
significant warming x precipitation interactions were present, with soil moisture in the -70%
plots approximately 40% of that recorded in the +70% plots (Fig. 18). Soil moisture in the
ambient plots, however, was more similar to that recorded in the -70% plots when OTCs were
present, and similar to that recorded in the +70% plots when OTCs were absent. These findings
suggest that there may have been increased evapo-transpiration within warmed plots.
Alternatively, this observation may be an artifact of the OTCs preventing precipitation from
entering the sides of these plots, and will require further examination. Temporal variation in
precipitation effects for both the 0-5 cm and 5-20 cm soil layers can be seen in Fig. 18.
Warming x depth interactions were observed for all but two of the sampling times. The
general pattern of the interaction was for slightly lower soil moisture in warmed plots than
control plots in the 5-20 cm layer, but greater soil moisture in control plots than warmed plots in
the 0-5 cm layer. Differences between control and warmed plots in the 5-20 cm layer ranged
from 0.3% to 2.6% VWC, while differences between control and warmed in the 0-5 cm layer
ranged from 5.8% to 10.3% VWC. A summary of all significant and near-significant treatment
effects and interactions is presented in Table 5.
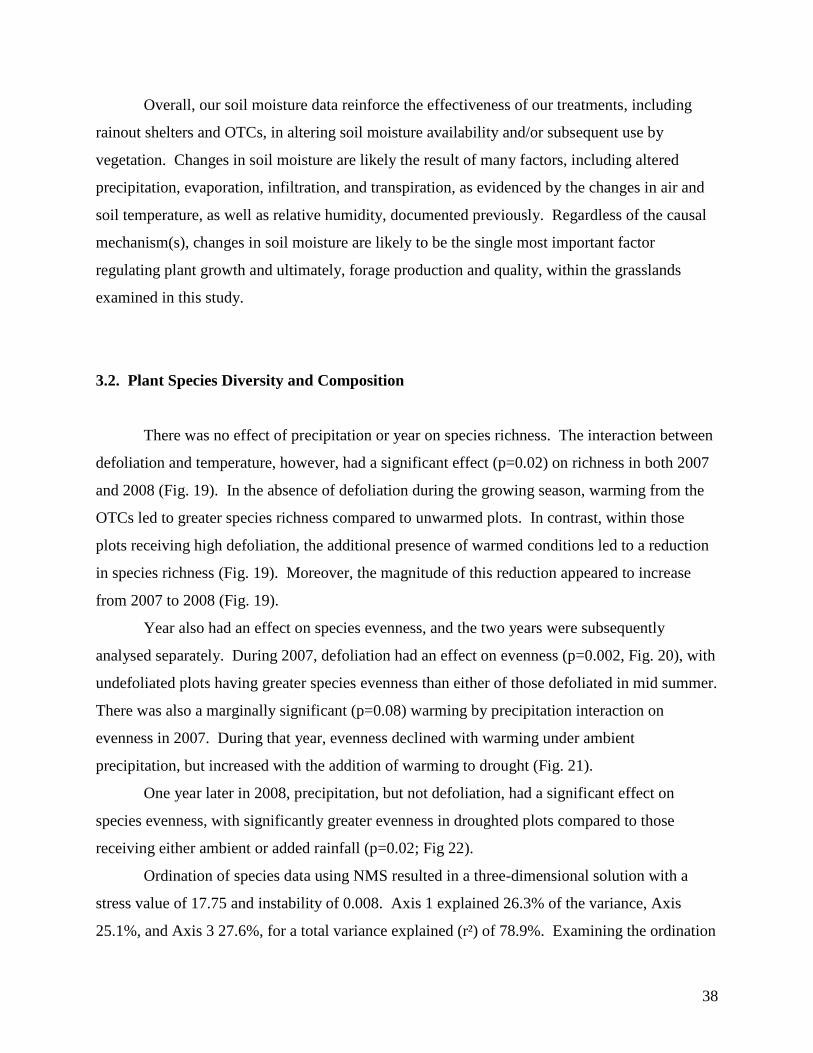
38
Overall, our soil moisture data reinforce the effectiveness of our treatments, including
rainout shelters and OTCs, in altering soil moisture availability and/or subsequent use by
vegetation. Changes in soil moisture are likely the result of many factors, including altered
precipitation, evaporation, infiltration, and transpiration, as evidenced by the changes in air and
soil temperature, as well as relative humidity, documented previously. Regardless of the causal
mechanism(s), changes in soil moisture are likely to be the single most important factor
regulating plant growth and ultimately, forage production and quality, within the grasslands
examined in this study.
3.2. Plant Species Diversity and Composition
There was no effect of precipitation or year on species richness. The interaction between
defoliation and temperature, however, had a significant effect (p=0.02) on richness in both 2007
and 2008 (Fig. 19). In the absence of defoliation during the growing season, warming from the
OTCs led to greater species richness compared to unwarmed plots. In contrast, within those
plots receiving high defoliation, the additional presence of warmed conditions led to a reduction
in species richness (Fig. 19). Moreover, the magnitude of this reduction appeared to increase
from 2007 to 2008 (Fig. 19).
Year also had an effect on species evenness, and the two years were subsequently
analysed separately. During 2007, defoliation had an effect on evenness (p=0.002, Fig. 20), with
undefoliated plots having greater species evenness than either of those defoliated in mid summer.
There was also a marginally significant (p=0.08) warming by precipitation interaction on
evenness in 2007. During that year, evenness declined with warming under ambient
precipitation, but increased with the addition of warming to drought (Fig. 21).
One year later in 2008, precipitation, but not defoliation, had a significant effect on
species evenness, with significantly greater evenness in droughted plots compared to those
receiving either ambient or added rainfall (p=0.02; Fig 22).
Ordination of species data using NMS resulted in a three-dimensional solution with a
stress value of 17.75 and instability of 0.008. Axis 1 explained 26.3% of the variance, Axis
25.1%, and Axis 3 27.6%, for a total variance explained (r²) of 78.9%. Examining the ordination
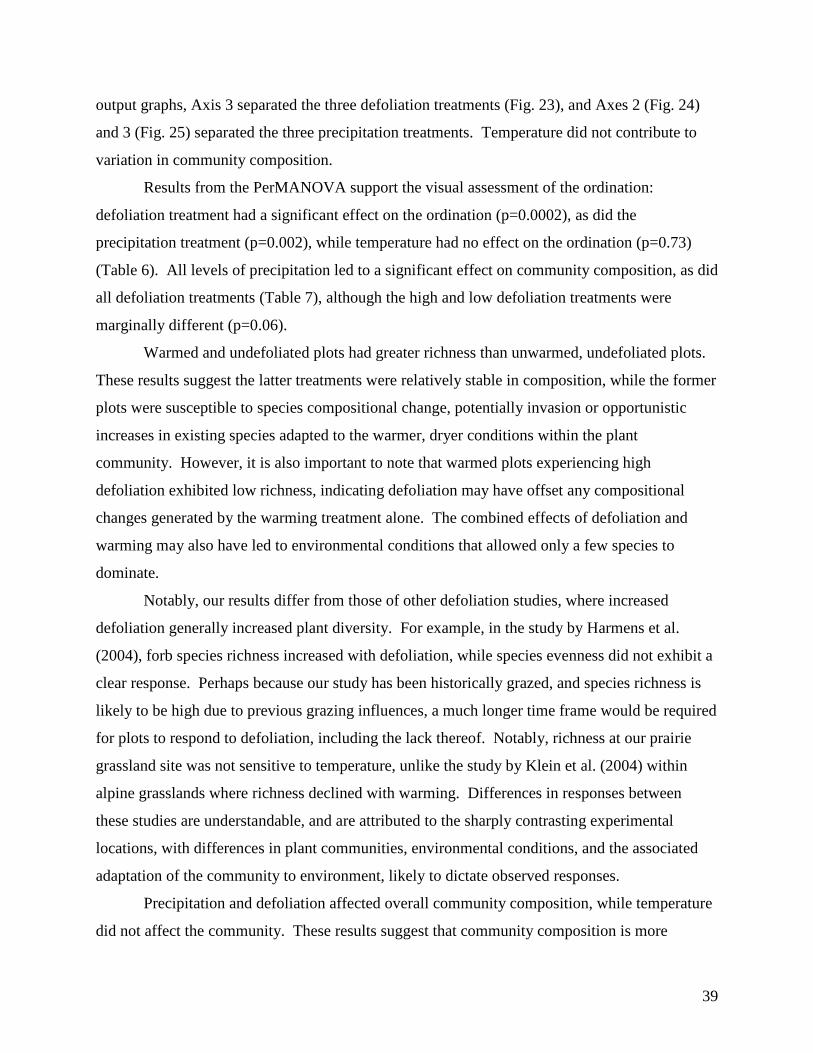
39
output graphs, Axis 3 separated the three defoliation treatments (Fig. 23), and Axes 2 (Fig. 24)
and 3 (Fig. 25) separated the three precipitation treatments. Temperature did not contribute to
variation in community composition.
Results from the PerMANOVA support the visual assessment of the ordination:
defoliation treatment had a significant effect on the ordination (p=0.0002), as did the
precipitation treatment (p=0.002), while temperature had no effect on the ordination (p=0.73)
(Table 6). All levels of precipitation led to a significant effect on community composition, as did
all defoliation treatments (Table 7), although the high and low defoliation treatments were
marginally different (p=0.06).
Warmed and undefoliated plots had greater richness than unwarmed, undefoliated plots.
These results suggest the latter treatments were relatively stable in composition, while the former
plots were susceptible to species compositional change, potentially invasion or opportunistic
increases in existing species adapted to the warmer, dryer conditions within the plant
community. However, it is also important to note that warmed plots experiencing high
defoliation exhibited low richness, indicating defoliation may have offset any compositional
changes generated by the warming treatment alone. The combined effects of defoliation and
warming may also have led to environmental conditions that allowed only a few species to
dominate.
Notably, our results differ from those of other defoliation studies, where increased
defoliation generally increased plant diversity. For example, in the study by Harmens et al.
(2004), forb species richness increased with defoliation, while species evenness did not exhibit a
clear response. Perhaps because our study has been historically grazed, and species richness is
likely to be high due to previous grazing influences, a much longer time frame would be required
for plots to respond to defoliation, including the lack thereof. Notably, richness at our prairie
grassland site was not sensitive to temperature, unlike the study by Klein et al. (2004) within
alpine grasslands where richness declined with warming. Differences in responses between
these studies are understandable, and are attributed to the sharply contrasting experimental
locations, with differences in plant communities, environmental conditions, and the associated
adaptation of the community to environment, likely to dictate observed responses.
Precipitation and defoliation affected overall community composition, while temperature
did not affect the community. These results suggest that community composition is more
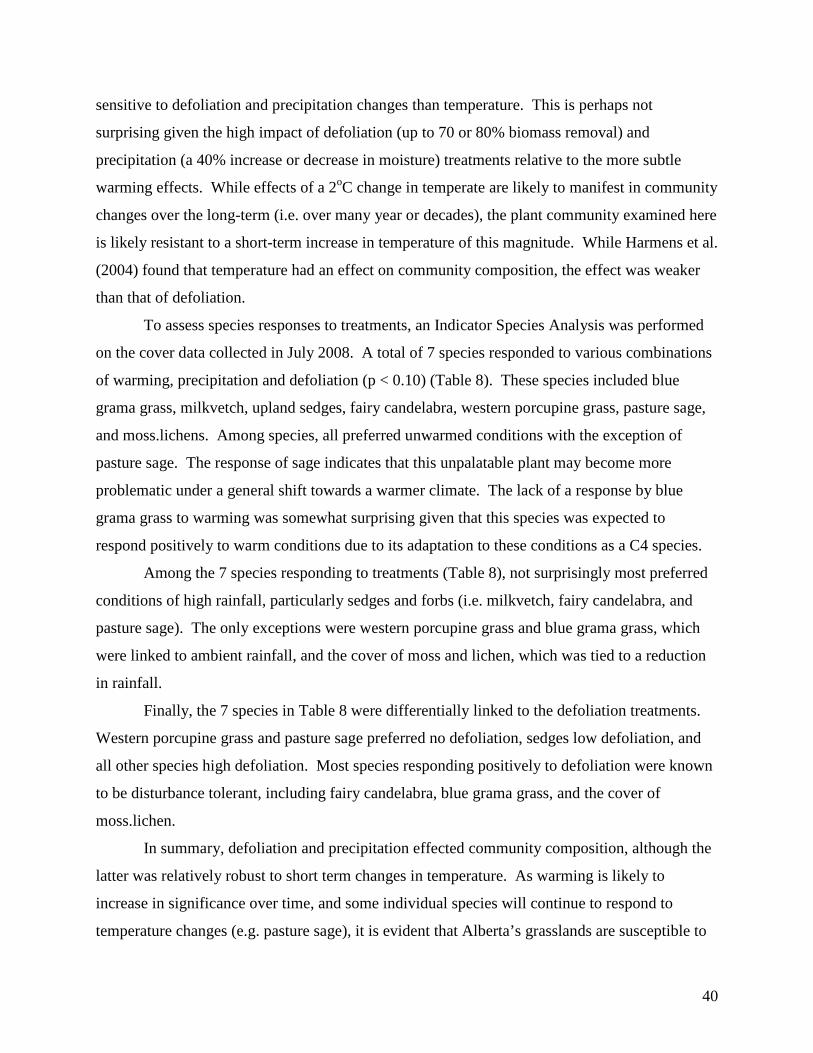
40
sensitive to defoliation and precipitation changes than temperature. This is perhaps not
surprising given the high impact of defoliation (up to 70 or 80% biomass removal) and
precipitation (a 40% increase or decrease in moisture) treatments relative to the more subtle
warming effects. While effects of a 2oC change in temperate are likely to manifest in community
changes over the long-term (i.e. over many year or decades), the plant community examined here
is likely resistant to a short-term increase in temperature of this magnitude. While Harmens et al.
(2004) found that temperature had an effect on community composition, the effect was weaker
than that of defoliation.
To assess species responses to treatments, an Indicator Species Analysis was performed
on the cover data collected in July 2008. A total of 7 species responded to various combinations
of warming, precipitation and defoliation (p < 0.10) (Table 8). These species included blue
grama grass, milkvetch, upland sedges, fairy candelabra, western porcupine grass, pasture sage,
and moss.lichens. Among species, all preferred unwarmed conditions with the exception of
pasture sage. The response of sage indicates that this unpalatable plant may become more
problematic under a general shift towards a warmer climate. The lack of a response by blue
grama grass to warming was somewhat surprising given that this species was expected to
respond positively to warm conditions due to its adaptation to these conditions as a C4 species.
Among the 7 species responding to treatments (Table 8), not surprisingly most preferred
conditions of high rainfall, particularly sedges and forbs (i.e. milkvetch, fairy candelabra, and
pasture sage). The only exceptions were western porcupine grass and blue grama grass, which
were linked to ambient rainfall, and the cover of moss and lichen, which was tied to a reduction
in rainfall.
Finally, the 7 species in Table 8 were differentially linked to the defoliation treatments.
Western porcupine grass and pasture sage preferred no defoliation, sedges low defoliation, and
all other species high defoliation. Most species responding positively to defoliation were known
to be disturbance tolerant, including fairy candelabra, blue grama grass, and the cover of
moss.lichen.
In summary, defoliation and precipitation effected community composition, although the
latter was relatively robust to short term changes in temperature. As warming is likely to
increase in significance over time, and some individual species will continue to respond to
temperature changes (e.g. pasture sage), it is evident that Alberta’s grasslands are susceptible to
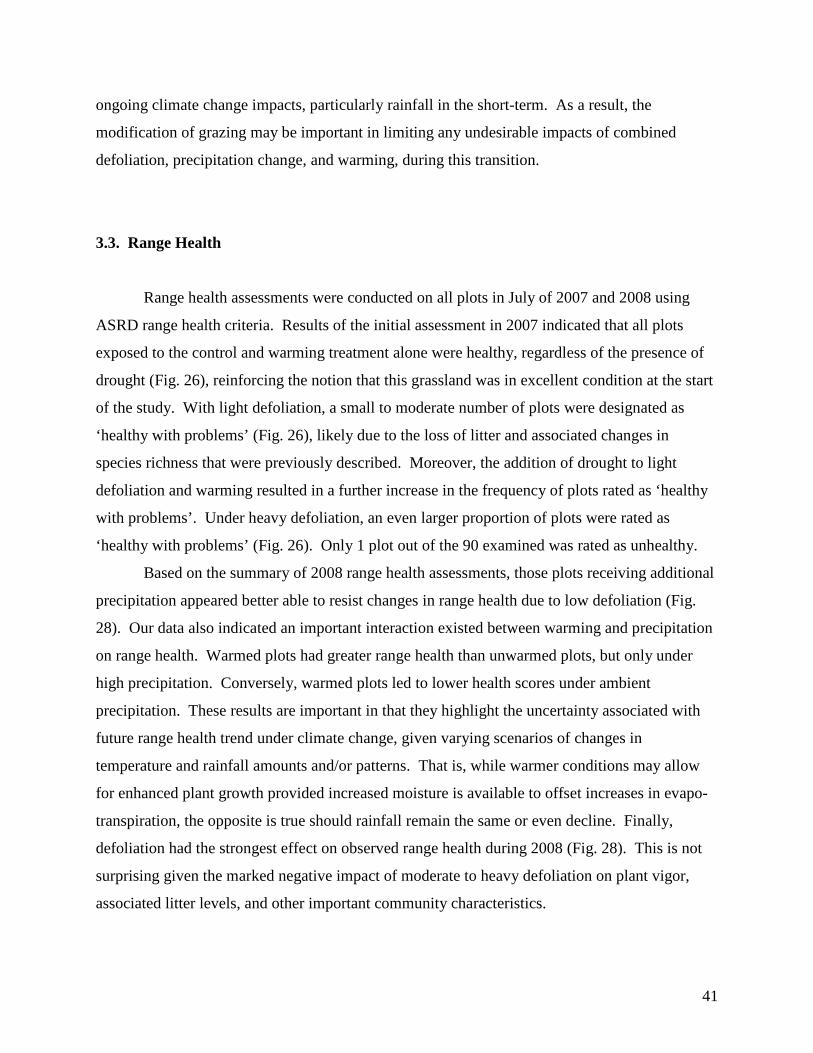
41
ongoing climate change impacts, particularly rainfall in the short-term. As a result, the
modification of grazing may be important in limiting any undesirable impacts of combined
defoliation, precipitation change, and warming, during this transition.
3.3. Range Health
Range health assessments were conducted on all plots in July of 2007 and 2008 using
ASRD range health criteria. Results of the initial assessment in 2007 indicated that all plots
exposed to the control and warming treatment alone were healthy, regardless of the presence of
drought (Fig. 26), reinforcing the notion that this grassland was in excellent condition at the start
of the study. With light defoliation, a small to moderate number of plots were designated as
‘healthy with problems’ (Fig. 26), likely due to the loss of litter and associated changes in
species richness that were previously described. Moreover, the addition of drought to light
defoliation and warming resulted in a further increase in the frequency of plots rated as ‘healthy
with problems’. Under heavy defoliation, an even larger proportion of plots were rated as
‘healthy with problems’ (Fig. 26). Only 1 plot out of the 90 examined was rated as unhealthy.
Based on the summary of 2008 range health assessments, those plots receiving additional
precipitation appeared better able to resist changes in range health due to low defoliation (Fig.
28). Our data also indicated an important interaction existed between warming and precipitation
on range health. Warmed plots had greater range health than unwarmed plots, but only under
high precipitation. Conversely, warmed plots led to lower health scores under ambient
precipitation. These results are important in that they highlight the uncertainty associated with
future range health trend under climate change, given varying scenarios of changes in
temperature and rainfall amounts and/or patterns. That is, while warmer conditions may allow
for enhanced plant growth provided increased moisture is available to offset increases in evapo-
transpiration, the opposite is true should rainfall remain the same or even decline. Finally,
defoliation had the strongest effect on observed range health during 2008 (Fig. 28). This is not
surprising given the marked negative impact of moderate to heavy defoliation on plant vigor,
associated litter levels, and other important community characteristics.
42
As a potential undesirable weed responding to warming, we conducted a further
assessment on the cover of pasture sage across the treatments (Fig. 28). Pasture sage cover
generally increased with greater rainfall, and declined sharply with dry conditions. Under
drought conditions, little effect of warming was apparent. However, under either ambient or
above normal rainfall, warming had a sharply contrasting impact that depended on defoliation
intensity. In the absence of defoliation, warming increased the cover of pasture sage (Fig. 28).
However, under high defoliation warming actually resulted in a reduction in pasture sage cover.
Given that defoliation was not selective (i.e. sage was also defoliated), the latter result represents
a reduction in resilience (i.e. recovery) of sage under warmed conditions following heavy
defoliation.
Overall, these results suggest that the range health assessment appears capable of
capturing variation in treatment responses, including that of warming, precipitation change and
defoliation. Future changes in range health rating scores are likely as the cumulative effects of
all three treatments continue to develop over the next several years. Data from 2009 in
particular, will provide clearer evidence of the utility of the range health scores for assessing
rangeland resistance to degradation under each disturbance, and may provide insight into the
disturbance thresholds likely to cause accelerated loss of range condition.
3.4. Vegetation Biomass
Year had an effect on productivity of all three growth forms, and thus years were
analyzed separately. In both years, total productivity was affected by precipitation and
defoliation (2007: def p<0.0001, precip p=0.001; 2008: def p=0.002, precip p=0.0002) (Fig. 29),
but not temperature. During 2007 total productivity increased with greater severity of
defoliation, although the extent of the increase was much larger under ambient moisture than
droughted plots (Fig. 29). Among growth forms, grass production in 2007 was affected by all
the treatments, (def p<0.0001, precip p=0.001, temp p=0.06; Fig. 30). Grass productivity was
reduced by drought, but increased with defoliation of any severity (Fig. 30).
One year later in 2008, total production once again increased in plots receiving either
moderate or high severity defoliation (Fig. 29). Similarly, production closely followed the total
43
amount of moisture as determined by the rainfall treatments. However, grass productivity was
affected by precipitation only (p<0.0001), decreasing with a reduction in precipitation. Unlike
the year before, forb productivity responded to treatments in 2008: forb productivity declined
with defoliation (p=0.02), and there was an additional temperature by precipitation interaction
(p=0.03) (Fig. 31). Under ambient and increased precipitation, forbs within the warmed
treatment had lower biomass than the unwarmed treatments, while under decreased precipitation
levels, forbs in the warmed treatment produced more biomass across all defoliation treatments
(Fig. 31).
Our results documenting temperate grassland responses to climatic factors in central
Alberta contrast those from arctic and alpine environments, which generally respond strongly to
climate and defoliation manipulations (Walker et al., 2006, Klein et al., 2004, Rustad et al.,
2001). For example, in the meta-analysis by Rustad et al. (2001) of warming experiments,
primary productivity in grasslands responded both positively and negatively to warming, with an
average response near zero.
One theory that explains the disparity between temperate grassland responses to stresses
like defoliation, precipitation, and temperature changes, is that these responses depend closely on
successional status (Grime et al. 2000). After five years of precipitation and temperature
manipulation in two grassland sites, the later successional site had no response to the treatments,
but productivity and community composition in the early successional grassland responded to all
treatments (Grime et al., 2000). Our site was historically moderately grazed prior to the
initiation of the experiment, and thus our site may be mid-successional, explaining why we saw
some treatment responses, but not as many as Grime observed at the early successional site.
In another study by Harmens et al. (2004), forb biomass increased in response to high
(frequent) defoliation coupled with warming, but declined with low defoliation and warming.
This outcome is similar to our results, although temperature interacted with precipitation instead
of defoliation to increase forb biomass. Plots exposed to the combined stress of decreased
precipitation (i.e. drought) and warming had greater forb biomass than unwarmed plots.
Additionally, within plots receiving ambient or high precipitation, forbs had lower biomass when
exposed to warming compared to the unwarmed treatments. Thus, it appears that forbs likely
have a competitive advantage under stressful growing conditions.
44
3.5. Soil Carbon and Nitrogen Dynamics
Summary results of the analysis of soil carbon and nitrogen data are provided in Table 9,
while data on gas fluxes are provided in Table 10.
3.5.1. Soil Microbial Biomass Carbon and Nitrogen
Soil microbial biomass carbon (MBC) showed strong inter-annual variability at both
shallow (0-5 cm) and deeper (5-15 cm) soil depths, with MBC greater during the second year of
the study. From the first to the second year of the study, MBC increased from 2.9 to 4.3, and 0.9
to 1.16 g/kg in the 0-5 and 5-15 cm soil layers, respectively (Fig. 32).
Within the 0-5 cm soil layer, high intensity defoliation decreased MBC from 3.5 to 2.5
g/kg in 2007. Similarly, levels of MBC declined from 4.29 (non-defoliation) and 5.19 (low
defoliation) to 3.4 g/kg (high defoliation) in 2008 (Fig. 32). In contrast, low defoliation had no
influence on soil MBC. In contrast to defoliation, warming increased MBC from 2.4 to 3.5 g/kg
in 2007 (Fig. 32). Precipitation also influenced MBC. Values of MBC increased at the 0-5 cm
soil depth from 4.6 g/kg in control plots to 5.3 g/kg under high precipitation, but decreased to 2.9
g/kg under reduced precipitation in 2008 (Table 9 and Fig. 32).
At the deeper soil depth (5-15 cm), defoliation also influenced MBC in 2007 (Table 9),
similar to that observed in the 0-5 cm soil layer. Soil MBC under reduced precipitation (1.04
g/kg) was lower than that documented under high precipitation (1.31 g/kg) during 2008.
Soil microbial biomass nitrogen (MBN) exhibited considerable inter-annual variability at
both soil depths (Table 9). During 2008, MBN was significantly greater at 0-5 cm (values
ranged from 2.9 to 4.3 g/kg) than at 5-15 cm (0.93 to 1.16 g/kg) soil depth (Figure 33). Levels of
MBN increased from 0.34 to 0.49 g/kg in response to warming in the 0-5 cm soil layer in 2007.
Precipitation was a key factor determining soil MBN in both 2007 and 2008 (Table 9). Reduced
precipitation decreased soil MBN in both years. In 2008, soil MBN was significantly greater
within precipitation addition plots (1.7 g/kg) compared to plots with ambient rainfall (1.1 g/kg).
The strong effect of defoliation on soil microbial biomass in our study illustrates the
influence of important belowground (i.e. soil) and aboveground (i.e. plant) processes interacting
45
with one another (Grime, 2001; Wardle et al., 2004; Bardgett et al., 2005). Soil microbial
populations directly influence carbon substrate quantity and quality (Bardgett et al., 1997).
Defoliation tended to decrease MBC and MBN because of the removal of plant biomass and
organic matter from these plots, decreasing soil organic carbon input and availability to
microbial populations, resulting in the reduction in soil MBC (Garcia, 1992; Zhang et al., 2005).
In general, warming increased soil microbial biomass in our study, for which there are
several potential explanations, including that 1) warming accelerated organic matter breakdown
leading to greater organic carbon availability for microbial population growth during
decomposition, or 2) warming enhanced plant growth, particularly belowground. Positive
responses of plant biomass to warming are known to increase soil C substrate available for
microbes (Wan et al., 2005; Belay-Tedla et al., 2009). Soil microbial responses to experimental
warming in other studies have been inconsistent. For example, 12 years of experimental
warming decreased the size of some microbial populations due to a reduction in labile C
availability (Frey et al., 2008).
The reduction in MBC and MBN with reduced precipitation may partially be explained
by a decline in soil C substrate as a consequence of suppressed plant growth (Peters et al., 2007),
or by the fact that soil wetting after a drought situation can induce bacteria lysis (Fierer et al.,
2003), thereby substantially decreasing total soil microbial biomass (Kassem et al., 2008).
Increased precipitation increased microbial N. The addition of precipitation resulted in an
obvious and predictable stimulation in grass productivity, which in turn, increased inputs of plant
biomass C and associated soil C substrates. Ultimately, this would enhance belowground C
allocations (Zak et al., 1994) and consequently support larger soil microbial populations.
3.5.2. Soil Dissolved Organic Carbon and Nitrogen
Soil dissolved organic carbon (DOC) and dissolved organic nitrogen (DON) showed few
responses to treatments over the first two years of data collection (Table 9; Figs. 34, 35).
However, annual variability of DOC between growing seasons was significant at both soil
depths. Concentrations of DOC were greater in the 0-5 cm soil layer than in 5-15 cm soil.
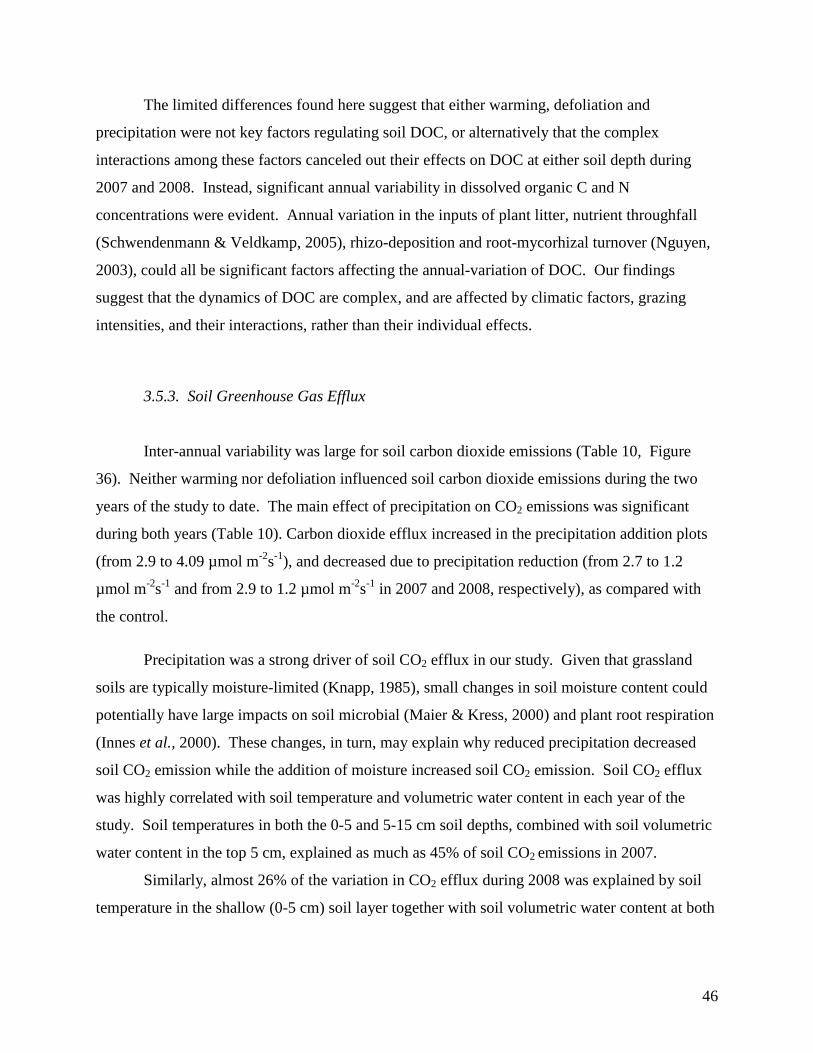
46
The limited differences found here suggest that either warming, defoliation and
precipitation were not key factors regulating soil DOC, or alternatively that the complex
interactions among these factors canceled out their effects on DOC at either soil depth during
2007 and 2008. Instead, significant annual variability in dissolved organic C and N
concentrations were evident. Annual variation in the inputs of plant litter, nutrient throughfall
(Schwendenmann & Veldkamp, 2005), rhizo-deposition and root-mycorhizal turnover (Nguyen,
2003), could all be significant factors affecting the annual-variation of DOC. Our findings
suggest that the dynamics of DOC are complex, and are affected by climatic factors, grazing
intensities, and their interactions, rather than their individual effects.
3.5.3. Soil Greenhouse Gas Efflux
Inter-annual variability was large for soil carbon dioxide emissions (Table 10, Figure
36). Neither warming nor defoliation influenced soil carbon dioxide emissions during the two
years of the study to date. The main effect of precipitation on CO2 emissions was significant
during both years (Table 10). Carbon dioxide efflux increased in the precipitation addition plots
(from 2.9 to 4.09 µmol m-2s-1), and decreased due to precipitation reduction (from 2.7 to 1.2
µmol m-2s-1 and from 2.9 to 1.2 µmol m-2s-1 in 2007 and 2008, respectively), as compared with
the control.
Precipitation was a strong driver of soil CO2 efflux in our study. Given that grassland
soils are typically moisture-limited (Knapp, 1985), small changes in soil moisture content could
potentially have large impacts on soil microbial (Maier & Kress, 2000) and plant root respiration
(Innes et al., 2000). These changes, in turn, may explain why reduced precipitation decreased
soil CO2 emission while the addition of moisture increased soil CO2 emission. Soil CO2 efflux
was highly correlated with soil temperature and volumetric water content in each year of the
study. Soil temperatures in both the 0-5 and 5-15 cm soil depths, combined with soil volumetric
water content in the top 5 cm, explained as much as 45% of soil CO2 emissions in 2007.
Similarly, almost 26% of the variation in CO2 efflux during 2008 was explained by soil
temperature in the shallow (0-5 cm) soil layer together with soil volumetric water content at both
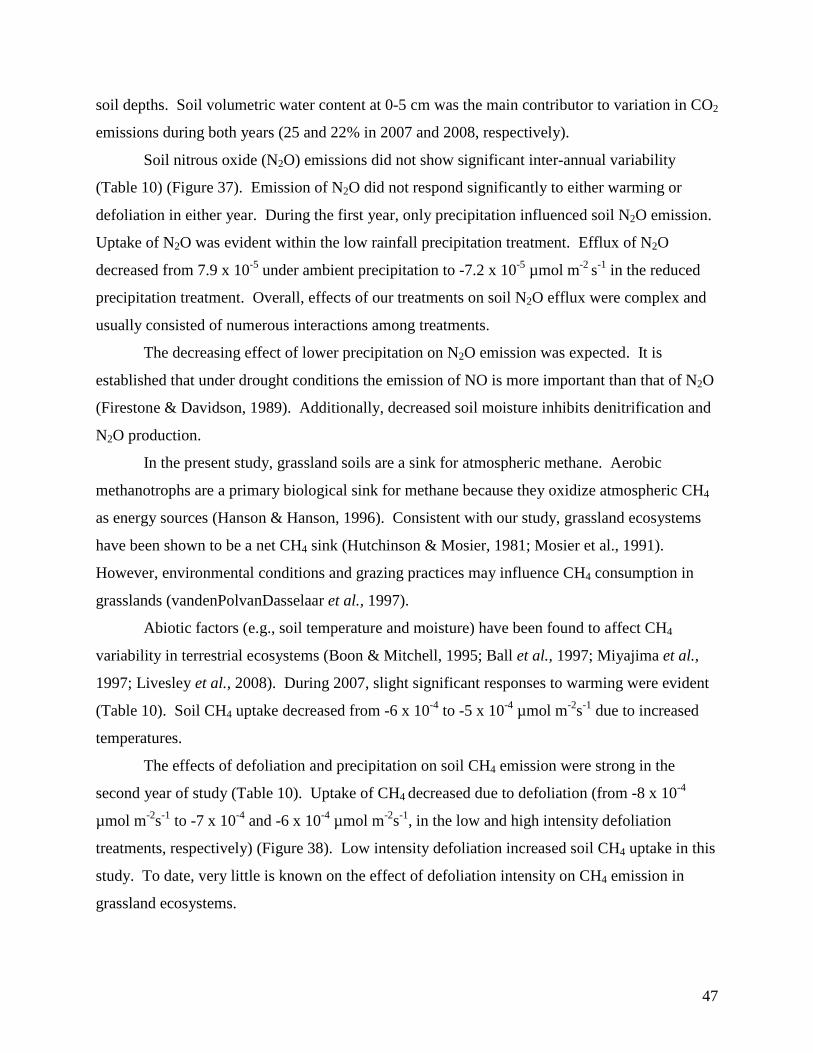
47
soil depths. Soil volumetric water content at 0-5 cm was the main contributor to variation in CO2
emissions during both years (25 and 22% in 2007 and 2008, respectively).
Soil nitrous oxide (N2O) emissions did not show significant inter-annual variability
(Table 10) (Figure 37). Emission of N2O did not respond significantly to either warming or
defoliation in either year. During the first year, only precipitation influenced soil N2O emission.
Uptake of N2O was evident within the low rainfall precipitation treatment. Efflux of N2O
decreased from 7.9 x 10⁻⁵ under ambient precipitation to -7.2 x 10⁻⁵ µmol m-2 s-1 in the reduced
precipitation treatment. Overall, effects of our treatments on soil N2O efflux were complex and
usually consisted of numerous interactions among treatments.
The decreasing effect of lower precipitation on N2O emission was expected. It is
established that under drought conditions the emission of NO is more important than that of N2O
(Firestone & Davidson, 1989). Additionally, decreased soil moisture inhibits denitrification and
N2O production.
In the present study, grassland soils are a sink for atmospheric methane. Aerobic
methanotrophs are a primary biological sink for methane because they oxidize atmospheric CH4
as energy sources (Hanson & Hanson, 1996). Consistent with our study, grassland ecosystems
have been shown to be a net CH4 sink (Hutchinson & Mosier, 1981; Mosier et al., 1991).
However, environmental conditions and grazing practices may influence CH4 consumption in
grasslands (vandenPolvanDasselaar et al., 1997).
Abiotic factors (e.g., soil temperature and moisture) have been found to affect CH4
variability in terrestrial ecosystems (Boon & Mitchell, 1995; Ball et al., 1997; Miyajima et al.,
1997; Livesley et al., 2008). During 2007, slight significant responses to warming were evident
(Table 10). Soil CH4 uptake decreased from -6 x 10⁻⁴ to -5 x 10⁻⁴ µmol m-2s-1 due to increased
temperatures.
The effects of defoliation and precipitation on soil CH4 emission were strong in the
second year of study (Table 10). Uptake of CH4 decreased due to defoliation (from -8 x 10⁻⁴
µmol m-2s-1 to -7 x 10⁻⁴ and -6 x 10⁻⁴ µmol m-2s-1, in the low and high intensity defoliation
treatments, respectively) (Figure 38). Low intensity defoliation increased soil CH4 uptake in this
study. To date, very little is known on the effect of defoliation intensity on CH4 emission in
grassland ecosystems.
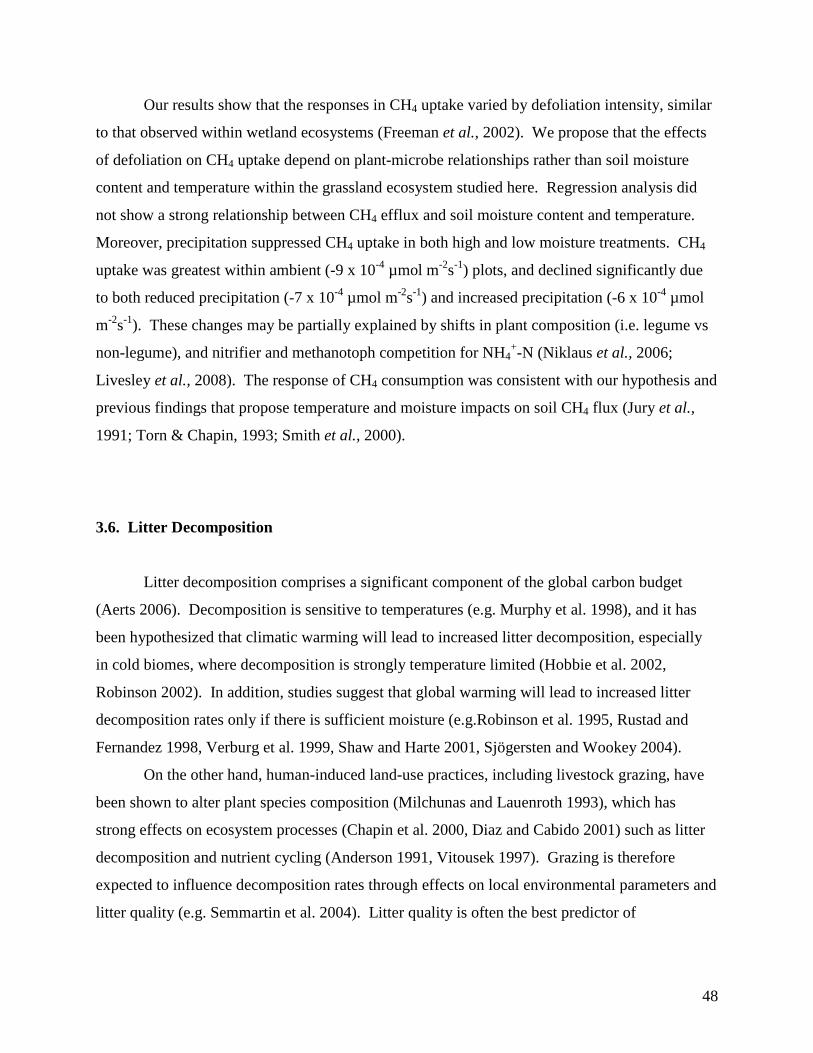
48
Our results show that the responses in CH4 uptake varied by defoliation intensity, similar
to that observed within wetland ecosystems (Freeman et al., 2002). We propose that the effects
of defoliation on CH4 uptake depend on plant-microbe relationships rather than soil moisture
content and temperature within the grassland ecosystem studied here. Regression analysis did
not show a strong relationship between CH4 efflux and soil moisture content and temperature.
Moreover, precipitation suppressed CH4 uptake in both high and low moisture treatments. CH4
uptake was greatest within ambient (-9 x 10⁻⁴ µmol m-2s-1) plots, and declined significantly due
to both reduced precipitation (-7 x 10⁻⁴ µmol m-2s-1) and increased precipitation (-6 x 10⁻⁴ µmol
m-2s-1). These changes may be partially explained by shifts in plant composition (i.e. legume vs
non-legume), and nitrifier and methanotoph competition for NH4+-N (Niklaus et al., 2006;
Livesley et al., 2008). The response of CH4 consumption was consistent with our hypothesis and
previous findings that propose temperature and moisture impacts on soil CH4 flux (Jury et al.,
1991; Torn & Chapin, 1993; Smith et al., 2000).
3.6. Litter Decomposition
Litter decomposition comprises a significant component of the global carbon budget
(Aerts 2006). Decomposition is sensitive to temperatures (e.g. Murphy et al. 1998), and it has
been hypothesized that climatic warming will lead to increased litter decomposition, especially
in cold biomes, where decomposition is strongly temperature limited (Hobbie et al. 2002,
Robinson 2002). In addition, studies suggest that global warming will lead to increased litter
decomposition rates only if there is sufficient moisture (e.g.Robinson et al. 1995, Rustad and
Fernandez 1998, Verburg et al. 1999, Shaw and Harte 2001, Sjögersten and Wookey 2004).
On the other hand, human-induced land-use practices, including livestock grazing, have
been shown to alter plant species composition (Milchunas and Lauenroth 1993), which has
strong effects on ecosystem processes (Chapin et al. 2000, Diaz and Cabido 2001) such as litter
decomposition and nutrient cycling (Anderson 1991, Vitousek 1997). Grazing is therefore
expected to influence decomposition rates through effects on local environmental parameters and
litter quality (e.g. Semmartin et al. 2004). Litter quality is often the best predictor of
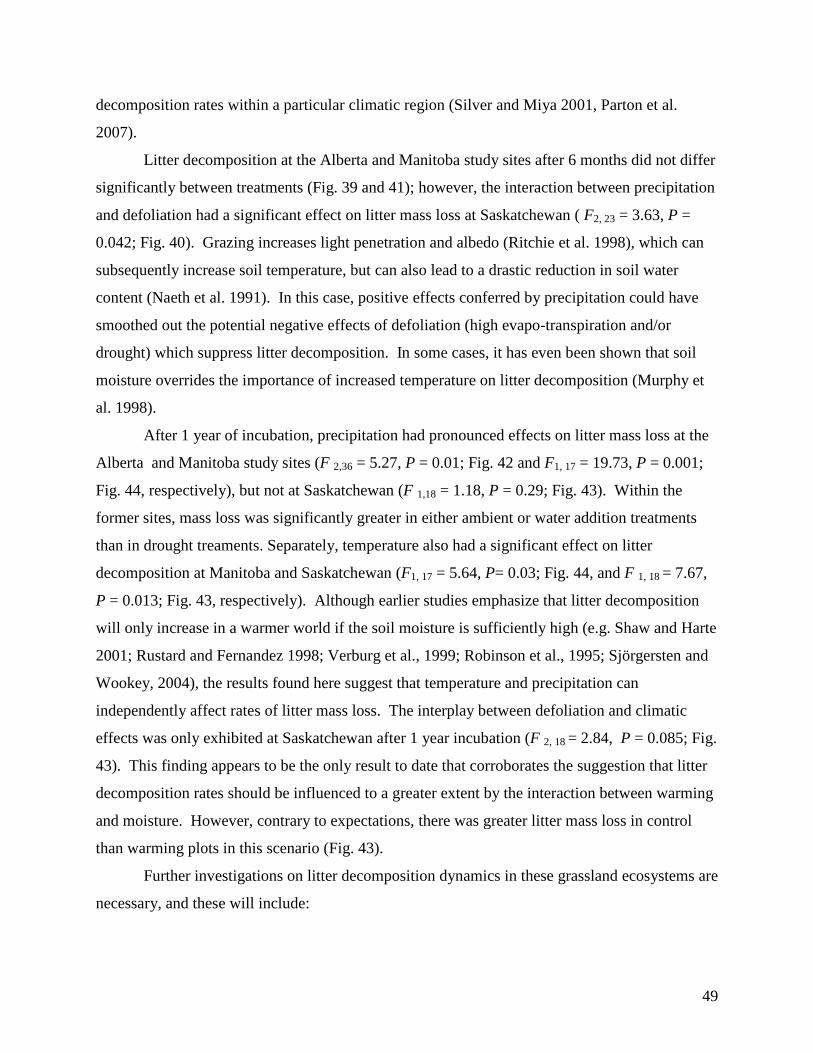
49
decomposition rates within a particular climatic region (Silver and Miya 2001, Parton et al.
2007).
Litter decomposition at the Alberta and Manitoba study sites after 6 months did not differ
significantly between treatments (Fig. 39 and 41); however, the interaction between precipitation
and defoliation had a significant effect on litter mass loss at Saskatchewan ( F2, 23 = 3.63, P =
0.042; Fig. 40). Grazing increases light penetration and albedo (Ritchie et al. 1998), which can
subsequently increase soil temperature, but can also lead to a drastic reduction in soil water
content (Naeth et al. 1991). In this case, positive effects conferred by precipitation could have
smoothed out the potential negative effects of defoliation (high evapo-transpiration and/or
drought) which suppress litter decomposition. In some cases, it has even been shown that soil
moisture overrides the importance of increased temperature on litter decomposition (Murphy et
al. 1998).
After 1 year of incubation, precipitation had pronounced effects on litter mass loss at the
Alberta and Manitoba study sites (F 2,36 = 5.27, P = 0.01; Fig. 42 and F1, 17 = 19.73, P = 0.001;
Fig. 44, respectively), but not at Saskatchewan (F 1,18 = 1.18, P = 0.29; Fig. 43). Within the
former sites, mass loss was significantly greater in either ambient or water addition treatments
than in drought treaments. Separately, temperature also had a significant effect on litter
decomposition at Manitoba and Saskatchewan (F1, 17 = 5.64, P= 0.03; Fig. 44, and F 1, 18 = 7.67,
P = 0.013; Fig. 43, respectively). Although earlier studies emphasize that litter decomposition
will only increase in a warmer world if the soil moisture is sufficiently high (e.g. Shaw and Harte
2001; Rustard and Fernandez 1998; Verburg et al., 1999; Robinson et al., 1995; Sjörgersten and
Wookey, 2004), the results found here suggest that temperature and precipitation can
independently affect rates of litter mass loss. The interplay between defoliation and climatic
effects was only exhibited at Saskatchewan after 1 year incubation (F 2, 18 = 2.84, P = 0.085; Fig.
43). This finding appears to be the only result to date that corroborates the suggestion that litter
decomposition rates should be influenced to a greater extent by the interaction between warming
and moisture. However, contrary to expectations, there was greater litter mass loss in control
than warming plots in this scenario (Fig. 43).
Further investigations on litter decomposition dynamics in these grassland ecosystems are
necessary, and these will include:
50
a) Determination of how grazing alters local environmental parameters which signifacntly
affect decomposition rates and related carbon and nitrogen fluxes (environment-effect).
b) Assessing how grazing changes plant species composition, which inherently alters
chemical quality of plant/litter material and therefore decomposition rates and related
Cand N fluxes (quality-effect).
c) Finally, comparison of above- and belowground decomposition rates and associated C
and N fluxes. Since above- and belowground litter are affected by different
environmental parameters, it is expected that root and shoot litter decomposition rates
will differ with considerable consequences for nutrient cycling (Giese et al., 2009 but see
Seastedt et al., 1992; Moretto et al., 2001; Biondini et al., 1998).
3.7. Soil Microfauna
We are studying the taxonomic composition of soil arthropod assemblages and
comparing these communities between treatments. Sample species are shown in Fig. 45. In
addition, we will estimate arthropod biomass and document new species. Data presented here
refer to soil cores collected in July 2007. Progress on sorting and identifying samples has been
slower than expected. Nonetheless, over 4500 individuals have been counted and a total of 69
taxa have been identified, most of them mites (Arachnida: Acari). Non-mite groups include 8
orders of macro-invertebrates and 3 families of Collembola (springtails). Mites include 2
families of Astigmata, 2 families of Endeostigmata, 15 families of Prostigmata (including 4
families of Heterostigmata) and 16 families of Oribatida (consisting of 25 genus or species-level
taxa). The remaining oribatids from 2007 samples will be sorted to genus or species when
possible. All other mites will continue to be sorted to the level of family.
We have identified 2 species new to science, and expect to find more. A member of the
genus Trachyuropoda (Mesostigmata: Trachyuropodidae) is in the process of being described by
Dr. Proctor in collaboration with Jeno Kontschan from Hungary, an expert on the genus. Its
proposed name is Trachyuropoda kinsella. The other species is a member of the spider mite
subfamily Bryobiinae (Prostigmata: Tetranychidae), which will be described if additional
51
specimens are found. This species might be of particular interest because some of its relatives
are plant pest species.
Almost all data used for the following analyses are from the plots in block 1 (with the
exception of plot 2-1, which was substituted for plot 1-3) producing a sample size of 12. Note
that the plots containing water addition treatments have not been included because these
treatments had not yet been applied. We performed an ordination analysis on our taxa using
PATN version 3 software (http://www.patn.com.au/patn_v3.htm). As extrinsic factors we used
all available environmental and vegetation data (including vegetation-cover evenness and
diversity indices), with the exception of the continuous temperature and soil humidity data.
These data will be used in later analyses. Multivariate analysis using all taxa identified to the
finest levels was difficult to interpret and did not offer much useful information due to the high
number of identified taxa relative to sample size. However, when taxa were combined into
larger groups (i.e. orders) a distinct pattern was evident (Fig. 46).
Precipitation manipulation was the only treatment showing a significant (p<0.05)
separation of the two groups using ANOSIM (analysis of similarity). Ordination of the
precipitation treatment revealed separation between ambient precipitation plots compared to the
droughted (i.e. rainfall reduced) plots. All mite taxa appeared to be more abundant under drier
conditions. When analyzing the same data using ANOVA (using SPSS version 17,
http://www.spss.com/statistics/) this interpretation was further supported (Fig. 47).
Exploring the complete dataset using Bivariate Pearson correlation analysis (using SPSS
version 17) indicated that abundance of Tydeidae, a family within the Prostigmata, was
significantly negatively correlated with soil moisture (p<0.01) (Fig. 48). Similarly, the majority
of Oribatida consisted of unidentified juveniles, which were also negatively correlated with soil
moisture (p<0.05). Using ANOVA we established that taxon richness of arthropods (at the
family level) significantly increased within the droughted plots (p<0.05). This was not the case
for either the grazing or the temperature treatments.
We had expected to see lower abundances and lower taxon richness in the drought
treatments. Instead, we saw the abundance and taxonomic richness of mites actually increasing.
A large part of this response was due to the Tydeidae. Previous studies have shown that
members of this family dominate dry soils, and they appear able to quickly capitalize on harsh
52
conditions. We expect that as more soil cores are processed, other taxa will also take up such
‘indicator’ roles with regard to changes in environmental variables.
Additional sets of samples will be taken from the plots at the end of the 2009 field
season. One set will be processed using the kerosene flotation protocol used for the initial (i.e.
2007) samples, and the other set will be rapidly extracted using Tullgren funnels. The former
extraction is exhaustive but labor intensive, and will allow us to recognize within-plot changes in
micro-arthropod community assemblages between 2007 and 2009, which in turn can be linked to
the treatments imposed (warming, precipitation and defoliation). As the Tullgren samples can be
rapidly processed they will be used to estimate biomass for the integrated modeling portion of
the overall project.
3.8. Root Dynamics Assessment of rooting dynamics, specifically measures of root length, using the images
obtained from the root periscope is in the early stages. However, some preliminary results have
been obtained and are providing a unique assessment of changes in root abundance in relation to
the main experimental treatments being tested in this investigation.
While warming produced no significant change in mean root length (Fig. 49, top), altered
precipitation had a profound influence on observed root length. In particular, the presence of
drought conditions resulted in more than a 50% reduction in mean root length (Fig. 49, bottom),
suggesting vegetation within these plots was unable to support ongoing root production, and
more likely, the maintenance of existing roots.
Not surprisingly, defoliation also had a strong influence on measured root length (Fig.
50). Heavy defoliation resulted in a large reduction in root presence, falling to approximately
half that observed within undefoliated check plots. While light defoliation appeared to produce a
modest increase in mean root length, this value remained statistically similar to that observed
under no defoliation (Fig. 50). The strong reduction in root length is consistent with several
other studies conducted in the mixedgrass and fescue grasslands of Alberta, all of which indicate
that changes in root abundance, including the depth of roots, are likely to occur, particularly
under heavy and repeated defoliation.
53
3.9. Literature Cited
Aerts, R. 2006. The freezer defrosting: global warming and litter decomposition rates in cold biomes. Journal of Ecology 94:713-724.
Anderson, J.M. 1991. The effects of climate change on decomposition processes in grassland and coniferous forests. Ecological Applications 1:326-347.
Anderson J.P.E. and Domsch K.H. 1978. A physiological method for the quantitative measurement of microbial biomass in soils. Soil Biology & Biochemistry 10: 215-221.
Ball B.C., Dobbie K.E., Parker J.P. and Smith K.A. 1997. The influence of gas transport and porosity on methane oxidation in soils. Journal Geophysics Research 102: 23301–23308.
Bardgett R.D., Leemans D.K., Cook R. and Hobbs P.J. 1997. Seasonality in the soil biota of grazed and ungrazed hill grasslands, Soil Biology and Biochemistry 29: 1285–1294.
Bardgett R.D., Bowmann W.D., Kaufmann R.and Schmidt S.K. 2005. A temporal approach to linking aboveground and belowground ecology, Trends in Ecology and Evolution 20: 634–641.
Belay-Tedla A., Zhou X.H., Su B. Wan S.Q. and Luo Y.Q. 2009. Labile, recalcitrant and microbial carbon and nitrogen pools of a tallgrass prairie soil in the US Great Plains subjected to experimental warming and clipping, Soil Biology & Biochemistry 41: 110-116.
Boon P.I. and Mitchell A. 1995. Methanogenesis in the sediments of an Australian freshwater wetland, Comparison with aerobic decay, and factors controlling methanogenesis. FEMS Microbial Ecology, 18: 175–190.
Chapin, F.S., E.S. Zavaleta, V.T. Eviner, R.L. Naylor, P.M. Vitousek, H.L. Reynolds, D.U. Hooper, S. Lavorel, O.E. Sala, S.E. Hobbie, M.C. Mack, and S. Diaz. 2000. Consequences of changing biodiversity. Nature 405:234-242.
Clarke, K.R. 1993. Non-parametric multivariate analyses of changes in community structure. Australian Journal of Ecology, 18: 117-143.
Diaz, S., and M. Cabido. 2001. Vive la difference: plant functional diversity matters to ecosystem processes. Trends in Ecology & Evolution 16:646-655.
Dunfield P. and Knowles R. 1995. Kinetics of inhibition of methane oxidation by nitrate, nitrite, and ammonium in a humisol. Applied and Environmental Microbiology, 61: 3129–3135.
Fierer N., Schimel J.P. and Holden P.A. 2003. Influence of drying-rewetting frequency on soil bacterial community structure. Microbial Ecology 45: 63–71.
Firestone M.K., Davidson E.A. 1989. Microbiological basis of NO and N2O production and consumption in soil. In: Exchange of trace gases between terrestrial ecosystems and the atmosphere (eds Andreae MO, Schimel DS), pp. 7–21. John Wiley & Sons, New York.
Freeman C., Nevison G.B., Kang H., Hughes S., Reynolds B. and Hudson J.A. 2002. Contrasted effects of simulated drought on the production and oxidation of methane in a wild-Wales wetland, Soil Biology and Biochemsitry 34: 61-67.
Frey S.D., Drijber R., Smith H. and Melillo J. 2008. Microbial biomass functional capacity and community structure after 12 years of soil warming, Soil Biology & Biochemistry 40: 2904-2907.
Garcia F.O. 1992. Carbon and nitrogen dynamics and microbial ecology in tallgrass prairie, Ph.D. dissertation Kansas State University, Manhattan.
54
Grime, J.P., Brown, V.K., Thompson, K., Masters, G.J., Hillier, S.H., Clarke, I.P., Askew, A.P., Corker, D. & Kielty, J.P. 2000. The response of two contrasting limestone grasslands to simulated climate change. Science 289: 762-765.
Grime J.P. 2001. Plant strategies: vegetation processes and ecosystem properties. John Wiley, Chichester, UK.
Hanson R.S., and Hanson T.E. 1996. Methanotrophic bacteria. Microbial Review 60: 439-471. Harmens, H., Williams, P.D., Peters, S.L., Bambrick, M.T., Hopkins, A. & Ashenden, T.W.
2004. Impacts of elevated atmospheric CO2 and temperature on plant community structure of a temperate grassland are modulated by cutting frequency. Grass and Forage Science 59: 144-156.
Hobbie, S.E., K.J. Nadelhoffer, and P. Hogberg. 2002. A synthesis: The role of nutrients as constraints on carbon balances in boreal and arctic regions. Plant and Soil 242:163-170.
Hutchinson G.L. and Mosier A.R. 1981. Improved soil cover method for field measurement of nitrous-oxide fluxes, Soil Science Society of America Journal 45: 311-316.
Innes J.L., Beniston M., Verstraete M.M. 2000. Biomass burning and its inter-relationships with the climate system: Proceedings of an international workshop in Wengen, Switzerland, September 1998, Published by Springer, 2000. 358 pages.
Jury W.A., Gardner W.R. and Gardner W.H. 1991. Soil physics, Wiley and Sons, New York. Kassem I.I., Joshi P., Sigler V., Heckathorn S. and Wang Q. 2008. Effect of elevated CO2 and
drought on soil microbial communities associated with Andropogon gerardii, Journal of Integrative Plant Biology 50: 1406-1415.
Klein, J.A., Harte, J. & Zhao, X.Q. 2004. Experimental warming causes large and rapid species loss, dampened by simulated grazing, on the Tibetan Plateau. Ecology Letters, 7: 1170-1179.
Knapp A.K. 1985. Effect of fire and drought on the ecophysiology of Andropogon gerardi and Panicum virgatum in a tallgrass prairie. Ecology 66: 1309–1320.
Livesley S.J., Kiese R., Graham J., Weston C.J., Butterbach-Bahl K. and Arndt S.K. 2008. Trace gas flux and the influence of short-term soil water and temperature dynamics in Australian sheep grazed pastures of differing productivity, Plant and Soil, 309: 89-103.
Maier C.A. and Kress L.W., 2000. CO2 evolution and root respiration in 11-year-old loblolly pine (Pinus taeda) plantations as affected by moisture and nutrient availability, Canadian Journal of Forest Research 30: 347-359.
Milchunas, D. G., and W. K. Lauenroth. 1993. Quantitative effects of grazing on vegetation and soils over a global range of environments. Ecological Monographs 63:327-366.
Miyajima T., Wada E., Hanba Y.T., Vijarnsorn P. 1997. Anaerobic mineralization of indigenous organic matters and methanogenesis in tropical wetland soils. Geochimica et Cosmochimica Acta, 61: 3739-3751.
Mosier A., Schimel D., Valentined D., Bronson K. and Parton W. 1991. Methane and nitrous-oxide fluxes in native fertilized and cultivated grasslands, Nature 350: 330-332.
Murphy, K.L., J.M. Klopatek, and C.C. Klopatek. 1998. The effects of litter quality and climate on decomposition along an elevational gradient. Ecological Applications 8:1061-1071.
Naeth, M.A., D.S. Chanasyk, R.L. Rothwell, and A.W. Bailey. 1991. Grazing impacts on soil-water in mixed prairie and fescue grassland ecosystems of Alberta. Canadian Journal of Soil Science 71:313-325.
Nguyen C. 2003. Rhizodeposition of organic C by plants: mechanisms and controls, Agronomie 23: 375–396.
55
Niklaus P.A., Wardle D.A., Tate K.R. 2006. Effects of plant species diversity and composition on nitrogen cycling and the trace gas balance of soils, Plant and Soil, 282: 83–98.
Parton, W., W.L. Silver, I.C. Burke, L. Grassens, M.E. Harmon, W.S. Currie, J.Y. King, E.C. Adair, L.A. Brandt, S.C. Hart, and B. Fasth. 2007. Global-scale similarities in nitrogen release patterns during long-term decomposition. Science 315:361-364.
Peters W., Jacobson A.R., Sweeney C., Andrews A.E., Conway T.J., Masarie K., Miller J.B., Bruhwiler L.M., Pétron G., Hirsch A.I., Worthy D.E., van der Werf G.R., Randerson J.T., Wennberg P.O., Krol M.C. and Tans P.P., 2007. An atmospheric perspective on North American carbon dioxide exchange: carbon tracker. Proc. Natl. Acad. Sci. USA 104: 18925–18930.
Ritchie, M.E., D. Tilman, and J.M.H. Knops. 1998. Herbivore effects on plant and nitrogen dynamics in oak savanna. Ecology 79:165-177.
Robinson, C.H. 2002. Controls on decomposition and soil nitrogen availability at high latitudes. Plant and Soil 242:65-81.
Robinson, C.H., P.A. Wookey, A.N. Parsons, J.A. Potter, T.V. Callaghan, J.A. Lee, M.C. Press, and J.M. Welker. 1995. Responses of plant litter decomposition and nitrogen mineralisation to simulated environmental change in a high arctic polar semi-desert and a subarctic dwarf shrub heath. Oikos 74:503-512.
Rustad, L.E., and I.J. Fernandez. 1998. Soil warming: Consequences for foliar litter decay in a spruce-fir forest in Maine, USA. Soil Science Society of America Journal 62:1072-1080.
Rustad, L.E., Campbell, J.L., Marion, G.M., Norby, R.J., Mitchell, M.J., Hartley, A.E., Cornelissen, J.H.C. & Gurevitch, J. 2001. A meta-analysis of the response of soil respiration, net nitrogen mineralization, and aboveground plant growth to experimental ecosystem warming. Oecologia, 126: 543-562.
Schwendenmann L. and Veldkamp E. 2005. The role of dissolved organic carbon, dissolved organic nitrogen, and dissolved inorganic nitrogen in a tropical wet forest ecosystem, Ecosystems 8: 339–351.
Semmartin, M., M.R. Aguiar, R.A. Distel, A.S. Moretto, and C M. Ghersa. 2004. Litter quality and nutrient cycling affected by grazing-induced species replacements along a precipitation gradient. Oikos 107:148-160.
Shaw, M.R., and J. Harte. 2001. Control of litter decomposition in a subalpine meadow-sagebrush steppe ecotone under climate change. Ecological Applications 11:1206-1223.
Silver, W.L., and R.K. Miya. 2001. Global patterns in root decomposition: comparisons of climate and litter quality effects. Oecologia 129:407-419.
Sjögersten, S., and P.A. Wookey. 2004. Decomposition of mountain birch leaf litter at the forest-tundra ecotone in the Fennoscandian mountains in relation to climate and soil conditions. Plant and Soil 262:215-227.
Smith K.A., Dobbie K.E., Ball B.C., Bakken L.R., Sitaula B.K., Hansen S., Brumme R., Borken W., Christensen S., Prieme A., Fowler D., Macdonald J.A., Skiba U., Klemedtsson L., Kasimir-Klemedtsson A., Degorska A. and Orlanski P. 2000. Oxidation of atmospheric methane in Northern European soils, comparison with other ecosystems, and uncertainties in the global terrestrial sink. Global Change Biology 6: 791–803.
Torn M.S. and Chapin F.S., III. 1993. Environmental and biotic controls over methane flux from arctic tundra, Chemosphere, 26: 357-368.
56
vandenPolvanDasselaar A., vanBeusichem M.L., Oenema O. 1997. Effects of grassland management on the emission of methane from intensively managed grasslands on peat soil, Plant and Soil 189: 1-9.
Verburg, P.S. J., W.K.P. Van Loon, and A. Lukewille. 1999. The CLIMEX soil-heating experiment: soil response after 2 years of treatment. Biology and Fertility of Soils 28:271-276.
Vitousek, P.M. 1997. Human domination of Earth's ecosystems (vol 277, pg 494, 1997). Science
278:21-21.
Walker, M.D., Wahren, C.H., Hollister, R.D., Henry, G.H.R., Ahlquist, L.E., Alatalo, J.M., Bret-Harte, M.S., Calef, M.P., Callaghan, T.V., Carroll, A.B., Epstein, H.E., Jonsdottir, I.S., Klein, J.A., Magnusson, B., Molau, U., Oberbauer, S.F., Rewa, S.P., Robinson, C.H., Shaver, G.R., Suding, K.N., Thompson, C.C., Tolvanen, A., Totland, O., Turner, P.L., Tweedie, C.E., Webber, P.J. & Wookey, P.A. 2006. Plant community responses to experimental warming across the tundra biome. Proceedings of the National Academy of Sciences of the United States of America, 103: 1342-1346.
Wan S., Hui D., Wallace L.L. and Luo Y. 2005. Responses of aboveground biomass, net nitrogen mineralization, and soil respiration to experimental warming and clipping in a tallgrass prairie, Global Biogeochemical Cycles 19: GB2014.
Wardle D.A., Bardgett R.D., Klironomos J.N., Setälä H., van der Putten W.H. and Wall D.H. 2004. Ecological linkages between aboveground and belowground biota, Science 304: 1629–1633.
Zak D.R., Tilman D., Parmenter R.R., Rice C.W., Fisher F.M., Vose J., Milchunas D. and Martin C.W. 1994. Plant-production and soil-microorganism in late-successional ecosystems – a continental-scale study. Ecology 75: 2333–2347.
Zhang W., Parker K.M., Luo Y., Wan S., Wallace L.L. and Hu S. 2005. Soil microbial responses to experimental warming and clipping in a tallgrass prairie, Global Change Biology 11: 266–277.
57
Appendix 1:
Summary Data Results for the Second Year
Effects of Warming, Precipitation, and Defoliation
on Rangeland Function
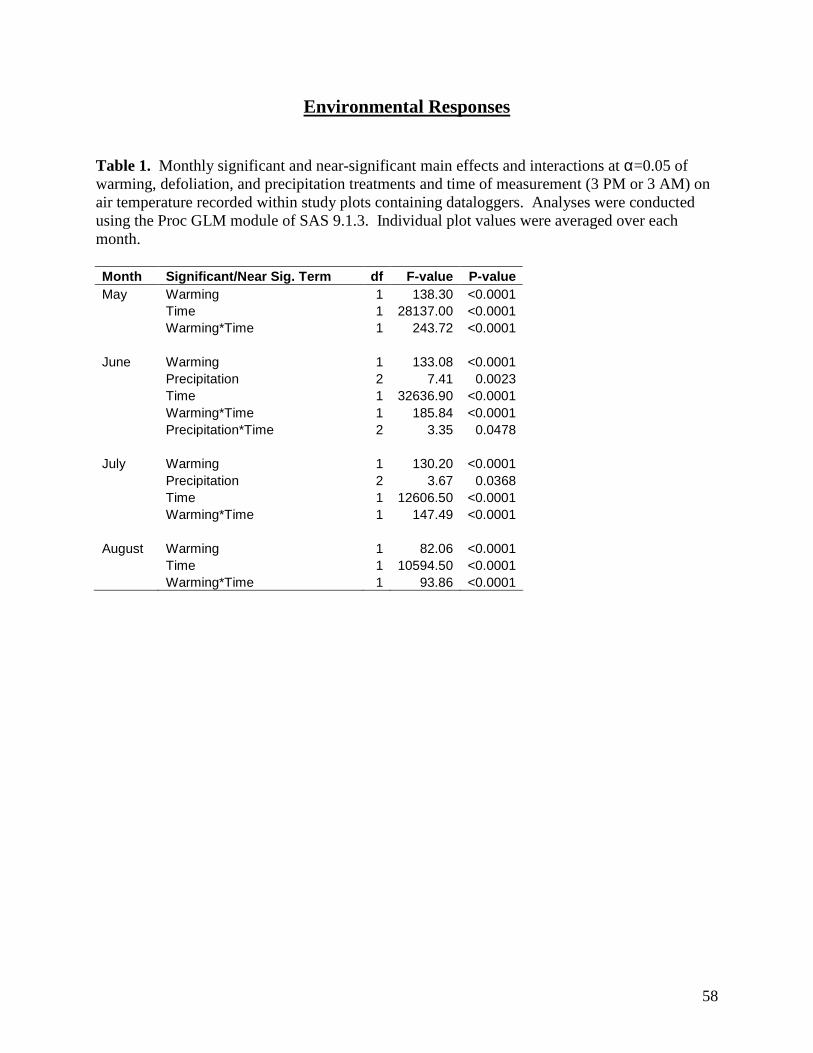
58
Environmental Responses
Table 1. Monthly significant and near-significant main effects and interactions at α=0.05 of warming, defoliation, and precipitation treatments and time of measurement (3 PM or 3 AM) on air temperature recorded within study plots containing dataloggers. Analyses were conducted using the Proc GLM module of SAS 9.1.3. Individual plot values were averaged over each month. Month Significant/Near Sig. Term df F-value P-value May Warming 1 138.30 <0.0001 Time 1 28137.00 <0.0001 Warming*Time 1 243.72 <0.0001 June Warming 1 133.08 <0.0001 Precipitation 2 7.41 0.0023 Time 1 32636.90 <0.0001 Warming*Time 1 185.84 <0.0001 Precipitation*Time 2 3.35 0.0478 July Warming 1 130.20 <0.0001 Precipitation 2 3.67 0.0368 Time 1 12606.50 <0.0001 Warming*Time 1 147.49 <0.0001 August Warming 1 82.06 <0.0001 Time 1 10594.50 <0.0001 Warming*Time 1 93.86 <0.0001
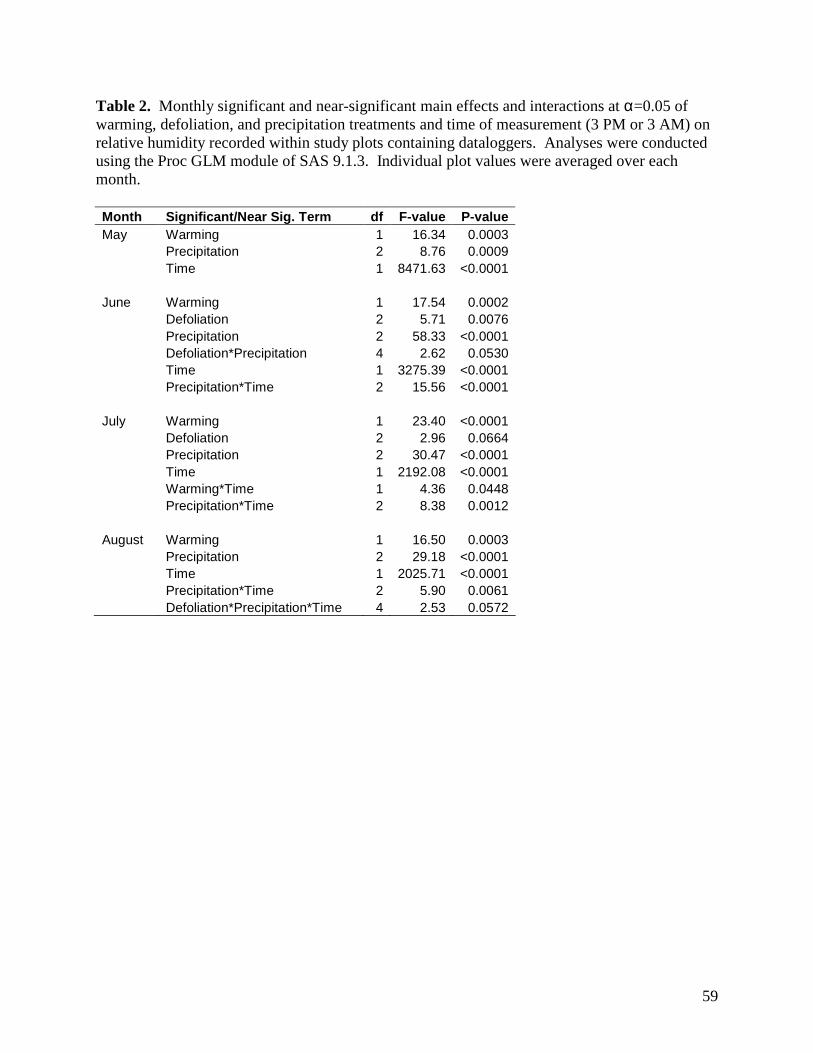
59
Table 2. Monthly significant and near-significant main effects and interactions at α=0.05 of warming, defoliation, and precipitation treatments and time of measurement (3 PM or 3 AM) on relative humidity recorded within study plots containing dataloggers. Analyses were conducted using the Proc GLM module of SAS 9.1.3. Individual plot values were averaged over each month. Month Significant/Near Sig. Term df F-value P-value May Warming 1 16.34 0.0003 Precipitation 2 8.76 0.0009 Time 1 8471.63 <0.0001 June Warming 1 17.54 0.0002 Defoliation 2 5.71 0.0076 Precipitation 2 58.33 <0.0001 Defoliation*Precipitation 4 2.62 0.0530 Time 1 3275.39 <0.0001 Precipitation*Time 2 15.56 <0.0001 July Warming 1 23.40 <0.0001 Defoliation 2 2.96 0.0664 Precipitation 2 30.47 <0.0001 Time 1 2192.08 <0.0001 Warming*Time 1 4.36 0.0448 Precipitation*Time 2 8.38 0.0012 August Warming 1 16.50 0.0003 Precipitation 2 29.18 <0.0001 Time 1 2025.71 <0.0001 Precipitation*Time 2 5.90 0.0061 Defoliation*Precipitation*Time 4 2.53 0.0572
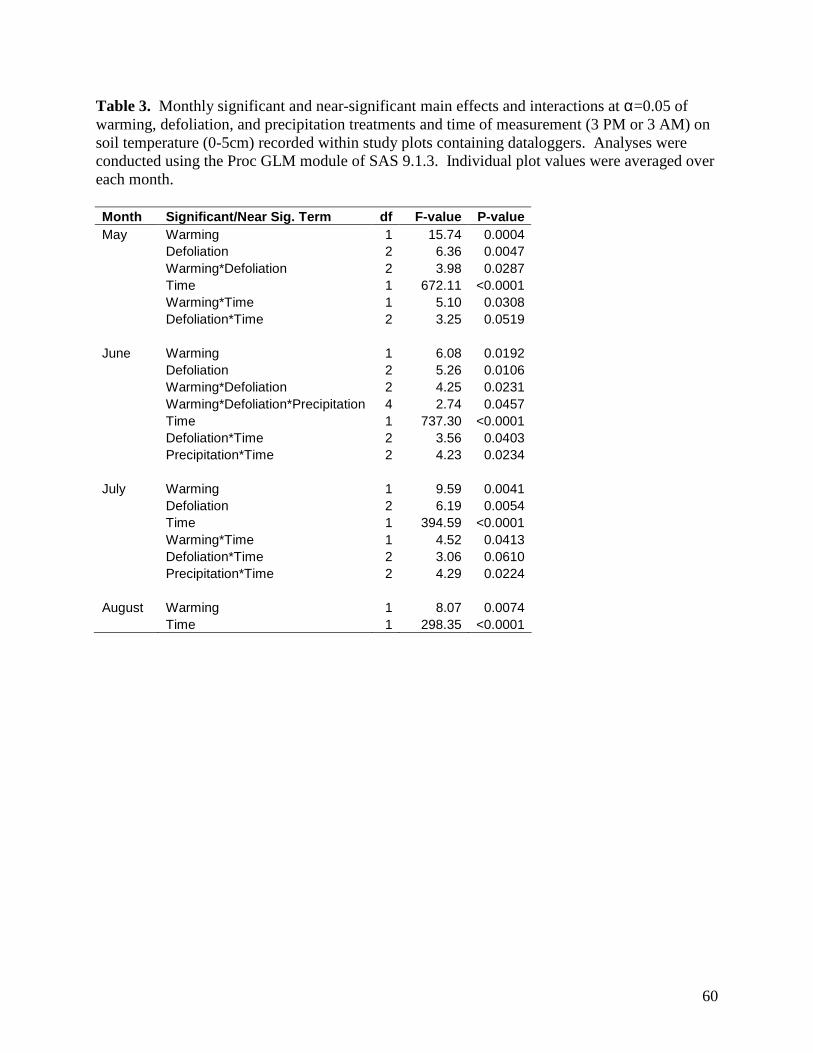
60
Table 3. Monthly significant and near-significant main effects and interactions at α=0.05 of warming, defoliation, and precipitation treatments and time of measurement (3 PM or 3 AM) on soil temperature (0-5cm) recorded within study plots containing dataloggers. Analyses were conducted using the Proc GLM module of SAS 9.1.3. Individual plot values were averaged over each month. Month Significant/Near Sig. Term df F-value P-value May Warming 1 15.74 0.0004 Defoliation 2 6.36 0.0047 Warming*Defoliation 2 3.98 0.0287 Time 1 672.11 <0.0001 Warming*Time 1 5.10 0.0308 Defoliation*Time 2 3.25 0.0519 June Warming 1 6.08 0.0192 Defoliation 2 5.26 0.0106 Warming*Defoliation 2 4.25 0.0231 Warming*Defoliation*Precipitation 4 2.74 0.0457 Time 1 737.30 <0.0001 Defoliation*Time 2 3.56 0.0403 Precipitation*Time 2 4.23 0.0234 July Warming 1 9.59 0.0041 Defoliation 2 6.19 0.0054 Time 1 394.59 <0.0001 Warming*Time 1 4.52 0.0413 Defoliation*Time 2 3.06 0.0610 Precipitation*Time 2 4.29 0.0224 August Warming 1 8.07 0.0074 Time 1 298.35 <0.0001
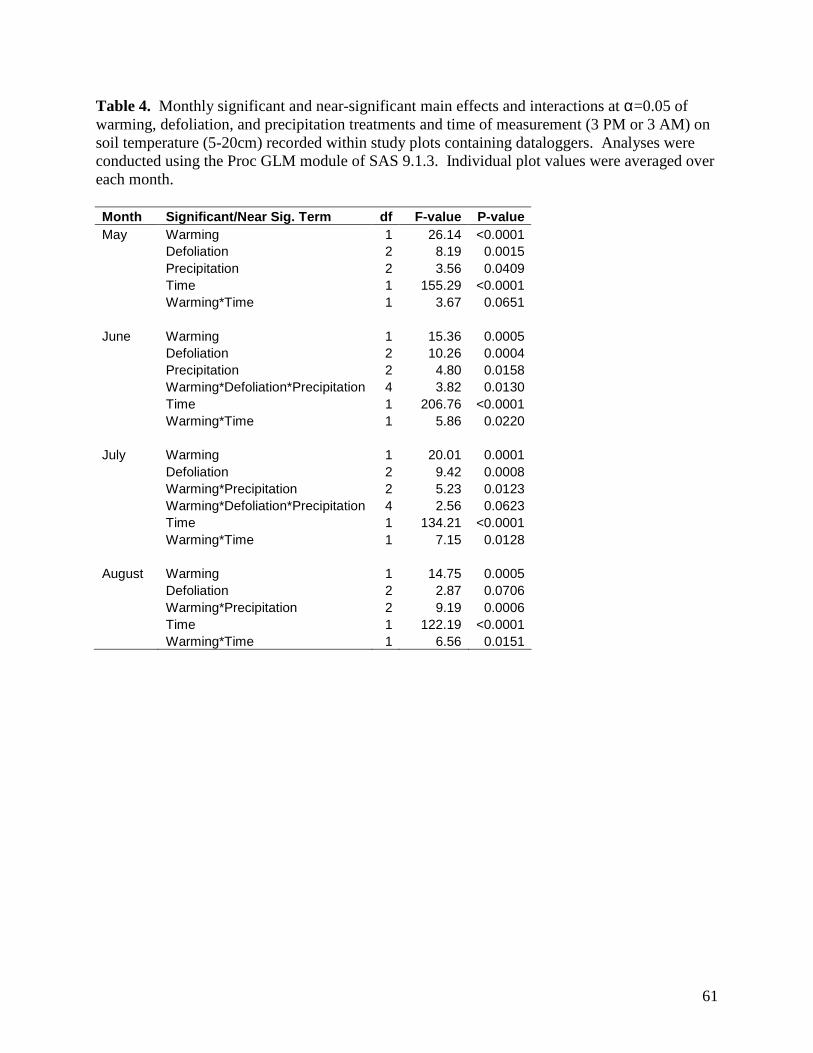
61
Table 4. Monthly significant and near-significant main effects and interactions at α=0.05 of warming, defoliation, and precipitation treatments and time of measurement (3 PM or 3 AM) on soil temperature (5-20cm) recorded within study plots containing dataloggers. Analyses were conducted using the Proc GLM module of SAS 9.1.3. Individual plot values were averaged over each month. Month Significant/Near Sig. Term df F-value P-value May Warming 1 26.14 <0.0001 Defoliation 2 8.19 0.0015 Precipitation 2 3.56 0.0409 Time 1 155.29 <0.0001 Warming*Time 1 3.67 0.0651 June Warming 1 15.36 0.0005 Defoliation 2 10.26 0.0004 Precipitation 2 4.80 0.0158 Warming*Defoliation*Precipitation 4 3.82 0.0130 Time 1 206.76 <0.0001 Warming*Time 1 5.86 0.0220 July Warming 1 20.01 0.0001 Defoliation 2 9.42 0.0008 Warming*Precipitation 2 5.23 0.0123 Warming*Defoliation*Precipitation 4 2.56 0.0623 Time 1 134.21 <0.0001 Warming*Time 1 7.15 0.0128 August Warming 1 14.75 0.0005 Defoliation 2 2.87 0.0706 Warming*Precipitation 2 9.19 0.0006 Time 1 122.19 <0.0001 Warming*Time 1 6.56 0.0151
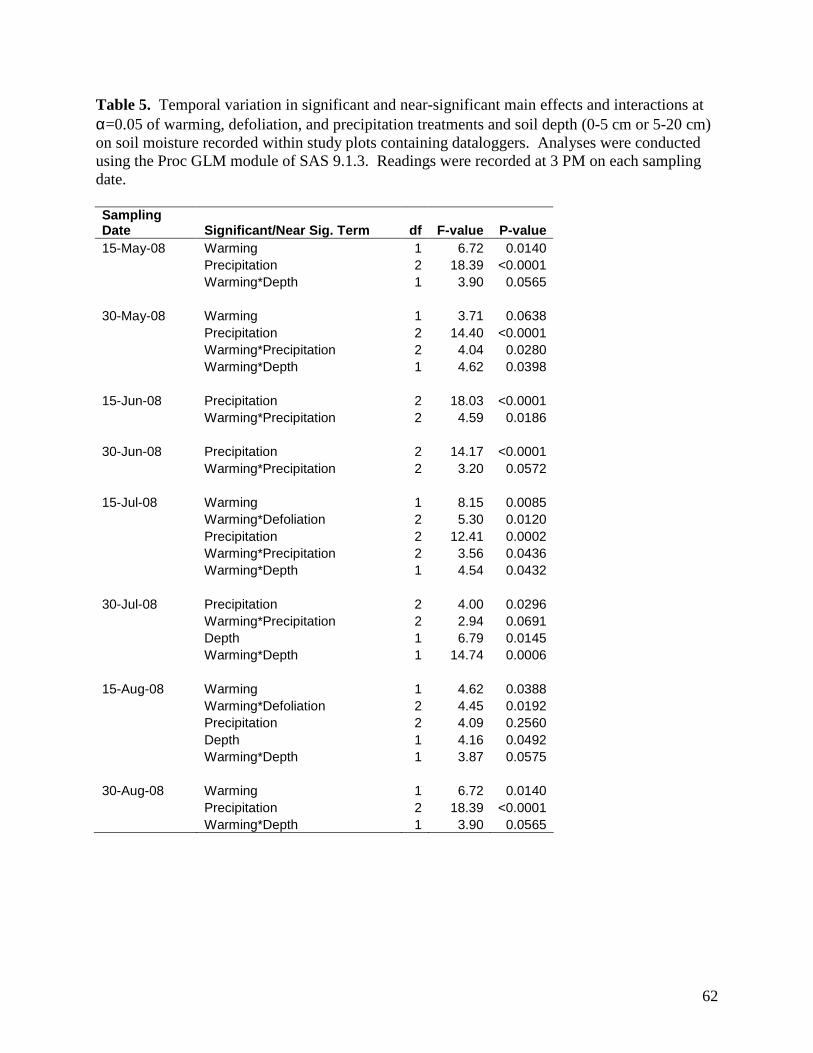
62
Table 5. Temporal variation in significant and near-significant main effects and interactions at α=0.05 of warming, defoliation, and precipitation treatments and soil depth (0-5 cm or 5-20 cm) on soil moisture recorded within study plots containing dataloggers. Analyses were conducted using the Proc GLM module of SAS 9.1.3. Readings were recorded at 3 PM on each sampling date. Sampling Date Significant/Near Sig. Term df F-value P-value 15-May-08 Warming 1 6.72 0.0140 Precipitation 2 18.39 <0.0001 Warming*Depth 1 3.90 0.0565 30-May-08 Warming 1 3.71 0.0638 Precipitation 2 14.40 <0.0001 Warming*Precipitation 2 4.04 0.0280 Warming*Depth 1 4.62 0.0398 15-Jun-08 Precipitation 2 18.03 <0.0001 Warming*Precipitation 2 4.59 0.0186 30-Jun-08 Precipitation 2 14.17 <0.0001 Warming*Precipitation 2 3.20 0.0572 15-Jul-08 Warming 1 8.15 0.0085 Warming*Defoliation 2 5.30 0.0120 Precipitation 2 12.41 0.0002 Warming*Precipitation 2 3.56 0.0436 Warming*Depth 1 4.54 0.0432 30-Jul-08 Precipitation 2 4.00 0.0296 Warming*Precipitation 2 2.94 0.0691 Depth 1 6.79 0.0145 Warming*Depth 1 14.74 0.0006 15-Aug-08 Warming 1 4.62 0.0388 Warming*Defoliation 2 4.45 0.0192 Precipitation 2 4.09 0.2560 Depth 1 4.16 0.0492 Warming*Depth 1 3.87 0.0575 30-Aug-08 Warming 1 6.72 0.0140 Precipitation 2 18.39 <0.0001 Warming*Depth 1 3.90 0.0565
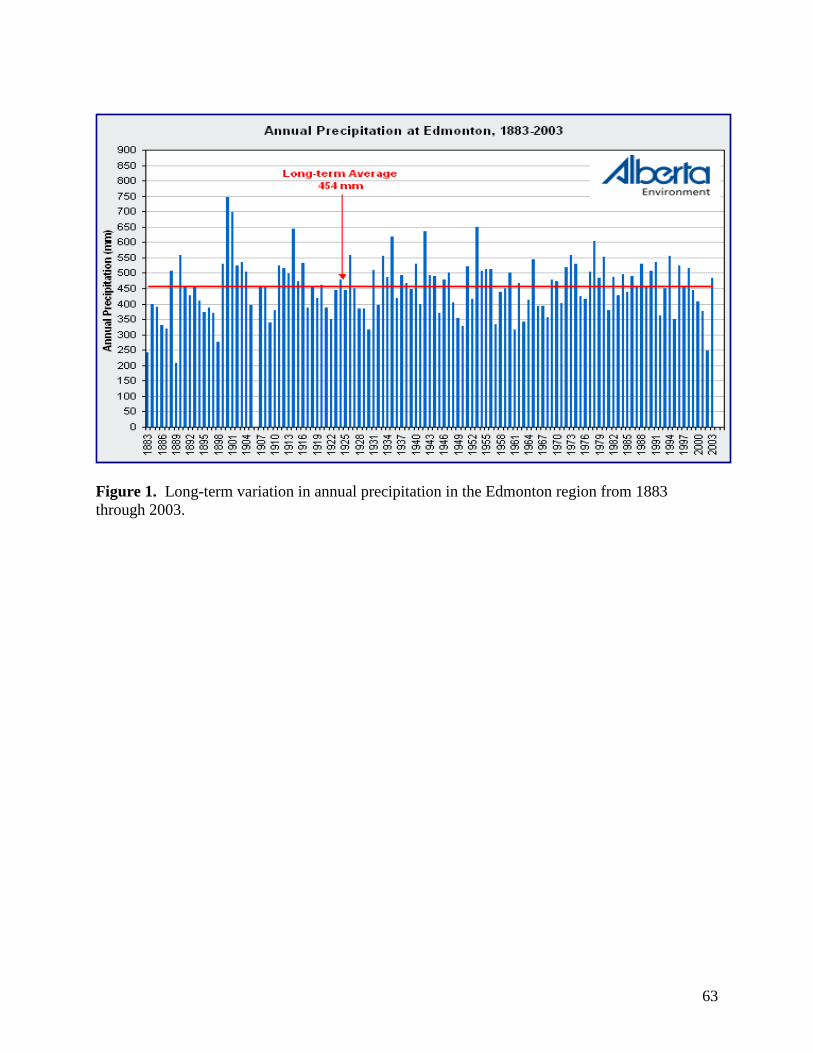
63
Figure 1. Long-term variation in annual precipitation in the Edmonton region from 1883 through 2003.
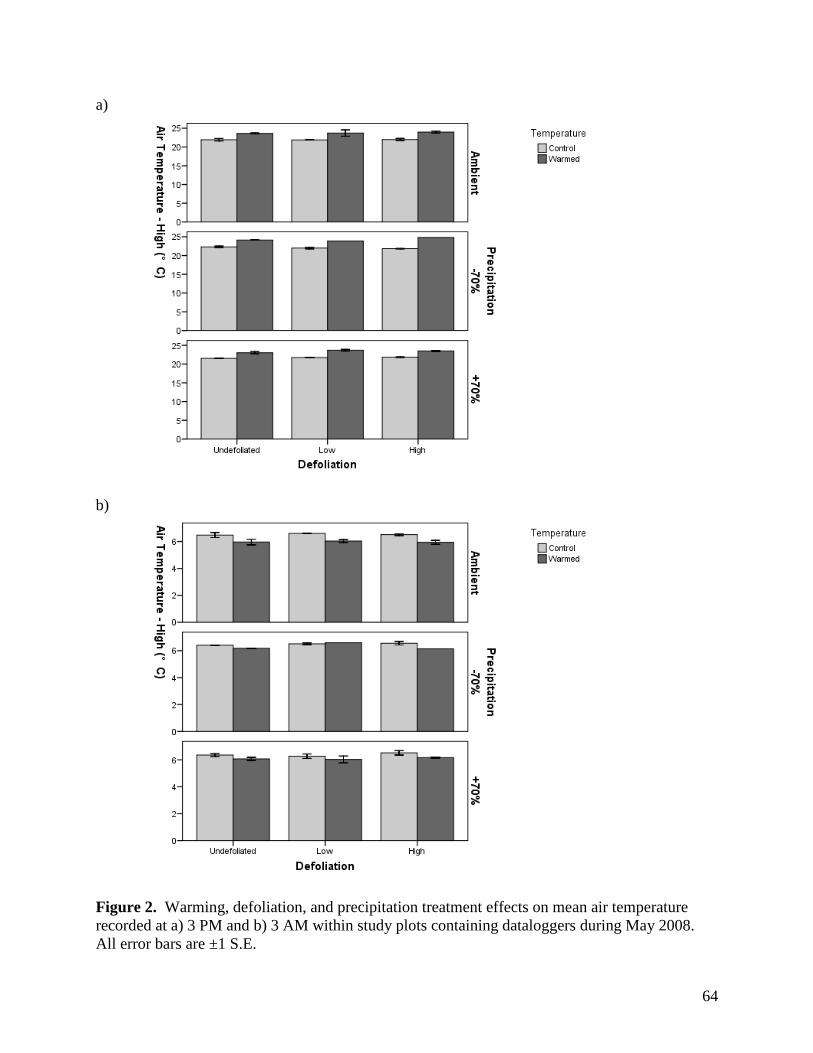
64
a)
b)
Figure 2. Warming, defoliation, and precipitation treatment effects on mean air temperature recorded at a) 3 PM and b) 3 AM within study plots containing dataloggers during May 2008. All error bars are ±1 S.E.
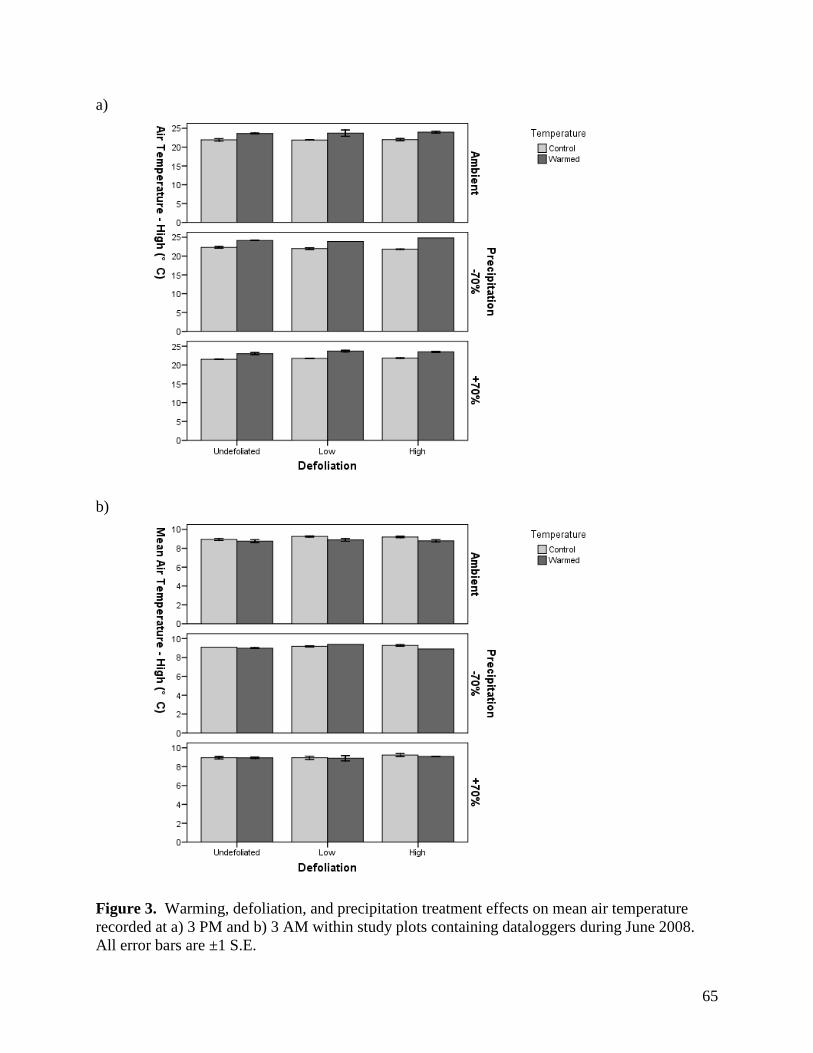
65
a)
b)
Figure 3. Warming, defoliation, and precipitation treatment effects on mean air temperature recorded at a) 3 PM and b) 3 AM within study plots containing dataloggers during June 2008. All error bars are ±1 S.E.
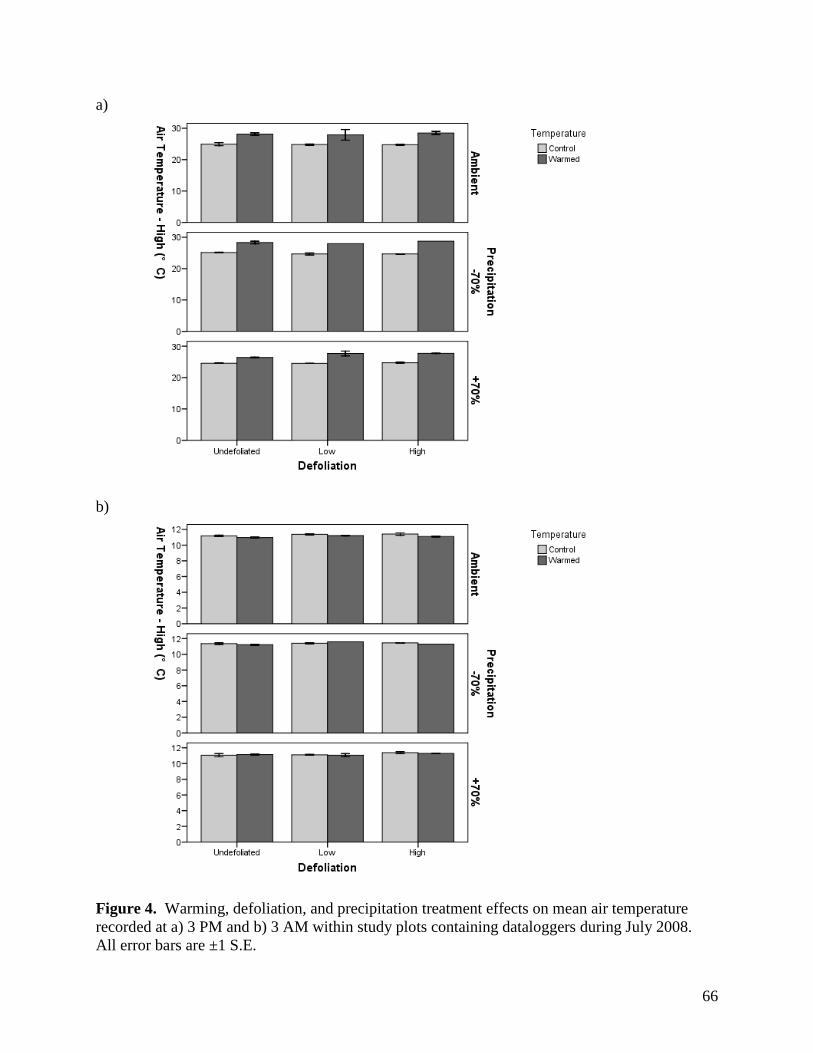
66
a)
b)
Figure 4. Warming, defoliation, and precipitation treatment effects on mean air temperature recorded at a) 3 PM and b) 3 AM within study plots containing dataloggers during July 2008. All error bars are ±1 S.E.
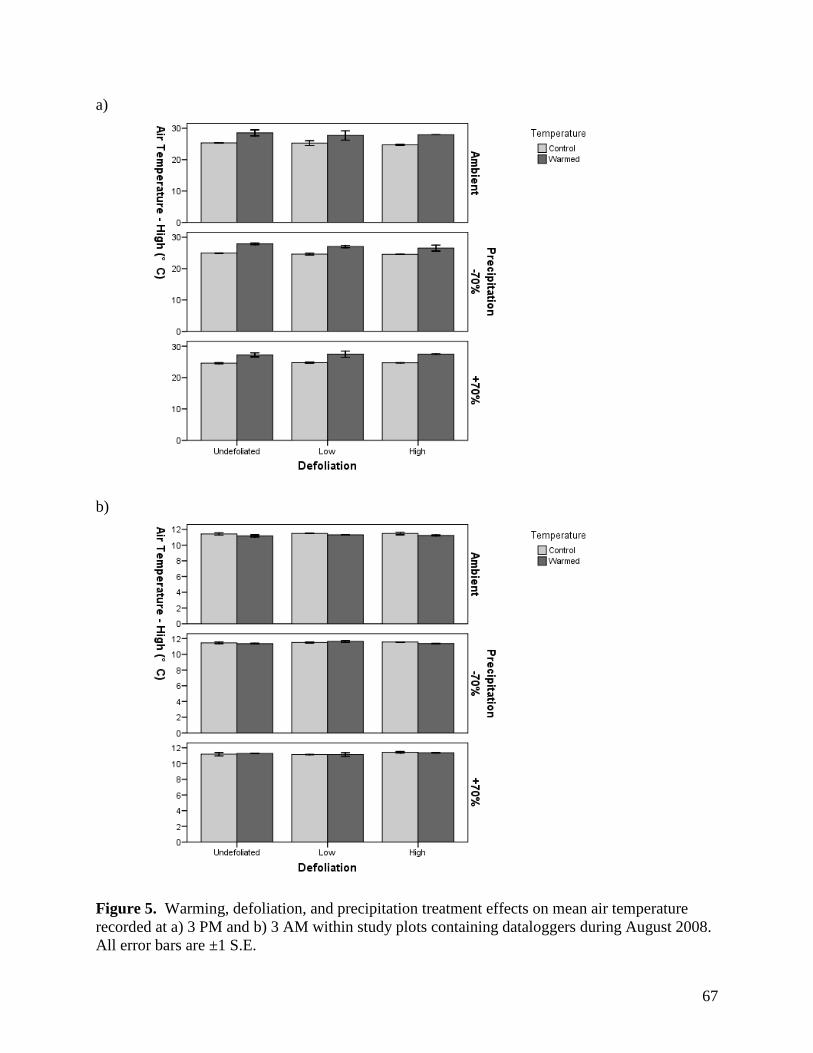
67
a)
b)
Figure 5. Warming, defoliation, and precipitation treatment effects on mean air temperature recorded at a) 3 PM and b) 3 AM within study plots containing dataloggers during August 2008. All error bars are ±1 S.E.
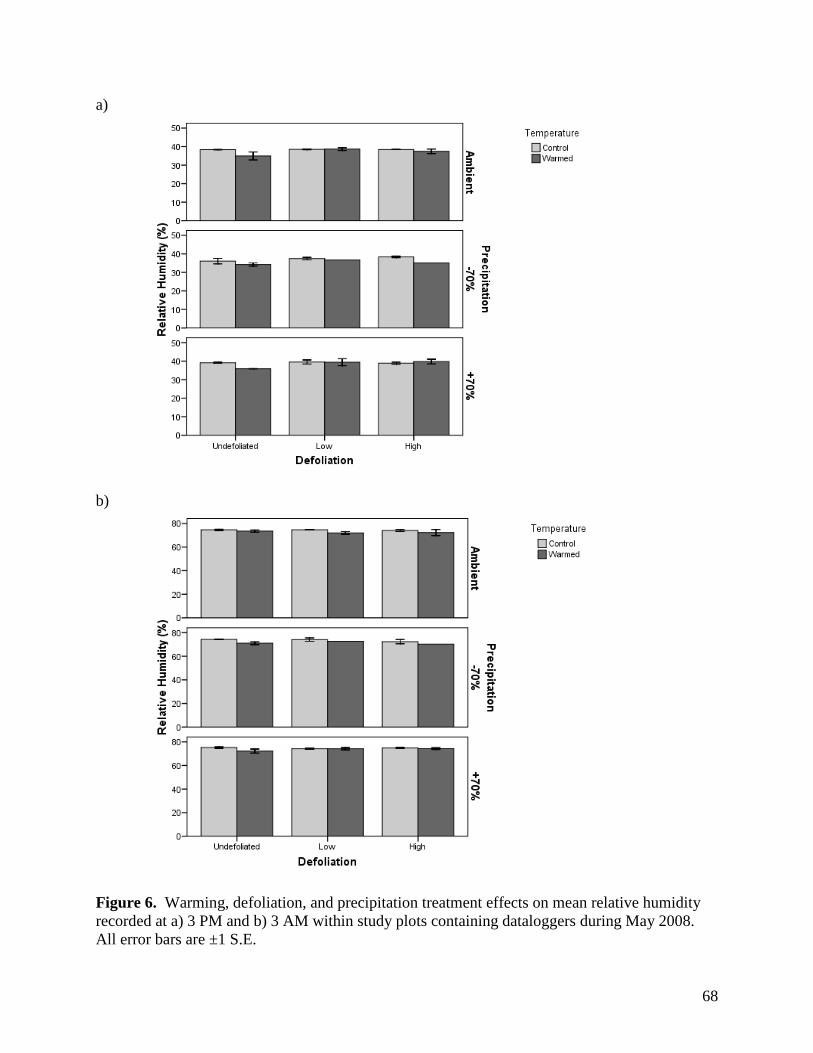
68
a)
b)
Figure 6. Warming, defoliation, and precipitation treatment effects on mean relative humidity recorded at a) 3 PM and b) 3 AM within study plots containing dataloggers during May 2008. All error bars are ±1 S.E.
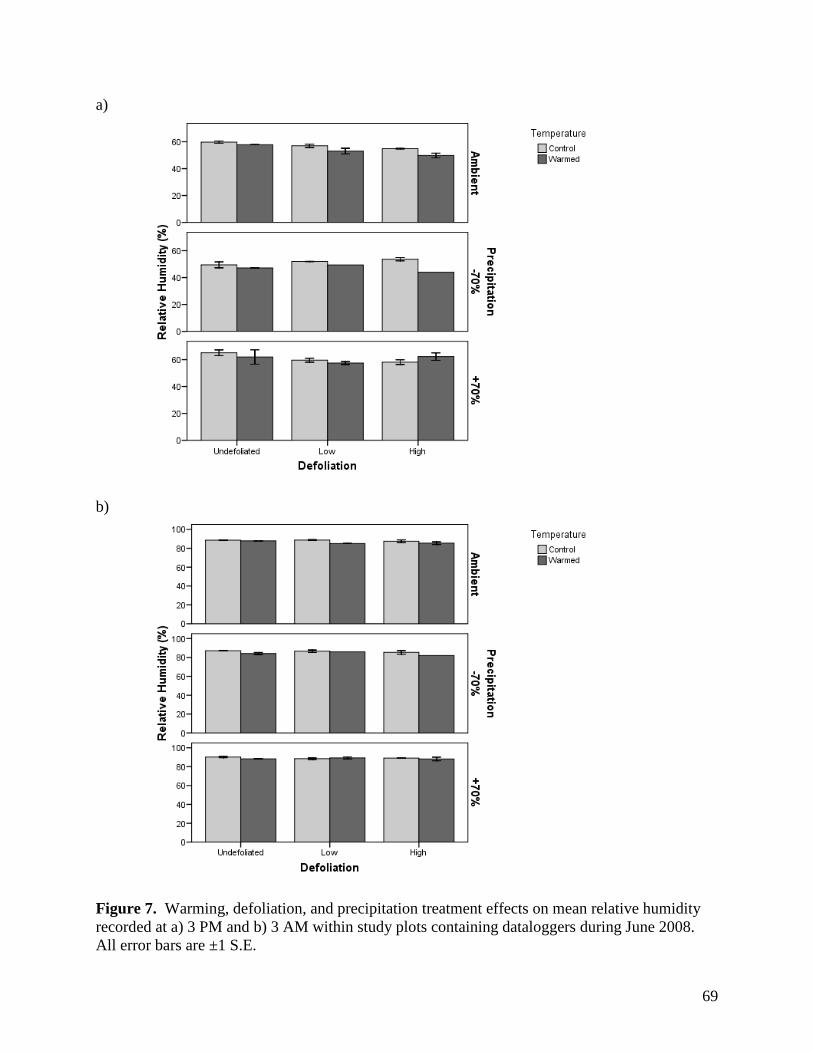
69
a)
b)
Figure 7. Warming, defoliation, and precipitation treatment effects on mean relative humidity recorded at a) 3 PM and b) 3 AM within study plots containing dataloggers during June 2008. All error bars are ±1 S.E.
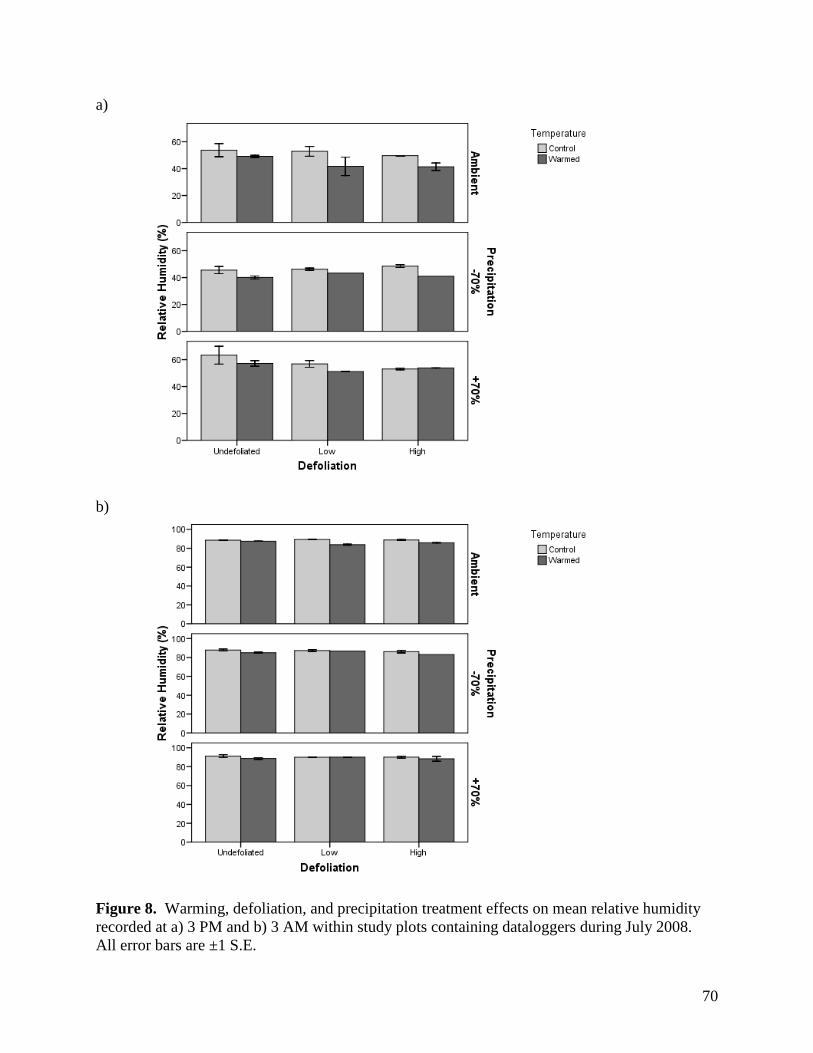
70
a)
b)
Figure 8. Warming, defoliation, and precipitation treatment effects on mean relative humidity recorded at a) 3 PM and b) 3 AM within study plots containing dataloggers during July 2008. All error bars are ±1 S.E.
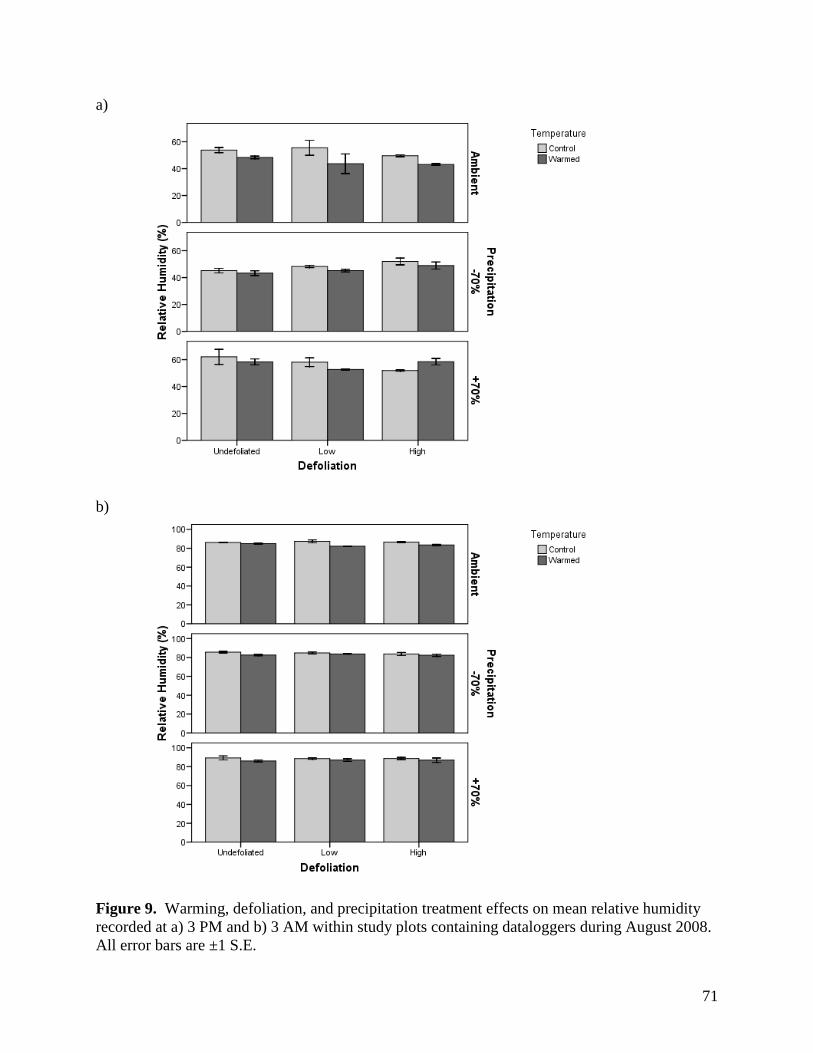
71
a)
b)
Figure 9. Warming, defoliation, and precipitation treatment effects on mean relative humidity recorded at a) 3 PM and b) 3 AM within study plots containing dataloggers during August 2008. All error bars are ±1 S.E.
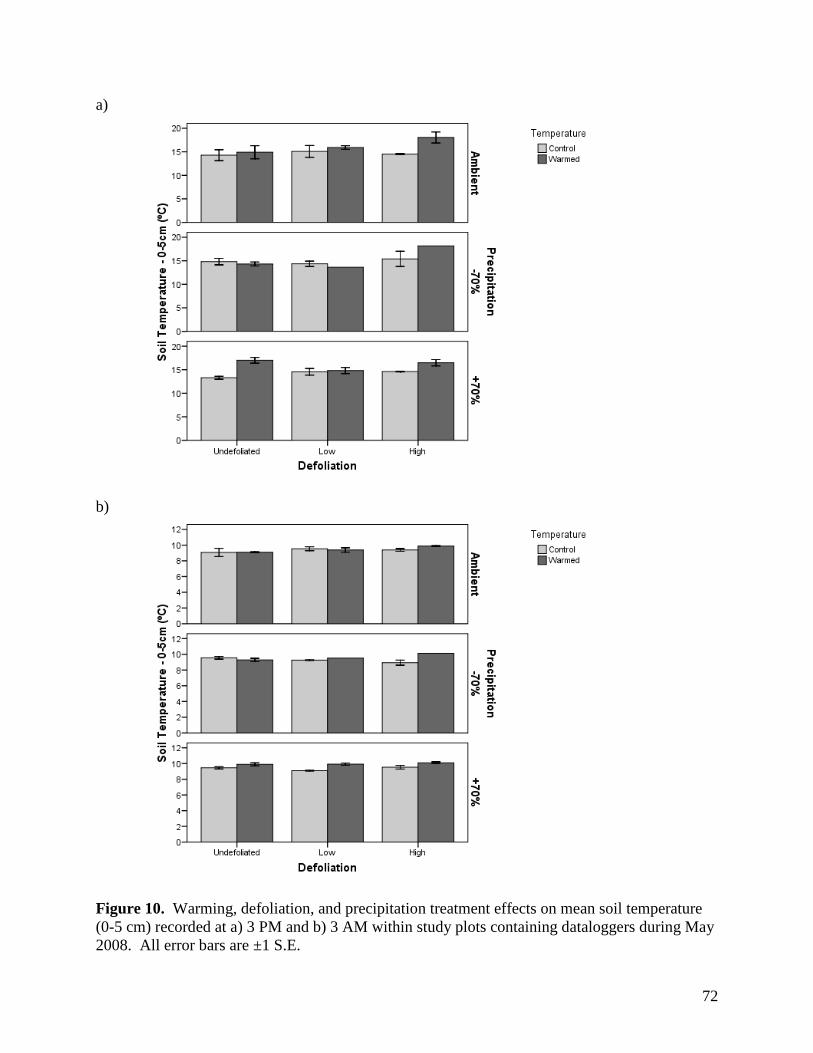
72
a)
b)
Figure 10. Warming, defoliation, and precipitation treatment effects on mean soil temperature (0-5 cm) recorded at a) 3 PM and b) 3 AM within study plots containing dataloggers during May 2008. All error bars are ±1 S.E.
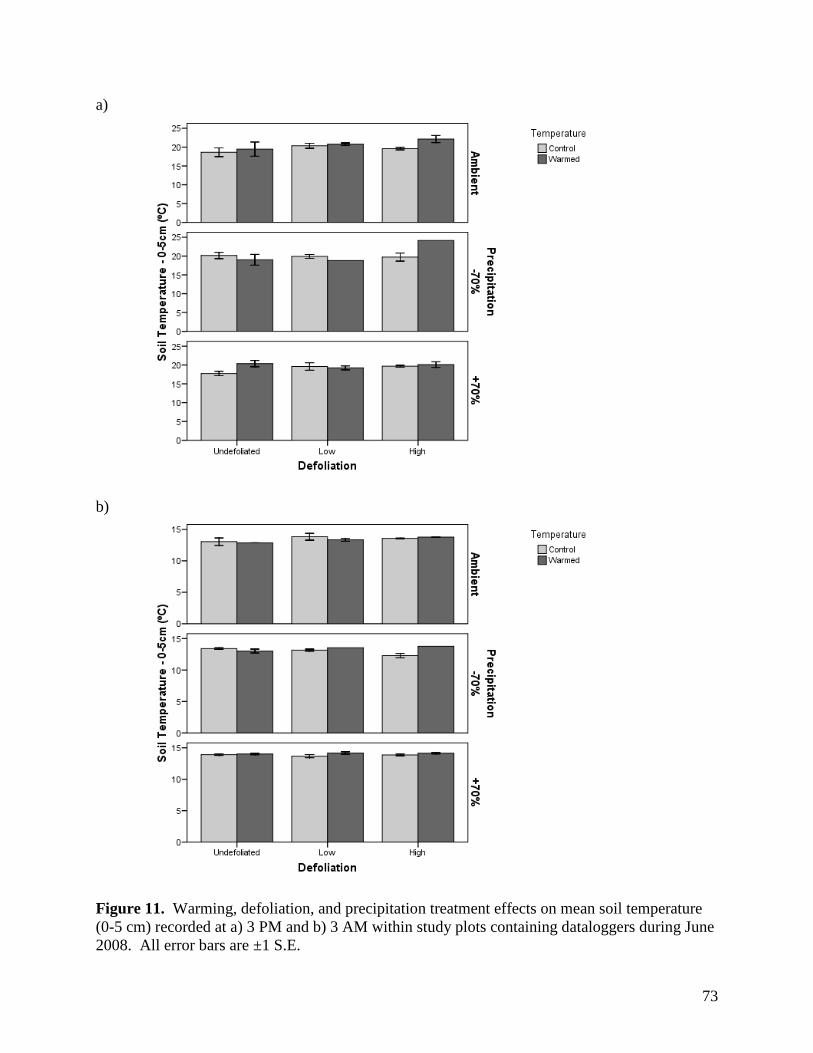
73
a)
b)
Figure 11. Warming, defoliation, and precipitation treatment effects on mean soil temperature (0-5 cm) recorded at a) 3 PM and b) 3 AM within study plots containing dataloggers during June 2008. All error bars are ±1 S.E.
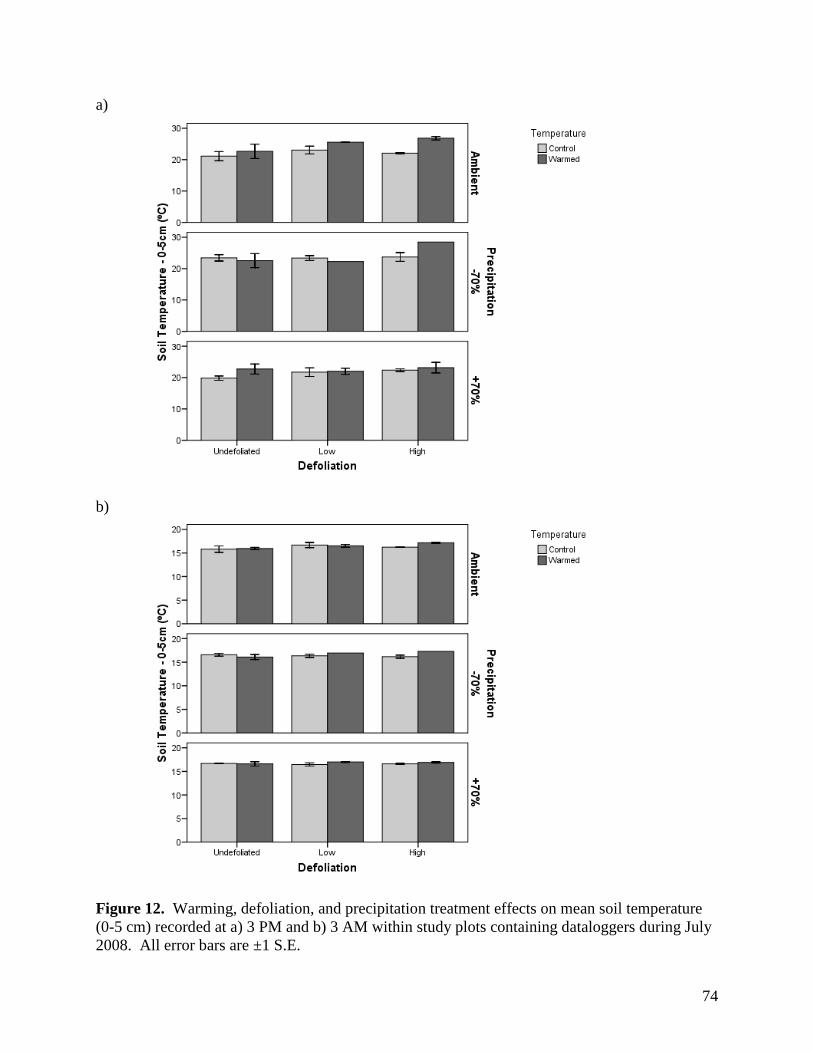
74
a)
b)
Figure 12. Warming, defoliation, and precipitation treatment effects on mean soil temperature (0-5 cm) recorded at a) 3 PM and b) 3 AM within study plots containing dataloggers during July 2008. All error bars are ±1 S.E.
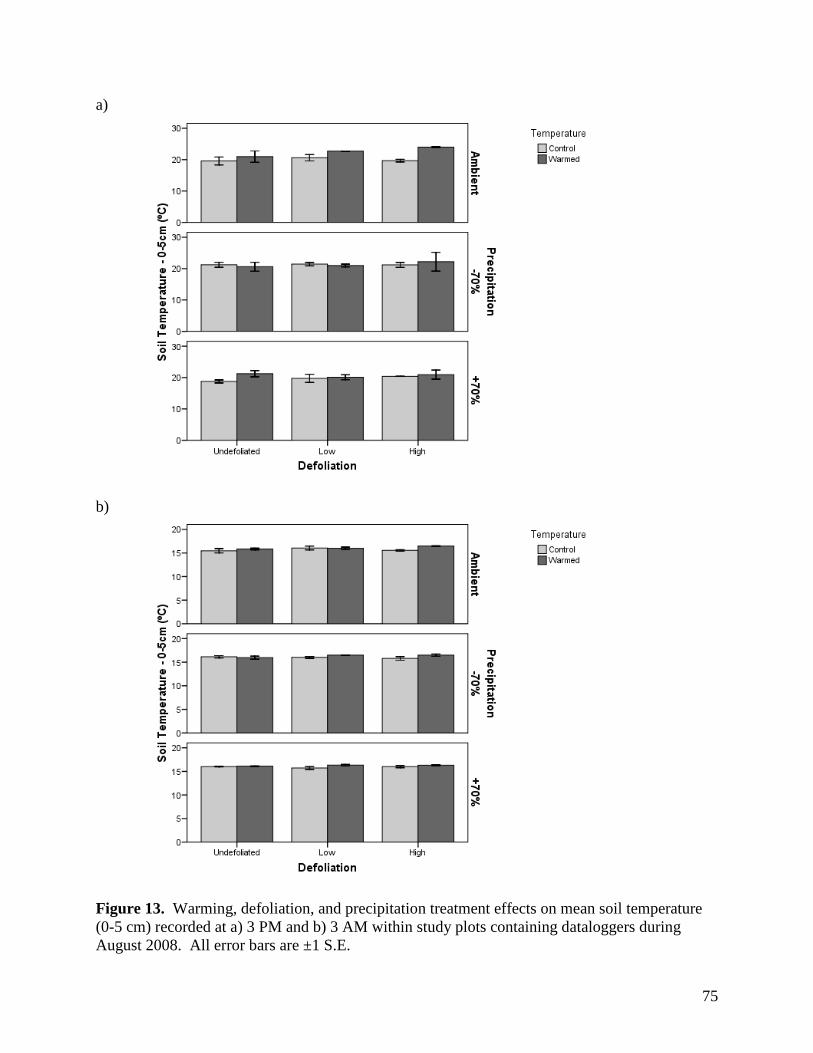
75
a)
b)
Figure 13. Warming, defoliation, and precipitation treatment effects on mean soil temperature (0-5 cm) recorded at a) 3 PM and b) 3 AM within study plots containing dataloggers during August 2008. All error bars are ±1 S.E.
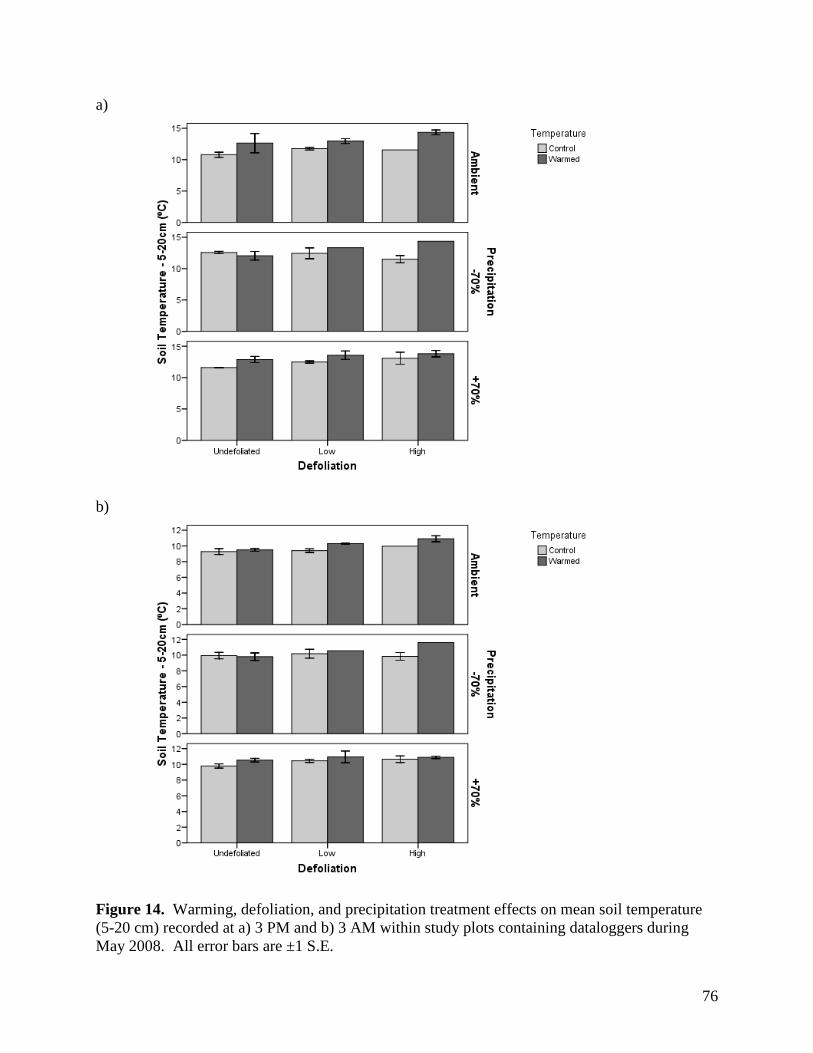
76
a)
b)
Figure 14. Warming, defoliation, and precipitation treatment effects on mean soil temperature (5-20 cm) recorded at a) 3 PM and b) 3 AM within study plots containing dataloggers during May 2008. All error bars are ±1 S.E.
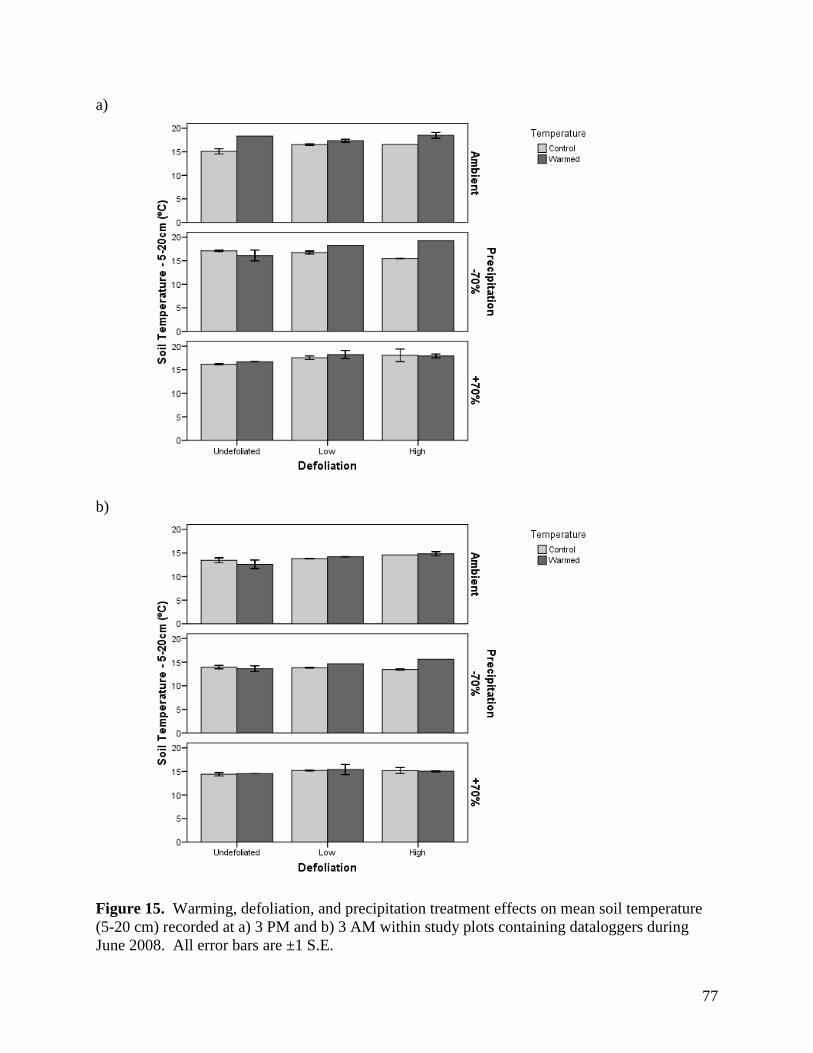
77
a)
b)
Figure 15. Warming, defoliation, and precipitation treatment effects on mean soil temperature (5-20 cm) recorded at a) 3 PM and b) 3 AM within study plots containing dataloggers during June 2008. All error bars are ±1 S.E.
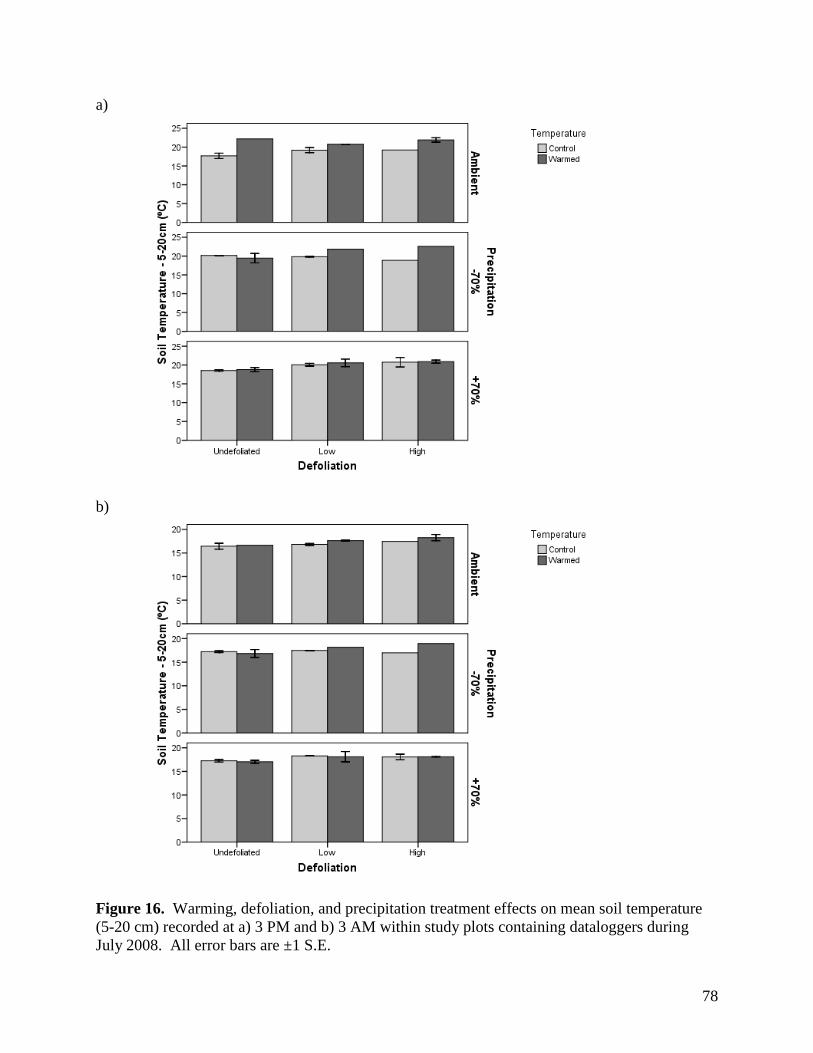
78
a)
b)
Figure 16. Warming, defoliation, and precipitation treatment effects on mean soil temperature (5-20 cm) recorded at a) 3 PM and b) 3 AM within study plots containing dataloggers during July 2008. All error bars are ±1 S.E.
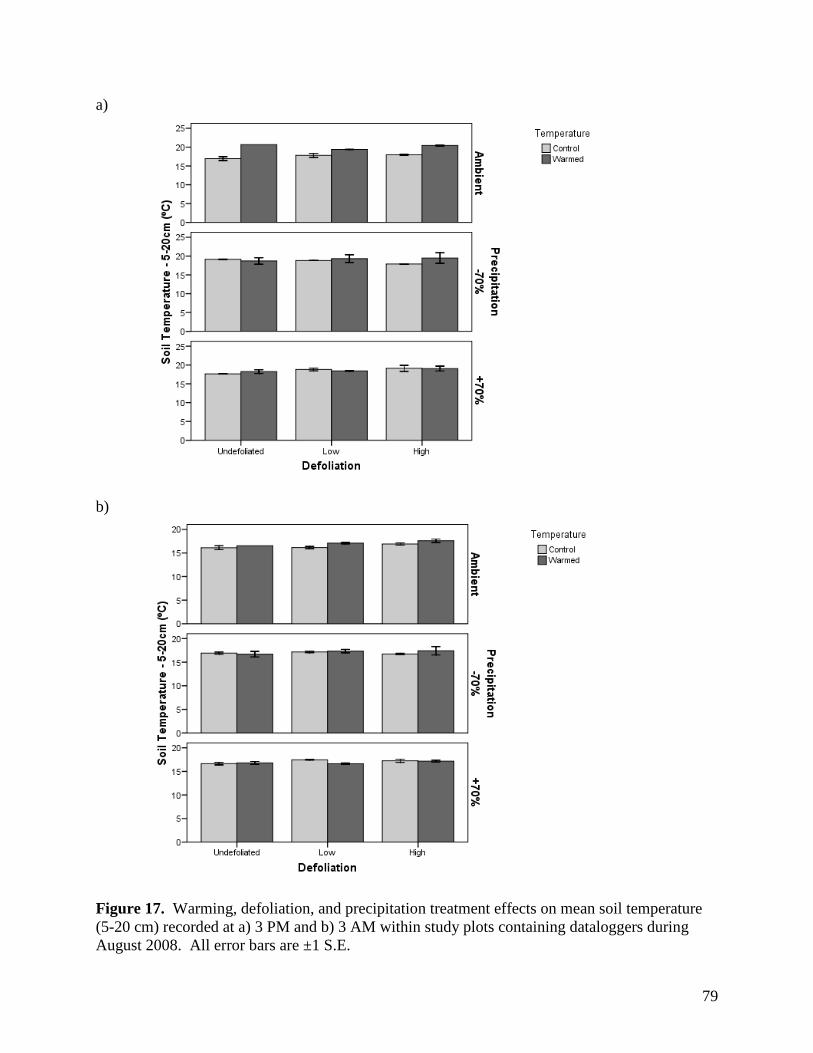
79
a)
b)
Figure 17. Warming, defoliation, and precipitation treatment effects on mean soil temperature (5-20 cm) recorded at a) 3 PM and b) 3 AM within study plots containing dataloggers during August 2008. All error bars are ±1 S.E.
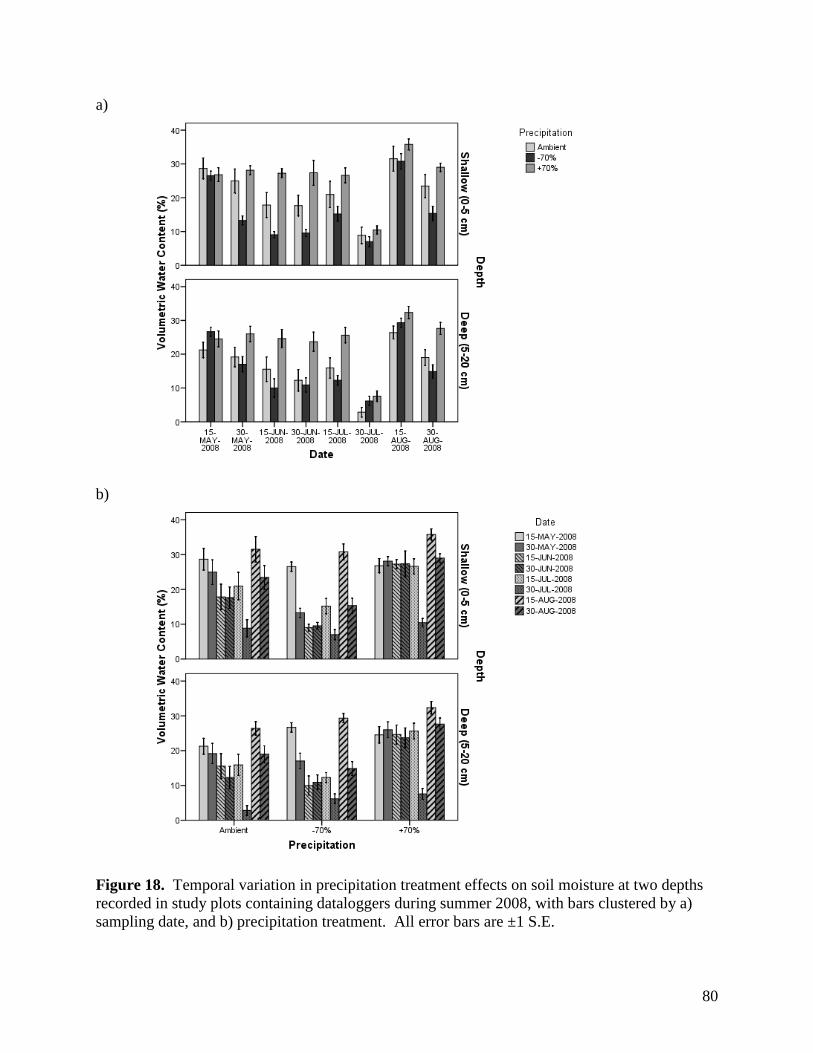
80
a)
b)
Figure 18. Temporal variation in precipitation treatment effects on soil moisture at two depths recorded in study plots containing dataloggers during summer 2008, with bars clustered by a) sampling date, and b) precipitation treatment. All error bars are ±1 S.E.
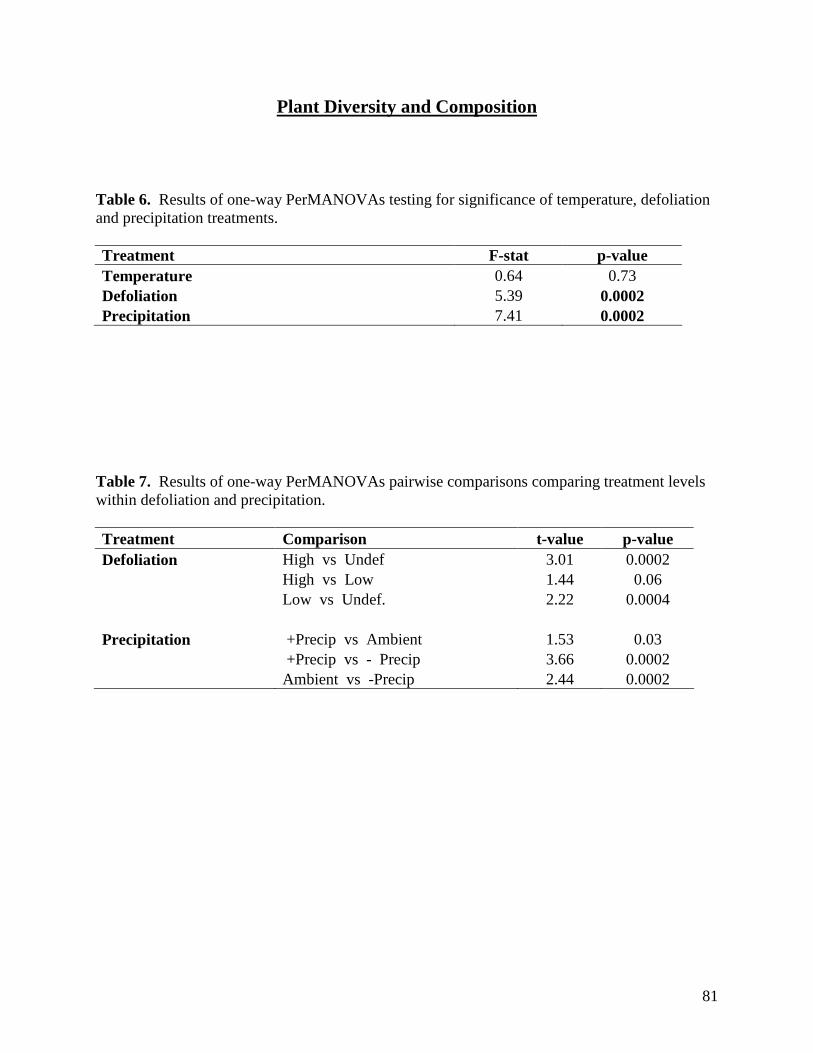
81
Plant Diversity and Composition Table 6. Results of one-way PerMANOVAs testing for significance of temperature, defoliation and precipitation treatments. Treatment F-stat p-value Temperature 0.64 0.73 Defoliation 5.39 0.0002 Precipitation 7.41 0.0002
Table 7. Results of one-way PerMANOVAs pairwise comparisons comparing treatment levels within defoliation and precipitation. Treatment Comparison t-value p-value Defoliation High vs Undef 3.01 0.0002 High vs Low 1.44 0.06 Low vs Undef. 2.22 0.0004 Precipitation +Precip vs Ambient 1.53 0.03 +Precip vs - Precip 3.66 0.0002 Ambient vs -Precip 2.44 0.0002
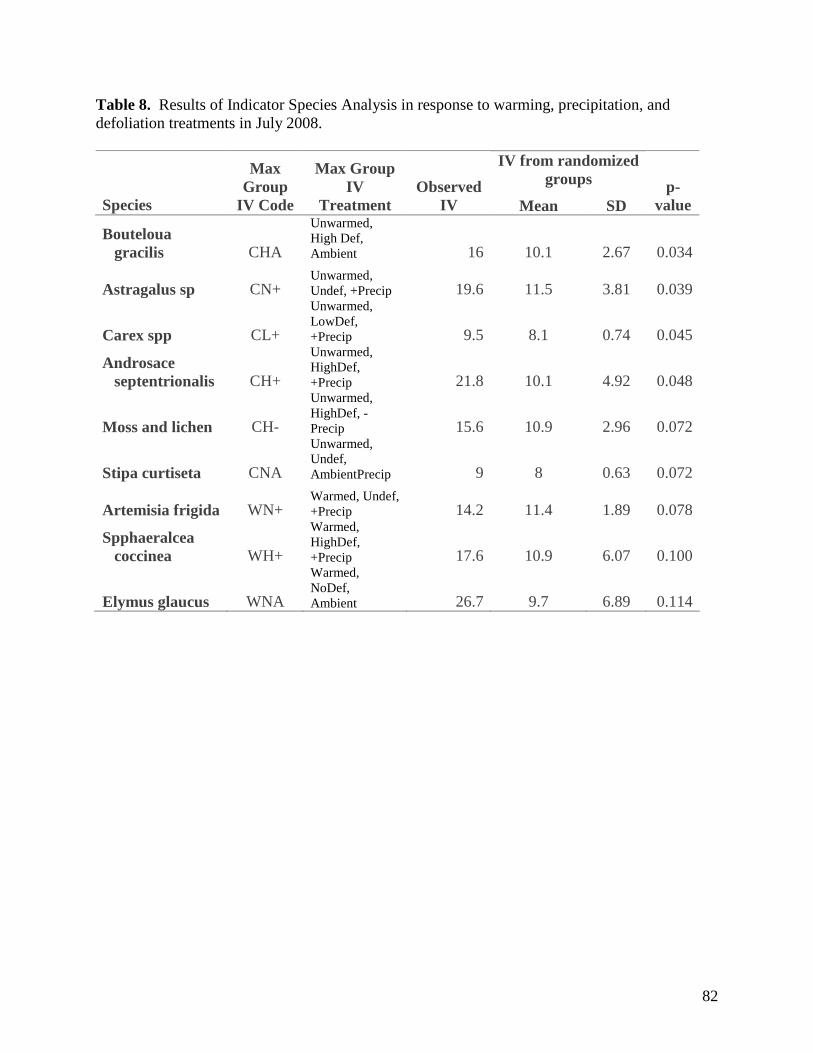
82
Table 8. Results of Indicator Species Analysis in response to warming, precipitation, and defoliation treatments in July 2008.
IV from randomized groups
Species
Max Group
IV Code
Max Group IV
Treatment Observed
IV Mean SD p-
value
Bouteloua gracilis CHA
Unwarmed, High Def, Ambient 16 10.1 2.67 0.034
Astragalus sp CN+ Unwarmed, Undef, +Precip 19.6 11.5 3.81 0.039
Carex spp CL+
Unwarmed, LowDef, +Precip 9.5 8.1 0.74 0.045
Androsace septentrionalis CH+
Unwarmed, HighDef, +Precip 21.8 10.1 4.92 0.048
Moss and lichen CH-
Unwarmed, HighDef, -Precip 15.6 10.9 2.96 0.072
Stipa curtiseta CNA
Unwarmed, Undef, AmbientPrecip 9 8 0.63 0.072
Artemisia frigida WN+ Warmed, Undef, +Precip 14.2 11.4 1.89 0.078
Spphaeralcea coccinea WH+
Warmed, HighDef, +Precip 17.6 10.9 6.07 0.100
Elymus glaucus WNA
Warmed, NoDef, Ambient 26.7 9.7 6.89 0.114
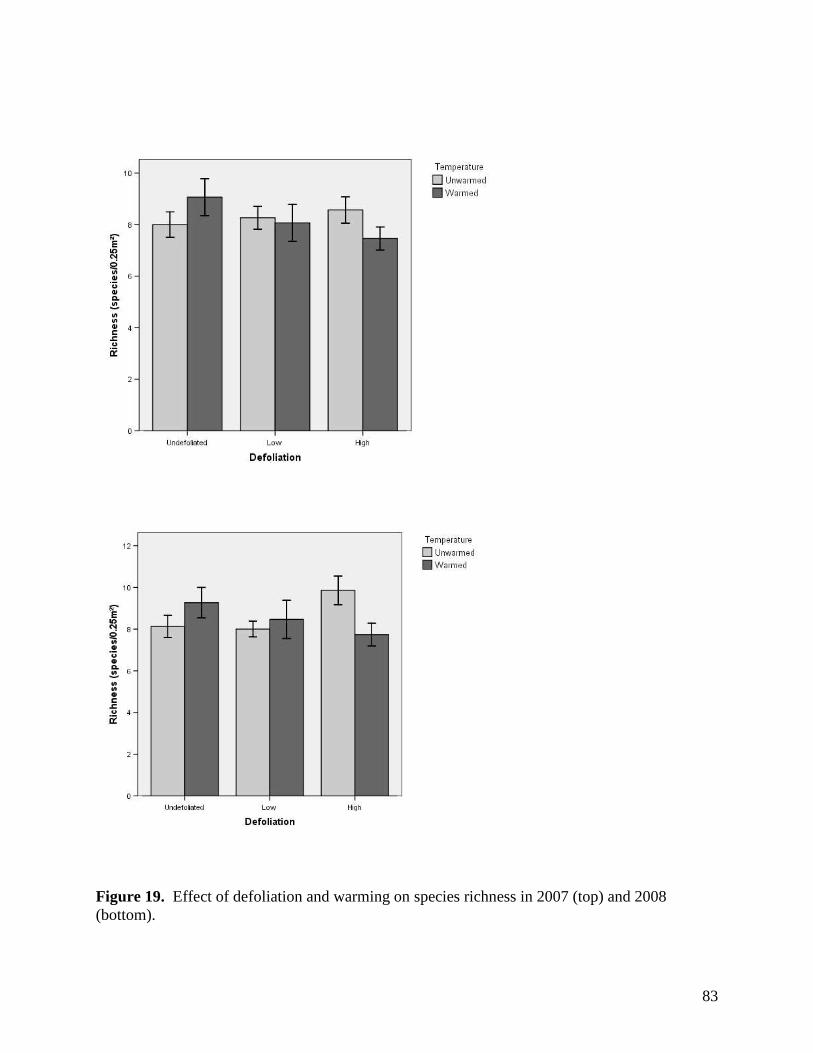
83
Figure 19. Effect of defoliation and warming on species richness in 2007 (top) and 2008 (bottom).
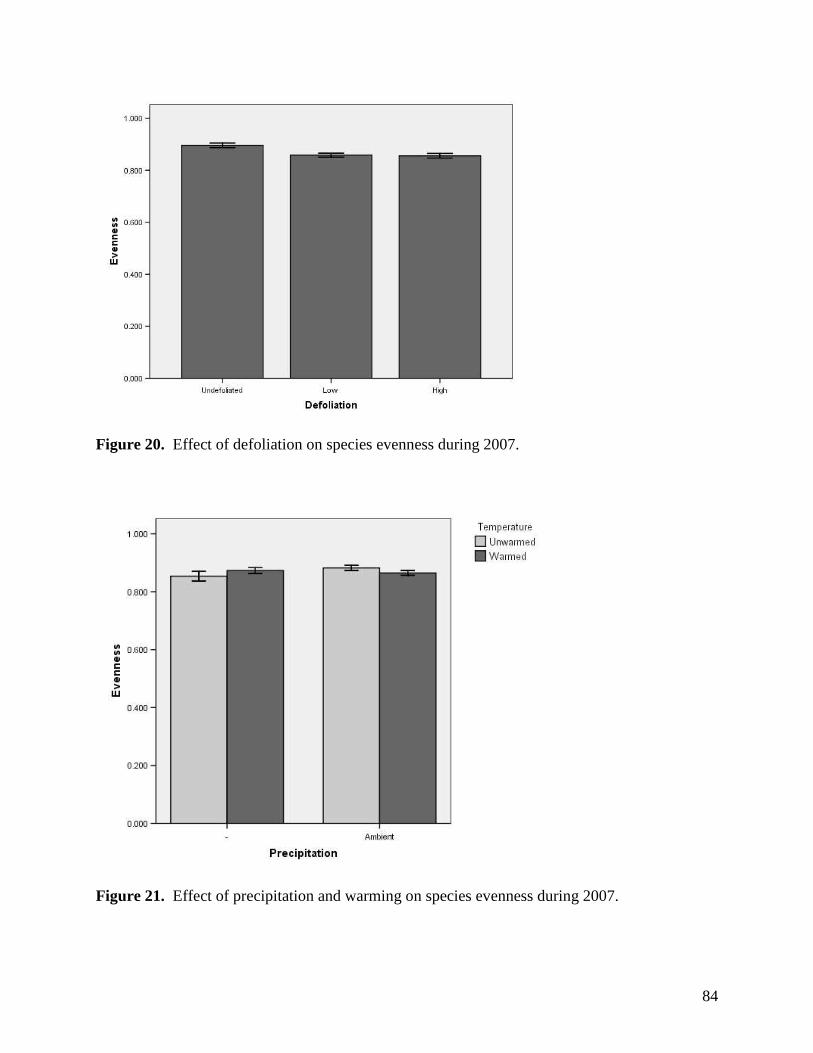
84
Figure 20. Effect of defoliation on species evenness during 2007.
Figure 21. Effect of precipitation and warming on species evenness during 2007.
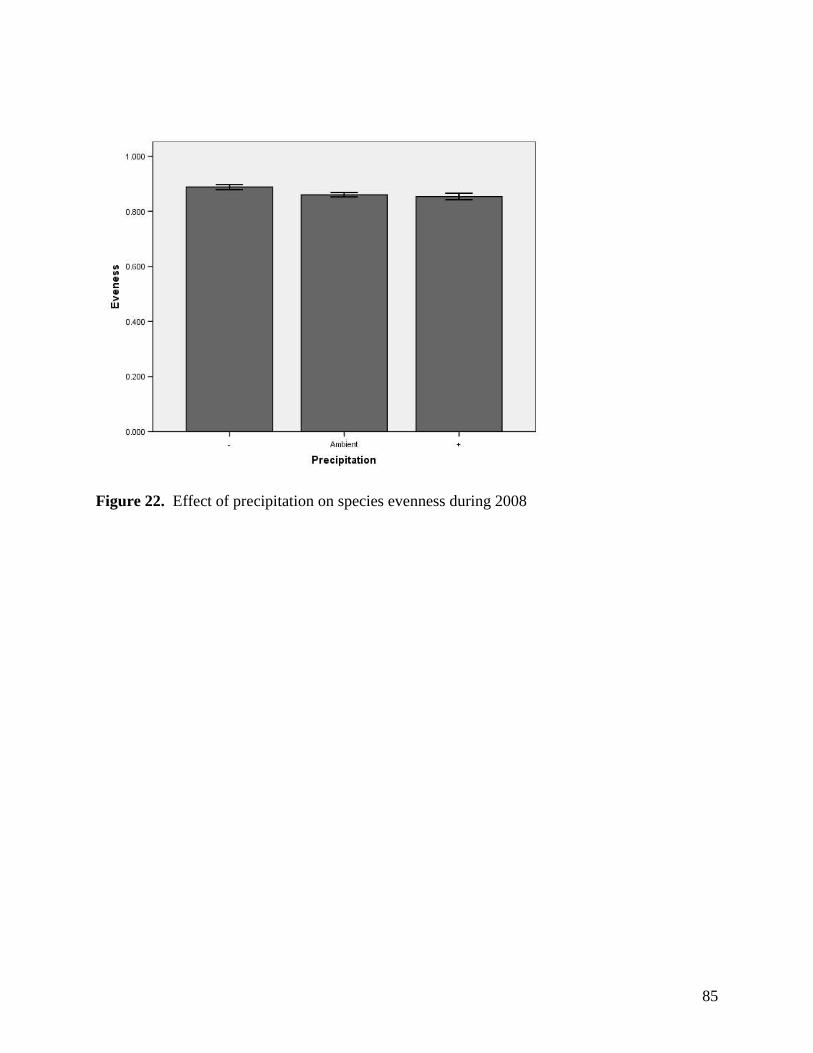
85
Figure 22. Effect of precipitation on species evenness during 2008
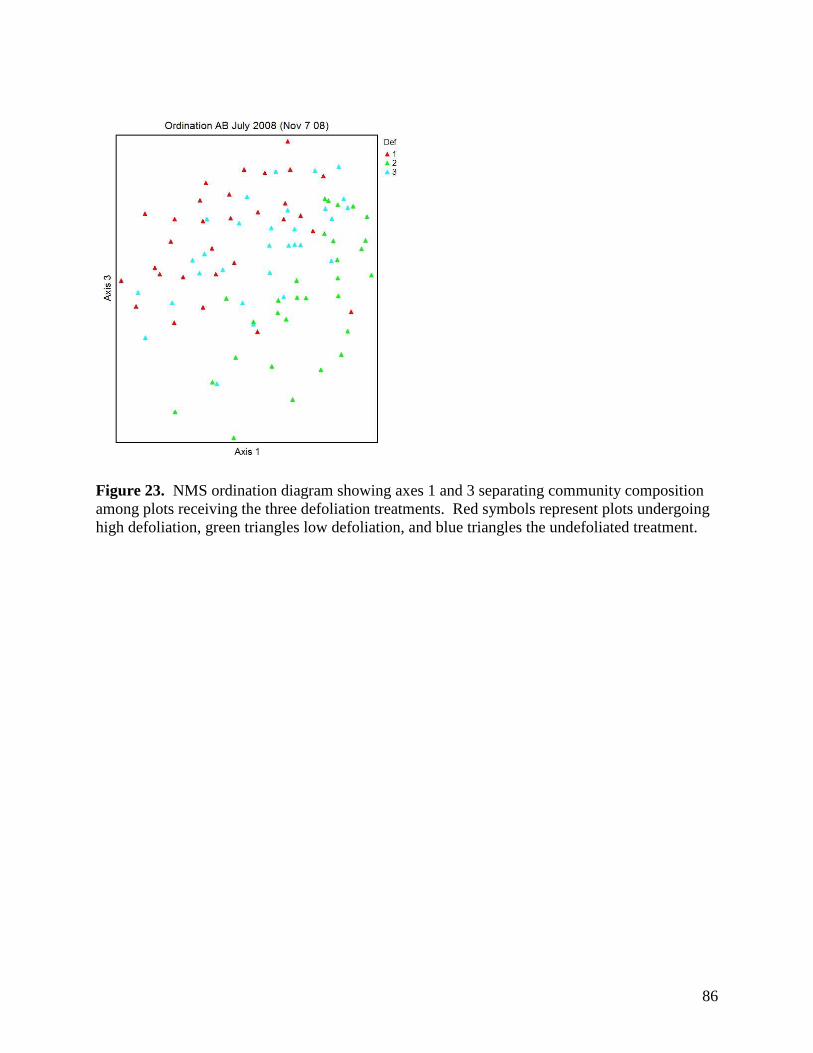
86
Figure 23. NMS ordination diagram showing axes 1 and 3 separating community composition among plots receiving the three defoliation treatments. Red symbols represent plots undergoing high defoliation, green triangles low defoliation, and blue triangles the undefoliated treatment.
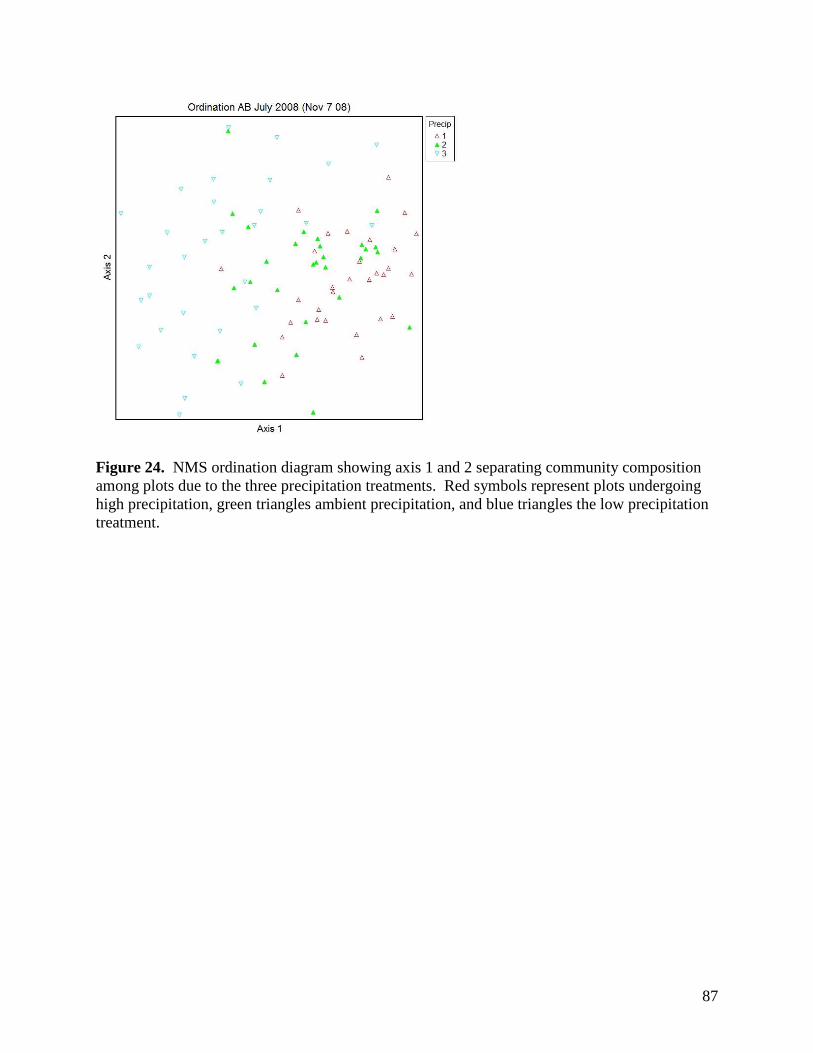
87
Figure 24. NMS ordination diagram showing axis 1 and 2 separating community composition among plots due to the three precipitation treatments. Red symbols represent plots undergoing high precipitation, green triangles ambient precipitation, and blue triangles the low precipitation treatment.
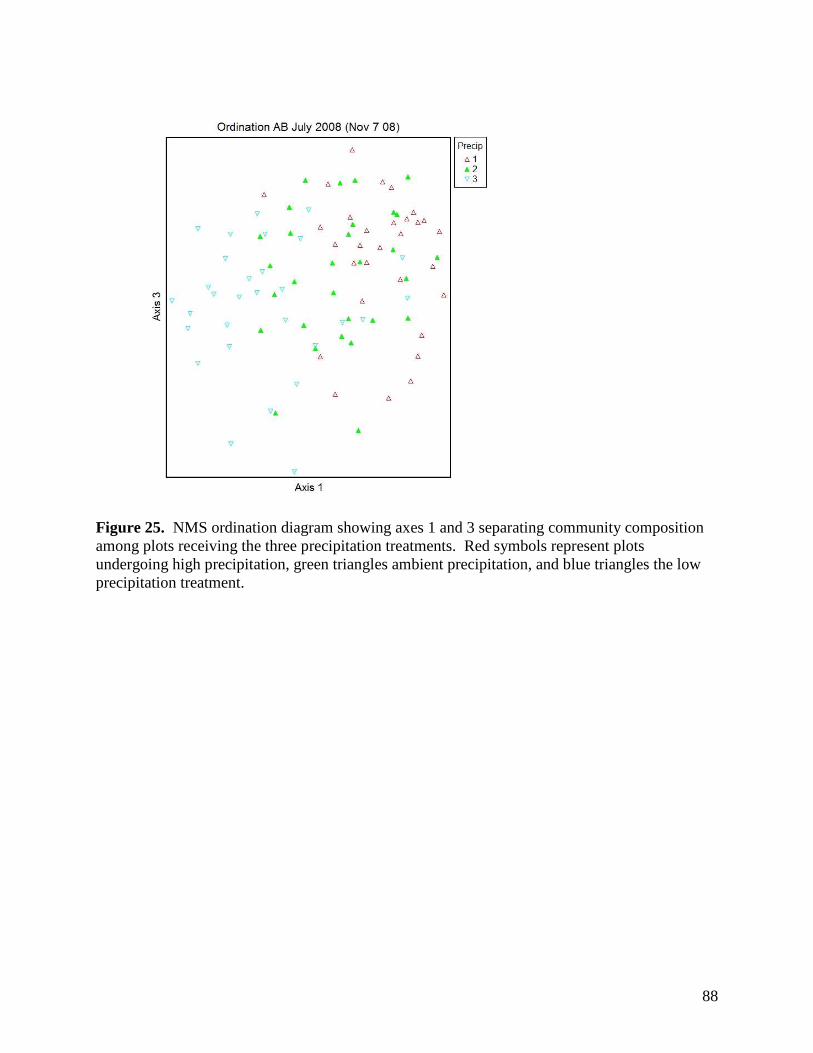
88
Figure 25. NMS ordination diagram showing axes 1 and 3 separating community composition among plots receiving the three precipitation treatments. Red symbols represent plots undergoing high precipitation, green triangles ambient precipitation, and blue triangles the low precipitation treatment.
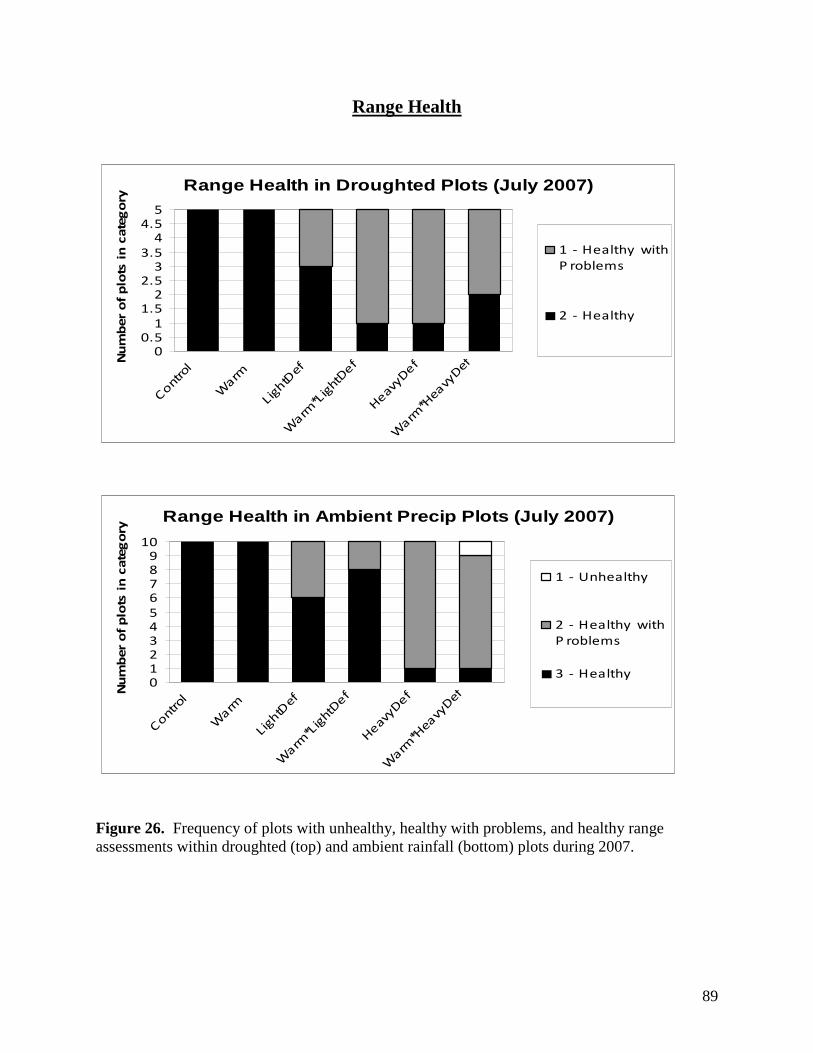
89
Range Health
Figure 26. Frequency of plots with unhealthy, healthy with problems, and healthy range assessments within droughted (top) and ambient rainfall (bottom) plots during 2007.
Range Health in Ambient Precip Plots (July 2007)
012345
6789
10
Contr
ol
Warm
Ligh
tDef
Warm
*Lig
htDef
Heavy
Def
Warm
*Hea
vyDefN
um
ber
of
plo
ts i
n c
ate
go
ry
1 - Unhealthy
2 - Healthy with
P roblems
3 - Healthy
Range Health in Droughted Plots (July 2007)
00.5
1
1.52
2.53
3.5
44.5
5
Contr
ol
Warm
LightD
ef
Warm
*Lig
htDef
Heavy
Def
Warm
*Hea
vyDefN
um
ber
of
plo
ts i
n c
ate
go
ry
1 - Healthy with
P roblems
2 - Healthy
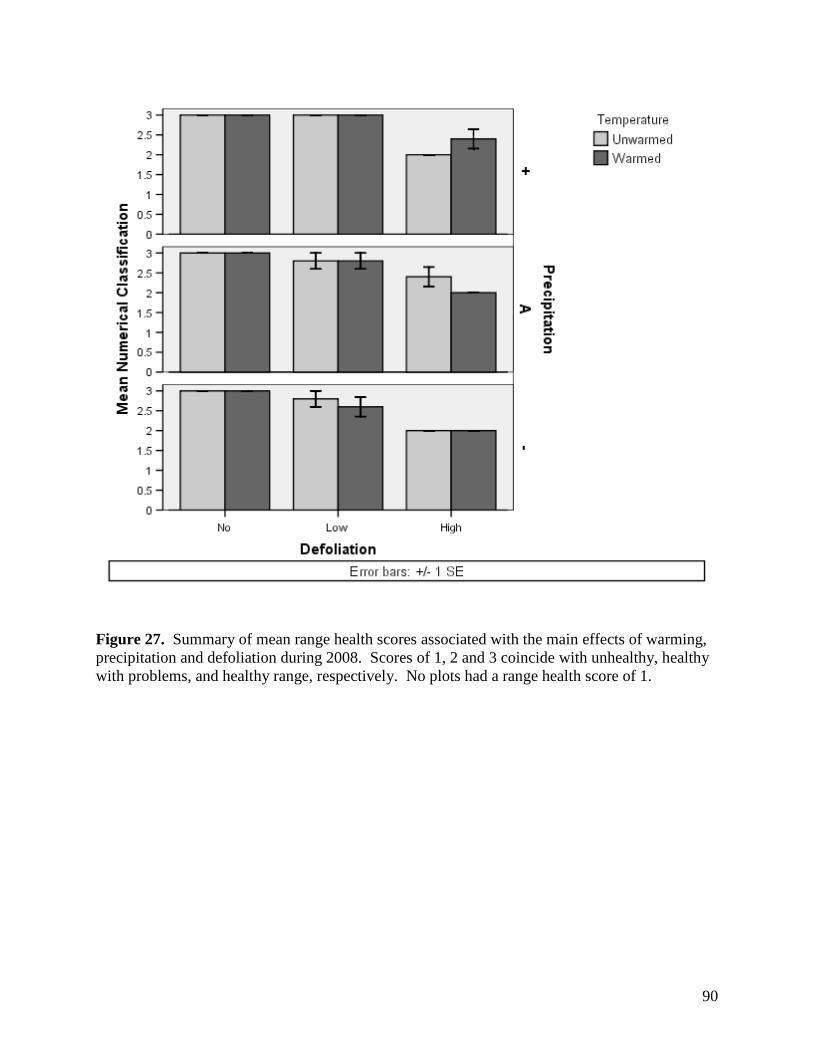
90
Figure 27. Summary of mean range health scores associated with the main effects of warming, precipitation and defoliation during 2008. Scores of 1, 2 and 3 coincide with unhealthy, healthy with problems, and healthy range, respectively. No plots had a range health score of 1.
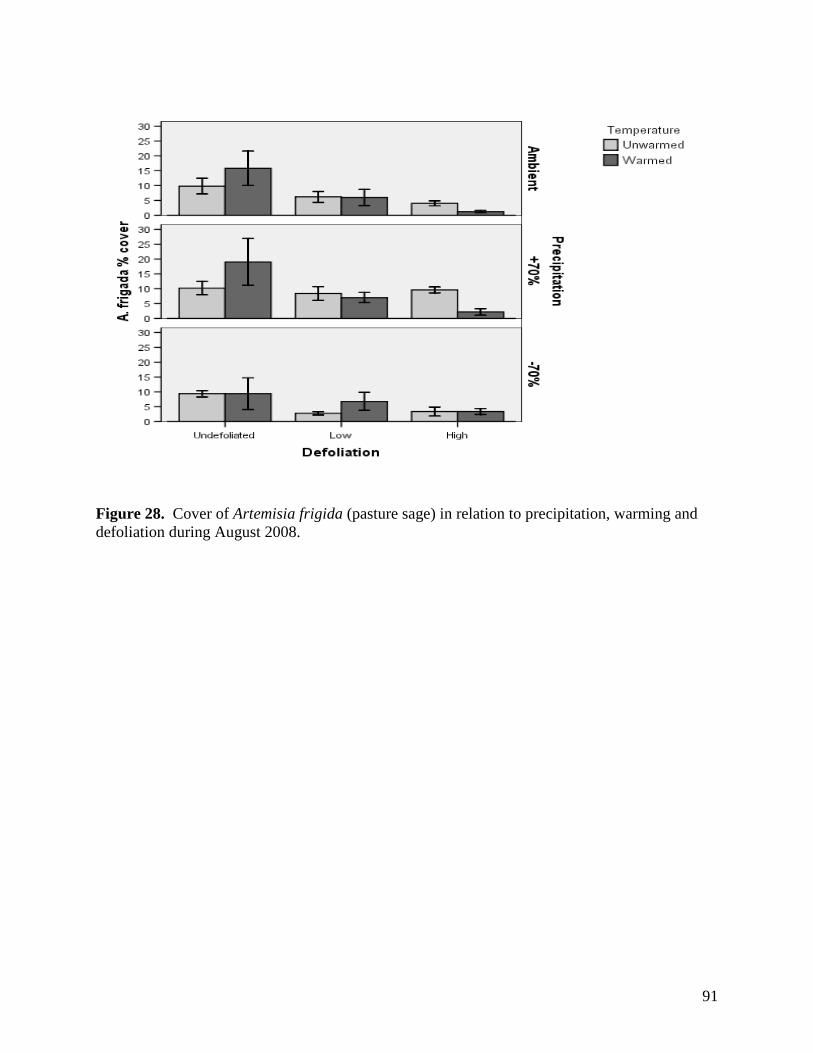
91
Figure 28. Cover of Artemisia frigida (pasture sage) in relation to precipitation, warming and defoliation during August 2008.
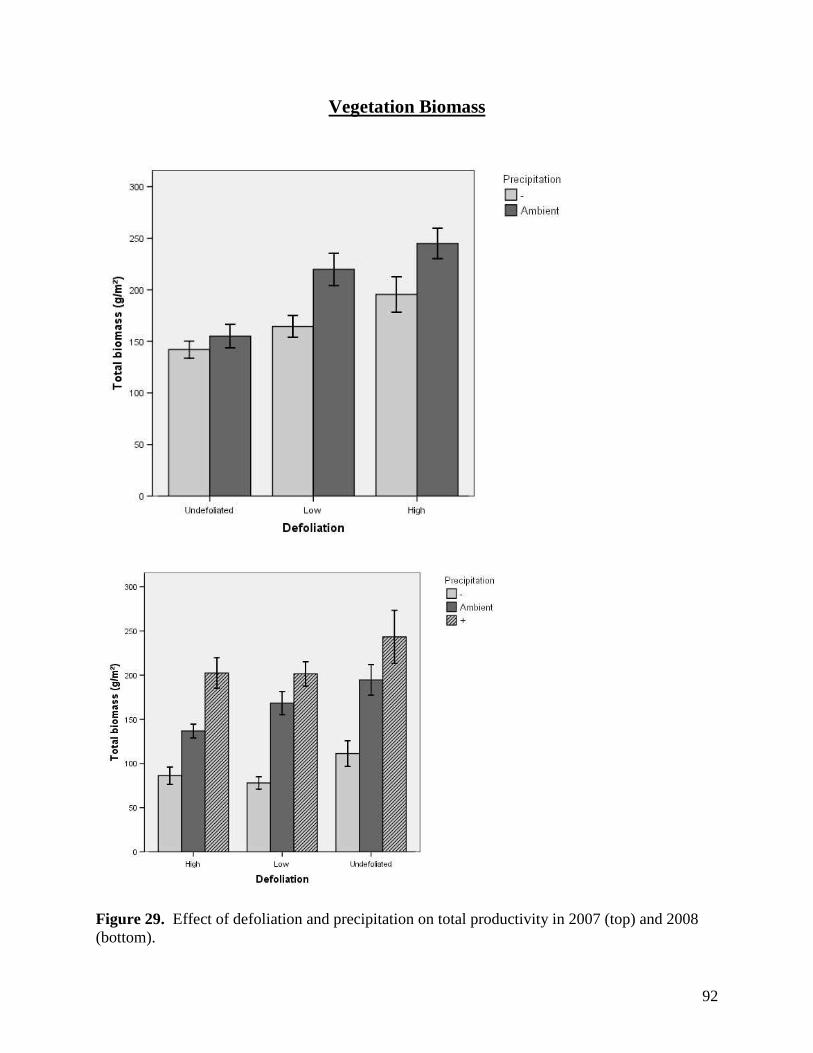
92
Vegetation Biomass
Figure 29. Effect of defoliation and precipitation on total productivity in 2007 (top) and 2008 (bottom).
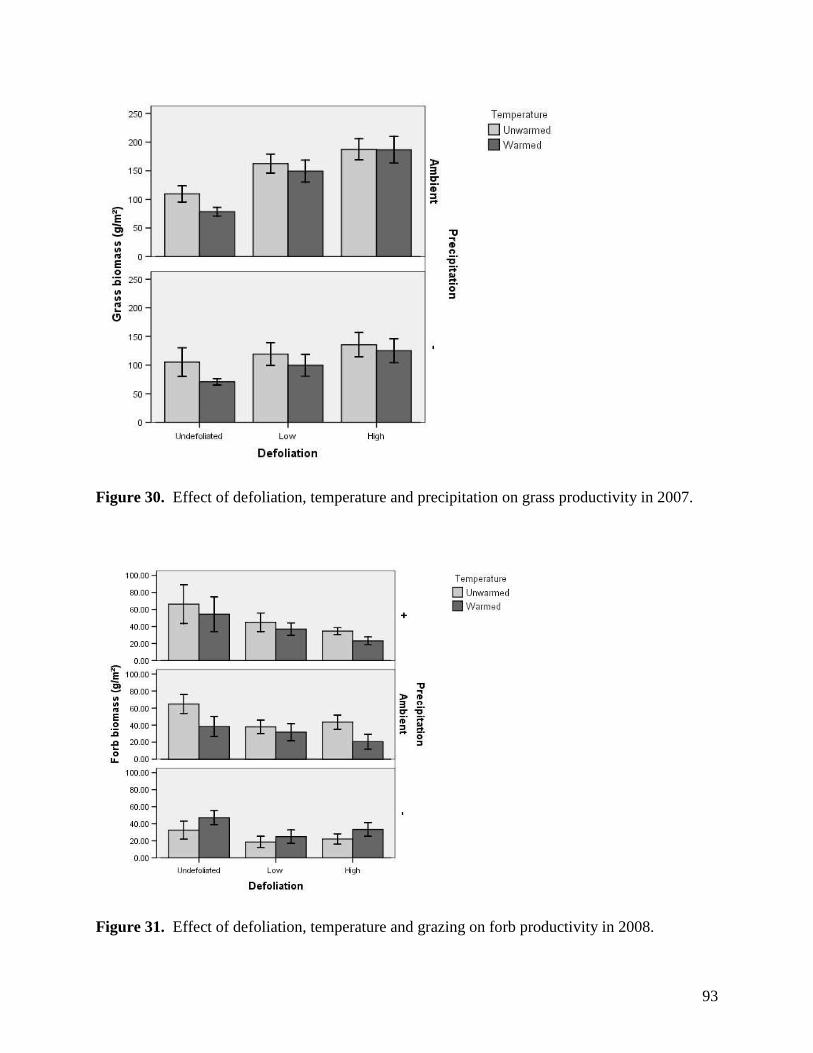
93
Figure 30. Effect of defoliation, temperature and precipitation on grass productivity in 2007.
Figure 31. Effect of defoliation, temperature and grazing on forb productivity in 2008.
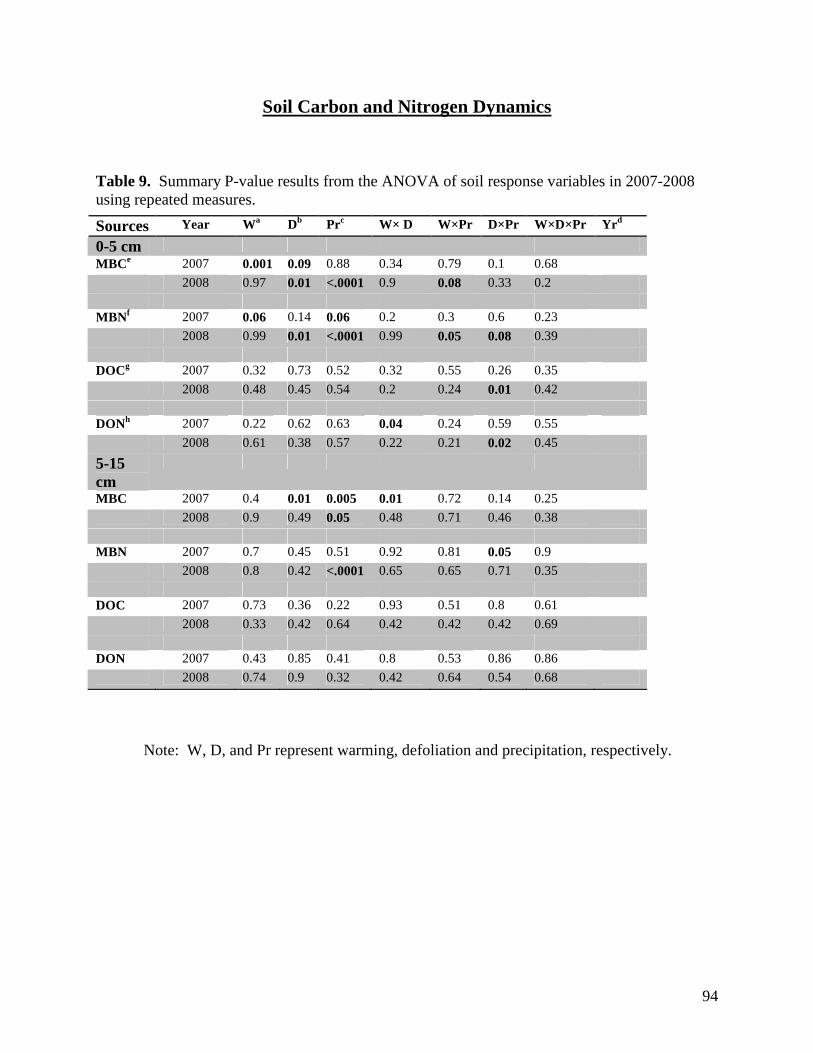
94
Soil Carbon and Nitrogen Dynamics
Table 9. Summary P-value results from the ANOVA of soil response variables in 2007-2008 using repeated measures.
Note: W, D, and Pr represent warming, defoliation and precipitation, respectively.
Sources Year Wa Db Prc W× D W×Pr D×Pr W×D×Pr Yr d
0-5 cm MBC e 2007 0.001 0.09 0.88 0.34 0.79 0.1 0.68 2008 0.97 0.01 <.0001 0.9 0.08 0.33 0.2 MBN f 2007 0.06 0.14 0.06 0.2 0.3 0.6 0.23 2008 0.99 0.01 <.0001 0.99 0.05 0.08 0.39 DOCg 2007 0.32 0.73 0.52 0.32 0.55 0.26 0.35 2008 0.48 0.45 0.54 0.2 0.24 0.01 0.42
DONh 2007 0.22 0.62 0.63 0.04 0.24 0.59 0.55 2008 0.61 0.38 0.57 0.22 0.21 0.02 0.45
5-15 cm
MBC 2007 0.4 0.01 0.005 0.01 0.72 0.14 0.25 2008 0.9 0.49 0.05 0.48 0.71 0.46 0.38 MBN 2007 0.7 0.45 0.51 0.92 0.81 0.05 0.9 2008 0.8 0.42 <.0001 0.65 0.65 0.71 0.35 DOC 2007 0.73 0.36 0.22 0.93 0.51 0.8 0.61 2008 0.33 0.42 0.64 0.42 0.42 0.42 0.69 DON 2007 0.43 0.85 0.41 0.8 0.53 0.86 0.86 2008 0.74 0.9 0.32 0.42 0.64 0.54 0.68
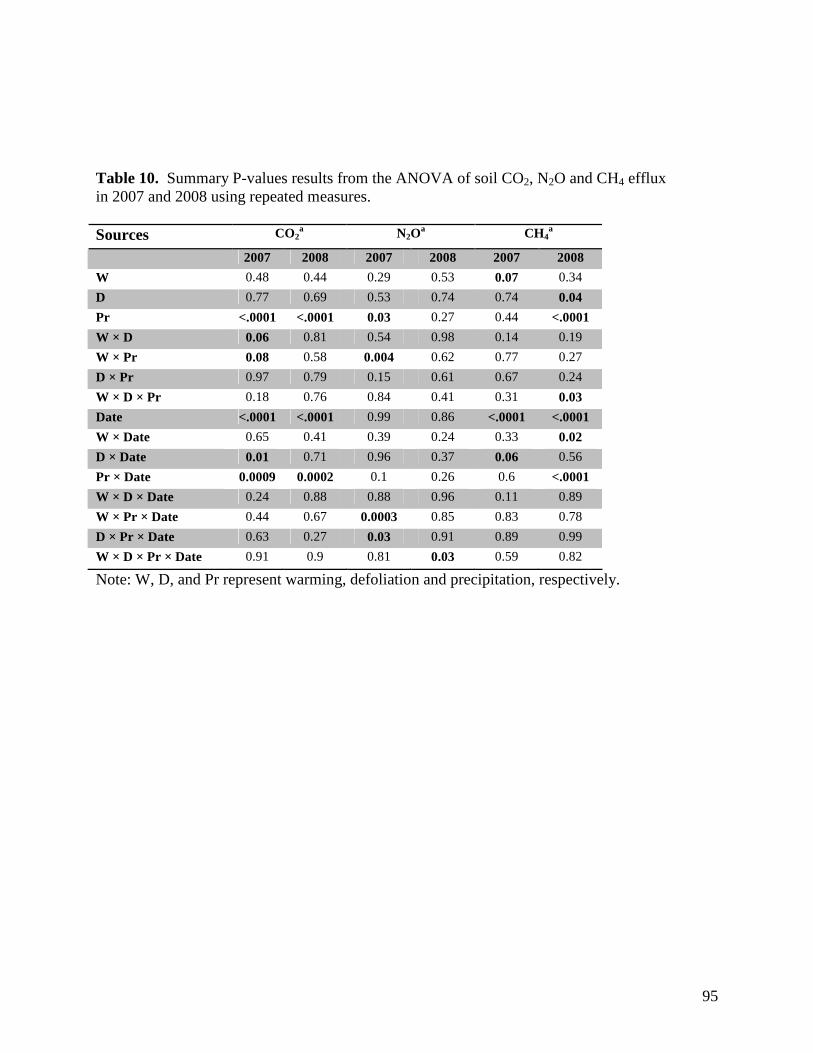
95
Table 10. Summary P-values results from the ANOVA of soil CO2, N2O and CH4 efflux in 2007 and 2008 using repeated measures. Sources CO2
a N2Oa CH4
a
2007 2008 2007 2008 2007 2008
W 0.48 0.44 0.29 0.53 0.07 0.34
D 0.77 0.69 0.53 0.74 0.74 0.04
Pr <.0001 <.0001 0.03 0.27 0.44 <.0001
W × D 0.06 0.81 0.54 0.98 0.14 0.19
W × Pr 0.08 0.58 0.004 0.62 0.77 0.27
D × Pr 0.97 0.79 0.15 0.61 0.67 0.24
W × D × Pr 0.18 0.76 0.84 0.41 0.31 0.03
Date <.0001 <.0001 0.99 0.86 <.0001 <.0001
W × Date 0.65 0.41 0.39 0.24 0.33 0.02
D × Date 0.01 0.71 0.96 0.37 0.06 0.56
Pr × Date 0.0009 0.0002 0.1 0.26 0.6 <.0001
W × D × Date 0.24 0.88 0.88 0.96 0.11 0.89
W × Pr × Date 0.44 0.67 0.0003 0.85 0.83 0.78
D × Pr × Date 0.63 0.27 0.03 0.91 0.89 0.99
W × D × Pr × Date 0.91 0.9 0.81 0.03 0.59 0.82
Note: W, D, and Pr represent warming, defoliation and precipitation, respectively.

96
Figure 32. Defoliation, precipitation and warming effects on average soil microbial biomass carbon (MBC) during the 2007 and 2008 growing seasons at 0-5 cm depth (left) and 5-15 cm depth (right). Error bars represent 1 SE.
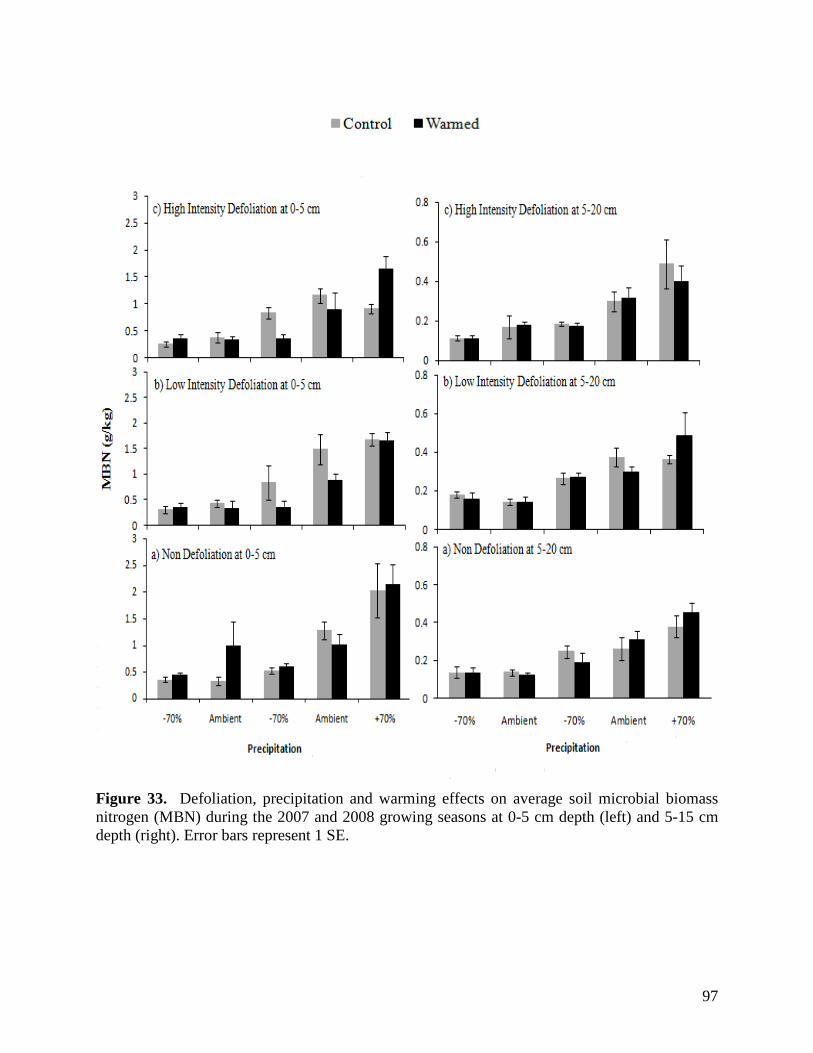
97
Figure 33. Defoliation, precipitation and warming effects on average soil microbial biomass nitrogen (MBN) during the 2007 and 2008 growing seasons at 0-5 cm depth (left) and 5-15 cm depth (right). Error bars represent 1 SE.
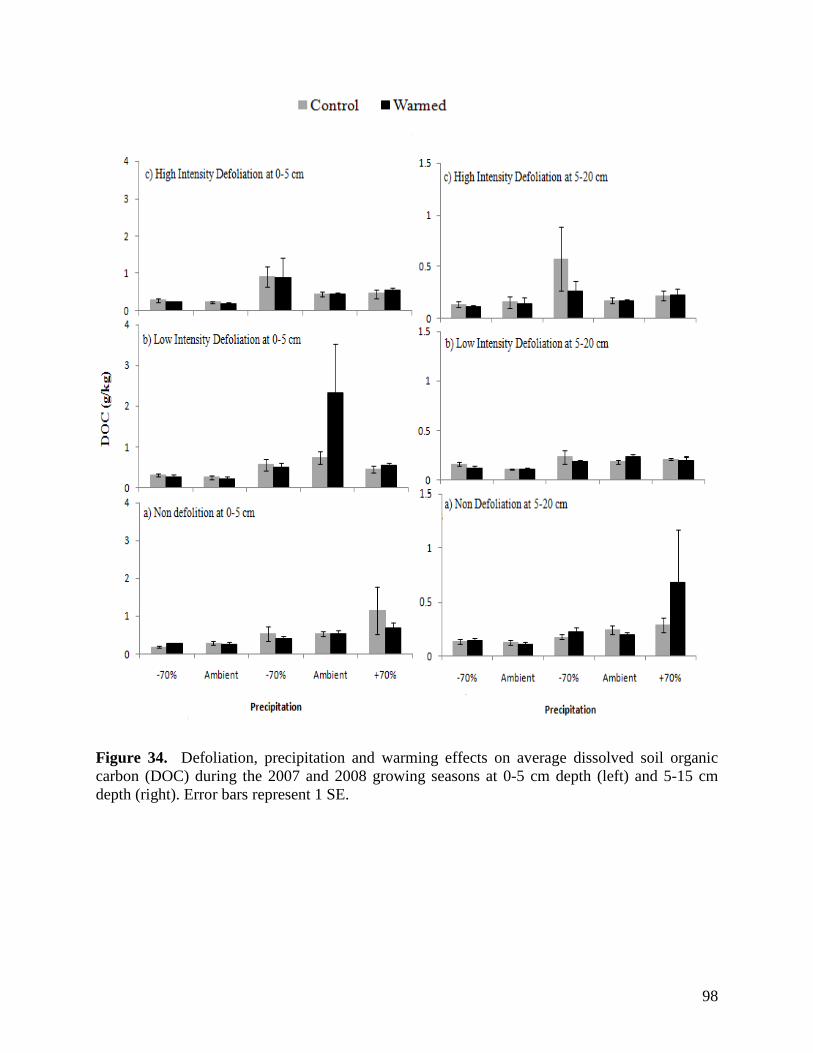
98
Figure 34. Defoliation, precipitation and warming effects on average dissolved soil organic carbon (DOC) during the 2007 and 2008 growing seasons at 0-5 cm depth (left) and 5-15 cm depth (right). Error bars represent 1 SE.
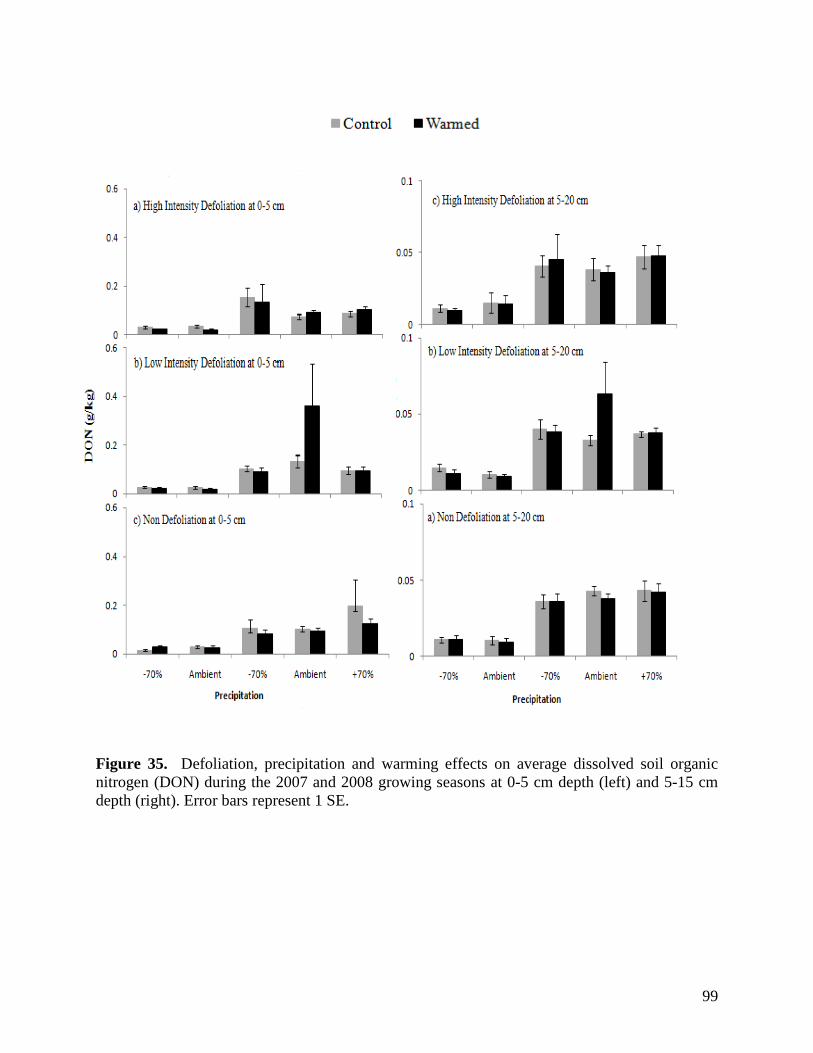
99
Figure 35. Defoliation, precipitation and warming effects on average dissolved soil organic nitrogen (DON) during the 2007 and 2008 growing seasons at 0-5 cm depth (left) and 5-15 cm depth (right). Error bars represent 1 SE.
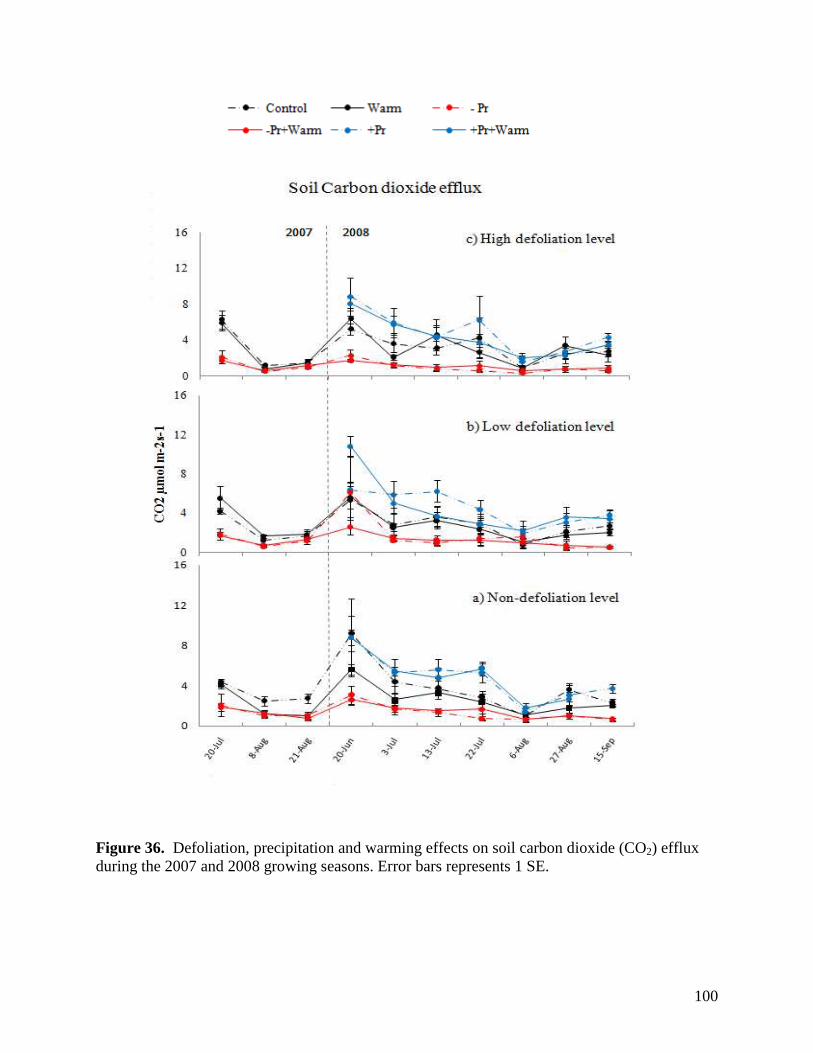
100
Figure 36. Defoliation, precipitation and warming effects on soil carbon dioxide (CO2) efflux during the 2007 and 2008 growing seasons. Error bars represents 1 SE.
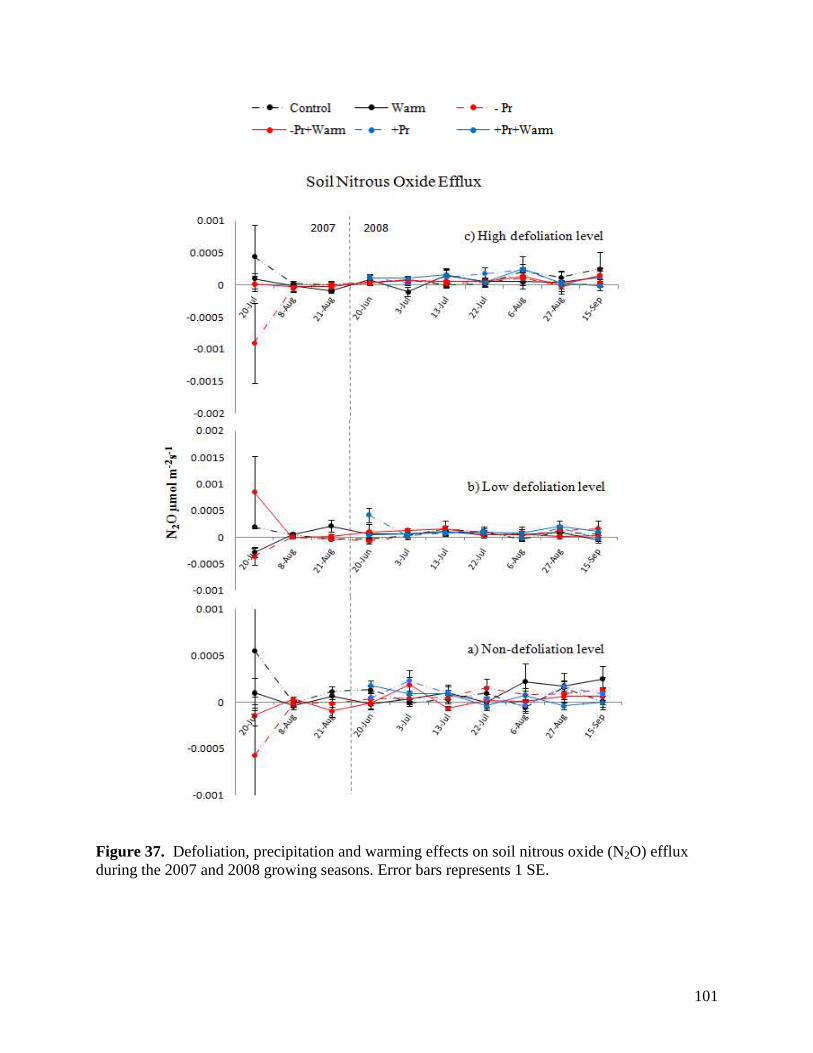
101
Figure 37. Defoliation, precipitation and warming effects on soil nitrous oxide (N2O) efflux during the 2007 and 2008 growing seasons. Error bars represents 1 SE.
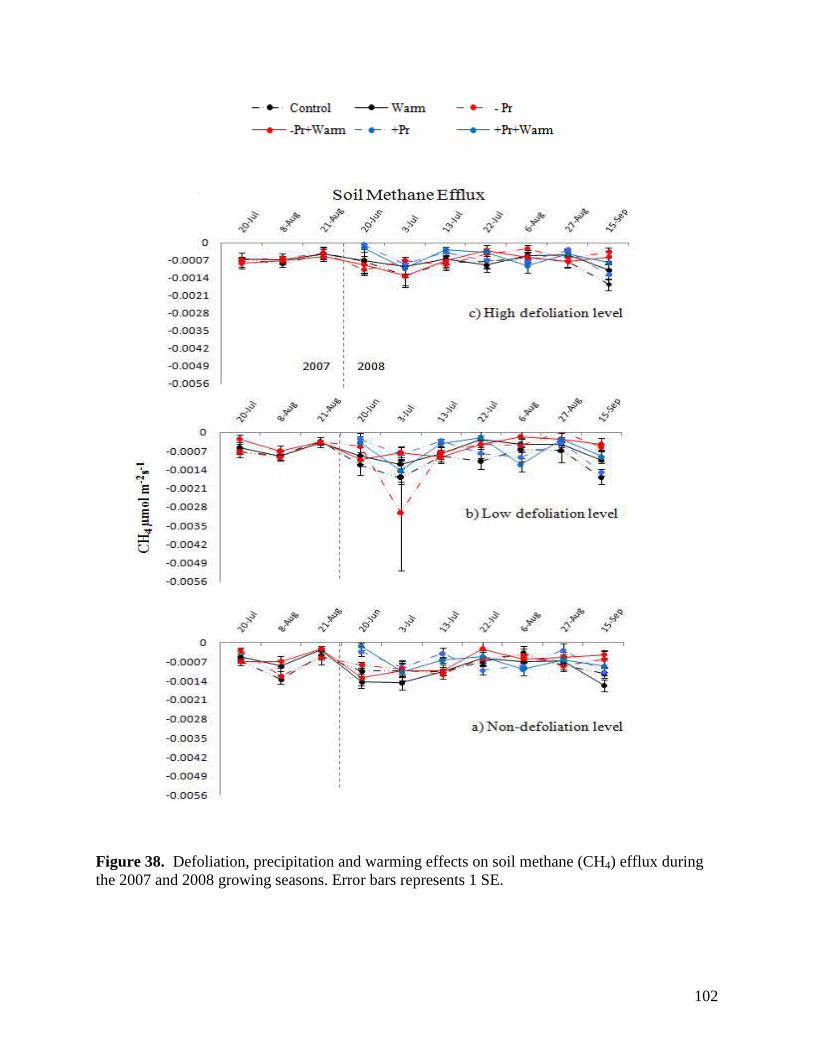
102
Figure 38. Defoliation, precipitation and warming effects on soil methane (CH4) efflux during the 2007 and 2008 growing seasons. Error bars represents 1 SE.
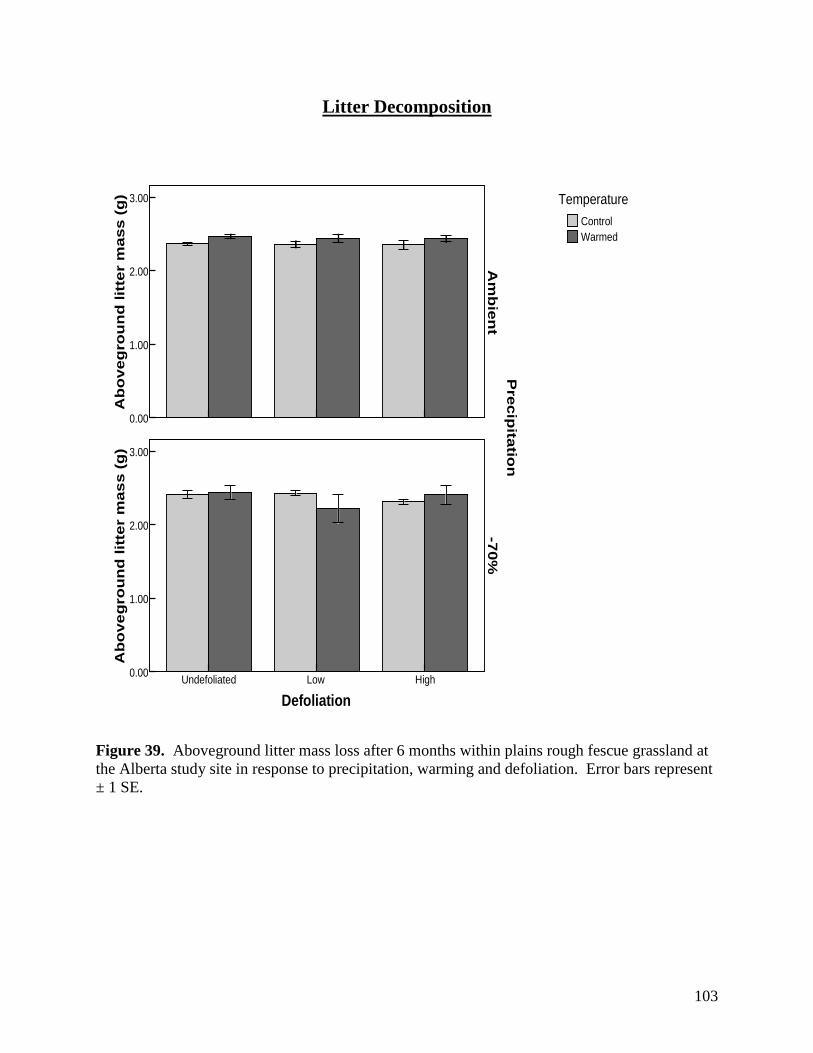
103
Litter Decomposition
Ab
oveg
rou
nd
lit
ter
mass (
g) 3.00
2.00
1.00
0.00
DefoliationHighLowUndefoliated
Ab
ove
gro
un
d lit
ter
mas
s (
g) 3.00
2.00
1.00
0.00
Pre
cip
itatio
nA
mb
ien
t-7
0%
WarmedControl
Temperature
Figure 39. Aboveground litter mass loss after 6 months within plains rough fescue grassland at the Alberta study site in response to precipitation, warming and defoliation. Error bars represent ± 1 SE.
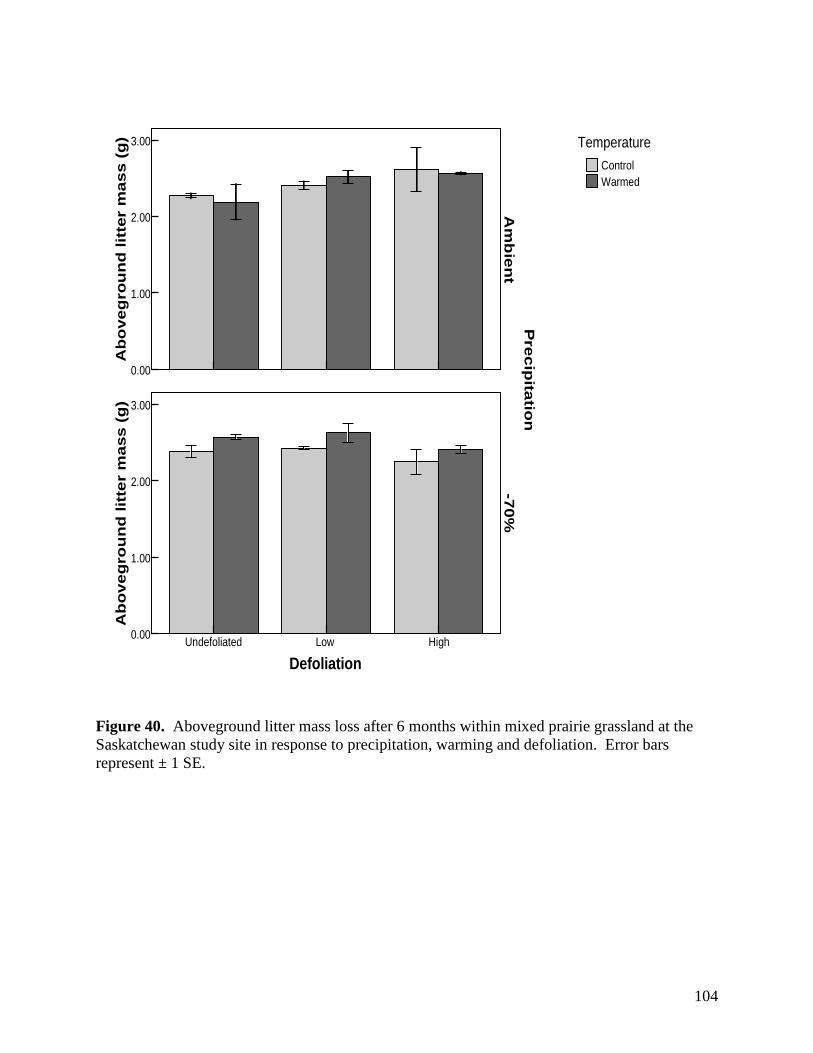
104
A
bo
ve
gro
un
d lit
ter
ma
ss
(g
) 3.00
2.00
1.00
0.00
DefoliationHighLowUndefoliated
Ab
ov
eg
rou
nd
lit
ter
ma
ss
(g
) 3.00
2.00
1.00
0.00
Pre
cip
itatio
nA
mb
ien
t-7
0%
WarmedControl
Temperature
Figure 40. Aboveground litter mass loss after 6 months within mixed prairie grassland at the Saskatchewan study site in response to precipitation, warming and defoliation. Error bars represent ± 1 SE.
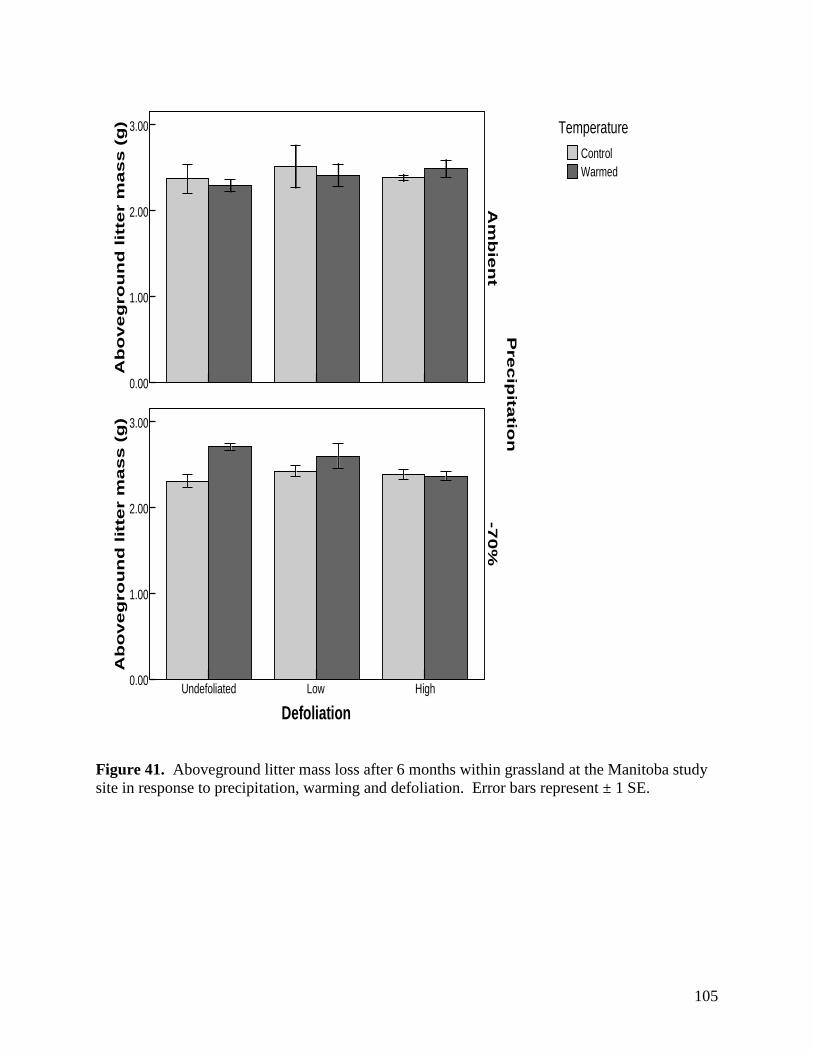
105
Ab
ov
eg
rou
nd
lit
ter
ma
ss
(g
) 3.00
2.00
1.00
0.00
DefoliationHighLowUndefoliated
Ab
ov
eg
rou
nd
lit
ter
ma
ss
(g
) 3.00
2.00
1.00
0.00
Pre
cip
itatio
nA
mb
ien
t-7
0%
WarmedControl
Temperature
Figure 41. Aboveground litter mass loss after 6 months within grassland at the Manitoba study site in response to precipitation, warming and defoliation. Error bars represent ± 1 SE.
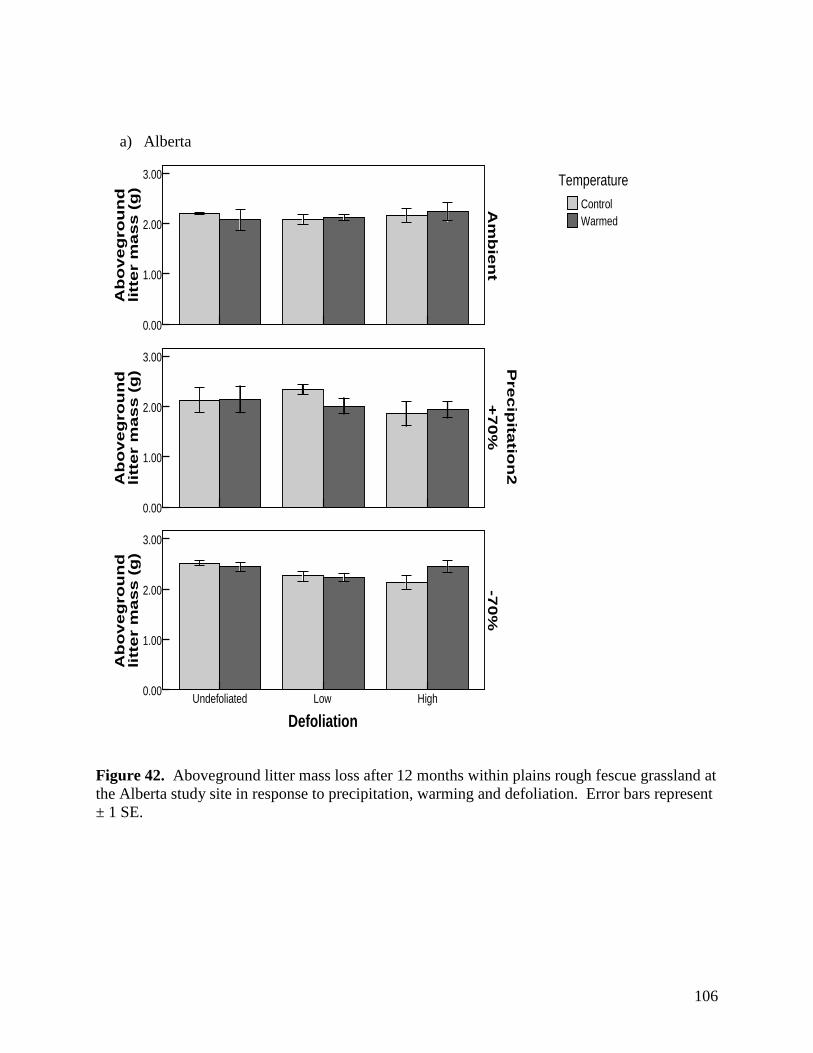
106
a) Alberta
Ab
ov
eg
rou
nd
litt
er
ma
ss
(g
)
3.00
2.00
1.00
0.00
Ab
ov
eg
rou
nd
li
tte
r m
as
s (
g)
3.00
2.00
1.00
0.00
DefoliationHighLowUndefoliated
Ab
ov
eg
rou
nd
li
tte
r m
as
s (
g)
3.00
2.00
1.00
0.00
Pre
cip
itatio
n2
Am
bie
nt
+7
0%
-70
%
WarmedControl
Temperature
Figure 42. Aboveground litter mass loss after 12 months within plains rough fescue grassland at the Alberta study site in response to precipitation, warming and defoliation. Error bars represent ± 1 SE.
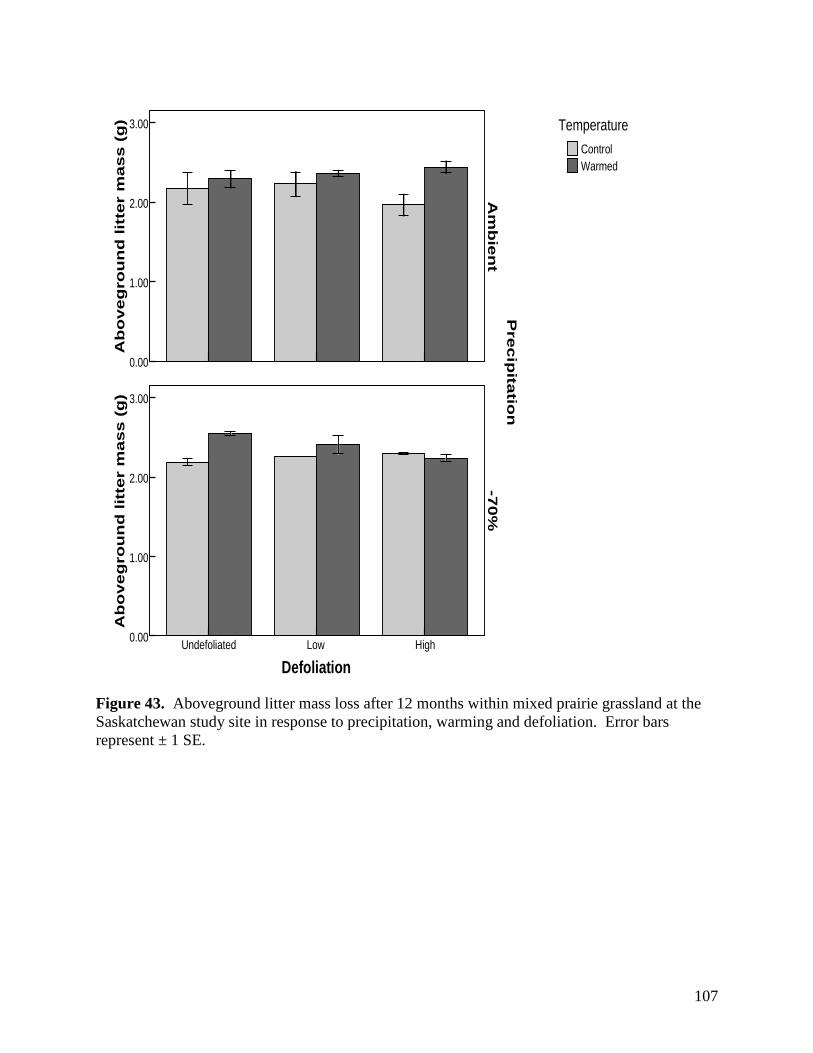
107
Ab
oveg
rou
nd
lit
ter
mass (
g) 3.00
2.00
1.00
0.00
DefoliationHighLowUndefoliated
Ab
oveg
rou
nd
lit
ter
mass (
g) 3.00
2.00
1.00
0.00
Pre
cip
itatio
nA
mb
ien
t-7
0%
WarmedControl
Temperature
Figure 43. Aboveground litter mass loss after 12 months within mixed prairie grassland at the Saskatchewan study site in response to precipitation, warming and defoliation. Error bars represent ± 1 SE.
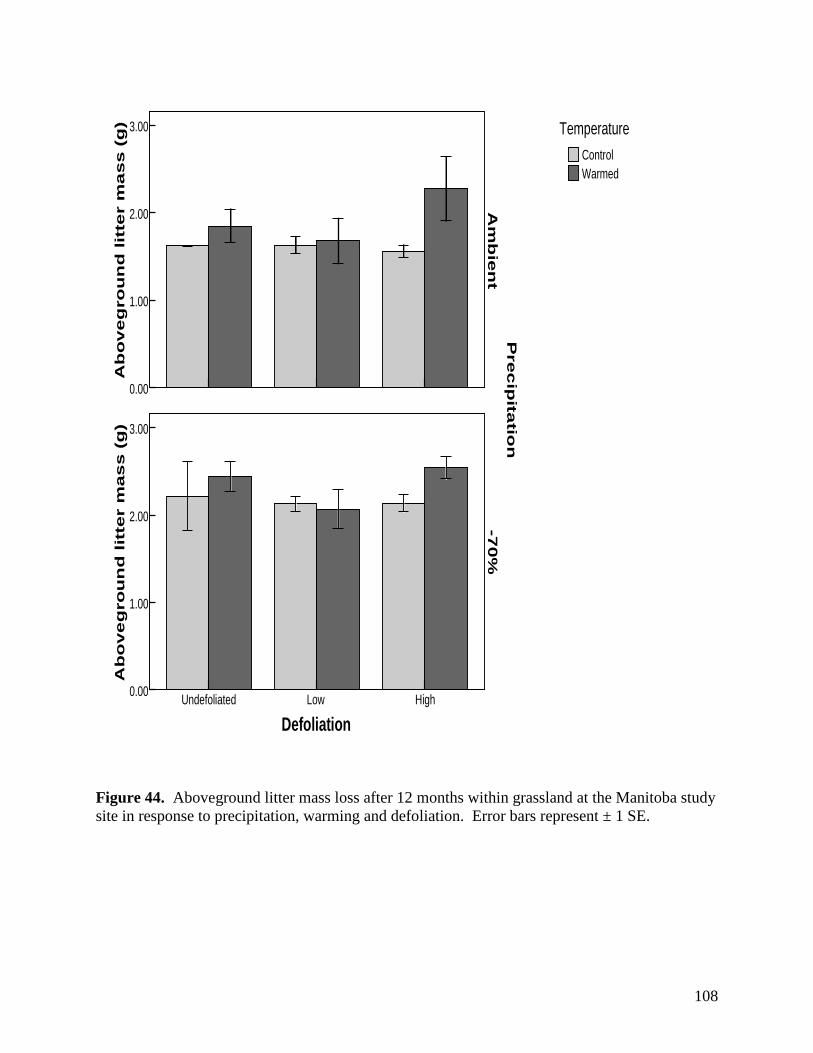
108
Ab
ov
eg
rou
nd
lit
ter
ma
ss (
g) 3.00
2.00
1.00
0.00
DefoliationHighLowUndefoliated
Ab
ove
gro
un
d lit
ter
mas
s (
g) 3.00
2.00
1.00
0.00
Pre
cip
itatio
nA
mb
ien
t-7
0%
WarmedControl
Temperature
Figure 44. Aboveground litter mass loss after 12 months within grassland at the Manitoba study site in response to precipitation, warming and defoliation. Error bars represent ± 1 SE.
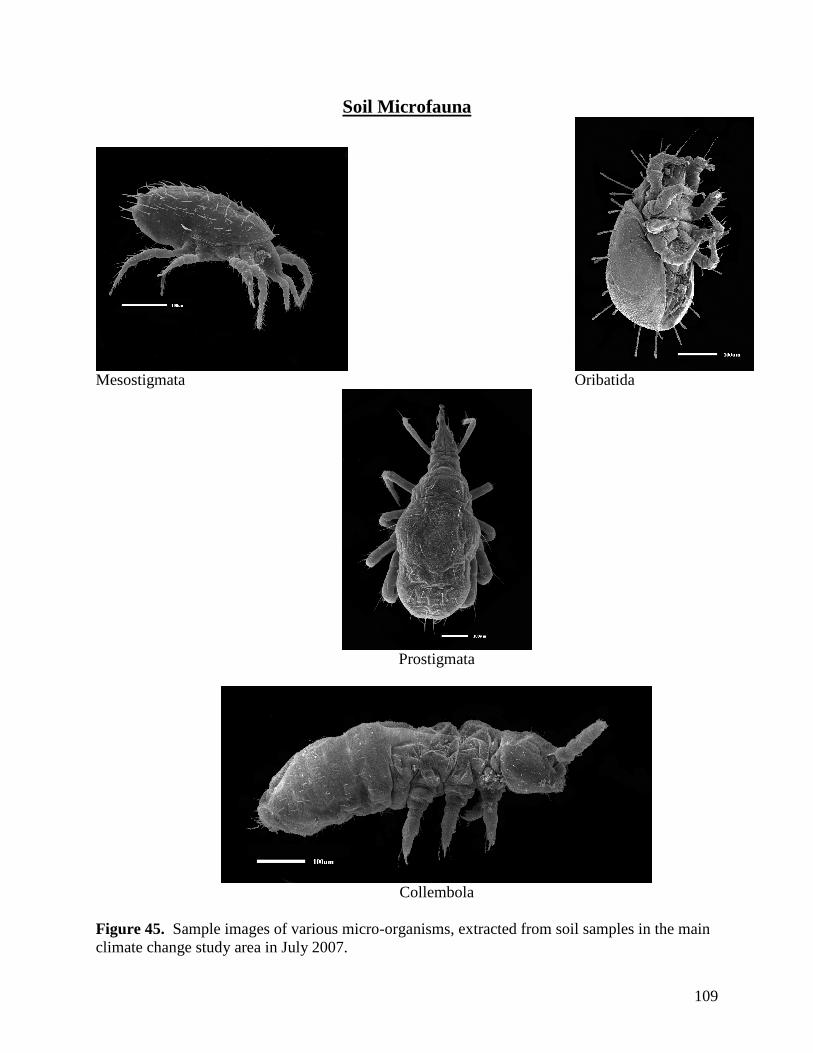
109
Soil Microfauna
Mesostigmata Oribatida
Prostigmata
Collembola Figure 45. Sample images of various micro-organisms, extracted from soil samples in the main climate change study area in July 2007.
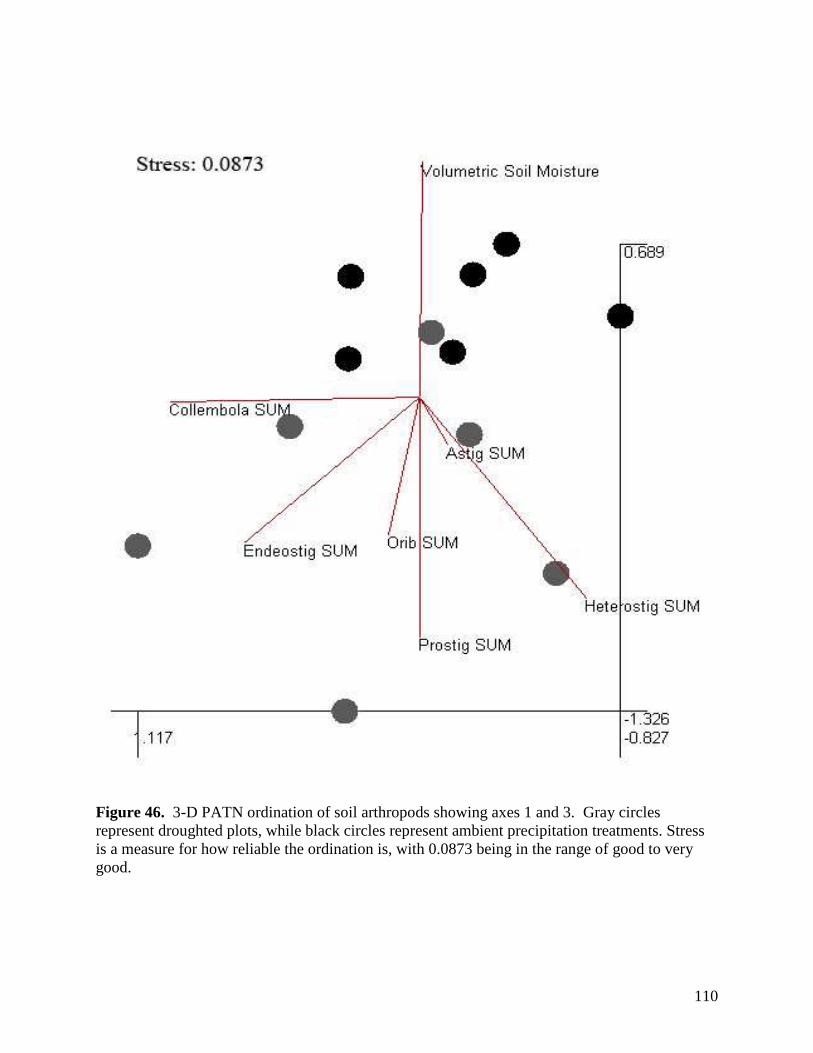
110
Figure 46. 3-D PATN ordination of soil arthropods showing axes 1 and 3. Gray circles represent droughted plots, while black circles represent ambient precipitation treatments. Stress is a measure for how reliable the ordination is, with 0.0873 being in the range of good to very good.
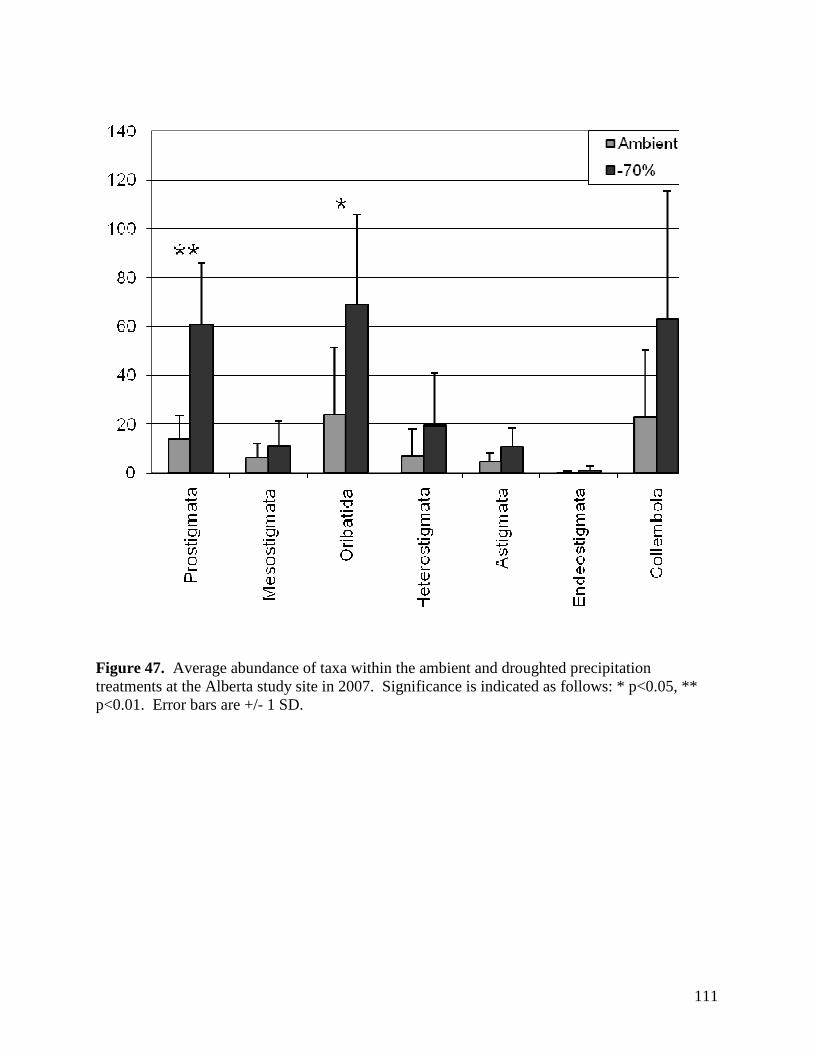
111
Figure 47. Average abundance of taxa within the ambient and droughted precipitation treatments at the Alberta study site in 2007. Significance is indicated as follows: * p<0.05, ** p<0.01. Error bars are +/- 1 SD.
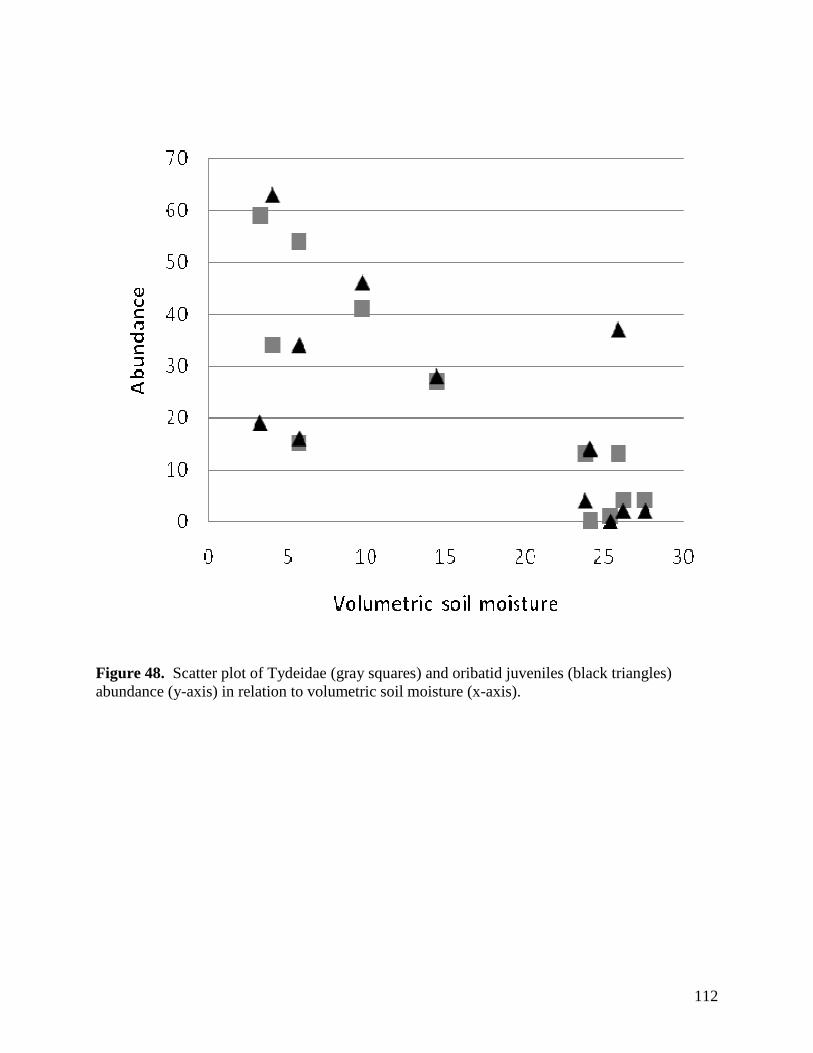
112
Figure 48. Scatter plot of Tydeidae (gray squares) and oribatid juveniles (black triangles) abundance (y-axis) in relation to volumetric soil moisture (x-axis).
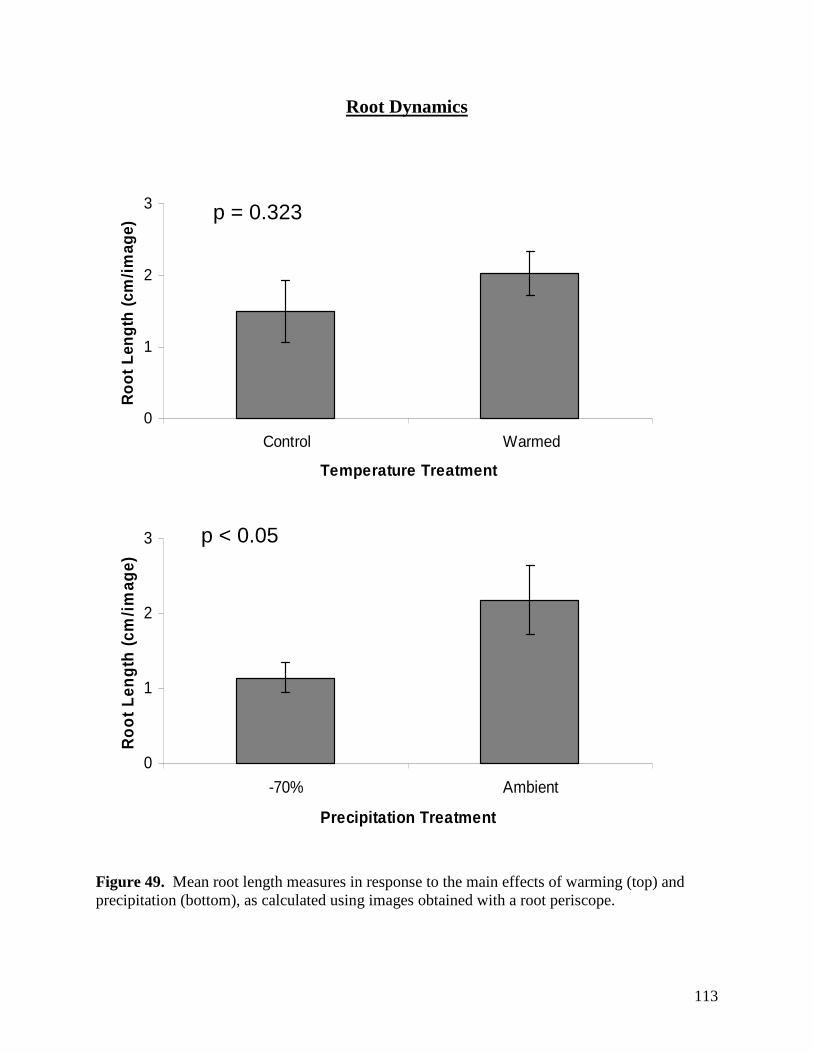
113
Root Dynamics
Figure 49. Mean root length measures in response to the main effects of warming (top) and precipitation (bottom), as calculated using images obtained with a root periscope.
0
1
2
3
-70% Ambient
Precipitation Treatment
Ro
ot
Len
gth
(cm
/im
age)
0
1
2
3
Control Warmed
Temperature Treatment
Ro
ot
Len
gth
(cm
/im
age)
p = 0.323
p < 0.05
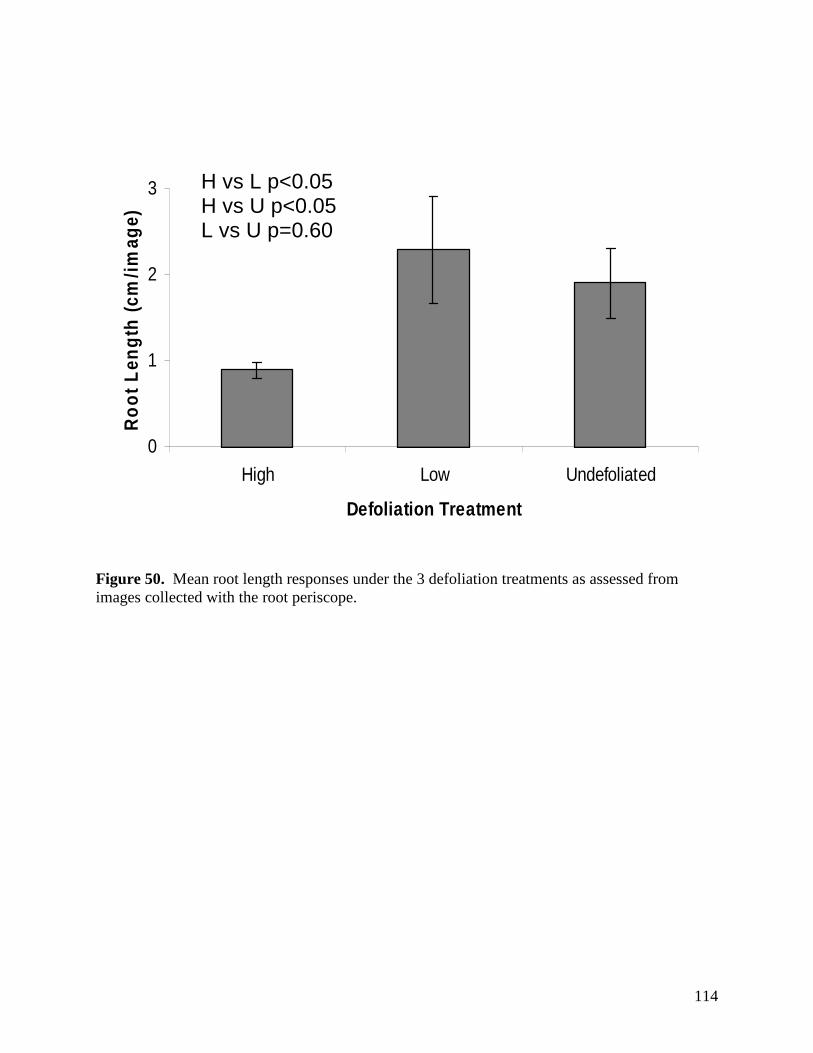
114
Figure 50. Mean root length responses under the 3 defoliation treatments as assessed from images collected with the root periscope.
0
1
2
3
High Low Undefoliated
Defoliation Treatment
Ro
ot
Len
gth
(cm
/im
age)
H vs L p<0.05 H vs U p<0.05 L vs U p=0.60


![Forest and rangeland soil biodiversity [Chapter 5] · 2020. 9. 30. · soil viruses as bacteriophages, in part because bacteria are numerous in soils and because bacteriophages have](https://img.pdfslide.net/doc/110x75/60ea3e6fcbdf0d1cd33ab4a9/forest-and-rangeland-soil-biodiversity-chapter-5-2020-9-30-soil-viruses-as.jpg)