Embed Size (px)
Citation preview
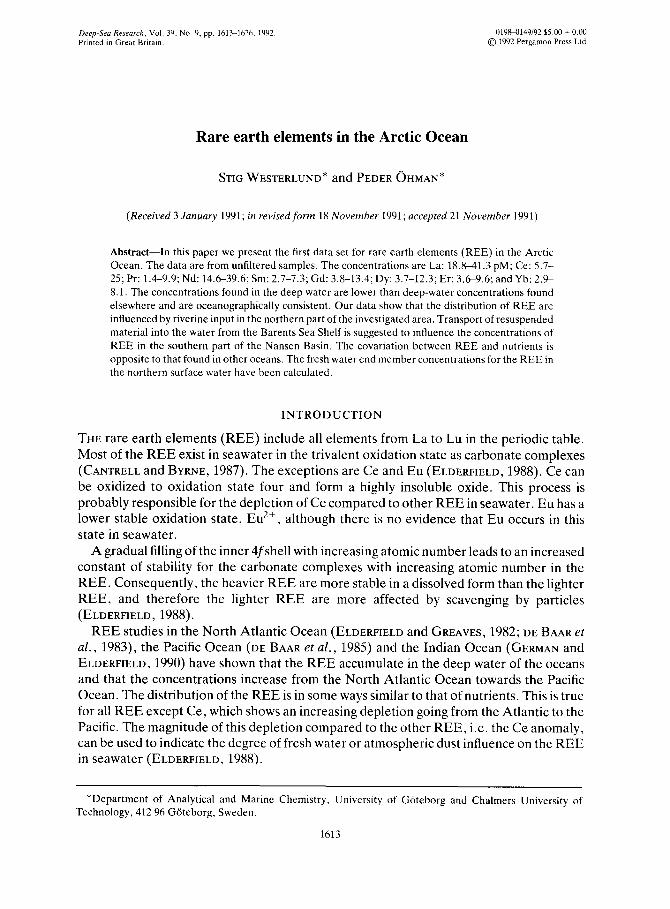
Deep-Sea Research, Vol. 39, No. 9, pp. 1613-1626. 1992. 0198~)149/92 $5.00 + 0.00 Printed in Great Britain. © 1992 Pergamon Press Ltd
Rare earth elements in the Arctic Ocean
STIG WESTERLUND* a n d PEDER OHMAN*
(Received 3 January 1991; in revised form 18 November 1991 ; accepted 21 November 1991)
Abs t rac t - - In this paper we present the first data set for rare earth elements (REE) in the Arctic Ocean. The data are from unfiltered samples. The concentrations are La: 18.8-41.3 pM; Ce: 5.7- 25; Pr: 1.4-9.9; Nd: 14.6-39.6; Sin: 2.7-7.3; Gd: 3.8-13.4; Dy: 3.7-12.3; Er: 3.6-9.6; and Yb: 2.9- 8.1. The concentrations found in the deep water are lower than deep-water concentrations found elsewhere and are oceanographically consistent. Our data show that the distribution of REE are influenced by riverine input in the northern part of the investigated area. Transport of resuspended material into the water from the Barents Sea Shelf is suggested to influence the concentrations of REE in the southern part of the Nansen Basin. The covariation between REE and nutrients is opposite to that found in other oceans. The fresh water cnd member concentrations for the REE in the northern surface water have bccn calculated.
I N T R O D U C T I O N
THE rare earth elements (REE) include all elements from La to Lu in the periodic table. Most of the R E E exist in seawater in the trivalent oxidation state as carbonate complexes (CANTRELL and BYRNE, 1987). The exceptions are Ce and Eu (ELDERFIELD, 1988). Ce can be oxidized to oxidation state four and form a highly insoluble oxide. This process is probably responsible for the depletion of Ce compared to other REE in seawater. Eu has a lower stable oxidation state, Eu 2+, although there is no evidence that Eu occurs in this state in seawater.
A gradual filling of the inner 4fshell with increasing atomic number leads to an increased constant of stability for the carbonate complexes with increasing atomic number in the REE. Consequently, the heavier REE are more stable in a dissolved form than the lighter REE, and therefore the lighter REE are more affected by scavenging by particles (ELDERFIELD, 1988).
R E E studies in the North Atlantic Ocean (ELDERFIELD and GREAVES, 1982; DE BAAR et al. , 1983), the Pacific Ocean (DE BAAR et al. , 1985) and the Indian Ocean (GERMAN and ELDERFIELD, 1990) have shown that the REE accumulate in the deep water of the oceans and that the concentrations increase from the North Atlantic Ocean towards the Pacific Ocean. The distribution of the REE is in some ways similar to that of nutrients. This is true for all R EE except Ce, which shows an increasing depletion going from the Atlantic to the Pacific. The magnitude of this depletion compared to the other REE, i.e. the Ce anomaly, can be used to indicate the degree of fresh water or atmospheric dust influence on the REE in seawater (ELDERFIELD, 1988).
*Depar tment of Analytical and Marine Chemistry, University of G6teborg and Chalmers University of Technology, 412 96 G6teborg, Sweden.
1613

1614 S. WESTERLUND and P. OHMAN
The transport of REE to the oceans has demonstrated the importance of riverine input and also the significance of eolian transport to the Atlantic Ocean (ELDERFIELD et al., 1990). Hydrothermal vents have been shown to contribute Eu enriched water to the oceans (ELDERFIELD et al., 1987; ELDERFIELD, 1988).
Determination o f R E E in seawater
Coprecipitation with iron is a widely used method for preconcentration of REE from seawater samples (ELDERFIELD and GREAVES, 1983; GREAVES et al., 1989). These authors have used an extensive preparation procedure for the coprecipitate and made their determinations on a mass spectrometer with a filament ion source (filament-MS). A major problem in using the filament-MS is isobaric interference, which consequently made it necessary to use a complicated ion exchange procedure to clean the sample after coprecipitation. Using inductively coupled plasma mass spectrometry (ICP-MS), which has a high temperature ion source much less sensitive to this type of interference, it should be possible to simplify the method and to use smaller sample volumes.
In this paper a method for the determination of REE using ICP-MS is presented together with a REE data set form the Barents Sea shelf, across the Nansen Basin to the Nansen-Gakkel Ridge.
INVESTIGATED AREA
The Arctic ocean is characterized by an area with large shelves and deep basins with rather newly formed bottom water (GORDIENKO and LAKa'IONOV, 1965). The area studied in this work is situated north of Spitsbergen (Fig. 1) and consists of a transect from the Barents Sea shelf to the Nansen Basin. The hydrography of this section is described by ANDERSON et al. (1989) and ANDERSON and JONES (in press).
This area is characterized by a wide interior basin and two boundary current systems (ANDERSON et al., 1989). The first one is found along the Barents Sea shelf-slope and is marked by high oxygen concentrations, low temperatures and high salinities that indicate that these waters originate from the shelf areas and Fram Strait. The second one is found along the Nansen-Gakkel Ridge to the north. The Nansen Basin interior, with the deep water being several decades old, is slowly ventilated by these boundary current systems and shelf waters. Another major feature of this part of the Arctic Ocean is the saline warm water, Atlantic derived Arctic Intermediate Water (AIW). The surface waters of the northern part are strongly influenced by river run-off from the Siberian rivers, while the surface waters in the southern part have a strong melt-water component. The near- freezing, relatively fresh Polar Surface Water layer thickens from about 60 m in the south to about 200 m in the north. The samples in this study were taken across the Nansen Basin from the Barents shelf in the south to the Nansen-Gakkel Ridge in the north.
SAMPLING
Our samples were collected during the cruise ARK IV/3, July-September 1987, with the German research vessel F.R. Polarstern. Both 2.5 and 11 I Teflon-coated Go-Flo bottles were used, hung on a 6 mm plastic-coated hydrowire. The samplers were carefully cleaned with diluted hydrochloric acid and rinsed with Milli-Q water before the expedition. The

Rare earth elements in the Arctic Ocean 1615
180"
90°~ 90*E
60*E
30*W O* 30*E
Fig. 1. Chart of the investigated area with the stations marked.
samples were not filtered, but the suspended load in this area is low and the particles presumably do not affect the dissolved concentration to any large extent. After sampling, the water was drained into acid-cleaned LD-polyethylene bottles. The samples were acidified with 1 ml, 15 M sub-boiled distilled nitric acid per 1 1 of seawater. All work was performed in a portable clean room container (DANIELSSON and WESTERLUND, 1983).
DETERMINATION Investigation of the analytical procedure
Coprecipitation with iron hydroxide is an efficient method for preconcentration of the R E E in seawater and quantitative recovery (90-100%) for all REE has been demonstrated (ELDERFIELD and GREAVES, 1983; GREAVES et al., 1989).
The major part of our method development work focused on achieving proper conditions for the coprecipitation by varying the iron concentration at the optimum pH (9.1) (ELDERFIELD and GREAVES, 1983; GREAVES et al., 1989). The seawater selected for this experiment was Atlantic water spiked with excess Lu as an internal standard. Lu, the R E E with the largest mass, was chosen for its low affinity to particles, making the coprecipitation more critical for Lu than for the other REE. The iron concentration was varied between 1.8 and 180 mM. The recovery found for Lu was 98% _+ 3 at all iron concentrations above 9 mM. For La, Ce, Pr, Nd, Sm, Dy, Er and Yb the recoveries dropped slightly below 9 mM Fe. The results of this coprecipitation test gave 5-15 % RSD, which is also an estimate of the precision for this method. There is no reason to believe that
1616 S. WESTERLUYD and P. OHMAN
the recovery of the lighter REE should be less than the recovery of Lu, based on the results obtained by previous investigators of the iron coprecipitation of the REE (ELDERVIELD and GREAVES, 1983; GREAVES et al., 1989).
The next major concern in the ICP-MS method was isobaric interferences. The major candidate for this was barium, as the coprecipitation procedure also precipitates barium and consequently generates rather high concentrations of barium in the final sample. However, no interference from barium was detected.
Procedure
After storage of the acidified samples the RE E were preconcentrated by coprecipitation with iron. To a 500 ml sample, i ml of a solution of 36 mM Fe and 0.15 ¢tM Lu were added. After mixing, 1 ml 7 M of a sub-boiled distilled ammonia solution was added to give a pH of 9.1 + 0.2. The solution was then left to stand for at least 1 h to allow the coprecipitation process to adsorb all REE on the iron hydroxide colloids. At the same time the colloidal particles agglomerated. The solution was then filtered through a 0.45/~m Millipore H A filter. Each filter was individually packed and used without any cleaning. The filter was then placed in a 10 ml polypropylene tube with screw-cap, where the precipitate was dissolved in 200/~1 15 M HNO3 and 5.8 ml Milli-Q water. The tube could then be placed directly into the autosampler of the ICP-MS. We found the recovery of the REE for this procedure to be 90-100%.
Dewrminauon
The determinations were performed on a VG Plasma Quad ICP-MS with a Gilson autosampler. The autosampler was loaded with 20 samples and standards were included between every fourth sample. Before the next set was run the sampling cone and skimmer cone were cleaned to prevent a large drop in sensitivity. Lu, included in the samples during the sample workup, was used as an internal standard to check the recovery of the coprecipitation. The amount added gave a concentration several magnitudes higher than the concentration obtained from the seawater in the final samples. For the standardization of the individual REE, a mixed standard prepared from pure metals, diluted to proper concentrations, was used. Corrections for the recovery were made on the final data.
Blanks and detection limits and accuracy
The blanks and the detection limits can be found in Table 1. The precision for the REE determinations is 5-15%, depending on the concentrations. As the detection limits are limited by the counting statistics for most of the REE, the detection limits can be improved by running fewer elements per sample. The REE results from a North Atlantic water, generated with this method, agree well with results obtained by other methods (Table 2).
Temperature, salinity and nutrients
The temperature data were taken from a parallel cast with a CTD-rosette system. Salinities were determined with a Guildline Autosal and the nutrients with standard spectrophotometric methods using an autoanalyser.
R a r e ea r th e l emen t s in the Arct ic O c e a n 1617
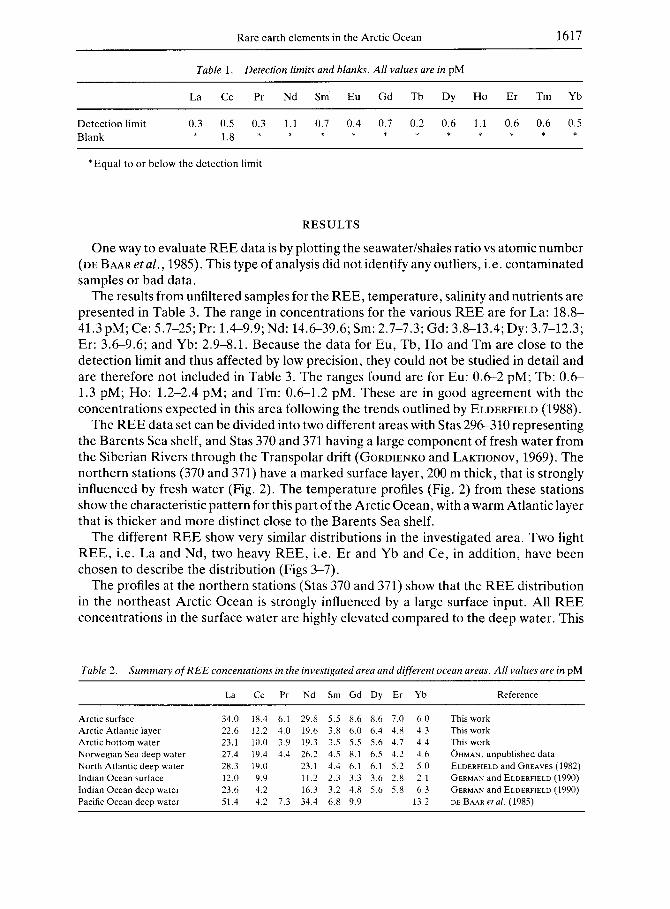
Table 1. Detection limits and blanks. All values are in p M
La Ce Pr Nd Sin Eu G d Tb D y H o E r T m Yb
De tec t ion limit 0.3 0.5 0.3 1.1 0.7 0.4 (I.7 0.2 0.6 1.1 0.6 0.6 0.5
Blank * 1.8 * * * * * * * * * * *
• Equa l to or be low the de tec t ion limit
R E S U L T S
One way to evaluate REE data is by plotting the seawater/shales ratio vs atomic number (DE BAAR et al., 1985). This type of analysis did not identify any outliers, i.e. contaminated samples or bad data.
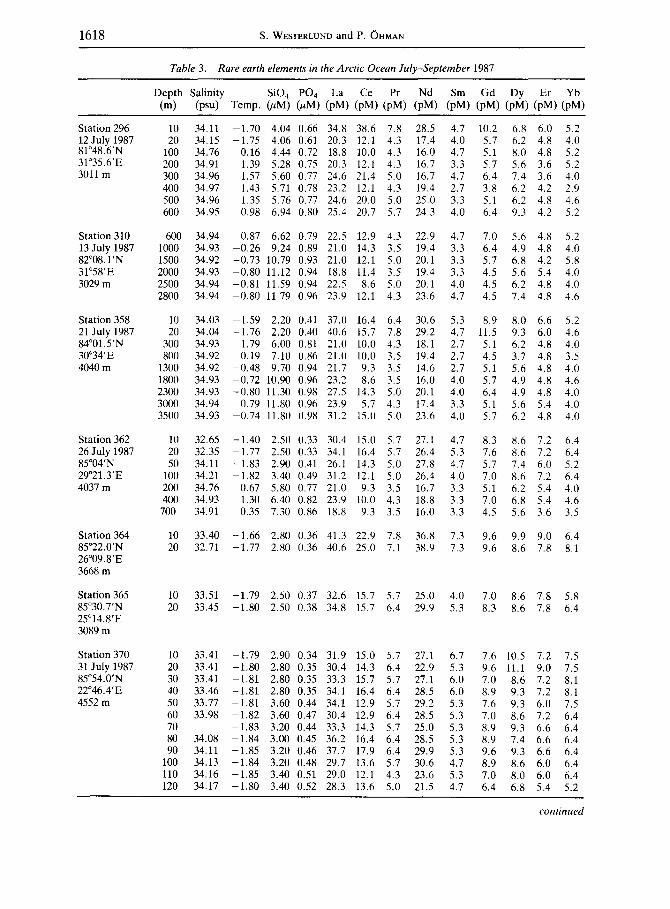
The results from unfiltered samples for the REE, temperature, salinity and nutrients are presented in Table 3. The range in concentrations for the various REE are for La: 18.8- 41.3 pM; Ce: 5.7-25; Pr: 1.4-9.9; Nd: 14.6-39.6; Sm: 2.7-7.3; Gd: 3.8-13.4; Dy: 3.7-12.3; Er: 3.6-9.6; and Yb: 2.9-8.1. Because the data for Eu, Tb, Ho and Tm are close to the detection limit and thus affected by low precision, they could not be studied in detail and are therefore not included in Table 3. The ranges found are for Eu: 0.6-2 pM; Tb: 0.6- 1.3 pM; Ho: 1.2-2.4 pM; and Tm: 0.6-1.2 pM. These are in good agreement with the concentrations expected in this area following the trends outlined by ELDERFIELD (1988).
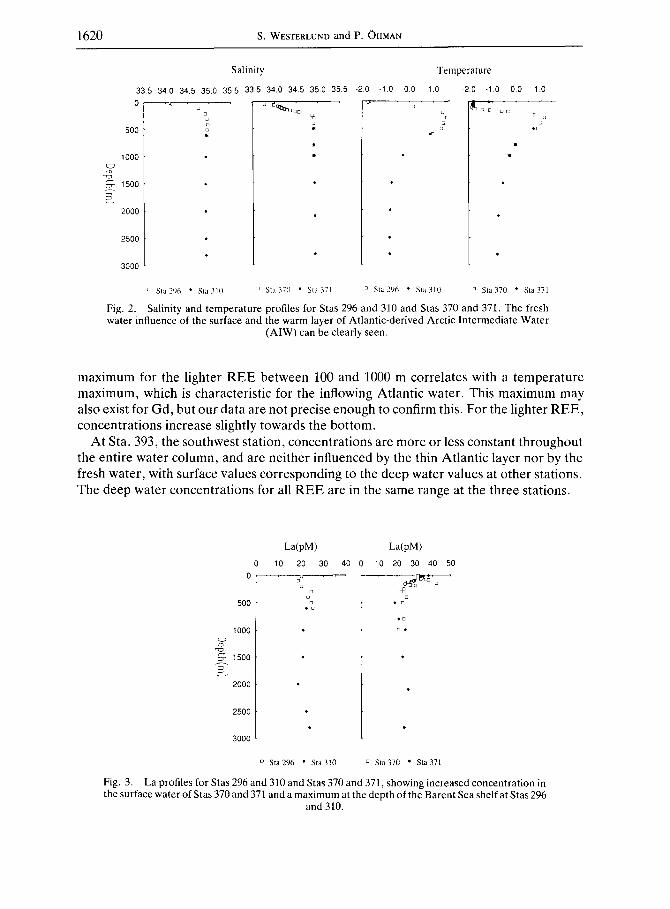
The REE data set can be divided into two different areas with Stas 296-310 representing the Barents Sea shelf, and Stas 370 and 371 having a large component of fresh water from the Siberian Rivers through the Transpolar drift (GORDIENKO and LAKTIONOV, 1969). The northern stations (370 and 371) have a marked surface layer, 200 m thick, that is strongly influenced by fresh water (Fig. 2). The temperature profiles (Fig. 2) from these stations show the characteristic pattern for this part of the Arctic Ocean, with a warm Atlantic layer that is thicker and more distinct close to the Barents Sea shelf.
The different REE show very similar distributions in the investigated area. Two light REE, i.e. La and Nd, two heavy REE, i.e. Er and Yb and Ce, in addition, have been chosen to describe the distribution (Figs 3-7).
The profiles at the northern stations (Stas 370 and 371) show that the REE distribution in the northeast Arctic Ocean is strongly influenced by a large surface input. All REE concentrations in the surface water are highly elevated compared to the deep water. This
Table 2. Summary of REE concentations in the investigated area and different ocean areas. All values are in pM
La Ce Pr Nd Sm Gd Dy Er Yb Reference
Arctic surface 34.0 18.4 6.1 29.8 5.5 8.6 8.6 7.0 6.0 Thiswork Arctic Atlantic layer 22.6 12.2 4.0 19.6 3.8 6.0 6.4 4.8 4.3 This work Arctic bottom water 23,1 10.0 3.9 19.3 3.5 5.5 5.6 4.7 4.4 This work Norwegian Sea deep water 27.4 19.4 4.4 26,2 4.5 8.1 6.5 4.2 4.6 OHMAN, unpublished data North Atlantic deep water 28.3 19.(I 23.1 4.4 6.1 6.1 5.2 5.0 ELDERFIELD and GREAVES (1982) Indian Ocean surface 12.0 9.9 11.2 2.3 3.3 3.6 2.8 2.1 GERMAN and ELDERF1ELD (1990) Indian Ocean deep water 23.6 4.2 16.3 3.2 4.8 5.6 5.8 6.3 GERMAN and ELDERFIELD (1990) Pacific Ocean deep water 51.4 4.2 7.3 34,4 6.8 9.9 13.2 DE BAAR et al. (1985)
1618 S. WESTERLUND and P. OHMAN
Table 3. Rare earth elements in the Arctic Ocean July-September 1987
Depth Salinity SiO 4 PO 4 La Ce Pr Nd Sm Gd Dy Er Yb (m) (psu) Temp. (~M) (~M) (pM) (pM) (pM) (pM) (pM) (pM) (pM) (pM) (pM)
Station 296 12 July 1987 81°48.6'N 31°35.6'E 3011 m
Station 310 13 July 1987 82°08.1 'N 31°58'E 3029 m
Station 358 21 July 1987 84°01.5'N 30°34'E 4040 m
Station 362 26 July 1987 85°04'N 29°21.3'E 4037 m
Station 364 85°22.0'N 26°09.8'E 3668 m
Station 365 85°30.7'N 25°14.8'E 3089 m
Station 370 31 July 1987 85°54.0'N 22°46.4'E 4552 m
10 34.11 - 1 . 7 0 4.04 0.66 34.8 38.6 7.8 28.5 4.7 10.2 6.8 6.0 5.2 20 34.15 -1 .75 4.06 0.61 20.3 12.1 4.3 17.4 4.0 5.7 6.2 4.8 4.0
100 34.76 0.16 4.44 0.72 18.8 10.0 4.3 16.0 4.7 5.1 8.0 4.8 5.2 200 34.91 1.39 5.28 0.75 20.3 12.1 4.3 16.7 3.3 5.7 5.6 3.6 5.2 300 34.96 1.57 5.60 0.77 24.6 21.4 5.0 16.7 4.7 6.4 7.4 3.6 4.0 400 34.97 1.43 5.71 0.78 23.2 12.1 4.3 19.4 2.7 3.8 6.2 4.2 2.9 500 34.96 1.35 5.76 0.77 24.6 20.0 5.0 25.0 3.3 5.1 6.2 4.8 4.6 600 34.95 0.98 6.94 0.80 25.4 20.7 5.7 24.3 4.0 6.4 9.3 4.2 5.2
600 34.94 0.87 6.62 0.79 22.5 12.9 4.3 22.9 4.7 7.0 5.6 4.8 5.2 1000 34.93 - 0 . 2 6 9.24 0.89 21.0 14.3 3.5 19.4 3.3 6.4 4.9 4.8 4.0 1500 34.92 -0 .73 10.79 0.93 21.0 12.1 5.0 20.1 3.3 5.7 6.8 4.2 5.8 2000 34.93 - 0 . 8 0 11.12 0.94 18.8 11.4 3.5 19.4 3.3 4.5 5.6 5.4 4.0 2500 34.94 -0 .81 11.59 0.94 22.5 8.6 5.0 20.1 4.0 4.5 6.2 4.8 4.0 2800 34.94 - 0 . 8 0 11.79 0.96 23.9 12.1 4.3 23.6 4.7 4.5 7.4 4.8 4.6
10 34.03 - 1 . 5 9 2.20 0.41 37.0 16.4 6.4 30.6 5.3 8.9 8.0 6.6 5.2 20 34.04 - 1 . 7 6 2.20 0.40 40.6 15.7 7.8 29.2 4.7 11.5 9.3 6.0 4.6
300 34.93 1.79 6.00 0.81 21.0 10.0 4.3 18.1 2.7 5.1 6.2 4.8 4.0 800 34.92 0.19 7.10 0.86 21.0 10.0 3.5 19.4 2.7 4.5 3.7 4.8 3.5
1300 34.92 - 0 . 4 8 9.70 0.94 21.7 9.3 3.5 14.6 2.7 5.1 5.6 4.8 4.0 1800 34.93 - 0 . 7 2 10.90 0.96 23.2 8.6 3.5 16.0 4.0 5.7 4.9 4.8 4.6 2300 34.93 - 0 . 8 0 11.30 0.98 27.5 14.3 5.0 20.1 4.0 6.4 4.9 4.8 4.0 3000 34.94 - 0 . 7 9 11.80 0.96 23.9 5.7 4.3 17.4 3.3 5.1 5.6 5.4 4.0 3500 34.93 - 0 . 7 4 11.80 0.98 31.2 15.0 5.0 23.6 4.0 5.7 6.2 4.8 4.0
10 32.65 - 1 . 4 0 2.50 0.33 30.4 15.0 5.7 27.1 4.7 8.3 8.6 7.2 6.4 20 32.35 -1 .77 2.50 0.33 34.1 16.4 5.7 26.4 5.3 7.6 8.6 7.2 6.4 50 34.11 -1 .83 2.90 0.41 26.1 14.3 5.0 27.8 4.7 5.7 7.4 6.0 5.2
100 34.21 - 1 . 8 2 3.40 0.49 31.2 12.1 5.0 26.4 4.0 7.0 8.6 7.2 6.4 200 34.76 0.67 5.80 0.77 21.0 9.3 3.5 16.7 3.3 5.1 6.2 5.4 4.0 400 34.93 1.30 6.40 0.82 23.9 10.0 4.3 18.8 3.3 7.0 6.8 5.4 4.6
700 34.91 0.35 7.30 0.86 18.8 9.3 3.5 16.0 3.3 4.5 5.6 3.6 3.5
10 33.40 - 1 . 6 6 2.80 0.36 41.3 22.9 7.8 36.8 7.3 9.6 9.9 9.0 6.4 20 32.71 - 1 . 7 7 2.80 0.36 40.6 25.0 7.1 38.9 7.3 9.6 8.6 7.8 8.1
10 33.51 - 1 . 7 9 2.50 0.37 32.6 15.7 5.7 25.0 4.0 7.0 8.6 7.8 5.8 20 33.45 - 1 . 8 0 2.50 0.38 34.8 15.7 6.4 29.9 5.3 8.3 8.6 7.8 6.4
10 33.41 - 1 . 7 9 2.90 0.34 31.9 15.0 5.7 27.1 6.7 7.6 10.5 7.2 7.5 20 33.41 - 1 . 8 0 2.80 0.35 30.4 14.3 6.4 22.9 5.3 9.6 11.1 9.0 7.5 30 33.41 -1 .81 2.80 0.35 33.3 15.7 5.7 27.1 6.0 7.0 8.6 7.2 8.1 40 33.46 -1 .81 2.80 0.35 34.1 16.4 6.4 28.5 6.0 8.9 9.3 7.2 8.1 50 33.77 -1 .81 3.60 0.44 34.1 12.9 5.7 29.2 5.3 7.6 9.3 6.0 7.5 60 33.98 - 1 . 8 2 3.60 0.47 30.4 12.9 6.4 28.5 5.3 7.0 8.6 7.2 6.4 70 - 1 . 8 3 3.20 0.44 33.3 14.3 5.7 25.0 5.3 8.9 9.3 6.6 6.4 80 34.08 - 1 . 8 4 3.00 0.45 36.2 16.4 6.4 28.5 5.3 8.9 7.4 6.6 6.4 90 34.11 -1 .85 3.20 0.46 37.7 17.9 6.4 29.9 5.3 9.6 9.3 6.6 6.4
100 34.13 - 1 . 8 4 3.20 0.48 29.7 13.6 5.7 30.6 4.7 8.9 8.6 6.0 6.4 110 34.16 -1 .85 3.40 0.51 29.0 12.1 4.3 23.6 5.3 7.0 8.0 6.0 6.4 120 34.17 - 1 . 8 0 3.40 0.52 28.3 13.6 5.0 21.5 4.7 6.4 6.8 5.4 5.2
continued
Rare earth elements in the Arctic Ocean 1619
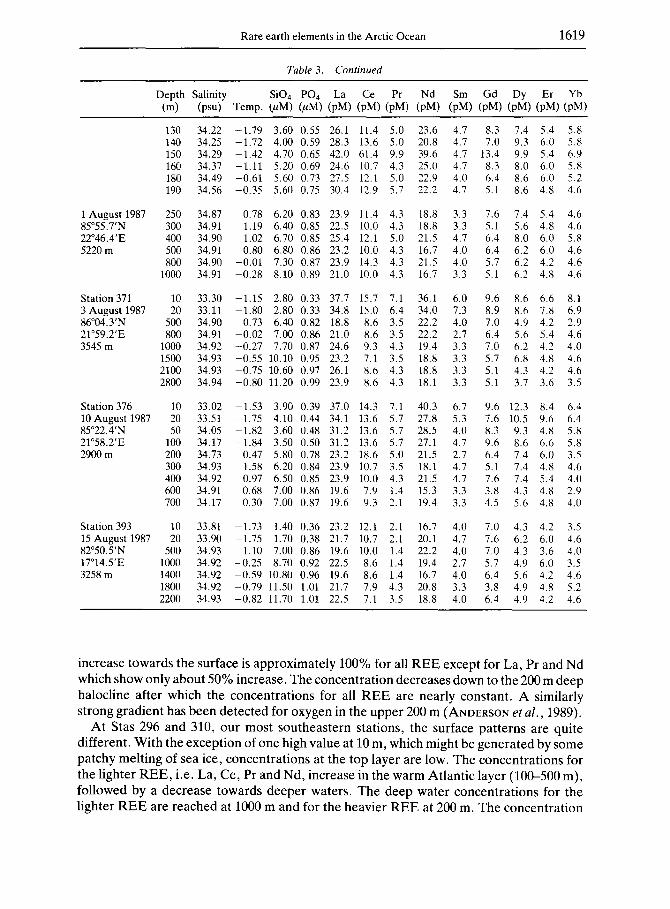
Table 3. Continued
Depth Salinity SiO 4 P O 4 La Ce Pr Nd Sm Gd Dy Er Yb (m) (psu) Temp. ~uM) ~uM) (pM) (pM) (pM) (pM) (pM) (pM) (pM) (pM) (pM)
1 August 1987 85°55.7'N 22°46.4'E 5220 m
Station 371 3 August 1987 86°04.3'N 21°59.2'E 3545 m
Station 376 10 August 1987 85°22.4'N 21°58.2'E 2900 m
130 34.22 -1.79 3.60 0.55 26.1 11.4 5.0 23.6 4.7 8.3 7.4 5.4 5.8 140 34.25 -1.72 4.00 0.59 28.3 13.6 5.0 20.8 4.7 7.0 9.3 6.0 5.8 150 34.29 -1.42 4.70 0.65 42.0 61.4 9.9 39.6 4.7 13.4 9.9 5.4 6.9 160 34.37 -1.11 5.20 0.69 24.6 10.7 4.3 25.0 4.7 8.3 8.0 6.0 5.8 180 34.49 -0.61 5.60 0.73 27.5 12.l 5.0 22.9 4.0 6.4 8.6 6.0 5,2 190 34.56 -0.35 5.60 0.75 30.4 12.9 5.7 22.2 4.7 5.1 8.6 4.8 4.6
250 34.87 0.78 6.20 0.83 23.9 1!.4 4.3 18.8 3.3 7.6 7.4 5.4 4.6 300 34.91 1.19 6.40 0.85 22.5 10.0 4.3 18.8 3.3 5.1 5.6 4.8 4.6 400 34.90 1.02 6.70 0.85 25.4 12.1 5.0 21.5 4.7 6.4 8.0 6.0 5.8 500 34.91 0.80 6.80 0.86 23.2 10.0 4.3 16.7 4.0 6.4 6.2 6.0 4.6 800 34.90 -0.01 7.30 0.87 23.9 14.3 4.3 21.5 4.0 5.7 6.2 4.2 4.6
1000 34.91 -0.28 8.10 0.89 21.0 10.0 4.3 16.7 3.3 5.1 6.2 4.8 4.6
10 33.30 -1.15 2.80 0.33 37.7 15.7 7.1 36.1 6.0 9.6 8.6 6.6 8.1 20 33.11 -1.80 2.80 0.33 34.8 15.0 6.4 34.0 7.3 8.9 8.6 7.8 6.9
500 34.90 0.73 6.40 0.82 18.8 8.6 3.5 22.2 4.0 7.0 4.9 4.2 2.9 800 34.91 -0.02 7.00 0.86 21.0 8.6 3.5 22.2 2.7 6.4 5.6 5.4 4.6
1000 34.92 -0.27 7.70 0.87 24.6 9.3 4.3 19.4 3.3 7.0 6.2 4.2 4.0 1500 34.93 -0.55 10.10 0.95 23.2 7.1 3.5 18.8 3.3 5.7 6.8 4.8 4.6 2100 34.93 -0.75 10.60 0.97 26.1 8.6 4.3 18.8 3.3 5.1 4.3 4.2 4.6 2800 34.94 -0.80 11.20 0.99 23.9 8.6 4.3 18.1 3.3 5.1 3.7 3.6 3.5
10 33.02 -1.53 3.90 0.39 37.0 14.3 7.1 40.3 6.7 9.6 12.3 8.4 6.4 20 33.51 -1.75 4.10 0.44 34.1 13.6 5.7 27.8 5.3 7.6 10.5 9.6 6.4 50 34.05 -1.82 3.60 0.48 31.2 13.6 5.7 28.5 4.0 8.3 9.3 4.8 5.8
100 34.17 -1.84 3.50 0.50 31.2 13.6 5.7 27.1 4.7 9.6 8.6 6.6 5.8 200 34.73 0.47 5.80 0.78 23.2 18.6 5.0 21.5 2.7 6.4 7.4 6.0 3.5 300 34.93 1.58 6.20 0.84 23.9 10.7 3.5 18.1 4.7 5.1 7.4 4.8 4.6 400 34.92 0.97 6.50 0.85 23.9 10.0 4.3 21.5 4.7 7.6 7.4 5.4 4.0 600 34.91 0.68 7.00 0.86 19.6 7.9 1.4 15.3 3.3 3.8 4.3 4.8 2.9 700 34.17 0.30 7.00 0.87 19.6 9.3 2.1 19.4 3.3 4.5 5.6 4.8 4.0
Station 393 10 33.81 -1.73 1.40 0.36 23.2 12.1 2.1 16.7 4.0 7.0 4.3 4.2 3.5 15 August 1987 20 33.90 -1.75 1.70 0.38 21.7 10.7 2.1 20.1 4.7 7.6 6.2 6.0 4.6 82°50.5'N 500 34.93 1.10 7.00 0.86 19.6 10.0 1.4 22.2 4.0 7.0 4.3 3.6 4.0 17°14.5'E 1000 34.92 -0.25 8.70 0.92 22.5 8.6 1.4 19.4 2.7 5.7 4.9 6.0 3.5 3258m 1400 34.92 -0.59 10.80 0.96 19.6 8.6 1.4 16.7 4.0 6.4 5.6 4.2 4.6
1800 34.92 -0.79 11.50 1.01 21.7 7.9 4.3 20.8 3.3 3.8 4.9 4.8 5.2 2200 34.93 -0.82 11.70 1.01 22.5 7.1 3.5 18.8 4.0 6.4 4.9 4.2 4.6
i n c r e a s e t o w a r d s t h e s u r f a c e is a p p r o x i m a t e l y 1 0 0 % fo r all R E E e x c e p t f o r L a , P r a n d N d
w h i c h s h o w o n l y a b o u t 5 0 % i n c r e a s e . T h e c o n c e n t r a t i o n d e c r e a s e s d o w n to t h e 200 m d e e p
h a l o c l i n e a f t e r w h i c h t h e c o n c e n t r a t i o n s f o r all R E E a r e n e a r l y c o n s t a n t . A s i m i l a r l y
s t r o n g g r a d i e n t h a s b e e n d e t e c t e d f o r o x y g e n in t h e u p p e r 200 m (ANDERSON et al . , 1989) .
A t S tas 296 a n d 310 , o u r m o s t s o u t h e a s t e r n s t a t i o n s , t h e s u r f a c e p a t t e r n s a r e q u i t e
d i f f e r e n t . W i t h t h e e x c e p t i o n o f o n e h i g h v a l u e a t 10 m , w h i c h m i g h t b e g e n e r a t e d b y s o m e
p a t c h y m e l t i n g o f s e a ice , c o n c e n t r a t i o n s a t t h e t o p l a y e r a r e low. T h e c o n c e n t r a t i o n s fo r
t h e l i g h t e r R E E , i .e . L a , C e , P r a n d N d , i n c r e a s e in t h e w a r m A t l a n t i c l a y e r ( 1 0 0 - 5 0 0 m ) ,
f o l l o w e d b y a d e c r e a s e t o w a r d s d e e p e r w a t e r s . T h e d e e p w a t e r c o n c e n t r a t i o n s fo r t h e
l i g h t e r R E E a r e r e a c h e d a t 1000 m a n d f o r t h e h e a v i e r R E E a t 200 m . T h e c o n c e n t r a t i o n
1620 S. WESTERLUND and P. OHMAN
Salinity
33.5 34.0 34.5 35.0 35.5 33.5 34.0 34.5 35.0 35.5 -2.0 -1.0
0 .~
500
1000
1500
2000
2500
3000
[3 J 0 0 m
0 . 0 1.0
[3
t
Temperature
-2.0 -I.0 0.0 1.0
GD o D oG c: •
o u
m
I
t S t a 2 9 6 • S i n 3 1 0 z S t a 3 7 0 • S t a 3 7 1 z S t a 2 9 6 • S t a 3 1 0 o S t a 3 7 0 • S t a 3 7 1
Fig. 2. Salinity and temperature profiles for Stas 296 and 310 and Stas 370 and 371. The fresh water influence of the surface and the warm layer of Atlantic-derived Arctic Intermediate Water
(AIW) can be clearly seen.
maximum for the lighter R E E between 100 and 1000 m correlates with a temperature maximum, which is characteristic for the inflowing Atlantic water. This maximum may also exist for Gd, but our data are not precise enough to confirm this. For the lighter REE, concentrations increase slightly towards the bottom.
At Sta. 393, the southwest station, concentrations are more or less constant throughout the entire water column, and are neither influenced by the thin Atlantic layer nor by the fresh water, with surface values corresponding to the deep water values at other stations. The deep water concentrations for all R E E are in the same range at the three stations.
La(pM)
0 10 20 30 40 0
0 r~ • D
oO m 500
1000
15oo
2000
2500
3 0 0 0
La(pM) 10 20 30 40 50
" F ~ ' o
• D a
• D
o •
o S t a 2 9 6 • S t a 3 1 0 o S t a 3 7 0 • S t a 3 7 1
Fig. 3. La profiles for Stas 296 and 310 and Stas 370 and 371, showing increased concentration in the surface water of Stas 370 and 371 and a maximum at the depth of the Barent Sea shelf at Stas 296
and 310.
Rare earth elements in the Arctic Ocean 1621
o
500
lOOO
15oo
2000
2500
3000
Ce(pM) Ce(pM)
0 5 10 15 20 25 5 10 15 20
• E, . . . . ~ ~ " [ ]
o o o o D
• o
@
25
o Sta296 • Sta310 o Sta370 " Sta371
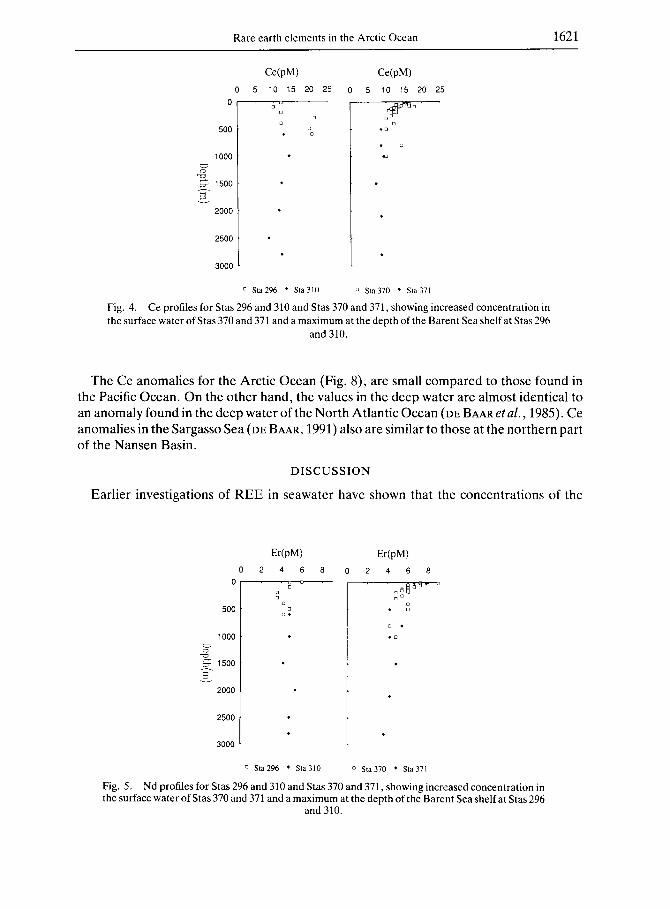
Fig. 4. Ce profiles for Stas 296 and 310 and Stas 370 and 371, showing increased concentration in the surface water of Stas 370 and 371 and a maximum at the depth of the Barent Sea shelf at Stas 296
and 310.
The Ce anomalies for the Arctic Ocean (Fig. 8), are small compared to those found in the Pacific Ocean. On the other hand, the values in the deep water are almost identical to an anomaly found in the deep water of the North Atlantic Ocean (DE BARR etal., 1985). Ce anomalies in the Sargasso Sea (DE BAAR, 1991) also are similar to those at the northern part of the Nansen Basin.
D I S C U S S I O N
Earlier investigations of REE in seawater have shown that the concentrations of the
Er(pM) Er(pM)
0 2 4 6 8 0 2 4 6 8
0 " " ~z o •
o o o o o
e •
• . o
500
1000
~- 15oo
2000
2500
3000
o S t a 2 9 6 * S t a 3 1 0 o S t a 3 7 0 * S t a 3 7 1
Fig. 5. Nd profiles for Stas 296 and 310 and Stas 370 and 371, showing increased concentration in the surface water of Stas 370 and 371 and a maximum at the depth of the Barent Sea shelf at Stas 296
and 310.
1622 s. WESTERLUND and P. (~HMAN
o
o
500
lOOO
15oo
2000
2500
3000
Nd(pM)
10 2o 30 o ~ . o, Q o
40 0
Nd(pM)
10 20 30 40
B o
o •
o *
o S t a 2 9 6 * S t a 3 1 0 o S t a 3 7 0 * S t a 3 7 1
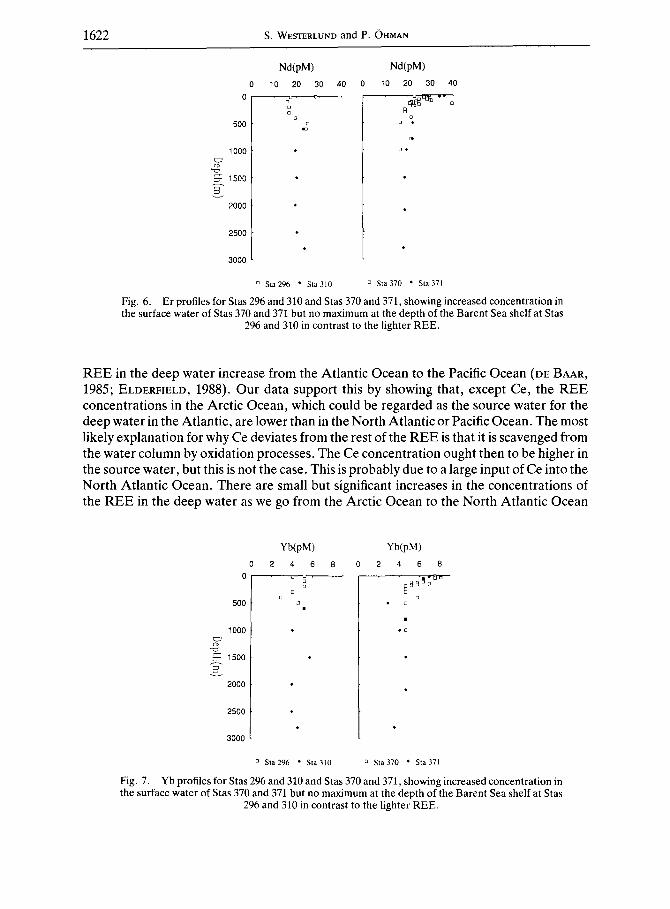
Fig. 6. Er profiles for Stas 296 and 310 and Stas 370 and 371, showing increased concentration in the surface water of Stas 370 and 371 but no max imum at the depth of the Barent Sea shelf at Stas
296 and 310 in contrast to the lighter REE.
REE in the deep water increase from the Atlantic Ocean to the Pacific Ocean (DE BAAR, 1985; ELDERFIELD, 1988). Our data support this by showing that, except Ce, the REE concentrations in the Arctic Ocean, which could be regarded as the source water for the deep water in the Atlantic, are lower than in the North Atlantic or Pacific Ocean. The most likely explanation for why Ce deviates from the rest of the REE is that it is scavenged from the water column by oxidation processes. The Ce concentration ought then to be higher in the source water, but this is not the case. This is probably due to a large input of Ce into the North Atlantic Ocean. There are small but significant increases in the concentrations of the REE in the deep water as we go from the Arctic Ocean to the North Atlantic Ocean
Yb(pM) Yb(pM)
0 2 4 6 8 0 2 4 6 8
o • o ~ , • E ] . ~ B ~ ,
o o ~] D a
o * D
* o
500
1000
1500
2000
2500
3000
@
@
o S t a 2 9 6 * S t a 3 1 0 o S t a 3 7 0 * S t a 3 7 1
Fig. 7. Yb profiles for Stas 296 and 310 and Stas 370 and 371, showing increased concentration in the surface water of Stas 370 and 371 but no max imum at the depth of the Barent Sea shelf at Stas
296 and 310 in contrast to the lighter REE.

Rare earth elements in the Arctic Ocean 1623
lO
"~ 1 E O
E • t- 0.1
0.01
j ' ~ ' - - - " - - - . . . . . . . . . . . . . . . . . . . . . . . . . . . . . . . . . . . . .
0 1000 2000 3 0 ~
Depth(m)
Fig. 8. Schematic profiles of Ce anomalies in the Arctic Ocean and Pacific Ocean showing the decrease in relative Ce concentration with the age of the water. The Pacific data from DE BAAR et aL
(1985). The Ce anomaly is calculated as 2([Ce]/[Ceshale])/([La]/[Lashale] + [Pr]/[PrshaJe] ).
(Table 2). This increase is most pronounced for La, Nd and Sm (20-25% increase), while the trend is less marked for the heavier REE (approximately 10% increase). The REE concentrations in the Pacific Ocean are twice as high, except for Ce which is depleted in the Pacific Ocean compared to the Arctic Ocean.
The elevated concentrations found for La-Nd at Stas 296 and 310 are probably caused by resuspension of material from the Barents Sea shelf. These stations are situated close to the Barents Sea shelf and could be influenced by a transport of resuspended particles from the shelf caused by boundary currents (ANDERSON et al., 1989). The increase in concen- tration is only found for the lighter REE, which ought to be the case if it was caused by resuspension of scavenged material, because the lighter REE are more affected by scavenging than the heavier REE which are stabilized by stronger complexes to ligands in the water, mainly carbonate. Consequently the lighter REE in the scavenged particulate material are expected to be enriched compared to the heavy REE.
The very high surface concentrations found for all REE at Stas 370 and 371, the most northern stations, suggest that the input of REE to the surface water in this area is large. This could be attributed to several sources, i.e. eolian input, melt-water input from circulating ice or river water input. However, the surface water at these stations has a large component that originates from the Siberian rivers (ANDERSON et al., 1990). It is therefore likely that the elevated concentrations of REE are transported to this area by the river water. As the data are from unfiltered samples the question arises whether the elevated concentrations found in the top layer might be REE in suspended form. However, this is probably not the case, based on suspended iron data from a few samples (WESTERLUND, unpublished data). Assuming we have pure conservative mixing of the REE from the fresh water and the REE from the seawater, we can use the REE-salinity relation (Fig. 9) to calculate the fresh water end member concentrations of the REE. As seen in Table 4, the values obtained are in a range reasonable for river water, indicating that the REE react rather slowly in the seawater.
The Ce anomalies (Fig. 8) do not differ with depth at Stas 370 and 371. At Stas 296 and 310 they are slightly higher and the maximum found in the Atlantic layer shows a less pronounced anomaly which ought to be the case with an input of newly resuspended Ce.
1624 S. WESTERLUND and P. OHMAN
La(pM) 50
40
30
20
10
0 33.0
c
c o
D D O
D O
33.5 34.0 34.5 35.0
Salinity
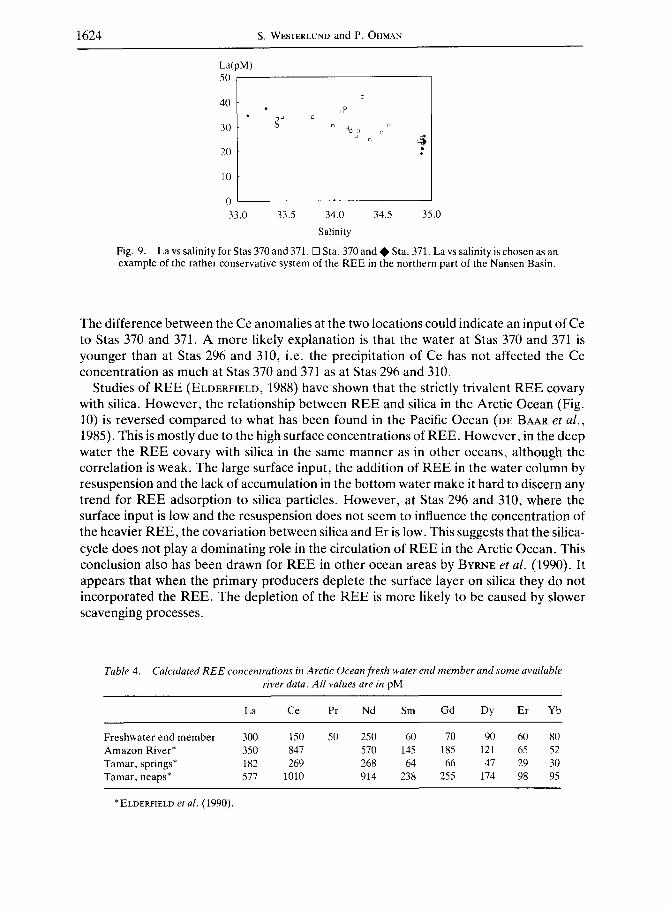
Fig. 9. Lavs salinity for Stas 370 and 371. [] Sta. 370 and • Sta. 371. Lavs salinity is chosen as an example of the rather conservative system of the REE in the northern part of the Nansen Basin.
The difference between the Ce anomalies at the two locations could indicate an input of Ce to Stas 370 and 371. A more likely explanation is that the water at Stas 370 and 371 is younger than at Stas 296 and 310, i.e. the precipitation of Ce has not affected the Ce concentration as much at Stas 370 and 371 as at Stas 296 and 310.
Studies of REE (ELDERHELD, 1988) have shown that the strictly trivalent REE covary with silica. However, the relationship between REE and silica in the Arctic Ocean (Fig. 10) is reversed compared to what has been found in the Pacific Ocean (DE BAAR et al . , 1985). This is mostly due to the high surface concentrations of REE. However, in the deep water the REE covary with silica in the same manner as in other oceans, although the correlation is weak. The large surface input, the addition of REE in the water column by resuspension and the lack of accumulation in the bottom water make it hard to discern any trend for REE adsorption to silica particles. However, at Stas 296 and 310, where the surface input is low and the resuspension does not seem to influence the concentration of the heavier REE, the covariation between silica and Er is low. This suggests that the silica- cycle does not play a dominating role in the circulation of REE in the Arctic Ocean. This conclusion also has been drawn for REE in other ocean areas by BYRNE et al. (1990). It appears that when the primary producers deplete the surface layer on silica they do not incorporated the REE. The depletion of the REE is more likely to be caused by slower scavenging processes.
Table 4. Calculated R E E concentrations in Arctic Ocean fresh water end member and some available river data. Al l values are in pM
La Ce Pr Nd Sm Gd Dy Er Yb
Freshwater end member 300 150 50 250 60 70 90 60 80 Amazon River* 350 847 570 145 185 121 65 52 Tamar, springs* 182 269 268 64 66 47 29 30 Tamar, neaps* 577 1010 914 238 255 174 98 95
* ]~LDERFIELD et al. (1990).
Rare earth elements in the Arctic Ocean 1625
La( 50
4O
3O
2O
~M)
10
0 0 2
D
~ c ~ c
c o
o %%D• • • •
4 6 8 10 12 14
Silica(uM)
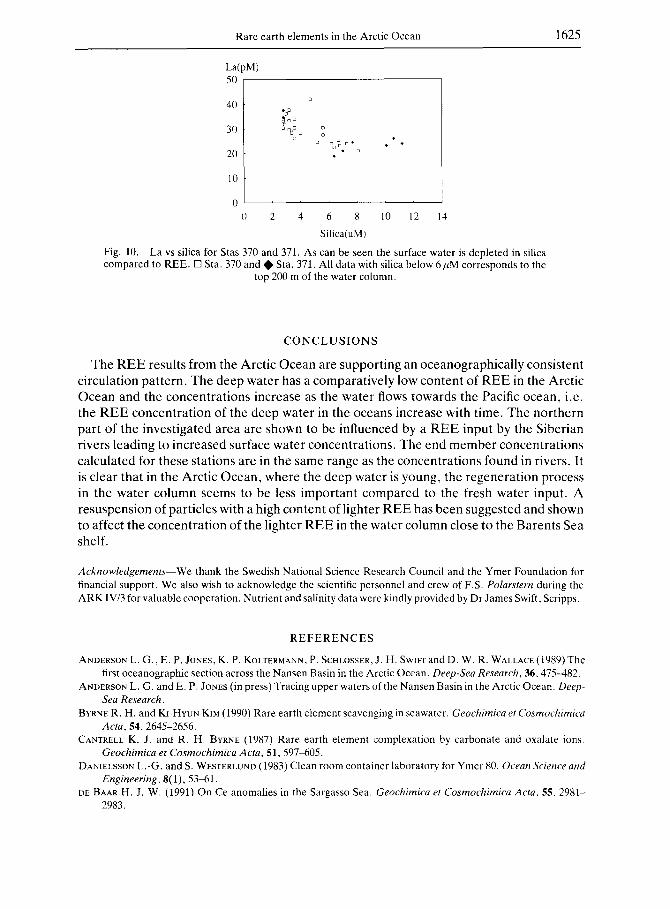
Fig. 10. Lavs silica for Stas 370 and 371. As can be seen the surface water is depleted in silica compared to REE. [] Sta. 370 and • Sta. 371. All data with silica below 6/~M corresponds to the
top 200 m of the water co[umn.
C O N C L U S I O N S
T h e R E E resu l t s f r o m the A r c t i c O c e a n a re s u p p o r t i n g an o c e a n o g r a p h i c a l l y cons i s t en t
c i r c u l a t i o n p a t t e r n . T h e d e e p w a t e r has a c o m p a r a t i v e l y l ow c o n t e n t o f R E E in the A r c t i c
O c e a n and t h e c o n c e n t r a t i o n s i n c r e a s e as t he w a t e r f lows t o w a r d s t he Pacif ic o c e a n , i .e .
t he R E E c o n c e n t r a t i o n o f t he d e e p w a t e r in t he o c e a n s i nc r ea se wi th t ime . T h e n o r t h e r n
pa r t o f t he i n v e s t i g a t e d a r e a a re s h o w n to be i n f l u e n c e d by a R E E inpu t by the S i b e r i a n
r ive rs l e a d i n g to i n c r e a s e d su r f ace w a t e r c o n c e n t r a t i o n s . T h e e n d m e m b e r c o n c e n t r a t i o n s
c a l c u l a t e d fo r t he se s t a t ions a r e in t he s a m e r a n g e as t he c o n c e n t r a t i o n s f o u n d in r ivers . It
is c l ea r t ha t in t h e A r c t i c O c e a n , w h e r e t he d e e p w a t e r is y o u n g , t he r e g e n e r a t i o n p r o c e s s
in t he w a t e r c o l u m n s e e m s to be less i m p o r t a n t c o m p a r e d to the f resh w a t e r input . A
r e s u s p e n s i o n o f pa r t i c l e s wi th a h igh c o n t e n t o f l igh te r R E E has b e e n s u g g e s t e d and s h o w n
to a f fec t t h e c o n c e n t r a t i o n o f t he l i gh t e r R E E in t he w a t e r c o l u m n c lose to t he B a r e n t s Sea
shelf .
Acknowledgements--We thank the Swedish National Science Research Council and the Ymer Foundation for financial support. We also wish to acknowledge the scientific personnel and crew of F.S. Polarstern during the ARK IV/3 for valuable cooperation. Nutrient and salinity data were kindly provided by Dr James Swift, Scripps.
R E F E R E N C E S
ANDERSON L. G., E. P. JONES, K. P. KOLTERMANN, P. SCHLOSSER, J. H. SWIFT and D. W. R. WALLACE (1989) The first oceanographic section across the Nansen Basin in the Arctic Ocean. Deep-Sea Research, 36,475-482.
ANDERSON L. G. and E. P. JONES (in press) Tracing upper waters of the Nansen Basin in the Arctic Ocean. Deep- Sea Research.
BYRNE R. H. and KI-HYUN KIM (1990) Rare earth element scavenging in seawater. Geochimica et Cosmochimica Acta, 54, 2645-2656.
CANTRELL K. J. and R. H. BYRNE (1987) Rare earth element complexation by carbonate and oxalate ions. Geochimica et Cosmochimica Acta, 51,597~05.
DANIELSSON L.-G. and S. WESTERLUND (1983) Clean room container laboratory for Ymer 80. Ocean Science and Engineering, 8(1), 53q51.
DE BAAR H. J. W. (1991) On Ce anomalies in the Sargasso Sea. Geochimica et Cosmochimica Acta, 55, 2981- 2983.

1626 S. WESTERLUND and P. OHMAN
DE BAAR H. J. W., M. P. BACON and P. G. BREWER (1983) Rare-earth distributions with a positive Ce anomaly in the Western North Atlantic Ocean. Nature, 301,324-327.
DE BAAR H. J. W., M. P. BACON and P. G. BREWER (1985) Rare earth elements in the Pacific and Atlantic Ocean. Geochimica et Cosmochimica Acta, 49, 1943-1959.
ELDERFIELD H. (1988) The oceanic chemistry of the rare-earth elements. Philosophical Transactions of the Royal Society of London, A325, 105-126.
ELDERFIEED H. and M. J. GREAVES (1982) The rare elements in seawater. Nature, 296,214-219. ELDERFIELD H. and M. J. GREAVES (1983) Determinat ion of the rare earth elements in sea water. In: Trace metals
in sea water~ C. S. WONG, E. BOYLE, K. W. BRULAND, J. D. BURTON and E. D. GOLDBERG, editors, Plenum Press, New York, pp. 427-445.
ELDERF1ELD H.~ M. J. GREAVES, G. P. KLINKHAMMER and J. M. EDMOND (1987) Rare earth elements in hydrothermal fluids and plumes: influence on geochemical mass balance. Abstract , I U G G Symposium, Vancouver 1987.
ELDERFIELD H., R. UPSTILL-GODDARD and E. R. SHOLKOVITZ (1990) The rare earth elements in rivers, estuaries, and coastal seas and their significance to the composition of ocean waters. Geochimica et Cosmochimica Acta, 54, 971-991.
GERMAN C. R. and H. ELDERFIELD (1990) Rare earth elements in the NW Indian Ocean. Geochimica et Cosmochimica Acta, 54, 1929-1940.
GORDIENKO P. A and A. F. LAKTIONOV (1965) Circulation and physics of the Arctic Basin waters. In: Annals of the international geophysical year, XLVI Oceanography, Pergamon Press, Oxford, pp. 94-112.
GREAVES M. J., H. ELDERFIELD and G. P. KLINKHAMMER (1989) Determinat ion of the rare earth elements in natural waters by isotope-dillution mass spectrometry. Analytica Chimica Acta, 218,265-280.