Embed Size (px)
DESCRIPTION
Overview of RCOM's subsea cable business
Citation preview
PRINTING INSTRUCTIONS
CHECK TOC BEFORE PRINTING
Color/grayscale: Color (regardless of printing in b/w)
Scale to fit paper: OFF
Print hidden slides: OFF
POWERPOINT OPTIONS > ADVANCED > PRINT
Print in background: OFF
CHARTING INSTRUCTIONS
Charts in this book are created… (delete as necessary):
in Excel, pasted as a live object, then brake chart link (delete existing chart before pasting an update from Excel)
in Excel and pasted as a data linked objects (edits made directly on the slide will not be reflected in the
original Excel file)
in Excel and pasted as pictures (source location comments required for file management)
RCOM’s subsea cable business
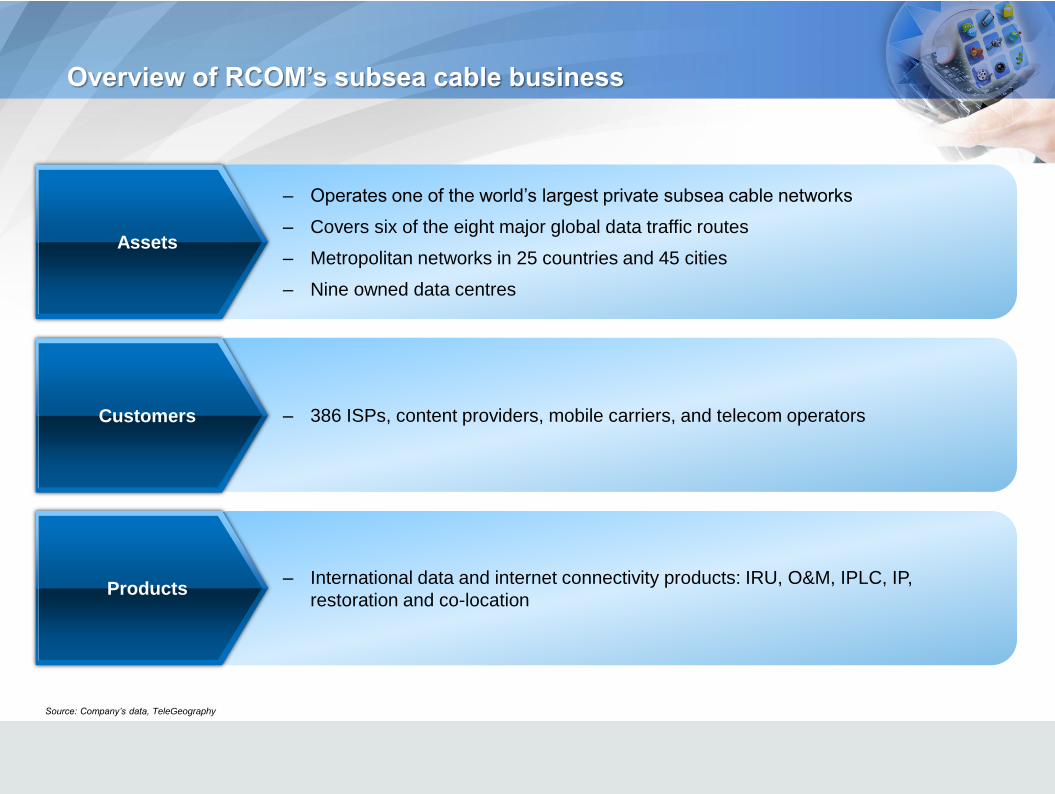
Overview of RCOM’s subsea cable business
Source: Company’s data, TeleGeography
– Operates one of the world’s largest private subsea cable networks
– Covers six of the eight major global data traffic routes
– Metropolitan networks in 25 countries and 45 cities
– Nine owned data centres
– 386 ISPs, content providers, mobile carriers, and telecom operators
– International data and internet connectivity products: IRU, O&M, IPLC, IP,
restoration and co-location
Assets
Customers
Products

Investment highlights
Presence in key markets and global reach
High entry barriers – Cost, Time, Right of Way
Significant available capacity, low incremental upgrade costs, long useful life
High quality network, Global Ethernet enabled – Low latency IP
Strong customer relationships
4x IP traffic growth expected over next 5 years
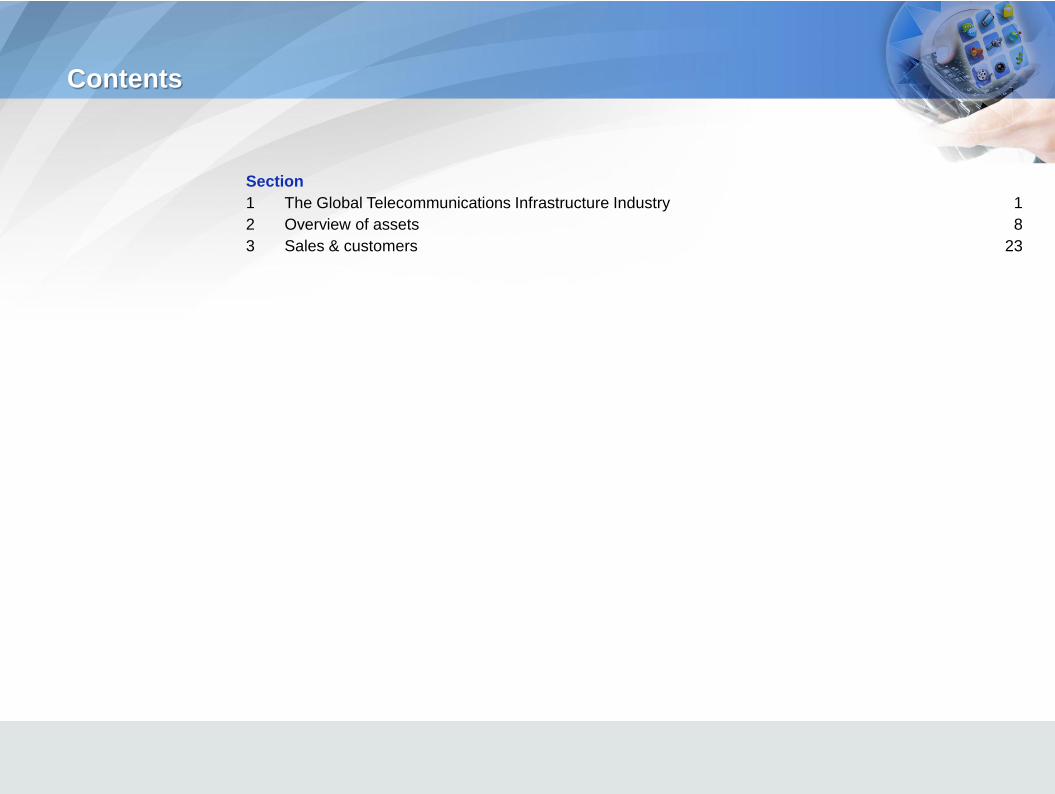
Contents
Section
1 The Global Telecommunications Infrastructure Industry 1
2 Overview of assets 8
3 Sales & customers 23
The Global Telecommunications Infrastructure Industry
Section 1
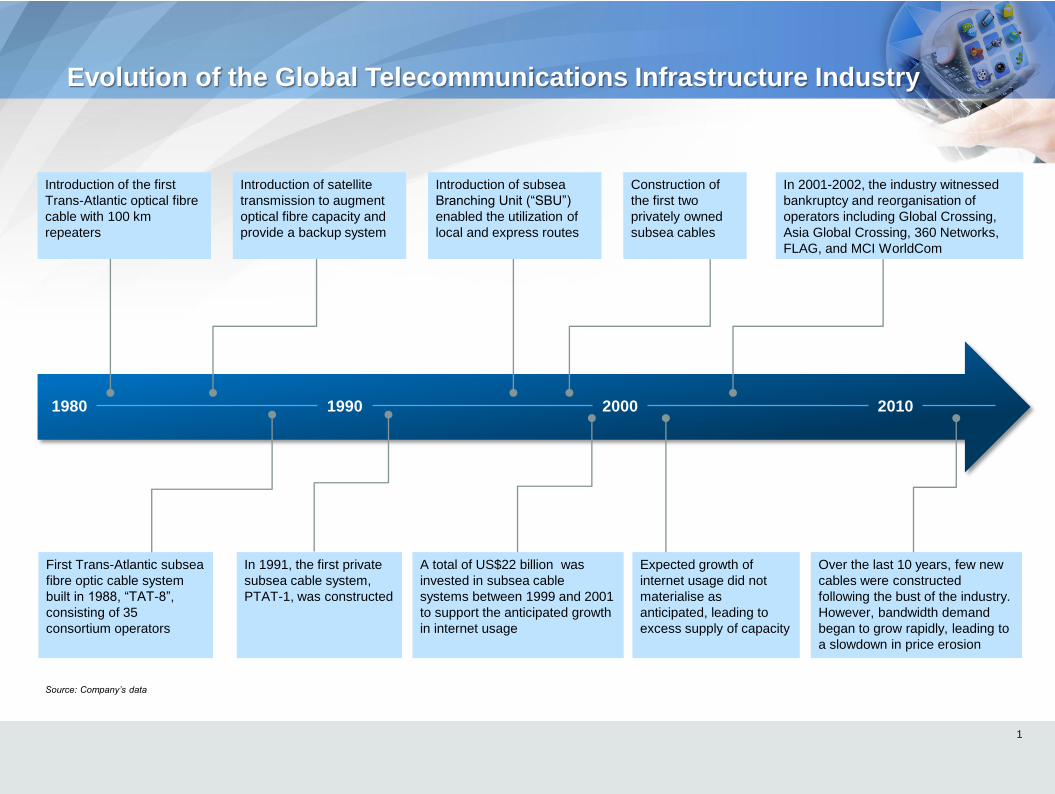
Evolution of the Global Telecommunications Infrastructure Industry
1
1980 1990 2000 2010
Source: Company’s data
Introduction of the first
Trans-Atlantic optical fibre
cable with 100 km
repeaters
Introduction of satellite
transmission to augment
optical fibre capacity and
provide a backup system
Construction of
the first two
privately owned
subsea cables
Introduction of subsea
Branching Unit (“SBU”)
enabled the utilization of
local and express routes
In 2001-2002, the industry witnessed
bankruptcy and reorganisation of
operators including Global Crossing,
Asia Global Crossing, 360 Networks,
FLAG, and MCI WorldCom
Expected growth of
internet usage did not
materialise as
anticipated, leading to
excess supply of capacity
A total of US$22 billion was
invested in subsea cable
systems between 1999 and 2001
to support the anticipated growth
in internet usage
Over the last 10 years, few new
cables were constructed
following the bust of the industry.
However, bandwidth demand
began to grow rapidly, leading to
a slowdown in price erosion
First Trans-Atlantic subsea
fibre optic cable system
built in 1988, “TAT-8”,
consisting of 35
consortium operators
In 1991, the first private
subsea cable system,
PTAT-1, was constructed
Source: Company’s data
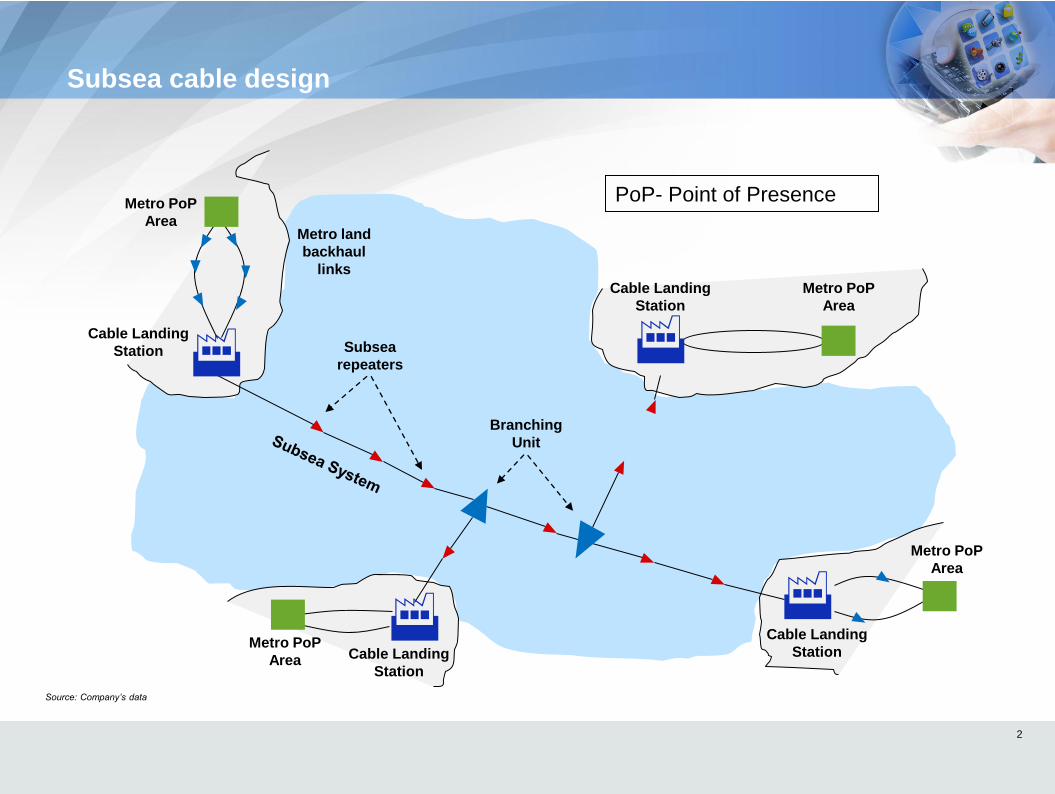
Subsea cable design
2
PoP- Point of Presence
Cable Landing
Station
Cable Landing
Station
Cable Landing
Station
Metro PoP
Area
Metro PoP
Area
Metro PoP
Area
Metro PoP
Area
Branching
Unit
Subsea
repeaters
Metro land
backhaul
links
Cable Landing
Station
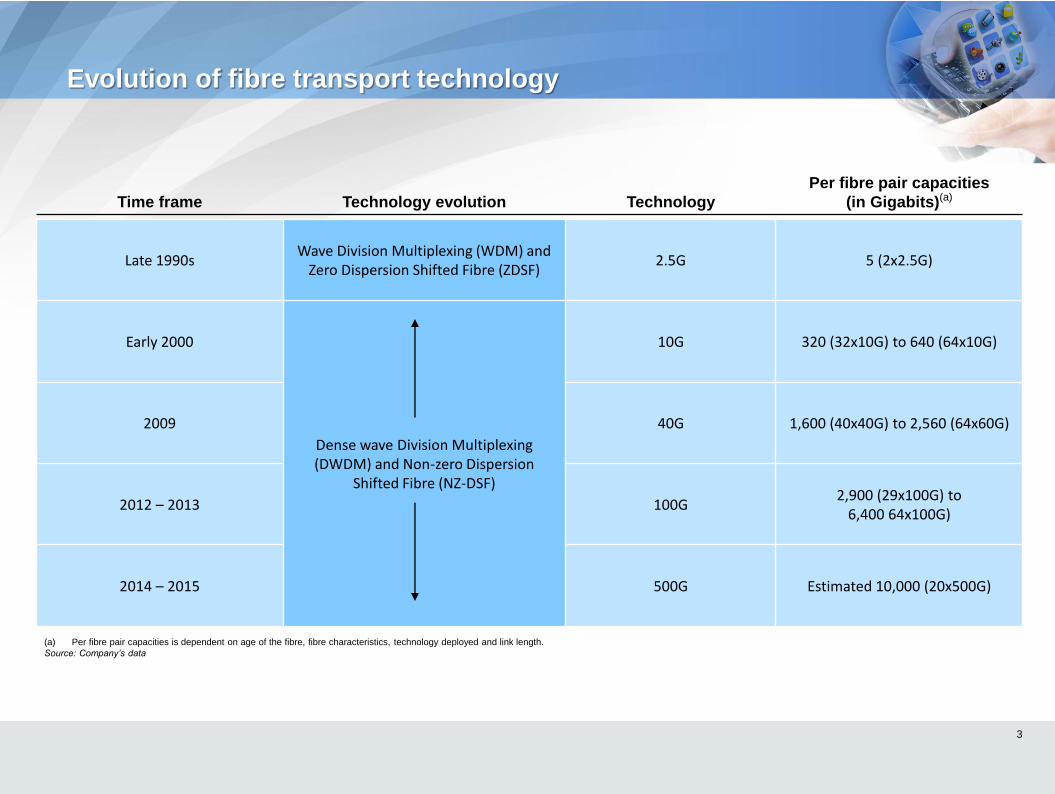
(a) Per fibre pair capacities is dependent on age of the fibre, fibre characteristics, technology deployed and link length.
Source: Company’s data
Evolution of fibre transport technology
Time frame Technology evolution Technology
Per fibre pair capacities
(in Gigabits)(a)
Late 1990s Wave Division Multiplexing (WDM) and
Zero Dispersion Shifted Fibre (ZDSF) 2.5G 5 (2x2.5G)
Early 2000
Dense wave Division Multiplexing (DWDM) and Non-zero Dispersion
Shifted Fibre (NZ-DSF)
10G 320 (32x10G) to 640 (64x10G)
2009 40G 1,600 (40x40G) to 2,560 (64x60G)
2012 – 2013 100G 2,900 (29x100G) to
6,400 64x100G)
2014 – 2015 500G Estimated 10,000 (20x500G)
3
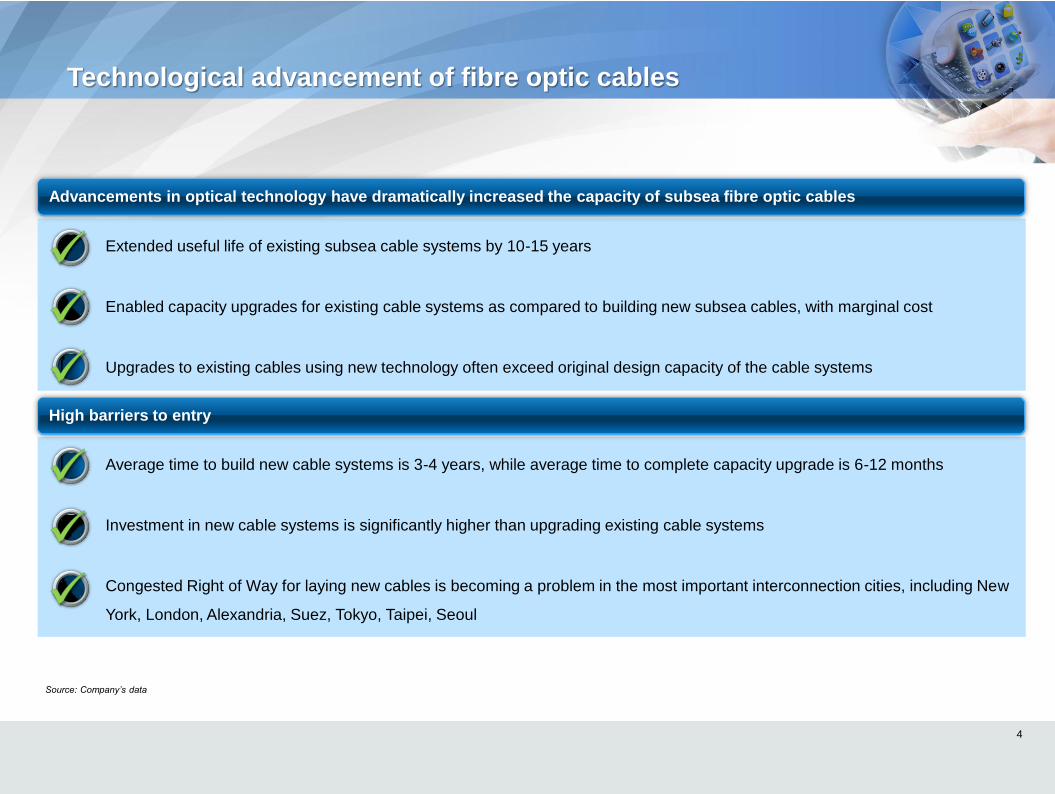
Extended useful life of existing subsea cable systems by 10-15 years
Enabled capacity upgrades for existing cable systems as compared to building new subsea cables, with marginal cost
Upgrades to existing cables using new technology often exceed original design capacity of the cable systems
The capacity upgrades often exceed the original design capacity of the system
Technological advancement of fibre optic cables
4
Source: Company’s data
Average time to build new cable systems is 3-4 years, while average time to complete capacity upgrade is 6-12 months
Investment in new cable systems is significantly higher than upgrading existing cable systems
Congested Right of Way for laying new cables is becoming a problem in the most important interconnection cities, including New
York, London, Alexandria, Suez, Tokyo, Taipei, Seoul
Advancements in optical technology have dramatically increased the capacity of subsea fibre optic cables
High barriers to entry
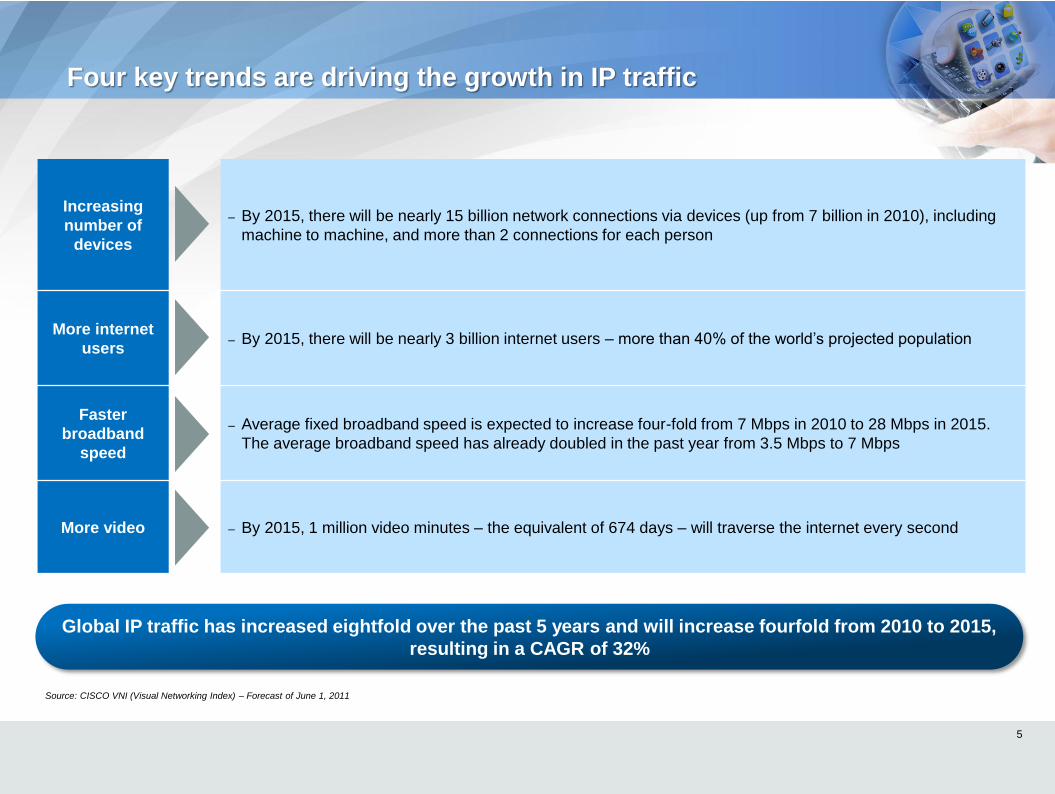
Four key trends are driving the growth in IP traffic
5
Global IP traffic has increased eightfold over the past 5 years and will increase fourfold from 2010 to 2015,
resulting in a CAGR of 32%
Increasing
number of
devices
– By 2015, there will be nearly 15 billion network connections via devices (up from 7 billion in 2010), including
machine to machine, and more than 2 connections for each person
More internet
users – By 2015, there will be nearly 3 billion internet users – more than 40% of the world’s projected population
Faster
broadband
speed
– Average fixed broadband speed is expected to increase four-fold from 7 Mbps in 2010 to 28 Mbps in 2015.
The average broadband speed has already doubled in the past year from 3.5 Mbps to 7 Mbps
More video – By 2015, 1 million video minutes – the equivalent of 674 days – will traverse the internet every second
Source: CISCO VNI (Visual Networking Index) – Forecast of June 1, 2011
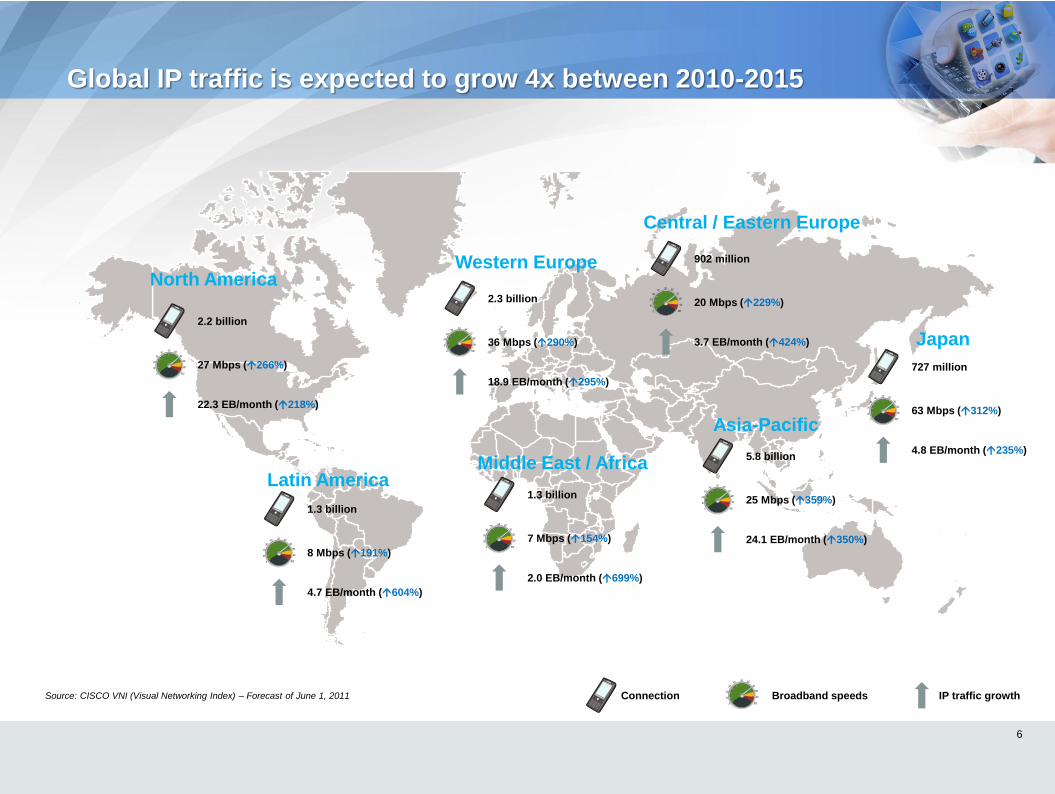
Global IP traffic is expected to grow 4x between 2010-2015
Japan
Asia-Pacific
Middle East / Africa
Central / Eastern Europe
Western Europe
Latin America
North America
2.2 billion
27 Mbps (266%)
22.3 EB/month (218%)
1.3 billion
8 Mbps (191%)
4.7 EB/month (604%)
1.3 billion
7 Mbps (154%)
2.0 EB/month (699%)
5.8 billion
25 Mbps (359%)
24.1 EB/month (350%)
727 million
63 Mbps (312%)
4.8 EB/month (235%)
902 million
20 Mbps (229%)
3.7 EB/month (424%)
2.3 billion
36 Mbps (290%)
18.9 EB/month (295%)
Connection IP traffic growth Broadband speeds
6
Source: CISCO VNI (Visual Networking Index) – Forecast of June 1, 2011
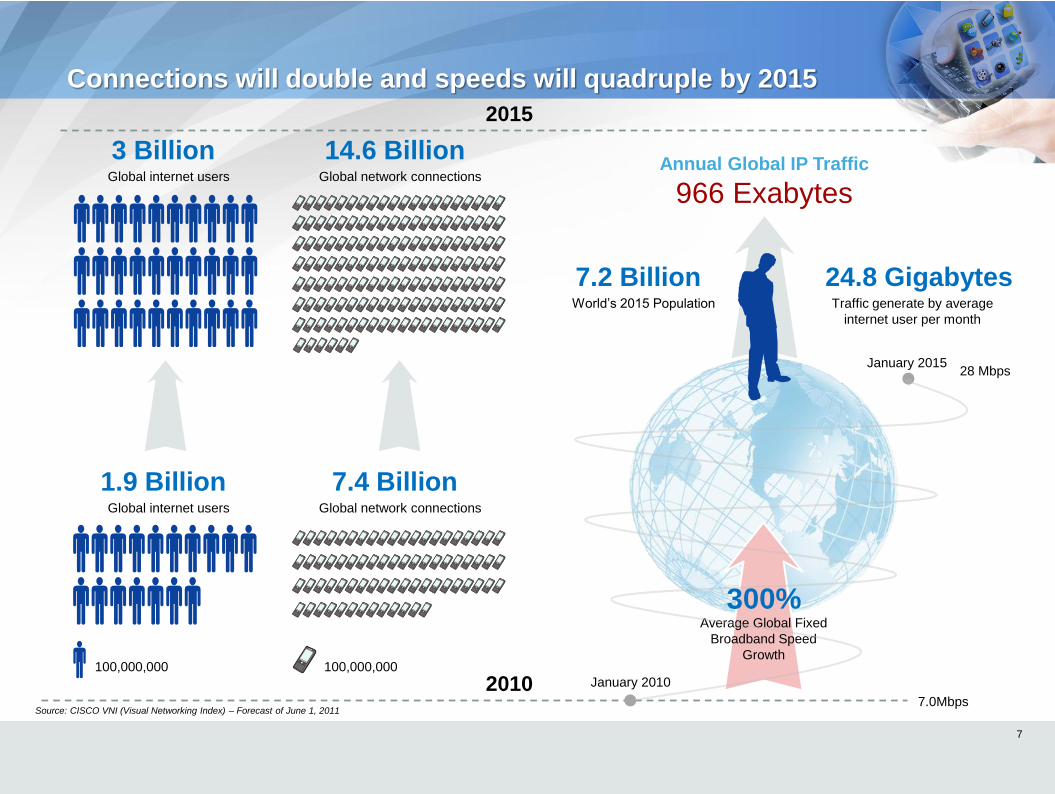
Connections will double and speeds will quadruple by 2015
3 Billion Global internet users
14.6 Billion Global network connections
1.9 Billion Global internet users
7.4 Billion Global network connections
100,000,000 100,000,000
Annual Global IP Traffic
966 Exabytes
7.2 Billion World’s 2015 Population
2015
28 Mbps
300% Average Global Fixed
Broadband Speed
Growth
7.0Mbps 2010 January 2010
January 2015
24.8 Gigabytes Traffic generate by average
internet user per month
7
Source: CISCO VNI (Visual Networking Index) – Forecast of June 1, 2011

Overview of assets
Section 2
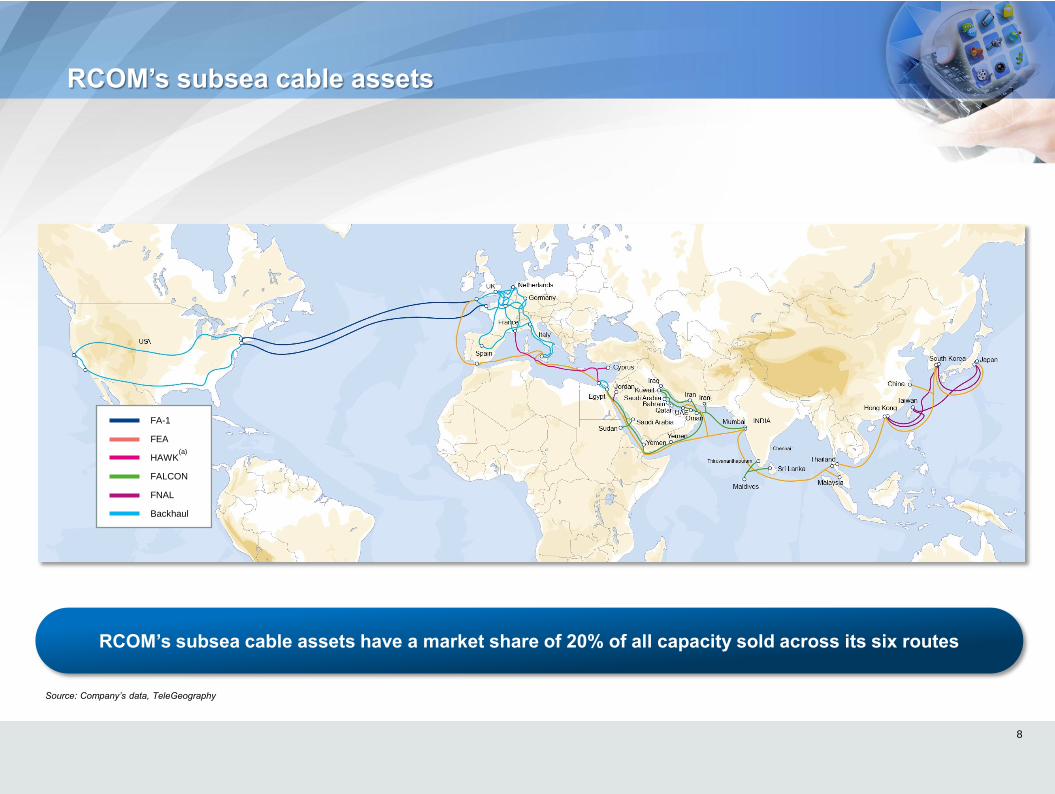
RCOM’s subsea cable assets
8
FA-1
FEA
HAWK
FALCON
FNAL
Backhaul
Source: Company’s data, TeleGeography
RCOM’s subsea cable assets have a market share of 20% of all capacity sold across its six routes
(a)
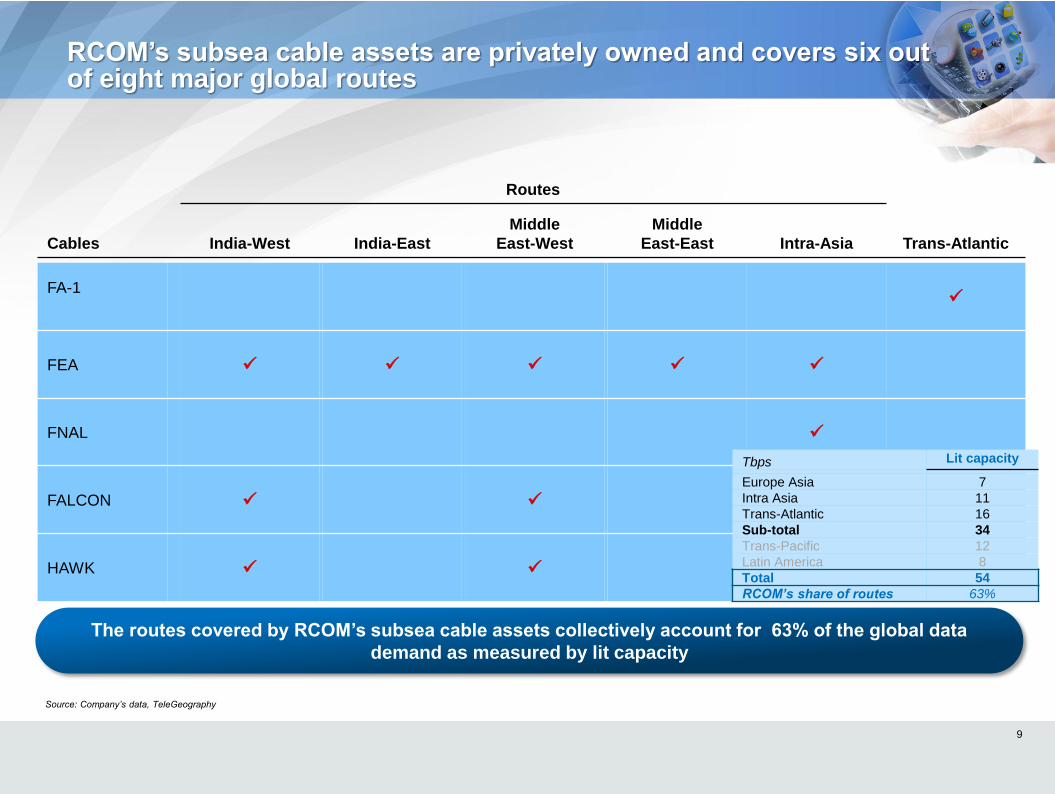
Routes
Cables
India-West India-East
Middle
East-West
Middle
East-East Intra-Asia Trans-Atlantic
FA-1
FEA
FNAL
FALCON
HAWK
RCOM’s subsea cable assets are privately owned and covers six out of eight major global routes
9
Source: Company’s data, TeleGeography
The routes covered by RCOM’s subsea cable assets collectively account for 63% of the global data
demand as measured by lit capacity
Tbps Lit capacity
Europe Asia 7
Intra Asia 11
Trans-Atlantic 16
Sub-total 34
Trans-Pacific 12
Latin America 8
Total 54
RCOM’s share of routes 63%
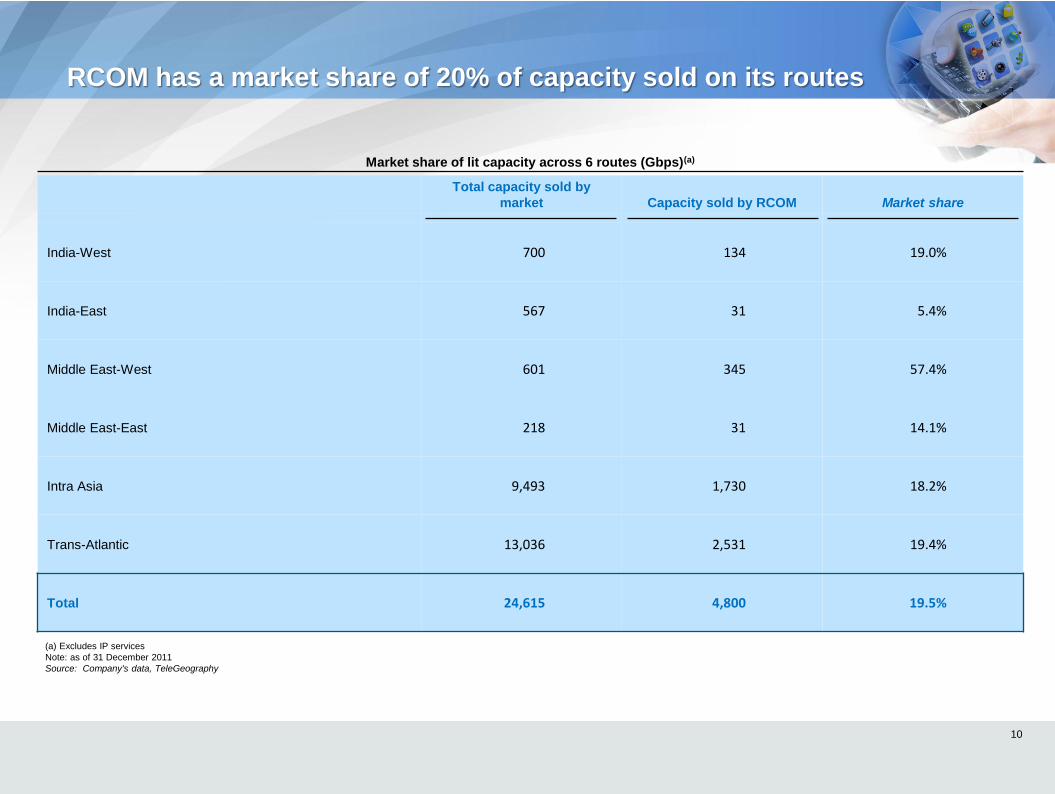
RCOM has a market share of 20% of capacity sold on its routes
Total capacity sold by
market Capacity sold by RCOM Market share
India-West 700 134 19.0%
India-East 567 31 5.4%
Middle East-West 601 345 57.4%
Middle East-East 218 31 14.1%
Intra Asia 9,493 1,730 18.2%
Trans-Atlantic 13,036 2,531 19.4%
Total 24,615 4,800 19.5%
10
(a) Excludes IP services
Note: as of 31 December 2011
Source: Company's data, TeleGeography
Market share of lit capacity across 6 routes (Gbps)(a)
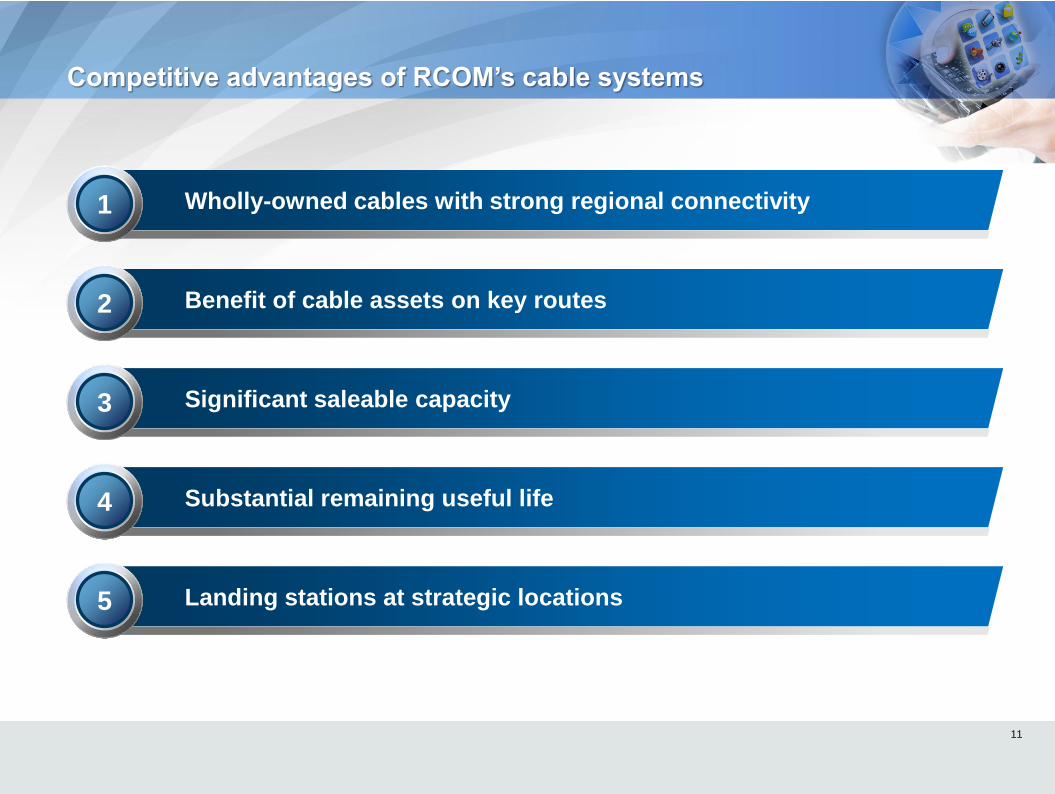
Landing stations at strategic locations
Substantial remaining useful life
Significant saleable capacity
Benefit of cable assets on key routes
Wholly-owned cables with strong regional connectivity
Competitive advantages of RCOM’s cable systems
11
1
2
3
4
5
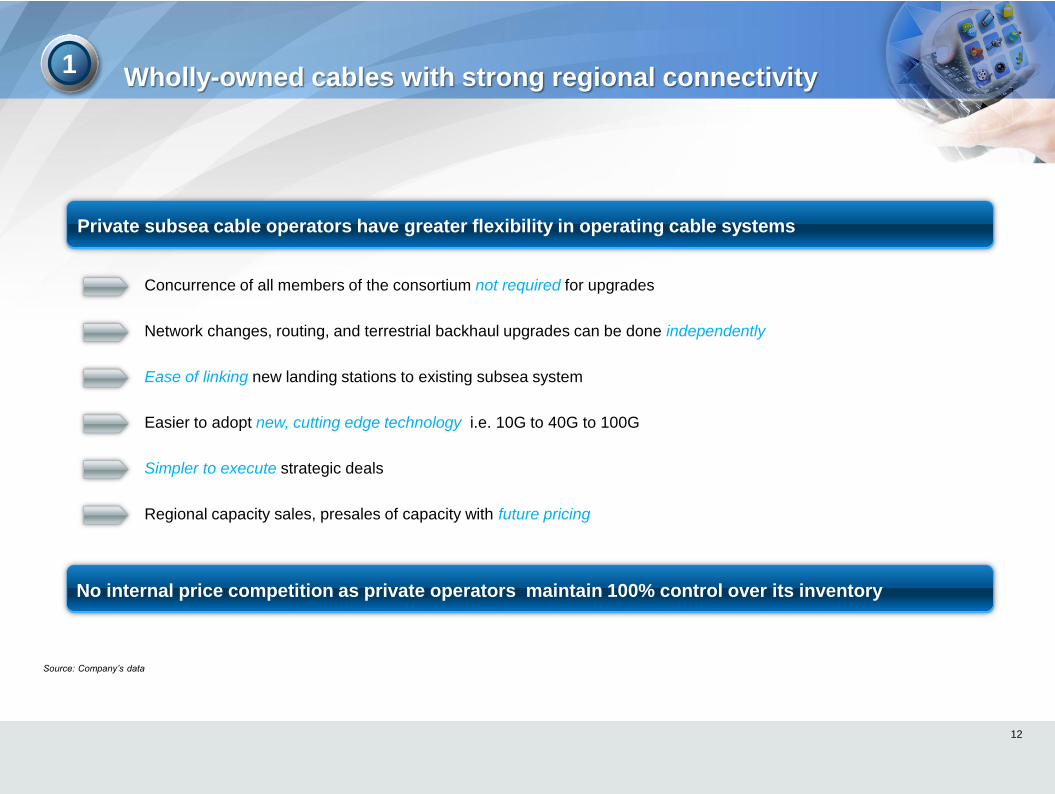
– Concurrence of all members of the consortium not required for upgrades
– Network changes, routing, and terrestrial backhaul upgrades can be done independently
– Ease of linking new landing stations to existing subsea system
– Easier to adopt new, cutting edge technology i.e. 10G to 40G to 100G
– Simpler to execute strategic deals
– Regional capacity sales, presales of capacity with future pricing
12
Wholly-owned cables with strong regional connectivity
Source: Company’s data
1
Private subsea cable operators have greater flexibility in operating cable systems
No internal price competition as private operators maintain 100% control over its inventory
Benefit of cable assets on key routes
13
2
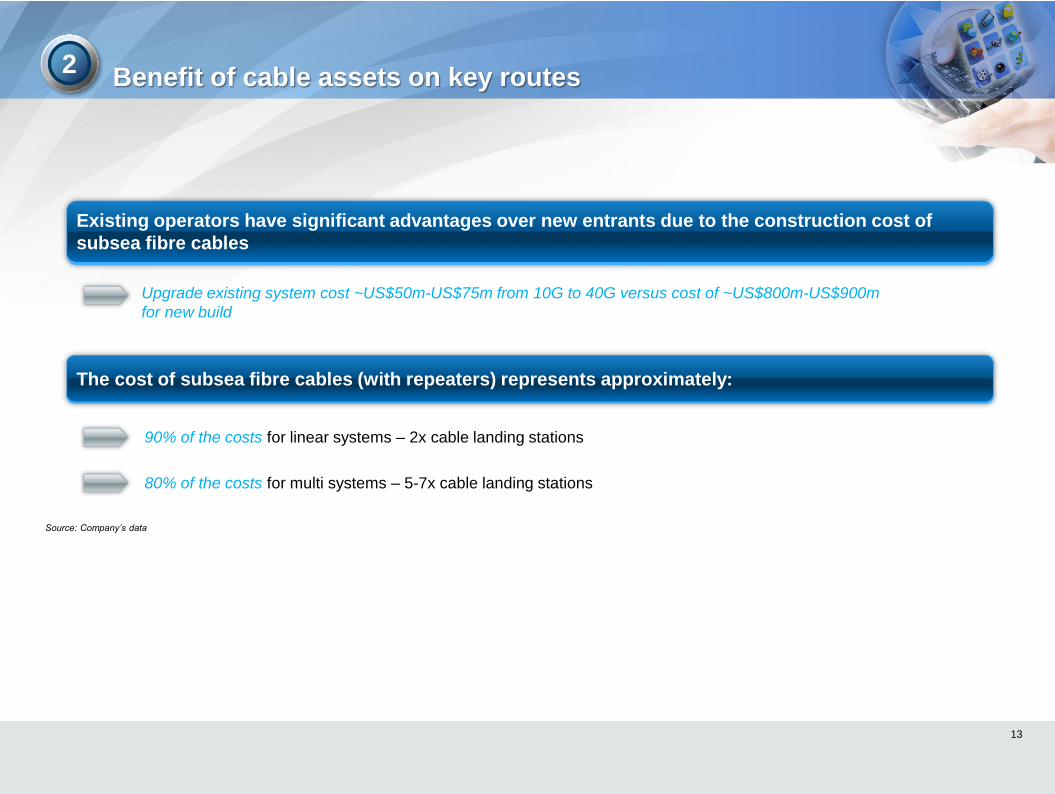
Existing operators have significant advantages over new entrants due to the construction cost of
subsea fibre cables
The cost of subsea fibre cables (with repeaters) represents approximately:
– 90% of the costs for linear systems – 2x cable landing stations
– 80% of the costs for multi systems – 5-7x cable landing stations
– Upgrade existing system cost ~US$50m-US$75m from 10G to 40G versus cost of ~US$800m-US$900m
for new build
Source: Company’s data
Significant saleable capacity
14
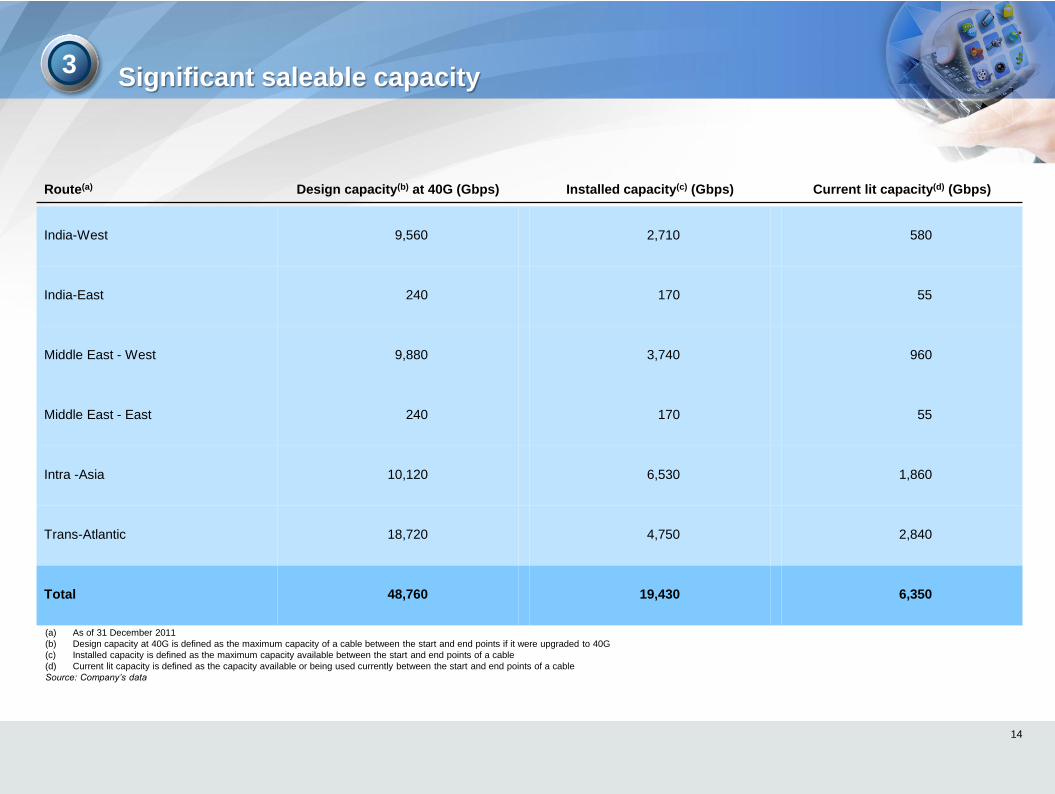
(a) As of 31 December 2011
(b) Design capacity at 40G is defined as the maximum capacity of a cable between the start and end points if it were upgraded to 40G
(c) Installed capacity is defined as the maximum capacity available between the start and end points of a cable
(d) Current lit capacity is defined as the capacity available or being used currently between the start and end points of a cable
Source: Company’s data
Route(a) Design capacity(b) at 40G (Gbps) Installed capacity(c) (Gbps) Current lit capacity(d) (Gbps)
India-West 9,560 2,710 580
India-East 240 170 55
Middle East - West 9,880 3,740 960
Middle East - East 240 170 55
Intra -Asia 10,120 6,530 1,860
Trans-Atlantic 18,720 4,750 2,840
Total 48,760 19,430 6,350
3
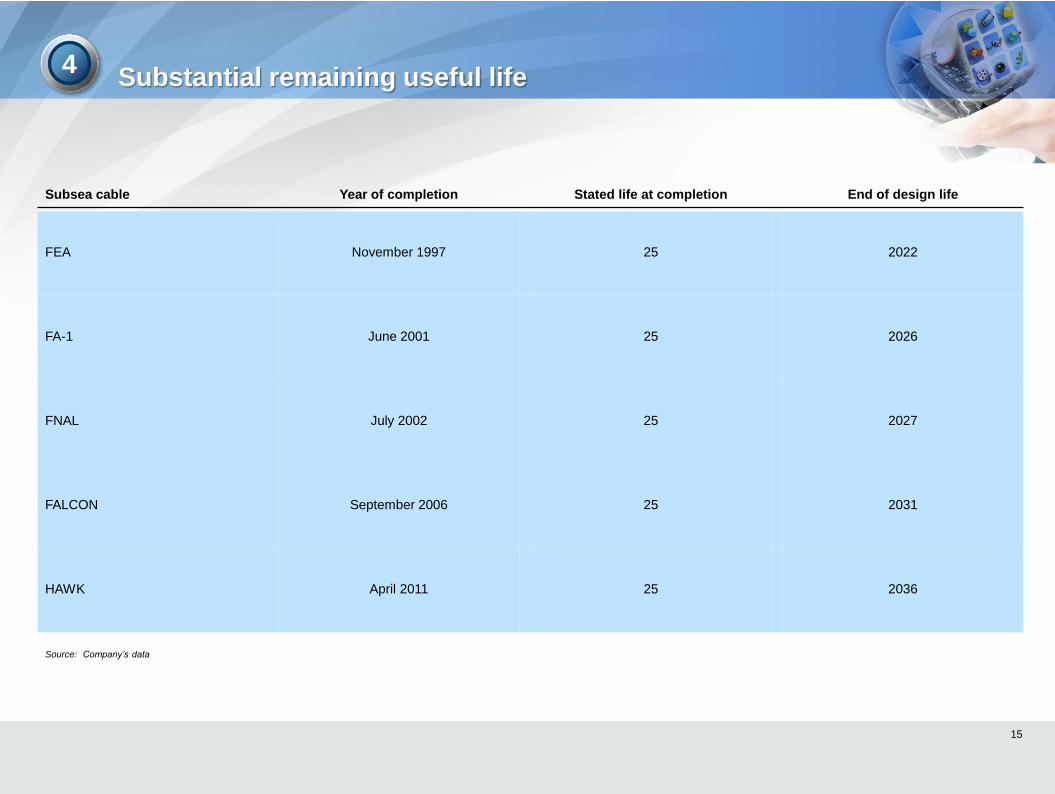
Substantial remaining useful life
15
Subsea cable Year of completion Stated life at completion End of design life
FEA November 1997 25 2022
FA-1 June 2001 25 2026
FNAL July 2002 25 2027
FALCON September 2006 25 2031
HAWK April 2011 25 2036
Source: Company’s data
4
Landing stations at strategic locations
16
5
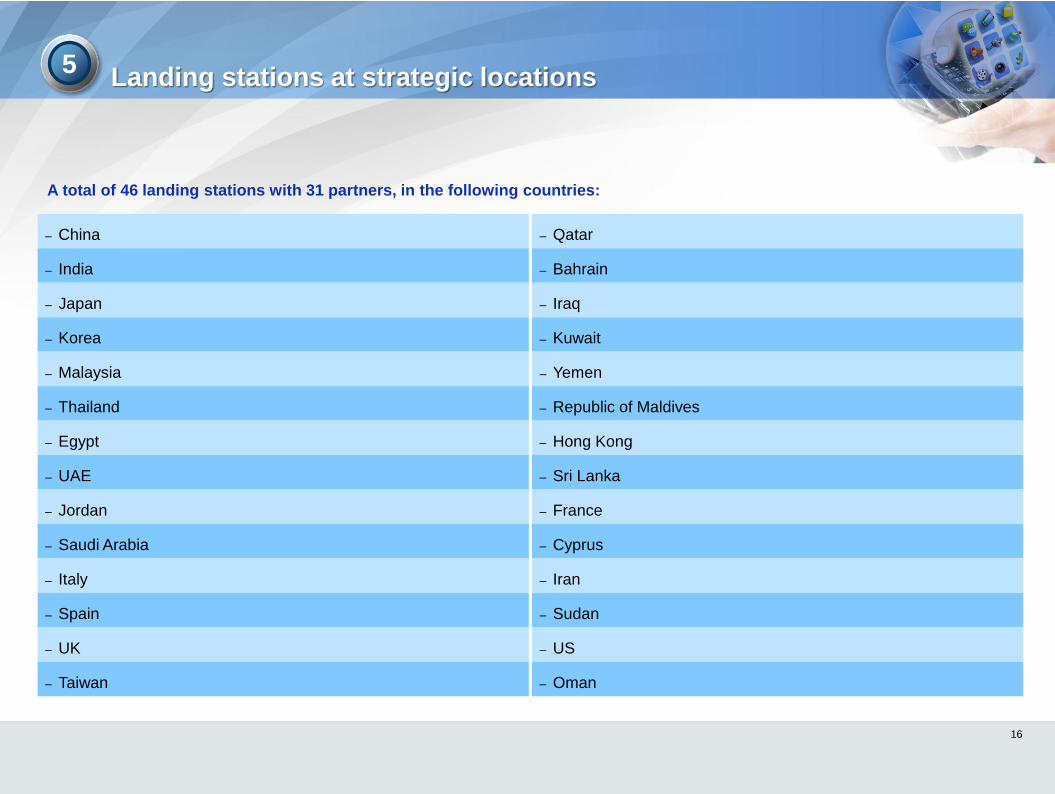
– China – Qatar
– India – Bahrain
– Japan – Iraq
– Korea – Kuwait
– Malaysia – Yemen
– Thailand – Republic of Maldives
– Egypt – Hong Kong
– UAE – Sri Lanka
– Jordan – France
– Saudi Arabia – Cyprus
– Italy – Iran
– Spain – Sudan
– UK – US
– Taiwan – Oman
A total of 46 landing stations with 31 partners, in the following countries:
Cable systems Third-Party Networks
17
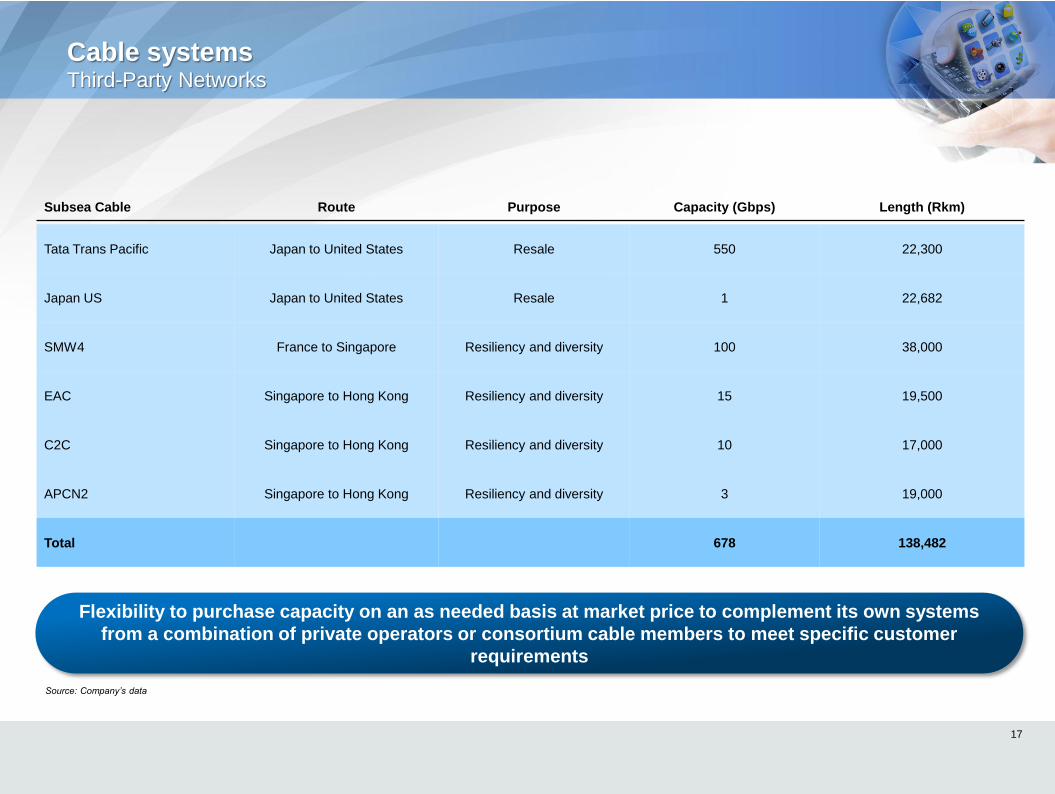
Subsea Cable Route Purpose Capacity (Gbps) Length (Rkm)
Tata Trans Pacific Japan to United States Resale 550 22,300
Japan US Japan to United States Resale 1 22,682
SMW4 France to Singapore Resiliency and diversity 100 38,000
EAC Singapore to Hong Kong Resiliency and diversity 15 19,500
C2C Singapore to Hong Kong Resiliency and diversity 10 17,000
APCN2 Singapore to Hong Kong Resiliency and diversity 3 19,000
Total 678 138,482
Source: Company’s data
Flexibility to purchase capacity on an as needed basis at market price to complement its own systems
from a combination of private operators or consortium cable members to meet specific customer
requirements
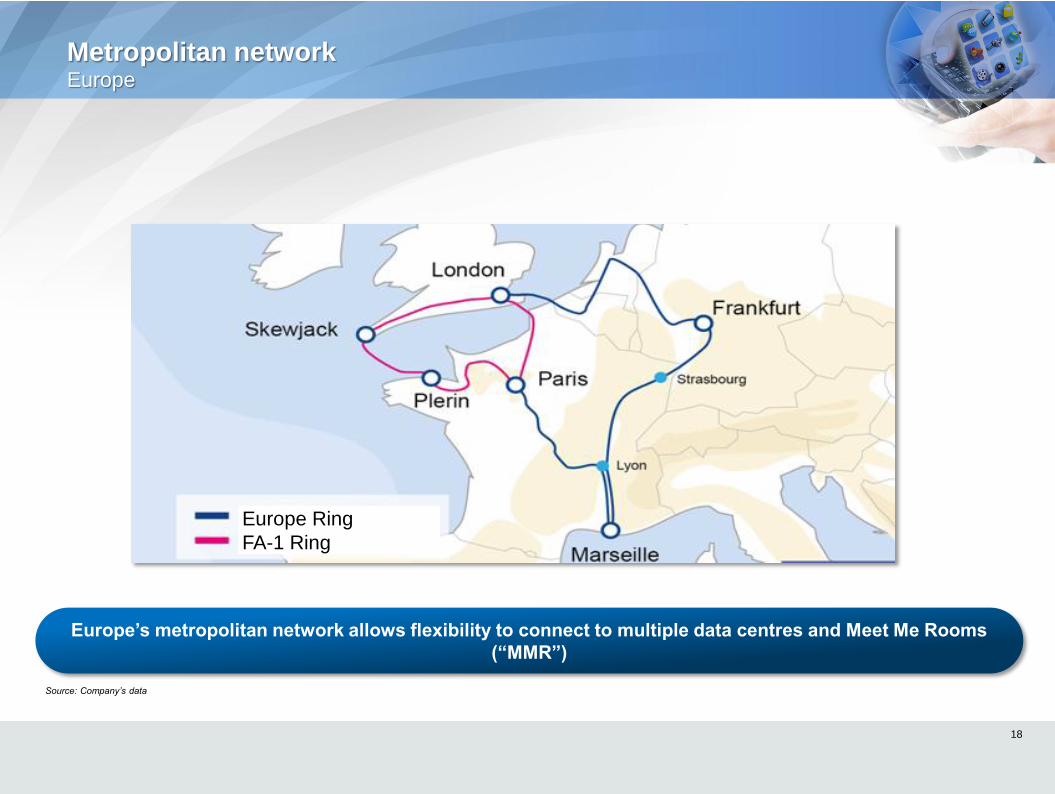
Metropolitan network Europe
18
Source: Company’s data
Europe’s metropolitan network allows flexibility to connect to multiple data centres and Meet Me Rooms
(“MMR”)
Europe Ring
FA-1 Ring
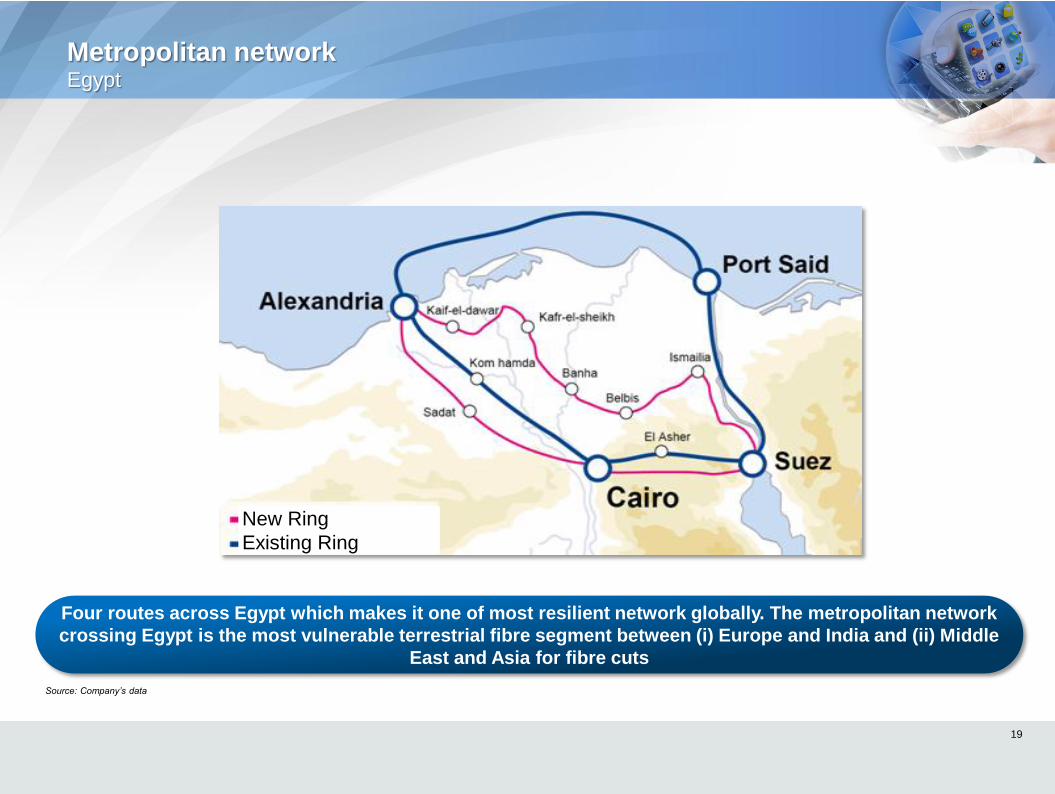
Metropolitan network Egypt
19
Source: Company’s data
Four routes across Egypt which makes it one of most resilient network globally. The metropolitan network
crossing Egypt is the most vulnerable terrestrial fibre segment between (i) Europe and India and (ii) Middle
East and Asia for fibre cuts
New Ring
Existing Ring
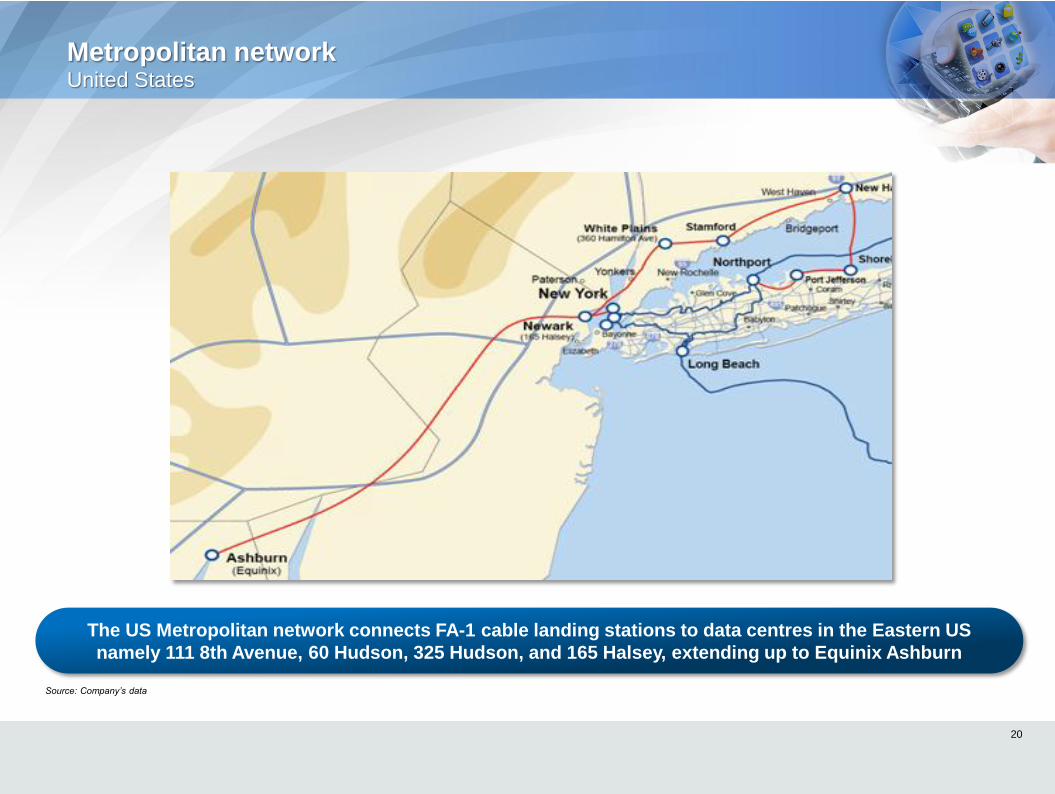
Metropolitan network United States
20
Source: Company’s data
The US Metropolitan network connects FA-1 cable landing stations to data centres in the Eastern US
namely 111 8th Avenue, 60 Hudson, 325 Hudson, and 165 Halsey, extending up to Equinix Ashburn
Data centres
21
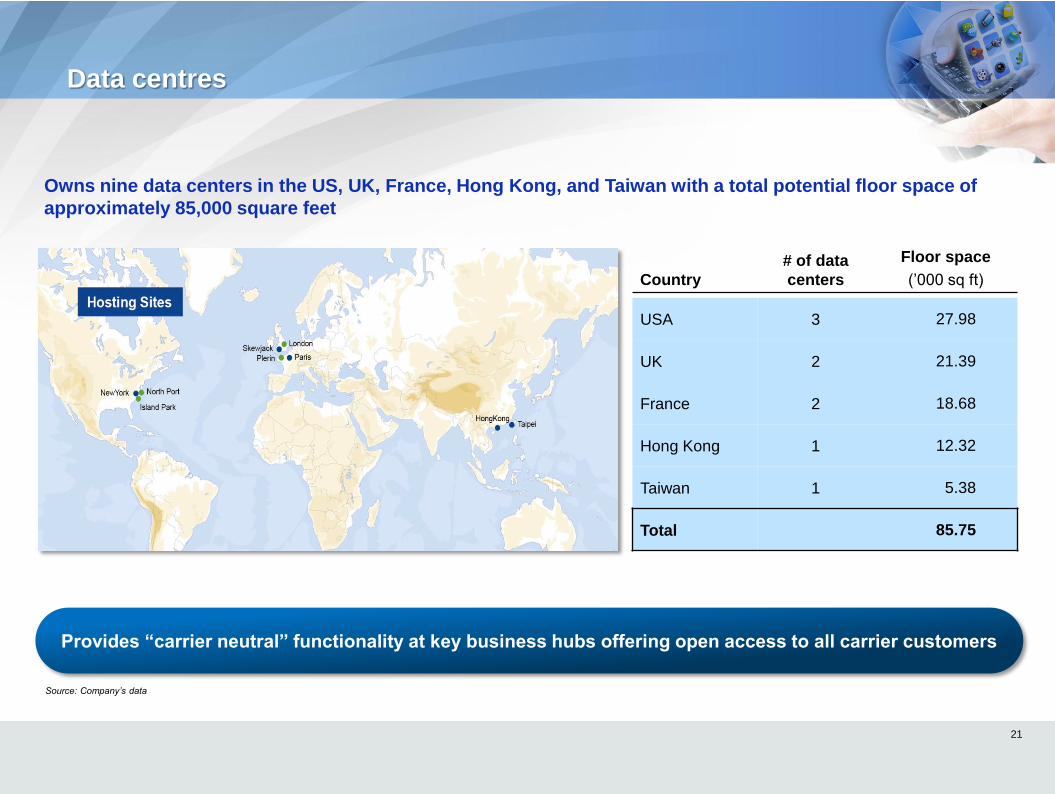
Country
# of data
centers
Floor space
(’000 sq ft)
USA 3 27.98
UK 2 21.39
France 2 18.68
Hong Kong 1 12.32
Taiwan 1 5.38
Total 85.75
Source: Company’s data
Owns nine data centers in the US, UK, France, Hong Kong, and Taiwan with a total potential floor space of
approximately 85,000 square feet
Provides “carrier neutral” functionality at key business hubs offering open access to all carrier customers
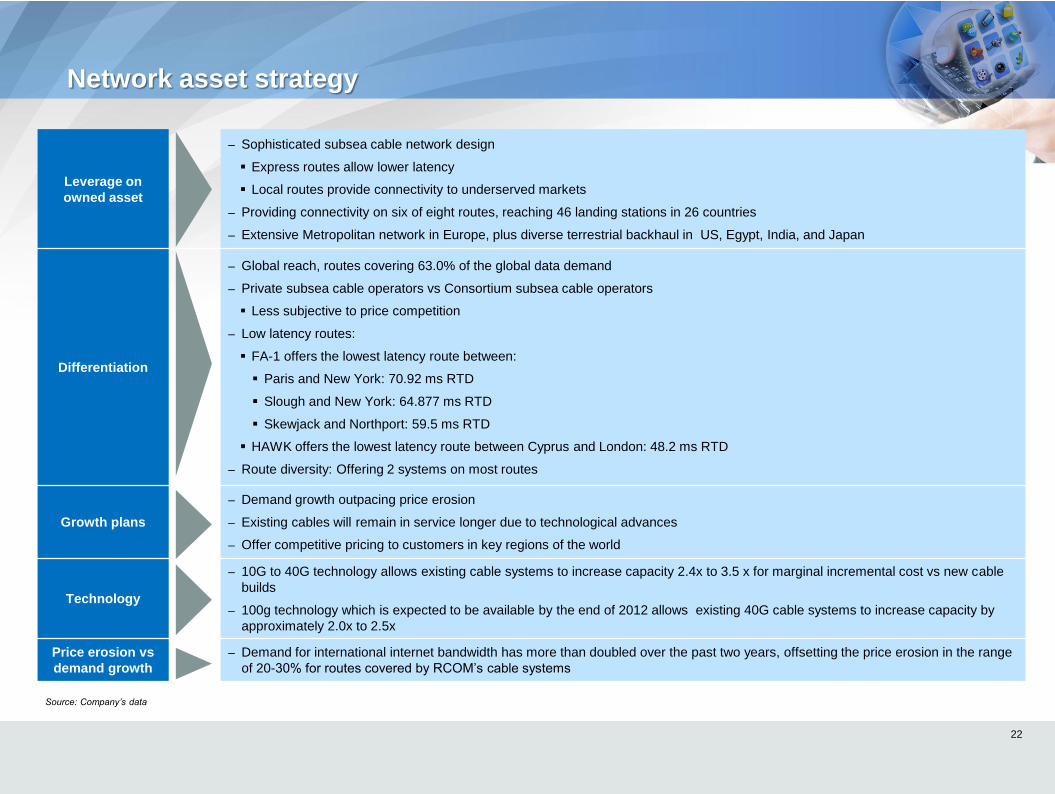
Network asset strategy
22
Leverage on
owned asset
– Sophisticated subsea cable network design
Express routes allow lower latency
Local routes provide connectivity to underserved markets
– Providing connectivity on six of eight routes, reaching 46 landing stations in 26 countries
– Extensive Metropolitan network in Europe, plus diverse terrestrial backhaul in US, Egypt, India, and Japan
Differentiation
– Global reach, routes covering 63.0% of the global data demand
– Private subsea cable operators vs Consortium subsea cable operators
Less subjective to price competition
– Low latency routes:
FA-1 offers the lowest latency route between:
Paris and New York: 70.92 ms RTD
Slough and New York: 64.877 ms RTD
Skewjack and Northport: 59.5 ms RTD
HAWK offers the lowest latency route between Cyprus and London: 48.2 ms RTD
– Route diversity: Offering 2 systems on most routes
Growth plans
– Demand growth outpacing price erosion
– Existing cables will remain in service longer due to technological advances
– Offer competitive pricing to customers in key regions of the world
Technology
– 10G to 40G technology allows existing cable systems to increase capacity 2.4x to 3.5 x for marginal incremental cost vs new cable
builds
– 100g technology which is expected to be available by the end of 2012 allows existing 40G cable systems to increase capacity by
approximately 2.0x to 2.5x
Price erosion vs
demand growth
– Demand for international internet bandwidth has more than doubled over the past two years, offsetting the price erosion in the range
of 20-30% for routes covered by RCOM’s cable systems
Source: Company’s data

Sales & customers
Section 3
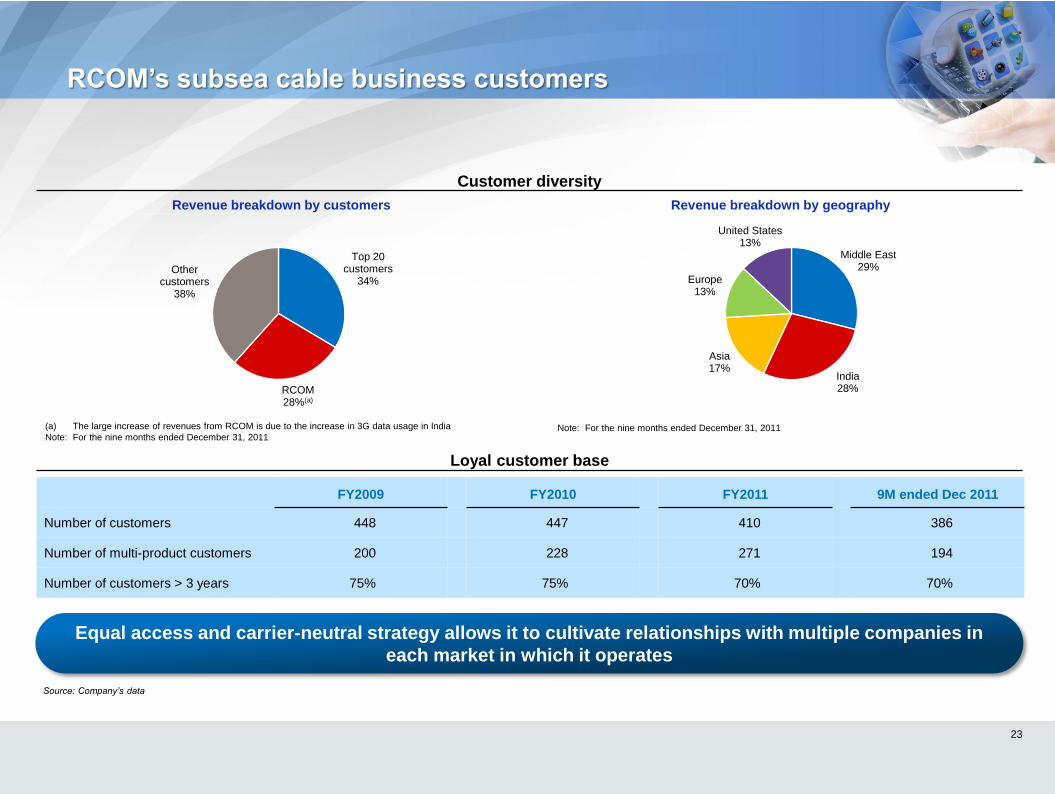
Top 20 customers
34%
RCOM 28%(a)
Other customers
38%
Middle East 29%
India 28%
Asia 17%
Europe 13%
United States 13%
RCOM’s subsea cable business customers
Customer diversity
Loyal customer base
23
Revenue breakdown by customers Revenue breakdown by geography
(a) The large increase of revenues from RCOM is due to the increase in 3G data usage in India
Note: For the nine months ended December 31, 2011 Note: For the nine months ended December 31, 2011
User XP ID(login name): liawjon
File Path: \\Dbg.ads.db.com\Sng-ma-
g\ibd\sngpres\Pitchbooks\2012\12csg\IBC
A\12csg0079\Backups\12csg0079_corner
stone.xlsx
File name: 12csg0079_cornerstone.xlsx
XL Sheet name: '19'!$D$14:$E$16
Time Stamp: 23/03/2012 22:49:54
User XP ID(login name): liawjon
File Path: \\Dbg.ads.db.com\Sng-ma-
g\ibd\sngpres\Pitchbooks\2012\12csg\IBC
A\12csg0079\Backups\12csg0079_corner
stone.xlsx
File name: 12csg0079_cornerstone.xlsx
XL Sheet name: '20'!$D$11:$E$15
Time Stamp: 23/03/2012 22:52:33
Source: Company’s data
FY2009 FY2010 FY2011 9M ended Dec 2011
Number of customers 448 447 410 386
Number of multi-product customers 200 228 271 194
Number of customers > 3 years 75% 75% 70% 70%
Equal access and carrier-neutral strategy allows it to cultivate relationships with multiple companies in
each market in which it operates
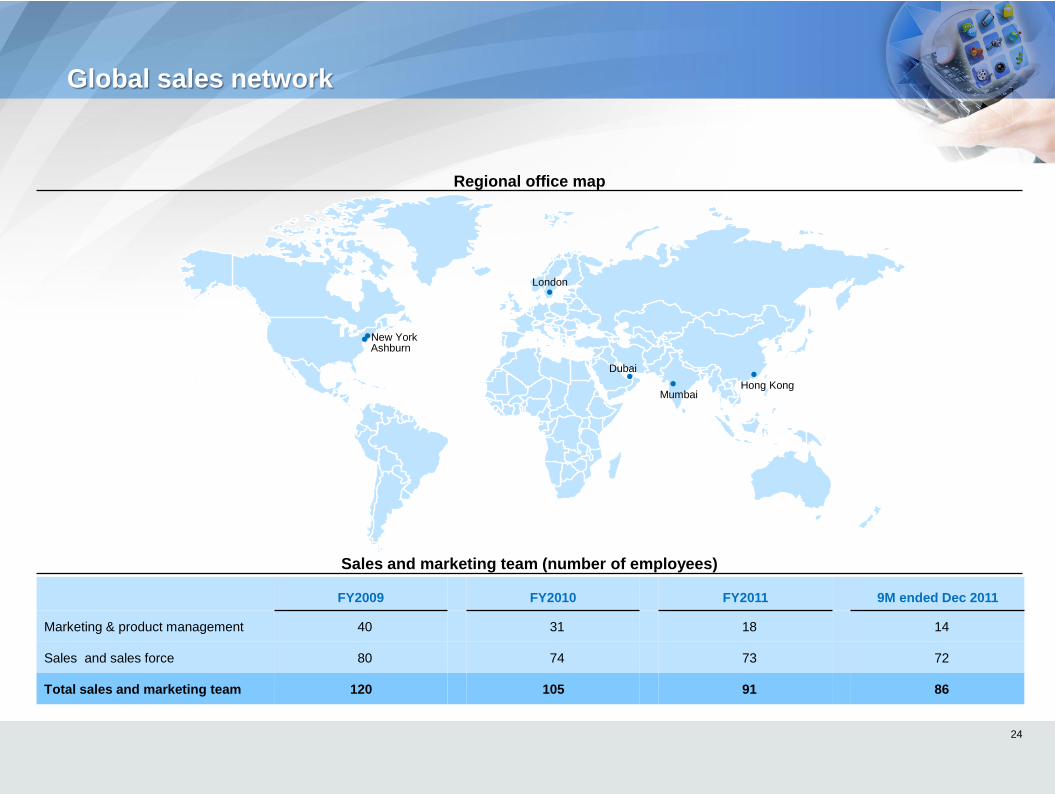
Global sales network
Regional office map
New York
Dubai
London
Hong Kong
Ashburn
24
Sales and marketing team (number of employees)
FY2009 FY2010 FY2011 9M ended Dec 2011
Marketing & product management 40 31 18 14
Sales and sales force 80 74 73 72
Total sales and marketing team 120 105 91 86
Mumbai
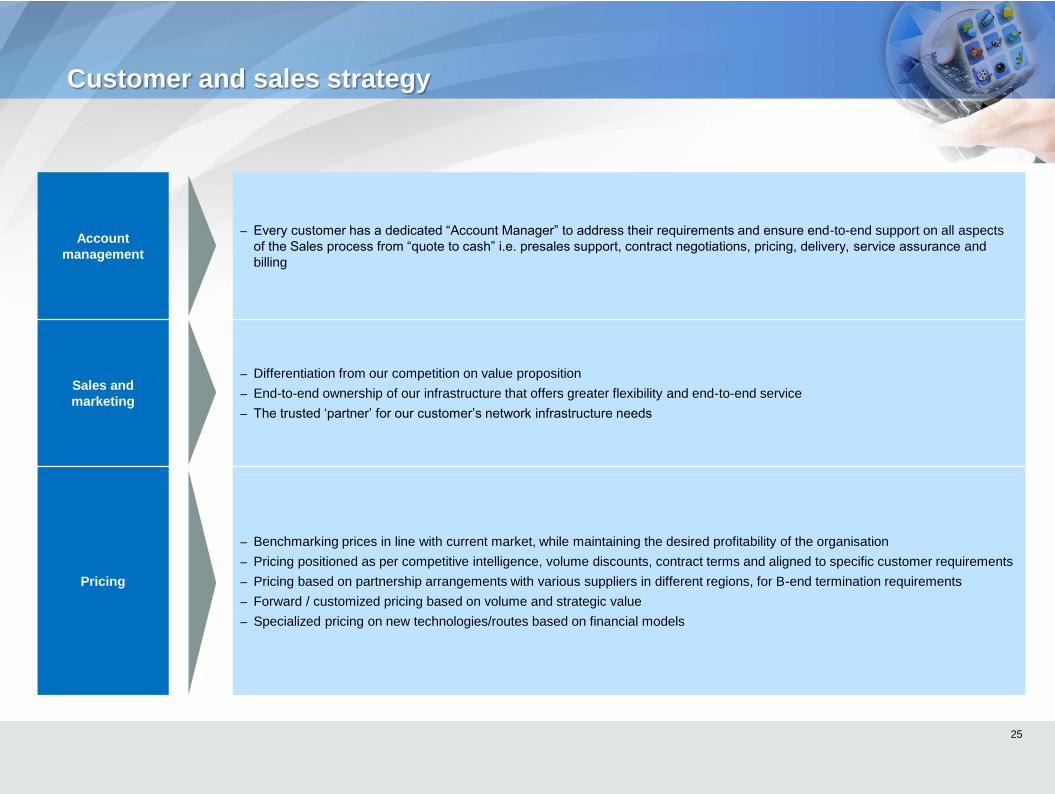
Account
management
– Every customer has a dedicated “Account Manager” to address their requirements and ensure end-to-end support on all aspects
of the Sales process from “quote to cash” i.e. presales support, contract negotiations, pricing, delivery, service assurance and
billing
Sales and
marketing
– Differentiation from our competition on value proposition
– End-to-end ownership of our infrastructure that offers greater flexibility and end-to-end service
– The trusted ‘partner’ for our customer’s network infrastructure needs
Pricing
– Benchmarking prices in line with current market, while maintaining the desired profitability of the organisation
– Pricing positioned as per competitive intelligence, volume discounts, contract terms and aligned to specific customer requirements
– Pricing based on partnership arrangements with various suppliers in different regions, for B-end termination requirements
– Forward / customized pricing based on volume and strategic value
– Specialized pricing on new technologies/routes based on financial models
Customer and sales strategy
25
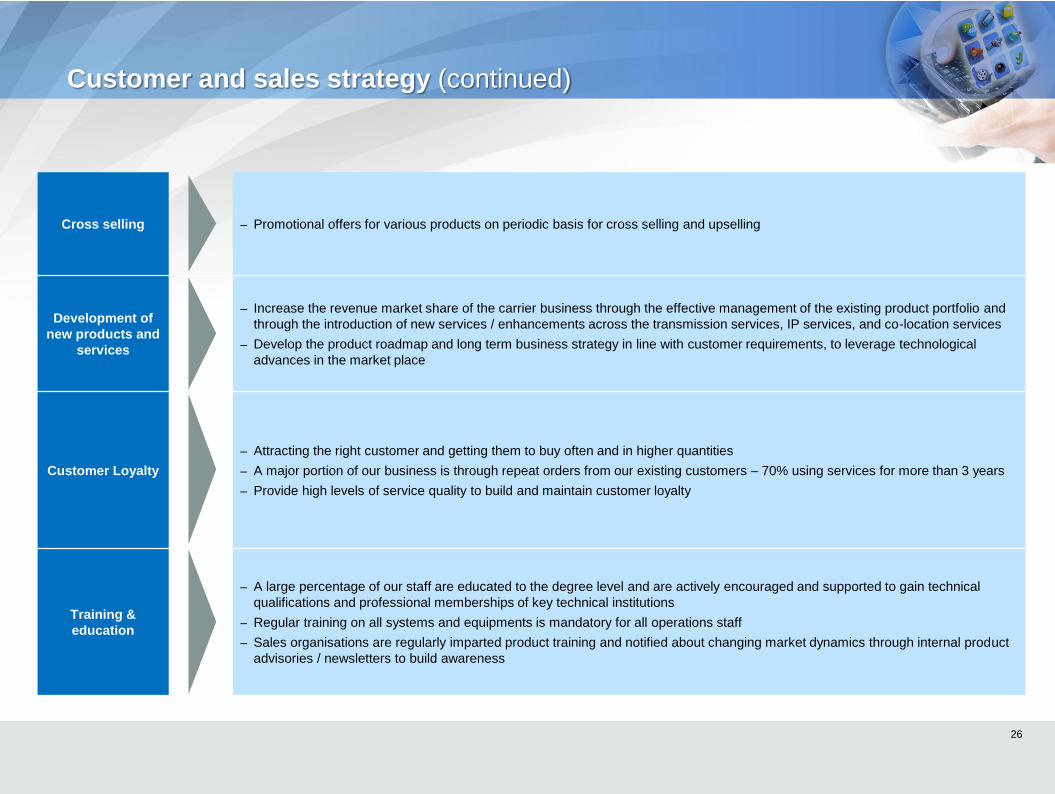
Cross selling – Promotional offers for various products on periodic basis for cross selling and upselling
Development of
new products and
services
– Increase the revenue market share of the carrier business through the effective management of the existing product portfolio and
through the introduction of new services / enhancements across the transmission services, IP services, and co-location services
– Develop the product roadmap and long term business strategy in line with customer requirements, to leverage technological
advances in the market place
Customer Loyalty
– Attracting the right customer and getting them to buy often and in higher quantities
– A major portion of our business is through repeat orders from our existing customers – 70% using services for more than 3 years
– Provide high levels of service quality to build and maintain customer loyalty
Training &
education
– A large percentage of our staff are educated to the degree level and are actively encouraged and supported to gain technical
qualifications and professional memberships of key technical institutions
– Regular training on all systems and equipments is mandatory for all operations staff
– Sales organisations are regularly imparted product training and notified about changing market dynamics through internal product
advisories / newsletters to build awareness
Customer and sales strategy (continued)
26
Investment highlights
27
Presence in key markets and global reach
High entry barriers – Cost, Time, Right of Way
Significant available capacity, low incremental upgrade costs, long useful life
High quality network, Global Ethernet enabled – Low latency IP
Strong customer relationships
4x IP traffic growth expected over next 5 years