Embed Size (px)
Citation preview
Untapped Skills RealiSing the Potential of immigRant StUdentS
iSBn 978-92-64-17229-698 2012 04 1P
Please cite this publication as:OECD (2012), Untapped Skills: Realising the Potential of Immigrant Students, OECD Publishing.http://dx.doi.org/10.1787/9789264172470-en
This work is published on the OECD iLibrary, which gathers all OECD books, periodicals and statistical databases. Visit www.oecd-ilibrary.org and do not hesitate to contact us for more information.
2012
Untapped Skills Realising the Potential of immigRant students
a country’s success in integrating immigrants’ children is a key benchmark of the efficacy of social policy in general and education policy in particular. the variance in performance gaps between immigrant and non-immigrant students across countries, even after adjusting for socio-economic background, suggests that policy has an important role to play in eliminating such gaps. Yet education policy alone is unlikely to fully address these challenges.
Untapped Skills: Realising the Potential of Immigrant Students was jointly produced by the countries participating in Pisa, the experts and institutions working within the framework of the Pisa Consortium, the oeCd directorate for education and the oeCd directorate for employment, labour and social affairs. it offers an in-depth look at the various factors, including language and socio-economic disadvantage, that can impede the full integration of immigrant students into their host societies.
Contents
Chapter 1. overview of immigration Regimes and education systems
Chapter 2. the Performance Profiles of immigrant students
Chapter 3. mastery of the assessment language and Reading outcomes
Chapter 4. immigrant students’ age at arrival and assessment Results
Chapter 5. Parental education, immigrant Concentration and Pisa outcomes
Chapter 6. Post-secondary attendance of immigrants in switzerland and Canada
the oeCd PRogRamme foR inteRnational StUdent aSSeSSment (PiSa)
Pisa focuses on young people’s ability to use their knowledge and skills to meet real-life challenges. this orientation reflects a change in the goals and objectives of curricula themselves, which are increasingly concerned with what students can do with what they learn at school and not merely with whether they have mastered specific curricular content. Pisa’s unique features include its:
– Policy orientation, which highlights differences in performance patterns and identifies features common to high-performing students, schools and education systems by linking data on learning outcomes with data on student characteristics and other key factors that shape learning in and outside of school.
– Innovative concept of “literacy”, which refers both to students’ capacity to apply knowledge and skills in key subject areas and to their ability to analyse, reason and communicate effectively as they pose, interpret and solve problems in a variety of situations.
– Relevance to lifelong learning, which goes beyond assessing students’ competencies in school subjects by asking them to report on their motivation to learn, their beliefs about themselves and their learning strategies.
– Regularity, which enables countries to monitor their progress in meeting key learning objectives.
– Breadth of geographical coverage and collaborative nature, which, in Pisa 2009, encompasses the 34 oeCd member countries and 41 partner countries and economies.
Un
tapp
ed S
kills Re
aliS
ing
th
e P
ot
en
tia
l of im
mig
Ra
nt
St
Ud
en
tS
Programme for International Student Assessment

Untapped Skills
Realising the Potential of immigRant students
PISA

The statistical data for Israel are supplied by and under the responsibility of the relevant Israeli authorities. The use of such data by the OECD is without prejudice to the status of the Golan Heights, East Jerusalem and Israeli settlements in the West Bank under the terms of international law.
Photo credits:
Getty Images © Ariel Skelley
Getty Images © Geostock
Getty Images © Jack Hollingsworth
Stocklib Image Bank © Yuri Arcurs
Corrigenda to OECD publications may be found on line at: www.oecd.org/publishing/corrigenda.
© OECD 2012
You can copy, download or print OECD content for your own use, and you can include excerpts from OECD publications, databases
and multimedia products in your own documents, presentations, blogs, websites and teaching materials, provided that suitable
acknowledgement of OECD as source and copyright owner is given. All requests for public or commercial use and translation rights
should be submitted to [email protected]. Requests for permission to photocopy portions of this material for public or commercial use
shall be addressed directly to the Copyright Clearance Center (CCC) at [email protected] or the Centre français d’exploitation du droit
de copie (CFC) at [email protected].
This work is published on the responsibility of the Secretary-General of the OECD. The opinions
expressed and arguments employed herein do not necessarily reflect the official views of
the Organisation or of the governments of its member countries.
This document and any map included herein are without prejudice to the status of or
sovereignty over any territory, to the delimitation of international frontiers and boundaries
and to the name of any territory, city or area.
Please cite this publication as: OECD (2012), Untapped Skills: Realising the Potential of Immigrant Students, OECD Publishing.
http://dx.doi.org/10.1787/9789264172470-en
ISBN 978-92-64-17229-6 (print)ISBN 978-92-64-17247-0 (PDF)

3Untapped SkillS: RealiSing the potential of immigRant StUdentS © OECD 2012
ForewordIntegrating immigrant student populations poses significant challenges to the quality and equity of education systems across OECD countries. Migration is not a new phenomenon, but ageing populations and the looming threat of labour and skill shortages have brought the issue to the top of the policy agenda in many countries. A country’s success in integrating immigrants’ children is a key benchmark of the efficacy of social policy in general and educational policy in particular. Education systems that allow all students to achieve their potential manage to combine excellence and equity.
Designing education policy to address the needs of immigrants’ children is not easy or cheap. It takes a concerted effort to try to understand what those needs are and the best ways to address them. Furthermore, what works for non-immigrant students might not work for children of immigrants. The diversity of immigrant student populations across countries signals the wide variety of challenges these students face. The variance in performance gaps between immigrant and non-immigrant students across countries, even after adjusting for socio-economic background, suggests that policy has an important role to play in eliminating such gaps.
Yet education policy alone is unlikely to fully address these challenges. For example, immigrant children’s performance in PISA is more strongly (and negatively) associated with the concentration of educational disadvantage in schools than with the concentration of immigrants per se or the concentration of students who speak a different language at home than at school. Reducing the concentration of educational disadvantage may imply changes in housing policy, to enable a more balanced social mix in schools at an early age.
This report is the product of a collaborative effort between the countries participating in PISA, the experts and institutions working within the framework of the PISA Consortium, the OECD Directorate for Education (EDU) and the OECD Directorate for Employment, Labour and Social Affairs (ELS). Georges Lemaitre from ELS and Pablo Zoido from EDU co-ordinated the work on the report. Chapter 1 was drafted by Georges Lemaitre, Guillermo Montt and Francesca Borgonovi. Chapter 2 was drafted by Pablo Zoido. Chapter 3 was drafted by Josep Mestres. Chapter 4 was drafted by Anthony Heath of the University of Oxford and Elina Kilpi-Jakonen of the Otto-Friedrich-University in Bamberg. Chapter 5 was drafted by Georges Lemaitre. Chapter 6 was drafted by Garnett Picot of Queens University and Feng Hou from Statistics Canada. Satya Brink and Stephen Wolter provided useful comments for the report. Giannina Rech provided analytical input while Marilyn Achiron, Elizabeth Del Bourgo, Juliet Evans, Marlène Mohier and Elisabeth Villoutreix provided editorial and administrative support. The development of the report was steered by the PISA Governing Board, which is chaired by Lorna Bertrand (United Kingdom).
Lorna Bertrand Chair of the PISA Governing Board
Barbara Ischinger Director for Education, OECD
John P. Martin Director for Employment, Labour and Social Affairs, OECD


5UNTAPPED SKILLS: REALISING THE POTENTIAL OF IMMIGRANT STUDENTS © OECD 2012
Table of Contents
EXECUTIVE SUMMARY ........................................................................................................................................................... 11
READER’S GUIDE .................................................................................................................................................................... 15
CHAPTER 1 OVERVIEW OF IMMIGRATION REGIMES AND EDUCATION SYSTEMS ............................................................ 17
Introduction .......................................................................................................................................................................... 18
Overview of international migration ................................................................................................................................... 18
• International migration trends in recent decades ............................................................................................................ 18
• The regulation of international migration ........................................................................................................................ 21
• The composition of international migration .................................................................................................................... 22
• The immigrant student population .................................................................................................................................. 23
Introduction to PISA ............................................................................................................................................................. 23
• The PISA surveys ........................................................................................................................................................... 23
• The PISA student population .......................................................................................................................................... 25
The prevalence of immigrant students across countries .................................................................................................... 26
The proportion of immigrant students continues to grow ................................................................................................. 27
Overview of education systems ........................................................................................................................................... 28
• The level and distribution of resources ........................................................................................................................... 28
• Managing student diversity: the selection and grouping of students across and within schools ....................................... 29
• Governance of schools .................................................................................................................................................. 30
• Assessment and accountability ....................................................................................................................................... 32
Summary and conclusions ................................................................................................................................................... 32
CHAPTER 2 THE PERFORMANCE PROFILES OF IMMIGRANT STUDENTS ........................................................................... 33
Introduction .......................................................................................................................................................................... 34
Knowledge and skills disadvantage among immigrant students ....................................................................................... 34
• Average performance ..................................................................................................................................................... 34
• Performance differences across the distribution of performance ..................................................................................... 34
• Knowledge and skills disadvantage among first- and second-generation students ........................................................... 39
Socio-economic disadvantage among immigrant students ............................................................................................... 41
• Student socio-economic background in PISA ................................................................................................................. 41
Do differences in socio-economic background account for the disadvantage in knowledge and skills? ...................... 44
• Immigrant students......................................................................................................................................................... 44
• Second-generation students ........................................................................................................................................... 44
• First-generation students ................................................................................................................................................ 44
Heterogeneity in knowledge, skills and socio-economic background ............................................................................. 45
• Performance heterogeneity of immigrant students .......................................................................................................... 47
• Socio-economic heterogeneity of immigrant students .................................................................................................... 48
Trends between PISA 2000 and PISA 2009 .......................................................................................................................... 51
• First and second-generation students ............................................................................................................................. 52
Summary and conclusions ................................................................................................................................................... 54

6 © OECD 2012 UNTAPPED SKILLS: REALISING THE POTENTIAL OF IMMIGRANT STUDENTS
TABLE OF CONTENTS
CHAPTER 3 MASTERY OF THE ASSESSMENT LANGUAGE AND READING OUTCOMES ..................................................... 55
Introduction .......................................................................................................................................................................... 56
What factors affect language proficiency? .......................................................................................................................... 56
Language exposure at home ................................................................................................................................................ 56
Language exposure at school ............................................................................................................................................... 60
• A higher concentration in schools of students who do not speak the test language at home is related to
worse outcomes for both non-immigrant and immigrant students. ...................................................................................... 60
• First- and second-generation immigrants are more likely to attend remedial language classes ......................................... 65
Summary and conclusions ................................................................................................................................................... 65
CHAPTER 4 IMMIGRANT STUDENTS’ AGE AT ARRIVAL AND ASSESSMENT RESULTS ........................................................ 67
Introduction .......................................................................................................................................................................... 68
Previous evidence on age-at-arrival penalties .................................................................................................................... 68
• Country-specific studies ................................................................................................................................................. 68
• International evidence .................................................................................................................................................... 69
Country differences in late-arrival penalties ...................................................................................................................... 70
Language and the late-arrival penalty ................................................................................................................................. 73
Age of arrival penalties and language spoken at home: A combined analysis ................................................................. 75
Summary and conclusions ................................................................................................................................................... 77
CHAPTER 5 PARENTAL EDUCATION, IMMIGRANT CONCENTRATION AND PISA OUTCOMES ........................................ 79
Introduction .......................................................................................................................................................................... 80
Educational attainment and assessment results ................................................................................................................. 84
The differential impacts of maternal attainment on outcomes ......................................................................................... 89
The effect of concentration on immigrant student outcomes ........................................................................................... 93
School disadvantage, maternal educational attainment and reading outcomes ............................................................. 96
Summary and conclusions ................................................................................................................................................... 103
CHAPTER 6 POST-SECONDARY ATTENDANCE OF IMMIGRANTS IN SWITZERLAND AND CANADA ............................... 105
Introduction .......................................................................................................................................................................... 106
Skills and knowledge at age 15 and tertiary attendance ..................................................................................................... 108
• Outcomes for the entire student population and for low performers ............................................................................... 108
• Outcomes for immigrant students and for lowest performers .......................................................................................... 108
Differences in immigration and educational systems of Canada and Switzerland .......................................................... 109
• Differences in immigration systems ................................................................................................................................ 109
• Differences in education systems ................................................................................................................................... 109
• Differences in average performance in PISA 2000 .......................................................................................................... 110
Educational attendance by immigrant background: the likelihood of attending tertiary level ....................................... 110
• Canada .......................................................................................................................................................................... 112
• Switzerland .................................................................................................................................................................... 113
Differences in outcomes by source country background .................................................................................................. 113
• Country of origin profiles in Canada and Switzerland ..................................................................................................... 113
• Canada .......................................................................................................................................................................... 113
• Switzerland .................................................................................................................................................................... 114

7UNTAPPED SKILLS: REALISING THE POTENTIAL OF IMMIGRANT STUDENTS © OECD 2012
TABLE OF CONTENTS
Access to higher education among low performers ........................................................................................................... 114
• Observed differences: A simple model without adjustments for individual characteristics (model 1) ............................... 114
• Adjusted differences: Taking into account individual characteristics (models 2 and 3) ..................................................... 114
• Differences by source region among low performers ..................................................................................................... 115
What differentiates low-performers who attend post-secondary education from those who do not? .......................... 116
Summary and conclusions ................................................................................................................................................... 117
ANNEX A TECHNICAL BACKGROUND ................................................................................................................................ 123
ANNEX B DATA TABLES ON IMMIGRANT STUDENTS......................................................................................................... 125
BOXES
Box 1.1 Key definitions: Immigrant background ................................................................................................................ 18
Box 1.2 Key features of PISA 2009 .................................................................................................................................... 24
Box 4.1 Analysing the role of language and late-arrival penalties ...................................................................................... 76
Box 5.1 Data sources and definitions ................................................................................................................................ 81
Box 5.2 Country cluster: Grouping countries by immigrant characteristics ........................................................................ 82
Box 5.3 How 15-year-olds report parental education ........................................................................................................ 86
Box 6.1 Longitudinal surveys in Canada and Switzerland: The YITS and TREE data ........................................................... 106
Box 6.2 Defining low and high performers in secondary school ....................................................................................... 107
Box 6.3 Definitions and statistical methods ....................................................................................................................... 110
FIGURES
Figure 1.1 50 years of net migration in selected OECD countries, 1959-2009 ....................................................................... 19
Figure 1.2 The foreign-born population as a percentage of the total population, 2010 .......................................................... 20
Figure 1.3 Permanent immigration into selected OECD and non-OECD countries,
total and by category of entry, 2009 .................................................................................................................... 22
Figure 1.4 Percentage of immigrant students......................................................................................................................... 26
Figure 1.5 Percentage of immigrant students in PISA 2000 and PISA 2009............................................................................ 27
Figure 1.6 How school systems allocate resources for education .......................................................................................... 29
Figure 1.7 How school systems select and group students for schools, grades and programmes ........................................... 30
Figure 1.8 How school systems are governed ....................................................................................................................... 31
Figure 2.1 Performance disadvantage of immigrant students ................................................................................................. 35
Figure 2.2 Representation of immigrant students among high and low achievers .................................................................. 36
Figure 2.3 PISA reading proficiency levels ............................................................................................................................ 37
Figure 2.4 Skills and knowledge inequality across immigrant background at the bottom of the performance distribution,
lowest performers by immigrant background ....................................................................................................... 38
Figure 2.5 Skills and knowledge inequality across immigrant background at the top of the performance distribution,
top performers by immigrant background ............................................................................................................ 39
Figure 2.6 Performance disadvantage of first- and second-generation students ..................................................................... 40
Figure 2.7 Proportion of students with low maternal education, by immigrant background ................................................... 42
Figure 2.8 Proportion of students with low maternal education, by immigrant status ............................................................ 43
Figure 2.9 Performance gap between non-immigrant students and first-generation students before and
after accounting for socio-economic background ................................................................................................. 45
Figure 2.10 The knowledge and skill disadvantage among immigrant students and diverse socio-economic status ................. 46

8 © OECD 2012 UNTAPPED SKILLS: REALISING THE POTENTIAL OF IMMIGRANT STUDENTS
TABLE OF CONTENTS
Figure 2.11 Performance dispersion among students with and without an immigrant background across OECD countries ...... 46
Figure 2.12 Inter-quartile range of performance, by immigrant background ............................................................................ 47
Figure 2.13 Relative socio-economic dispersion among immigrant students across OECD countries ....................................... 49
Figure 2.14 Prevalence, relative socio-economic dispersion, and knowledge and skills disadvantage among immigrant
students across OECD countries .......................................................................................................................... 50
Figure 2.15 Changes in performance and dispersion among immigrant students across OECD countries
between 2000 and 2009 ..................................................................................................................................... 51
Figure 2.16 Changes in mean socio-economic background, performance and dispersion among immigrant students by
country of birth.................................................................................................................................................... 52
Figure 3.1 Share of students who speak a language different from the test language at home,
by migration status ............................................................................................................................................... 57
Figure 3.2 Relationship between the share of students who speak a language different from the test language at home and
score differential .................................................................................................................................................. 57
Figure 3.3 Differential score controlling (and not controlling) if the test language is spoken at home,
by migration status ............................................................................................................................................... 58
Figure 3.4 Reading score advantage if having over 100 books at home, by migration status,
controlling for parental education and language at home ..................................................................................... 59
Figure 3.5 Differential score if attending pre-primary school for at least one year,
non-immigrants and second-generation immigrants ............................................................................................. 61
Figure 3.6 Reading scores by percentage of students in school who do not speak test language,
by migration status ............................................................................................................................................... 62
Figure 3.7 Share of students attending test language remedial classes, by migration status .................................................... 64
Figure 4.1 Estimated difference in PISA reading scores of late and mid arrivers compared to early arrivers ............................ 71
Figure 4.2 Estimated difference in PISA reading scores of non-immigrant and second-generation students
compared to early arrivers ................................................................................................................................... 72
Figure 4.3 Relationship between PISA reading score and age at arrival in selected destination countries
by immigrant origin.............................................................................................................................................. 74
Figure 5.1 Countries grouped according to certain immigrant-related characteristics ............................................................ 83
Figure 5.2 Percentage of 15-year-olds whose mother has attained at least upper secondary education ................................. 85
Figure 5.3 Mothers with at least upper secondary education, PISA vs. labour force surveys .................................................. 86
Figure 5.4 Relationship between reading performance of students and mother’s educational attainment,
by immigrant background .................................................................................................................................... 87
Figure 5.5 PISA reading scores as a function of mother’s educational attainment, selected countries .................................... 89
Figure 5.6 Differences between reading outcomes across immigrant backgrounds adjusting for mother’s education ............. 91
Figure 5.7 Average reading score by educational attainment of the mother, immigrant and non-immigrant students ............. 92
Figure 5.8 Children of immigrants in the high-concentration quartile, by various measures of concentration ........................ 94
Figure 5.9 Correlations between reading outcomes of children of immigrants and various measures of
student concentration in schools .......................................................................................................................... 96
Figure 5.10 Students by mother’s education in disadvantaged schools .................................................................................... 97
Figure 5.11 Students in disadvantaged schools from low occupation status families ................................................................ 98
Figure 5.12 Difference in scores between students in the top or bottom school disadvantage quartiles and those with
mothers who have high or low education, all students ......................................................................................... 99
Figure 5.13 Reading outcomes of students in advantaged and disadvantaged schools, by educational attainment
of mother and immigration status ......................................................................................................................... 100
Figure 5.14 Differences in reading outcomes between immigrant and non-immigrant students
adjusting for concentration of disadvantage at the school level ............................................................................ 102
Figure 6.1 Distribution of students by PISA reading level ...................................................................................................... 107

9UNTAPPED SKILLS: REALISING THE POTENTIAL OF IMMIGRANT STUDENTS © OECD 2012
TABLE OF CONTENTS
Figure 6.2 Prevalence of university attendance by age 23, by immigrant background ............................................................ 111
Figure 6.3 Factors associated with the gap in university attendance across immigrant backgrounds ...................................... 112
Figure 6.4 Prevalence of higher education attendance by age 23 among lowest performers at age 15,
by immigrant background .................................................................................................................................... 115
Figure 6.5 Prevalence of university attendance by age 23 among lowest performers at age 15,
by immigrant background .................................................................................................................................... 116
TABLES
Table B1.1 The foreign-born population aged 15 and older by country of residence and region of birth, circa 2000 .............. 126
Table B1.2 Percentage of parents of second-generation students, by age at arrival, 2008 ....................................................... 127
Table B1.3 Proportion of students, by immigrant status .......................................................................................................... 128
Table B1.4 Proportion of students, by immigrant status and language spoken at home ........................................................... 129
Table B1.5 Sampled immigrant and non-immigrant students, by test language and language spoken at home ........................ 130
Table B1.6 Percentage of immigrant students in PISA 2000 and 2009 .................................................................................... 132
Table B2.1a Student performance in reading, by immigrant status ........................................................................................... 133
Table B2.1b Student performance in mathematics, by immigrant status ................................................................................... 134
Table B2.1c Student performance in science, by immigrant status ........................................................................................... 135
Table B2.1d Proportion of immigrant students below the 25th, 50th and 75th percentile of performance among non-
immigrant students .............................................................................................................................................. 136
Table B2.1e Proportion of top performers in reading, by immigrant status ............................................................................... 137
Table B2.1f Proportion of lowest performers in reading, by immigrant status .......................................................................... 138
Table B2.2a Socio-economic background, by immigrant status ............................................................................................... 139
Table B2.2b Highest parental education, by immigrant status .................................................................................................. 140
Table B2.2c Number of books in the home, by immigrant status ............................................................................................. 141
Table B2.2d Highest parental occupational status, by immigrant status .................................................................................... 142
Table B2.2e Cultural possessions, by immigrant status ............................................................................................................. 143
Table B2.2f Home possessions, by immigrant status ............................................................................................................... 144
Table B2.2g Home educational resources, by immigrant status ............................................................................................... 145
Table B2.2h Wealth, by immigrant status ................................................................................................................................. 146
Table B2.2i Low maternal education, by immigrant status....................................................................................................... 147
Table B2.3a Standard deviation in reading performance, by immigrant status .......................................................................... 148
Table B2.3b Standard deviation in mathematics performance, by immigrant status .................................................................. 149
Table B2.3c Standard deviation in science performance, by immigrant status .......................................................................... 150
Table B2.4 Interquartile range of performance, by immigrant status ....................................................................................... 151
Table B2.5 Standard deviation in socio-economic background, by immigrant status .............................................................. 152
Table B2.6a Reading performance in PISA 2000 and 2009, by immigrant background ............................................................ 153
Table B2.6b Reading performance dispersion in PISA 2000 and 2009, by immigrant background ............................................ 154
Table B2.6c Socio-economic background in PISA 2000 and 2009, by immigrant background ................................................. 155
Table B2.6d Socio-economic dispersion in PISA 2000 and 2009, by immigrant background ................................................... 156
Table B2.6e Performance in reading and socio-economic background in PISA 2000 and 2009, second-generation students ... 157
Table B2.6f Performance in reading and socio-economic background in PISA 2000 and 2009, first-generation students ........ 158
Table B3.1 Percentage of students and reading performance, by immigrant status and language spoken at home .................. 159
Table B3.2 Performance difference in reading with non-immigrant students adjusting for mother’s educational attainment .... 162
Table B3.3 Performance difference in reading with non-immigrant students adjusting for mother’s educational attainment
and language spoken at home .............................................................................................................................. 163
Table B3.4a Differential score if attending pre-primary school for at least one year, non-immigrants and second-generation
immigrants ........................................................................................................................................................... 164
10 © OECD 2012 UNTAPPED SKILLS: REALISING THE POTENTIAL OF IMMIGRANT STUDENTS
TABLE OF CONTENTS
Table B3.4b Performance difference in reading with non-immigrant students adjusting for mother’s educational attainment,
language spoken at home and attendance to pre-primary with second-generation specific effects ....................... 165
Table B3.5 Performance difference in reading among students by immigrant background adjusting for mother’s educational
attainment, language spoken at home and number of books at home, separate regressions .................................. 166
Table B3.6 Share of individuals in a school by percentage of students who speak a language different from the
test language as main language, by migration status ............................................................................................. 169
Table B3.7 Reading scores by percentage of students in school who do not speak the test language, by migration status ....... 172
Table B3.8 Performance difference in reading of non-immigrant students adjusting for mother’s educational attainment,
language spoken at home and percentage that do not speak the test language ..................................................... 175
Table B3.9 Share of students attending test language remedial classes, by migration background ........................................... 176
Table B4.1a Age-at-arrival profiles of young people from different countries of origin .............................................................. 177
Table B4.1b Age-at-arrival profiles of young people from different countries of origin in linguistically similar countries of
destination ........................................................................................................................................................... 177
Table B4.2 Age at arrival effects for different types of immigrants in western countries .......................................................... 178
Table B4.3 Estimated PISA scores of immigrants who arrived at or before age 5 and other groups’ score differences
compared to early arrivals by country of destination ............................................................................................ 179
Table B4.4 Estimated PISA scores of immigrants who arrived at or before age 5 and other groups’ score differences
compared to early arrivals by country of destination before and after controls for parental education
and socio-economic status .................................................................................................................................. 180
Table B5.1a Prevalence and average reading performance across mother’s education, by immigrant status ............................. 182
Table B5.1b Average reading performance across mother’s education, by immigrant status ..................................................... 186
Table B5.2 Sample sizes and estimated number of students in schools having less than 20 responding students .................... 187
Table B5.3 Differences between reading outcomes of immigrant and non-immigrant students before and after adjusting
for mother’s education and immigrant-specific interaction effects ........................................................................ 188
Table B5.4 Concentration of children of immigrants in schools according to various characteristics, PISA 2009 ..................... 190
Table B5.5 Differences in reading outcomes between immigrant and non-immigrant students, adjusting for mother’s
education and concentration of disadvantage quartiles ........................................................................................ 191
Table B5.6 Correlations between reading outcomes and various measures of student concentration in schools ..................... 192
Table B5.7 Students by mother’s education in disadvantaged schools .................................................................................... 193
Table B5.8 Students in disadvantaged schools from low occupation status families ................................................................ 194
Table B5.9 Performance among students in the top or bottom school disadvantage quartiles and those with mothers with
high or low education levels, all students ............................................................................................................. 195
Table B5.10a Mean performance across mother’s educational attainment by quartile of most disadvantaged schools measured
as the proportion of students with low educated mothers .................................................................................... 196
Table B5.10b Mean performance across mother’s educational attainment by quartile of least disadvantaged schools measured
as the proportion of students with low educated mothers .................................................................................... 200
Table B6.1 Distribution of students by PISA reading performance level ................................................................................. 201
Table B6.2 Distribution of immigrant students (first- and second-generation combined) by source region .............................. 201
Table B6.3 Differences in the likelihood of pursuing a post-secondary education between immigrant students and
third-and-higher generation students, by source region ........................................................................................ 202

11UNTAPPED SKILLS: REALISING THE POTENTIAL OF IMMIGRANT STUDENTS © OECD 2012
Executive Summary
The successful integration of the children of immigrants is a key benchmark of success for social, education and migration policies.
The best way to measure how well immigrants are integrated into a society is arguably not by how their outcomes compare with those of their native-born peers, but rather by their children’s outcomes. There are always reasons to explain why adult immigrants do not do as well as native-born individuals in the labour market. For example, they may not speak the language of their new country fluently, or their qualifications or work experience obtained abroad may not be recognised, or equivalent to domestic qualifications, or adapted to what is required in the destination country. However, one would not necessarily expect such reasons to apply to immigrants’ children who were born in the country or who arrived when they were quite young and were fully, or almost fully, educated in the country of residence. This would particularly be the case if immigrant parents had the same educational attainment or, more generally, a similar socio-economic background as non-immigrant parents, on average.
In a number of countries, however, many immigrant parents have lower educational attainment than non-immigrant parents. They are also often employed in low-skilled occupations. The educational outcomes of their children have, in consequence, become a litmus test for how well education systems and indeed the broader society address social and educational disadvantage, especially for immigrant students born in the new country. Is it really possible that the fact of having immigrant parents has a stronger influence on how well someone does in life than being immersed from a very early age in a country’s society and educational institutions?
This book looks at the educational attainment of immigrant children and how it could be improved, drawing on results from the OECD Programme for International Student Assessment (PISA), which measures the performance of students at the age of 15 across the OECD and a number of other countries.
Immigrant students underperform in PISA, but the performance gap between them and non-immigrant students varies considerably across countries, even after adjusting for socio-economic differences.
For the children of immigrants, the basic outcomes in reading are well-documented, thanks to the PISA surveys. There are only a few OECD countries where reading outcomes at age 15 are similar to those of non-immigrant students; these are countries such as Australia, Canada and New Zealand, which have practiced selective immigration policies for many years and where arriving immigrants tend to be highly educated. This is also the case in Israel, which in recent decades has seen an increase in the migration of educated Jewish people from around the world, especially from Russia, and in Singapore, which has favoured and encouraged skilled migration since the 1980s. In other countries where immigrants’ children do well, the migration often occurred when these countries were part of larger states and/or had a different international status.
In most other countries, reading levels for immigrant students lag far behind those for non-immigrant students, even after controlling for parental education. As the previous PISA publication on immigrant outcomes demonstrated (OECD, 2006), it is difficult to link this empirical finding clearly to differences between countries in education policies concerning immigrant children. On the other hand, there have been significant improvements in reading outcomes in some countries since 2000, when reading was also the main assessment focus in PISA. The improvement is especially apparent in Belgium, Germany and Switzerland, and it appears to be related to changes in the composition of migration.
Language is an obstacle to school achievement for many immigrant students.
The most obvious challenge for many students with immigrant parents is adapting to a new language and a new learning environment. It is a commonly held view that young children have little difficulty in picking up a new language and one might therefore expect that this would not constitute an insurmountable or persistent barrier. However, PISA results suggest that the older a child is at arrival, the less well he or she does in reading at age 15. Also, at least as far as reading outcomes are concerned, there does not seem to a be a critical age for language learning – in other words, there is no arrival age after which there is an abrupt fall-off in performance. Moreover, some of the decline with age does not appear to be related to the language barrier itself, but rather to the fact that some students have spent significant time in an education system in the origin country with different standards, curricula, and instructional characteristics. Immigration may thus mean not only learning a new language, but also adapting to a

12 © OECD 2012 UNTAPPED SKILLS: REALISING THE POTENTIAL OF IMMIGRANT STUDENTS
EXECUTIVE SUMMARY
more demanding education system.1 The most vulnerable immigrant students would then be those who arrive at a late age, unable to speak the host country language, and from a country where education standards are weaker.2 Such students would benefit from policies and programmes that take these multiple disadvantages into account. Ignoring them may result in the marginalisation of such students at a critical age and the acceptance of poor integration prospects.
The most effective way to tackle disadvantages related to age at arrival would be to favour the earlier arrival of immigrant children whenever possible. Of course this is not something that is entirely subject to policy influence or even a matter of immigrant choice, such as when immigrants and their families are fleeing persecution or life-threatening situations. However, the results concerning the impact of age at arrival on outcomes suggest that immigrants who intend to settle or are thinking of doing so should be encouraged to bring their families over as soon as they can. Most countries have policies in place that require certain immigrants to have adequate income and housing before they can bring over their families. Such policies, intended to ensure minimum living standards for immigrant families, may delay the arrival of immigrant children and thus have the unintended consequence of delaying the acquisition of the language of instruction or of falling behind in school for certain immigrant children.
Not understanding the language of the country of residence upon arrival is a disadvantage; but so too is little exposure to that language outside school. PISA results suggest that students who mostly speak a different language at home from that which is used in school have significantly lower reading scores than those who tend to use the test language at home most of the time. This effect is very strong, accounting for a difference of about 30 points in reading scores, on average, between those who mostly speak the test language at home and those who do not, in both OECD countries and elsewhere. The performance gap is still apparent even when comparing students of similar socio-economic backgrounds. This amounts to almost a full year of schooling.
It is undoubtedly the case that current communication technologies make it substantially easier for immigrants and their families to maintain their knowledge of and familiarity with the language and culture of their country of origin much more so than used to be the case several decades ago when, for example, most television channels were in the national language and the Internet did not exist. There is thus a greater need to disseminate information to immigrant parents about the benefits of language exposure so that immigrant households do not always take the path of greater familiarity and least resistance. It is well known that the presence of reading materials in the home in the host-country language is strongly associated with better reading outcomes, and the PISA results confirm this, even when parental education and language have been taken into account.
Other lines of evidence also point to the importance of language exposure. Second-generation students in OECD countries, for example, benefit more from attending pre-primary education for at least one year than do non-immigrant students. Certain countries show nearly the same effects for both groups. Pooling results from OECD countries together suggests a sizeable additional benefit for those who speak another language at home of more than 20 points, and this also holds after taking into account the mother’s educational attainment. For those who speak the test language at home, there is no such additional benefit.
Lower performance is more strongly associated with a higher concentration of socio-economic disadvantage than with a higher concentration of immigrants or foreign-language speakers.
PISA data also show a heavy concentration of immigrants in schools with students who mostly speak another language at home. On average across OECD countries, some 15% of immigrant students are in schools where more than 40% of students mostly speak another language at home, and some 40% are in schools where more than 20% of students mostly speak another language. If this does not necessarily imply that they speak another language among themselves at school, it nevertheless does place students whose reading performance is weakest together in the same schools, which is surely not a good basis for improving overall outcomes. This raises larger questions regarding the concentration of immigrants in schools, an issue that is considered further in this report.
Most education systems provide language learning and remedial reading classes for children of immigrants. No doubt these help to improve and accelerate language acquisition, but the scale of the remaining difference in outcomes among those who mostly speak another language at home compared with those who do not, suggests that current language and reading programmes may need to be reinforced, especially at earlier ages when their impact is greatest. Policy obviously cannot impose the use of the host-country language in the home environment, but it needs to ensure that the host-country language can better compete for the attention and interest of immigrant children. Parents clearly have a role to play in this and should be encouraged to expose their children to national-language publications and media at home.

13UNTAPPED SKILLS: REALISING THE POTENTIAL OF IMMIGRANT STUDENTS © OECD 2012
EXECUTIVE SUMMARY
Some education and social policies have different effects on immigrants and non-immigrants.
If high educational attainment among parents seems the most likely explanation for the favourable outcomes of immigrant children in the selective immigration countries noted above, poor parental education seems to be an inadequate explanation, by itself, for the unfavourable outcomes of immigrant students observed in many other countries. Indeed, adjusting for parental educational seems to explain at best 25% of the difference between the outcomes of immigrant and non-immigrant students. Differences in parental education also fail to explain why, in some cases, second-generation students do not perform as well as first-generation students. Nonetheless, parental educational attainment is significant for student reading outcomes and is a factor that policy may not be able to change, but can at least mediate.
To a certain extent, all education systems depend upon or are characterised by parental assistance with schoolwork, which clearly places poorly educated families at a disadvantage that increases as the student progresses through the education system. The generally lower reading outcomes of students with poorly educated mothers are undoubtedly associated with less of an inclination and, for some, an inability to read to their children and assist them with reading tasks, whether associated with schoolwork or in general. While this is not an issue specific to immigrant students, it is magnified by the especially low attainment levels of some immigrant parents. Compensatory policies, such as tutoring and other out-of-class assistance, need to be introduced or reinforced. Policies targeted at parents, both to support them and enhance their engagement with schools, are also appropriate in this context.3
But parental attainment levels alone cannot explain immigrant students’ outcomes, suggesting that something else is at play. In many countries, the impact of higher parental attainment levels is weaker among immigrant than among non-immigrant children. One simply does not observe the same level of positive association between reading achievement and parental attainment as one observes among non-immigrant children. This does not appear to be related to the language spoken at home, nor does it seem to reflect the educational qualifications of immigrant parents, which are effectively, if not formally, lower than those from domestic institutions.
What one does observe, however, is that immigrant children with highly-educated mothers – as well as those with mothers with lower levels of education – are over-represented in disadvantaged schools. In addition, the differences in reading performance between disadvantaged schools and the most advantaged schools are large in many countries, mostly cancelling out any gains that are associated with high parental attainment. Education policy and funding rarely compensate for this disadvantage, as formulas tend to be based on the number of students and programmes. Quality resources, such as highly educated teachers, tend to be concentrated in more socio-economically advantaged schools. Indeed, the concentration of immigrant students in disadvantaged schools is a more powerful explanatory factor for outcomes than either immigrant concentration in schools or the proportion of immigrant students who speak another language at home.
The social and economic phenomena that lead to the concentration of disadvantage in certain geographic areas, which include private housing prices, thus have a powerful effect on reading outcomes, for both immigrant and non-immigrant students. With immigrant populations, which are more skewed towards disadvantage than non-immigrant populations in many countries, the concentration effect for immigrants is magnified. What is unexpected, however, is the presence of so many immigrant children of highly educated mothers in disadvantaged schools. This seems to be correlated with the fact that they come from families with low-status occupations and lower incomes, despite high maternal educational attainment. Low occupational status may result when qualifications or work experience are not recognised or considered equivalent, because of a language barrier, or because of discrimination in the hiring process, which is found in practically all countries to a greater or lesser extent. Technical occupations, such as teaching, nursing or healthcare, where women are generally over-represented compared to men, are also professions where accreditation is a factor for immigrant mothers. It seems unlikely that the high concentration of immigrant students in disadvantaged schools, particularly of those whose parents are highly educated, is a consequence of parental choice alone.
Countries whose education systems tend to have a stronger concentration of disadvantaged students, where low-cost housing is segregated and immigrant populations are generally less educated would appear to be part of a social dynamic that generally, if not inexorably, leads to poor outcomes for immigrant children. Some countries seem to be able to avoid this, among them the United Kingdom and the United States, but the reasons are not obvious.
Focus on language, concentration of disadvantage and the concerns specific to immigrant families.
What can reverse or attenuate these poor outcomes for immigrant children? The first thing to note is that although there are success stories among immigrant students coming from disadvantaged schools, the average outcomes are generally unsatisfactory. The problem is difficult to tackle, because it appears to be as much structural as a consequence of weak or less-than-adequate policies.

14 © OECD 2012 UNTAPPED SKILLS: REALISING THE POTENTIAL OF IMMIGRANT STUDENTS
EXECUTIVE SUMMARY
Short of making large-scale changes in housing policies that would ensure a better social mix in schools, the less-favourable outcomes of many immigrant students need to be addressed through education policies.
The three key elements stand out:
• Language-learning policies need to be reinforced, both for very young immigrant children and for those students who arrive later with little knowledge of the host-country language. Relying too heavily on the “natural” language-learning ability of young children or on the assumption that a basic level of language proficiency is sufficient will not yield satisfactory results. Children may learn quickly, but not to the level required to progress adequately in school. The language skills of parents, particularly of mothers, may not be sufficient to allow them to assist their children in their schoolwork. The objective needs to be more exposure to the host-country language, both in and out of school. This is especially the case in the Internet age when media in the language of the country of origin are more present in immigrant households than they ever used to be. Parents need to be sensitised to this so that the home environment contributes to improving outcomes.
• The adverse effects of the concentration of disadvantage need to be reduced. The policy choices here are difficult. There is the option of investing more heavily in disadvantaged schools, without attempting to change the extent of concentration. The expectation is that education policy measures, whether in the form of better teachers, smaller classes or more remedial help, can indeed improve outcomes, even under unfavourable conditions. But this is a costly option. A different policy choice would involve attempting to reduce the degree of concentration through housing or school-choice policies, options that are likely, however, to be more difficult and controversial to implement. All things being equal, a more balanced social mix in schools would go a long way towards improving outcomes for both immigrant and non-immigrant students from disadvantaged backgrounds. The first to benefit would be the numerous immigrant students with highly educated parents in disadvantaged schools whose performance is much poorer compared to their peers in schools where there is less concentration of disadvantage. All of these policies would need to be implemented early on in the school trajectory, before immigrant children fall too far behind.
• Social phenomena and education policies may have specific effects on immigrants beyond those observed among non-immigrants. The impact of the concentration of disadvantage, for example, seems to be more severe among immigrant students than non-immigrant students. The weaker relationship between reading performance and parental education levels, and the greater benefits of attending pre-school for immigrant students who largely speak another language at home, compared with those who do not, are two more examples. This suggests that analyses of immigrant-related phenomena must not only adjust for differences in characteristics between immigrant and non-immigrant students, but must also focus on differences in the impact of social phenomena or policies. Integration means that everyone has the opportunity to achieve his or her potential. It would appear that, in some cases, the route taken is not always the same, a difference that policy makers need to consider more closely.
Notes
1. In some cases, migration may be from a country where standards are higher, which would imply a late-arrival premium rather than a penalty.
2. Both educational standards and student performance tend to rise with economic development.
3. A new PISA Thematic Report to be published in 2012 focusing on parental involvement will explore these issues in more depth.
References
OECD (2006), Where Immigrant Students Succeed – A Comparative Review of Performance and Engagement in PISA 2003, OECD Publishing.

15UNTAPPED SKILLS: REALISING THE POTENTIAL OF IMMIGRANT STUDENTS © OECD 2012
Reader’s Guide
DATA UNDERLYING THE FIGURESThe data referred to in this volume are presented in Annex B and, in greater detail, on the PISA website (www.pisa.oecd.org).
Five symbols are used to denote missing data:
a The category does not apply in the country concerned. Data are therefore missing.
c There are too few observations or no observation to provide reliable estimates (i.e. there are fewer than 30 students or less than five schools with valid data).
m Data are not available. These data were not submitted by the country or were collected but subsequently removed from the publication for technical reasons.
w Data have been withdrawn or have not been collected at the request of the country concerned.
x Data are included in another category or column of the table.
COUNTRY COVERAGEThis publication features data on 65 countries and economies, including all 34 OECD countries and 31 partner countries and economies.
The statistical data for Israel are supplied by and under the responsibility of the relevant Israeli authorities. The use of such data by the OECD is without prejudice to the status of the Golan Heights, East Jerusalem and Israeli settlements in the West Bank under the terms of international law.
CALCULATING INTERNATIONAL AVERAGESAn OECD average was calculated for most indicators presented in this report. The OECD average corresponds to the arithmetic mean of the respective country estimates. In the case of some indicators, a total representing the OECD area as a whole was also calculated.
Where the focus is on comparing performance across education systems, the OECD average is used. In the case of some countries, data may not be available for specific indicators, or specific categories may not apply. Readers should, therefore, keep in mind that the terms “OECD average” refer to the OECD countries included in the respective comparisons.
ROUNDING FIGURESBecause of rounding, some figures in tables may not exactly add up to the totals. Totals, differences and averages are always calculated on the basis of exact numbers and are rounded only after calculation.
All standard errors in this publication have been rounded to one or two decimal places. Where the value 0.00 is shown, this does not imply that the standard error is zero, but that it is smaller than 0.005.
REPORTING STUDENT DATAThe report uses “15-year-olds” as shorthand for the PISA target population. PISA covers students who are aged between 15 years 3 months and 16 years 2 months at the time of assessment and who have completed at least 6 years of formal schooling, regardless of the type of institution in which they are enrolled and of whether they are in full-time or part-time education, of whether they attend academic or vocational programmes, and of whether they attend public or private schools or foreign schools within the country.
REPORTING SCHOOL DATAThe principals of the schools in which students were assessed provided information on their schools’ characteristics by completing a school questionnaire. Where responses from school principals are presented in this publication, they are weighted so that they are proportionate to the number of 15-year-olds enrolled in the school.

16 © OECD 2012 UNTAPPED SKILLS: REALISING THE POTENTIAL OF IMMIGRANT STUDENTS
READER’S GUIDE
FOCUSING ON STATISTICALLY SIGNIFICANT DIFFERENCESThis report discusses only statistically significant differences or changes. These are denoted in darker colours in figures and in bold font in tables. See Annex A of OECD (2010), PISA 2009 Results: What Students Know and Can Do (Volume I), PISA, OECD Publishing, for further information.
CATEGORISING STUDENT PERFORMANCEThis report uses a shorthand to describe students’ levels of proficiency in the subjects assessed by PISA:
Top performers are those students proficient at Levels 5 and 6 of the assessment
Strong performers are those students proficient at Level 4 of the assessment
Moderate performers are those students proficient at Levels 2 and 3 of the assessment
Lowest performers are those students proficient at Level 1 or below of the assessment
ABBREVIATIONS USED IN THIS REPORT
ESCS PISA index of economic, social and cultural status
GDP Gross domestic product
ISCED International Standard Classification of Education
ISEI International socio-economic index of occupational status
PPP Purchasing power parity
S.D. Standard deviation
S.E. Standard error
FURTHER DOCUMENTATIONFor further information on the PISA assessment instruments and the methods used in PISA, see the PISA 2009 Technical Report (OECD, 2012) and the PISA website (www.pisa.oecd.org).

17UNTAPPED SKILLS: REALISING THE POTENTIAL OF IMMIGRANT STUDENTS © OECD 2012
Different immigration and education policies across countries shape the context in which the children of immigrants strive to learn. History, international treaties and domestic immigration policy are all factors which have influenced and continue to influence the immigrant intake in a particular country. Education systems differ in the way they distribute resources and establish system-wide and school-level policies. The following overview of the context in which children of immigrants learn is intended to provide a frame of reference for the evidence and results discussed in subsequent chapters.
Overview of Immigration Regimes and Education Systems
1

18 © OECD 2012 UNTAPPED SKILLS: REALISING THE POTENTIAL OF IMMIGRANT STUDENTS
OVERVIEW OF IMMIGRATION REGIMES AND EDUCATION SYSTEMS1
INTRODUCTIONThe Programme for International Student Assessment (PISA) tests 15-year-old students at school across countries. Some of these students and/or their parents were not born in the country of assessment. It is they who are the focus of this report. Some of these students speak a language at home different from that of the PISA assessment. Box 1.1 categorises students who participated in PISA across immigrant backgrounds and provides key definitions used in this report.
This chapter first reviews recent trends in international migration, describing the size of current foreign-born populations across countries and presenting elements associated with the size and nature of these populations. The chapter then reviews a set of important differences and similarities across national educational systems. It ends with a brief overview of population sizes across countries.
OVERVIEW OF INTERNATIONAL MIGRATION
International migration trends in recent decadesIn part because of aging and demographic decline, international migration has jumped up the policy agenda in many countries across the globe in recent decades, but it is hardly a new phenomenon. The post-World War II years saw large movements of workers crossing borders to fill jobs for which there were not enough domestic workers in many European countries. At the same time, the traditional settlement countries of Australia, Canada, New Zealand and the United States resumed admission of immigrants from across the oceans, which had been interrupted by the two world wars and the Great Depression. Workers arrived from countries across the globe, as the settlement countries abandoned former restrictive policies, sometimes based on geographic origin.
The seventies oil crisis put a stop to labour migration in many countries, as economies adjusted to higher energy prices. But migration as a whole did not stop. Many workers stayed on, bringing over their families from abroad. Others fled their homelands in the wake of civil wars and political persecution. The transfer of wealth to the Gulf States transformed them into magnets for workers moving to take on jobs in oil production, construction, commerce and domestic help. More than a decade later, the fall
Box 1.1 Key definitions: Immigrant background
PISA 2009 asked students to report the country where they and their parents were born. The countries or country groups identified vary by assessment country. All countries differentiate between the country of assessment and other countries. In some cases, a list of countries was provided. For example, among OECD countries, Australia, Austria, Belgium, Denmark, Luxembourg, New Zealand and Switzerland all had at least three options (specific countries or regions) in addition to “other country”.
This report distinguishes between immigrant and non-immigrant students based on the information reported by students on the country of origin of both their parents. If both of the student’s parents were born in a country other than the country where the student sat the PISA test, the student is classified as an immigrant student. Non-immigrant students are the remainder, that is, students who have at least one parent who was born in the country where the student took the assessment.
Among immigrant students, the report distinguishes between first- and second-generation students based on the information they reported on their own country of birth. Second-generation students are immigrant students born in the country of assessment (where they sat the PISA test). First-generation students are foreign-born, like their parents.
While this categorisation of students is useful for analysis, it hides some variation across family characteristics, age of arrival or countries of origin. For example, non-immigrant students include students with one parent born abroad or students who are themselves foreign-born but have at least one parent who was born in the country of assessment. Immigrant students vary by country of origin, as do their parents, sometimes even within the same family. For example, families may include children born both abroad and in the country. First-generation students vary according to the age they arrived in the country.
Another important dimension of variation among immigrant students is the language they speak at home. PISA asked students to report whether or not the language they mostly speak at home was the same as the language in which they were assessed by PISA, which is always the language of instruction. It is therefore possible to distinguish between immigrant students who mostly speak the assessment language at home and those who do not.

19UNTAPPED SKILLS: REALISING THE POTENTIAL OF IMMIGRANT STUDENTS © OECD 2012
OVERVIEW OF IMMIGRATION REGIMES AND EDUCATION SYSTEMS1
of the Iron Curtain ushered in a new era of international migration, as barriers to out-migration, if not to immigration, came down almost everywhere. In addition, economic globalisation created needs and opportunities for workers, both skilled and lesser skilled, in new centres of development, production and growth, such as Korea, Thailand, Malaysia, Singapore, China and India.
At the same time, most former OECD emigration countries became immigration countries, showing immigration rates (before the economic crisis) that were on average as large as those of traditional OECD immigration countries (Figure 1.1). Such countries are thus being faced with new challenges, in both their educational systems and their labour markets, which they have not had to face before in a significant way.
By 2010, foreign-born individuals as a percentage of the total population reached an average of about 14% for countries participating in PISA 2009 and 11% for OECD countries (Figure 1.2). These averages over countries mask a considerable variability in immigrant prevalence. In Israel the size of the foreign-born population reaches 40%, Luxembourg follows with 35% and in Switzerland, New Zealand, Australia and Canada it ranges from 21% to 23%. Ireland with 20% and Austria with 16% are also above the OECD average. Spain, Sweden, Estonia, the United States and Germany are all near the OECD average. In contrast, Mexico, Korea, Japan, Turkey, Chile, Poland and the Slovak Republic have foreign born populations at less than 2% (Table B1.2).
Among partner countries and economies, some countries have negligible numbers of immigrants in percentage terms, such as Indonesia, Tunisia and most Latin American countries. At the other end of the spectrum are countries such as Dubai (UAE) and Qatar, where the immigrant population is almost as large if not larger than the native-born population, and countries or regions which have been involved in border changes, break-ups or changes in international status, such as the republics of former Yugoslavia and the Soviet Union and Macao- and Hong Kong-China. In the countries of former Yugoslavia, the foreign-born populations largely consist of individuals from other republics of the former country who had migrated (internally) before the break-up. In the former republics of the Soviet Union, such as Estonia, Latvia, Kyrgyzstan and Kazakhstan, immigrants are often ethnic Russians who attend Russian-language schools in those countries. Immigrants in Macao- and Hong Kong-China are mostly ethnic Chinese from the rest of China. Many immigrants in the Czech Republic are from the Slovak Republic. Most immigrants from Hungary are ethnic Hungarians who have “returned” to Hungary from their homes in the Slovak Republic, Romania and Serbia. All of these countries are included in the analyses of this publication, sample sizes permitting, with the cautionary note that much of the international migration in these cases does not bear all of the hallmarks usually associated with the cross-border movement of populations with ethnic, cultural and linguistic backgrounds different from those of the destination country. Table B1.5, which shows the assessment
• Figure 1.1 • 50 years of net migration in selected OECD countries, 1959-2009
-0.2
-0.1
0
0.1
0.2
0.3
0.4
0.5
1956 1961 1966 1971 1976 1981 1986 1991 1996 2001 2006
Net migration as a percentage of the total resident population
Emigration countries Immigration countries All countries Trendline (All countries)
Note: Immigration countries include Australia, Austria, Belgium, Canada, France, Germany, Luxembourg, the Netherlands, New Zealand, Sweden, Switzerland, the United Kingdom and the United States. Emigration countries include the Czech Republic, Denmark, Finland, Iceland, Italy, Norway, the Slovak Republic, Japan, Greece, Hungary, Ireland, Poland, Portugal and Spain. Korea, Mexico and Turkey are out of the scope of the study for data availability reasons.
Source: OECD (2011), Labour Force Statistics.

20 © OECD 2012 UNTAPPED SKILLS: REALISING THE POTENTIAL OF IMMIGRANT STUDENTS
OVERVIEW OF IMMIGRATION REGIMES AND EDUCATION SYSTEMS1
• Figure 1.2 • The foreign-born population as a percentage of the total population, 2010
Indonesia
Peru
Colombia
Tunisia
Brazil
Romania
Bulgaria
Thailand
Uruguay
Trinidad and Tobago
Albania
Azerbaijan
Panama
Argentina
Lithuania
Kyrgyzstan
Serbia
Montenegro
Russian Federation
Latvia
Croatia
Kazakhstan
Liechtenstein
Hong Kong-China
Singapore
Jordan
Macao-China
Dubai (UAE)
Qatar
Mexico
Korea
Japan
Turkey
Chile
Poland
Slovak Republic
Hungary
Finland
Czech Republic
Italy
Slovenia
Portugal
Denmark
Belgium
Norway
Greece
United Kingdom
Netherlands
France
Iceland
Germany
United States
Estonia
Sweden
Spain
Austria
Ireland
Canada
Australia
New Zealand
Switzerland
Luxembourg
Israel
Part
ners
OEC
D
0 10 20 30 40 50 60 70 80 90 100%
Countries are ranked ascending order of the percentage of the foreign-born population.
Source: United Nations (2011), Trends in International Migrant Stock.
21UNTAPPED SKILLS: REALISING THE POTENTIAL OF IMMIGRANT STUDENTS © OECD 2012
OVERVIEW OF IMMIGRATION REGIMES AND EDUCATION SYSTEMS1
languages for each country and the percentage of immigrants assessed in each language who speak a different language at home, gives an illuminating view of the nature of migration movements in the countries assessed in PISA. In some countries immigrants are assessed in a language which is not the main language of the native-born population.
The regulation of international migrationIn any particular country, the size and composition of the immigrant population are determined by international treaties and country-specific immigration policies and practices. International migration movements are extremely diverse and have tended to be regulated since the beginning of the 20th century. The regulation of migration affects the composition and skill-level of immigrant populations across countries, but it would be an exaggeration to assume that the link is always strong. Governments do not necessarily even have full control over legal movements because, among other reasons, of past decisions concerning particular types of migration. For example, many movements are subject to international agreements or treaties, and governments generally cannot restrict such movements without reneging on the treaties. Examples of such treaties are free-mobility regimes in certain regions, such as the free-circulation regime for the citizens of European Union member countries, the Trans-Tasman Travel Arrangement between Australia and New Zealand, or the MERCOSUR Agreement on the Free Movement of Persons and Residence between the countries of the southern cone of South America.
Likewise many governments have signed the Geneva Convention, which requires that they examine requests for asylum by people arriving or present in the country or country’s territory and grant refugee status to those satisfying the criteria defined in the convention. Those not satisfying the criteria in principle must return to their country of origin.
Most governments also recognise the right of residents to live with their families or to marry or adopt whom they want. There may be restrictions on the arrival of family migrants, such as minimum income levels or adequate lodgings, but these cannot be made overly restrictive without calling into the question the commitment of countries to the rights in question.
All of these describe situations in which governments have limited discretionary authority over the nature and composition of movements, and ultimately on the nature of the immigrant student populations as a result of these movements. Free-circulation regimes, for example, may not always be between countries with similar wage and education levels, with the consequence that significant movements of lesser-skilled migrants may occur from lower- to higher-wage countries. Likewise, refugee movements from some developing countries may involve and indeed have involved at times populations of extreme educational disadvantage.
Labour migration and immigration policy
Labour migration, on the other hand, tends to be discretionary in nature, that is, governments define the conditions of entry and stay and, in principle, have full discretion to increase or decrease the flows as they wish. Movements are often restricted, either through numerical limits or by assessments of whether local labour is available, both to ensure political acceptability and to avoid adverse wage and employment effects on resident workers.
The education or skill level of labour migrants can and is often regulated by governments, whether the labour migrants are recruited directly by employers (demand-driven migration) or are selected by the national administration on the basis of an assessment of their characteristics and deemed aptitude to integrate into the labour market and society of the destination country (supply-driven migration). Most OECD governments have tended to favour highly skilled labour migration over recent decades, not the least because their labour market outcomes and contribution to the economy have generally been far more favourable than for lesser-skilled migration. At the same time, the children of such migrants have tended to have better educational outcomes than the children of lesser-skilled migrants. While highly skilled migration has been preferred by almost all countries, the scale of such migration has varied considerably across countries.
It is essentially only in the settlement countries of Australia, Canada and New Zealand that discretionary labour migration was significant in numbers until approximately the mid 1990s, when Ireland and the United Kingdom also began opening up to skilled labour migration. This was also the case in Singapore since the 1980s and in Israel, with the migration of highly educated Russian Jewish people in the 1990s. In most other countries, highly skilled labour migration remained low in proportional terms and lower-skilled humanitarian and family migration predominated, even if education levels were generally increasing for immigrants from developing countries as well. It is hardly a coincidence that students of immigrant parents in the countries where there has been significant highly skilled migration generally have had favourable reading outcomes. In other countries, this is less often observed although, as will be seen, there are factors other than low parental educational attainment alone which influence outcomes in these countries.
The extent of discretionary skilled labour migration in countries would appear to be about the only facet of migration policy regimes which seems to be useful in explaining immigrant student reading outcomes. Other categorisations of countries according to their migration history or policy, such as whether or not they had guest-worker regimes in the 1960s and 1970s, colonial pasts or were important destination countries for refugee populations, may well have affected the composition of migration in these countries, but have not proven useful in distinguishing countries from each other with respect to the reading outcomes of immigrant students.

22 © OECD 2012 UNTAPPED SKILLS: REALISING THE POTENTIAL OF IMMIGRANT STUDENTS
OVERVIEW OF IMMIGRATION REGIMES AND EDUCATION SYSTEMS1
The countries of southern Europe constitute an interesting example, because they are among the countries which have seen very high levels of labour migration over the past 15 years. However, the education levels of immigrant parents have not been especially high, although they have not been substantially different from those of its (older) working-age population. Despite this, the PISA reading outcomes of immigrant children in these countries have not been especially favourable.
Other aspects of migration policy can affect the migration of family members and in particular of immigrant students. Historically, not all immigrants have been allowed to bring in their families at the same time they themselves migrated, nor have their spouses necessarily been allowed to work. Family reunification continues to be subject to certain conditions in most countries, in particular the requirement of adequate income and lodgings. In practice, these requirements may delay family reunification and the arrival of immigrant children in the educational systems of destination countries. By contrast, highly skilled migrants are normally allowed, and indeed in many countries encouraged, to come with their families from the beginning.
The composition of international migrationFor both historical and policy reasons, the scale and nature of international migration movements differ from country to country. Figure 1.3 gives an indication of this variability across OECD countries for a recent year (2009), showing both the relative importance of permanent migration and the distribution by category of entry. These statistics show immigration for a given year, that is immigration flows, as opposed to Figure 1.2, which shows the extent of the entire immigrant population. Note that most of the large countries in Figure 1.3 have relatively low immigration rates, even if the absolute numbers of immigrants in these countries may seem large. Free circulation has become an important category of entry for many European countries, although it was less so prior to the enlargement of the European Union (EU) in 2004. Labour migration (excluding free-circulation movements) tends to be a minority phenomenon in almost all countries and the number of people entering under this category is generally smaller than those entering as family migrants.
• Figure 1.3 • Permanent immigration into selected OECD and non-OECD countries,
total and by category of entry, 2009
0
0.2
0.4
0.6
0.8
1
1.2
1.4
1.6
Japan
Russia
n Fed
eratio
n
German
y
Franc
eKo
rea
Finlan
d
Belgium
United
State
s
Austri
a
Netherl
ands
Portu
gal
OECD av
erag
eIta
ly
United
King
dom
Denmark
Spain
Canad
a
Swed
en
Irelan
d
Norway
Austra
lia
New Z
ealan
d
Switz
erlan
d
WorkAccompanying family of workersFamily Free movementHumanitarianOther
Percentage of the total population
Countries are ranked in ascending order of the percentage of the total population.
Source: OECD (2011).
23UNTAPPED SKILLS: REALISING THE POTENTIAL OF IMMIGRANT STUDENTS © OECD 2012
OVERVIEW OF IMMIGRATION REGIMES AND EDUCATION SYSTEMS1
The extent of discretionary labour migration tends to understate the impact of this form of migration, however. Spouses of migrants tend to have educational attainment levels that are similar to those of the migrants, and tend to transmit their educational situation to their children. In practice, this means that the impact of relatively modest labour migration regimes can be much greater than the actual size of a labour migration programme might lead one to believe. The selective migration countries of Australia, Canada and New Zealand, for example, tend to include accompanying family members in their statistics when they cite the relative importance of their skilled migration programmes. Although it is generally only the labour migrants who are directly settled, from the point of view of impact, it is undoubtedly the entire family which is the relevant group. Including family members of skilled labour migrants in the statistics for these countries raises the share of this group to over 60% of annual entries.
Migration movements tend to be strongly influenced by current migration policies but also by previous migration waves, which in turn may reflect the colonial history of the country, as is the case of Belgium, France, Netherlands and the United Kingdom. Table B1.1 provides circa 2000 statistics on the geographic origin of immigrants, for those PISA-assessed countries for which such data are readily obtainable from the most recent Census. This is not a recent year, but nonetheless provides a good overview of both the scale of international migration over recent decades, as well as its composition by continent and by OECD and non-OECD countries.
OECD countries are the origin countries of about 44% of all immigrants in OECD countries, but represent only 8% of all immigrants among the partner countries shown. Immigrants in European countries are generally European in origin, but there are significant populations from Africa in certain countries, in particular France and Portugal and to a lesser extent in Belgium, Italy, the Netherlands, Spain and the United Kingdom. Asia is strongly represented in Scandinavia, the Netherlands and the United Kingdom, but also in the settlement countries of Australia, Canada and New Zealand as well as in Japan. Migration in Latin America is heavily intra-regional, but also to the United States and Spain. In most countries, there is substantial diversity in origin countries, with more than 100 origin countries represented, but also often strong representation from a more limited number of countries (Table B1.1).
The immigrant student populationThe children of immigrants may be immigrants themselves, having arrived with their parents or having been brought over some time later (first-generation students in PISA), or they may have been born in the country (second-generation students in PISA). First-generation immigrants may have arrived as adults or may have themselves entered the country when young and been largely educated in the country. Second-generation 15-year-old students in 2009 will generally have mothers roughly aged between 33 and 60, which means that they were born between 1949 and 1976. As immigrants, they must have entered the country in a year between their own birth and that of their PISA-assessed offspring in 1994, which provides for a rather broad range of possibilities. By contrast the mothers of first-generation students would only have entered the country as adults after 1994.
In practice then, second generation students may be a rather heterogeneous group, some being similar to first-generation students who arrived when quite young and some having parents who have been largely educated in the country of residence and thus more akin to children of the native-born.
Table B1.2 gives some indication of this diversity for a number of countries, using data for 13-17-year-olds from labour force surveys. It can be seen that the “older” migration countries tend to show more children of immigrants with parents who themselves arrived in the country when they were young. This is far less the case for recent migration countries such as Italy, Spain and Greece. It would be instructive to be able to distinguish between these different groups in practice. The better performance of second-generation students, which one generally observes in most countries, may well correspond to the fact that their parents in many cases may have been educated in the host country.
INTRODUCTION TO PISA
The PISA surveysAre students well prepared to meet the challenges of the future? Can they analyse, reason and communicate their ideas effectively? Have they found the kinds of interests they can pursue throughout their lives as productive members of the economy and society? The OECD Programme for International Student Assessment (PISA) seeks to answer these questions through its triennial surveys of key competencies of 15-year-old students in OECD member countries and partner countries/economies. Together, the group of countries participating in PISA represents nearly 90% of the world economy.1
PISA assesses the extent to which students near the end of compulsory education have acquired some of the knowledge and skills that are essential for full participation in modern societies, with a focus on reading, mathematics and science.
PISA has now completed its fourth round of surveys. Following the detailed assessment of each of PISA’s three main subjects – reading, mathematics and science – in 2000, 2003 and 2006, the 2009 survey marks the beginning of a new round with a return to a focus on reading, but in ways that reflect the extent to which reading has changed since 2000, including the prevalence of texts in digital form.
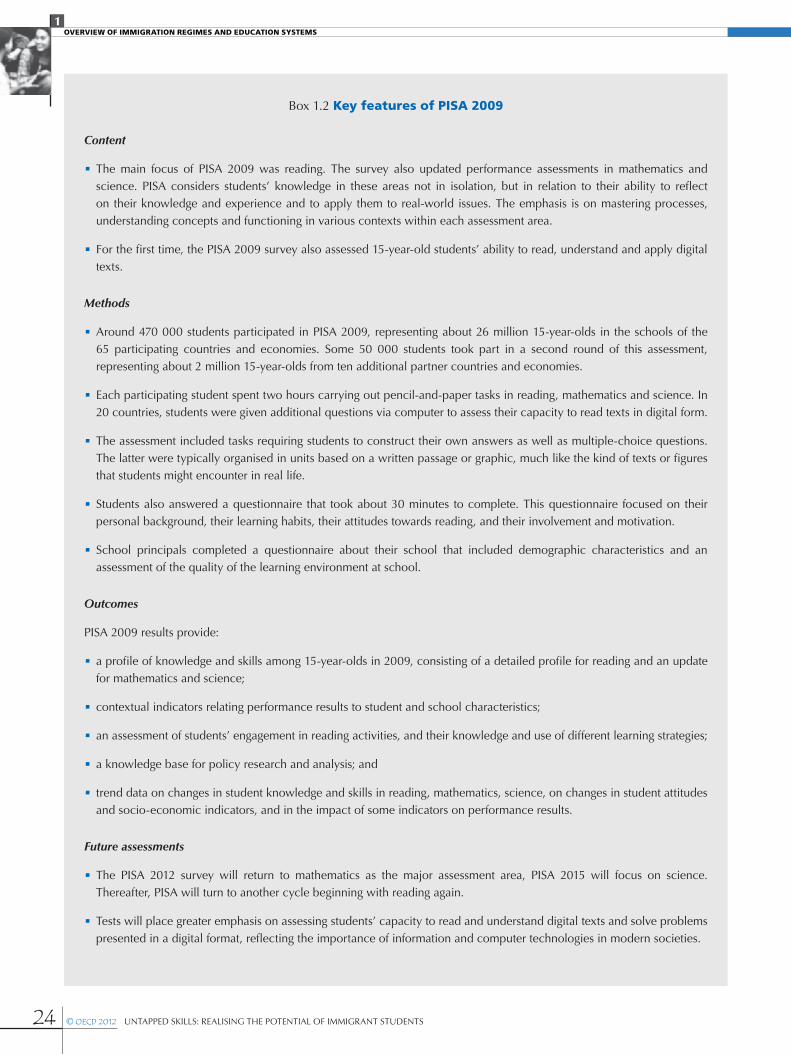
24 © OECD 2012 UNTAPPED SKILLS: REALISING THE POTENTIAL OF IMMIGRANT STUDENTS
OVERVIEW OF IMMIGRATION REGIMES AND EDUCATION SYSTEMS1
Box 1.2 Key features of PISA 2009
Content
• The main focus of PISA 2009 was reading. The survey also updated performance assessments in mathematics and science. PISA considers students’ knowledge in these areas not in isolation, but in relation to their ability to reflect on their knowledge and experience and to apply them to real-world issues. The emphasis is on mastering processes, understanding concepts and functioning in various contexts within each assessment area.
• For the first time, the PISA 2009 survey also assessed 15-year-old students’ ability to read, understand and apply digital texts.
Methods
• Around 470 000 students participated in PISA 2009, representing about 26 million 15-year-olds in the schools of the 65 participating countries and economies. Some 50 000 students took part in a second round of this assessment, representing about 2 million 15-year-olds from ten additional partner countries and economies.
• Each participating student spent two hours carrying out pencil-and-paper tasks in reading, mathematics and science. In 20 countries, students were given additional questions via computer to assess their capacity to read texts in digital form.
• The assessment included tasks requiring students to construct their own answers as well as multiple-choice questions. The latter were typically organised in units based on a written passage or graphic, much like the kind of texts or figures that students might encounter in real life.
• Students also answered a questionnaire that took about 30 minutes to complete. This questionnaire focused on their personal background, their learning habits, their attitudes towards reading, and their involvement and motivation.
• School principals completed a questionnaire about their school that included demographic characteristics and an assessment of the quality of the learning environment at school.
Outcomes
PISA 2009 results provide:
• a profile of knowledge and skills among 15-year-olds in 2009, consisting of a detailed profile for reading and an update for mathematics and science;
• contextual indicators relating performance results to student and school characteristics;
• an assessment of students’ engagement in reading activities, and their knowledge and use of different learning strategies;
• a knowledge base for policy research and analysis; and
• trend data on changes in student knowledge and skills in reading, mathematics, science, on changes in student attitudes and socio-economic indicators, and in the impact of some indicators on performance results.
Future assessments
• The PISA 2012 survey will return to mathematics as the major assessment area, PISA 2015 will focus on science. Thereafter, PISA will turn to another cycle beginning with reading again.
• Tests will place greater emphasis on assessing students’ capacity to read and understand digital texts and solve problems presented in a digital format, reflecting the importance of information and computer technologies in modern societies.
25UNTAPPED SKILLS: REALISING THE POTENTIAL OF IMMIGRANT STUDENTS © OECD 2012
OVERVIEW OF IMMIGRATION REGIMES AND EDUCATION SYSTEMS1
PISA 2009 offers the most comprehensive and rigorous international measurement of student reading skills to date. It assesses not only reading knowledge and skills, but also students’ attitudes and their learning strategies in reading. PISA 2009 updates the assessment of student performance in mathematics and science as well.
The assessment focuses on young people’s ability to use their knowledge and skills to meet real-life challenges. This orientation reflects a change in the goals and objectives of curricula themselves, which are increasingly concerned with what students can do and what they learn at school and not merely whether they have mastered specific curricular content. PISA’s unique features include its:
• Policy orientation, which connects data on student learning outcomes with data on students’ characteristics and on key factors shaping their learning in and out of school in order to draw attention to differences in performance patterns and to identify the characteristics of students, schools and education systems which have high performance standards.
• Innovative concept of “literacy”, which refers to the capacity of students to apply knowledge and skills in key subject areas and to analyse, reason and communicate effectively as they pose, interpret and solve problems in a variety of situations.
• Relevance to lifelong learning, which does not limit PISA to assessing students’ competencies in school subjects, but also asks them to report on their own motivations to learn, their beliefs about themselves and their learning strategies.
• Regularity, which enables countries to monitor their progress in meeting key learning objectives.
• Breadth of geographical coverage and collaborative nature. PISA 2009 covers the 34 OECD member countries and 40 partner countries and economies.2
The relevance of the knowledge and skills measured by PISA is confirmed by studies tracking young people in the years after they have been assessed by PISA. Longitudinal studies in Australia, Canada and Switzerland display a strong relationship between performance in reading on the PISA 2000 assessment at age 15 and future educational attainment and success in the labour-market (see Volume I, Chapter 2).3
The frameworks for assessing reading, mathematics and science in 2009 are described in detail in PISA 2009 Assessment Framework: Key Competencies in Reading, Mathematics and Science (OECD, 2010a).
Decisions about the scope and nature of the PISA assessments and the background information to be collected are made by leading experts in participating countries. Governments guide these decisions based on shared policy-driven interests. Considerable efforts and resources are devoted to achieving cultural and linguistic breadth and balance in the assessment materials. Stringent quality-assurance mechanisms are applied in designing the test, in translation, sampling and data collection. As a result, PISA data tend to be of high statistical quality.
PISA findings are useful in gauging the knowledge and skills of students in one country in comparison with those in other countries, especially the highest performing countries. They are also of use in assessing the pace of educational progress, through the possibility of contrasting performance changes observed nationally with those seen elsewhere. In a growing number of countries, PISA is used to set policy targets in terms of measurable goals achieved by other systems, and to initiate research and peer-learning designed to identify appropriate policy levers to improve educational outcomes. While it is difficult with PISA data to identify cause-and-effect relationships between inputs, processes and educational outcomes, they can highlight the key features common to education systems or by which they differ, making the findings available to educators, policy makers and the general public.
The PISA student populationIn order to ensure the comparability of the results across countries, PISA devoted a great deal of attention to assessing comparable target populations. Differences between countries with respect to the nature and extent of pre-primary education and care, the age of entry to formal schooling, and the structure of the education system make it difficult to define school grade levels so that they are internationally comparable. PISA instead defines its population with reference to a specific target age, namely students who are aged between 15 years 3 months and 16 years 2 months at the time of the assessment and who have completed at least six years of formal schooling, regardless of the type of institution in which they are enrolled, whether they are in full-time or part-time education, whether they attend academic or vocational programmes, and whether they attend public or private schools or foreign schools within the country. (For an operational definition of this target population, see the PISA 2009 Technical Report [OECD, 2012].) Using a set age in PISA, across countries and over time, allows the performance of students to be compared in a consistent manner, prior to the upper age limit for compulsory education.
Stringent technical standards were established to define the national target populations and to identify permissible exclusions from this definition (for more information, see the PISA website www.pisa.oecd.org). The overall exclusion rate within a country was required to be below 5% to ensure that, under reasonable assumptions, any distortions in national mean scores would remain within plus or minus 5 score points, i.e. typically within the order of magnitude of two standard sampling errors (see PISA 2009 Results Volume I, Annex A2 [OECD, 2010b]). Exclusion could take place either at the school or student level. There are several reasons why
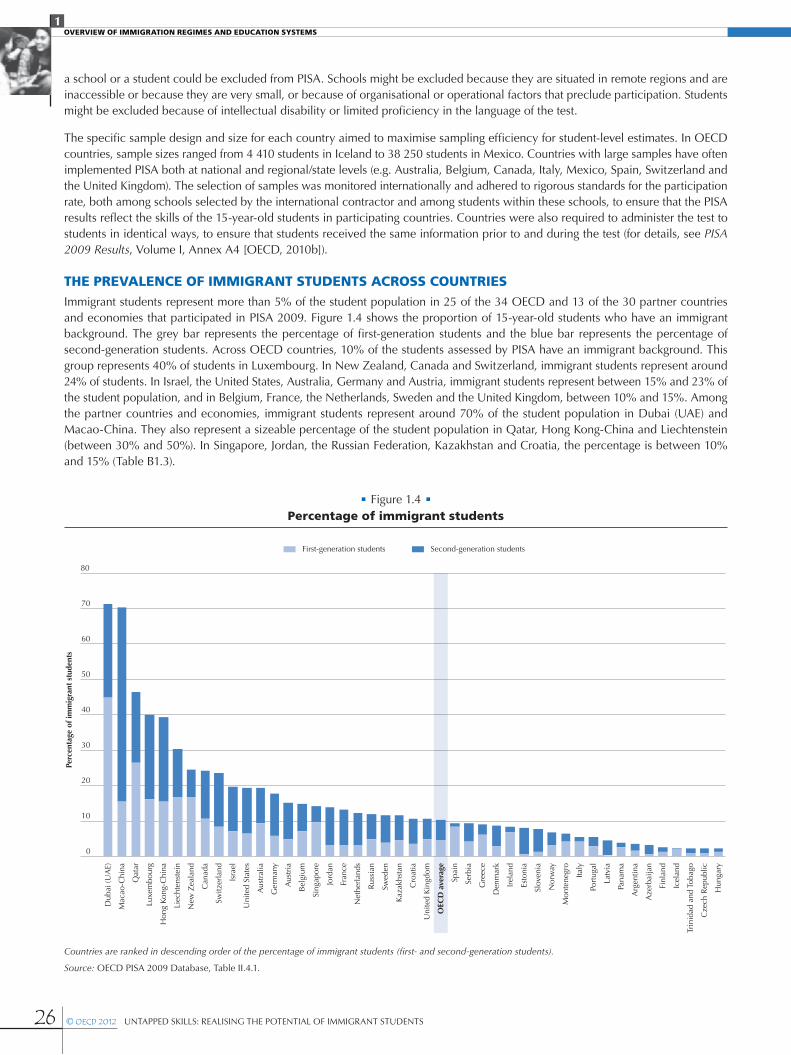
26 © OECD 2012 UNTAPPED SKILLS: REALISING THE POTENTIAL OF IMMIGRANT STUDENTS
OVERVIEW OF IMMIGRATION REGIMES AND EDUCATION SYSTEMS1
a school or a student could be excluded from PISA. Schools might be excluded because they are situated in remote regions and are inaccessible or because they are very small, or because of organisational or operational factors that preclude participation. Students might be excluded because of intellectual disability or limited proficiency in the language of the test.
The specific sample design and size for each country aimed to maximise sampling efficiency for student-level estimates. In OECD countries, sample sizes ranged from 4 410 students in Iceland to 38 250 students in Mexico. Countries with large samples have often implemented PISA both at national and regional/state levels (e.g. Australia, Belgium, Canada, Italy, Mexico, Spain, Switzerland and the United Kingdom). The selection of samples was monitored internationally and adhered to rigorous standards for the participation rate, both among schools selected by the international contractor and among students within these schools, to ensure that the PISA results reflect the skills of the 15-year-old students in participating countries. Countries were also required to administer the test to students in identical ways, to ensure that students received the same information prior to and during the test (for details, see PISA 2009 Results, Volume I, Annex A4 [OECD, 2010b]).
THE PREVALENCE OF IMMIGRANT STUDENTS ACROSS COUNTRIESImmigrant students represent more than 5% of the student population in 25 of the 34 OECD and 13 of the 30 partner countries and economies that participated in PISA 2009. Figure 1.4 shows the proportion of 15-year-old students who have an immigrant background. The grey bar represents the percentage of first-generation students and the blue bar represents the percentage of second-generation students. Across OECD countries, 10% of the students assessed by PISA have an immigrant background. This group represents 40% of students in Luxembourg. In New Zealand, Canada and Switzerland, immigrant students represent around 24% of students. In Israel, the United States, Australia, Germany and Austria, immigrant students represent between 15% and 23% of the student population, and in Belgium, France, the Netherlands, Sweden and the United Kingdom, between 10% and 15%. Among the partner countries and economies, immigrant students represent around 70% of the student population in Dubai (UAE) and Macao-China. They also represent a sizeable percentage of the student population in Qatar, Hong Kong-China and Liechtenstein (between 30% and 50%). In Singapore, Jordan, the Russian Federation, Kazakhstan and Croatia, the percentage is between 10% and 15% (Table B1.3).
• Figure 1.4 • Percentage of immigrant students
0
10
20
30
40
50
60
70
80
Dub
ai (U
AE)
Mac
ao-C
hina
Qat
ar
Luxe
mbo
urg
Hon
g Ko
ng-C
hina
Liec
hten
stei
n
New
Zea
land
Can
ada
Switz
erla
nd
Isra
el
Uni
ted
Stat
es
Aus
tral
ia
Ger
man
y
Aus
tria
Bel
gium
Sing
apor
e
Jord
an
Fran
ce
Net
herl
ands
Rus
sian
Swed
en
Kaz
akhs
tan
Cro
atia
Uni
ted
Kin
gdom
OEC
D a
vera
ge
Spai
n
Serb
ia
Gre
ece
Den
mar
k
Irel
and
Esto
nia
Slov
enia
Nor
way
Mon
tene
gro
Italy
Port
ugal
Latv
ia
Pana
ma
Arg
entin
a
Aze
rbai
jan
Finl
and
Icel
and
Trin
idad
and
Tob
ago
Cze
ch R
epub
lic
Hun
gary
Perc
enta
ge o
f im
mig
rant
stu
dent
s
Second-generation studentsFirst-generation students
Countries are ranked in descending order of the percentage of immigrant students (first- and second-generation students).
Source: OECD PISA 2009 Database, Table II.4.1.

27UNTAPPED SKILLS: REALISING THE POTENTIAL OF IMMIGRANT STUDENTS © OECD 2012
OVERVIEW OF IMMIGRATION REGIMES AND EDUCATION SYSTEMS1
First-generation students represent 4.8% of the student population across OECD countries. However they represent more than 10% of the 15-year-old student population in Australia, Canada, Luxembourg, New Zealand and in the partner countries and economies of Dubai (UAE), Hong-Kong China, Liechtenstein, Macao-China and Qatar. Second-generation students represent a larger share of the student population – 6.2% across OECD countries – and in many countries represent sizeable minorities. Second-generation students represent more than 10% of the student population in Australia, Austria, Canada, France, Germany, Israel, Luxembourg, Switzerland and the United States among OECD countries and in Dubai (UAE), Hong-Kong China, Jordan, Liechtenstein, Macao-China and Qatar among partner countries and economies. In most countries second-generation students represent a larger proportion of students than first-generation students, reflecting established migration histories. In other countries, first-generation students represent the majority. First-generation students represent more than 50% of immigrant students in Spain, Chile, Shanghai-China, Ireland, Iceland, Italy, Romania, Greece, New Zealand, Singapore, Panama, Dubai (UAE), Montenegro, Mexico, Hungary, Qatar, Bulgaria, Finland, Liechtenstein, Uruguay, Japan, and Portugal (Table B1.3).
THE PROPORTION OF IMMIGRANT STUDENTS CONTINUES TO GROWBased on information gathered from questionnaires distributed with the PISA 2009 assessment, the percentage of 15-year-old immigrant students grew by two percentage points, on average, between 2000 and 2009 among OECD countries with comparable data (Figure 1.5). In Ireland, New Zealand, Spain, the United States, and the partner countries Liechtenstein and the Russian Federation, the percentage of immigrant students increased by five percentage points or more over the past decade, and these students now represent from 8% to 30% of these countries’ student populations. In Italy, Greece and Canada, the percentage of immigrant students increased by three to five percentage points over the same period. Nearly 25% of Canada’s student population has an immigrant background.
• Figure 1.5 • Percentage of immigrant students in PISA 2000 and PISA 2009
0
5
10
15
20
25
30
35
40
45
Perc
enta
ge o
f im
mig
rant
stu
dent
s
Hon
g Ko
ng-C
hina
Liec
hten
stei
n
New
Zea
land
Can
ada
Switz
erla
nd
Aus
tral
ia
Isra
el
Uni
ted
Stat
es
Ger
man
y
Bel
gium
Fran
ce
Rus
sian
Fed
erat
ion
Swed
en
Spai
n
Gre
ece
Den
mar
k
Irel
and
Nor
way
Italy
Port
ugal
Latv
ia
Arg
entin
a
Finl
and
Icel
and
Cze
ch R
epub
lic
Hun
gary
Mex
ico
Bra
zil
Alb
ania
Bul
gari
a
Chi
le
Peru
Rom
ania
Japa
n
Indo
nesi
a
Pola
nd
– + + + + 0 – + 0 0 0 + 0 + + + + + + + – 0 + + + 0 – + 0 0 0 0 0 0 0 –
20092000
Change in the percentage of immigrant students between 2000 and 2009
2009 higher than 2000 2009 lower than 2000 No statistically significant difference
95% confidence level + – 0
Countries are ranked in descending order of the percentage of immigrant students in 2009.
Source: Table B1.6.

28 © OECD 2012 UNTAPPED SKILLS: REALISING THE POTENTIAL OF IMMIGRANT STUDENTS
OVERVIEW OF IMMIGRATION REGIMES AND EDUCATION SYSTEMS1
OVERVIEW OF EDUCATION SYSTEMSEducation systems are charged with the task of teaching students and ensuring that they learn according to the standards and expectations set in each country. This is a particularly complex task because of the resources involved, the size and the diversity of the student population and because although standards and expectations may be determined at central levels, learning eventually takes place in the classrooms of many schools scattered around each country.
To accommodate the complexity of educating a large and diverse student population, school systems face at least four distinct and relevant issues that determine the organisation and character of the education system. These issues are: i) defining the level of resources to invest and how they are distributed across the school system ; ii) determining how to deal with the diversity in interests, abilities and backgrounds of the student population; iii) determining how individual schools are governed; and iv) evaluating the progress of their students and schools and motivating them.
PISA results show that the choices school systems make with respect to these issues have an impact on the average performance of students, but also on their dispersion, which concerns inequities in the distribution of learning opportunities available to students. Performance is a measure of students’ cognitive achievement, and a country’s average performance is an important benchmark against which to compare the quality of its education system. Equity, on the other hand refers to the degree to which student performance is related to students’ economic, social and cultural backgrounds. In more equitable school systems, educational success tends to more independent of students’ socio-economic, cultural or linguistic background.
Due to the particular needs of immigrant students, the distribution of resources, the differentiation of students and the governance of schools may affect the level and quality of the opportunities to learn available to these students.
This overview draws on PISA 2009 Results: What Makes a School Successful (Volume IV) (OECD, 2010c) which offers a categorisation of school systems across these organisational dimensions. The organisation of school systems, even at the highest level in the hierarchy, eventually influences what happens in the classroom, that is students’ (including immigrant students) exposure to opportunities to learn and their scholastic performance.
The level and distribution of resourcesCountries must decide on the level of resources to invest in education and how to distribute them. The decision on the distribution of resources hinges on deciding whether all students will be offered the same opportunities or whether students who have lower educational achievement are offered more resources in order to compensate for socio-economic, cultural or linguistic disadvantages. In general, effective school systems require the right combination of trained and talented personnel, adequate educational resources and facilities and motivated students ready to learn.
Countries must decide not only on the level of monetary resources to invest in education, but also where these resources will be invested in terms of learning time (in the classroom, in pre-primary institutions, and in extra-curricular learning and activities), human resources (number of teachers, teacher salaries and class size) and material resources (building and instructional infrastructure).
At the level of individual students, in practically all countries students who have attended pre-primary schools for more than one year tend to have higher reading performance. At the school level, higher student scores tend to be related to more learning time in mathematics and science, and the availability of better educational resources. PISA results also shows that the association between school resources and schools’ performance is also largely related to schools’ socio-economic intake. In other words, high socio-economic status students usually enjoy a higher level of educational resources than low socio-economic status students. Therefore school resources may be an important mediator through which the socio-economic background of students and schools affects performance.
At the system level with respect to resources, high-performing school systems tend to prioritise higher salaries for teachers over smaller classes. OECD countries can be grouped into four categories, depending on the amount of resources they invest and the spending choices they make (Figure 1.6). Countries may invest relatively small or large amounts of resources in education, and each of these countries may choose to focus this investment on factors such as teachers’ salaries or smaller class sizes. In general, high-performing countries spend more than USD 35 000 per student from ages 6 to 15, but the level of expenditure above this level is unrelated to performance or equity. Most OECD countries prioritise smaller class sizes: the Czech Republic, Estonia, Greece, Hungary, Israel, New Zealand, Poland, Portugal, the Slovak Republic and Turkey spend relatively less on education than the average OECD country and focus these limited resources on smaller class sizes. Australia, Austria, Belgium, Canada, Denmark, Finland, France, Germany, Iceland, Ireland, Italy, Luxembourg, the Netherlands, Norway, Slovenia, Spain, Sweden, Switzerland, the United Kingdom and the United States spend more on education and also focus resources on smaller classes. Only four OECD countries prioritise teachers’ salaries: two of these countries, Mexico and Chile, spend relatively small amounts on education and two, Japan and Korea, invest relatively large amounts in education.

29UNTAPPED SKILLS: REALISING THE POTENTIAL OF IMMIGRANT STUDENTS © OECD 2012
OVERVIEW OF IMMIGRATION REGIMES AND EDUCATION SYSTEMS1
Managing student diversity: the selection and grouping of students across and within schoolsThe educational task of school systems is particularly complex given the diversity of student populations. Students vary not only with respect to their age, but also with respect to their interests, abilities and socio-economic, cultural and linguistic background. Governments must decide how they manage this diversity and many choose either to adopt a comprehensive approach to student diversity or differentiate students to create homogeneous learning environments. While the latter opt for similarity in the classroom to cater teaching to students’ academic potential and/or interests in specific programmes, comprehensive schools seek to provide all students with similar opportunities, leaving it to each teacher and school to provide for the full range of student abilities, interests and backgrounds. In comprehensive school systems immigrant students are more likely to share the classroom and the school with non-immigrant students, as well as with both high- and low-achieving students. Depending on the perceived academic potential and interests of the immigrant student population and immigrant sub-groups, in school systems that differentiate, immigrant students may tend to be concentrated in particular schools through the selection practices of students into schools, through school transfers or by the establishment of different types of educational programmes (academic or vocational/technical programmes for example) which may differentiate students into different schools or into different tracks/streams within schools.
When analysing the academic outcomes of students it is important to bear in mind how students are grouped into schools, grades and classrooms. Figure 1.7 categorises school systems in PISA by how they sort students into schools and classrooms and how they differentiate students with different academic potential and interests. Among OECD countries, Australia, Canada, Denmark, Estonia, Finland, Greece, Iceland, New Zealand, Norway, Poland, Sweden, the United Kingdom and the United States (and Kazakhstan, Latvia, Lithuania and the Russian Federation among partner countries) adopt more comprehensive approaches to schooling, implying that students of different academic potential and interests attend the same schools and, generally, the same classrooms. Other school systems, differentiate students across schools, selecting students at an early age into schools with different educational programmes, for example (as is the case in Austria, the Czech Republic, Hungary, the Slovak Republic in the OECD, as well as in Croatia, Liechtenstein and Singapore). Other school systems, in turn, homogenise schools and classrooms by transferring students with behavioural or low academic achievement and/or retaining students that fail to meet the grade’s standards (Spain, Chile, Argentina, Brazil, Colombia, Tunisia, Peru and Uruguay, for example).
• Figure 1.6 • How school systems allocate resources for education
Czech Republic, Estonia,** Hungary, Greece, Israel, New Zealand,* Poland,* Portugal, Slovak Republic, Turkey,
Albania, Argentina, Azerbaijan, Bulgaria, Croatia, Dubai (UAE), Kazakhstan, Kyrgyzstan, Latvia,
Liechtenstein, Lithuania, Montenegro, Panama, Peru, Qatar, Romania, Russian Federation, Serbia,
Tunisia, Trinidad and Tobago, Uruguay
Chile, Mexico, Brazil, Colombia,
Hong Kong-China,** Jordan, Indonesia,
Macao-China, Shanghai-China,* Singapore,*
Chinese Taipei, Thailand
Australia,* Austria, Belgium,* Canada,**
Denmark, Finland,** France, Germany, Iceland,**
Ireland, Italy, Luxembourg, Norway,** Netherlands,*
Slovenia, Spain, Sweden, Switzerland,*
the United Kingdom, United States
Japan,** Korea*
Cumulative expenditure
by educational institutions
per students aged 6 to 15:
39 463
Cumulative expenditure
by educational institutions
per students aged 6 to 15:
81 238
Low
cumulative
expenditure on
education
High
cumulative
expenditure on
education
Small class size and/or low teacher salaries Large class size and high teacher salaries
Class size for the language of instruction: 23 Class size for the language of instruction: 36
Teacher salary relative to GDP/capita1: 118 Teacher salary relative to GDP/capita1: 172
* Perform higher than the OECD average in reading.
** Perform higher than the OECD average in reading and have the relationship between students’ socio-economic background and reading performance weaker than the OECD average.
Note: The estimates in the grey cells indicate the average values of the variables used in latent profile analysis in each group. See Annex A5 in PISA 2009 Initial Results: What Makes a School Successful (Volume IV) for technical details.
1. This is the weighted average of upper and lower secondary teachers. The average is computed with weighting teacher salaries for upper and lower secondary education according to the respective 15-year-old students enrolment (for countries with valid information on both if 15-year-old students are both at the upper and lower secondary schools).
Source: OECD (2010c), Figure IV.3.7.

30 © OECD 2012 UNTAPPED SKILLS: REALISING THE POTENTIAL OF IMMIGRANT STUDENTS
OVERVIEW OF IMMIGRATION REGIMES AND EDUCATION SYSTEMS1
PISA results show that school systems that track students at an early age tend to show a stronger impact of socio-economic background on learning outcomes, signalling larger socio-economic inequalities which may affect immigrant students if they generally have lower socio-economic status or tend to be selected in specific educational programmes. PISA results also show that school systems that are underpinned by a philosophy that all students can succeed and commit to having all students succeed (e.g. school systems with low grade-repetition, low transfer rates and low prevalence of ability grouping within schools) tend to show better student performance and a weaker impact of socio-economic background on learning outcomes. Selective schools perform at higher levels than non-selective schools, but a system as a whole does not benefit from having more selective schools.
Because PISA assesses students when they are 15-years-old, they may have been in school for a different number of years (given the different ages of entry into primary school in different countries), or be in different educational levels (i.e. lower or upper secondary school given the curricular organisation of the school). As a result, students assessed in PISA attend a wide variety of grades and may be in lower or upper secondary schools in different countries. PISA does not assess curricular content but the ability of students to apply knowledge to everyday-life situations. As a result, PISA scores are less sensitive to the fact that 15-year-old students in one country may be in different grade levels or ISCED levels than performance assessments that are curriculum-based.
Governance of schoolsAnother important organisational feature of school systems is the extent to which parents and students can choose the school they attend and the degree to which schools are considered autonomous entities that make organisational decisions independently of district, regional or national entities. Since the early 1980s, educational reforms in many countries have intended to improve the
• Figure 1.7 • How school systems select and group students for schools, grades and programmes
Australia,* Canada,** Denmark, Estonia,**
Finland,** Greece, Iceland,** New Zealand,* Norway,**
Poland,* Sweden, United States, United Kingdom, Kazakhstan,
Latvia, Lithuania, Russian Federation
Jordan Spain, Argentina, Brazil,Tunisia, Uruguay
Chile, Colombia, Peru
Low vertical differentiation High vertical differentiation
Students who repeated one or more grades: 7%Students out of modal starting ages: 7%
Students who repeated one or more grades: 29%Students out of modal starting ages: 11%
Low horizontal differentiation
at the school level
High horizontal differentiation
at the school level
Low horizontal differentiation
at the school level
High horizontal differentiation
at the school level
Schools that transfer students to other schools due to low achievement, behavioural
problems or special learning needs: 15%
Schools that transfer students to other schools due to low achievement, behavioural
problems or special learning needs: 33%
Schools that transfer students to other schools due to low achievement, behavioural
problems or special learning needs: 15%
Schools that transfer students to other schools due to low achievement, behavioural
problems or special learning needs: 33%
Schools that group students by ability in all subjects: 8%
Schools that group students by ability in all subjects: 38%
Schools that group students by ability in all subjects: 8%
Schools that group students by ability in all subjects: 38%
Low horizontal
differentiation at
the system level
Medium
horizontal
differentiation at
the system level
High
horizontal
differentiation at
the system level
Number of school typesor distinct educational
programmes: 1.1First age of selection: 15.8
Selective schools: 17%
Number of school typesor distinct educational
programmes: 3.0First age of selection: 14.5
Selective schools: 42%
Number of school typesor distinct educational
programmes: 4.3First age of selection: 11.2
Selective schools: 61%
Ireland, Israel, Italy, Japan,** Korea,* Slovenia, Albania, Azerbaijan, Dubai (UAE),
Hong Kong-China,** Montenegro,
Shanghai-China,* Thailand
Indonesia, Kyrgyzstan, Qatar, Romania, Chinese Taipei
Mexico, Portugal Luxembourg, Macao-China, Panama
Austria, Czech Republic, Hungary, Slovak Republic,
Croatia, Liechtenstein, Singapore*
Turkey, Bulgaria,Serbia
Belgium,* Germany, Trinidad and Tobago
Netherlands,* Switzerland*
* Perform higher than the OECD average in reading.
** Perform higher than the OECD average in reading and have the relationship between students’ socio-economic background and reading performance weaker than the OECD average.
Note: The estimates in the grey cells indicate the average values of the variables used in latent profile analysis in each group. See Annex A5 in PISA 2009 Initial Results: What Makes a School Successful (Volume IV) for technical details.
Source: OECD (2010c), Figure IV.3.2.

31UNTAPPED SKILLS: REALISING THE POTENTIAL OF IMMIGRANT STUDENTS © OECD 2012
OVERVIEW OF IMMIGRATION REGIMES AND EDUCATION SYSTEMS1
quality of instruction in schools by offering a greater diversity of courses, greater autonomy for schools to respond to local needs, and more choice for parents.
Figure 1.8 shows how school systems organise the governance of schools in terms of the autonomy they give schools to decide over the curriculum and assessment, and the extent to which they allow parents to choose schools (and schools to compete for students). Across OECD countries, the most common configuration is the one that gives schools discretion over curricular and assessment decisions, and restricts competition for enrolment among schools. These school systems have relatively little competition for enrolment among schools, and private schools are not widely available in these countries. Twenty-three OECD countries and 15 partner countries and economies share this configuration. The configuration that offers relatively low levels of autonomy to schools and low levels of school competition is found in 4 OECD countries and 11 partner countries. Six OECD countries and five partner countries and economies reported configurations that offer high levels of autonomy and competition, either in the form of a high prevalence of privately managed schools or greater competition among schools for enrolment. In these school systems, schools have the authority to design curricula, and parents and students can choose from a variety of schools for their children.
PISA results highlight the fact that education systems which grant autonomy to schools over curricular decisions tend to perform better, particularly when autonomy is coupled with accountability measures that guide autonomy towards national standards and expectations. School systems that promote competition between schools do not perform better than school systems that limit competition, nor is the prevalence of private schools in the system associated with national reading performance.
The governance of school systems may impact the educational opportunities available to immigrant students in many ways. For example, schools with more autonomy over curricular decisions may be better able to cater to the particular needs of immigrant students (as long as the decision makers in the school are able to make informed decisions). Greater levels of school choice may also mean more educational opportunities available for immigrant students. School choice depends on parents’ access to information and ability to make decisions based on that information. When immigrant parents have restricted access or a limited ability to choose schools, school choice may lead to segregation of students across immigrant status lines. In this regard, PISA results show that socio-economically disadvantaged parents are less likely to choose schools for their children and those school systems that promote parental choice of schools have lower equity levels than school systems that limit competition between schools.
• Figure 1.8 • How school systems are governed
Greece, Mexico, Portugal, Turkey, Albania, Azerbaijan, Bulgaria, Croatia,
Kazakhstan, Jordan, Montenegro, Qatar, Serbia, Tunisia, Uruguay
—
Austria, Canada,** Czech Republic, Denmark, Estonia,**
Finland,** Germany, Hungary, Iceland,** Israel, Italy,
Japan,** Luxembourg, New Zealand,* Norway,**
Poland,* Slovak Republic, Slovenia, Spain, Sweden,
Switzerland,* United Kingdom, United States, Panama,
Argentina, Brazil, Colombia, Kyrgyzstan, Latvia,
Liechtenstein, Lithuania, Peru, Romania,
Russian Federation, Shanghai-China,* Singapore,*
Thailand, Trinidad and Tobago
Australia,* Belgium,* Chile, Ireland, Korea,*
Netherlands,* Dubai (UAE), Hong
Kong-China,** Indonesia, Macao-China,
Chinese Taipei
Establish student assessment policies: 61%
Choose which textbooks are used: 55%
Determine course content: 14%
Decide which courses are offered: 18%
Establish student assessment policies: 92%
Choose which textbooks are used: 97%
Determine course content: 85%
Decide which courses are offered: 87%
Less school
autonomy for
curriculum
and
assessment
More school
autonomy for
curriculum
and assessment
Less school competition More school competition
Schools that compete with other schools for students in the same area: 73%
Schools that compete with other schools for students in the same area: 89%
Private schools: 8% Private schools: 52%
* Perform higher than the OECD average in reading.
** Perform higher than the OECD average in reading and have the relationship between students’ socio-economic background and reading performance weaker than the OECD average.
Note: The estimates in the grey cells indicate the average values of the variables used in latent profile analysis in each group. See Annex A5 in PISA 2009 Initial Results: What Makes a School Successful (Volume IV) for technical details.
Source: OECD (2010c), Figure IV.3.5.

32 © OECD 2012 UNTAPPED SKILLS: REALISING THE POTENTIAL OF IMMIGRANT STUDENTS
OVERVIEW OF IMMIGRATION REGIMES AND EDUCATION SYSTEMS1
Assessment and accountabilityTo ensure that instruction is effective, most schools evaluate student learning, usually through teachers’ assessments, required assignments or tests. Standardised tests are often used to compare students and schools at the national or regional level. Evaluation of student learning outcomes can also be used to hold schools and other actors in education accountable for what is one of the principal functions of schooling.
PISA results show that the use of standards-based external examinations tends to be positively related to a system’s overall performance, while the use of standardised tests or assessment data for benchmarking or-decision making is not consistently related to learning outcomes. However, in some countries, schools that post achievement data publicly tend to perform better. Assessment and accountability practices may be related to the educational opportunities of immigrant students, as assessments may provide useful information to schools and teachers on the educational needs of immigrant students. In this regard, results from PISA suggest that the use of standardised tests tends to be associated with a lower impact of socio-economic background on student performance.
SUMMARY AND CONCLUSIONSIncreasing levels of migration and the associated increases in immigrant student populations will continue to pose challenges and opportunities for governments and educators. Differences and similarities in the composition of migrant populations and the characteristics of education systems allow for shared experiences and mutual learning among countries. What may work in some contexts might not be appropriate in different circumstances.
This chapter provides an overview of immigration regimes and education systems among PISA 2009 participants. The evidence and results presented in subsequent chapters must be interpreted within this framework.
Notes
1. The GDP of the countries that participated in PISA 2009 represents 86% of the 2007 world GDP. Some of the entities represented in this report are referred to as partner economies. This is because they are not strictly national entities.
2. Thirty-one partner countries and economies originally participated in the PISA 2009 assessment and ten additional partner countries and economies took part in a second round of the assessment.
3. Marks (2007); Bertschy, et al. (2009); OECD (2010b).
References
Bertschy K., M.A. Cattaneo and S.C. Wolter (2009), “PISA and the Transition into the Labour Market”, Labour, Vol. 23, pp. 111-139.
Marks, G.N. (2007), “Do Schools Matter for Early School Leaving? Individual and School Influences in Australia”, School Effectiveness and School Implementation, Vol. 18, No. 4, University of Melbourne, Australian Council for Educational Research, Australia, pp. 429-450.
OECD (2010a), PISA 2009 Assessment Framework: Key Competencies in Reading, Mathematics and Science, PISA, OECD Publishing.
OECD (2010b), PISA 2009 Results: What Students Know and Can Do: Student Performance in Reading, Mathematics and Science (Volume I), PISA, OECD Publishing.
OECD (2010c), PISA 2009 Results: What Makes a School Successful?: Resources, Policies and Practices (Volume IV), PISA, OECD Publishing.
OECD (2011), International Migration Outlook 2011, OECD Publishing.
OECD (2012), PISA 2009 Technical Report, PISA, OECD Publishing.
33UNTAPPED SKILLS: REALISING THE POTENTIAL OF IMMIGRANT STUDENTS © OECD 2012
This chapter provides an overview of the results emerging from PISA 2009 on the performance and socio-economic background of immigrant students. What do they know and what can they do? How do they differ from other students? The evidence highlights the differences and similarities across countries with respect to the challenges and opportunities posed by immigrant student populations. Recent trends show that performance differences are related to both policy and the underlying profiles of immigrant populations.
2
The Performance Profiles of Immigrant Students

34 © OECD 2012 UNTAPPED SKILLS: REALISING THE POTENTIAL OF IMMIGRANT STUDENTS
THE PERFORMANCE PROFILES OF IMMIGRANT STUDENTS2
INTRODUCTIONStudents who come from other countries, or whose parents do, add to the diversity of student populations. While this diversity enriches education systems, it can also pose significant challenges for educators and policy makers. In many countries, immigrant students constitute a sizable proportion of the student population – and form a diverse group, with different backgrounds and skill levels.
What distinguishes immigrant students? Are there common patterns in their outcomes and characteristics across countries?
KNOWLEDGE AND SKILLS DISADVANTAGE AMONG IMMIGRANT STUDENTS
Average performanceFigure 2.1 highlights the performance differences in the PISA 2009 reading scale between immigrant and non-immigrant students.1 The PISA reading scale was set to yield a mean of 500 score points for OECD countries in PISA 2000, with a standard deviation of 100 (in 2009, these were 493 and 93 respectively). In 2009, immigrant students scored lower in reading than non-immigrant students in 23 out of 28 OECD countries with sufficient data. The performance gap reaches 99 score points in Mexico, more than 80 in Iceland and more than 72 in Italy. In Finland, Austria, Belgium, Sweden, Denmark and France, the gap is 60 score points or more, the equivalent of more than a year and a half of schooling (Table B2.1a).
Among OECD countries, only Australia, Canada, the Czech Republic, Hungary and Israel show no overall performance differences between students by immigrant background. In Hungary, most migrants consist of ethnic Hungarians from neighbouring countries and in the Czech Republic, they consist mainly of persons born in the Slovak Republic. Australia and Canada select and admit significant numbers of highly educated migrants every year, whose children do well in school. In Israel, most migration is of an ethnic/religious character. All of these are special situations which may encourage better outcomes by immigrant students.
In general, immigrant populations are less prominent in partner countries and economies; in ten of them, the populations are too small to be included in this report.2 Patterns in performance gaps are also more complex. In Qatar, Dubai (UAE), Kyrgyzstan, Serbia, Jordan and Macao-China, immigrant students perform better in reading than non-immigrant students. None of these cases, however, correspond to typical immigrant situations encountered in OECD countries. In Qatar and Dubai (UAE), significant numbers of immigrant students were administered the PISA test in English and in Kyrgyzstan it was administered in Russian. In Serbia, most immigrants speak Serbian at home, in Jordan, Arabic, and in Macao-China, Chinese (Table B1.5). In Croatia, Lithuania, the Russian Federation, Liechtenstein, Argentina, Brazil and Colombia, immigrant students have lower reading scores than non-immigrant students. In Montenegro, Kazakhstan, Singapore, Trinidad and Tobago, Azerbaijan, Hong Kong-China, Latvia and Panama, there are no apparent differences in the performance between immigrant students and those without (Figure 2.1 and Table B2.1a).
The performance advantage in reading among non-immigrant students is mirrored in other assessment domains. Performance gaps are similar for mathematics and science (Tables B2.1b and B2.1c, respectively). Out of 28 OECD countries with sufficient data, non-immigrant students outscore immigrant students in 25 countries in science and 24 countries in mathematics. Only in Australia do immigrant students perform better in mathematics than non-immigrant students. The patterns among partner countries and economies are similar to those described for reading.
Performance differences across the distribution of performance
Over- or under-representation of immigrant students among low or high achievers
Average performance gaps can mask important differences between immigrant and non-immigrant students in the distribution of performance. PISA proficiency levels provide an indication of what students know and can do; they describe the kinds of reading skills 15-year-olds students demonstrated in the assessment. Therefore, differences in the proportion of students who reach a certain level of proficiency provide a deeper understanding of the differences in skills between students by immigrant background.
The 25th percentile among non-immigrant students provides a practical country-specific benchmark for low performance. Likewise, the 75th percentile will be used as a benchmark for high performance. The 50th percentile divides the population of non-immigrant students into two halves and provides a measure of the typical performance for this group of students. Figure 2.2 shows the proportion of immigrant students who scored below the 25th, 50th and 75th percentiles.
With a couple of important exceptions, immigrant students are over-represented among low achievers and under-represented among high achievers, as shown in Figure 2.2. Given their performance disadvantage, it is no surprise that the proportion of immigrant students that score below the 25th percentile exceeds 25% in all OECD countries (except Australia, Hungary and Israel). Perhaps more surprisingly, it is as high as 72% in Mexico and exceeds 50% in eight OECD countries (Spain, Sweden, Belgium, Austria, Denmark, Italy, Finland and Iceland). Except for Australia, Hungary and the Czech Republic, in no OECD country is the proportion of immigrant students who score below the 75th percentile lower than 75%. On average, it reaches 86% in the OECD and it is above 90% in 10 OECD countries (Mexico, Iceland, Italy, Spain, Denmark, Austria, Slovenia, Belgium and Germany) (Table B2.1d).

35UNTAPPED SKILLS: REALISING THE POTENTIAL OF IMMIGRANT STUDENTS © OECD 2012
THE PERFORMANCE PROFILES OF IMMIGRANT STUDENTS2
• Figure 2.1 • Performance disadvantage of immigrant students
-125 -75 -25 25 75 125
OEC
D Hungary
Australia
Israel
Canada
New Zealand
United States
Czech Republic
United Kingdom
Portugal
Ireland
Estonia
OECD average
Netherlands
Slovenia
Switzerland
Norway
Luxembourg
Germany
Greece
Spain
France
Denmark
Sweden
Belgium
Austria
Finland
Italy
Iceland
Mexico
Part
ners Qatar
Dubai (UAE)
Kyrgyzstan
Serbia
Jordan
Macao-China
Montenegro
Kazakhstan
Singapore
Trinidad and Tobago
Azerbaijan
Hong Kong-China
Latvia
Croatia
Lithuania
Russian Federation
Liechtenstein
Panama
Argentina
Brazil
Colombia
Score point difference
Non-immigrant studentsperform better
Immigrant studentsperform better
Note: Score point differences that are statistically significant are shown in a darker tone.
Countries are ranked in ascending order of the score point difference between non-immigrant students and immigrant students (first- and second-generation).
Source: Table B2.1a.

36 © OECD 2012 UNTAPPED SKILLS: REALISING THE POTENTIAL OF IMMIGRANT STUDENTS
THE PERFORMANCE PROFILES OF IMMIGRANT STUDENTS2
The Czech Republic, Ireland and Finland represent important exceptions to the general patterns of over/under representation. These are all cases of countries where the under-representation of immigrant students among high achievers is relatively low compared with the over-representation of immigrant students among low performers. This finding suggests that in these countries the population of immigrant students is quite diverse and can sensibly be divided into two groups: high- and low-performing immigrant students.
The same general patterns are also evident among partner countries and economies, but the extremes are even more marked. For example, more than 70% of immigrant students score below the 25th percentile in Brazil and Colombia, whereas in Dubai (UAE) and Qatar, it is less than 8%. In Kyrgyzstan, Trinidad and Tobago and Panama, there is evidence of a significant proportion of high achievers among immigrant students, especially given the proportion of immigrant students scoring below the 25th percentile (Table B2.1d).
Reading skills by immigrant background
In PISA reading skills are described in terms of proficiency levels. These levels are helpful for providing information on what students’ scores in the PISA reading scale mean in substantive terms. For PISA 2009, the range of difficulty of the test questions allowed for the description of seven levels of reading proficiency: Level 1b is the lowest described proficiency level, then Level 1a, Level 2, Level 3 and so on up to Level 6.
Each proficiency level is described based on the kinds of skills and knowledge students need to successfully complete the assessment tasks and questions. Students proficient at Level 1b are likely to be able to complete Level 1b tasks successfully, but are unlikely to be able to complete tasks at higher levels. Level 6 reflects tasks that present the greatest challenge in terms of reading skills and knowledge. Students with scores in this range are likely to be able to successfully complete reading tasks at that level, as well as all the other reading tasks in PISA.
A student’s performance on the questions in the test is associated with a score which corresponds to a specific level on the reading scale. This allows the score to be associated with a defined proficiency level. The student’s level is defined to be the highest level for which he or she would be expected to answer a majority of a random selection of questions correctly at that particular level. Thus, for example, in an assessment composed of tasks spread uniformly across Level 3, students with a score located at Level 3 would be expected to complete at least 50% of the tasks successfully. Because a level covers a range of difficulties and proficiencies, success rates across this range can vary. Students near the bottom of the level would be likely to succeed on just over 50% of the tasks spread uniformly across the level, while students at the top of the level would be likely to succeed on well over 70% of the same tasks.
Figure 2.3 provides details on the nature of the reading skills, knowledge and understanding required at each level of the reading scale.
• Figure 2.2 • Representation of immigrant students among high and low achievers
0
25
50
75
100
%
OEC
DH
unga
ryAu
stral
iaIsr
ael
Cana
daN
ew Z
eala
ndU
nite
d St
ates
Uni
ted
King
dom
Czec
h Re
publ
icPo
rtuga
lEs
toni
aIre
land
Slov
enia
Net
herla
nds
OEC
D a
vera
geSw
itzer
land
Luxe
mbo
urg
Gre
ece
Nor
way
Ger
man
yFr
ance
Spai
nSw
eden
Belg
ium
Austr
iaD
enm
ark
Italy
Finl
and
Icel
and
Mex
ico
Partn
ers
Dub
ai (U
AE)
Qat
arSe
rbia
Azer
baija
nM
acao
-Chi
naM
onte
negr
oKy
rgyz
stan
Jord
anSi
ngap
ore
Kaza
khsta
n
Hon
g Ko
ng-C
hina
Croa
tia
Trin
idad
and
Toba
goLa
tvia
Russ
ian
Fede
ratio
nLi
thua
nia
Arge
ntin
aLi
echt
enste
inPa
nam
aCo
lom
bia
Braz
il
Below 75th percentile Below 50th percentile Below 25th percentile
Countries are ranked in ascending order of the percentage of immigrant students below the 25th percentile of performance among non-immigrant students.
Source: Table B2.1d.

37UNTAPPED SKILLS: REALISING THE POTENTIAL OF IMMIGRANT STUDENTS © OECD 2012
THE PERFORMANCE PROFILES OF IMMIGRANT STUDENTS2
Proficiency Level 2 is considered a baseline level of proficiency, at which students begin to demonstrate the reading skills that will enable them to participate effectively and productively in life. Students who do not reach Level 2 have difficulties locating basic information that meets several conditions, making comparisons or contrasts around a single feature, working out what a well-defined part of a text means when the information is not prominent, or making connections between the text and outside knowledge by drawing on personal experience and attitudes. Students scoring below Level 2 are the lowest performers in PISA.
Top performers are those students proficient at Levels 5 or 6 of the assessment. Top performers can tackle some of the most complex tasks and questions in PISA. At a minimum, they can infer what is relevant in a text and retrieve information by locating and organising several pieces of information deeply embedded in the text. They are capable of critical evaluation, drawing on specialised knowledge and can deal with concepts that are contrary to their expectations. And they can interpret and reflect on texts that are unfamiliar both in terms of the content or form.
Analysing PISA performance across performance levels highlights important skill differences across immigrant background in the student populations of each system. One way to do this is by studying the proportion of lowest and top performers among immigrant and non-immigrant students. In general, there are higher proportions of low performers among immigrant students and higher proportions of top performers among non-immigrant students. The ratio of low performers among students with and without an immigrant background is a good measure of skill inequality at the bottom of the distribution: the higher the ratio, the bigger the proportion of low performers among immigrant students relative to the proportion of low performers among non-immigrant students. At the top of the distribution, the reverse is true and therefore it is the ratio of top performers among immigrant and non-immigrant students that provides a good measure of inequality. In the case of skill inequality at the top of the performance distribution, the higher the ratio, the bigger the proportion of top performers will be among non-immigrant students relative to the proportion of top performers among immigrant students.
• Figure 2.3 • PISA reading proficiency levels
LevelLower score limit
Percentage of students able to perform tasks at
each level or above (OECD
average)
Characteristics of tasks
6 698
0.8% of students across the OECD can perform tasks at Level 6 on the reading scale
Tasks at this level typically require the reader to make multiple inferences, comparisons and contrasts that are both detailed and precise. They require demonstration of a full and detailed understanding of one or more texts and may involve integrating information from more than one text. Tasks may require the reader to deal with unfamiliar ideas, in the presence of prominent competing information, and to generate abstract categories for interpretations. Reflect and evaluate tasks may require the reader to hypothesise about or critically evaluate a complex text on an unfamiliar topic, taking into account multiple criteria or perspectives, and applying sophisticated understandings from beyond the text. A salient condition for access and retrieve tasks at this level is precision of analysis and fine attention to detail that is inconspicuous in the texts.
5 626
7.6% of students across the OECD can perform tasks at least at Level 5 on the reading scale
Tasks at this level that involve retrieving information require the reader to locate and organise several pieces of deeply embedded information, inferring which information in the text is relevant. Reflective tasks require critical evaluation or hypothesis, drawing on specialised knowledge. Both interpretative and reflective tasks require a full and detailed understanding of a text whose content or form is unfamiliar. For all aspects of reading, tasks at this level typically involve dealing with concepts that are contrary to expectations.
4 553
28.3% of students across the OECD can perform tasks at least at Level 4 on the reading scale
Tasks at this level that involve retrieving information require the reader to locate and organise several pieces of embedded information. Some tasks at this level require interpreting the meaning of nuances of language in a section of text by taking into account the text as a whole. Other interpretative tasks require understanding and applying categories in an unfamiliar context. Reflective tasks at this level require readers to use formal or public knowledge to hypothesise about or critically evaluate a text. Readers must demonstrate an accurate understanding of long or complex texts whose content or form may be unfamiliar.
3 480
57.2% of students across the OECD can perform tasks at least at Level 3 on the reading scale
Tasks at this level require the reader to locate, and in some cases recognise the relationship between, several pieces of information that must meet multiple conditions. Interpretative tasks at this level require the reader to integrate several parts of a text in order to identify a main idea, understand a relationship or construe the meaning of a word or phrase. They need to take into account many features in comparing, contrasting or categorising. Often the required information is not prominent or there is much competing information; or there are other obstacles in the text, such as ideas that are contrary to expectation or negatively worded. Reflective tasks at this level may require connections, comparisons, and explanations, or they may require the reader to evaluate a feature of the text. Some reflective tasks require readers to demonstrate a fine understanding of the text in relation to familiar, everyday knowledge. Other tasks do not require detailed text comprehension but require the reader to draw on less common knowledge.
2 407
81.2% of students across the OECD can perform tasks at least at Level 2 on the reading scale
Some tasks at this level require the reader to locate one or more pieces of information, which may need to be inferred and may need to meet several conditions. Others require recognising the main idea in a text, understanding relationships, or construing meaning within a limited part of the text when the information is not prominent and the reader must make low level inferences. Tasks at this level may involve comparisons or contrasts based on a single feature in the text. Typical reflective tasks at this level require readers to make a comparison or several connections between the text and outside knowledge, by drawing on personal experience and attitudes.
1a 335
94.3% of students across the OECD can perform tasks at least at Level 1a on the reading scale
Tasks at this level require the reader: to locate one or more independent pieces of explicitly stated information; to recognise the main theme or author’s purpose in a text about a familiar topic; or to make a simple connection between information in the text and common, everyday knowledge. Typically the required information in the text is prominent and there is little, if any, competing information. The reader is explicitly directed to consider relevant factors in the task and in the text.
1b 262
98.9% of students across the OECD can perform tasks at least at Level 1b on the reading scale
Tasks at this level require the reader to locate a single piece of explicitly stated information in a prominent position in a short, syntactically simple text with a familiar context and text type, such as a narrative or a simple list. The text typically provides support to the reader, such as repetition of information, pictures or familiar symbols. There is minimal competing information. In tasks requiring interpretation the reader may need to make simple connections between adjacent pieces of information.
Source: OECD PISA 2009 Database, Figure I.2.12.

38 © OECD 2012 UNTAPPED SKILLS: REALISING THE POTENTIAL OF IMMIGRANT STUDENTS
THE PERFORMANCE PROFILES OF IMMIGRANT STUDENTS2
In Figure 2.4, education systems are ranked according to the ratio of the lowest performers among immigrant and non-immigrant students, which appears in parenthesis next to the country name in the horizontal axis. As the figure shows, the proportion of the lowest performers is higher among immigrant than non-immigrant students. The disadvantage for immigrant students is apparent in all OECD countries except for Australia, Hungary, Israel, the Czech Republic and Iceland (Table B2.1f). In no OECD country are the lowest performers more common among non-immigrant students.
Across the OECD the proportion of the lowest performers among immigrant students is almost twice as high as the proportion of the lowest performers among non-immigrant students. Skill inequality at the bottom of the distribution, the ratio of the lowest performers, reaches 3.9 in Finland and more than 2.5 in Denmark, Iceland, Belgium and Sweden.3 In contrast, in Israel, Australia and Hungary the ratio falls below one because the proportion of low performers is higher among non-immigrant than among immigrant students.
As evident in Figure 2.4, skill inequality at the bottom of the distribution is not necessarily associated with the proportion of low performers among immigrant or non-immigrant students. For example, Finland and Canada have relatively few low performers among non-immigrant students, 7% and 9% respectively. Yet, the proportion of the lowest performers among immigrant students reaches 29% in Finland and it stands at 11% in Canada. In general, low proportions of the lowest performers among immigrant students are associated with lower skills inequality at the bottom of the distribution. However, there are countries with average proportions of low performers among immigrant students where this measure of inequality is still high. For example, Finland, Denmark, Belgium, Sweden, Switzerland, Norway, Spain and Germany have relatively average proportions of the lowest performers among immigrant students, but skill inequality at the bottom of the distribution is well above the OECD average of 1.9.
In Figure 2.5 systems are ranked according to skill inequality across immigrant background at the top of the distribution. Across the OECD the proportion of top performers among non-immigrant students is 1.7 times as large as the proportion among top performers among immigrant students. Top performers are less common among immigrant students in all OECD countries except Portugal, Ireland, the United States, Israel, New Zealand, the Czech Republic, Hungary, Canada and Australia, where there are no apparent differences. In no OECD country are top performers more common among immigrant students. Beyond the odd case of Mexico,4 skill inequality at the top of the distribution is highest in Denmark and Austria where the proportion of top performers among non-immigrant students is respectively 6.1 times and 5.8 times larger than the proportion of top performers among immigrant students. The ratio is also above 3.1 in Italy, Greece, Germany, Slovenia, Spain, Sweden, Estonia and Iceland (Table B2.1e).
• Figure 2.4 • Skills and knowledge inequality across immigrant background at the bottom of the performance
distribution, lowest performers by immigrant background
0
10
20
30
40
50
60
70
80
90
100
%
OEC
DFi
nlan
d [3
.9]
Den
mar
k [2
.8]
Icel
and
[2.7
]
Belg
ium
[2.5
]
Swed
en [2
.5]
Italy
[2.4
]
Switz
erla
nd [2
.3]
Nor
way
[2.3
]Sp
ain
[2.3
]
Ger
man
y [2
.2]
Fran
ce [2
.2]
Luxe
mbo
urg
[2.2
]Au
stria
[2.2
]M
exic
o [2
.2]
Gre
ece
[2.1
]
OEC
D a
vera
ge [1
.9]
Irela
nd [1
.9]
Esto
nia
[1.8
]
Slov
enia
[1.8
]
Net
herla
nds [
1.8]
Portu
gal [
1.5]
Czec
h Re
publ
ic [1
.4]
Uni
ted
King
dom
[1.4
]
New
Zea
land
[1.4
]
Uni
ted
Stat
es [1
.3]
Cana
da [1
.2]
Israe
l [1]
Austr
alia
[0.9
]
Hun
gary
[0.7
]Pa
rtner
s
Colo
mbi
a [1
.9]
Braz
il [1
.9]
Liec
hten
stein
[1.7
]La
tvia
[1.4
]
Russi
an Fe
dera
tion
[1.4
]
Lith
uani
a [1
.4]
Arge
ntin
a [1
.3]
Croa
tia [1
.3]
Pana
ma
[1.1
]
Trin
idad
and T
obag
o [1
]
Hon
g Ko
ng-C
hina
[1]
Sing
apor
e [1
]
Azer
baija
n [1
]
Kaza
khsta
n [1
]
Mon
tene
gro
[1]
Jord
an [0
.9]
Serb
ia [0
.8]
Kyrg
yzsta
n [0
.8]
Mac
ao-C
hina
[0.8
]Q
atar
[0.5
]
Dub
ai (U
AE) [
0.4]
Immigrant students Non-immigrant students
Note: Relative risk of low performance for immigrant students is indicated in brackets next to the country names.
Countries are ranked in descending order of the relative risk of low performance for immigrant students.
Source: Table B2.1f.

39UNTAPPED SKILLS: REALISING THE POTENTIAL OF IMMIGRANT STUDENTS © OECD 2012
THE PERFORMANCE PROFILES OF IMMIGRANT STUDENTS2
Figure 2.5 shows that a high proportion of top performers among immigrant students is related to lower inequality across immigrant background at the top of the distribution. Finland is the only OECD country where the proportion of top performers among immigrant students is at or above the OECD average of 5% and the proportion of top performers among non-immigrant students are well above twice that at 15%. And in a number of OECD countries – Germany, Sweden, Iceland, Belgium, Netherlands, France, Norway and Switzerland – the proportion of top performers among non-immigrant students is at or above the OECD average of 8% but the proportion of top performers among immigrant students is 4% or less.
Considering both inequality at the top and bottom of the distribution across immigrant background, Austria, Denmark, Italy and Finland stand out as countries with high inequality at both ends of the distribution scale. While in Finland the inequality is more marked at the bottom, in Austria, Denmark and Italy, it is more marked at the top. Other countries with high inequality at the top and bottom are Iceland, Germany, Sweden, Greece, Spain, Belgium, France, Norway and Switzerland. Luxembourg is the only country where inequality is average at the top and high at the bottom. In Slovenia, Estonia, and the Netherlands inequality is high only at the top but it is only average at the bottom. Inequality is low both at the top and the bottom in Hungary, Australia, Israel and Canada. In New Zealand and the Czech Republic it is below average, particularly at the top. In the United States, the United Kingdom and Portugal inequality is average at the top and low at the bottom.
Knowledge and skills disadvantage among first- and second-generation students
Average performance
Across OECD countries, non-immigrant students outscore both first- and second- generation students, but the knowledge and skills disadvantage tends to be greatest among first-generation students. Canada and the Czech Republic are the only OECD countries where there are no differences based on students’ immigrant background. Immigrant students represent almost a quarter of Canada’s student population assessed in PISA 2009, while they account for only about 2% in the Czech Republic (Table B1.3).
In no OECD country do first-generation students outperform non-immigrant students. Non-immigrant students outscore first-generation students in 23 out of 28 OECD countries with sufficient data (Table B2.1a).
• Figure 2.5 • Skills and knowledge inequality across immigrant background at the top of the performance
distribution, top performers by immigrant background
0
2
4
6
8
10
12
14
16
18
%
OEC
DM
exic
o [4
2]D
enm
ark
[6.1
]Au
stria
[5.8
]Ita
ly [4
.9]
Gre
ece
[3.7
]G
erm
any
[3.6
]Sl
oven
ia [3
.5]
Spai
n [3
.4]
Swed
en [3
.3]
Esto
nia
[3.2
]Ic
elan
d [3
.2]
Belg
ium
[2.9
]
Net
herla
nds [
2.8]
Fran
ce [2
.6]
Nor
way
[2.4
]Fi
nlan
d [2
.1]
Switz
erla
nd [2
]Po
rtuga
l [1.
7]
OEC
D a
vera
ge [1
.7]
Uni
ted
King
dom
[1.6
]
Luxe
mbo
urg
[1.5
]Ire
land
[1.4
]
Uni
ted
Stat
es [1
.3]
Israe
l [1.
1]
New
Zea
land
[1]
Czec
h Re
publ
ic [1
]H
unga
ry [1
]Ca
nada
[1]
Austr
alia
[0.8
]Pa
rtne
rsBr
azil
[45.
7]Ar
gent
ina
[3.7
]
Liec
hten
stein
[3.4
]
Russ
ian
Fede
ratio
n [2
.1]
Lith
uani
a [2
.1]
Croa
tia [1
.5]
Hon
g Ko
ng-C
hina
[1]
Mac
ao-C
hina
[0.9
]
Sing
apor
e [0
.9]
Mon
tene
gro
[0.8
]La
tvia
[0.8
]
Kyrg
yzsta
n [0
.6]
Jord
an [0
.6]
Serb
ia [0
.5]
Kaza
khsta
n [0
.5]
Pana
ma
[0.5
]
Trin
idad
and T
obag
o [0
.3]
Qat
ar [0
.1]
Dub
ai (U
AE) [
0]
Immigrant students Non-immigrant students
Note: Relative risk of top performance for immigrant students is indicated in brackets next to the country names.
Countries are ranked in descending order of the relative risk of top performance for immigrant students.
Source: Table B2.1e.
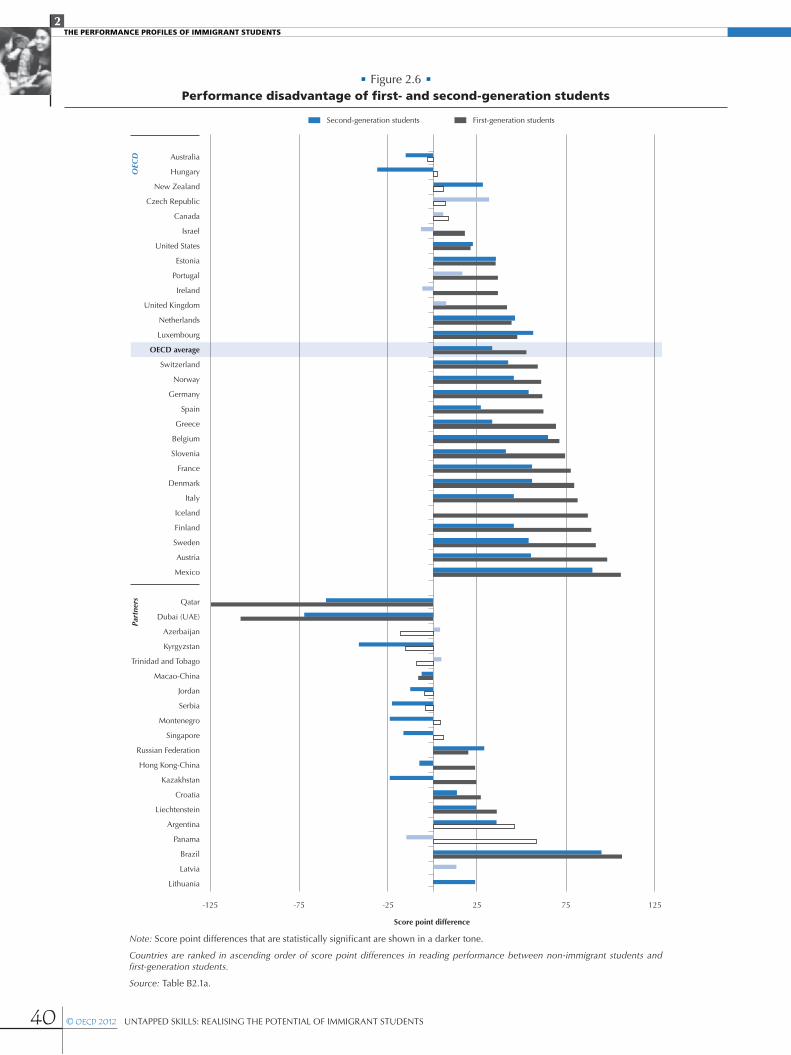
40 © OECD 2012 UNTAPPED SKILLS: REALISING THE POTENTIAL OF IMMIGRANT STUDENTS
THE PERFORMANCE PROFILES OF IMMIGRANT STUDENTS2
• Figure 2.6 • Performance disadvantage of first- and second-generation students
-125 -75 -25 25 75 125
OEC
D Australia
Hungary
New Zealand
Czech Republic
Canada
Israel
United States
Estonia
Portugal
Ireland
United Kingdom
Netherlands
Luxembourg
OECD average
Switzerland
Norway
Germany
Spain
Greece
Belgium
Slovenia
France
Denmark
Italy
Iceland
Finland
Sweden
Austria
Mexico
Part
ners Qatar
Dubai (UAE)
Azerbaijan
Kyrgyzstan
Trinidad and Tobago
Macao-China
Jordan
Serbia
Montenegro
Singapore
Russian Federation
Hong Kong-China
Kazakhstan
Croatia
Liechtenstein
Argentina
Panama
Brazil
Latvia
Lithuania
Score point difference
Second-generation students First-generation students
Note: Score point differences that are statistically significant are shown in a darker tone.
Countries are ranked in ascending order of score point differences in reading performance between non-immigrant students and first-generation students.
Source: Table B2.1a.

41UNTAPPED SKILLS: REALISING THE POTENTIAL OF IMMIGRANT STUDENTS © OECD 2012
THE PERFORMANCE PROFILES OF IMMIGRANT STUDENTS2
Non-immigrant students outperform second-generation students in 19 out of 27 OECD countries with sufficient data. Only in New Zealand do first-generation students outscore second-generation students (Table B2.1a). In Hungary and Australia, second-generation students outscore non-immigrant students. In Australia, immigrant students account for 23% of the student population assessed in PISA 2009, while they represent only 2% of that population in Hungary (Table B1.3).
In most cases, the knowledge and skills disadvantage among first-generation students is large. Figure 2.6 displays the performance differences between non-immigrant students and first- and second-generation students across all countries with sufficient data. In Mexico, the gap between non-immigrant and first-generation students reaches 105 score points on the PISA reading scale. This difference is larger than 90 points in Sweden and Austria and it is above 80 points in Italy, Iceland and Finland. In contrast, there are no apparent performance differences between non-immigrant students and first-generation students in Australia, Hungary, New Zealand, the Czech Republic and Canada (Table B2.1a).
The knowledge and skills gap among second-generation students tends to be narrower than among first-generation and non-immigrant students, but in most cases it remains noticeable. In Mexico, it is close to 90 score points on the PISA reading scale. In Belgium, the gap is more than 64 score points or the equivalent of a year and a half of schooling. And in Sweden, Germany, Austria, France, Denmark and Luxembourg, non-immigrant students outperform second-generation students by more than 50 score points in reading. In contrast, in Hungary and Australia, second-generation students outscore non-immigrant students by 32 and 16 score points, respectively. Ireland, the United Kingdom, Israel, Portugal, the Czech Republic and Canada are the only OECD countries where there are no performance differences between non-immigrant students and second-generation students. In Canada and the Czech Republic this is coupled with no differences between first-generation students and non-immigrant students (Table B2.1). Beyond their different size, the immigrant population in the Czech Republic and that in Canada are peculiar and cannot be easily compared.
With some important exceptions, the larger the knowledge and skills disadvantage of first-generation students, the larger the disadvantage for second-generation students. For example, second-generation students outscore first-generation students by more than 42 score points, or the equivalent of one school year, in Finland, Austria and Ireland.
SOCIO-ECONOMIC DISADVANTAGE AMONG IMMIGRANT STUDENTSLower levels of knowledge and skills are not the only impediments to success at school among immigrant students. Socio-economic disadvantage, which is common among these children, is closely associated with lower performance in PISA across the board. This disadvantage only partly explains the poorer performance among immigrant students. In many cases, the disadvantage in knowledge and skills remains even after accounting for socio-economic background and language spoken at home.
Student socio-economic background in PISAStudent socio-economic background in PISA is measured by the index of economic, social and cultural status, which is a composite index of various measures. PISA 2009 Results (OECD, 2010) contains a detailed description of how the index is constructed. The main components are: a measure of parental education (the highest educational attainment of either the father or the mother), a measure of parental occupation (the highest parental occupational status) and a measure of home possessions (including wealth, educational and cultural possessions and the number of books at home). Tables B2.2a through B2.2g explore each of these components and their subcomponents by immigrant background and provide a rich picture of differences across students from different backgrounds.
In no OECD country do immigrant students enjoy a socio-economic advantage over non-immigrant students. In the Czech Republic, Portugal, Estonia, Australia, Hungary, New Zealand and Ireland, there are no overall differences in socio-economic background between immigrant students and those without. In the other 21 of 28 OECD countries with sufficient data, immigrant students are more socio-economically disadvantaged than non-immigrant students (Table B2.2a).
The socio-economic disadvantage of immigrant students is illustrated by differences in parental education and in particular in the education of the mother. In some instances in this report, the mother’s education is chosen as a proxy of socio-economic background because it provides a good approximation to the educational system of the origin country for many immigrant students. It also provides an intuitive approach to socio-economic background, which may prove helpful when designing education, immigration or other social policies. Across OECD countries, highest parental educational attainment reaches 13.4 years of education among non-immigrant students and 12.9 among immigrant students (Table B2.2b). These averages and their slight difference mask wide variation across countries. The difference in years of education is largest in Luxembourg, the Netherlands and the United States where it reaches two years or more. In Iceland, Finland, Greece, Israel, United Kingdom, Italy, the Czech Republic, Spain, Hungary and Canada there is no apparent difference. While in Australia, Estonia, New Zealand, Ireland and Portugal the gap is reversed and immigrant students have higher average parental educational attainment than non-immigrant students. Average parental attainment among immigrant students is highest in Canada, where it reaches 15.0 years, and it is lowest in Mexico, where it is less than 9.5 years.
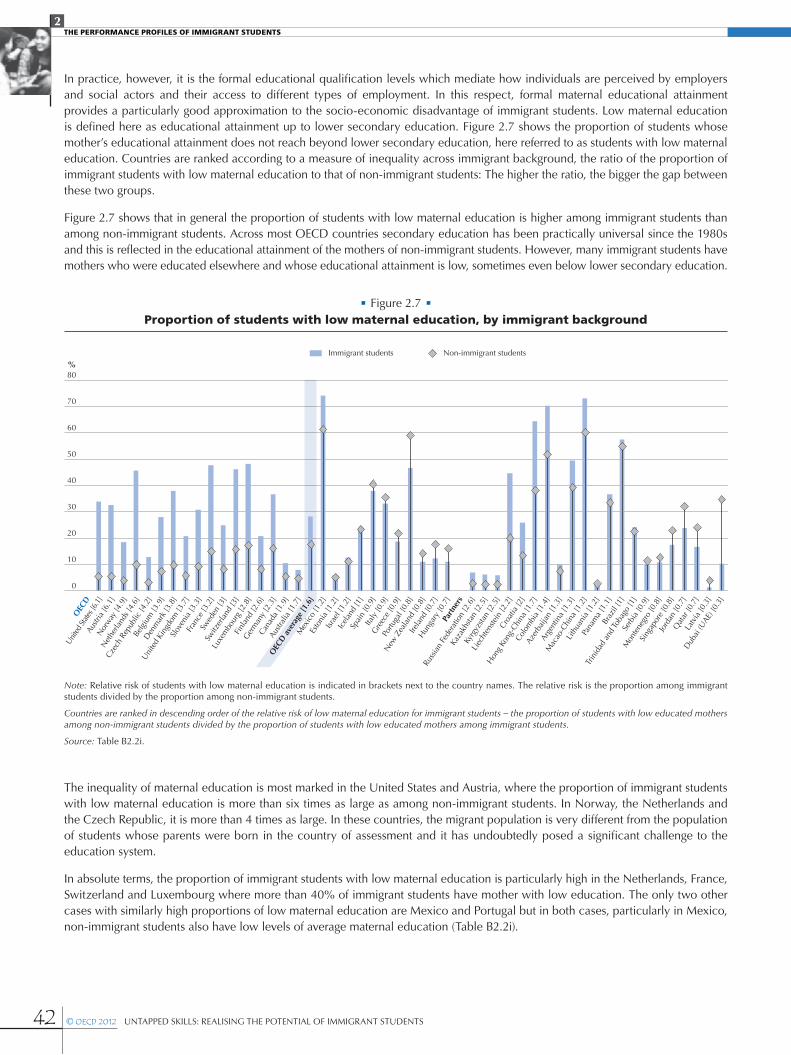
42 © OECD 2012 UNTAPPED SKILLS: REALISING THE POTENTIAL OF IMMIGRANT STUDENTS
THE PERFORMANCE PROFILES OF IMMIGRANT STUDENTS2
In practice, however, it is the formal educational qualification levels which mediate how individuals are perceived by employers and social actors and their access to different types of employment. In this respect, formal maternal educational attainment provides a particularly good approximation to the socio-economic disadvantage of immigrant students. Low maternal education is defined here as educational attainment up to lower secondary education. Figure 2.7 shows the proportion of students whose mother’s educational attainment does not reach beyond lower secondary education, here referred to as students with low maternal education. Countries are ranked according to a measure of inequality across immigrant background, the ratio of the proportion of immigrant students with low maternal education to that of non-immigrant students: The higher the ratio, the bigger the gap between these two groups.
Figure 2.7 shows that in general the proportion of students with low maternal education is higher among immigrant students than among non-immigrant students. Across most OECD countries secondary education has been practically universal since the 1980s and this is reflected in the educational attainment of the mothers of non-immigrant students. However, many immigrant students have mothers who were educated elsewhere and whose educational attainment is low, sometimes even below lower secondary education.
The inequality of maternal education is most marked in the United States and Austria, where the proportion of immigrant students with low maternal education is more than six times as large as among non-immigrant students. In Norway, the Netherlands and the Czech Republic, it is more than 4 times as large. In these countries, the migrant population is very different from the population of students whose parents were born in the country of assessment and it has undoubtedly posed a significant challenge to the education system.
In absolute terms, the proportion of immigrant students with low maternal education is particularly high in the Netherlands, France, Switzerland and Luxembourg where more than 40% of immigrant students have mother with low education. The only two other cases with similarly high proportions of low maternal education are Mexico and Portugal but in both cases, particularly in Mexico, non-immigrant students also have low levels of average maternal education (Table B2.2i).
• Figure 2.7 • Proportion of students with low maternal education, by immigrant background
0
10
20
30
40
50
60
70
80%
OEC
D
United
State
s [6.
1]Au
stria
[6.1
]
Nor
way
[4.9
]
Net
herla
nds [
4.6]
Czec
h Re
publ
ic [4
.2]
Belg
ium
[3.9
]
Den
mar
k [3
.8]
Uni
ted
King
dom
[3.7
]
Slov
enia
[3.3
]Fr
ance
[3.2
]Sw
eden
[3]
Switz
erla
nd [3
]
Luxe
mbo
urg
[2.8
]Fi
nlan
d [2
.6]
Ger
man
y [2
.3]
Cana
da [1
.9]
Austr
alia
[1.7
]
OEC
D a
vera
ge [1
.6]
Mex
ico
[1.2
]Es
toni
a [1
.2]
Israe
l [1.
2]Ic
elan
d [1
]Sp
ain
[0.9
]Ita
ly [0
.9]
Gre
ece
[0.9
]
Portu
gal [
0.8]
New
Zea
land
[0.8
]Ire
land
[0.7
]
Hun
gary
[0.7
]Pa
rtner
s
Russ
ian
Fede
ratio
n [2
.6]
Kaza
khsta
n [2
.5]
Kyrg
yzsta
n [2
.5]
Liec
hten
stein
[2.2
]Cr
oatia
[2]
Hon
g Ko
ng-C
hina
[1.7
]
Colo
mbi
a [1
.4]
Azer
baija
n [1
.3]
Arge
ntin
a [1
.3]
Mac
ao-C
hina
[1.2
]
Lith
uani
a [1
.2]
Pana
ma
[1.1
]Br
azil
[1]
Trin
idad
and
Toba
go [1
]Se
rbia
[0.9
]
Mon
tene
gro
[0.8
]
Sing
apor
e [0
.8]
Jord
an [0
.7]
Qat
ar [0
.7]
Latv
ia [0
.3]
Dub
ai (U
AE) [
0.3]
Immigrant students Non-immigrant students
Note: Relative risk of students with low maternal education is indicated in brackets next to the country names. The relative risk is the proportion among immigrant students divided by the proportion among non-immigrant students.
Countries are ranked in descending order of the relative risk of low maternal education for immigrant students – the proportion of students with low educated mothers among non-immigrant students divided by the proportion of students with low educated mothers among immigrant students.
Source: Table B2.2i.

43UNTAPPED SKILLS: REALISING THE POTENTIAL OF IMMIGRANT STUDENTS © OECD 2012
THE PERFORMANCE PROFILES OF IMMIGRANT STUDENTS2
• Figure 2.8 • Proportion of students with low maternal education, by immigrant status
100 20 30 40 50 60 70
OEC
D Greece [2.4]
Slovenia [1.7]
Finland [1.4]
Hungary [1.3]
Norway [1.3]
Sweden [1.2]
Austria [1.1]
United Kingdom [1.1]
Estonia [1]
Mexico [1]
Spain [1]
United States [0.9]
Switzerland [0.9]
OECD average [0.9]
Netherlands [0.9]
France [0.9]
Germany [0.8]
Luxembourg [0.8]
Italy [0.8]
Denmark [0.8]
Israel [0.7]
Portugal [0.7]
Czech Republic [0.7]
Belgium [0.7]
Canada [0.6]
Australia [0.6]
New Zealand [0.5]
Ireland [0.4]
Iceland [N/A]
Part
ners Kazakhstan [2.6]
Montenegro [1.3]
Panama [1.2]
Hong Kong-China [1.1]
Croatia [1.1]
Liechtenstein [1]
Brazil [0.9]
Macao-China [0.9]
Argentina [0.8]
Azerbaijan [0.8]
Serbia [0.8]
Russian Federation [0.7]
Jordan [0.7]
Trinidad and Tobago [0.6]
Singapore [0.5]
Dubai (UAE) [0.4]
Qatar [0.4]
Kyrgyzstan [0.4]
Latvia [N/A]
Lithuania [N/A]
First-generation students Second-generation students Non-immigrant students
Note: Relative risk of students with low maternal education is indicated in brackets next to the country names. The relative risk is the proportion among immigrant students divided by the proportion among non-immigrant students.
Countries are ranked in descending order of the relative risk of low maternal education for immigrant students – the proportion of students with low educated mothers among non-immigrant students divided by the proportion of students with low educated mothers among immigrant students.
Source: Table B2.2i.

44 © OECD 2012 UNTAPPED SKILLS: REALISING THE POTENTIAL OF IMMIGRANT STUDENTS
THE PERFORMANCE PROFILES OF IMMIGRANT STUDENTS2
DO DIFFERENCES IN SOCIO-ECONOMIC BACKGROUND ACCOUNT FOR THE DISADVANTAGE IN KNOWLEDGE AND SKILLS?Socio-economic background and performance are closely related. Given that the immigrant students are socio-economically disadvantaged, it is possible that their knowledge and skills disadvantage is, to a large extent, a reflection of their socio-economic disadvantage. To evaluate this hypothesis, one can compare their performance with similarly disadvantaged non-immigrant students. The change in the performance gap before and after accounting for socio-economic background gives an approximation to the extent to which differences in student performance across immigrant background are associated with differences in socio-economic background. Although controlling for socio-economic background may statistically reduce the scale of the measured score difference between immigrant students and children of the native-born, the socio-economic disadvantage itself of course does not disappear, nor does the performance gap and its downstream consequences on schooling and labour market prospects.
Immigrant studentsAcross the OECD the performance gap between immigrant students and non-immigrant students diminishes from 44 to 27 score points after adjusting for socio-economic background, a reduction of 16 score points or more than a third of the initial disadvantage. However, the performance advantage of non-immigrant students remains in 21 out of 28 OECD countries with sufficient data (Table B2.1a).
Comparing students of similar socio-economic background reduces the performance differences across immigrant background but the Netherlands is the only country where the performance gap across immigrant background vanishes after adjusting for socio-economic background. The gap is halved in Luxembourg, Germany and France. In Slovenia, Austria, Denmark and Switzerland the performance gap is reduced by more than 40%. Finland, Mexico, Portugal and Estonia are the only OECD countries where the reductions are less than 15% of the initial disadvantage.
A few countries deviate from the general pattern of persistent performance disadvantages. In Australia, Israel and the United States, after comparing students of similar socio-economic background, immigrant students perform better than non-immigrant students but the gap is small: the widest is in Australia with 11 score points. The United States is the only case where there is a reversal in the direction of the gap after adjusting for socio-economic background. In Canada, the Czech Republic and Hungary there is no performance gap associated with immigrant background before or after adjusting for socio-economic background.
Second-generation studentsSecond-generation students face an important socio-economic disadvantage but their performance disadvantage with non-immigrant students was narrower than for first-generation students. Adjusting for socio-economic background, the performance disadvantage remains but it is almost halved across the OECD – it is reduced from 33 to 18 score points or a 46% reduction of the initial disadvantage equivalent to 15 score points (Table B2.1a).
Only in the United States and the Netherlands does the observed performance difference disappear after adjusting for socio-economic background. Out of the 27 OECD countries with enough data, there are 18 countries where the performance disadvantage of second-generation students remains after adjusting for socio-economic background. Among these countries, the narrowing of the gap is largest in Luxembourg, where socio-economic differences are associated with more than two thirds of the performance disadvantage of second-generation students. In Germany, Slovenia, France, Switzerland, Austria and Denmark, the gap is more than halved. In contrast, the gap is reduced by less than a third in Spain, Mexico, Finland and Estonia.
A number of countries diverge from this general pattern. In Australia second-generation students perform better than non-immigrant students and this advantage persists after adjusting for socio-economic background. In Hungary, there is no difference after adjusting for socio-economic background, while second-generation students outperformed non-immigrant students without the adjustment. In Canada, the United Kingdom, Ireland, the Czech Republic and Portugal there is no performance difference between second-generation students and non-immigrant students before or after adjusting for socio-economic background.
First-generation studentsFirst-generation students face a large performance disadvantage in 22 out of 28 OECD countries with enough data even after adjusting for socio economic background (Table B2.1a). Figure 2.9 displays the performance disadvantage between first-generation students and non-immigrant students. Countries are ranked by the number of score points the disadvantage narrows after adjusting for socio-economic background.
Figure 2.9 shows that the performance disadvantage of first-generation students persists after adjusting for socio-economic background, but it is substantially reduced in many cases. Across the OECD, the underperformance of first-generation students when compared with non-immigrant students is reduced from 52 to 35 score points, a reduction of some 17 score points or about a third of the initial disadvantage (Table B2.1a).

45UNTAPPED SKILLS: REALISING THE POTENTIAL OF IMMIGRANT STUDENTS © OECD 2012
THE PERFORMANCE PROFILES OF IMMIGRANT STUDENTS2
Adjusting for socio-economic background eliminates the performance difference in the United States, Israel and the Netherlands. Among the 22 countries where the disadvantage persists, the narrowing of the disadvantage is greatest in Luxembourg, where it is more than halved. In France, Germany, Norway, Slovenia and Greece the gap is narrowed by more than 40% of the initial disadvantage. In contrast, the gap is narrowed by less than a quarter of the initial disadvantage in Spain, Finland, Mexico and Portugal. In Ireland and Estonia the gap widens by a small margin. In Canada and New Zealand adjusting for socio-economic background widens the gap and makes it noticeable. While there was no apparent difference before adjusting for socio-economic background between first-generation students and non-immigrant students, after the adjustment a small but significant disadvantage for first-generation students becomes apparent in both countries (Table B2.1a).
Hungary, Australia and the Czech Republic are the only cases in the OECD where there is no performance disadvantage for first-generation students before or after adjusting for socio-economic background.
HETEROGENEITY IN KNOWLEDGE, SKILLS AND SOCIO-ECONOMIC BACKGROUNDA more diverse student population presents challenges for education systems. The immigrant students are often socio-economically disadvantaged and are unfamiliar with the language of instruction. Their knowledge and skills at age 15 reflect these deficits, but the performance of immigrant students still lags behind that of students from similar socio-economic backgrounds. However, the gap between these two groups is far from uniform across countries, as is also the diversity of immigrant populations. Indeed, the immigrant students form a relatively heterogeneous group when compared with non-immigrant students. Could this diversity be related to the performance gap between immigrant students and children of the native-born? This section evaluates the evidence in PISA on heterogeneity along two lines: knowledge and skills, and socio-economic background.
Figure 2.10 displays the relationship between the average performance difference between immigrant and non-immigrant students (on the vertical axis) and the dispersion of socio-economic background across immigrant students. While there are important exceptions to this pattern, the general pattern is that greater differences in performance are associated with immigrant populations of more diverse socio-economic backgrounds.
Beyond their disadvantaged socio-economic background, the main characteristic of the population of non-immigrant students is its diversity.
• Figure 2.9 • Performance gap between non-immigrant students and first-generation students before and after
accounting for socio-economic background
-130
-110
-90
-70
-50
-30
-10
10
30
50
70
90
110
OEC
DM
exic
o (1
4%)
Finl
and
(16%
)Ic
elan
d (2
6%)
Austr
ia (3
8%)
Italy
(27%
)Sw
eden
(38%
)
Den
mar
k (3
3%)
Spai
n (2
4%)
Belg
ium
(36%
)Sl
oven
ia (4
0%)
Fran
ce (4
4%)
Gre
ece
(40%
)
Switz
erla
nd (3
0%)
Irela
nd (-
12%
)N
orw
ay (4
1%)
Esto
nia
(-3%
)Po
rtuga
l (3%
)
Ger
man
y (4
3%)
OEC
D a
vera
ge (3
4%)
Uni
ted
King
dom
(32%
)
Luxe
mbo
urg
(58%
)
New
Zea
land
(-13
5%)
Net
herla
nds (
76%
)
Czec
h Re
publ
ic (-
56%
)Ca
nada
(-6%
)
Austr
alia
(38%
)
Hun
gary
(274
%)
Israe
l (15
0%)
Uni
ted
Stat
es (1
55%
)Pa
rtne
rsBr
azil
(8%
)Pa
nam
a (4
%)
Arge
ntin
a (4
1%)
Liec
hten
stein
(32%
)
Sing
apor
e (-2
32%
)
Russ
ian
Fede
ratio
n (2
1%)
Kaza
khsta
n (4
2%)
Croa
tia (4
9%)
Hon
g Ko
ng-C
hina
(67%
)Jo
rdan
(252
%)
Mon
tene
gro
(-23%
)
Trin
idad
and
Toba
go (1
08%
)
Azer
baija
n (5
9%)
Serb
ia (-
154%
)
Mac
ao-C
hina
(-48
%)
Kyrg
yzsta
n (0
%)
Dub
ai (U
AE)(1
5%)
Qat
ar (3
%)
Score pointdifference
After adjusting for socio-economic background Before adjusting for socio-economic background
Note: In parenthesis, the change in the performance gap after adjusting for socio-economic background as a proportion of the performance gap before adjusting for socio-economic background.
Countries are ranked in descending order of the score point differences in reading performance between non-immigrant students and first-generation students, after accounting for socio-economic background.
Source: Table B2.1a.
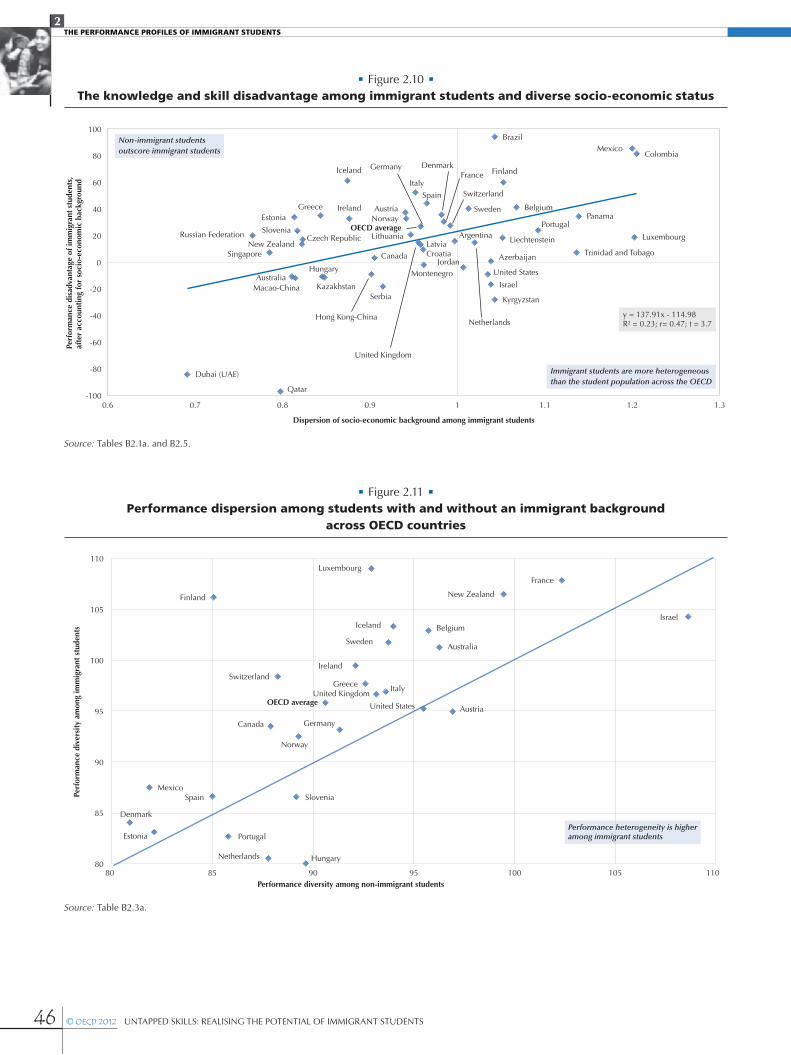
46 © OECD 2012 UNTAPPED SKILLS: REALISING THE POTENTIAL OF IMMIGRANT STUDENTS
THE PERFORMANCE PROFILES OF IMMIGRANT STUDENTS2
• Figure 2.10 • The knowledge and skill disadvantage among immigrant students and diverse socio-economic status
Australia
Austria Belgium
Canada
Czech Republic
Denmark
Estonia
FinlandFranceGermany
Greece
Hungary
Iceland
Ireland
Israel
Italy
Luxembourg
Mexico
Netherlands
New Zealand
NorwayPortugal
Slovenia
Spain
Sweden
Switzerland
United Kingdom
United States
OECD averageArgentina
Azerbaijan
Brazil
Colombia
Croatia
Dubai (UAE)
Hong Kong-China
Jordan
Kazakhstan
Kyrgyzstan
Latvia LiechtensteinLithuania
Macao-China
Montenegro
Panama
Qatar
Russian Federation
Serbia
Singapore Trinidad and Tobago0
-100
-80
-60
-40
-20
20
40
60
80
100
0.6 0.7 0.8 0.9 1 1.1 1.2 1.3
Perf
orm
ance
dis
adva
ntag
e of
imm
igra
nt s
tude
nts,
afte
r ac
coun
ting
for
soci
o-ec
onom
ic b
ackg
roun
d
Dispersion of socio-economic background among immigrant students
y = 137.91x - 114.98R² = 0.23; r= 0.47; t = 3.7
Non-immigrant studentsoutscore immigrant students
Immigrant students are more heterogeneousthan the student population across the OECD
Source: Tables B2.1a. and B2.5.
• Figure 2.11 • Performance dispersion among students with and without an immigrant background
across OECD countries
Israel
France
New Zealand
Austria
Australia
Belgium
United States
Iceland
Sweden
Italy United Kingdom
Luxembourg
Greece
Ireland
Germany
OECD average
Hungary
Norway
Slovenia
Switzerland
Canada
Netherlands
Portugal
Finland
Spain
Estonia
Mexico
Denmark
80
85
90
95
100
105
110
80 85 90 95 100 105 110
Perf
orm
ance
div
ersi
ty a
mon
g im
mig
rant
stu
dent
s
Performance diversity among non-immigrant students
Performance heterogeneity is higheramong immigrant students
Source: Table B2.3a.

47UNTAPPED SKILLS: REALISING THE POTENTIAL OF IMMIGRANT STUDENTS © OECD 2012
THE PERFORMANCE PROFILES OF IMMIGRANT STUDENTS2
Performance heterogeneity of immigrant students
Measures of dispersion: Standard deviation of performance
In most OECD countries, diversity among immigrant students is most evident in the dispersion of knowledge and skills within this group. Not only do these students face a disadvantage in knowledge and skills, but some of them are at a much greater disadvantage than others. Dispersion within a group is measured by the standard deviation of performance among students sharing a particular characteristic, in this case performance in reading.
In general, the performance dispersion is wider among immigrant students than among non-immigrant students. Minimum educational standards across OECD educational systems introduce a large amount of inter-generational progress. In other countries, these minimum standards may not exist and some may not have even completed primary school.
Figure 2.11 displays the performance dispersion among immigrant and non-immigrant students across OECD countries. For example, the dispersion of performance among non-immigrant students in the typical OECD country is 90 score points on the PISA reading scale.5 Such a dispersion implies that in the typical OECD country, the difference between the 15% of students with the lowest scores and the 15% with the highest scores is 90 score points. Only in Hungary, Slovenia, the Netherlands, Portugal, Spain, Estonia, Mexico and Denmark do immigrant students show a performance dispersion lower than 90 score points. In all other countries, the dispersion among immigrant students is about the same or much higher (Table B2.3a).
With some important exceptions, the wider the performance dispersion among non-immigrant students, the wider the performance dispersion among immigrant students. For example, in Finland and Luxembourg, dispersion among immigrant students is above 105 score points – well above the OECD average of 95 score points, and similar to that in New Zealand and France (both of which show wide performance dispersions among immigrant and non-immigrant students). Yet in Finland, the performance dispersion among non-immigrant students – 85 score points – is among the lowest across OECD countries, similar to the level found in Spain. And in Luxembourg, the performance dispersion among non-immigrant students is close to that of a typical OECD country (Table B2.3). This result suggests that performance dispersion is country-specific and thus depends in part on national policies.
• Figure 2.12 • Inter-quartile range of performance, by immigrant background
80
100
120
140
160
180
200
220
240
OEC
DFi
nlan
dLu
xem
bour
gSw
itzer
land
Irela
nd
Czec
h Re
publ
icCa
nada
Esto
nia
Fran
ce
New
Zea
land
Swed
en
OEC
D a
vera
geBe
lgiu
mU
nite
d St
ates
Austr
alia
Portu
gal
Ger
man
yN
orw
ayIsr
ael
Den
mar
kSp
ain
Icel
and
Net
herla
nds
Gre
ece
Austr
iaIta
lySl
oven
iaH
unga
ry
Uni
ted
King
dom
Mex
ico
Partn
ers
Trin
idad
and
Toba
goPa
nam
aQ
atar
Liec
hten
stein
Arge
ntin
aSi
ngap
ore
Dub
ai (U
AE)
Jord
an
Hon
g Ko
ng-C
hina
Russ
ian
Fede
ratio
nKy
rgyz
stan
Croa
tiaKa
zakh
stan
Mac
ao-C
hina
Serb
iaM
onte
negr
oAz
erba
ijan
Braz
ilLa
tvia
Colo
mbi
aLi
thua
nia
Score point differenceFirst-generation students Second-generation students Non-immigrant students
Note: The interquartile range of performance refers to the difference between the 75th and the 25th percentile of the performance in the reading scale.
Countries are ranked in descending order of the difference in the interquartile range of performance between first-generation students and non-immigrant students.
Source: Table B2.4.

48 © OECD 2012 UNTAPPED SKILLS: REALISING THE POTENTIAL OF IMMIGRANT STUDENTS
THE PERFORMANCE PROFILES OF IMMIGRANT STUDENTS2
Groups of students sharing common characteristics, such as country of birth, are generally less diverse. The largest performance dispersion is therefore observed among first-generation students, whose country of origin is not necessarily the same. Second-generation students were born in the country of assessment but their parents were born abroad and not necessarily in the same country as the parents of other second-generation students. First-generation students are more diverse than second-generation students, who are, in turn, more diverse than non-immigrant students (Table B2.3).
Figure 2.12 provides the inter-quartile range of performance across immigrant background, distinguishing between first and second-generation students. The inter-quartile range of performance among a particular group of students is defined as the difference between the 75th percentile of performance (above which only 25% of students in this group score) and the 25th percentile of performance (below which only 25% of students in this group score). It provides a different perspective into how diverse performance is within a particular group of students.
Across the OECD, the inter-quartile range of performance among non-immigrant students reaches 125 score points, smaller than among immigrant students (133 score points). The inter-quartile range of performance is larger among first-generation students (138 score points) than among second-generation students (129 score points). In Figure 2.12 countries are ranked according to the difference between the inter-quartile range of first-generation students and that of non-immigrant students. The difference is largest in Finland, Luxembourg, Switzerland, Ireland, Czech Republic, Canada, Estonia, France, New Zealand and Sweden among OECD countries and it is only reversed by more than 10 score points in Mexico. The Czech Republic and New Zealand are the only countries in this group where the inter-quartile range is even larger among second-generation students (Table B2.4).
Figure 2.12 highlights some important deviations from this general pattern. In Ireland and Canada, the inter-quartile range is high for first-generation students but not for second-generation students, relative to non-immigrant students. In the United States, Portugal, the Netherlands and Hungary, the inter-quartile range is small for second-generation students, but not so for first-generation students (Table B2.4).
Socio-economic heterogeneity of immigrant studentsDifferences in performance heterogeneity across immigrant backgrounds are relatively limited when compared with differences in socio-economic heterogeneity. The PISA index of economic, social and cultural status is constructed so that the dispersion in socio-economic background across all OECD students is one. Within-country socio-economic dispersion is naturally smaller; for example, it is equal to 0.87 in the typical OECD country among non-immigrant students. Figure 2.13 plots the differences in dispersion in socio-economic background according to immigrant background.
The differences are starker among first-generation students, but they are marked in practically all OECD countries. Across the 27 OECD countries with sufficient data, only second-generation students in Greece and Mexico appear to have a more homogeneous distribution of socio-economic background than non-immigrant students. In 17 countries, the opposite is true; and there appears to be no difference in Hungary, Spain, Ireland, Austria, Portugal and Estonia. Only in Hungary, Greece, Portugal, Spain and Italy are first-generation students more homogenous in socio-economic background than non-immigrant students. In 21 of 28 OECD countries with sufficient data, first-generation students form a more heterogeneous group of students than non-immigrant students. In Mexico, Iceland, New Zealand, Slovenia and Ireland there appears to be no difference in heterogeneity between these two groups of students (Table B2.5).
Not only are differences in socio-economic dispersion across immigrant background clearly seen in most OECD countries, they are also rather large. The dispersion of socio-economic background among immigrant students appear to be widest for first-generation students. For example, socio-economic dispersion in Sweden, Austria and Luxembourg among immigrant students stands at 1.01, 0.94 and 1.20 respectively, while for non-immigrant students, socio-economic dispersion stands at 0.76, 0.77 and 0.84, respectively (Table B2.5).
Across countries, socio-economic dispersion is associated with lower mean performance and larger performance gaps in favour of non-immigrant students. Countries where immigrant students come from more diverse socio-economic backgrounds are also those where the difference in reading performance is greater when comparing those students with non-immigrant students who have a similar socio-economic status.
However, socio-economic diversity is only part of the story. The proportion of immigrant students is actually negatively related to performance gaps in reading. Figure 2.14 shows the relationship between the proportion of immigrant students and performance gaps. Countries with larger populations of immigrant students are characterised by smaller performance differences between immigrant and non-immigrant students, after adjusting for socio-economic background. These examples show that it is possible to successfully integrate large proportions of immigrant students and reduce the performance differences between immigrant and non-immigrant students even when the size of the immigrant student population is considerable.

49UNTAPPED SKILLS: REALISING THE POTENTIAL OF IMMIGRANT STUDENTS © OECD 2012
THE PERFORMANCE PROFILES OF IMMIGRANT STUDENTS2
• Figure 2.13 • Relative socio-economic dispersion among immigrant students across OECD countries
-0.5
0.0
0.5
1.0
1.5
2.0
Mex
ico
Greece
Slove
nia
Hunga
rySp
ain
Irelan
d
Austri
a
Portu
gal
Eston
ia
OECD av
erag
e
New Z
ealan
dIta
ly
Austra
lia
Swed
en
German
y
Canad
a
Switz
erlan
d
Franc
e
United
State
s
Belgium
Denmark
Czech
Rep
ublic
United
King
dom
Finlan
d
Netherl
ands
Norway
Israe
l
Luxe
mbour
g
Immigrant students are more diversethan non-immigrant students
Non-immigrant students are more diversethan immigrant students
Second-generation students
-0.5
0.0
0.5
1.0
1.5
2.0
Hunga
ry
Greece
Portu
gal
Spain
Ita
ly
Mex
ico
Icelan
d
New Z
ealan
d
Slove
nia
Irelan
d
Czech
Rep
ublic
Austra
lia
Canad
a
OECD av
erag
e
Denmark
Eston
ia
German
y
Israe
l
Belgium
United
State
s
United
King
dom
Norway
Switz
erlan
d
Finlan
d
Franc
e
Netherl
ands
Luxe
mbour
g
Austri
a
Swed
en
Immigrant students are more diversethan non-immigrant students
Non-immigrant students are more diversethan immigrant students
First-generation students
Note: Relative diversity is defined as the ratio of the variance in socio-economic background in the group of immigrant students (e.g. first generation students) to the variance of socio-economic background in the group of non-immigrant students (e.g. in the same case as before, non-immigrant students) minus one. If both variances are equal, the relative diversity so defined would be zero.
Countries are ranked in ascending order of the relative diversity of immigrant students.
Source: Table B2.5.
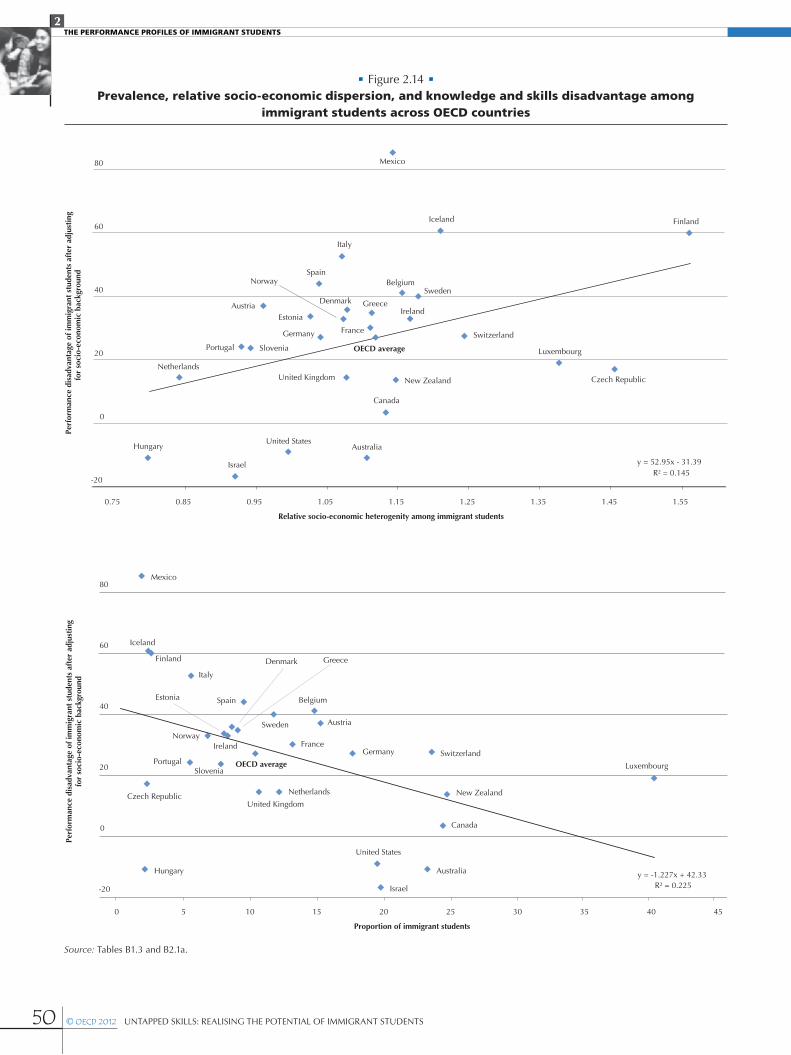
50 © OECD 2012 UNTAPPED SKILLS: REALISING THE POTENTIAL OF IMMIGRANT STUDENTS
THE PERFORMANCE PROFILES OF IMMIGRANT STUDENTS2
• Figure 2.14 • Prevalence, relative socio-economic dispersion, and knowledge and skills disadvantage among
immigrant students across OECD countries
Australia
Austria
Belgium
Canada
Czech Republic
Denmark
Estonia
Finland
France Germany
Greece
Hungary
Iceland
Ireland
Israel
Italy
Luxembourg
Mexico
Netherlands
New Zealand
Norway
Portugal Slovenia
Spain
Sweden
Switzerland
United Kingdom
United States
OECD average
y = 52.95x - 31.39 R² = 0.145
-20
0
20
40
60
80
0.75 0.85 0.95 1.05 1.15 1.25 1.35 1.45 1.55
Perf
orm
ance
dis
adva
ntag
e of
imm
igra
nt s
tude
nts
afte
r ad
just
ing
for
soci
o-ec
onom
ic b
ackg
roun
d
Relative socio-economic heterogenity among immigrant students
Australia
Austria
Belgium
Canada
Czech Republic
Denmark
Estonia
Finland
France Germany
Greece
Hungary
Iceland
Ireland
Israel
Italy
Luxembourg
Mexico
Netherlands New Zealand
Norway
Portugal Slovenia
Spain
Sweden
Switzerland
United Kingdom
United States
OECD average
y = -1.227x + 42.33 R² = 0.225 -20
0
20
40
60
80
0 5 10 15 20 25 30 35 40 45
Perf
orm
ance
dis
adva
ntag
e of
imm
igra
nt s
tude
nts
afte
r ad
just
ing
for
soci
o-ec
onom
ic b
ackg
roun
d
Proportion of immigrant students
Source: Tables B1.3 and B2.1a.
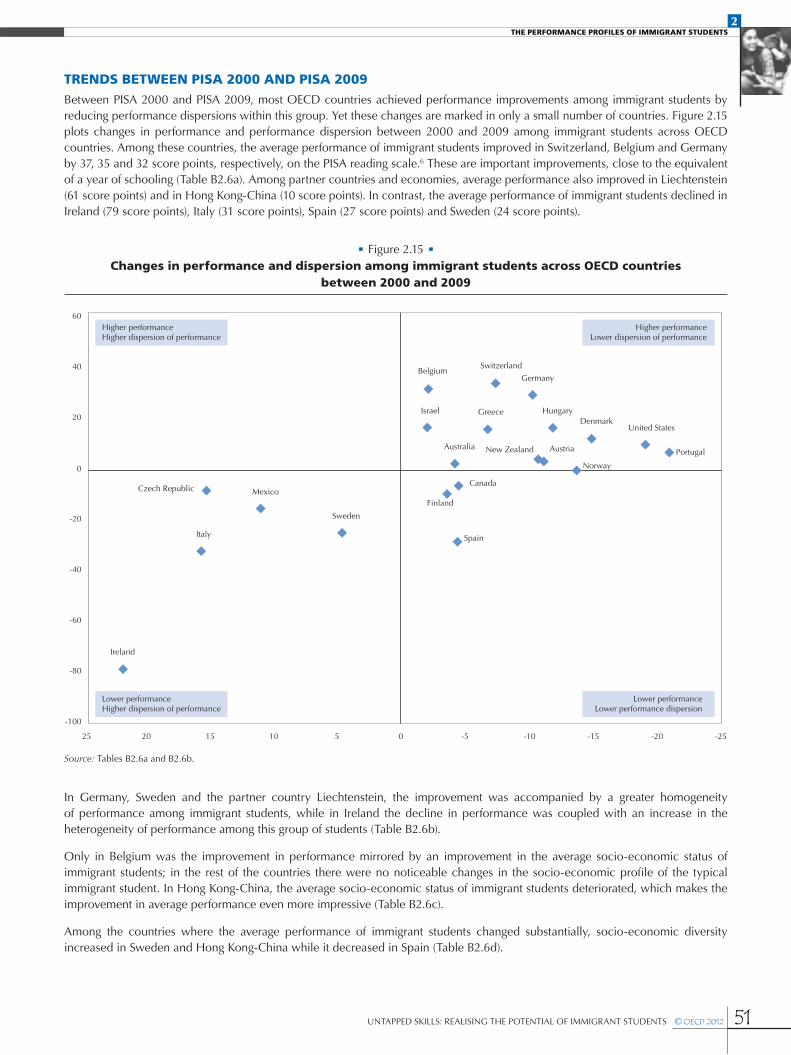
51UNTAPPED SKILLS: REALISING THE POTENTIAL OF IMMIGRANT STUDENTS © OECD 2012
THE PERFORMANCE PROFILES OF IMMIGRANT STUDENTS2
TRENDS BETWEEN PISA 2000 AND PISA 2009Between PISA 2000 and PISA 2009, most OECD countries achieved performance improvements among immigrant students by reducing performance dispersions within this group. Yet these changes are marked in only a small number of countries. Figure 2.15 plots changes in performance and performance dispersion between 2000 and 2009 among immigrant students across OECD countries. Among these countries, the average performance of immigrant students improved in Switzerland, Belgium and Germany by 37, 35 and 32 score points, respectively, on the PISA reading scale.6 These are important improvements, close to the equivalent of a year of schooling (Table B2.6a). Among partner countries and economies, average performance also improved in Liechtenstein (61 score points) and in Hong Kong-China (10 score points). In contrast, the average performance of immigrant students declined in Ireland (79 score points), Italy (31 score points), Spain (27 score points) and Sweden (24 score points).
In Germany, Sweden and the partner country Liechtenstein, the improvement was accompanied by a greater homogeneity of performance among immigrant students, while in Ireland the decline in performance was coupled with an increase in the heterogeneity of performance among this group of students (Table B2.6b).
Only in Belgium was the improvement in performance mirrored by an improvement in the average socio-economic status of immigrant students; in the rest of the countries there were no noticeable changes in the socio-economic profile of the typical immigrant student. In Hong Kong-China, the average socio-economic status of immigrant students deteriorated, which makes the improvement in average performance even more impressive (Table B2.6c).
Among the countries where the average performance of immigrant students changed substantially, socio-economic diversity increased in Sweden and Hong Kong-China while it decreased in Spain (Table B2.6d).
• Figure 2.15 • Changes in performance and dispersion among immigrant students across OECD countries
between 2000 and 2009
Australia Austria
Belgium
Canada Czech Republic
Denmark
Finland
Germany
Greece Hungary
Ireland
Israel
Italy
Mexico
New Zealand
Norway
Portugal
Spain
Sweden
Switzerland
United States
-100
-80
-60
-40
-20
0
20
40
60
-25 -20 -15 -10 -5 0 5 10 15 20 25
Higher performanceHigher dispersion of performance
Lower performanceHigher dispersion of performance
Higher performanceLower dispersion of performance
Lower performanceLower performance dispersion
Source: Tables B2.6a and B2.6b.

52 © OECD 2012 UNTAPPED SKILLS: REALISING THE POTENTIAL OF IMMIGRANT STUDENTS
THE PERFORMANCE PROFILES OF IMMIGRANT STUDENTS2
First and second-generation studentsAnalysing country of birth across immigrant students reveals that some of these trends are in part the result of differences in the changes taking place across sub-populations of immigrant students. The general observation that improvements in average performance and lower dispersion go hand in hand is reinforced.
Figure 2.16 plots changes in mean socio-economic background, mean performance and dispersion of performance across country of birth for immigrant students as well as changes. To better appreciate country differences the extreme improvement in mean performance among first-generation students in the partner country Liechtenstein and the extreme decline among this group in Ireland have been excluded (Tables B2.6e and B2.6f).
• Figure 2.16 • Changes in mean socio-economic background, performance and dispersion among immigrant students
by country of birth
Figure 2.16a. Second-generation students
-55
-35
-15
5
25
45
-25 -20 -15 -10 -5 0 5 10 15 20 25
Rel
atio
nshi
p be
twee
n re
adin
g pe
rfor
man
ce a
nd p
efor
man
ce d
ispe
rsio
n in
rea
ding
Lower performance and dispersion ofperformance in 2009 than in 2000
Higher performance and dispersion ofperformance in 2009 than in 2000
Australia
Austria
Canada
Denmark
Germany
Ireland
Mexico
New Zealand
Norway
Portugal
Sweden
France
OECD average
Argentina
Latvia
Russian Federation
Liechtenstein Belgium
Israel
Spain Switzerland Hong Kong-China
Marked change Change not significant
More advantaged socio-economic backgroundin 2009 than in 2000.Higher performance in 2009 than in 2000
More advantaged socio-economic backgroundin 2009 than in 2000.Lower performance in 2009 than in 2000
Rel
atio
nshi
p be
twee
n re
adin
g pe
rfor
man
ce a
nd s
ocio
-eco
nom
ic b
ackg
roun
d
Australia
Austria
Belgium
Canada
Denmark
Germany
Ireland
Israel
Mexico
New Zealand
Norway
Portugal
Spain
Sweden
Switzerland United States
OECD average Argentina
Hong Kong-China
Latvia
Russian Federation
France
-55
-35
-15
5
25
45
-0.80 -0.60 -0.40 -0.20 0.00 0.20 0.40 0.60 0.80 1.00
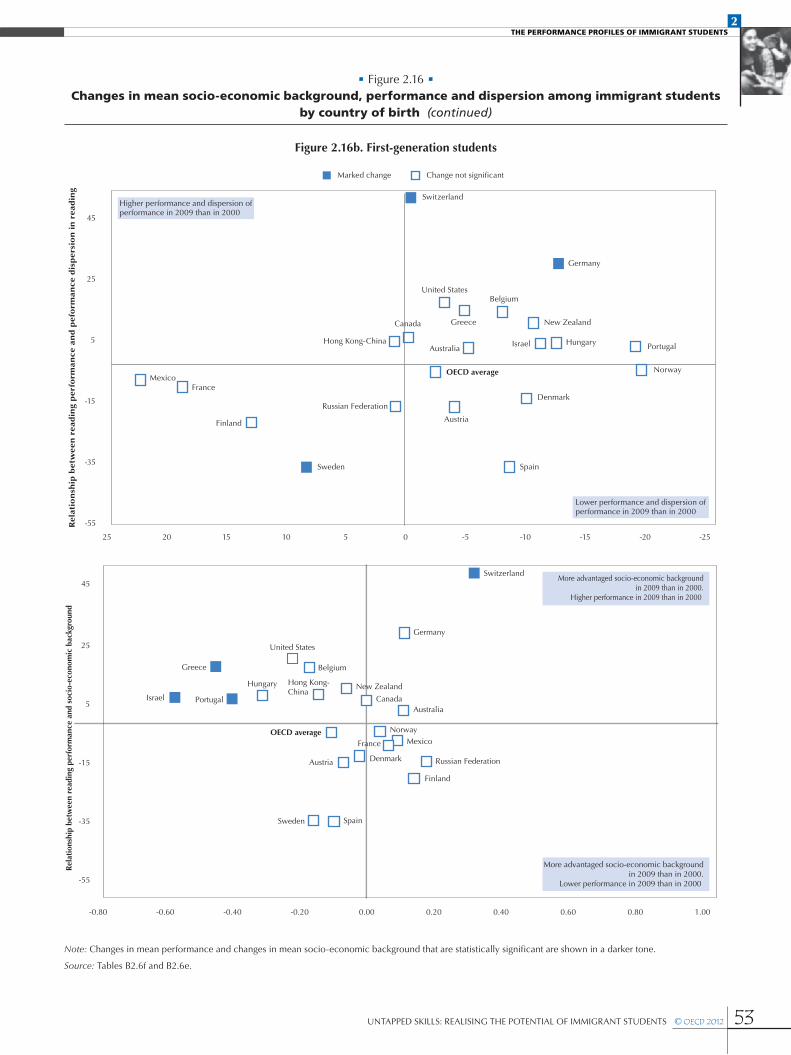
53UNTAPPED SKILLS: REALISING THE POTENTIAL OF IMMIGRANT STUDENTS © OECD 2012
THE PERFORMANCE PROFILES OF IMMIGRANT STUDENTS2
• Figure 2.16 • Changes in mean socio-economic background, performance and dispersion among immigrant students
by country of birth (continued)
Figure 2.16b. First-generation students
Lower performance and dispersion ofperformance in 2009 than in 2000
Higher performance and dispersion ofperformance in 2009 than in 2000
Rela
tio
nsh
ip b
etw
een r
ead
ing
perf
orm
an
ce a
nd p
efo
rman
ce d
isp
ers
ion i
n r
ead
ing
Australia
Austria
Belgium
GreeceCanada
Denmark
Germany
Israel
Mexico
Finland
France
New Zealand
Norway
Portugal
Spain Sweden
Switzerland
United States
OECD average
HungaryHong Kong-China
Russian Federation
-55
-35
-15
5
25
45
-25 -20 -15 -10 -5 0 5 10 15 20 25
Marked change Change not significant
More advantaged socio-economic backgroundin 2009 than in 2000.
Higher performance in 2009 than in 2000
More advantaged socio-economic backgroundin 2009 than in 2000.
Lower performance in 2009 than in 2000
Rel
atio
nshi
p be
twee
n re
adin
g pe
rfor
man
ce a
nd s
ocio
-eco
nom
ic b
ackg
roun
d
Australia
Austria Denmark
Canada
Belgium Greece
Finland
Mexico France
Israel
Hungary
Norway
New Zealand
Portugal
Spain Sweden
United States
OECD average
Germany
Hong Kong-China
Switzerland
Russian Federation
-55
-35
-15
5
25
45
-0.80 -0.60 -0.40 -0.20 0.00 0.20 0.40 0.60 0.80 1.00
Note: Changes in mean performance and changes in mean socio-economic background that are statistically significant are shown in a darker tone.
Source: Tables B2.6f and B2.6e.

54 © OECD 2012 UNTAPPED SKILLS: REALISING THE POTENTIAL OF IMMIGRANT STUDENTS
THE PERFORMANCE PROFILES OF IMMIGRANT STUDENTS2
Figure 2.16 highlights general trends towards higher mean scores in PISA 2009 relative to PISA 2000 among second-generation students, where performance improved in Belgium, Denmark, Israel, Germany and the partner countries and economies Latvia, Liechtenstein and Hong Kong-China. Of these, only the performance improvement in Belgium is associated with an improvement in the mean socio-economic background. In Israel and Germany, the improvement in performance took place despite a decline in average socio-economic background. Second-generation students in Canada, Mexico and Sweden suffered a decline in average performance, associated with a decline in average socio-economic background only in Canada (Tables B2.6e and B2.6f).
Among first-generation students, only in Switzerland and Germany there are marked improvements and in the Swiss case they are associated with higher average socio-economic background (Tables B2.6e and B2.6f).
SUMMARY AND CONCLUSIONSDesigning policies that are effective in allowing all students to reach their potential requires that differences and similarities between immigrant and non-immigrant students be taken into account. While this chapter characterises those differences and similarities within and across countries, it also highlights the heterogeneity of immigrant student populations. Differences in the performance and profiles of immigrant students are associated with the varying degrees of success of educational systems in mitigating the performance differences among these students. The more diverse the immigrant student population, in absolute terms or relative to the non-immigrant student population, the greater the challenge of integrating these students will be.
Notes
1. This report only includes estimates based on at least 30 students from five different schools. According to this criterion, the data on children of immigrants in Chile, Japan, Korea, Poland, the Slovak Republic and Turkey are not sufficiently reliable to be included in this report.
2. Albania, Bulgaria, Chinese Taipei, Colombia, Peru, Romania, Shanghai-China, Tunisia, Uruguay, Indonesia and Thailand are not included in this report because the student populations with an immigrant background in these countries and economies were not sufficiently large to produce reliable estimates.
3. The differences in Iceland are very large but the number of observations is very small, therefore it is not possible to say that the estimates are statistically different with a high degree of confidence.
4. In Mexico, the proportion of top performers across all students is very small and ratio of top performers is very high (because of the low number in the denominator).
5. Across all students in the OECD area, the dispersion in performance on the PISA 2000 reading scale was set to 100. Dispersion has not decreased; rather we are looking at the average dispersion across countries as a more appropriate benchmark. The entire OECD population is quite diverse, in it of itself; however the student population within each country is less diverse.
6. For an in-depth study of the performance changes in Switzerland see Cattaneo and Wolter (2012) and for Germany see Ehmke, et al. (2012).
References
Cattaneo, M. A. and S. C. Wolter (2012), “Migration Policy Can Boost PISA Results: Findings from a Natural Experiment”, IZA Discussion Paper Series, No. 6300, Institute for the Study of Labour, Bonn.
Ehmke, T., P. Stanat and E. Klieme (2012), “Erklärungsansätze für Veränderungen in der Lesekompetenz von PISA 2000 nach PISA 2009,” Zeitschrift für Pädagogik.
OECD (2010), PISA 2009 Results: What Students Know and Can Do: Student Performance in Reading, Mathematics and Science (Volume I), PISA, OECD Publishing.

55UNTAPPED SKILLS: REALISING THE POTENTIAL OF IMMIGRANT STUDENTS © OECD 2012
3
Many children of immigrants face a language barrier at school – they speak a different language at home than the language of instruction, which is also the language of their PISA test. Immigrant students with lower levels of performance in PISA tend to speak another language at home. Greater exposure to and the mastery of the assessment language is associated with better performance. Policies which promote this enhanced exposure are likely to help bridge the gap between immigrant and non-immigrant students.
Mastery of the Assessment Language and Reading Outcomes

56 © OECD 2012 UNTAPPED SKILLS: REALISING THE POTENTIAL OF IMMIGRANT STUDENTS
MASTERY OF THE ASSESSMENT LANGUAGE AND READING OUTCOMES3
INTRODUCTIONThe fact that many immigrant children arrive speaking a main language different from that of the destination country is undoubtedly the most significant barrier to development of good reading skills in the host-county language. Even for immigrant students born in the country or who arrived at an early age, exposure to the language of the country of residence may not be as extensive as it is for non-immigrant students, among other reasons because the language mostly spoken at home may not be the host-country language.
The objective of this chapter is to more closely examine the issue of language proficiency among immigrant students and its link to reading outcomes in PISA. In an assessment such as PISA, the reading performance of immigrant students will often be a function both of language proficiency and of skill level with respect to the types of tasks being assessed. However, the two cannot be easily disentangled and language proficiency can be said to determine the ability of persons assessed to mobilise the skills which they possess in the accomplishment of reading tasks.
There are several factors which can affect language proficiency. Among these are the age at arrival, the analysis of which is explored in Chapter 4. The other main determinants explored in this chapter relate to the amount of exposure to the assessment language in different environments, in particular exposure to that language at home and at school.
The objective is to examine the extent to which exposure to the assessment language is related to proficiency in that language. Does greater exposure to the assessment language, for example through use at home, improve performance in PISA? Does it reduce the observed difference between immigrant and non-immigrant students? How relevant is exposure to the assessment language at school, for example through attendance at pre-primary school or indeed schools where most students’ mother tongue is the language of the host-country? To what extent does extensive exposure to a different language matter, compared to parental education, for example?
WHAT FACTORS AFFECT LANGUAGE PROFICIENCY?Migrants’ lower language proficiency in the assessment language is partly explained by their lower exposure to the assessment language. For first-generation immigrants whose native language is different from the language of assessment used in PISA, the first factor that influences exposure is the amount of time immigrants have lived in the host-country; generally the earlier the arrival, the better the reading outcome. This question is pursued further in Chapter 4.
LANGUAGE EXPOSURE AT HOMEFor many immigrants, the language of the country of migration is not their native language. This is a truism that typifies the challenges faced by immigrants in their adopted countries. If they must sometimes deal with a second (or third) language in their work or daily dealings with others in the country of residence, the home environment is one where the comfort and familiarity of a language they master well can be enjoyed. Even if both spouses of an immigrant household are able to speak the language of the host-country, they will normally not speak it to each other. Their children, therefore, are likely to learn the language of their parents as their first language and to be exposed to the language of the host-country only through older siblings, relatives or friends, the media (television and Internet) or school attendance.
This in itself might lead one to expect lower performance levels on the part of persons who speak mostly a foreign language at home. Moreover, over the past 20 years, the means (electronic) to maintain contact with the language, culture and way of life of the country of origin at very low cost have expanded tremendously, so that the presence and use of the assessment language in the home may well be even less frequent than in the past.
Almost two thirds of first-generation immigrants in OECD countries do not speak the language of the test assessment at home (Figure 3.1). In northern European countries like Norway, Iceland, Sweden and Finland, the percentage of first-generation immigrants not speaking the test language at home increases to over 80%. Only in a few OECD countries (Belgium, Australia, Spain, Portugal and Mexico) is the percentage of first-generation immigrants who do not speak the test language at home lower than 50%.
In partner countries, the situation is different: 72% of first-generation immigrants on average speak the test language at home, but there is some heterogeneity. In several partner countries, like Serbia, Croatia or Macao-China, the percentage is even higher than 90%. A notable exception is Singapore, where the percentage of first-generation immigrants speaking the test language at home is only 17%.
Second-generation immigrants tend to speak the test language at home to a greater extent than first-generation migrants. One reason for this is that the parents of many second-generation students themselves arrived in the country when they were quite young and speak the language of the host-country as their main language (Table 1.2). The share of second-generation students who do not speak the test language at home in OECD countries is on average 25 percentage points lower than that of first-generation students. In the Czech Republic, Israel, Ireland and Greece, the share is even over 40 percentage points lower. The few exceptions where the

57UNTAPPED SKILLS: REALISING THE POTENTIAL OF IMMIGRANT STUDENTS © OECD 2012
MASTERY OF THE ASSESSMENT LANGUAGE AND READING OUTCOMES3
• Figure 3.1 • Share of students who speak a language different from the test language at home,
by migration status
0%
10%
20%
30%
40%
50%
60%
70%
80%
90%
100%
Norway
OECD
Icelan
d
Swed
en
Finlan
d
Czech
Repu
blic
Italy
Slove
nia
Austria
German
y
Israe
l
United
State
s
Luxe
mbour
g
Netherl
ands
Denmark
United
Kingdo
m
Canad
a
OECD av
erage
Switz
erlan
d
Franc
e
Greece
Irelan
d
New Zea
land
Belgium
Austra
lia
Spain
Portu
gal
Mex
ico
Eston
ia
Partn
ers
Singa
pore
Dubai
(UAE)
Liech
tenste
in
Qatar
Pana
ma
Trinid
ad an
d Tob
ago
Argenti
na
Azerb
aijan
Russi
an Fe
derat
ion
Hong K
ong-C
hina
Braz
il
Kazak
hstan
Mon
teneg
ro
Jorda
n
Mac
ao-C
hina
Croati
a
Serb
ia
Kyrgy
zstan
Lithu
ania
Latvi
a
Second-generation students First-generation students
Countries are ranked in descending order of the share of students from the first generation who do no speak the test language.
Source: Table B3.1.
• Figure 3.2 • Relationship between the share of students who speak a language different from the test language
at home and score differential
Score point difference Percentage of children of immigrants who mostly speaka foreign language at home (columns)
Croatia
Serbi
aJor
dan
Hunga
ry
Macao
-Chin
a
Kaza
khsta
n
Monten
egro
Eston
ia
Hong K
ong-C
hina
Azerba
ijan
Latvi
a
Argenti
na
Portu
gal
Russi
an Fe
derat
ion
Austra
lia
Lithu
ania
Greece
Franc
eIsr
ael
Spain
Netherl
ands
Irelan
d
Czech
Repu
blic
Liech
tenste
in
United
King
dom
New Ze
aland
Canad
a
Belgi
um
Danmark
Switz
erlan
d
Slove
nia
German
y
United
State
s
Swed
en Italy
Austria
Finlan
d
Luxe
mbourg
Norway
Icelan
d
Singa
pore
-100
-80
-60
-40
-20
0
20
40
0%
10%
20%
30%
40%
50%
60%
80%
90%
70%
Countries are ranked in ascending order of the share of students who speak a language different from the test language at home.
Source: Tables B2.1a and B3.1.

58 © OECD 2012 UNTAPPED SKILLS: REALISING THE POTENTIAL OF IMMIGRANT STUDENTS
MASTERY OF THE ASSESSMENT LANGUAGE AND READING OUTCOMES3
• Figure 3.3 • Differential score controlling (and not controlling) if the test language is spoken at home,
by migration status
-130 -80 -30 20 70
Mexico
Iceland
Finland
Austria
Italy
Sweden
Denmark
Greece
Spain
Slovenia
France
Germany
Belgium
Portugal
OECD average
Norway
Switzerland
Ireland
Estonia
United Kingdom
Luxembourg
Netherlands
New Zealand
Israel
Canada
United States
Czech Republic
Australia
Part
ners
OEC
D
Brazil
Panama
Argentina
Lithuania
Liechtenstein
Croatia
Kazakhstan
Singapore
Hong Kong-China
Russian Federation
Montenegro
Latvia
Jordan
Serbia
Macao-China
Trinidad and Tobago
Kyrgyzstan
Azerbaijan
Dubai (UAE)
Qatar
120
Second generation students controlling if test language spoken at home
Second generation students
Mexico
Iceland
Finland
Austria
Italy
Sweden
Denmark
Greece
Spain
Slovenia
France
Germany
Belgium
Portugal
OECD average
Norway
Switzerland
Ireland
Estonia
United Kingdom
Luxembourg
Netherlands
New Zealand
Israel
Canada
United States
Czech Republic
Australia
Brazil
Panama
Argentina
Lithuania
Liechtenstein
Croatia
Kazakhstan
Singapore
Hong Kong-China
Russian Federation
Montenegro
Latvia
Jordan
Serbia
Macao-China
Trinidad and Tobago
Kyrgyzstan
Azerbaijan
Dubai (UAE)
Qatar
-130 -80 -30 20 70 120
First generation students First generation students controllingif test language spoken at home
Note: Differential test score for first- and second-generation immigrant, controlling for parental education and controlling (or not controlling) for test language spoken at home.
Countries are ranked in ascending order of the score point difference among first-generation students, without controlling if test language is spoken at home.
Source: Tables B3.2 and B3.3.

59UNTAPPED SKILLS: REALISING THE POTENTIAL OF IMMIGRANT STUDENTS © OECD 2012
MASTERY OF THE ASSESSMENT LANGUAGE AND READING OUTCOMES3
proportion of second-generation students not speaking the test language at home is higher than that of first-generation students are Spain, Belgium and Luxembourg, probably because first- and second-generation students belong to different migration waves. For partner countries, second-generation immigrants also tend to speak the test language at home to a greater extent. On average, 81% of second-generation immigrants speak the test language at home, 9 percentage points higher than for first-generation immigrants.
The importance of language exposure for PISA reading scores is evident from Figure 3.2, which shows for each country the percentage of students mostly speaking a language at home other than the language of instruction and the score difference between immigrant students (first- and second-generation combined) and children of the native-born.
The difference in PISA reading performance between students who do not speak the assessment language at home and the children of the native-born is massive, averaging over 50 points for first-generation students and 35 points for second-generation in OECD countries. Nothing illustrates as clearly as this the paramount importance of language for the integration of the immigrant students.
In fact, exposure to the test language at home gives a substantial advantage in language proficiency for first- and second-generation students (Figure 3.3). On average, a second-generation student in an OECD country has a reading score 27 points higher if he speaks the test language at home and a first-generation student a reading score 30 points higher.
Exposure to the test language at home can be seen to have significant impacts on reading scores (Figure 3.3). Reading score differences for both first- and second-generation students compared to non-immigrant students are substantially reduced after controlling for the language spoken at home. On average in the OECD, the score is reduced by 11 points for second-generation (a 42% reduction) and by 18 points for first-generation immigrants (a 38% reduction).
In some countries like New Zealand, Israel, Canada, United States, the Czech Republic and Australia, the score difference for first-generation students even becomes positive, implying that migrants have higher reading scores than natives after controlling for whether or not the test language is spoken at home. This highlights the importance of exposure to the assessment language at home. Admittedly policy cannot expect to impose what language should be spoken in the home environment, but it can act to increase the exposure of immigrant students in the school or para-school environment, for example, through enhanced language learning for immigrant students as well as their parents or by “open school” programmes during the summer months.
• Figure 3.4 • Reading score advantage if having over 100 books at home, by migration status,
controlling for parental education and language at home
Austri
a
OECD
Partn
ers
United
King
dom
Franc
e
Czech
Rep
ublic
United
State
s
Swed
en
Irelan
d
German
y
Luxe
mbour
g
New Z
ealan
d
Netherl
ands
Switz
erlan
d
Norway
Austra
lia
Slove
nia
OECD av
erag
e
Belgium
Ita
ly
Finlan
d
Canad
a
Spain
Icelan
d
Denmark
Greece
Israe
l
Eston
ia
Portu
gal
Mex
ico
Kyrgyz
stan
Argenti
na
Liech
tenste
in
Pana
ma
Kazak
hstan
Russia
n Fed
eratio
n
Serb
ia
Lithu
ania
Mon
teneg
ro
Croati
a
Hong K
ong-C
hina
Singa
pore
Latvi
a
Azerb
aijan
Brazil
Mac
ao-C
hina
Trini
dad a
nd To
bago
Qatar
Jorda
n
Dubai
(UAE)
0
20
40
60
80
100
120 Second-generation students First-generation students Non-immigrant students
Note: OLS coefficients of a variable indicating if the household has over 100 books. Separate regressions for immigrant and non-immigrants.
Countries are ranked in descending order of the reading score advantage if having over 100 books at home among non-immigrant students.
Source: Table B3.5.

60 © OECD 2012 UNTAPPED SKILLS: REALISING THE POTENTIAL OF IMMIGRANT STUDENTS
MASTERY OF THE ASSESSMENT LANGUAGE AND READING OUTCOMES3
Other factors in the home environment may act to improve the reading skills of the children, such as the availability of reading materials like books and newspapers, which is one of the strongest factors related to good reading outcomes. Both non-immigrant and first- and second-generation immigrants have higher reading scores if there are more books in the home and this remains true even after controlling for parental education and language spoken at home (Figure 3.4). On average, a first-generation immigrant in the OECD has a score 61 points higher if his household possesses over 100 books. This premium also exists for second-generation students (45 points) and for non-immigrant students (51 points).
In some countries, first-generation students tend to reap higher benefits from the availability of reading materials at home than non-immigrant students, but this is not the case everywhere, for reasons which are easily discernible (Figure 3.4).
LANGUAGE EXPOSURE AT SCHOOLEarly entry into formal education can be beneficial to immigrant students, not only because they enter the formal education system per se but also because they can increase their exposure to the host-country language. The analysis in this section is limited to immigrant students born in the country, because most of those born abroad will not have attended pre-primary schooling in the host country.
Figure 3.5 shows the score premium of attending pre-primary schooling for one year or more, for non-immigrant and second-generation students.
Attendance in pre-primary education is clearly linked with higher reading scores at age 15. On average in the OECD, a second-generation student who has attended pre-primary education has a reading score 23 points higher than one who did not attend pre-primary schooling (Table B3.4a). The premium for attending pre-primary schooling is even higher for immigrants in Italy (a score 50 points higher), Portugal (37 points higher) and Germany (32 points higher). Non-immigrant students who attended pre-primary schooling also have a higher score (27 points difference).
For students in partner countries, attendance in pre-primary education is also associated with higher scores. Immigrant students who attended pre-primary education have scores 30 points higher than those who did not. Non-immigrant students in partner countries have a similar average benefit from attending pre-primary education (31 points).
Attendance at pre-primary remains strong and significant after controlling for parental education, migration status and whether a foreign language is spoken at home (Table B3.4b). The average difference in OECD after controlling for these characteristics is over 20 points higher scores (around half a year of formal schooling). For Germany and Italy, the advantage is around 34 points, for France around 34 points, for Israel around 50 points and for Belgium almost 70 points. The effect, however, does not seem significantly more advantageous for second-generation immigrants than for non-immigrants (Table B3.4b).1
A higher concentration in schools of students who do not speak the test language at home is related to worse outcomes for both non-immigrant and immigrant students.As is well known, immigrants tend to concentrate in certain neighbourhoods. The impact of this concentration on immigrant educational and labour market outcomes is a question of some interest and will be considered with respect to reading outcomes more generally in Chapter 5. This chapter looks at how individual reading outcomes vary according to the percentage of immigrants in schools who speak another language at home.2 As noted above, reading outcomes are not as good on average if students speak another language at home, but there may also be a collective effect due to the grouping of such students in the same schools. Students learn from each other and a lower overall level of language proficiency in the school environment may hamper peer-influenced learning. In order to study the effect of concentration of those students, the share of individuals not speaking the test language at the school level is computed from the individual responses to the language spoken at home.3 A detailed analysis of the effects of concentration in the school, in particular relating to other types of disadvantage, can be found in a separate chapter.
The percentage of students in a school mostly speaking another language at home varies significantly according to whether the student is of immigrant origin or not. Non-immigrant students attend mostly schools where there is a low prevalence of students who do not speak the test language at home. On average in the OECD, over 74% of non-immigrant students attend schools where less than 10% of the students mostly speak another language at home (Table B3.6). Only 6% of non-immigrants attend schools where more than 40% of the students mostly speak another language at home. In partner countries also, over 75% of non-immigrant students attend schools with a low percentage of students not speaking the test language (less than 10% of students).
First- and second-generation students tend to attend schools with a higher proportion of students who mostly do not speak the test language at home. In the OECD, around 62% of second-generation students and 64% of first-generation students are in schools where more than 10% of students do not speak the test language at home (see Figure 3.7). In partner countries, first- and second-generation students are less concentrated in schools with a high proportion of students not speaking the test language at home. Around 32% of second-generation students and 36% of first-generation students attend schools with a percentage of students not speaking the test language at home higher than 10%. A detailed distribution for each country can be found in Table B3.6.

61UNTAPPED SKILLS: REALISING THE POTENTIAL OF IMMIGRANT STUDENTS © OECD 2012
MASTERY OF THE ASSESSMENT LANGUAGE AND READING OUTCOMES3
• Figure 3.5 • Differential score if attending pre-primary school for at least one year,
non-immigrants and second-generation immigrants
OEC
D Italy
Greece
Portugal
Germany
New Zealand
Spain
United Kingdom
Sweden
Israel
Australia
Canada
Austria
Denmark
OECD average
Switzerland
United States
Netherlands
Estonia
Luxembourg
Ireland
Mexico
Slovenia
Belgium
France
Iceland
Norway
Finland
Czech Republic
Part
ners Kyrgyzstan
Qatar
Dubai (UAE)
Kazakhstan
Argentina
Macao-China
Azerbaijan
Hong Kong-China
Jordan
Croatia
Russian Federation
Montenegro
Serbia
Latvia
Brazil
Panama
Singapore
Lithuania
Trinidad and Tobago
-20-40 0 20 40 60 80 100
Score point difference
Non-immigrant students Second-generation students
Note: Lighter shades indicate non-significant differences.
Countries are ranked in descending order of the score point difference among second-generation students if they attended pre-primary school for at least one year.
Source: Table B3.4a.

62 © OECD 2012 UNTAPPED SKILLS: REALISING THE POTENTIAL OF IMMIGRANT STUDENTS
MASTERY OF THE ASSESSMENT LANGUAGE AND READING OUTCOMES3
The percentage of students in schools that generally do not speak the test language at home is negatively correlated with language outcomes for non-immigrants as well as second- and first-generation students. Reading scores of non-immigrants, and first- and second-generation students are highest when it is uncommon for students to speak another language at home, that is, from 0% to under 10%. The scores decline as the concentration of foreign-language speakers increases (Figure 3.6).
• Figure 3.6 • Reading scores by percentage of students in school who do not speak test language,
by migration status
350
400
450
500
550
Score
Spain
Non-immigrant Second-generation First-generation
20 to 40% 0 to 10% 10 to 20% 40% or more
350
400
450
500
550
Score
20 to 40% 0 to 10% 10 to 20% 40% or more
United Kingdom
450
350
400
500
550
Score
20 to 40% 0 to 10% 10 to 20% 40% or more
Canada
20 to 40% 0 to 10% 10 to 20% 40% or more
350
400
500
550
Score
450
New Zealand
350
400
450
500
550
Score
Spain
Non-immigrant Second-generation First-generation
20 to 40% 0 to 10% 10 to 20% 40% or more
350
400
450
500
550
Score
20 to 40% 0 to 10% 10 to 20% 40% or more
United Kingdom
450
350
400
500
550
Score
20 to 40% 0 to 10% 10 to 20% 40% or more
Canada
20 to 40% 0 to 10% 10 to 20% 40% or more
350
400
500
550
Score
450
New Zealand
350
400
450
500
550
Score OECD average
20 to 40% 0 to 10% 10 to 20% 40% or more
350
400
450
500
550
Score
20 to 40% 0 to 10% 10 to 20% 40% or more
Belgium
450
350
400
500
550
Score
20 to 40% 0 to 10% 10 to 20% 40% or more
Sweden
20 to 40% 0 to 10% 10 to 20% 40% or more
350
400
500
550
Score
450
Germany
Non-immigrant students Second-generation students First-generation students
350
400
450
500
550
Score OECD average
20 to 40% 0 to 10% 10 to 20% 40% or more
350
400
450
500
550
Score
20 to 40% 0 to 10% 10 to 20% 40% or more
Belgium
450
350
400
500
550
Score
20 to 40% 0 to 10% 10 to 20% 40% or more
Sweden
20 to 40% 0 to 10% 10 to 20% 40% or more
350
400
500
550
Score
450
Germany
Non-immigrant students Second-generation students First-generation students

63UNTAPPED SKILLS: REALISING THE POTENTIAL OF IMMIGRANT STUDENTS © OECD 2012
MASTERY OF THE ASSESSMENT LANGUAGE AND READING OUTCOMES3
• Figure 3.6 • Reading scores by percentage of students in school who do not speak test language,
by migration status (continued)
350
400
450
500
550
Score
20 to 40% 0 to 10% 10 to 20% 40% or more
350
400
450
500
550
Score
20 to 40% 0 to 10% 10 to 20% 40% or more
450
350
400
500
550
Score
20 to 40% 0 to 10% 10 to 20% 40% or more
20 to 40% 0 to 10% 10 to 20% 40% or more
350
400
500
550
Score
450
Austria Switzerland
Netherlands Israel
Non-immigrant students Second-generation students First-generation students
350
400
450
500
550
Score
20 to 40% 0 to 10% 10 to 20% 40% or more
350
400
450
500
550
Score
20 to 40% 0 to 10% 10 to 20% 40% or more
450
350
400
500
550
Score
20 to 40% 0 to 10% 10 to 20% 40% or more
20 to 40% 0 to 10% 10 to 20% 40% or more
350
400
500
550
Score
450
Austria Switzerland
Netherlands Israel
Non-immigrant students Second-generation students First-generation students
350
400
450
500
550
Score
20 to 40% 0 to 10% 10 to 20% 40% or more
Norway
20 to 40% 0 to 10% 10 to 20% 40% or more
350
400
500
550
Score
450
United States
350
400
500
550
450
Score
20 to 40% 0 to 10% 10 to 20% 40% or more
Denmark
20 to 40% 0 to 10% 10 to 20% 40% or more
350
400
450
500
550
Score
Non-immigrant Second-generation First-generation
Australia
350
400
450
500
550
Score
20 to 40% 0 to 10% 10 to 20% 40% or more
Norway
20 to 40% 0 to 10% 10 to 20% 40% or more
350
400
500
550
Score
450
United States
350
400
500
550
450
Score
20 to 40% 0 to 10% 10 to 20% 40% or more
Denmark
20 to 40% 0 to 10% 10 to 20% 40% or more
350
400
450
500
550
Score
Non-immigrant Second-generation First-generation
Australia
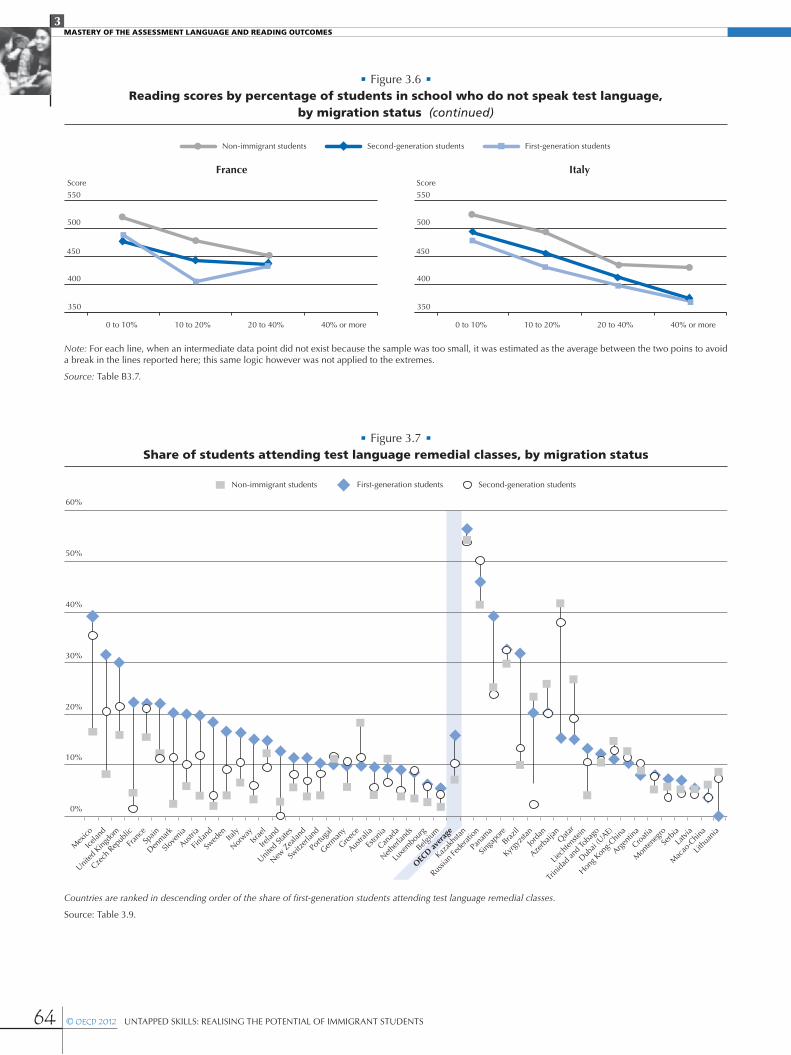
64 © OECD 2012 UNTAPPED SKILLS: REALISING THE POTENTIAL OF IMMIGRANT STUDENTS
MASTERY OF THE ASSESSMENT LANGUAGE AND READING OUTCOMES3
• Figure 3.6 • Reading scores by percentage of students in school who do not speak test language,
by migration status (continued)
350
400
450
500
550
Score
20 to 40% 0 to 10% 10 to 20% 40% or more
France
450
350
400
500
550
Score
20 to 40% 0 to 10% 10 to 20% 40% or more
Italy
Non-immigrant students Second-generation students First-generation students
350
400
450
500
550
Score
20 to 40% 0 to 10% 10 to 20% 40% or more
France
450
350
400
500
550
Score
20 to 40% 0 to 10% 10 to 20% 40% or more
Italy
Non-immigrant students Second-generation students First-generation students
350
400
450
500
550
Score
20 to 40% 0 to 10% 10 to 20% 40% or more
France
450
350
400
500
550
Score
20 to 40% 0 to 10% 10 to 20% 40% or more
Italy
Non-immigrant students Second-generation students First-generation students
Note: For each line, when an intermediate data point did not exist because the sample was too small, it was estimated as the average between the two poins to avoid a break in the lines reported here; this same logic however was not applied to the extremes.
Source: Table B3.7.
• Figure 3.7 • Share of students attending test language remedial classes, by migration status
0%
10%
20%
30%
40%
50%
60%
Portu
gal
German
y
Greece
Austra
lia
Eston
ia
Canad
a
Netherl
ands
Luxe
mbour
g
Belgium
OECD av
erag
e
Kazak
hstan
Russia
n Fed
eratio
n
Pana
ma
Singa
pore
Brazil
Kyrgyz
stan
Jorda
n
Azerb
aijan
Qatar
Liech
tenste
in
Trini
dad a
nd To
bago
Dubai
(UAE)
Hong K
ong-C
hina
Argenti
na
Croati
a
Mon
teneg
ro
Serb
ia
Latvi
a
Mac
ao-C
hina
Lithu
ania
Switz
erlan
d
New Z
ealan
d
United
State
s
Irelan
d
Israe
l
Norway
Ita
ly
Swed
en
Finlan
d
Austri
a
Denmark
Slove
nia
Spain
Franc
e
Czech
Rep
ublic
United
King
dom
Icelan
d
Mex
ico
Second-generation studentsFirst-generation studentsNon-immigrant students
Countries are ranked in descending order of the share of first-generation students attending test language remedial classes.
Source: Table 3.9.
65UNTAPPED SKILLS: REALISING THE POTENTIAL OF IMMIGRANT STUDENTS © OECD 2012
MASTERY OF THE ASSESSMENT LANGUAGE AND READING OUTCOMES3
The effect of concentration, however, is not the same for first- and second-generation students or even non-immigrant students. The reading score penalty associated with concentration is higher for first- and second-generation students than for non-immigrants. The lowest scores for non-immigrants, second- and first-generation students are observed when the concentration of pupils not speaking the test language at home is the highest (40% or plus). The results for each country can be found in Figure 3.6. Results for certain countries, such as Australia, Canada and Israel, suggest that it is not language concentration per se which is problematic; in these countries reading outcomes for immigrant students in schools where there are a high percentage of students mostly speaking another language at home are as high as in schools where foreign-language speakers are less frequent. As will be seen in Chapter 5, other determinants of outcomes play a more systematic role.
The negative association between the proportion of students in a school who do not speak the test language and lower reading proficiency is substantial. The negative correlation, however, declines if one controls for parental education, language spoken at home and migration status (Table B3.8).
First- and second-generation immigrants are more likely to attend remedial language classesSince first- and second-generation students have lower reading scores than their non-immigrant peers, it is not surprising to find that they attend more support courses. Figure 3.7 shows the share of students who attend remedial classes in the test language. In OECD countries, around 16% of all first-generation students and 10% of second-generation students attended remedial classes (compared to 7% for non-immigrant students). Given the large reading outcome gaps between immigrant and non-immigrant students, these differences are surprisingly small. However, remedial classes are intended to be exceptions; in schools where the overall reading level of students is weak, remedial help may be required for almost all students, which may well imply that regular classes take on a remedial role. In most countries, immigrant students are more likely to attend language support courses. Exceptions are Greece and Portugal, where migrants despite having lower language skills are less likely to attend support courses.
Is attending this type of programme beneficial to poor performing students? Addressing this question would require a measure of performance both before and after receiving remedial support, to be able to determine its causal impact. Because remedial support is given to individuals with low performance, a direct comparison of performance between those who received and those who did not receive support would tend to show lower outcomes for the former.
SUMMARY AND CONCLUSIONSThe language proficiency of immigrant students depends on a number of factors. This chapter highlights the importance of exposure to the assessment language both at home and at school. Speaking the test language at home is strongly associated with better reading outcomes among immigrant students. A sizeable proportion of the difference in reading outcomes between immigrant and non-immigrant students is due to this factor alone.
Exposure to the assessment language in school at an earlier age is also beneficial for language proficiency. Pre-primary school attendance is strongly associated with higher reading skills at age 15 among immigrant students. However, many immigrant students attend schools where a high percentage of students speak another language at home. Since these students have less-favourable reading outcomes, on average, immigrant students will not benefit significantly from exposure to the assessment language at school. While policy measures to modify language behaviour are impractical, the objective of increasing exposure to the host-country language can be achieved in other ways.
Immigrants should be encouraged to enrol their children in early education. If many countries already have special language programmes for immigrant children, they do not appear to be sufficient to guarantee good reading levels in the host-country language. Children may be able to learn foreign languages quickly, but one cannot rely on that ability to ensure adequate reading levels. Measures to reinforce language programmes for children of immigrants and to increase their effectiveness would be beneficial throughout the years of schooling. Open-school policies that offer access to schools, tutors and reading materials during the summer months are another avenue for increasing exposure. Parents also need to be sensitised to the benefits of home exposure to media in the prevailing language.
People who have a good mastery of the language of instruction and are able to read well in that language are better equipped to participate in the society and economy of the country. This is a benefit not only to the individual but to the society, as well. Countries thus have an interest in funding language-learning for all adults who have been admitted for settlement and who wish to improve their language knowledge and proficiency. Canada and Sweden, among other countries, provide free language tuition to all adult permanent residents. Such measures undoubtedly contribute to better language proficiency among immigrant parents, which can only be beneficial to their children.
66 © OECD 2012 UNTAPPED SKILLS: REALISING THE POTENTIAL OF IMMIGRANT STUDENTS
MASTERY OF THE ASSESSMENT LANGUAGE AND READING OUTCOMES3
Notes
1. However, this counterintuitive result seems to be sample-size related, since pooling over OECD countries shows an additional benefit of some 23 points for those speaking another language at home but no significant additional benefit for those who speak the test language.
2. The percentage is measured for students participating in the PISA assessment, which covers only 15-year-olds. This may not be entirely representative of all students in the school. In addition, schools with fewer than 20 sampled students responding on the language-spoken-at-home questions are excluded from the analysis.
3. This variable should be a good proxy of the first language of the students. Alternatively, a variable at the school level could be used, where the principal declares the share of 15-year-old students that do not speak the test language as first language. While the results do not differ significantly, the variable is not available for some several countries and it might have greater measuring error that the variable constructed from the individual responses. For this reason, the results presented here correspond to the constructed variable at the school level from individual responses.

67UNTAPPED SKILLS: REALISING THE POTENTIAL OF IMMIGRANT STUDENTS © OECD 2012
4
Age at arrival is an important factor in helping to describe much of the performance gap between immigrant and non-immigrant students. In general, the later in their life immigrant student arrived in the host-country, the lower their performance in PISA. Mastery of the assessment language, once more, plays an important role in explaining this pattern. Late-arrival penalties vary across countries, but they are more pronounced for those immigrant students who do not speak the assessment language at home.
Immigrant Students’ Age at Arrival and Assessment Results

68 © OECD 2012 UNTAPPED SKILLS: REALISING THE POTENTIAL OF IMMIGRANT STUDENTS
IMMIGRANT STUDENTS’ AGE AT ARRIVAL AND ASSESSMENT RESULTS4
INTRODUCTIONThe aim of this chapter is to examine the effect of age at arrival on the performance of immigrant students in the PISA.1 The general expectation following earlier research (e.g. OECD, 2010) is that the later children arrive in a destination country, the further they will lag behind non-immigrant students in that country. This might be due to language difficulties or to more general difficulties in adapting to a different culture and school system, or to cross-national differences in educational standards at different ages.
This chapter focuses particularly on whether the effect of age at arrival varies according to the country of origin and the country of assessment. It is not so much the levels of performance which are of interest but rather the rate of change in performance with respect to age at arrival. Putting it more colloquially, the question is whether young people coming from or arriving in particular countries are especially vulnerable to what might be termed a “late-arrival penalty”. These penalties may in turn have long-lasting implications on young people’s opportunities for further educational progress, integration into the labour market, and improvement of life chances in the destination country. Substantial penalties may leave long-term negative effects with important implications for both the migrants affected and for the wider society. Chapter 6 studies these issues in the context of educational attainment in Canada and Switzerland.
Research on what might be termed the “absolute” levels of student test performance suggests that young people from certain origins (for example China) tend to score particularly well no matter the country they migrate to. However, in the case of the “late-arrival penalty”, the combination of certain origins with particular destinations is likely to be of paramount importance and there are two main arguments that suggest this may be the case.
First of all, it is likely that children arriving from, say, a developed western nation will already have performed quite well at school before migrating, while those coming from a less-developed country with less-developed educational institutions and lower general levels of performance might lag further behind. For example, PISA test scores show Turkey to be below the OECD average, and so children arriving from Turkey in, say, Germany are likely to start at a considerable disadvantage. In contrast children migrating from the Netherlands to Germany are likely to be achieving already at a similar (or even at a higher) level to their peers in Germany. This suggests that the effect of age at arrival will be relatively flat in the case of immigrants from the Netherlands to Germany but could be steeper in the case of young people arriving from Turkey since the later they arrive in Germany, the greater the differential is likely to be.
Second, it is likely that, even if children were high achievers in their origin country, they will suffer a penalty on arrival if they do not speak the destination-country language. For example, children migrating from, say, the United Kingdom to continental Europe will typically have to learn a new language, whereas those migrating from the United Kingdom to Australia or New Zealand will not. One therefore expects to find that the effect of age at arrival will be more marked where children have to learn a new language.
To be sure, the possibility that there could also be some more general processes at work which affect all young people who migrate to a particular destination is not excluded. These might for example relate to the kinds of help that countries or educational systems give to the integration of newcomers, but the general expectation is that the major processes are those that involve particular origin and destination combinations.
While this kind of research cannot on its own provide direct implications for what policies to adopt, it can usefully indicate the sorts of students and countries where there are especially large “late-arrival penalties”, and where some kind of policy response may be warranted. The findings may also indicate whether there are any countries which have been particularly successful at avoiding these penalties and whose institutional arrangements may be worthy of more in-depth study in order to assist policy transfer. They suggest that policies which delay family reunification may have unintended consequences on the outcomes of immigrant students and on their downstream integration into the labour market and societies of host countries.
PREVIOUS EVIDENCE ON AGE-AT-ARRIVAL PENALTIESA small number of single-country studies have explored the effects of age at arrival on a variety of educational outcomes, while the PISA 2009 Results Volume II: Overcoming Social Background (OECD, 2010) compares the effects of early and late arrival on immigrant students’ reading scores in different countries.
Country-specific studiesA major focus of country-specific studies has been the question of whether there is a “critical” age at arrival for learning a new language after which there is a strong negative impact on language acquisition and on educational performance more generally (given that proficiency in the destination-country language is also assumed to be crucial for wider educational success). Using Swedish register data, Böhlmark (2008) found that the critical age at arrival for grade point average (GPA) at age 16 was about nine, with the slopes of the age-at-immigration/performance profiles being similar for boys and girls and for children from different family backgrounds, but varying widely by region of origin. For Asian children the profile was substantially steeper than for Western

69UNTAPPED SKILLS: REALISING THE POTENTIAL OF IMMIGRANT STUDENTS © OECD 2012
IMMIGRANT STUDENTS’ AGE AT ARRIVAL AND ASSESSMENT RESULTS4
children, Böhlmark’s interpretation being that the steep profile among the Asian children probably reflected “large differences in Sweden-specific skills between children of relatively high and those of relatively low age at migration” whereas the flatter profile for Western children probably reflected the fact that “there is not much to catch up on, i.e. that the human capital they have acquired in the source country does not differ much from that acquired in Sweden.” (Böhlmark, 2008, p. 1382). He attributes the finding that immigration at age nine or later has a negative impact on GPA to the fact that these students have passed their prime age for language-learning and also because their acquisition of other subject skills is less efficient while the students are still struggling to learn the new language (Böhlmark, 2009).
In an American study, Myers and his colleagues also investigate whether a particular age at arrival is critical for self-reported fluency in English and a variety of other socio-economic outcomes. Using the 2000 census and focussing on the experiences of Mexican immigrants, their results indicated that the effect of early arrival was much greater for English proficiency than for other outcomes. They found “little evidence at any age of a sharp discontinuity demarcating a 1.5 generation from older immigrants and, in fact, a series of classifications or a continuous measurement of age at arrival may be preferred in some cases” (Myers, et al., 2009, p. 205). More generally Myers and his colleagues show that linear and curvilinear models perform better than categorical ones, with curvilinear models being slightly superior to linear ones.
In another study conducted in Israel, Cahan and his colleagues investigated the effects of age of arrival on verbal and mathematics scores on tests administered to 8th grade students. Like Böhlmark in Sweden, they found no difference between boys and girls in the effects of age at arrival. They did find, however, that the effects were stronger for verbal than for mathematics scores, and they also found clear differences between ethnic background groups. However, in their case the decrease in attainment with later arrival was greater for the Western groups (coming from Europe and North America) than among the Eastern groups (coming from Asia and North Africa) (Cahan, et al., 2001, p. 591). They also tested the “vulnerable age” hypothesis which had been advanced by earlier scholars – that is to say a U-shaped relationship between age at arrival and educational performance, with higher performance being found among early and late arrivals and the lowest performance among those arriving during the intermediate “vulnerable” years. However, they found absolutely no support for this hypothesis.
In a Dutch study, van Ours and Veenman compared age at arrival effects for Turks and Moroccans with those for Surinamese and Antilleans. Their main finding was that migration at an older age appears to be more of a disadvantage for the educational achievements (measured by level of education achieved not by test scores) of the Turks and Moroccans than for the Surinamese and Antilleans. Van Ours and Veenman’s interpretation of the differences in the effects of age at arrival of the two groups focused on the congruence between the educational systems of the different origin countries and those of the Netherlands. “Since there are no indications that these differences are related to the destination country (e.g. the characteristics of the [Dutch] educational system), the explanation must be searched for in the origin country or cultural background. In this respect it seems important that the educational system in Surinam and the Antilles, being (former) Dutch colonies, has a lot in common with the Dutch educational system. Since this is not the case with the Turkish and Moroccan educational systems, this might explain the greater difficulties for the Turks and Moroccans. Migration to the Netherlands is for them a larger step than for the Surinamese and the Antilleans” (Van Ours and Veenman, 2006, pp. 314-6). They also checked whether their results were sensitive to the inclusion of statistical controls for parental education or interacted with them. They found that the results barely changed after including parental controls or splitting the sample between higher and lower-educated parents.
International evidenceTurning next to cross-national comparisons based on the PISA data, the PISA 2009 Results Volume II: Overcoming Social Background confirms this picture of a late-arrival penalty with respect to reading scores. Table II.4.8 of the report shows that first-generation students who arrived in the host country at a younger age outperform those who arrived when they were older with a difference of 42 points (roughly equivalent to one school year or grade level) between those who arrived when they were 5-years-old and those who arrived after they were 12-years-old. “This suggests that where the education system of the host country had a longer opportunity to shape the learning outcomes of immigrant students, it was able to improve student performance” (OECD, 2010, p. 75).
The size of these gaps, however, varied considerably across countries, with the largest late-arrival penalties being found in Italy, Belgium, Sweden and Ireland. There were also a small number of non-Western countries and economies, such Macao-China, where there were late arrival “premia” rather than penalties.2 That is to say the late arrivals performed better in the reading test than those who arrived earlier. One possible explanation for these puzzling cross-country variations that the 2010 report was unable to address is that the kinds of students, for example their national origins, who arrive early and late may vary between destination countries. These “compositional” differences will need to be considered carefully.

70 © OECD 2012 UnTAPPED SKILLS: REALISInG THE POTEnTIAL OF IMMIGRAnT STUDEnTS
ImmIgrant StudentS’ age at arrIval and aSSeSSment reSultS4
Country dIfferenCeS In late-arrIval penaltIeSThe focus of the PISA analysis to follow is the test of reading literacy, which is particularly important for educational success and integration more generally, and for which age-at-arrival effects appear to be stronger than for mathematics or science. For this analysis the data are pooled for all relevant years in which PISA collected the necessary information (2003, 2006 and 2009), for all countries and for all origin groups. The results are also pooled for boys and girls. While girls generally perform better than boys, there is no significant gender difference with respect to late-arrival penalties. In other words, the female advantage over males is broadly similar at all ages of arrival.
This section begins with some descriptive statistics showing for each participating country and economy the differences in reading test scores between early and medium, and between early and late arrivers. Early arrivers are defined as those who arrived at or before age 5, which will generally cover children who arrived before the start of compulsory schooling (OECD, 2010). Late arrivers are defined as those who arrived after age 12. This latter group will thus have had a maximum of three years schooling in the destination country at the time of the test. Figure 4.1 shows the differences in the reading scores of the late- and mid-arrivers in comparison with those of the early-arrivers in each country and economy (which are set to zero). (The full details are provided in Table B4.3 in Annex B.) The results are shown only for cases where there are reasonable numbers of immigrant students in the sample for each country.3 For a few countries (shown at the bottom of Figure 4.1) there are a sufficient number of cases to show the differences between mid- and early-arrivers but not sufficient for investigating late-arrivers.
The patterns shown in Figure 4.1, and throughout this chapter, are derived from cross-sectional not from panel data. That is to say, they show the differences in reading scores at the end of lower secondary education between 15-year-olds who arrived in the destination country at different ages, and have thus spent a longer or shorter time in the country of current residence. As noted earlier, since they are not derived from a panel study, the figures do not show how test scores for the same individuals change over time, although it will often be reasonable to suppose that a panel study might show patterns similar to those documented here.
These introductory descriptive statistics should be interpreted with caution and need to be studied with more sophisticated analyses in due course, in particular taking into account any “compositional” differences in the origin countries from which the migrant students come. As will be seen in the next section, migrants from countries who also speak the test language tend to have flatter age-at-arrival profiles (softer late-arrival penalties) than do migrants who come from different linguistic backgrounds. A large late-arrival penalty may therefore simply reflect a large inflow of migrants who need to learn a new language in the destination country. nevertheless, the overall observed differences do provide an overview of the main patterns in the data as well as a yardstick against which to check for important deviations. (Figure 4.1 presents the “gross” differences before controlling for parents’ socio-economic background. Table B4.4 in Annex B shows the “net” results after controls, i.e. only contrasting students with similar socio-economic background. As with van Ours and Veenman’s study, the controls generally have little effect on the size of the late-arrival penalties.)
In Figure 4.1 the performance of the early arrivers is set to zero, and the performance of the mid- and late-arrivers is compared with that of the early arrivers. In general, the figure shows there is a late arrival penalty, albeit of varying size, in almost all of the developed Western countries. The OECD average late-arrival penalty is about 20 score points, roughly equivalent to about a half a year of schooling. Furthermore, in most countries the mid-arrivers are rather closer to the early arrivers than to the late arrivers. This suggests that the effect of age at arrival on test scores is not a linear one but becomes progressively larger the later the age at which the student migrates. This implies that a curvilinear characterisation of the age-at-arrival/performance profile is more appropriate than a linear one. More detailed analysis (Heath and Kilpi-Jakonen, 2012) indicates that there is no specific “critical” age for arrival but that later arrivals are increasingly vulnerable.
In contrast to this dominant pattern of a late-arrival penalty, in some partner countries and economies such as Macao-China, late arrivers actually perform better than the early arrivers. This may well reflect particular features of the migrant flows to these countries. As will be shown later, a late-arrival “premium” rather than a penalty can occur when children migrate at an older age, having spent a larger part of their educational career in a country with higher educational standards or speaking the same language.
Even the early arrivers may perform less well than non-immigrant students in the country of assessment. The absence of a late-arrival penalty therefore does not mean that all is well for immigrant students. This will become more clear when comparing the results of Figure 4.1 with those of Figure 4.2, which compares the test scores of the early arrivers with those of the non-immigrant students. Figure 4.2 also compares the early-arrivers’ test scores with the scores of second-generation students.
As in Figure 4.1, the performance of early arrivers is set to zero and the performance of non-immigrant students and of the second-generation are compared with this baseline. There is again considerable cross-national variation, but non-immigrant students outperform both the early arrivers and the second-generation students in many countries, sometimes by considerable margins. (As Table B4.4 in Annex B shows, the net differences between the immigrant and non-immigrant students after controls tend to be somewhat smaller than the gross differences shown in Figure 4.2, but in most cases the differences remain quite substantial and statistically significant.) Figure 4.2 also suggests that the scores of second-generation students tend to be rather close to those of the early-arrivers; in some countries the second-generation do rather better, while in others they score somewhat worse, but the overall average for OECD countries is virtually identical for early-arrivers and second-generation students.
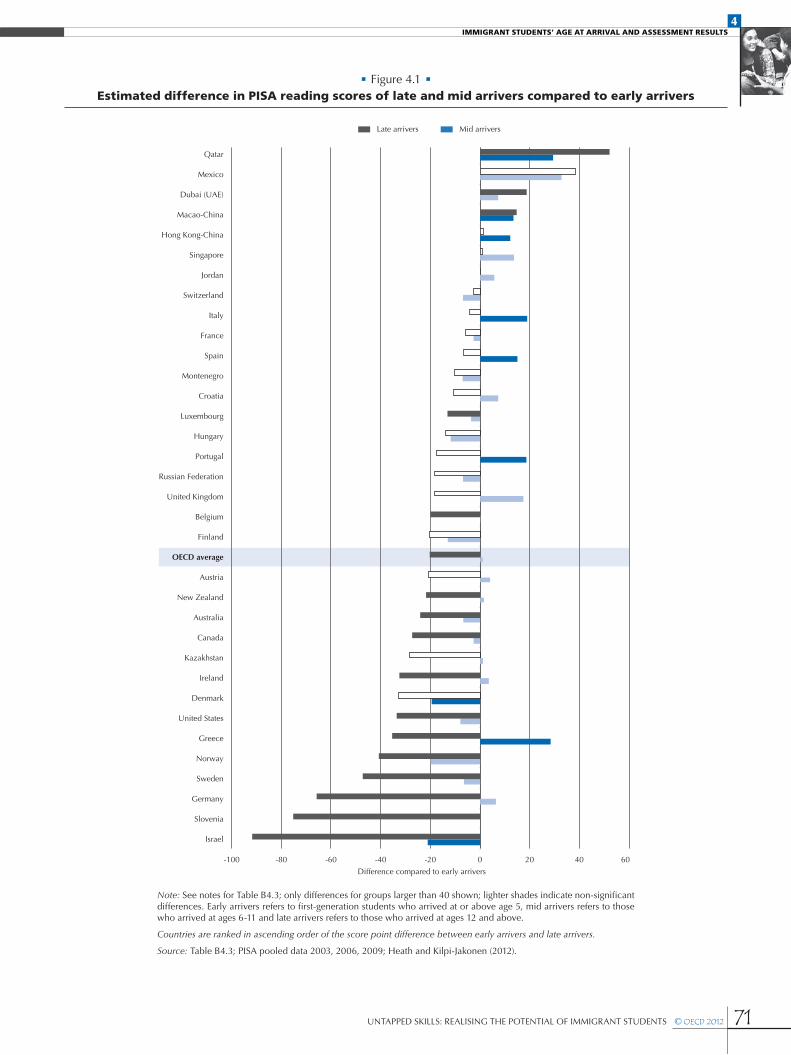
71Untapped SkillS: RealiSing the potential of immigRant StUdentS © OECD 2012
ImmIgrant StudentS’ age at arrIval and aSSeSSment reSultS4
• Figure 4.1 • Estimated difference in PISA reading scores of late and mid arrivers compared to early arrivers
Israel
Slovenia
Germany
Sweden
Norway
Greece
United States
Denmark
Ireland
Kazakhstan
Canada
Australia
New Zealand
Austria
OECD average
Finland
Belgium
United Kingdom
Russian Federation
Portugal
Hungary
Luxembourg
Croatia
Montenegro
Spain
France
Italy
Switzerland
Jordan
Singapore
Hong Kong-China
Macao-China
Dubai (UAE)
Mexico
Qatar
-100 -80 -60 -40 -20 0 20 40 60
Difference compared to early arrivers
Mid arrivers Late arrivers
Note: See notes for Table B4.3; only differences for groups larger than 40 shown; lighter shades indicate non-significant differences. Early arrivers refers to first-generation students who arrived at or above age 5, mid arrivers refers to those who arrived at ages 6-11 and late arrivers refers to those who arrived at ages 12 and above.
Countries are ranked in ascending order of the score point difference between early arrivers and late arrivers.
Source: Table B4.3; PISA pooled data 2003, 2006, 2009; Heath and Kilpi-Jakonen (2012).

72 © OECD 2012 UnTAPPED SKILLS: REALISInG THE POTEnTIAL OF IMMIGRAnT STUDEnTS
ImmIgrant StudentS’ age at arrIval and aSSeSSment reSultS4
• Figure 4.2 • Estimated difference in PISA reading scores of non-immigrant and second-generation students
compared to early arrivers
-150 -100 -50 0 50 100
Mexico
Switzerland
Iceland
Sweden
Finland
Austria
Luxembourg
Norway
Germany
Denmark
United Kingdom
France
Spain
OECD average
United States
Netherlands
Italy
Croatia
Belgium
Slovenia
Portugal
Greece
Russian Federation
Kazakhstan
Canada
New Zealand
Ireland
Australia
Czech Republic
Hungary
Serbia
Hong Kong-China
Macao-China
Montenegro
Israel
(Former) Yugoslavia
Singapore
Jordan
Qatar
Dubai (UAE)
Difference compared to early arrivers
Non-immigrant students Second-generation students
Note: See notes for Table 4.3; only differences for groups larger than 40 shown; lighter shades indicate non-significant differences.
Countries are ranked in ascending order of the score point difference between early arrivers from first-generation and non-immigrant students.
Source: Table B4.3; PISA pooled data 2003, 2006, 2009; Heath and Kilpi-Jakonen (2012).

73UNTAPPED SKILLS: REALISING THE POTENTIAL OF IMMIGRANT STUDENTS © OECD 2012
IMMIGRANT STUDENTS’ AGE AT ARRIVAL AND ASSESSMENT RESULTS4
LANGUAGE AND THE LATE-ARRIVAL PENALTYPrevious research has often found differences between origin groups in the extent to which later age at arrival depresses test performance, although the results vary across countries of residence. For example, in Israel (Cahan, et al., 2001) found that children arriving from western Europe had a much steeper age-at-arrival/performance profile, with a heavier age-of-arrival penalty, than children arriving from North Africa and western Asia. In contrast, in Sweden (Böhlmark, 2008), found that children arriving from western Europe suffered very little in the way of a late age-at-arrival penalty whereas there was a steep profile for those arriving from Asia. One reason for these differences is almost certainly, as Böhlmark suggests, the possession of destination-country specific skills, most notably language (although other factors such as the educational levels typically achieved in the country of origin may also be relevant as will be seen in the next section).
Age-at-arrival profiles have quite different characters and explanations from overall performance levels. Thus children from East Asia and India generally perform very well in performance tests, and appear to do so whatever the country they have migrated to. In contrast, their age-at-arrival profiles are likely to vary according to the particular country which they have migrated to. For example, mainland Chinese migrating to Hong Kong-China, where Chinese is the language of instruction in schools, might be expected to have a flatter profile than those migrating to Australia, where they will be taught in English and might hence experience a steeper learning curve. In other words, it is the congruence or lack of congruence between the language of the home and that of the school that is likely to affect the age-at-arrival/test score profile.
In practice it is not straightforward to investigate the differences in profiles of specific migrant groups in different countries of destination, as there are relatively few origin groups found in several different destination countries. There is also a selection problem: migrants often move to countries which are culturally and linguistically more similar, for example Britons tending to migrate to Australia or New Zealand, both English-speaking countries and hence ones where the age-at-arrival profiles of Britons are expected to be fairly flat.
However, Chinese students are found in reasonable numbers in the PISA samples in Australia, Hong Kong-China, Macao-China and New Zealand. The expectation is that Chinese migrating to Hong Kong-China and Macao-China will have relatively flat age-at-arrival profiles, since they have moved to countries with similar cultures and language of instruction in schools, whereas Chinese migrating to English-speaking Australia and New Zealand will have much steeper age-at-arrival profiles. It is important to recognise that this does not mean that Chinese or Asians in general have heavier penalties than Britons and other western Europeans: the expectation is that the penalty will vary from one destination country to another. Some western European groups migrating to countries where there is a different language of instruction in school (e.g. Germans migrating to Belgium) might therefore also be expected to have quite heavy age-at-arrival penalty.
In Tables B4.1a and B4.1b age-at-arrival profiles are shown for selected origin groups.4 The tables show the late-arrival penalty for that origin group in the particular country of destination. The larger the reported coefficient in the table, the steeper the profile; that is the greater the late-arrival penalty. Negative coefficients indicate that a later age at arrival is associated with better, not worse, test scores which, as will be seen in the next section is a theoretically important possibility. (The models also include controls for PISA year, gender and students’ school year/grade. Interactions are fitted and reported only for those cases where at least 40 respondents from a given origin country were sampled in the country of destination.)
While standard errors for the coefficients reported in Tables B4.1a and B4.1b are generally rather large (because of the small sample sizes), the overall pattern is nonetheless quite striking and in line with expectations. Thus the age-at-arrival profile is indeed much steeper for Chinese in Australia and New Zealand than it is in Hong Kong-China or Macao-China. The profile for Germans migrating to Belgium is much steeper than for Germans moving to Austria or Switzerland (where it is assumed that many will have moved to German-speaking parts of Switzerland). The profile for young people from the former USSR is much steeper in Israel, Finland and Germany than it is in Russia. And the profile for young people from the former Yugoslavia is much steeper in Luxembourg, Germany and Switzerland than it is in Serbo-Croat speaking Croatia or Serbia. In contrast the profiles for Britons or French, who typically migrate to other Anglophone or Francophone countries respectively, are uniform and fairly flat.
Tables B4.1a and B4.1b also show the overall coefficient for young migrants in each destination country in the final column, and it is informative to compare this with the coefficients for the individual origin groups within a given country. Consider Germany for example, which Figure 4.1 indicated was one of the countries with the largest late-arrival penalty. Overall, Germany does indeed exhibit a large age-at-arrival coefficient of 36.0 score points. However, the main immigrant groups to Germany with sufficient numbers in the sample for detailed analysis are all ones from linguistically-dissimilar countries, namely from Turkey, the former-USSR and the former Yugoslavia. Conversely Australia, which overall displays a much smaller age-at-arrival coefficient of 12.9 score points, also exhibits a large coefficient of 48.5 score points (as large as the biggest coefficient in Germany) for the linguistically-dissimilar migrants from China. The small overall Australian coefficient can almost certainly be explained by its large number of migrants from linguistically-similar Britain with their small coefficient of minus 5.7 score points. In other words, the overall differences in the magnitude of the late-arrival penalties observed in Figure 4.1 almost certainly owe a great deal to the composition of the immigrant flows, specifically whether the immigrants come from linguistically-similar or dissimilar origin countries.
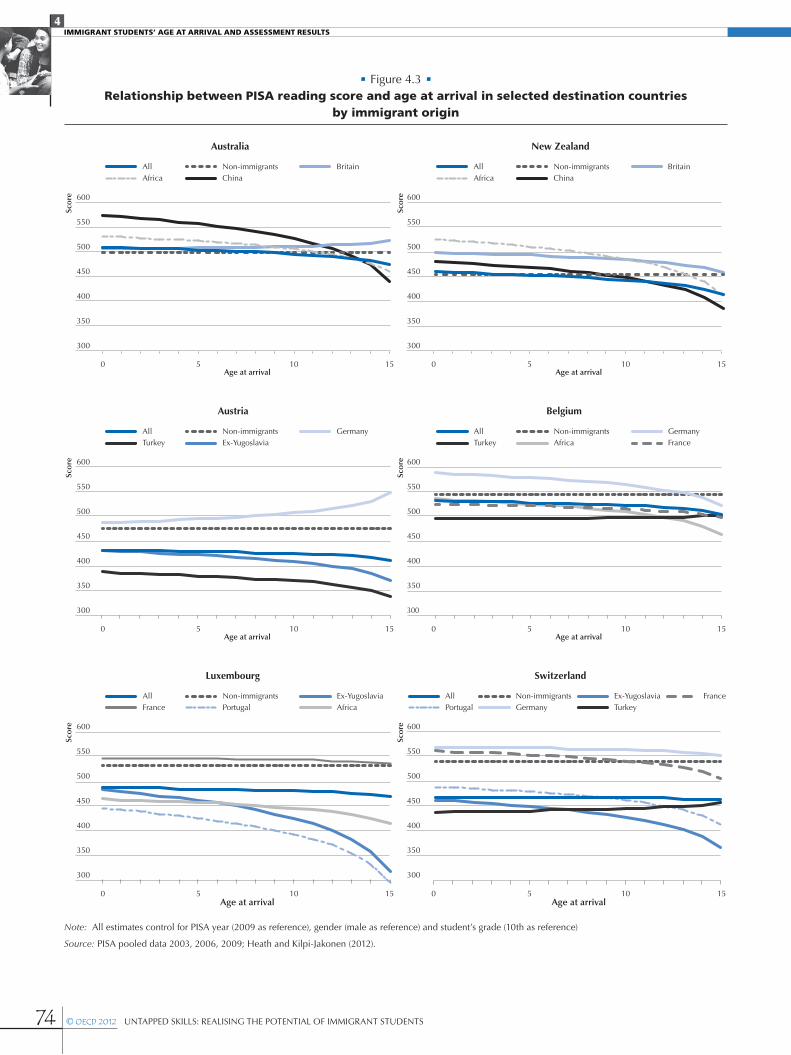
74 © OECD 2012 UnTAPPED SKILLS: REALISInG THE POTEnTIAL OF IMMIGRAnT STUDEnTS
ImmIgrant StudentS’ age at arrIval and aSSeSSment reSultS4
• Figure 4.3 • Relationship between PISA reading score and age at arrival in selected destination countries
by immigrant origin
300
350
400
450
500
550
600
0 5 10 15
Australia
400
300
350
450
500
550
600
0 5 10 15
New Zealand
Age at arrival Age at arrival
Sco
re
Sco
re
BritainChinaNon-immigrants
AfricaAll Britain
ChinaNon-immigrants
AfricaAll
Austria Belgium
0 5 10 15
300
350
400
450
500
550
600
300
350
400
450
500
550
600
0 5 10 15Age at arrival Age at arrival
Sco
re
Sco
re
Non-immigrantsAllAfricaTurkey France
GermanyGermanyAll Non-immigrantsTurkey Ex-Yugoslavia
Luxembourg Switzerland
300
350
400
450
500
550
600
0 5 10 15
300
350
400
450
500
550
600
0 5 10 15Age at arrival Age at arrival
Sco
re
Sco
re
Ex-YugoslaviaAll Non-immigrantsPortugal AfricaFrance
Ex-YugoslaviaTurkeyPortugal
All FranceNon-immigrantsGermany
Note: All estimates control for PISA year (2009 as reference), gender (male as reference) and student’s grade (10th as reference)
Source: PISA pooled data 2003, 2006, 2009; Heath and Kilpi-Jakonen (2012).

75UNTAPPED SKILLS: REALISING THE POTENTIAL OF IMMIGRANT STUDENTS © OECD 2012
IMMIGRANT STUDENTS’ AGE AT ARRIVAL AND ASSESSMENT RESULTS4
To illustrate the patterns, the curves are plotted for a selection of countries. Thus in the top panel of Figure 4.3 the age-at-arrival curves are shown for Australia. Here one can see that the non-immigrant group is high-performing, that there is a flat curve for arrivals from Britain, and a steep curve for arrivals from Africa and even more so from China. Especially notable is the fact that the early arrivals from China clearly outperform non-immigrant students, whereas the late arrivals score substantially lower.
New Zealand, in the next panel, tells a rather similar story with steeper curves for migrants from Africa and China, and with early arrivals outperforming non-immigrant students and late arrivals faring worse.
In Austria the late-arrival premium for migrants from Germany is apparent, and the late-arrival penalties for migrants from the former Yugoslavia and from Turkey. However, this figure also brings out the important point that the rather flat curves for the latter two groups do not tell a positive story about these migrants. Instead, what is observed is that even the early arrivals from the former Yugoslavia and from Turkey have much lower scores than non-immigrant students at age 15. In contrast, in Belgium, immigrant students from Turkey do not appear to suffer a late-arrival penalty, performing at much the same level as non-immigrant students throughout (although one should be careful about drawing any strong conclusions from this finding as it is based on a sample of only 61 migrants from Turkey).
In Luxembourg and Switzerland late-arrival penalties and lower scores are observed for minorities coming from linguistically-dissimilar countries. In contrast the curves are much flatter for migrants from France to Luxembourg, and for migrants from Germany to Switzerland, and the scores for the migrants are comparable to those of non-immigrant students. Switzerland, despite the absence of a late-arrival penalty overall, displays major late-arrival penalties for the late arrivers from Portugal and the former Yugoslavia.
To be sure, there are some anomalies in Tables B4.1a and B4.1b (and Figure 4.3), such as the profile of migrants from Turkey in Belgium, some of which may be due to sampling error given the small sample sizes involved. A more formal test of the hypothesis that late-arrival penalties are larger when the young people come from linguistically-dissimilar countries was therefore conducted. The PISA datasets record whether the young people were tested in the same language as they speak at home. This measure can be used to test statistically the informal observations based on the coefficients displayed in Table B4.1. The result is to confirm a significant difference in the age-at-arrival coefficients for those who do and do not speak the test language at home.5
The measure of language spoken at home, however, provides only limited information. The measure gives the current language spoken at home, which may not always be the same as the language spoken on arrival. Thus many early arrivers (and their families) may have shifted, partly or completely, from speaking their origin-country language in their early years in the new country to speaking the destination-country language by the time of the test.6
While the need to learn a new language is clearly important in explaining the late-arrival penalty, it is likely not the whole story. Even among those who speak the test language or who come from linguistically-similar origin countries, there is still a modest-sized late-arrival penalty.
One possible reason for this is that migrants moving from a country with lower educational standards to one with higher standards will have more ground to make up for and thus will be particularly penalised if they arrive late (having spent a larger proportion of their academic career in the country with lower standards and thus being even further behind). There is a further possibility as well: some young people might be moving from a high-achieving to a low-achieving country. In this case one might expect that late age-at-arrival might be beneficial since the young people will have spent more time in the educational system of the country of origin. In other words, the usual pattern of a penalty for late arrival might be reversed with a premium for late arrivals. And indeed there were some hints of this in Table B4.1a, for example, where migrants from higher-achieving Germany (mean score in PISA 2009 of 497) had a late-arrival premium in lower-achieving Austria (mean score of 470) as shown by the negative coefficient.
AGE OF ARRIVAL PENALTIES AND LANGUAGE SPOKEN AT HOME: A COMBINED ANALYSISTo isolate the role played by language and late-arrival penalties, this section presents the results of an analysis that considers how all of these factors interact for a subsample of countries sharing common characteristics. Box 4.1 provides the technical details on the analysis.
The first column of results in Table B4.2 shows the coefficients estimated from a model which includes age at arrival, destination country, and type of origin country as the predictors. Four types of origin countries are distinguished,7 namely: i) Linguistically-similar Western countries (the reference category); ii) Linguistically-dissimilar Western countries; iii) Linguistically-similar non-Western countries; and iv) Linguistically-dissimilar non-Western countries.
As is evident, in the first model there are significant late-arrival penalties for migration from linguistically-dissimilar countries (both Western and non-Western) and for nine countries of residence (relative to the reference country of Australia). Since age at arrival is coded as the natural logarithm of years spent in the destination country, the estimates for countries of origin and destination

76 © OECD 2012 UNTAPPED SKILLS: REALISING THE POTENTIAL OF IMMIGRANT STUDENTS
IMMIGRANT STUDENTS’ AGE AT ARRIVAL AND ASSESSMENT RESULTS4
effectively tell us about the reading scores of young people who arrived in the destination country at ages 15 and 16 (which are combined in the coding of age at arrival). That is, late arrivals from a linguistically-dissimilar non-Western country are estimated to score on average 51 score points less than late-arrivals from a linguistically-similar Western country; and late arrivals in Finland are estimated to score on average 67 score points more than late arrivals in Australia, while late arrivals in Italy on average score 51 score points worse than those in Australia.
The positive sign of the age-at-arrival coefficient reflects the effect of additional years of residence on the reading score. For example, for students with 15 years of residence, that is, who arrived in the destination country when they were less than one year of age, the reading score is estimated to be higher by about 50 score points than students who arrived when they were 15.8 Fifty score points can thus be interpreted as the late-arrival penalty for those arriving at age 15.
The second model introduces interactions between age-at-arrival and type of origin country. This in effect allows the late-arrival penalty to differ according to the type of country from which the migrants came. And the estimated coefficients indicate that late-arrival penalties are significantly greater for migrants coming from linguistically-dissimilar non-Western countries than they are for migrants coming from linguistically-similar Western countries.
Perhaps the most helpful way to interpret these interaction terms is to add them to the “main effect” of age at arrival, thus showing us what the effect of age at arrival is for migrants from a particular type of origin. Thus, for migrants moving from one Western country to another, linguistically-similar Western country, the age-at-arrival coefficient is a statistically-significant 7.6 score points, so that the reading score improves with years of residence. Thus even these migrants experience a late-arrival penalty, possibly because of the difficulties of adjustment to a new educational system (or to unmeasured heterogeneity within our Western category, for example with respect to educational standards).
For migrants arriving from linguistically-similar non-Western countries the age-at-arrival coefficient is effectively the same at 3.4 score points (7.6 – 4.2), while for those arriving from linguistically-dissimilar Western countries it is rather larger at 15.1 score points (7.6 + 7.5). Finally, for those arriving from linguistically-dissimilar non-western countries it is significantly larger at 29.3 (7.6 + 21.7). It is this latter group of migrants, then, who have both to learn a new language and to make the transition from a non-Western to a Western educational environment, who experience much the largest late-arrival penalties.
In the third model, interactions between age at arrival and destination country are introduced. These interactions indicate whether the relationship between age at arrival and test scores is steeper in some countries than in the reference country of Australia. In effect, then, these reveal whether late-arrival penalties are greater in some countries than in others. (Note that this is importantly different from the meaning of the main effects of country, which simply indicates how the test scores of late arrivals in a particular country differ from those of late arrivals in Australia.) Only two of the interactions are statistically significant, those for Israel and for Switzerland – two countries which were seen in Figure 4.1 to be quite distinctive, Israel having the largest late-arrival penalty and Switzerland having the smallest.
In the fourth model, both sets of interactions are included, but the story remains essentially the same: migrants from linguistically-dissimilar non-Western countries experience much larger late-arrival penalties than do those from other origins. Once one controls for these differences in the composition of the migrant flow and the distinctive penalties which this particular group of migrants from linguistically-dissimilar non-Western countries experience, the remaining differences between Western destination countries in their late-arrival penalties prove to be statistically non-significant (apart from Israel and Switzerland).
Box 4.1 Analysing the role of language and late-arrival penalties
In order to assess the relative importance of these different processes, and to determine what country differences remain after taking these processes into account, a multivariate analysis of the dataset was undertaken. The dependent variable is, as before, the reading test scores of the young migrants. Only young migrants are included in the analysis (excluding second-generation and non-immigrant students) in order to focus on the effects of late arrival. (The total sample size for these analyses is therefore 11 299 young migrants.) Furthermore, the analyses are restricted to destination countries which are relatively developed, and which generally have high overall scores on the reading test and on the Human Development Index, in order to sidestep the differing patterns to be found in the less-developed destinations (and which would have involved more complex interaction terms). Migrants with an unreported country of origin are also excluded as they cannot be classified into the categories used in this analysis (described below). All the included countries are given equal weight in the analyses, the results of which are shown in Table B4.2.

77Untapped SkillS: RealiSing the potential of immigRant StUdentS © OECD 2012
ImmIgrant StudentS’ age at arrIval and aSSeSSment reSultS4
Given the absence of statistically-significant interaction terms, one should be careful about drawing any conclusions as to whether particular countries provide more effective institutional arrangements for integrating late arrivals in the school system. Even in the cases of Israel and Switzerland, one needs to be circumspect since their distinctive age-at-arrival/test score profiles may be due to unmeasured heterogeneity in their migrant flows; this is particularly likely to be the case in Israel where the migrant flows are rather different from those going to any other destination, but as was seen in Figure 4.3, late arrivals in Switzerland from the former Yugoslavia (many of whom were from Kosovo) experience large late-arrival penalties.
Summary and ConCluSIonSAfter considering various factors that could affect the performance of immigrant children, including their age at arrival, gender, the language of the assessment and the educational standards both in the country of origin and in the host country, the analysis identifies an especially vulnerable group composed of students who arrived when they were of lower secondary-school age from less-developed countries where the home language is different from the test language in the destination country. These students have to both quickly acquire knowledge of the test language and catch up with the higher levels of attainment achieved by their peers in the destination country, all while coping with all the problems of adjusting to a new educational and social environment.
To be sure, test performance at age 15 is not in itself a critical issue, provided that poor performance at this stage does not have major implications for young people’s future school careers. However, in most countries there are major decisions to be made at age 16 regarding which track to follow in upper secondary schooling, or whether to continue with schooling at all. Relatively poor reading performance at this stage may therefore have important implications for subsequent schooling. This suggests that, in addition to language instruction, additional help to mitigate the adverse consequences of arriving when older should be offered. This might take the form of further language instruction and flexible arrangements so that those students who arrive when they are older can delay the transition to upper secondary education. Flexible arrangements of this kind might be particularly important if linguistic problems are not the only obstacles facing young migrants. In other words, while language instruction is clearly of greatest importance, it may not be the only path to greater success in school. As the analyses in Table B4.2 shows, it is the combination of coming from a linguistically-dissimilar and less-developed country that is particularly disadvantageous for those who arrive when they are older. Coming from a linguistically-dissimilar but highly developed country does not appear to pose the same risks. Different social and educational contexts will probably require different solutions to these problems.
The results also point to a dilemma in migration policy that is rarely explicitly acknowledged. Most countries require that immigrants have adequate lodgings and income before family reunification is allowed. Although such requirements are well-intentioned, they sometimes result in delaying family reunification and thus increasing the disadvantages to immigrant children, especially if they are older, in terms of poorer reading outcomes and possibly in poorer labour market outcomes later on. Thus, a legitimate concern about the welfare of immigrant children and families may translate into the possibility, if not always the certainty, of poorer educational and integration outcomes following their arrival in destination countries.
Notes
1. This chapter is based on a working paper produced by Anthony Heath and Eilina Kilpi-Jakonen. For more detailed analyses and technical issues see Heath and Kilpi-Jakonen (2012).
2. The results for Qatar were not included in this table.
3. For this analysis, only groups with more than 40 observations are considered. note however that this database combines the data from PISA 2003, PISA 2006 and PISA 2009.
4. The table shows the main effect added to the interaction effect. Technically, for each country test scores were regressed on the natural logarithm of years since arrival (that is, the number of years spent in the destination country by the time of the test), fitting both main effects for years since arrival and interaction effects, allowing the coefficients to vary across origin groups. After experimenting with alternative functional forms, the most parsimonious and tractable form seems to be to take the natural logarithm of the number of years spent in the destination country at the time of the test. The logarithmic transformation takes account of the fact that age-at-arrival differences are relatively small during the earlier years and that the differences gradually increase thereafter. It also provides a significantly better fit to the data than a simple linear model A quadratic function provides an even better fit to the data since it better captures the lower test scores of those who arrived in the first year of life. However, a quadratic function does not lend itself easily to modelling interaction terms, which are a key feature of the analysis, and the more parsimonious logarithmic transformation is therefore preferred.
5. The coefficient for those who speak the test language at home is 5.1 with a standard error of 2.0 and the interaction for those who do not speak the test language at home is 9.6 with a standard error of 2.5 (p=0.0002).

78 © OECD 2012 UnTAPPED SKILLS: REALISInG THE POTEnTIAL OF IMMIGRAnT STUDEnTS
ImmIgrant StudentS’ age at arrIval and aSSeSSment reSultS4
6. This is likely to bias the results of the statistical test although possibly the bias might lead one to underestimate the difference. Thus the early arrivers can be divided into three groups: those who speak the test language at home throughout their lives, those who speak a non-test language when they migrate but switch to the test language by age 15 and those who speak a non-test language throughout their lives. If the test scores of these three groups are assumed to go from highest to lowest in the order that they are listed here, then when the age-of-arrival effect of current test language speakers is examined, it will include a slightly worse-performing group of those who did not speak the test language on arrival, whereas the non-test group is missing the better-performing students (in comparison). If those who switched language do not differ in progress from those who have always spoken the test language and these two groups perform throughout at a higher level than those who speak a non-test language, then the age-at-arrival effect is correct for the test speakers but is dampened for the non-test speakers. But this does depend on what is assumed about the test scores and progress of these three groups (which unfortunately cannot be checked with the currently available data).
7. Linguistic similarity is assumed when countries have the same majority language. In cases where it is not clear whether immigrants are likely to speak the majority language, the language spoken at home was taken as the language of the immigrant student’s country of birth. For example South Africans in Australia and new Zealand (the only two countries where they are identified separately) are classified as coming from a linguistically similar country when they speak the test language at home and from a linguistically different country when they do not. The same applies to immigrant students from Oceania. Italians are always regarded as being linguistically different, except for those in Switzerland who speak the test language at home. By the term “western” here is meant “developed” ; by this classification, Korea, for example, is western.
8. The estimated coefficient 18.5 score points times the natural logarithm of 15 years of age, which equals 50.
References
Böhlmark, A. (2008), “Age at immigration and school performance: A siblings analysis using Swedish register data”, Labour Economics, Vol. 15, no. 6, pp. 1366-1387.
Böhlmark, A. (2009), “Integration of childhood immigrants in the short and long run – Swedish evidence”, International Migration Review, Vol. 43, no. 2, pp. 387-409.
Cahan, S., D. Davis, and R. Staub (2001), “Age at immigration and scholastic achievement in school-age children: Is there a vulnerable age?”, International Migration Review, Vol. 35, no. 2, pp. 587-595.
Heath, A. and E. Kilpi-Jakonen (2012), “Immigrant children’s age at arrival and assessment results”, OECD Education Working Paper Series, no. 75, OECD Publishing.
Myers, D., Xin Gao, and A. Emeka (2009), “The gradient of immigrant age-at-arrival effects on socioeconomic outcomes in the U.S.”, International Migration Review, Vol. 43, no. 1, pp. 205-229.
OECD (2010), PISA 2009 Results: Overcoming Social Background: Equity in Learning Opportunities and Outcomes (Volume II), PISA, OECD Publishing.
van Ours, J.C. and J. Veenman (2006), “Age at immigration and educational attainment of young immigrants,” Economics Letters, Vol. 90, no. 3, pp. 310–316.

79UNTAPPED SKILLS: REALISING THE POTENTIAL OF IMMIGRANT STUDENTS © OECD 2012
Part of the underperformance of immigrant students in PISA can be linked to the fact that they tend to be concentrated in disadvantaged schools. Indeed, the latter is a stronger predictor of immigrant outcomes than either the concentration of immigrants in schools per se or even who mostly speak another language at home. Attendance in a disadvantaged school has a strong adverse impact on reading performance, whatever the origin of the student. In addition, immigrant students with highly educated mothers are more likely to attend disadvantaged schools than are non-immigrant students with mothers of similar education. So their performance suffers as well. These results highlight the fact that educational and social policies interact to limit opportunities for school success among immigrant students.
5
Parental Education, Immigrant Concentration and PISA Outcomes

80 © OECD 2012 UNTAPPED SKILLS: REALISING THE POTENTIAL OF IMMIGRANT STUDENTS
PARENTAL EDUCATION, IMMIGRANT CONCENTRATION AND PISA OUTCOMES5
INTRODUCTIONOne of the notable contrasts observed in the PISA results for children of immigrants compared to those of children of non-immigrants concerns that between the so-called settlement countries of Australia, Canada, New Zealand and the United States, as well as many European countries. In the former group of countries, PISA results for the children of immigrants have shown small differences with those of children of non-immigrants and in some cases were better, while in European countries, assessment results for children of immigrants have generally lagged behind those of the children of non-immigrants, in some countries seriously so. The immediate reaction of many observers is to attribute this result to the selective migration policies of the first three countries and the attractiveness of the United States generally to highly educated migrants.1
The underlying assumption is that there is a link between the educational attainment of parents and the academic outcomes of their children, with higher parental attainment generally associated with better outcomes for their children. The mechanisms by which this operates are numerous and can include, among others, the transmission, in part, of innate ability from parent to child, the presence of educational resources in the home environment, parental assistance with learning and with schoolwork, exposure to cultural events and manifestations, and proficiency in language and expression. As is well known, the link is not a deterministic one, however, with some regression towards mean outcomes by the children of highly educated parents, and some progression towards better schooling and attainment results by children of parents having at best compulsory education.
The issue is an especially pertinent one for the children of immigrants, both because the cross-generational link may be affected by a language barrier among immigrant parents but also because immigrant populations in some countries include significant proportions of individuals with a level of education that may be considerably below the compulsory education level of the country of residence. For example, in the PISA 2009 results, more than 30% of children of immigrants in a number of countries (for example, Luxembourg or the Netherlands) had mothers who at best had completed primary education, perhaps no more than eight or nine years of schooling. Many had much less than this and significant proportions had no education at all.2 In most OECD countries, compulsory education levels are equivalent to at least ten years of schooling and have been so for some time.
The question this raises is whether educational systems are accustomed to and indeed, perhaps presupposing that the parents of entering children have the compulsory education of the country, equipped to deal with such disadvantaged populations. Are they structured to deliver adequate outcomes for the children, regardless of the home environment, and in particular whatever the education level of the parents? To what extent do they depend on parental involvement to achieve their goals? What measures are already in place, or should be in place, to compensate for the more limited ability of poorly educated immigrant parents to assist their children with their schooling?
The measure of outcomes used in this chapter is not educational attainment per se, but rather reading assessment results as measured at age 15, that is, close to the age limit for compulsory education. The link between assessment results and access to higher education is the subject of Chapter 6 in this publication.
Although one might expect the human capital endowment of parents to be a significant element in the outcomes of their children, as will be seen, the lower human capital endowment of the immigrant population by itself does not account for all of the reading differences between children of immigrants and children of non-immigrants. Other factors are at play, which exert a significant role.
One other such factor is the school’s composition, that is, the characteristics of the student population. Given that immigrants tend to concentrate in certain neighbourhoods and districts of cities in virtually all countries, the issue of a possible peer effect on outcomes is an especially pertinent one. However, the dimension along which concentration occurs and which affects outcomes is not self-evident. Is it the concentration of immigrants per se in certain neighbourhoods which is associated with the less favourable outcomes one observes for the children of immigrants in many countries? Or is it rather the concentration of students who largely speak another language at home? Or the concentration of immigrant students in disadvantaged schools? This is an issue that will figure prominently in this chapter.
In examining the association between a particular characteristic and differences in outcomes between children of immigrants and non-immigrants, there are two elements to consider: how different the two populations are with respect to the characteristic in question and how different the populations are with respect to the impact of the characteristic on outcomes. Modelling exercises normally focus on adjusting for the former, often (but not always) assuming that the impact is more or less of the same magnitude for both the target and reference populations. In practice, this may not be the case, and the differences may provide some insight concerning where policy interventions may be especially effective.
The purpose of the chapter is to examine the impact of parental education on outcomes more closely and, in particular, the effect of peer educational disadvantage on assessment outcomes. As will be seen, this generally has a greater impact on outcomes that the other concentration measures cited above and indeed, than parental educational attainment. In an ideal world, immigrant children 3 would be distributed throughout all schools in the same proportion by educational attainment as their non-immigrant counterparts. In practice, this is far from being the case. The extent to which immigrant outcomes are related to this unequal distribution is a matter of some interest.

81UNTAPPED SKILLS: REALISING THE POTENTIAL OF IMMIGRANT STUDENTS © OECD 2012
PARENTAL EDUCATION, IMMIGRANT CONCENTRATION AND PISA OUTCOMES5
The chapter pays particular attention to differential impacts of certain factors on outcomes for the children of immigrants. The emphasis as well will be on characteristics which policy can reasonably affect or where the results suggest a means of policy intervention, the cost and feasibility of which remain to be determined. It is clear, for example, that policy can scarcely hope to affect the educational attainment of the parents of immigrants once they have arrived, but it can play a mediating role and provide the assistance which higher levels of education normally allow parents to give.
Box 5.1 Data sources and definitions
Participating countries and economies in PISA 2009 numbered 65, of which 34 were OECD member countries. The reading assessment that was carried out is the fourth in a series going back to the year 2000, but only the second in which reading has been a major domain of assessment. The PISA sample sizes vary from country to country, as do of course the total numbers of students of age 15. The analyses presented in this chapter are from the 2009 assessment.
Given the range of countries participating in PISA, there is considerable heterogeneity in the data, both with respect to the educational attainment of students’ parents and assessment results, and in absolute terms as well as for the children of immigrants compared to the children of non-immigrants (Table B5.1a).
This poses some problems for the analysis. Some people categorised as “immigrant” in some countries became immigrants by virtue of border changes which occurred following an internal migration. This is the case, for example, in countries formed by the break-up of the Soviet Union and Yugoslavia. It is difficult to determine to what extent “migrations” in these cases partake of standard cross-border movements in which migrants are faced with new institutions, customs and perhaps languages, to which they and their children traditionally have had to adapt. Nevertheless, the choice has generally been made to include them, while recognising that the diversity of situations across very different countries may make it more difficult to identify common patterns.
Sample size considerations also limit the number of countries which one can include in the analysis. For the purposes of the analyses presented here, only countries with at least 100 first- or second-generation 4 children of immigrants in the sample have been retained. Even with the 100-student minimum, there are nonetheless some sample-size issues figuring in many of the analyses and data occasionally have to be suppressed because the sample sizes are insufficient to provide reliable estimates.5
For the analyses of concentration effects, each sampled school in a country has been placed into a quartile defined according to the estimated (weighted) percentage of students in the school with a particular characteristic. Three characteristic measures were considered: i) the percentage of students in the school who are children of immigrants; ii) the percentage of students in the school who are children of immigrants and largely speak another language at home; and iii) the percentage of students in the school with mothers with less than upper secondary attainment.6
The percentages were defined only for schools with at least 20 responding students for the characteristics in question, in order to ensure a reasonably reliable measure of school concentration. The number of schools and students (unweighted and weighted) excluded by this criterion is given in Table B5.2. Overall the minimum 20-student criterion excluded some 7% to 10% of the sample representing an estimated 10% to 13% of students. For some countries, however, in particular Denmark, Germany and Latvia the percentage of sample excluded was considerably larger for some of the characteristics, ranging from 25% to 35%. If the sampling rates across all schools are similar, it is likely that it was the smaller schools which were excluded. Across schools and on average across countries, the percentage of children of immigrants in included and excluded schools was broadly similar.
Analyses involving parental educational attainment are carried out on the basis of the educational attainment of the mother, if present, otherwise they are based on that of the father. The mother’s educational attainment was chosen because traditionally school success has been considered to be more strongly linked to the attainment of the mother than with that of the father. In practice, however, the PISA data do not reveal much difference in this regard.

82 © OECD 2012 UNTAPPED SKILLS: REALISING THE POTENTIAL OF IMMIGRANT STUDENTS
PARENTAL EDUCATION, IMMIGRANT CONCENTRATION AND PISA OUTCOMES5
Box 5.2 Country cluster: Grouping countries by immigrant characteristics
Given sample-size limitations in general, data have had to be pooled across countries for certain analyses. Countries, however, are quite heterogeneous, both with respect to their immigrant populations and the nature of their educational systems, as well as with respect to policies concerning immigrant children. It is often difficult to account for all of these in modelling exercises. How then should countries be grouped?
The strategy adopted here has been to take a two-stage approach. The first stage consisted of grouping countries, using a standard clustering algorithm,7 based on certain characteristics observed to be significant factors in explaining student outcomes. The characteristics are the following: the difference in the distribution of the educational attainment of the mothers of immigrant versus non-immigrant students, the percentage of immigrant students in the country mostly speaking another language (than the test language) at home; and the percentage of immigrant students in each school disadvantage quartile, from the least advantaged (quartile 1) to the most disadvantaged (quartile 4). The characteristics used for clustering thus incorporate both home and school background effects.
The clustering procedure identified three clusters:8 Cluster 1, which includes the United States and most western and northern European countries, but excludes southern Europe; Cluster 2, which includes all non-OECD member countries with sufficient PISA sample sizes for immigrant analysis except Singapore, but also Greece and Portugal; and Cluster 3, which includes the settlement countries of Australia, Canada, New Zealand, three “new” migration countries, namely Ireland, Italy and Spain, plus Israel and Singapore.
The clusters can be characterised as follows (Figure 5.1): Cluster 1 consists of countries having a less educated immigrant population on average and a high concentration of immigrants in disadvantaged schools. Cluster 2, the “non-OECD” group is characterised by immigrants whose educational attainment is similar to that of the domestic population, who generally speak the host country language at home and whose immigrants are relatively evenly distributed across schools. The third cluster differs from the second in having a relatively high percentage of students mostly speaking another language at home, a feature which it shares with Cluster 1. On the other hand, it tends to have a somewhat more educated immigrant population compared to non-immigrants than Cluster 2.
This clustering result has a certain intuitive appeal, first of all, in splitting off most non-OECD member countries with their generally unusual immigrant populations, involving often border change migration or migration of persons of similar linguistic backgrounds or of expatriate populations often assessed in their own language or in English (Dubai [UAE] and Qatar). Secondly, the clustering procedure groups the selective migration countries together (Australia, Canada, New Zealand) and interestingly, three new migration countries (Ireland, Italy and Spain). Note that if partner countries are excluded from the clustering process, these three are joined in this same group by two other OECD member migration countries, namely Greece and Portugal, which are otherwise grouped with partner countries and economies. Although these new migration countries, which were becoming labour migration countries in the period when the immigrant parents of PISA-assessed students arrived there, are similar to the selective migration countries in certain respects, they differ in having outcomes for children of immigrants that are not generally as favourable. Cluster 3 also includes Israel, where permanent migration is almost entirely ethnic/religious in character and Singapore, where migration is very highly educated. By contrast, Cluster 1 groups countries together where immigrant children perform relatively unfavourably compared to non-immigrant children, with the possible exception of the United Kingdom and the United States, where the differences are not so large.
Figure 5.1 also shows the difference in reading scores between the children of immigrants and non-immigrants, which illustrates that the link between outcomes and characteristics is not straightforward. One could conclude provisionally, however, that the scenario associated with less educated immigrant populations, of linguistic origin different from that of the country of residence and concentrated in disadvantaged schools (Cluster 1) is not one that appears particularly conducive to positive outcomes.
…

83UNTAPPED SKILLS: REALISING THE POTENTIAL OF IMMIGRANT STUDENTS © OECD 2012
PARENTAL EDUCATION, IMMIGRANT CONCENTRATION AND PISA OUTCOMES5
Box 5.2 Country cluster: Grouping countries by immigrant characteristics (continued)
• Figure 5.1 • Countries grouped according to certain immigrant-related characteristics
Reading score of children of immigrants
compared to non-immigrants
Percentage of children of immigrants
speaking another language at home
Difference in distribution of educational attainment of mothers of immigrant compared to non-immigrant
children (percentage points higher[+] / lower[-])Percent of immigrant students in each school educational
disadvantage quartile
At best primary
Lower secondary
Upper secondary Tertiary
Advantaged (Q1)
Less advantaged
(Q2)
Less disadvantaged
(Q3)Disadvantaged
(Q4)
Cluster 1
Belgium -68 51 +16 +5 -7 -14 11 14 24 50
Austria -68 74 +12 +16 -21 -6 12 16 24 48
Sweden -66 66 +13 +4 -7 -10 18 20 19 43
Denmark -61 52 +18 +10 -8 -19 10 18 22 51
France -61 40 +16 +16 -17 -15 10 17 16 57
Germany -57 58 +16 +5 -22 +2 13 19 22 45
Norway -54 77 +12 +3 -1 -14 18 22 21 39
Luxembourg -52 77 +29 +2 -16 -14 24 15 26 35
Switzerland -49 57 +14 +16 -24 -6 19 20 23 38
Slovenia -48 55 +1 +20 -3 -18 16 17 23 44
Netherlands -45 43 +32 +3 -21 -14 11 13 17 59
United Kingdom -25 47 +10 +5 -15 +1 16 13 20 51
United States -22 60 +20 +8 -7 -21 10 10 27 53
Average -52 58 +16 +9 -13 -12 14 17 22 47
Cluster 2
Greece -59 39 -3 +0 +9 -6 17 20 21 42
Argentina -41 17 +13 -3 +2 -12 12 30 22 36
Estonia -34 11 -0 +1 -6 +5 28 43 11 18
Portugal -26 19 -14 +3 +2 +9 31 32 27 10
Russian Federation -25 19 +1 +3 +4 -8 21 29 21 30
Croatia -16 3 +2 +10 -4 -8 23 24 29 24
Latvia -13 19 -0 -2 +0 +2 26 26 10 39
Hong Kong-China -3 11 +17 +10 -18 -8 14 24 27 35
Montenegro 5 10 +2 -4 -6 +8 28 40 14 18
Kazakhstan 6 10 +1 +3 +0 -4 21 20 28 31
Macao-China 7 8 +3 +10 -5 -8 18 29 26 27
Jordan 11 6 -4 -5 -2 +11 38 31 21 10
Serbia 16 3 -1 -1 -1 +3 31 25 24 20
Average -13 13 +1 +2 -2 -1 24 29 22 26
Cluster 3
Italy -72 67 +6 -9 -0 +3 19 26 28 27
Spain -57 42 +1 -4 +3 +0 16 34 29 22
Ireland -30 45 +1 -6 -12 +17 22 23 30 25
New Zealand -13 47 +1 -5 -13 +16 24 27 23 26
Canada -6 49 +5 +0 -6 +1 20 22 26 32
Israel -0 40 +4 -2 -9 +7 19 31 32 18
Singapore 2 79 -6 +0 -17 +23 30 26 21 23
Australia 10 36 +3 +0 -9 +6 24 24 21 31
Average -21 51 +2 -3 -8 +9 22 27 26 25
Outlier countries
Brazil -101 4 +8 -5 -12 +10 6 39 21 34
Mexico -99 18 +21 -9 -7 -6 9 16 31 45
Dubai (UAE) 95 55 -16 -8 -7 +31 33 29 26 12
Qatar 97 42 -6 -1 -0 +8 34 26 23 17
Source: Table B2.1a, Table B3.1 and Table B5.1a. …

84 © OECD 2012 UNTAPPED SKILLS: REALISING THE POTENTIAL OF IMMIGRANT STUDENTS
PARENTAL EDUCATION, IMMIGRANT CONCENTRATION AND PISA OUTCOMES5
EDUCATIONAL ATTAINMENT AND ASSESSMENT RESULTSRather large differences exist in the educational attainment of immigrants across countries and within countries, relative to those of non-immigrants. So-called “guest-worker” migration in many European countries consisted of the migration of generally low-educated workers to take on low-skilled jobs, especially in construction and manufacturing, whereas the selective migration policies of countries like Australia and Canada guaranteed a flow of immigrants whose educational attainment was much more similar, and indeed in some cases, higher than that of the native-born population. Chain or network migration tends to ensure that past migration patterns continue to influence current patterns.
Figure 5.2 contrasts the percentage of native-born mothers with at least upper secondary attainment with that of immigrant mothers, as reported by the students assessed in PISA, where the countries are sorted according to the percentage of mothers of second-generation students with at least upper secondary attainment (Box 5.3). In many countries, the percentage of non-immigrant mothers with at least secondary attainment is higher by some 20 to 40 points than that of immigrant mothers. Many immigrant mothers in these countries have significantly less than compulsory education levels in their new countries of residence.
One would expect that reading assessment results would normally be associated with parental attainment levels. This is indeed the case and it holds true with few exceptions almost everywhere, for both children of immigrants and non-immigrants. Some of this can be attributed to innate ability being transmitted from parent to child, but this is only a partial explanation, educational attainment itself being at best an imperfect reflection of ability. It may apply even less so to the immigrant population, because greater inequalities in origin countries and generally lower levels of education in those countries mean that the link between educational attainment and ability may be weaker. In addition, educational systems also influence the link between parental attainment and reading outcomes, with some systems attenuating the effect of parental attainment on outcomes more than others.
Following this initial clustering in terms of characteristics, which is still highly aggregated, subgroups have been formed, which respect the initial clustering according to characteristics, but are now grouped according to criteria involving national or migration history, linguistic/cultural affinities and/or similarity in outcomes. Many of these will appear “natural”, others perhaps less so; the latter reflect inevitable compromises. The objective is to accumulate enough sampled students of immigrant origin in each group to be able to carry out more detailed analyses. The groups have been assigned names to assist in remembering their composition, which may not always do justice to the diversity of situations in the countries grouped together.
They are as follows:
Cluster 1: Germanic: Austria, Germany, Luxembourg and Switzerland
Franco-Dutch: Belgium, France and the Netherlands
Nordic: Denmark, Norway, Slovenia, and Sweden
Anglo-American: the United Kingdom and the United States
Cluster 2: China group: Macao-China and Hong Kong-China
Former Soviet Union: Estonia, Kazakhstan, Latvia and the Russian Federation
Former Yugoslavia: Croatia, Montenegro and Serbia
Mixed group: Argentina, Greece, Portugal and Jordan
Cluster 3: Settlement: Australia, Canada, Israel, New Zealand and Singapore
New migration: Italy, Spain and Ireland.
These country groups will be used on occasion, when sample sizes make it problematic to carry out results except for a limited number of countries. On occasion, the groups will be used as well to present average results across countries, when the statistics are too extensive to appropriately present individual countries. Note that in averaging across countries, each country is assigned the same weight, regardless of population. The objective is to show results for an average country and policy environment, not for all countries in a particular group confounded.
Box 5.2 Country cluster: Grouping countries by immigrant characteristics (continued)

85UNTAPPED SKILLS: REALISING THE POTENTIAL OF IMMIGRANT STUDENTS © OECD 2012
PARENTAL EDUCATION, IMMIGRANT CONCENTRATION AND PISA OUTCOMES5
• Figure 5.2 •Percentage of 15-year-olds whose mother has attained at least upper secondary education
0 20 40 60 80 100
Macao-China
Hong Kong-China
Argentina
Singapore
Jordan
Croatia
Serbia
Montenegro
Russian Federation
Kazakhstan
Latvia
Portugal
Luxembourg
France
Switzerland
Netherlands
Denmark
Italy
Germany
Spain
United States
Belgium
Austria
Slovenia
Ireland
Sweden
United Kingdom
New Zealand
Norway
Israel
Canada
Australia
Greece
Estonia
Part
ners
OEC
D
%
First-generation studentsSecond-generation studentsNon-immigrant students
Countries are ranked in descending order of the percentage of second-generation students whose mother has attained at least upper secondary education.
Source: Table B2.2i.

86 © OECD 2012 UNTAPPED SKILLS: REALISING THE POTENTIAL OF IMMIGRANT STUDENTS
PARENTAL EDUCATION, IMMIGRANT CONCENTRATION AND PISA OUTCOMES5
Box 5.3 How 15-year-olds report parental education
In the PISA assessments, the educational attainment level of the parents is reported by the students who are assessed. To what extent is this reporting accurate?
There are many reasons why one might expect the reporting to be subject to error, especially among children of immigrants. Many immigrants were educated in their countries of origin, where the structure of educational systems may be different from those in the country of residence. Still, one would expect that the basic levels (primary/secondary/tertiary) and their designations would tend to be well-nigh universal across countries. In addition, immigrants tend to be more often overqualified than non-immigrants for the jobs which they occupy, which may distort the perception which youth have of the educational level of their parents. On the other hand, immigrants in some countries have attainment levels which are lower on average than general education levels in the country and their children may tend to inflate the attainment of their parents, because of misperception, shame or another reason.
In most labour force surveys, one can identify mothers with children of a particular age as well as the immigrant status of persons within a household. To obtain some idea of the quality of the reporting of parental educational attainment, a comparison was carried out using the European Union Labour Force Survey, for the characteristics of households with children in the age range 13 to 17, pooling over the 2007-2009 surveys in order to accumulate a large enough sample to obtain reliable estimates.
• Figure 5.3 • Mothers with at least upper secondary education, PISA vs. Labour Force Surveys
-5
0
5
10
15
20
25
30
35
Luxe
mbo
urg
Esto
nia
Nether
lands
Spain
Irelan
d
Slove
nia
Franc
e
Portu
gal
Italy
Austri
a
United
King
dom
Greec
e
Belgium
Percentage point difference between PISAand labour force surveys
Immigrant students Non-immigrant students
Note: Labour force survey estimates are for young persons 13-17 years of age and were estimated using the 2007-09 European Union Labour Force Surveys. PISA estimates are from the 2009 assessment. The estimates cover countries for which the sample sizes were large enough to yield reliable estimates.
Countries are ranked in ascending order of the percentage point difference between PISA and Labour Force Survey estimates of immigrant students whose mother has attained at least upper secondary education.
The results indicate that the 15-year-old children of immigrants in PISA generally tend to report educational levels for their parents that are higher than those reported by the parents themselves or their spouses in labour force surveys (Figure 5.3), but this is also the case for children of non-immigrants and, on average, to approximately the same extent. On average across countries the percentage of mothers with at least upper secondary attainment reported by 15-year-olds in PISA is 16 points higher than those reported by the parents of 13 to 17-year-olds in labour force surveys. However, there is considerable variation across countries. In a number of countries, there are fairly large differences in reporting bias between immigrants and non-immigrants (Luxembourg, Slovenia, Greece and Belgium), with children of non-immigrants reporting relatively higher levels in Luxembourg and lower levels in the latter three countries. If labour force survey reporting can be considered a reliable benchmark, analyses using PISA data which depend on differences in parental attainment levels between immigrants and non-immigrants may be subject to distortion for some countries.

87UNTAPPED SKILLS: REALISING THE POTENTIAL OF IMMIGRANT STUDENTS © OECD 2012
PARENTAL EDUCATION, IMMIGRANT CONCENTRATION AND PISA OUTCOMES5
It should be noted, however, that irrespective of the quality of the educational system, there is a natural progression in the outcomes of children with the lowest parental attainment (progression towards the mean) and a regression to the mean by children with the highest parental attainment levels. Regression towards the mean in itself will result in some apparent offsetting of the effect of parental attainment on outcomes which has little to do with the particular merits or demerits of educational systems, but is a purely statistical phenomenon reflecting movement away from an extreme value. Expectations are of course that educational systems will be able to go beyond this and offset some of the real social disadvantages associated with low parental attainment, which would manifest itself through such things as a lower level of educational resources in the home, a lower ability to assist with homework, etc.
To what extent are the observed results for the children of immigrants in PISA-participating countries a function of the education attainment level of the parents? There exists considerable diversity in the composition of immigrants and in the history of migration among countries having administered the PISA assessment to 15-year-olds and the cross-country relation between differences in mothers’ attainment (compared to non-immigrant mothers)9 and differences in reading outcomes has not been found to be strong (Figures 5.4a and 5.4b). The cross-country correlations for both first and second generation students are in the neighbourhood of about 0.5. In other words, differences in mothers’ attainment levels explain about 25% of the variance in reading score levels across countries.10
• Figure 5.4 • Relationship between reading performance of students and mother’s educational attainment,
by immigrant background
Belgium
Austria
Luxembourg Denmark
GermanyFrance
NetherlandsNorway
Sweden
SwitzerlandSlovenia
United States
United Kingdom
Macao-ChinaHong Kong-China
Italy
Estonia GreeceRussian Federation
SpainNew Zealand
PortugalCroatia
LatviaCanada
Israel
JordanAustralia Singapore
SerbiaKazakhstan
OECD average
-100
-80
-60
-40
-20
0
20
40
-40 -30 -20 -10 0 10 20 30
Difference in mother’s education (second-generation – non-immigrant)
5.4a. Second-generation students
Average,both axes
Score point difference(second-generation –non-immigrant)
Note: The difference in mother’s education is measured by the difference in the percentage of mothers having at least upper secondary education for the two comparison groups.
Source: Tables B2.1a and B2.2i.
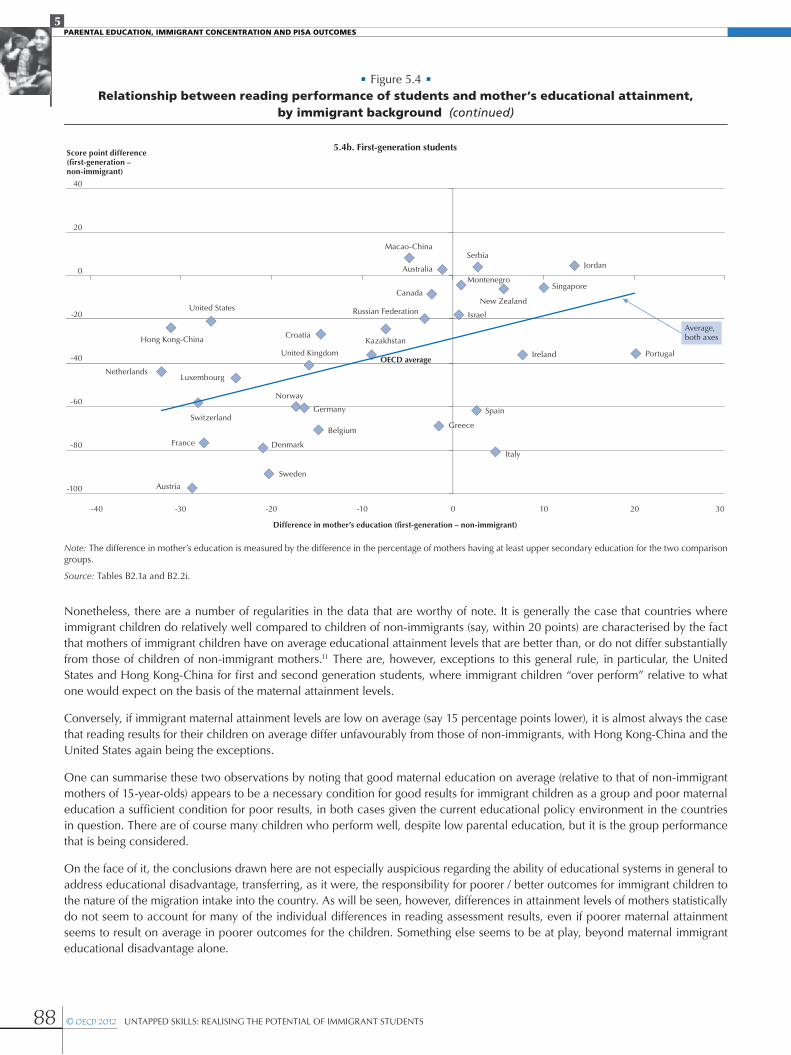
88 © OECD 2012 UNTAPPED SKILLS: REALISING THE POTENTIAL OF IMMIGRANT STUDENTS
PARENTAL EDUCATION, IMMIGRANT CONCENTRATION AND PISA OUTCOMES5
Nonetheless, there are a number of regularities in the data that are worthy of note. It is generally the case that countries where immigrant children do relatively well compared to children of non-immigrants (say, within 20 points) are characterised by the fact that mothers of immigrant children have on average educational attainment levels that are better than, or do not differ substantially from those of children of non-immigrant mothers.11 There are, however, exceptions to this general rule, in particular, the United States and Hong Kong-China for first and second generation students, where immigrant children “over perform” relative to what one would expect on the basis of the maternal attainment levels.
Conversely, if immigrant maternal attainment levels are low on average (say 15 percentage points lower), it is almost always the case that reading results for their children on average differ unfavourably from those of non-immigrants, with Hong Kong-China and the United States again being the exceptions.
One can summarise these two observations by noting that good maternal education on average (relative to that of non-immigrant mothers of 15-year-olds) appears to be a necessary condition for good results for immigrant children as a group and poor maternal education a sufficient condition for poor results, in both cases given the current educational policy environment in the countries in question. There are of course many children who perform well, despite low parental education, but it is the group performance that is being considered.
On the face of it, the conclusions drawn here are not especially auspicious regarding the ability of educational systems in general to address educational disadvantage, transferring, as it were, the responsibility for poorer / better outcomes for immigrant children to the nature of the migration intake into the country. As will be seen, however, differences in attainment levels of mothers statistically do not seem to account for many of the individual differences in reading assessment results, even if poorer maternal attainment seems to result on average in poorer outcomes for the children. Something else seems to be at play, beyond maternal immigrant educational disadvantage alone.
• Figure 5.4 •Relationship between reading performance of students and mother’s educational attainment,
by immigrant background (continued)
-100
-80
-60
-40
-20
0
20
40
-40 -30 -20 -10 0 10 20 30
Difference in mother’s education (first-generation – non-immigrant)
Score point difference(first-generation –non-immigrant)
Austria
Sweden
DenmarkFrance
Belgium
Germany
Norway
Switzerland
Luxembourg
United Kingdom
Netherlands
CroatiaHong Kong-China
United States
Italy
Greece
Spain
Ireland Portugal
Kazakhstan
Russian FederationNew Zealand
Israel
CanadaSingapore
MontenegroAustralia
SerbiaMacao-China
Jordan
OECD average
5.4b. First-generation students
Average,both axes
Note: The difference in mother’s education is measured by the difference in the percentage of mothers having at least upper secondary education for the two comparison groups.
Source: Tables B2.1a and B2.2i.

89UNTAPPED SKILLS: REALISING THE POTENTIAL OF IMMIGRANT STUDENTS © OECD 2012
PARENTAL EDUCATION, IMMIGRANT CONCENTRATION AND PISA OUTCOMES5
In addition to the exceptions of the United States and Hong Kong-China, there is another “exceptional” group of countries, where children on average appear to be “underperforming”, given the rather favourable attainment levels of their mothers. The population concerned is that of first-generation students and all of the exception countries are relatively “new” immigration countries, which have had large immigration inflows over the past 15 years (Italy, Greece, Spain and Ireland, with Portugal only marginally different). The educational systems of these countries may have had some difficulties adapting to the new high levels of inflows (Table B5.3).
THE DIFFERENTIAL IMPACTS OF MATERNAL ATTAINMENT ON OUTCOMESThe educational composition of the immigrant population is but one element among those which exert an influence on the reading outcomes of the children of immigrants and one over which educational systems cannot have a direct impact, although they may be able to compensate for home disadvantage to some extent, through assistance at school, special classes or tutoring, etc.
A second element concerns the relation between mother’s education and reading results, which may differ across countries, but also between immigrant and non-immigrant students within the same country. Figure 5.5 give some idea of the diversity observed in this regard across countries. Here one sees examples of countries where the maternal-education gradients 12 are parallel for the various migration statuses (Sweden and Italy); countries where there is convergence of the gradients with increasing educational attainment (Canada and Israel); and countries where there appears to be, on the one hand, divergence between natives and the second generation, and on the other, a parallel evolution for natives and the first generation (France and Germany and to some extent, Switzerland).
• Figure 5.5 • PISA reading scores as a function of mother’s educational attainment, selected countries
360
380
400
420
440
460
480
500
520
540
560
At best primary Lower secondary Upper secondary Tertiary
PISA
rea
ding
sco
re
360
380
400
420
440
460
480
500
520
540
560
PISA
rea
ding
sco
re
Mother’s education
At best primary Lower secondary Upper secondary Tertiary
Mother’s education
360
380
400
420
440
460
480
500
520
540
560
At best primary Lower secondary Upper secondary Tertiary
PISA
rea
ding
sco
re
360
380
400
420
440
460
480
500
520
540
560
PISA
rea
ding
sco
re
Mother’s education
At best primary Lower secondary Upper secondary Tertiary
Mother’s education
Germany France
Israel Canada
First-generation students Second-generation students Non-immigrant students
360
380
400
420
440
460
480
500
520
540
560
At best primary Lower secondary Upper secondary Tertiary
PISA
rea
ding
sco
re
360
380
400
420
440
460
480
500
520
540
560
PISA
rea
ding
sco
re
Mother’s education
At best primary Lower secondary Upper secondary Tertiary
Mother’s education
360
380
400
420
440
460
480
500
520
540
560
At best primary Lower secondary Upper secondary Tertiary
PISA
rea
ding
sco
re
360
380
400
420
440
460
480
500
520
540
560
PISA
rea
ding
sco
re
Mother’s education
At best primary Lower secondary Upper secondary Tertiary
Mother’s education
Sweden Italy
United States Hong Kong-China
First-generation students Second-generation students Non-immigrant students

90 © OECD 2012 UNTAPPED SKILLS: REALISING THE POTENTIAL OF IMMIGRANT STUDENTS
PARENTAL EDUCATION, IMMIGRANT CONCENTRATION AND PISA OUTCOMES5
Now in all the countries shown here and indeed in general, the curve for the second-generation students lies above that of first-generation students, as one might expect, since for native-born children of immigrants, there is no disruption of education as a result of migration and in principle, there is at least the possibility, if not always the reality, of significant exposure to the language of the destination country from a very early age. In addition, many immigrant parents of second generation students may themselves have arrived in the country at a young age and been partly educated in the country (Table B1.2, Chapter 1).
A more systematic linear regression analysis of the relationship between mothers’ education and reading assessment results in shown in Table B5.3. Figure 5.6 gives the essential results. Note that all of the statistics in Table B5.3 and Figure 5.6 and in others to come can be interpreted in terms of PISA score points. In Figure 5.6 only results for Clusters 1 and 3 are portrayed; those for Cluster 2 are erratic, but can be consulted in Table B5.3.
The first observation based on the results of the table (Figures 5.6a and 5.6b) is that controlling for educational attainment accounts for only about 10-15 points of the total difference between children of immigrants and children of the non-immigrants for Cluster 1, consisting largely of most northern and European countries with immigrant populations of below average education. But this is at best a third of the total difference, indicating that differences in reading outcomes in these countries involve more than just low parental education. For Cluster 3, where the difference in attainment levels between immigrants and non-immigrants are smaller, the adjustment has little effect, indeed in some cases it even increases the difference.
The more favourable results for second-generation students compared to the first cited above are evident for all country groupings. A less obvious result than this, however, is the fact that there are significant immigrant-specific effects of education and that these are even more important that those attributed to the lower attainment levels of immigrant parent populations. In practice, this manifests itself in an apparent flattening of maternal education gradients for children of immigrants in Clusters 1 and 3, that is, there appears to be less improvement in reading results with mothers’ education among children of immigrants than observed among the children of non-immigrant mothers. This is especially the case for second-generation students. This is the reason for the improvement in immigrant children outcomes seen in Figure 5.6b, when one removes the effect of this flattening.
Figures 5.7a and 5.7b show the result graphically, presented in a somewhat different way. The lines have been inserted as an aid in visualising the result. The figures show that there is less variation in PISA results across OECD countries among children of non-immigrants than among children of immigrants (the “slopes” of the lines are flatter), but there is less difference between children of high- and low-attainment immigrant mothers than between children of high- and low-attainment non-immigrant mothers (the bandwidth is smaller for children of immigrants).
• Figure 5.5 • PISA reading scores as a function of mother’s educational attainment, selected countries (continued)
360
380
400
420
440
460
480
500
520
540
560
At best primary Lower secondary Upper secondary TertiaryPI
SA r
eadi
ng s
core
360
380
400
420
440
460
480
500
520
540
560
PISA
rea
ding
sco
re
Mother’s education
At best primary Lower secondary Upper secondary Tertiary
Mother’s education
360
380
400
420
440
460
480
500
520
540
560
At best primary Lower secondary Upper secondary Tertiary
PISA
rea
ding
sco
re
360
380
400
420
440
460
480
500
520
540
560
PISA
rea
ding
sco
re
Mother’s education
At best primary Lower secondary Upper secondary Tertiary
Mother’s education
Sweden Italy
United States Hong Kong-China
First-generation students Second-generation students Non-immigrant students
360
380
400
420
440
460
480
500
520
540
560
At best primary Lower secondary Upper secondary Tertiary
PISA
rea
ding
sco
re
360
380
400
420
440
460
480
500
520
540
560
PISA
rea
ding
sco
re
Mother’s education
At best primary Lower secondary Upper secondary Tertiary
Mother’s education
Croatia Switzerland
First-generation students Second-generation students Non-immigrant students
Source: Table B5.1a.

91UNTAPPED SKILLS: REALISING THE POTENTIAL OF IMMIGRANT STUDENTS © OECD 2012
PARENTAL EDUCATION, IMMIGRANT CONCENTRATION AND PISA OUTCOMES5
• Figure 5.6 • Differences between reading outcomes across immigrant backgrounds adjusting for mother’s education
Figure 5.6a. First-generation and non-immigrant students
-80
-60
-40
-20
0
20
40
60
Germanic Anglo-American Franco-Dutch Nordic New migration Settlement
Cluster 1 Cluster 3
Observed Controllling for educational attainment Including immigrant-specific effects of educational attainment
Figure 5.6b. Second-generation and non-immigrant students
-80
-60
-40
-20
0
20
40
60
Germanic Anglo-American Franco-Dutch Nordic New migration Settlement
Cluster 1 Cluster 3
Observed Controllling for educational attainment Including immigrant-specific effects of educational attainment
Source: Table B5.3.
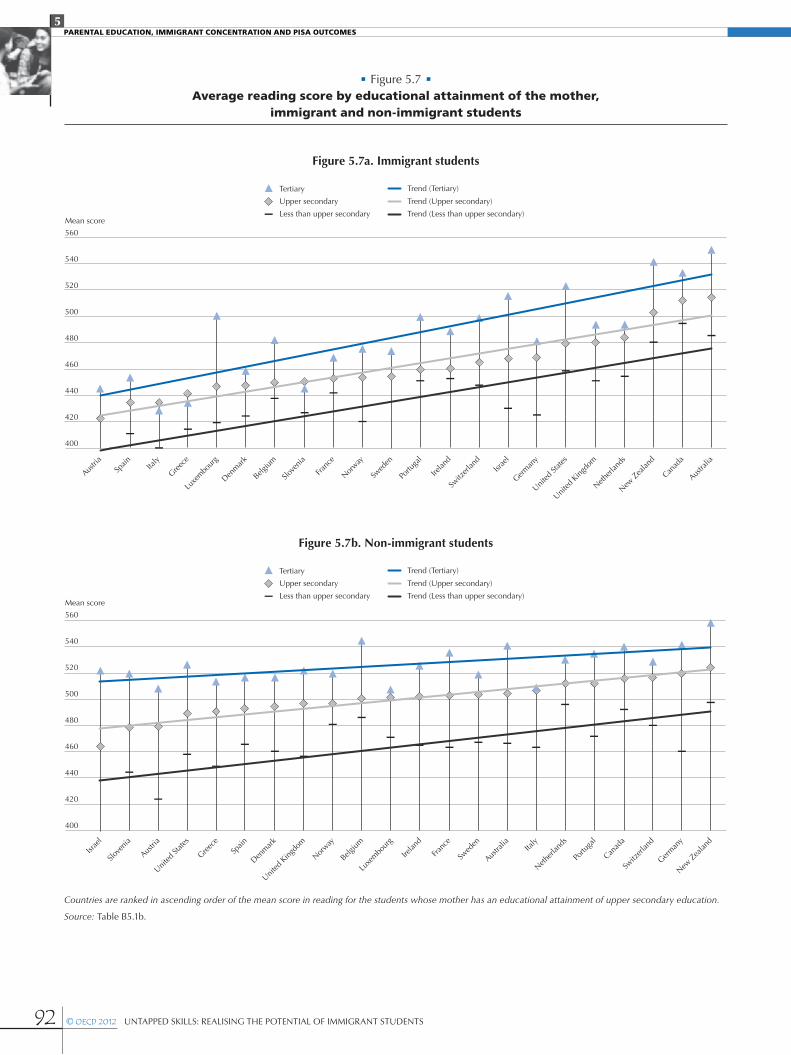
92 © OECD 2012 UNTAPPED SKILLS: REALISING THE POTENTIAL OF IMMIGRANT STUDENTS
PARENTAL EDUCATION, IMMIGRANT CONCENTRATION AND PISA OUTCOMES5
• Figure 5.7 • Average reading score by educational attainment of the mother,
immigrant and non-immigrant students
Figure 5.7a. Immigrant students
400
420
440
460
480
500
520
540
560
Austri
aSp
ain Italy
Greece
Luxe
mbour
g
Denmark
Belgium
Slove
nia
Franc
e
Norway
Swed
en
Portu
gal
Irelan
d
Switz
erlan
dIsr
ael
German
y
United
State
s
United
King
dom
Netherl
ands
New Z
ealan
d
Canad
a
Austra
lia
Mean score
Trend (Tertiary)
Trend (Upper secondary)
Less than upper secondary Trend (Less than upper secondary)
Tertiary
Upper secondary
Figure 5.7b. Non-immigrant students
400
420
440
460
480
500
520
540
560
Mean score
Israe
l
Slove
nia
Austri
a
United
State
s
Greece
Spain
Denmark
United
King
dom
Norway
Belgium
Luxe
mbour
g
Irelan
d
Franc
e
Swed
en
Austra
lia Italy
Netherl
ands
Portu
gal
Canad
a
Switz
erlan
d
German
y
New Z
ealan
d
Trend (Tertiary)
Trend (Upper secondary)
Less than upper secondary Trend (Less than upper secondary)
Tertiary
Upper secondary
Countries are ranked in ascending order of the mean score in reading for the students whose mother has an educational attainment of upper secondary education.
Source: Table B5.1b.

93UNTAPPED SKILLS: REALISING THE POTENTIAL OF IMMIGRANT STUDENTS © OECD 2012
PARENTAL EDUCATION, IMMIGRANT CONCENTRATION AND PISA OUTCOMES5
There are a number of possible hypotheses that come to mind to “explain” why the benefits of higher parental education on children’s outcomes might be less evident among children of immigrants than among children of non-immigrants. The first such explanation concerns the impact of the language spoken at home, which may often be different from that of the host country and which may hamper the acquisition of proficiency in the national language by the student. Among others, a greater recourse to a foreign language in the home environment may in particular offset the advantage which parents of higher attainment levels can be expected to have in assisting their children with school work.
A second hypothesis concerns the possibility that nominal educational attainment levels, especially at higher levels, for some immigrants may not be entirely comparable or equivalent to those obtained by non-immigrants in the host country. Hanushek and Woessmann (2008), for example, have shown that assessment results of children (as a proxy for educational quality) are better predictors of economic growth than formal educational qualifications, such as those measured here. The issue of the equivalence of qualifications is one that arises (in the labour market) generally for higher attainment levels. For some origin countries, foreign qualifications may convey only some of the impact on childrens’ outcomes that one associates with host-country higher educational attainment.
A third possible explanation concerns the possibility of a group impact on student outcomes, either associated with the concentration of immigrants in particular geographic areas and schools or with the characteristics of immigrants as a group. Immigrants in all countries tend to concentrate in particular areas of cities, with shops, religious establishments, and community groups that reproduce in part the environment of the home country. If immigrants are in general well-educated, the concentration of immigrants in specific areas and schools may not have any adverse effects; they may stimulate each other to better achievement. The concentration of disadvantage, however, may compound the impact of poorer parental education levels and socio-economic background. This is a point which will be examined in more detail later.
The broader question concerns the impact which the collective characteristics (real or imagined) of the group may have on how individuals are perceived and treated by social actors, institutions, educators, and employers, amongst others, a phenomenon known as statistical discrimination (Phelps, 1972). This is not discrimination in the sense of xenophobia or racism, but partakes of the human tendency to generalise, sometimes on the basis of limited or inaccurate information.
Controlling for the language spoken at home, of having a mother born outside an OECD country or attending a disadvantaged school had little impact on the flattened maternal education/score gradients. However a more detailed examination of these issues is beyond the scope of this chapter. They do illustrate a recurring theme, namely that immigrants constitute a group on which the effects of policies, institutions or socio-economic factors may not always be the same as for non-immigrants.
THE EFFECT OF CONCENTRATION ON IMMIGRANT STUDENT OUTCOMESIn all countries and in all periods, immigrants have tended to congregate in neighbourhoods with other immigrants, often of their own origin, when they move to a new country. This is a natural process that increases social capital and allows immigrants to maintain or build a network of friends and relatives from their origin country who can help recreate a familiar social environment but also be of assistance to them in finding a job, administrative procedures and tasks required in their new country of residence. This tendency may be reinforced by the availability of affordable housing if immigrant income levels are low, but may also be counterbalanced by government measures or incentives aimed at dispersing the immigrant population over the national territory. A number of OECD countries, for example, sought to disperse refugees throughout their territory, so as to avoid undue burden on large urban centres, but also under the assumption that excessive concentration would hamper integration efforts.
Studies of this phenomenon have shown that concentration by itself need not be negative, provided that there is access to social and public services of a quality comparable to what is found elsewhere and provided that ethnic agglomerations do not become permanent enclaves, with little possibility of outward mobility (Damm and Rosholm, 2010; Edin, et al., 2005).
With respect to educational services, the policy of neighbourhood schools has tended to ensure that the composition of schools tends to reflect that of the neighbourhoods in which they are located. In some school districts,13 there may be the possibility of attending an institution outside the neighbourhood, because of school voucher or open admission policies or because parents choose to place their children in private institutions. Lower- and upper-secondary level institutions generally draw on somewhat broader geographic areas, but perhaps not enough in order to ensure a better socio-economic mix.
To the extent that socio-economic origin is a determinant of school outcomes, early selection or tracking policies may also tend to place students of similar origins in the same institution, irrespective of their place of residence.
The question examined in this section is the extent to which the concentration of students of immigrant backgrounds in certain schools is associated with less favourable outcomes. There are, however, various ways of measuring concentration and it is not a priori obvious what measure of concentration is the appropriate one to use in this context. Is it the concentration of immigrant students per se that is associated with poor outcomes? Or rather the concentration of students with specific characteristics or in schools with particular characteristics?

94 © OECD 2012 UNTAPPED SKILLS: REALISING THE POTENTIAL OF IMMIGRANT STUDENTS
PARENTAL EDUCATION, IMMIGRANT CONCENTRATION AND PISA OUTCOMES5
The Coleman Report (Coleman, 1966) was among the first studies which examined the effect of school context, in particular socio-economic status and ethnic composition, on attainment. The negative correlation between immigrant concentration and attainment has been the object of a number of other more recent studies since then (Felouzis, 2003; Portes and Hao, 2004; Szulkin and Jonsson, 2007; Dronkers, 2010), which have confirmed the Coleman results. Although some studies have attempted to look at possible causes and mechanisms (Cebello-Boado and Medina, 2011), including composition effects, none have considered whether alternative measure of concentration might be more strongly associated with immigrant outcomes than immigrant concentration per se.
As indicated in the data section of this chapter three measures of concentration have been examined and the student sample for each country divided into quartiles on the basis of the three concentration measures. The first quartile is defined to have a low value on the measure and the fourth a high value. By way of recall, a listing of the three measures is repeated here:
• the percentage of children of immigrants in a school;
• the percentage of children of immigrants in a school speaking another language at home; and
• the percentage of students (whatever the origin) in a school who have mothers with less than upper secondary attainment.
The objective is to examine the extent to which concentration measured in these terms affects student outcomes in general and those of the children of immigrants in particular.
Table B5.4 and Figures 5.8a and 5.8b provide summary statistics for these measures and in particular, on the percentage of all children of immigrants who are in the high-concentration quartile, according to the measures listed above, and what share they are of all students in the quartiles. The individual country data are presented in the annex tables and the average over country groups in the figures.
Note, first of all, that if the distribution of the children of immigrants across quartiles were the same as that for non-immigrants, each quartile would contain 25% of both children of immigrants and children of non-immigrants, and the share of the children of immigrants in each quartile would be the same as their share of all students. As is evident from the table and figures, the observed situation is rather far from this statistical ideal.
Not surprisingly, the highest concentrations of children of immigrants occur for those measures which are themselves based on immigrant characteristics and which tend to “push” those schools with higher percentages of children of immigrants into the higher quartiles. For example, in most of the country groups in Figure 5.8a, some 50% to 70% of the children of immigrants are in the high-immigrant concentration quartile. And some 30% to 60% of immigrant children are in the quartile where there is the highest percentage of students speaking another language at home.
• Figure 5.8 • Children of immigrants in the high-concentration quartile, by various measures of concentration
Figure 5.8a. As a percentage of immigrants students
0
10
20
30
40
50
60
70
80
90
100
China g
roup
German
ic
Settle
ment
Form
er Yu
gosla
via
New m
igrati
on
Nordic
Mixe
d gro
up
Franc
o-Dutc
h
Form
er So
viet U
nion
Anglo-
America
n
% Immigrant concentration Foreign language concentration Concentration in disadvantaged schools

95UNTAPPED SKILLS: REALISING THE POTENTIAL OF IMMIGRANT STUDENTS © OECD 2012
PARENTAL EDUCATION, IMMIGRANT CONCENTRATION AND PISA OUTCOMES5
The same sort of automatic “push effect” is not in principle present when the quartiles are defined on the basis of an exogenous measure such as the student’s mother’s education. For this case, which does not explicitly include any reference to immigrant characteristics, the fourth quartile also contains significant shares of immigrant students, ranging from as less than 15% in Portugal, in the partner economy Dubai (UAE) and the partner country Jordan, to over 55% in the Netherlands, with most European countries and the United States being at the high end of the range and the settlement and new migration countries at the low end under 30%.
What connection is there between the three measures? First of all, there tends to be a high concordance between immigrant and foreign language concentrations in the country groups composed essentially of OECD countries and, with the exception of the settlement and new migration countries, a smaller difference between these measures and that based on school disadvantage. Likewise, the settlement and Nordic groups of countries have low shares of the children of immigrants in the bottom quartile, whatever the measure (Figure 5.8a), than do other OECD country groups, as does the China group. Finally the bottom disadvantage quartile tends to show a lower share of the children of immigrants than the bottom quartiles for the other two measures.
Note that only in some countries are children of immigrants overrepresented in the disadvantaged quartile, relative to their share of all students, in particular in the Nordic countries and the Germanic, Franco-Dutch and Anglo-American groups.
How close is the association between these various concentration measures and reading outcomes of the children of immigrants? Contrary to what one might have expected, it is generally the percentage of students from disadvantaged backgrounds (low educated mothers) in a school that is more highly (negatively) correlated with individual reading outcomes for the children of immigrants in almost all countries assessed (Figure 5.9). The percentage of children in a particular school who mostly speak a foreign language at home comes next in line, with the percentage of immigrants being the weakest covariate of the three. In many European countries, the association between immigrant outcomes and school disadvantage is especially high. The exceptions are the Nordic countries, Ireland, Estonia and Spain, although outcomes for children of immigrants in these countries are not always favourable compared to those of non-immigrant children.
In what follows the focus will be on the school disadvantage measure of concentration.
• Figure 5.8 • Children of immigrants in the high-concentration quartile, by various measures of concentration
(continued)
Figure 5.8b. As a percentage of all students in the quartile
0
10
20
30
40
50
60
70
80
90
100
New m
igrati
on
Mixe
d gro
up
Form
er Yu
gosla
via
Nordic
Form
er So
viet U
nion
Franc
e-Dutc
h
Anglo-
America
n
German
ic
Settle
ment
China g
roup
% Immigrant concentration Foreign language concentration Concentration in disadvantaged schools Percentage of immigrant students
Countries are ranked in ascending order of the immigrant concentration measure.
Source: Table B5.4.
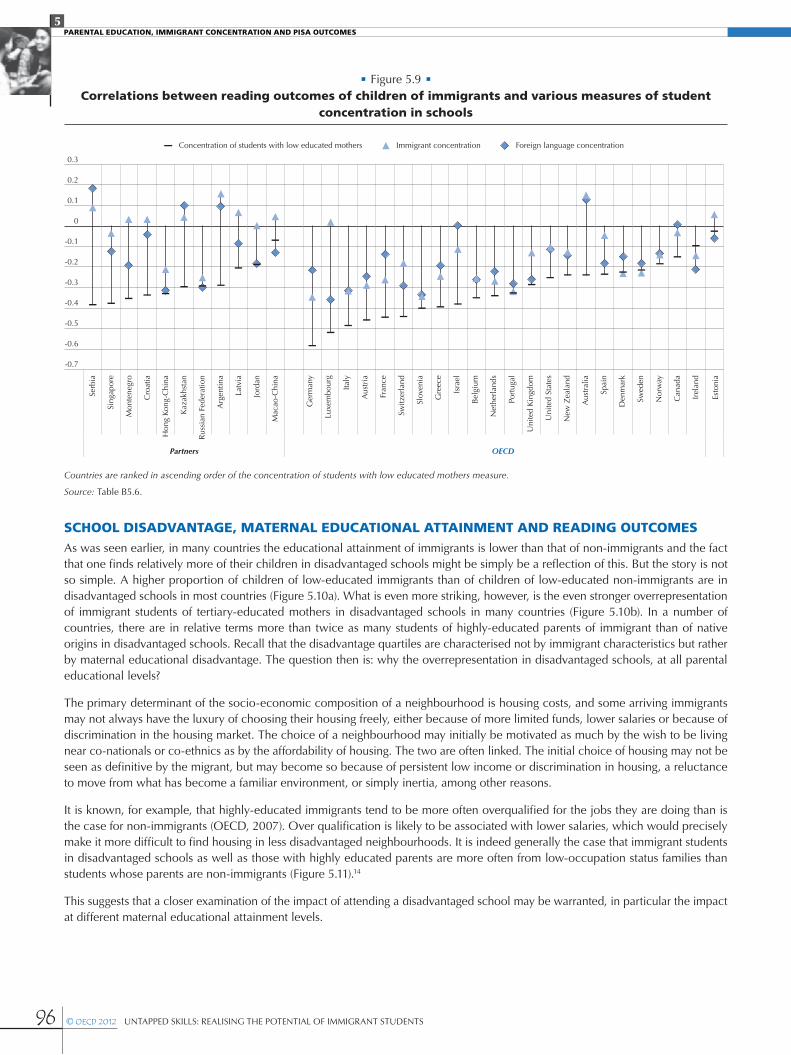
96 © OECD 2012 UNTAPPED SKILLS: REALISING THE POTENTIAL OF IMMIGRANT STUDENTS
PARENTAL EDUCATION, IMMIGRANT CONCENTRATION AND PISA OUTCOMES5
SCHOOL DISADVANTAGE, MATERNAL EDUCATIONAL ATTAINMENT AND READING OUTCOMESAs was seen earlier, in many countries the educational attainment of immigrants is lower than that of non-immigrants and the fact that one finds relatively more of their children in disadvantaged schools might be simply be a reflection of this. But the story is not so simple. A higher proportion of children of low-educated immigrants than of children of low-educated non-immigrants are in disadvantaged schools in most countries (Figure 5.10a). What is even more striking, however, is the even stronger overrepresentation of immigrant students of tertiary-educated mothers in disadvantaged schools in many countries (Figure 5.10b). In a number of countries, there are in relative terms more than twice as many students of highly-educated parents of immigrant than of native origins in disadvantaged schools. Recall that the disadvantage quartiles are characterised not by immigrant characteristics but rather by maternal educational disadvantage. The question then is: why the overrepresentation in disadvantaged schools, at all parental educational levels?
The primary determinant of the socio-economic composition of a neighbourhood is housing costs, and some arriving immigrants may not always have the luxury of choosing their housing freely, either because of more limited funds, lower salaries or because of discrimination in the housing market. The choice of a neighbourhood may initially be motivated as much by the wish to be living near co-nationals or co-ethnics as by the affordability of housing. The two are often linked. The initial choice of housing may not be seen as definitive by the migrant, but may become so because of persistent low income or discrimination in housing, a reluctance to move from what has become a familiar environment, or simply inertia, among other reasons.
It is known, for example, that highly-educated immigrants tend to be more often overqualified for the jobs they are doing than is the case for non-immigrants (OECD, 2007). Over qualification is likely to be associated with lower salaries, which would precisely make it more difficult to find housing in less disadvantaged neighbourhoods. It is indeed generally the case that immigrant students in disadvantaged schools as well as those with highly educated parents are more often from low-occupation status families than students whose parents are non-immigrants (Figure 5.11).14
This suggests that a closer examination of the impact of attending a disadvantaged school may be warranted, in particular the impact at different maternal educational attainment levels.
• Figure 5.9 • Correlations between reading outcomes of children of immigrants and various measures of student
concentration in schools
-0.7
-0.6
-0.5
-0.4
-0.3
-0.2
-0.1
0
0.1
0.2
0.3
Serb
ia
Sing
apor
e
Mon
tene
gro
Cro
atia
Hon
g Ko
ng-C
hina
Kaz
akhs
tan
Rus
sian
Fed
erat
ion
Arg
entin
a
Latv
ia
Jord
an
Mac
ao-C
hina
Ger
man
y
Luxe
mbo
urg
Italy
Aus
tria
Fran
ce
Switz
erla
nd
Slov
enia
Gre
ece
Isra
el
Bel
gium
Net
herl
ands
Port
ugal
Uni
ted
Kin
gdom
Uni
ted
Stat
es
New
Zea
land
Aus
tral
ia
Spai
n
Den
mar
k
Swed
en
Nor
way
Can
ada
Irel
and
Esto
nia
Partners OECD
Concentration of students with low educated mothers Immigrant concentration Foreign language concentration
Countries are ranked in ascending order of the concentration of students with low educated mothers measure.
Source: Table B5.6.

97UNTAPPED SKILLS: REALISING THE POTENTIAL OF IMMIGRANT STUDENTS © OECD 2012
PARENTAL EDUCATION, IMMIGRANT CONCENTRATION AND PISA OUTCOMES5
• Figure 5.10 • Students by mother’s education in disadvantaged schools
Figure 5.10a. As a percentage of all students with mothers having less than upper secondary education
0
10
20
30
40
50
60
70
80
90
Latv
iaM
onte
negr
oRu
ssia
n Fe
dera
tion
Kaz
akhs
tan
Arg
entin
a
Sing
apor
e
Cro
atia
Serb
iaH
ong
Kong
-Chi
na
Mac
ao-C
hina
Jord
an
OEC
D
Part
ners
Esto
nia
Uni
ted
Kin
gdom
Uni
ted
Stat
es
Bel
gium
Net
herl
ands
Slov
enia
Den
mar
k
Can
ada
Aus
tralia
Aus
tria
Fran
ce
Swed
en
Ger
man
y
Nor
way
Gre
ece
Switz
erla
nd
Luxe
mbo
urg
Isra
elN
ew Z
eala
nd
Italy
%Non-immigrant students Immigrant students
Figure 5.10b. As a percentage of all students with tertiary-educated mothers
Arg
entin
a
Latv
ia
Kaz
akhs
tan
Russ
ian
Fede
ratio
n
Serb
ia
Sing
apor
e
Cro
atia
Mac
ao-C
hina
Mon
tene
gro
Hon
g Ko
ng-C
hina
Jord
an
OEC
D
Part
ners
Uni
ted
Kin
gdom
Net
herl
ands
Aus
tria
Swed
en
Fran
ce
Den
mar
k
Ger
man
y
Bel
gium
Gre
ece
Slov
enia
Irel
and
Uni
ted
Stat
es
Switz
erla
nd
Can
ada
Aus
tralia
Italy
Nor
way
New
Zea
land
0
10
20
30
40
50
60
70
80
90%
Non-immigrant students Immigrant students
Countries are ranked in descending order of the percentage of immigrant students.
Source: Table B5.7.

98 © OECD 2012 UNTAPPED SKILLS: REALISING THE POTENTIAL OF IMMIGRANT STUDENTS
PARENTAL EDUCATION, IMMIGRANT CONCENTRATION AND PISA OUTCOMES5
• Figure 5.11 • Students in disadvantaged schools from low occupation status families
Figure 5.11a. Students from low occupation status families
0
10
20
30
40
50
60
70
80
Anglo-
America
n
Form
er So
viet U
nion
Franc
o-Dutc
h
German
ic
Mixe
d gro
up
New m
igrati
on
Nordic
Settle
ment
As a percentage of all immigrant/non-immigrant students in disadvantaged schools
Non-immigrant studentsImmigrant students
Figure 5.11b. Students with tertiary-educated mothers from low occupation status families
0
10
20
30
40
50
60
70
80
Anglo-
America
n
Form
er So
viet U
nion
Franc
o-Dutc
h
German
ic
Mixe
d gro
up
New m
igrati
on
Nordic
Settle
ment
As a percentage of all immigrant/non-immigrant students in disadvantaged schools
Non-immigrant studentsImmigrant students
Note: Low status occupations are those with an ISEI (International Socio-Economic Index of Occupational Status) index value lower than 40.
Source: Table B5.8.

99UNTAPPED SKILLS: REALISING THE POTENTIAL OF IMMIGRANT STUDENTS © OECD 2012
PARENTAL EDUCATION, IMMIGRANT CONCENTRATION AND PISA OUTCOMES5
Two questions will be addressed by the analysis which follows:
1. What is the association between school disadvantage and reading outcomes overall and by educational attainment of the mother? Can the fact that a mother is highly educated compensate for attendance of their children at disadvantaged schools?
2. Is there an immigrant-specific effect of school disadvantage on outcomes?
For these analyses, individual national samples in PISA are not always equal to the task of examining reading outcomes by both the mother’s attainment and the school disadvantage quartile together. This necessitates examining results by the country groupings described earlier, although even here, some cells have had to be suppressed because of insufficient samples.
Figure 5.12 contrasts reading-score differences between students who live in advantaged versus disadvantaged school quartiles and students with high- versus low-educated mothers. The comparison pertains to all students, not only students of immigrant background, to give a general picture of how well national educational systems address educational disadvantage in general. For many countries, the picture is not always a positive one.
Indeed, for many, whether they are OECD member countries or not, the “penalty” associated with attending a disadvantaged school is much larger than the difference in reading scores between students with high- versus low-educated mothers. The school disadvantage effect is often substantially stronger than the family background effect. In some countries, among them Italy, France, Germany, Slovenia, Luxembourg and Israel, the school disadvantage effect is almost twice as strong. There are very large differences in scores between schools where there are many students of low-educated parents and those where there are very few. In the Nordic countries, the settlement countries (except for the United States, Estonia, the United Kingdom and Ireland) it is generally the reverse situation, that is, the effect of parental educational attainment is more important.
Note that this is not a pattern that is unique to children of immigrants or to certain countries. It appears to hold for both children of non-immigrants as well as children of immigrants, for all country groupings and at all educational levels (Figure 5.13). Note the magnitude of the disadvantage effect (top quartile score minus bottom quartile score) across country groups, for example about 70 points for students of tertiary-educated mothers in the settlement-country group and about 120 points in the Franco-Dutch and Germanic groups (Table B5.9).
• Figure 5.12 •Difference in scores between students in the top or bottom school disadvantage quartiles and those
with mothers who have high or low education, all students
0
20
40
60
80
100
120
140
160
Mac
ao-C
hina
Latv
ia
Russ
ian
Fede
ratio
n
Jord
an
Kaz
akhs
tan
Hon
g Ko
ng-C
hina
Serb
ia
Cro
atia
Sing
apor
e
Mon
tene
gro
Arg
entin
a
Esto
nia
Nor
way
Can
ada
Den
mar
k
Swed
en
New
Zea
land
Aus
tral
ia
Irel
and
Uni
ted
Kin
gdom
Spai
n
Uni
ted
Stat
es
Aus
tria
Port
ugal
Net
herl
ands
Gre
ece
Bel
gium
Switz
erla
nd
Italy
Slov
enia
Luxe
mbo
urg
Ger
man
y
Fran
ce
Isra
elPartners OECD
Score point differenceTop minus bottom quartile High minus low education
Countries are ranked in as ascending order of the difference between top and bottom quartile.
Source: Table B5.9.

100 © OECD 2012 UNTAPPED SKILLS: REALISING THE POTENTIAL OF IMMIGRANT STUDENTS
PARENTAL EDUCATION, IMMIGRANT CONCENTRATION AND PISA OUTCOMES5
• Figure 5.13 • Reading outcomes of students in advantaged and disadvantaged schools, by educational attainment
of mother and immigration status
350
375
400
425
450
475
500
525
550
575
600
At bestprimary
Lowersecondary
Uppersecondary
Tertiary At bestprimary
Lowersecondary
Uppersecondary
Tertiary
Top quartile Bottom quartile
Score
350
375
400
425
450
475
500
525
550
575
600
At bestprimary
Lowersecondary
Uppersecondary
Tertiary At bestprimary
Lowersecondary
Uppersecondary
Tertiary
Top quartile Bottom quartile
Score Anglo-American China group
Non-immigrant studentsFirst-generation students Second-generation students
350
375
400
425
450
475
500
525
550
575
600
At bestprimary
Lowersecondary
Uppersecondary
Tertiary At bestprimary
Lowersecondary
Uppersecondary
Tertiary
Top quartile Bottom quartile
Score
350
375
400
425
450
475
500
525
550
575
600
At bestprimary
Lowersecondary
Uppersecondary
Tertiary At bestprimary
Lowersecondary
Uppersecondary
Tertiary
Top quartile Bottom quartile
Score Former Yugoslavia Former Soviet Union
350
375
400
425
450
475
500
525
550
575
600
At bestprimary
Lowersecondary
Uppersecondary
Tertiary At bestprimary
Lowersecondary
Uppersecondary
Tertiary
Top quartile Bottom quartile
Score
350
375
400
425
450
475
500
525
550
575
600
At bestprimary
Lowersecondary
Uppersecondary
Tertiary At bestprimary
Lowersecondary
Uppersecondary
Tertiary
Top quartile Bottom quartile
Score Franco-Dutch Germanic
350
375
400
425
450
475
500
525
550
575
600
At bestprimary
Lowersecondary
Uppersecondary
Tertiary At bestprimary
Lowersecondary
Uppersecondary
Tertiary
Top quartile Bottom quartile
Score
350
375
400
425
450
475
500
525
550
575
600
At bestprimary
Lowersecondary
Uppersecondary
Tertiary At bestprimary
Lowersecondary
Uppersecondary
Tertiary
Top quartile Bottom quartile
Score Mixed group New migration
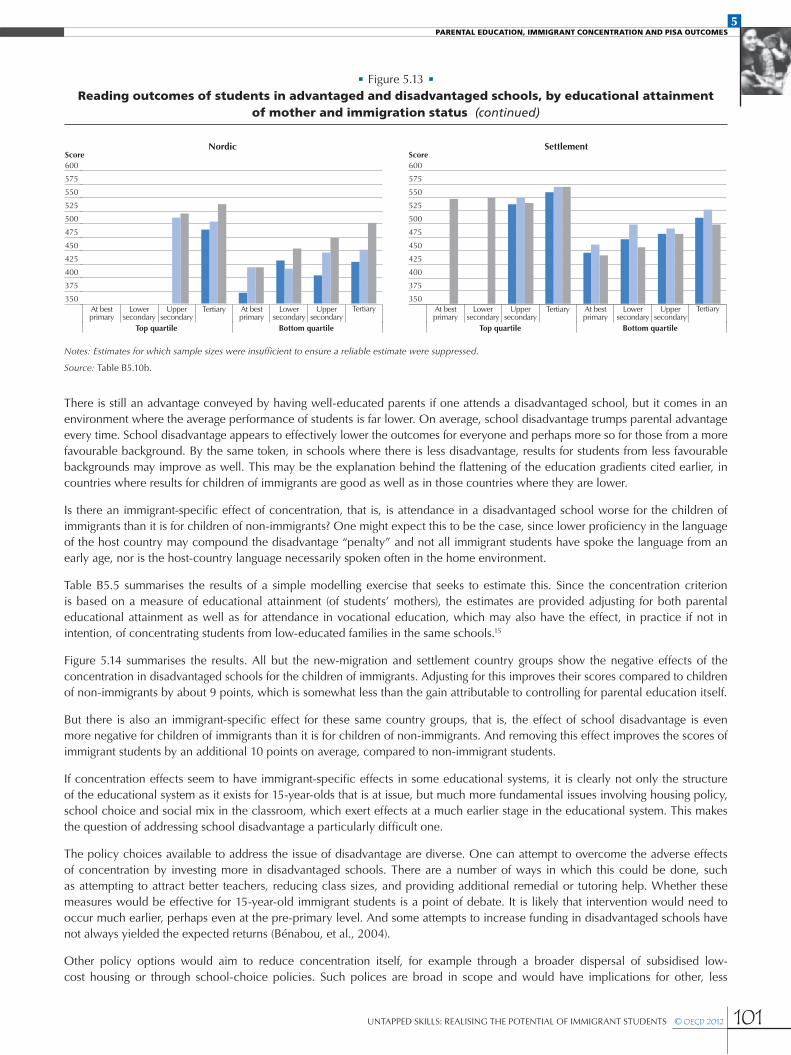
101UNTAPPED SKILLS: REALISING THE POTENTIAL OF IMMIGRANT STUDENTS © OECD 2012
PARENTAL EDUCATION, IMMIGRANT CONCENTRATION AND PISA OUTCOMES5
There is still an advantage conveyed by having well-educated parents if one attends a disadvantaged school, but it comes in an environment where the average performance of students is far lower. On average, school disadvantage trumps parental advantage every time. School disadvantage appears to effectively lower the outcomes for everyone and perhaps more so for those from a more favourable background. By the same token, in schools where there is less disadvantage, results for students from less favourable backgrounds may improve as well. This may be the explanation behind the flattening of the education gradients cited earlier, in countries where results for children of immigrants are good as well as in those countries where they are lower.
Is there an immigrant-specific effect of concentration, that is, is attendance in a disadvantaged school worse for the children of immigrants than it is for children of non-immigrants? One might expect this to be the case, since lower proficiency in the language of the host country may compound the disadvantage “penalty” and not all immigrant students have spoke the language from an early age, nor is the host-country language necessarily spoken often in the home environment.
Table B5.5 summarises the results of a simple modelling exercise that seeks to estimate this. Since the concentration criterion is based on a measure of educational attainment (of students’ mothers), the estimates are provided adjusting for both parental educational attainment as well as for attendance in vocational education, which may also have the effect, in practice if not in intention, of concentrating students from low-educated families in the same schools.15
Figure 5.14 summarises the results. All but the new-migration and settlement country groups show the negative effects of the concentration in disadvantaged schools for the children of immigrants. Adjusting for this improves their scores compared to children of non-immigrants by about 9 points, which is somewhat less than the gain attributable to controlling for parental education itself.
But there is also an immigrant-specific effect for these same country groups, that is, the effect of school disadvantage is even more negative for children of immigrants than it is for children of non-immigrants. And removing this effect improves the scores of immigrant students by an additional 10 points on average, compared to non-immigrant students.
If concentration effects seem to have immigrant-specific effects in some educational systems, it is clearly not only the structure of the educational system as it exists for 15-year-olds that is at issue, but much more fundamental issues involving housing policy, school choice and social mix in the classroom, which exert effects at a much earlier stage in the educational system. This makes the question of addressing school disadvantage a particularly difficult one.
The policy choices available to address the issue of disadvantage are diverse. One can attempt to overcome the adverse effects of concentration by investing more in disadvantaged schools. There are a number of ways in which this could be done, such as attempting to attract better teachers, reducing class sizes, and providing additional remedial or tutoring help. Whether these measures would be effective for 15-year-old immigrant students is a point of debate. It is likely that intervention would need to occur much earlier, perhaps even at the pre-primary level. And some attempts to increase funding in disadvantaged schools have not always yielded the expected returns (Bénabou, et al., 2004).
Other policy options would aim to reduce concentration itself, for example through a broader dispersal of subsidised low-cost housing or through school-choice policies. Such polices are broad in scope and would have implications for other, less
• Figure 5.13 • Reading outcomes of students in advantaged and disadvantaged schools, by educational attainment
of mother and immigration status (continued)
350
375
400
425
450
475
500
525
550
575
600
At bestprimary
Lowersecondary
Uppersecondary
Tertiary At bestprimary
Lowersecondary
Uppersecondary
Tertiary
Top quartile Bottom quartile
Score
350
375
400
425
450
475
500
525
550
575
600
At bestprimary
Lowersecondary
Uppersecondary
Tertiary At bestprimary
Lowersecondary
Uppersecondary
Tertiary
Top quartile Bottom quartile
Score Nordic Settlement
Notes: Estimates for which sample sizes were insufficient to ensure a reliable estimate were suppressed.
Source: Table B5.10b.
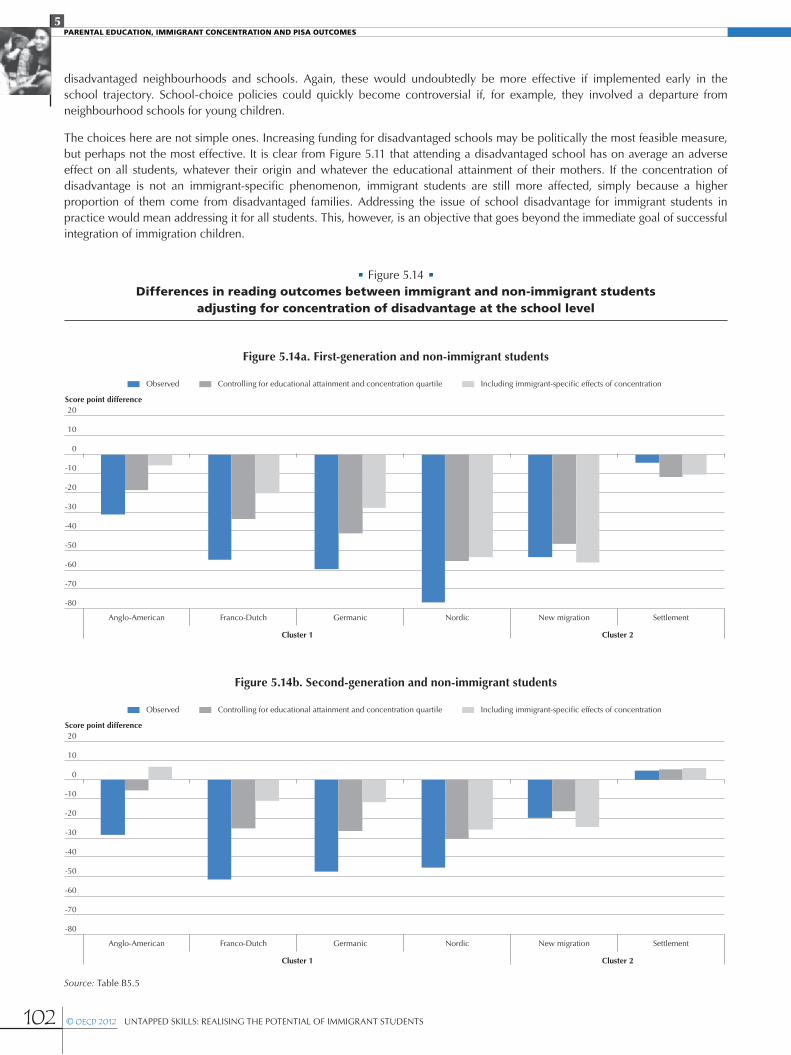
102 © OECD 2012 UNTAPPED SKILLS: REALISING THE POTENTIAL OF IMMIGRANT STUDENTS
PARENTAL EDUCATION, IMMIGRANT CONCENTRATION AND PISA OUTCOMES5
disadvantaged neighbourhoods and schools. Again, these would undoubtedly be more effective if implemented early in the school trajectory. School-choice policies could quickly become controversial if, for example, they involved a departure from neighbourhood schools for young children.
The choices here are not simple ones. Increasing funding for disadvantaged schools may be politically the most feasible measure, but perhaps not the most effective. It is clear from Figure 5.11 that attending a disadvantaged school has on average an adverse effect on all students, whatever their origin and whatever the educational attainment of their mothers. If the concentration of disadvantage is not an immigrant-specific phenomenon, immigrant students are still more affected, simply because a higher proportion of them come from disadvantaged families. Addressing the issue of school disadvantage for immigrant students in practice would mean addressing it for all students. This, however, is an objective that goes beyond the immediate goal of successful integration of immigration children.
• Figure 5.14 • Differences in reading outcomes between immigrant and non-immigrant students
adjusting for concentration of disadvantage at the school level
Figure 5.14a. First-generation and non-immigrant students
-80
-70
-60
-50
-40
-30
-20
-10
0
10
20
Anglo-American Franco-Dutch Germanic Nordic New migration Settlement
Cluster 1 Cluster 2
Score point difference
Observed Controlling for educational attainment and concentration quartile Including immigrant-specific effects of concentration
Figure 5.14b. Second-generation and non-immigrant students
-80
-70
-60
-50
-40
-30
-20
-10
0
10
20
Anglo-American Franco-Dutch Germanic Nordic New migration Settlement
Cluster 1 Cluster 2
Score point difference
Observed Controlling for educational attainment and concentration quartile Including immigrant-specific effects of concentration
Source: Table B5.5

103UNTAPPED SKILLS: REALISING THE POTENTIAL OF IMMIGRANT STUDENTS © OECD 2012
PARENTAL EDUCATION, IMMIGRANT CONCENTRATION AND PISA OUTCOMES5
SUMMARY AND CONCLUSIONSCountries where children of immigrants show less-favourable outcomes tend to have immigrant populations that are poorly educated and tend to show a higher-than-average concentration of these children in disadvantaged schools. This is true regardless of the parents’ educational attainment, and seems unlikely to be a consequence of parental choice. It may reflect the fact that parents of students in disadvantaged schools, including those with a tertiary education, tend to have low occupational status, and the lower income this implies may limit their housing and schooling choices.
School disadvantage has a substantial negative effect on reading outcomes, regardless of the parents’ level of education; in some countries immigrant children’s unfavourable outcomes are as strongly related to the proportion of immigrant children in schools as to low parental attainment levels. This is observed even when attendance in vocational programmes has been accounted for. These results raise much broader questions concerning the mechanisms and processes that tend to concentrate disadvantage in geographically distinct areas. These exist in all societies and are generally income-related, but they appear to have a particularly penalising effect on immigrants in some countries.
One notable observation based on the analyses described in this chapter is that immigrant-specific effects are everywhere. The immigrant condition is characterised precisely by differences compared to the native-born population. The objective of policy is to ensure that over time, these differences are reduced and that social and economic outcomes of immigrants are similar to those observed for the non-immigrant population. Children of immigrants, however, are not necessarily immigrants themselves, and even those born abroad may have arrived at an early age. Still, the immigrant experience clearly has an effect on them, even when they have been fully educated in the host country. The outcomes observed at age 15 would thus appear to reflect the influence of the home and school environments from an early age. If interventions are to address disadvantage effectively, they need to redress early imbalances.
The focus on the convergence of (or inequality in) outcomes for immigrants and their children is important, but so is attention to the processes that “generate” those outcomes. Mainstream structures and institutions do not always seem to have quite the same impact on children of immigrants as they do on children of non-immigrants. Examining the specific impact of policies, socio-economic factors and institutions on immigrants and their children is one avenue of approach that merits a closer look.
Notes
1. Past migration tends to have a significant influence on the composition of future migration, because knowledge of opportunities and of possible impediments is transmitted back to origin countries, which tends to facilitate migration from the same sources. Past migration to the United States has generally been skill-biased, which has undoubtedly contributed to maintaining this, despite the fact that it has been largely family based, rather than skill selected. Much current irregular migration to the United States, on the other hand, tends to be of lower educated migrants, which has resulted in an immigrant population of lower attainment than in the past.
2. Labour force survey estimates suggest lower percentages of immigrants with low levels of education, but the latter had on average more children than those with higher levels.
3. The term “immigrant children” will be used throughout this chapter to mean “children of immigrants”; it may thus include students whose parents were born abroad but who were themselves born in the country. Likewise the term “native” will be used to designate the children of native-born parents.
4. The usual definition of first- and second-generation here is being used, that is, persons born abroad/in the country, respectively, of two immigrant parents.
5. The cut-off rule applied is that an estimate must be based on at least thirty observations from at least five schools in order to be published.
6. If the mother’s education was missing or there was no mother in the household, the father’s attainment was used.
7. The Cluster procedure in SAS®, using average linkages.
8. Four “outlier” countries were excluded from the exercise, whose immigrant populations are unusual in a number of respects. They are Brazil and Mexico where the immigrant populations are very small and where children of immigrants have very poor PISA results compared to children of the native-born, and Dubai (UAE) and Qatar, where the situation is at the other extreme, with very large immigrant populations (close to or greater than 50% of the total population) and reading outcomes for children of immigrants that are far superior to those of children of the native-born.
9. The attainment differences are measured in terms of the percentage of students with mothers who have at least upper secondary education.
10. Only countries for which the sample size for the immigrant subgroup was at least one hundred were retained for these tables.

104 © OECD 2012 UNTAPPED SKILLS: REALISING THE POTENTIAL OF IMMIGRANT STUDENTS
PARENTAL EDUCATION, IMMIGRANT CONCENTRATION AND PISA OUTCOMES5
11. See note to Figure 5.1.
12. By gradient here, we mean, roughly speaking, the general slope of the maternal education / reading assessment curve.
13. The term district here is used in a very broad sense, recognising that educational policies may be determined at the national, regional or even municipal level.
14. In this context, low occupation status is defined as an HISEI less than 40, which roughly corresponds to service workers (other major groups included are agricultural workers, production and related workers, transport equipment operators and labourers). Occupational data for both the student’s father and student’s mother were obtained by asking open-ended questions. The response were coded to four-digit ISCO codes (ILO, 1990) and then mapped to the international socio-economic index of occupational status (ISEI) (Ganzeboom, et al., 1992). Three indices were obtained from these scores: father’s occupational status (BFMJ); mother’s occupational status (BMMJ); and the highest occupational status of parents (HISEI) which corresponds to the higher ISEI score of either parent or to the only available parent’s ISEI score. For all three indices, higher ISEI scores indicate higher levels of occupational status. For more info, see: http://arno.uvt.nl/show.cgi?fid=63721.
15. Vocational schools are defined by means of the ISCEDO variable, as ISCEDO=2 or 3. PISA 2009 collected data on study programmes available to 15-year-old students in each country. This information was obtained through the student tracking form and the student questionnaire. In the final database, all national programmes will be included in a separate variable (PROGN) where the first three digits are the ISO code for a country, the next two digits are the sub-national category, and the last two digits are the nationally specific programme code. All study programmes were classified using the International Standard Classification of Education (ISCED). The following indices are derived from the data on study programmes: programme level (ISCDL) indicating whether students are on the lower or upper secondary level (ISCED 2 or ISCED 3); programme designation (ISCEDD) indicating the designation of the study programme (A = general programmes designed to give access to the next programme level, B = programmes designed to give access to vocational studies at the next programme level, C = programmes designed to give direct access to the labour market, M = modular programmes that combine any or all of these characteristics; and programme orientation (ISCEDO) indicating whether the programme’s curricular content is general, pre-vocational or vocational.
References
Bénabou, R., F. Kramarz and C. Prost (2004), “Zones d’éducation prioritaire: quels moyens pour quels résultats?”, Économie et Statistique, No. 380, INSEE, Paris.
Cebello-Boado, H. and L. Garrido Medina (2011), “The Impact of Immigrant Concentration in Spanish Schools: School, Class, and Composition Effects”, European Sociological Review, Vol. 27, No. 5, pp. 606–623.
Coleman, J.S. (1966), Equality of Educational Opportunity, US Department of Health, Education and Welfare, Office of Education, Washington, DC.
Damm, A. and M. Rosholm (2010), “Employment Effects of Spatial Dispersal of Refugees,” Review of Economics of the Household, Vol. 8, No. 1, Springer, pp 105-146, March.
Dronkers, J. (2010), “Positive but also Negative Effects of Ethnic Diversity in Schools on Educational Performance? An Empirical Test Using Crossnational PISA Data”, unpublished.
Edin, P., P. Fredriksson and O. Åslund (2004), “Settlement Policies and the Economic Success of Immigrants,” Journal of Population Economics, Vol. 17, No. 1, Springer, pp. 133-155, February.
Felouzis, G. (2003), ‘’La ségrégation ethnique au collège et ses conséquences’’, Revue Française de Sociologie, Vol. 44, pp. 413-447.
Ganzeboom, H.B.G., P.M. De Graaf and D.J. Treiman (1992), “A Standard International Socio-economic Index of Occupational Status”, Social Science Research, Vol. 21, No. 1, pp. 1-56.
Hanushek, E. and L. Woessmann (2008), “The Role of Cognitive Skills in Economic Development”, Journal of Economic Literature, Vol. 46, No. 3, pp. 607-668, September.
ILO (International Labour Organization) (1990), “International Standard Classification of Occupations”, ISCO-88, Geneva.
OECD (2007), “Matching Educational Background and Employment: A Challenge for Immigrants in OECD Countries”, International Migration Outlook, OECD Publishing.
Phelps, E.S. (1972), “The Statistical Theory of Racism and Sexism”, American Economic Review, Vol. 62, pp. 659–661.
Portes, A. and L. Hao (2004), “The Schooling of Children of Immigrants: Contextual Effects on the Educational Attainment of the Second Generation”, Proceedings of the National Academy of Sciences, No. 101, pp.11920-11927, August.
Szulkin, R. and J.O. Jonsson (2007), “Ethnic Segregation and Educational Outcomes in Swedish comprehensive Schools”, SULCIS Working Paper No. 2007, No. 2, Stockholm University.
105UNTAPPED SKILLS: REALISING THE POTENTIAL OF IMMIGRANT STUDENTS © OECD 2012
Is the performance gap between 15-year-old immigrant and non-immigrant students reflected in later outcomes, such as educational attainment? This chapter uses data from Switzerland’s and Canada’s longitudinal follow-ups to PISA to evaluate the extent to which differences in performance in PISA are associated with enrolment in tertiary education by age 24. These two cases highlight the differences and similarities in educational outcomes between two different educational systems and immigration regimes and the factors associated with these outcomes.
Post-Secondary Attendance of Immigrants in Switzerland and Canada
6
106 © OECD 2012 UNTAPPED SKILLS: REALISING THE POTENTIAL OF IMMIGRANT STUDENTS
POST-SECONDARY ATTENDANCE OF IMMIGRANTS IN SWITZERLAND AND CANADA6
INTRODUCTIONIn most countries, immigrant students face a considerable skills and knowledge disadvantage at age 15. A more disadvantaged socio-economic background is only part of the reason for the performance gap between immigrant students and non-immigrant students. In most cases, immigrant students underperform even when compared to those non-immigrant students who share a similarly disadvantaged socio-economic background.
Beyond skills and knowledge at age 15, how persistent is the disadvantage of immigrant students in their educational pathways? Is the future educational and professional career of the children of immigrant related to their performance in PISA? Does the skill and knowledge disadvantage at age 15 translate into a disadvantage in later educational outcomes? In particular, are immigrant students less likely to access a post-secondary educational institution?
There is considerable research on the relationship between immigration status and educational attainment. In particular, in North America, immigrant students on average achieve higher levels of education than their counterparts with domestic backgrounds (Picot and Hou, 2010), while in Europe the opposite is typically observed (Heath, et al., 2008). Few studies have addressed the role of the student’s secondary school performance in explaining the difference in educational attainment between immigrant and non-immigrant students. That dimension is the focus of this chapter.
More specifically, the chapter focuses on the association between a performance in PISA and access to tertiary education for immigrant students. The objective ideally is to identify education or migration policies that contribute to the successful integration of immigrant students in host societies. Can immigration or education policy address skill disadvantage at age 15 among children of immigrants? Are there important differences between educational systems that help immigrant students overcome initial disadvantage to achieve high levels of educational attainment?
The chapter first compares and contrasts the factors associated with students’ access to tertiary education in Canada and Switzerland. These two countries have very different immigration and education systems. In addition, these two countries were selected for this study because they are two of the few countries that possess the longitudinal data necessary for such a study. The Canadian Youth in Transition (YITS) was launched in 2000 along with PISA 2000 and has asked a follow-up survey every two years since 2000. This study thus far includes data up to participants’ 23rd year, cycle 5 of YITS. The Swiss Transition from Education to Employment (TREE) survey followed up PISA 2000 students every year. This study also contains data until students’ 23rd year, the seventh round of TREE. Box 6.1 provides more details on these datasets.
A focus on low secondary school performers is this chapter’s second unique feature. In addition to conducting the analysis for all students, the educational attainment of students who do relatively poorly on PISA tests in secondary school is examined closely. Box 6.2 provides details on how lowest performers are defined. Are these students necessarily relegated to poor educational attainment outcomes? Or do significant numbers of these students continue to the post-secondary level, and if so, what distinguishes those who continue from those who do not? Does immigration status play a major role? This chapter addresses these questions.
Box 6.1 Longitudinal surveys in Canada and Switzerland: The YITS and TREE data
The analyses for both Canada and Switzerland utilise longitudinal surveys that tracked secondary school students from age 15 in December 1999 to age 23 in December 2007. Both surveys start with the national student sample of 15-year-olds 1 from the PISA 2000 round of assessment. PISA 2000 assessed reading, mathematical and scientific literacy among 15-year-olds, with a primary focus on reading literacy, the measure used in this analysis. PISA 2000 also collected information on social, cultural, economic and educational factors believed to be associated with student performance.
Based on this 15-year-old student sample from PISA 2000, both Canada and Switzerland implemented a longitudinal survey designed to examine the major transitions in young peoples’ lives as they move through the educational system into the labour force. The Swiss TREE (Transition from Education to Employment) survey started with an original sample in the first wave of 5 532 15-year-olds. By the 7th wave, 3 900 23-year-olds remained in the sample, for a response rate of 62%.2 Data from both the first-and 7th wave are used in this paper, and the sample is restricted to those students still in the sample in the 7th wave.
The Canadian YITS (Youth in Transition Survey) started in wave 1 with 29 687 respondents, and by wave 5 at age 23, 14 751 remained, for a response rate of 50%. In both surveys, the data were reweighted to reduce the sample bias introduced by non-response, and to compensate as much as possible for sample attrition.3
More details can be found in the research paper on which this chapter is based (Picot and Hou, 2012).
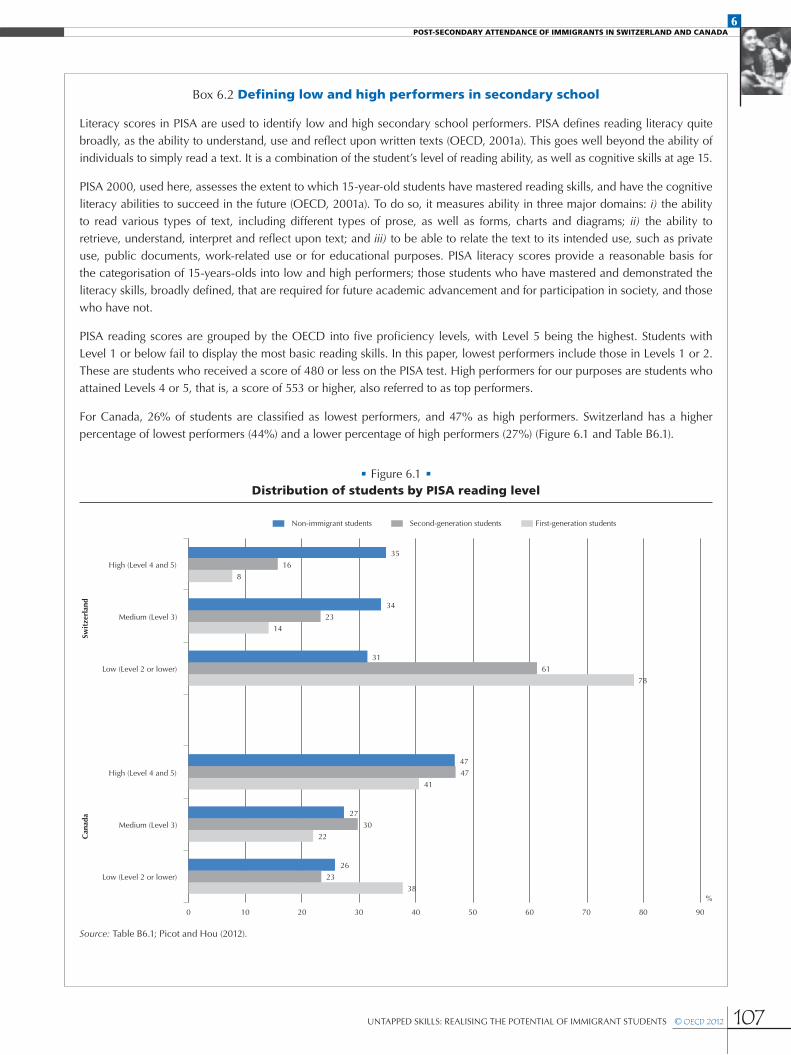
107UNTAPPED SKILLS: REALISING THE POTENTIAL OF IMMIGRANT STUDENTS © OECD 2012
POST-SECONDARY ATTENDANCE OF IMMIGRANTS IN SWITZERLAND AND CANADA6
Box 6.2 Defining low and high performers in secondary school
Literacy scores in PISA are used to identify low and high secondary school performers. PISA defines reading literacy quite broadly, as the ability to understand, use and reflect upon written texts (OECD, 2001a). This goes well beyond the ability of individuals to simply read a text. It is a combination of the student’s level of reading ability, as well as cognitive skills at age 15.
PISA 2000, used here, assesses the extent to which 15-year-old students have mastered reading skills, and have the cognitive literacy abilities to succeed in the future (OECD, 2001a). To do so, it measures ability in three major domains: i) the ability to read various types of text, including different types of prose, as well as forms, charts and diagrams; ii) the ability to retrieve, understand, interpret and reflect upon text; and iii) to be able to relate the text to its intended use, such as private use, public documents, work-related use or for educational purposes. PISA literacy scores provide a reasonable basis for the categorisation of 15-years-olds into low and high performers; those students who have mastered and demonstrated the literacy skills, broadly defined, that are required for future academic advancement and for participation in society, and those who have not.
PISA reading scores are grouped by the OECD into five proficiency levels, with Level 5 being the highest. Students with Level 1 or below fail to display the most basic reading skills. In this paper, lowest performers include those in Levels 1 or 2. These are students who received a score of 480 or less on the PISA test. High performers for our purposes are students who attained Levels 4 or 5, that is, a score of 553 or higher, also referred to as top performers.
For Canada, 26% of students are classified as lowest performers, and 47% as high performers. Switzerland has a higher percentage of lowest performers (44%) and a lower percentage of high performers (27%) (Figure 6.1 and Table B6.1).
• Figure 6.1 • Distribution of students by PISA reading level
Swit
zerl
and
38
22
41
78
14
8
23
30
47
61
23
16
26
27
47
31
34
35
0 10 20 30 40 50 60 70 80 90
Low (Level 2 or lower)
Medium (Level 3)
High (Level 4 and 5)
Low (Level 2 or lower)
Medium (Level 3)
High (Level 4 and 5)
Can
ada
%
Non-immigrant students Second-generation students First-generation students
Source: Table B6.1; Picot and Hou (2012).

108 © OECD 2012 UNTAPPED SKILLS: REALISING THE POTENTIAL OF IMMIGRANT STUDENTS
POST-SECONDARY ATTENDANCE OF IMMIGRANTS IN SWITZERLAND AND CANADA6
SKILLS AND KNOWLEDGE AT AGE 15 AND TERTIARY ATTENDANCE
Outcomes for the entire student population and for low performersStudents’ academic and cognitive performance at the end of compulsory schooling is positively correlated with access to tertiary. PISA reading literacy tests, administered at age 15, provide one means of assessing the association between secondary school performance and the enrolment in tertiary education.
In Canada, a recent OECD study found that students who obtained the highest PISA scores (Level 5) were 20 times 4 more likely to attend a university degree than those registering Level 1 PISA scores (the lowest), and twice as likely to attend college 5 (Pathways to Success, OECD, 2010a). In Switzerland, researchers found that almost one-half of students age 15 who scored the highest (Levels 4 and 5) of the PISA reading literacy test continued to the tertiary level six years later, as compared to only 8% of those scoring at reading Level 2 (Meyer and Bertschy, 2011).
Few studies focus specifically on the tertiary educational outcomes of lowest performers.6 Recent research on Australian longitudinal data showed that motivation was a key determinant of student’s later educational and labour market outcomes among lowest performers at age 15. The socio-economic background of the student was also important, as was having some form of educational goal or plan (Thompson and Hillman, 2010). Similar studies in Switzerland concluded that a surprisingly large number of low secondary school achievers (those with PISA reading literacy Level 2 or below) complete upper secondary with a VET (vocational) diploma. However, they did not examine the tertiary participation of low secondary school achievers (Stalder, et al., 2011).
An analysis of drop-out-rates using the Canadian YITS showed that parental aspirations are major determinants of the tendency to drop out of school after age 15, above and beyond any effect of the PISA score at age 15, family background and other variables (Foley, et al., 2010). This was particularly true for lowest performers at age 15 (i.e. those with low PISA reading scores). In fact, they conclude that after accounting for PISA reading scores and parental valuation of education, parental educational attainment has no direct effect on the student’s probability of dropping out after age 15. Similar results are evident for Switzerland, except that the outcome variable is the likelihood of making the transition to a particular upper secondary school stream, typically a vocational or academic stream. However, after controlling for PISA score, parental background has been shown to have little effect on the outcomes of low and high ability students (Falter, 2009).
Outcomes for immigrant students and for lowest performersRegarding the educational attainment gap between immigrant students and those with Canadian-born parents, the early Canadian research suggested that the most important determinant was parents’ education, as well as age and residential location (Boyd 2002; Hum and Simpson, 2007; Bonikowska, 2008). However, parental education may be a proxy for other effects, such as the aspirations of the parents regarding the child’s educational outcomes, the child’s high school performance, educational resources made available to the child, and the valuation of education by the parents or the student. But even after accounting for many determinants, earlier research found that perhaps one half of the positive gap in educational attainment between the children of immigrant and domestically-born parents persisted. Ethnic group differences also matter in the likelihood of attending the tertiary level (Abada, Hou, and Ram, 2009).
More recent Canadian research uses the YITS to address issues related to attendance at the tertiary level among immigrant and non-immigrant students (Childs, et al., 2010). They find that parental aspirations regarding university attendance are higher among immigrant students, and in particular among immigrant families from source regions such as China, India, other Asian countries and Africa. Regarding low-achievers, they observe that students from immigrant families who have low PISA scores are more likely to attend tertiary level than their low-scoring counterparts from domestic families.
Recent European research has also shown that there are significant educational attainment gaps between immigrant students and those from non-immigrant families. Heath, et al. (2008) find that second-generation students whose parents came from less economically developed origins tend to have much lower educational attainment (before controlling for social background) than students from non-immigrant groups. However, just as in Canada and the United States, second-generation minorities of Indian and Chinese background often outperform children of non-immigrant families educationally (unconditionally). They find that among second-generation groups of European ancestry, most of the negative gap in educational attainment between immigrant and non-immigrant students can be accounted for by socio-economic background. They also point out that educational aspirations are often much higher among immigrant than domestic-born families.
In Switzerland, in particular, recent research showed that after controlling for socio-economic background variables, PISA literacy scores at age 15 and the student’s secondary school stream, immigration background has no effect on the likelihood of attending tertiary level education (Meyer and Bertschy, 2011). However, as they point out, this does not mean that immigration background is not important. Its effect may work through other variables, notably the type of secondary school stream in which immigrant students find themselves, as compared to those with Swiss backgrounds.

109UNTAPPED SKILLS: REALISING THE POTENTIAL OF IMMIGRANT STUDENTS © OECD 2012
POST-SECONDARY ATTENDANCE OF IMMIGRANTS IN SWITZERLAND AND CANADA6
DIFFERENCES IN IMMIGRATION AND EDUCATIONAL SYSTEMS OF CANADA AND SWITZERLANDTo understand differences across countries in the role of student immigrant background on participation at the tertiary educational level, and the outcomes of low performers, an overview of the basic elements of the educational and immigration systems of the two countries may be helpful.
Differences in immigration systemsIn part as a result of differences in the immigration systems, the socio-economic characteristics of immigrant-background students are very different in Canada and Switzerland. This not surprisingly has an impact on differences in tertiary attendance between immigrant and non-immigrant students. These background differences are accounted for in the statistical models, which assess to what extent socio-economic background accounts for the gap in educational attainment between immigrant and non-immigrant students.
Canada, like Australia and New Zealand, has an immigration system that focuses on highly educated/skilled immigrants. Immigrants have, on average, educational attainment levels above that of the Canadian-born. This process has a positive influence on both the social and economic integration of immigrants, as well as the quite successful educational outcomes of the immigrant students (see Picot and Hou, 2010 for a review).
In contrast, Switzerland, like many European nations, has had an immigration system which in the past was more oriented towards the migration of lower-skilled workers.7 This approach also has implications for the educational outcomes of the immigrants and their children.
Differences in education systemsThe Canadian and Swiss education systems are also structurally very different. The most important difference is found on how schooling is organised and in particular in policies that group or select students across differentiated programmes.
The Swiss system is highly selective. Students are streamed at a very early age, starting at the sixth or seventh grade, into roughly three streams: an upper school track with more intellectually demanding courses, an intermediate track, and a basic track.8 Only 3% of students from the “basic” track ultimately enter tertiary level education by age 23, compared to 30% of those in the upper level track (Meyer and Bertschy, 2011). Following compulsory school, students move into upper-secondary, which is also heavily segmented. General education is provided in the Gymnasium stream, which typically leads to university.
In Switzerland students with a migrant background are over-represented in the lower level tracks, which affects their tertiary educational opportunities (Meyer, 2009).9 Furthermore, 24% of students with Swiss parents were in streams that prepared for university entrance, compared to 19% of second-generation students, and 12% of first-generation (Meunier, 2010).
Vocational programmes play an important role in the Swiss educational system. After completing secondary education most students in Switzerland (between 40% and 70% depending upon the region) enter a three- to four-year vocational training (VET) programme, usually through a dual apprenticeship where training is done both at a school and with a firm. The VET programmes ensure that students have a reasonable chance to obtain a qualified job, which may reduce the tendency to continue to the tertiary level. While typical of many European educational systems, such labour-market-oriented programmes in secondary school are not available in Canada, where labour market-oriented education or training is provides after secondary completion.
At the tertiary level in Switzerland, the level beyond upper secondary, there are two major streams (in the international classification: “Tertiary A”, and “Tertiary B”).10 The most advanced, Tertiary A, includes longer university programmes leading to a bachelor’s, master’s or higher degree. Tertiary B includes mostly higher level vocational education programmes in specialised areas. At age 23, roughly 25% of the original 15-year-old PISA cohort are in Tertiary A, 5% in Tertiary B (OPET, 2011).11
The Canadian educational system has a simpler structure. There is little or no streaming during elementary and secondary schooling in most provinces, and there is significant freedom in course selection. As a result of this course selection by students, some are eligible to apply to more types of post-secondary options, such as university or college, than others. A very small percentage of students enter secondary vocational schools. Most job-oriented vocational education is conducted in the post-secondary college system. In contrast, in Switzerland students need not attend the post-secondary system to obtain such training. This obviously affects the level of tertiary participation in the two countries. In the province of Quebec, upper secondary school consists of three years, following eight years of primary and lower secondary followed by two or three years in colleges (CEGEPS), before entrance into university programmes.
At the post-secondary (tertiary) level, most provinces have both community colleges and universities (Quebec has the CEGEP system plus universities). Universities are degree granting institutions at the bachelors, master and doctoral (PhD level. Community colleges include both advanced vocational programmes designed for labour market entry, as well as, in some provinces, an academic stream that can lead to university attendance at a level above standard entry level.

110 © OECD 2012 UNTAPPED SKILLS: REALISING THE POTENTIAL OF IMMIGRANT STUDENTS
POST-SECONDARY ATTENDANCE OF IMMIGRANTS IN SWITZERLAND AND CANADA6
Differences in average performance in PISA 2000PISA literacy scores are, in general, higher in Canada than in Switzerland. This was true in PISA 2000 and PISA 2009, both of which concentrated on reading, rather than math or science (OECD, 2001a; 2010b). In PISA 2000, the beginning of both longitudinal follow-ups analysed in this chapter, the mean literacy performance score in Canada was 534 score points and 494 score points in Switzerland. The average for all OECD countries was 500 score points (the standard deviation across the OECD was set to 100 score points). In PISA 2009, the scores were 524 for Canada and 501 for Switzerland, with an OECD average of 494.
In Switzerland, the reading ability as measured by PISA scores was much lower among immigrant students. Non-immigrant students (the 3rd-and-higher generation) registered a score of 514, second-generation students performed at 460 score points, and first-generation students at 412 score points (OECD, 2001a). For many of these foreign-born students the language of assessment would have been a second language, and some may not have had many years experience in the school system of their host country. Even among students born in Switzerland but with immigrant parents (second-generation students), the language spoken at home may be different from the language of assessment.
In Canada, Canadian-born students with Canadian-born parents and those with immigrant parents have approximately the same average PISA score, at 538. Given their higher educational hopes/aspirations and higher parental educational attainment, one might have expected the second generation in Canada to register higher PISA scores than their 3rd-and-higher generation counterparts. This was not the case. First-generation students, who are immigrants themselves, have slightly lower scores, at 511 (OECD, 2001a). All of these groups have scores above the OECD average score of 500, however.
EDUCATIONAL ATTENDANCE BY IMMIGRANT BACKGROUND: THE LIKELIHOOD OF ATTENDING TERTIARY LEVELThis section presents the results of an analysis of differences across immigrant background in attendance to a post-secondary education. Box 6.3 describes in detail the analysis. The analysis is conducted in three steps: i) an initial analysis of simple differences describes observed differences; ii) then the analysis compares only those individuals sharing similar performance levels and individual characteristics; iii) the last step adds country specific variables measuring the individual and family attitudes towards higher levels of educational attainment.
Box 6.3 Definitions and statistical methods
Linear probability models (i.e. ordinary least squares models) are used in the statistical analysis section of the paper.12 The dependent (outcome) variable is the probability of attending a post-secondary (tertiary) institution by age 23. The sample for both countries includes all students in the PISA 2000 sample (at age 15) who were still in the sample at age 23.
Three models are run on two populations, students who are low performers in secondary school, and all students. To save space, the regression coefficients are not reported in this chapter, but can be found in Picot and Hou (2012) along with more detail on the methods used.13
Model 1: Immigrant background model
Immigrant background is the only independent variable in model 1.
Immigrant background has four levels:
• Immigrant (foreign born) students who immigrated prior to the age of 15, referred to as a first-generation students.
• Students born domestically with two immigrant (foreign born) parents, referred to as a second-generation students.
• Students with parents who are domestically born (the third-plus generation), referred to as non-immigrant students.
The category non-immigrant students is selected as the reference group. Hence, the coefficients on the immigrant background variable give the difference in the raw data in the probability of attending a post-secondary institution between students in a given immigrant group (say second-generation) and non-immigrant students.

111UNTAPPED SKILLS: REALISING THE POTENTIAL OF IMMIGRANT STUDENTS © OECD 2012
POST-SECONDARY ATTENDANCE OF IMMIGRANTS IN SWITZERLAND AND CANADA6
Model 2: Student performance, immigrant and socio-economic background
Model 2 utilises the independent variables that are common to both data sets. They include, in addition to the immigrant background variable, gender, parents’ highest level of education, family type, number of siblings, language spoken at home, the size of the city of residence, and the PISA reading score.
The coefficient on the immigrant background variable in model 2 reflects the difference in the probability of attending a post-secondary institution after having controlled for the additional independent variable in the model.
Hence the difference in the immigrant background coefficient between model 1 (raw data) and model 2 indicates how much of the post-secondary attendance gap of interest (say between the second and third and higher generations) is “explained” or accounted for by the independent variables included in model 2.
Furthermore, a decomposition is carried out which indicates how much each of the independent variables contributed to this “explained” gap. This is important, since it is of interest to know which variables are important in accounting for the gap.
More detail on the decomposition can be found in Picot and Hou (2012).
Model 3: Attitudes of students and parents towards post-secondary education
Model 3 includes all the independent variables in model 2, plus variables unique to each country. For Switzerland, this means the student’s secondary school stream and the language of the canton of residence. For Canada, the additional variables include whether the parent hopes that the child will get at least one university degree, whether the student hopes to get at least one degree, whether the family has made some financial preparation for post-secondary education, and whether the student expects to have a job that requires a university degree.
The “explained” gap in this case indicates that portion of the original gap (in the raw data) that can be accounted for by the extended list of independent variables included in the model. The same decomposition technique is applied to the results from this model to determine the contribution of each variable to the “explained” gap.
Box 6.3 Definitions and statistical methods (continued)
• Figure 6.2 • Prevalence of university attendance by age 23, by immigrant background
6.2a. Unadjusted (raw data) 6.2b. Adjusted for differences in PISA score,
family background and other variables ¹
0
10
20
30
40
50
60
70
80
First generation Second generation Non-immigrants Total First generation Second generation Non-immigrants
65
70
52 56
17
26
35 31
58
63
52
36 35 35
Canada Switzerland
1. The important other variables include, in Canada, students’ and parents’ aspirations regarding university, and in Switzerland, the student’s secondary school stream.
Source: Picot and Hou (2012).

112 © OECD 2012 UNTAPPED SKILLS: REALISING THE POTENTIAL OF IMMIGRANT STUDENTS
POST-SECONDARY ATTENDANCE OF IMMIGRANTS IN SWITZERLAND AND CANADA6
CanadaIn Canada, first-generation students are 12 percentage points more likely to attend a post-secondary institution than non-immigrant students. For the second-generation, the advantage over non-immigrant students is around 18 percentage points (Figure 6.2). These are small relative differences because in Canada more than 50% of non-immigrant students access a post-secondary education by age 23.
Among first-generation students, adjusting for differences in background variables accounts for about 40% to 50% of this gap (Figure 6.3a). A number of variables account for this “explained” portion of the gap, including differences in the students’ and parents’ aspirations (accounting for almost one-half of the explained gap), as well as differences in parents’ education, geographical location, and homework time, each accounting for about one-fifth of the explained gap (Figure 6.3a). Taking into account the PISA scores tended to reduce the likelihood of the first-generation attending post-secondary, but this effect was more than offset by the other positive effects.
Among the second-generation students, about one-half of the gap can be accounted for by the independent variables related to socio-economic background, performance and attitudes towards tertiary education (Figure 6.3a).
Of this “explained” gap, parents’ and students’ aspirations accounted for about one-third, geographical location and homework time each about 15%. There were no differences in PISA scores between the second-generation and non-immigrant students, so this variable is not important in this case. Differences in parental education also were not seen to be important in the explanation.
• Figure 6.3 • Factors associated with the gap in university attendance across immigrant backgrounds
Second generation First generation
Observedgap
Explainedgap
PISAscore
Citysize
Other Observedgap
Explainedgap
OtherParents’/students’
aspirations
Parents’/students’
aspirations
Parentaleducation
Homeworktime
-10
-5
0
5
10
15
20
-10
-5
0
5
10
15
20
Contributions to the explained gap Contributions to the explained gap
Differencein probability
Differencein probability
6.3a. Canada
Second generation First generation
Observedgap
Explainedgap
PISAscore
Schoolstream
Citysize
Citysize
Parentaleducation
Other Observedgap
Explainedgap
PISAscore
Other
Contributions to the explained gap
Contributions to the explained gap
Differencein probability
6.3b. Switzerland
Differencein probability
-20
-15
-10
-5
0
5
-20
-15
-10
-5
0
5
Source: Picot and Hou (2012).
113UNTAPPED SKILLS: REALISING THE POTENTIAL OF IMMIGRANT STUDENTS © OECD 2012
POST-SECONDARY ATTENDANCE OF IMMIGRANTS IN SWITZERLAND AND CANADA6
SwitzerlandFor Switzerland, first-generation students were 18 percentage points less likely to attend the tertiary level by age 23 than their peers without an immigrant background. Second-generation students were 9 percentage points less likely to attend a post-secondary educational institution (Figure 6.2).
In both cases, the entire gap could be accounted for by performance, individual background characteristics and attitudes towards higher education (Figure 6.3b). In fact, the differences in the PISA score between the immigrant and non-immigrant students accounted for the entire observed performance gap (model 2). After considering other variables (model 3), including secondary school stream, the explanatory power of performance in PISA is weakened. However, since a student’s secondary school stream is in part a reflection of academic performance, both the PISA and the “stream” variables are reflecting academic performance to some extent. Parents’ education and geographical location account for some of the gap, the former in a negative and the latter in a positive sense, but their effects are very small compared to the PISA variable.
DIFFERENCES IN OUTCOMES BY SOURCE COUNTRY BACKGROUNDEarlier research clearly shows that the educational attainment of first- and second-generation varies by ethnic group/source country of the parents. Source country, likely serving as a proxy for a host of variables that it may be difficult to disentangle, is one of the important determinants of the educational attainment of the immigrant students (Picot and Hou, 2010; Heath, 2008).
Source country may reflect differences in the value placed on education by the parents, the expectations of the parents regarding educational attainment, the support available from the ethnic group as a whole (“ethnic capital”), the educational attainment and occupational status of the parents, which varies by ethnic groups, the quality of the school systems to which students are exposed, home language effects, and other cultural differences influencing life-style choices.
In both Canada and Switzerland, origin country plays a role but there is evidence of important similarities across very different regions. The results suggest there is an immigrant effect but that this depends on whether the country of origin is similar or not to the host country. For example, Chinese students in Canada are more likely to go to university than non-immigrant students, but so are students from Africa or from eastern Europe. In Switzerland, the results for immigrant students with a German-Austrian-French-Belgium background are more similar to non-immigrant students than students with immigrant backgrounds from other source countries.
Country of origin profiles in Canada and SwitzerlandIn Switzerland, a little over one-quarter of the immigrant-background students assessed in PISA 2000 were from, or had parents who were from, developed European economies (Table B6.2). About 40% were born in, or had parents who were born in, the less developed economies of the former Yugoslavia, Albania, Kosovo or Turkey. The remaining roughly one-third had Spanish or Portuguese backgrounds, or were from other countries.
The background of immigrant-background students was very different in Canada (Table B6.2). About 44% were of Asian origin, notably China and India. About 18% had backgrounds associated with the generally high attainment economies of the United States, the United Kingdom or northern and western Europe. The remaining one-third were born in, or had parents who were born in, Central or South America, elsewhere in Europe, or Africa.
To assess differences in outcomes by source region of the parents (or students if they are immigrants), the same analysis exercise (see Box 6.3) is replicated here by source country.14 Given the smaller number of individuals in each of the origin country groups, it is necessary to combine the first-and second-generation populations into one category, referred to as immigrant students. The host country (Switzerland or Canada) is always the reference group in the “source region” variable. Hence, the results refer to the differences in the likelihood of attending the higher education between the immigrant-background students whose source region is, say, Turkey, and students whose parents were born in Switzerland (non- immigrant students). The same approach is used with the Canadian sample.
CanadaIn Canada, students with Chinese backgrounds are 28 percentage points more likely to attend the post-secondary level than those with parents born in Canada. That means that 80% of Chinese background students attend some form of post-secondary institution, the vast majority attending a university. Accounting for background characteristics and aspirations regarding attendance, as well as residential location (model 3), accounts for 45% of this positive gap in the Chinese case (Table B6.3). But there remains an unexplained component even with this relatively rich set of control variables.
Students with many other source region backgrounds also display a significant advantage over the Canadian-background students regarding university and post-secondary participation. The advantage is particularly marked for students with backgrounds from all

114 © OECD 2012 UNTAPPED SKILLS: REALISING THE POTENTIAL OF IMMIGRANT STUDENTS
POST-SECONDARY ATTENDANCE OF IMMIGRANTS IN SWITZERLAND AND CANADA6
other Asian regions, Africa, and “other European” nations. Students with backgrounds from other developed economies such as the United States, the United Kingdom, and northern and western Europe do not look much different from Canadian-background students regarding post-secondary participation. However, immigrant students from all source-regions used in this typology have participation rates equal to or higher than students with strictly Canadian backgrounds. No source region group is seen to lag behind (in model 2).
The proportion of the positive gap with Canadian-background students that can be accounted for by differences in family background, PISA scores, aspirations and other variables (model 3) varies tremendously by source region, from one-quarter to over three-quarters (Table B6.3). However, in many cases the post-secondary attendance advantage cannot be entirely explained, even by the rich set of variables available in the most comprehensive analysis (model 3).
SwitzerlandIn Switzerland, immigrant-background students with German-Austrian-French-Belgium backgrounds are more likely than non-immigrant students (the 3rd and higher generation) to attend higher education, while those with all other backgrounds are less likely to attend (Table B6.3). The differences are substantial, ranging from 21 percentage points more likely to attend (German etc. backgrounds) to 21 percentage points less likely to attend. Students with families from Yugoslavia-Albania-Kosovo, Spain-Portugal and Turkey are in particular much less likely to attend the tertiary level than their non-immigrant counterparts.
For most regions, the differences in performance, individual characteristics and attitudes, notably PISA score, can account for most of the gap in attendance in higher education between immigrant and non-immigrant students from a particular region (Table B6.3). The German-Austrian-French-Belgium case is an exception. Relatively little of the advantage that students with backgrounds from these countries have relative to non-immigrant students in Switzerland in both attendance to university and other higher education is accounted for either by family background, PISA scores or school stream. Other unmeasured variables are playing a significant role in this case.
ACCESS TO HIGHER EDUCATION AMONG LOW PERFORMERSThis section focuses on lowest performers, as measured by the PISA reading score.
Observed differences: A simple model without adjustments for individual characteristics (model 1)More than 33% of low performers participated at the post-secondary level in Canada, compared to 11% in Switzerland (Figure 6.4). However, as noted earlier, participation in higher education in Switzerland is low for a number of structural reasons. Enrolment in Tertiary B, mainly vocational post-secondary schools in Switzerland, often occurs at a later age; perhaps as few as one-half of the students who will ultimately attend Tertiary B schools are enrolled by age 23. Furthermore, the capacity of the Tertiary B system in Switzerland is relatively small compared to the college system in Canada. Finally, many low-performing students may opt for vocational training (VET) in upper secondary, rather than continuing to the tertiary level. This route can result in positive labour market outcomes, and is a choice not readily available in Canada.
Being a low secondary school performer in Switzerland has a very large effect on the likelihood of tertiary attendance, more so than in Canada, particularly among immigrant students. And this is significant, since over three quarters of Swiss immigrant students are in fact low secondary school performers as measured by the PISA test 15 (Table B6.1). As noted, differences in the structure of the school systems likely account for part of this difference.
Overall, high secondary school performers (in PISA reading Level 4 or 5) are twice as likely to attend the post-secondary level as their low-performing counterparts in Canada (this result does not account for other factors), but in Switzerland they are over five times more likely to attend. This difference is exacerbated among the immigrant population. In Canada, among the first- and second-generation, high performers are 1.6 times more likely to attend than among low performers. In Switzerland, high performers are 12 times (among the first-generation) and 6 times (second-generation) more likely to attend.
Adjusted differences: Taking into account individual characteristics (models 2 and 3)
Canada
In Canada, immigrant students seem to find some way of attending the post-secondary level in spite of their low PISA reading scores. Low secondary school performers with immigrant backgrounds are much more likely to continue to the post-secondary level than non-immigrant students who are also lowest performers (Figure 6.5a). About one-half of low secondary school performers in the first-and second-generation continue to the post-secondary level, compared to only one-third of low-performing non-immigrant students (third plus generation).

115UNTAPPED SKILLS: REALISING THE POTENTIAL OF IMMIGRANT STUDENTS © OECD 2012
POST-SECONDARY ATTENDANCE OF IMMIGRANTS IN SWITZERLAND AND CANADA6
Of the 17 or 18 percentage point gap in attendance in higher education across immigrant background, 40% to 50% is accounted for by performance and/or individual characteristics (Figure 6.5a). Hence, even after controlling for numerous variables related to background, PISA reading literacy scores and aspirations, low-performing immigrant students remain 9 to 12 percentage points more likely to continue to the post-secondary level than non-immigrant students.
Once again differences in parents’ and students’ aspirations regarding post-secondary attendance accounted for the majority, or roughly 40% to 60%, of the explained gap. Other variables of significance included differences in geographical location, accounting for about one-third of the “explained” gap, and differences in homework time (one-fifth). But more than half of the difference in post-secondary attendance between the generations remains unexplained by the variables we have at our disposal. Differences between generations in PISA reading scores and parental education accounted for little of the post-secondary attendance gaps.
Switzerland
In Switzerland, the tertiary attendance rate of first-generation low-performers is less than one-half that of non-immigrant students, and among the second-generation is it two-thirds of the rate (Figure 6.3). Hence, the very large numbers of immigrant students who find themselves in the low-performing category have relatively low tertiary attendance rates compared to their counterparts with strictly Swiss backgrounds.
Among lowest performers, the variables included in the more comprehensive analyses do not account for the gap (Figure 6.5b). For the first-generation, both models account for virtually none of the 9 percentage-point gap in tertiary attendance between immigrant and non-immigrant students. Among second-generation students, there is no apparent gap in the likelihood of tertiary attendance with non-immigrant students.16
Differences by source region among low performers
Canada
Among low-performing students, educational outcomes vary tremendously by source region in Canada, less so in Switzerland. In Canada, low-performing students with Chinese background are 34 points more likely to attend the post-secondary level than their counterparts with Canadian-born parents (Table B6.3). Fully two-thirds (66%) of these students attended a college or university (about one-half attend a university). Registering a low-performance in secondary school appears to do little to discourage students with such a background from continuing. Only about one-quarter of this large advantage in post-secondary attendance by students with Chinese backgrounds can be accounted for by differences with the Canadian-background students in family background, PISA score, aspirations and the other variables included in model 3. Conditional on having similar backgrounds, having a Chinese background continues to result in a 24 percentage point advantage in post-secondary attendance compared to lowest performers among non-immigrant students (the 3rd-and-higher generation) (Table B6.3).
• Figure 6.4 • Prevalence of higher education attendance by age 23 among lowest performers at age 15,
by immigrant background
6.4a. Unadjusted (raw data) 6.4b. Adjusted for differences in PISA score,
family background and other variables ¹
49 50
32 36
6
11 15
11
41 42
32
5 6
15
0
10
20
30
40
50
60
0
10
20
30
40
50
60
First generation Second generation Non-immigrants Total First generation Second generation Non-immigrants
Canada Switzerland
1. The important other variables include, in Canada, students’ and parents’ aspirations regarding university, and in Switzerland, the student’s secondary school stream.
Source: Picot and Hou (2012).

116 © OECD 2012 UNTAPPED SKILLS: REALISING THE POTENTIAL OF IMMIGRANT STUDENTS
POST-SECONDARY ATTENDANCE OF IMMIGRANTS IN SWITZERLAND AND CANADA6
Virtually identical results are evident for students with other Asian backgrounds (other than Indian), and like the Chinese background students, these significant advantages are not explained by the background variables included in the models. Other unmeasured factors are at play. Low-performing students with European backgrounds also display a substantial advantage over their counterparts with strictly Canadian backgrounds regarding post-secondary attendance. Little of this advantage can be explained by these models as well.
Switzerland
In Switzerland, there is, in most cases, little difference to explain. Among secondary school low-performers, the unconditional differences (in the raw data) between immigrant-background students and Swiss-background students are much smaller and typically not statistically significant. Only among students with an Italian background is there a statistically significant difference in the likelihood of attending the tertiary level (Table B6.3) In this case, virtually none of this 12 percentage point gap is accounted for by the explanatory variables analysed here (model 3). Overall, there is less to explain in the case of secondary school low-performers in Switzerland.
WHAT DIFFERENTIATES LOW-PERFORMERS WHO ATTEND POST-SECONDARY EDUCATION FROM THOSE WHO DO NOT?Many other variables besides immigrant background differentiates low-performers who attend the post-secondary level from those who do not. To address this issue, the analysis compares the magnitude of the effect of various explanatory variables on the likelihood of attending a post-secondary institution (regression results reported in Picot and Hou, 2012).
For Canada, among the low-performing secondary school students, in addition to immigrant status, parents’ and students’ aspirations regarding post-secondary attendance, whether the family made financial preparations for post-secondary attendance
• Figure 6.5 • Prevalence of university attendance by age 23 among lowest performers at age 15,
by immigrant background
Second generation First generation
Observedgap
Explainedgap
Citysize
Citysize
Other Observedgap
Explainedgap
OtherParents/students
aspirations
Parents/students
aspirations
Familyfinanciallyprepared
Homeworktime
-10
-5
0
5
10
15
20
-10
-5
0
5
10
15
20
Contributions to the explained gap Contributions to the explained gap
Differencein probability
Differencein probability
6.5a. Canada
Second generation First generation
Observedgap
Explainedgap
PISAscore
Homelanguage
Citysize
Parentaleducation
Other Observedgap
Explainedgap
PISAscore
Schoolstream
Other
Contributions to the explained gap
Contributions to the explained gap
Differencein probability
6.5b. Switzerland
Differencein probability
-10
-5
0
5
-10
-5
0
5
Source: Picot and Hou (2012).

117UNTAPPED SKILLS: REALISING THE POTENTIAL OF IMMIGRANT STUDENTS © OECD 2012
POST-SECONDARY ATTENDANCE OF IMMIGRANTS IN SWITZERLAND AND CANADA6
(likely a motivational effect), family status, PISA reading literacy level, and parental educational attainment differentiate low-performing students who attend the post-secondary level from those who do not.17
In Switzerland, the results are similar (particularly in model 2). There is no variable related to the aspirations of parents or students, but parental education, family status, and PISA score are all seen to play a role in differentiating those low-performers who continue from those who do not. When secondary school stream and language canton variable are added (in model 3), not surprisingly secondary school stream in particular is seen to play a significant role. Low-performing students living in the Italian language cantons are also more likely to continue to the tertiary level than their counterparts in other cantons, all else being equal.
The results from the two countries suggest that the traditional variables such as parental education and family type play a role in the likelihood of low performers continuing, even after controls for PISA reading scores and other background variables. But the Canadian results also suggest that variables related to motivation, such as parental and student aspirations, and the degree of financial preparedness, play even a greater role in distinguishing those who continue from those who do not.
SUMMARY AND CONCLUSIONSConsistent with earlier research, this chapter presents evidence that first- and second-generation immigrant students in Canada are more likely to continue to the post-secondary level than their non-immigrant counterparts. Immigrant students in Switzerland are less likely to do so.
In Switzerland, the post-secondary attendance gap in favour of non-immigrant students is due almost entirely to poorer secondary school performance among immigrant students, as measured by the PISA reading scores. After controlling for PISA scores, differences in family background and other variables become less important. When secondary school stream is included, it is strongly associated with a significant part of the gap as well. However, academic performance works in part through this variable, since school stream is determined by academic performance, as well as other variables such as social background.
The story is very different in Canada. Differences in PISA scores account for only a small part of the gap in favour of immigrants in post-secondary education. Parents’ and students’ aspirations regarding the student’s post-secondary school career play a major role in the “explained” gap.
In both countries, there is significant variation in these results by source region. In Canada, Asian students, even if they perform poorly in secondary school, participate at high levels in the post-secondary system, particularly university. Even when parents’ and students’ aspirations are included, the models explain little of this advantage.
Being a low-performing secondary school student, that is, having a PISA reading score at Level 1 or 2 at age 15, results in a greater reduction in the likelihood of post-secondary participation in Switzerland than Canada, particularly among immigrant-background students. There are a number of reasons for this, many related to the differences in the structure of the educational systems between the two countries. In Canada, a surprisingly high share of low-performers with immigrant backgrounds continue to the post-secondary level, around 50%, compared to one-third of those with strictly Canadian backgrounds. This figure reaches 66% among students with Asian backgrounds. Again there is significant variation by source region background. Even with a rich set of PISA, family background and aspirational variables, the analysis can account for only about one-third to one-half of the post-secondary participation gap between low-performing immigrant and non-immigrant students with and without immigrant backgrounds. Differences in the student’s and parent’s aspirations regarding post-secondary attendance again play an important role. But other unmeasured factors are also at play. In Switzerland, first-generation low-performing students are less likely to continue than their non-immigrant counterparts without an immigrant background. Little of this gap can be accounted for by family background, the PISA score and other available variables.
But many other variables besides immigrant background influence the decision of poor-performing students to continue to the post-secondary level. The Canadian data suggest that these are related to motivation, such as parents’ and student’s aspirations, financial capacity, family type, PISA reading score, and parents’ educational attainment. In Switzerland, parents’ education, family type, PISA score, and the student’s secondary school track influence the decision.
Why do immigrant students have better relative educational attainment outcomes in Canada than in Switzerland? Differences in the immigration systems play a significant role. The educational attainment of immigrants exceeds that of the domestically born population by quite a wide margin. Furthermore, much of Canada’s immigration over the past thirty years has been from Asian countries, whose cultures place a high value on educational attainment and labour-market success. By including variables influenced by the immigrant selection system, including parental education, source region and home language, only about one-half of the post-secondary attendance advantage of immigrant-background students over others can be accounted for. So there are clearly many other factors at work.

118 © OECD 2012 UNTAPPED SKILLS: REALISING THE POTENTIAL OF IMMIGRANT STUDENTS
POST-SECONDARY ATTENDANCE OF IMMIGRANTS IN SWITZERLAND AND CANADA6
Meanwhile, until recently, Switzerland has not had an immigration system oriented towards highly skilled candidates and has generally received lower skilled immigrants from less developed nations. Other research has shown that differences in individual and family background between students with immigrant backgrounds and others could account for between one-half to all of the differences in PISA reading scores between these groups. And this difference in PISA scores accounts for virtually all of the difference in tertiary participation rates between these two groups.
The inter-country difference in immigration systems, resulting in immigrants with very different backgrounds, plays a role in explaining the differences between countries. However, because of changes in the Swiss system during the early 1990s, and more recently with the 2002/03 treaty on the free movement of labour in the European Union, migration patterns are shifting. Many more highly skilled immigrants are entering Switzerland from nations such as Germany and France, and a smaller share of immigrants are lower-skilled from the Balkans, Turkey or Portugal. This shift could significantly influence the educational attainment of immigrant-background students in the future.
Differences in the educational systems, and their effect on immigrant students of immigrant background may also play a role. The more structured Swiss system allows for less adjustment on the students’ part, and research has shown that social background is a factor in the streaming that takes place in secondary school, above and beyond academic performance. This could negatively affect the tertiary educational attendance of immigrant students of immigrant background. And the structure of the Canadian labour market is such that continuation to the post-secondary level is necessary to acquire skills of value in the job market, including vocational skills. This is not the case in Switzerland, with vocational (VET) programmes in upper secondary school.
The results also point to possible policy implications. In Switzerland, after controlling for secondary school performance, parental background variables play little direct role in explaining the negative attendance gap between immigrant and non-immigrant students. Given the earlier research referred to, it seems likely that parental education, for example, acts indirectly through variables such as high school performance and parental aspirations. This distinction is important. It is difficult at best to address the disadvantaged parental backgrounds of current students in immigrant families, but there may be ways of improving their high school performance. And immigration patterns have recently shown an increase in the educational attainment of entering immigrants, and could increasingly do so in the future. Without adequate data, it is difficult to know what role family hopes/aspirations play in the Swiss case. However, assuming that the Canadian results may apply to Switzerland, policies designed to influence the value that immigrant families place on higher education, and hence their aspirations regarding tertiary level attendance for their children, could also positively influence the currently negative post-secondary attendance gap.
In the Canadian case, parental background is also not directly a major explanation of the positive post-secondary attendance advantage immigrant-background students hold over low-performers (and in general) among non-immigrant students. Higher parental education among immigrant families may act indirectly through the hopes and aspirations of parents and students. But since this latter variable appears to have a more direct effect on educational attainment, focusing on the value placed on higher education, and hopefully thereby influencing aspirations, may be helpful. More research on this particular question would assist policy development.
Notes
1. The Canadian sample consisted of a representative sample of 15-year-olds in the secondary school system. The Swiss sample was representative of students in grade nine as of December 1999, and hence includes some students who were slightly younger or older than age 15.
2. Students are « lost » because they refuse to continue participating, because they have left the country, because they can no longer be found or because they were not available to be interviewed.
3. Since the focus is on students with and without immigrant backgrounds, differential response rates in these two groups and their possible effects are a matter of concern. However, the response rates were not that dissimilar.
4. This is an adjusted result, after controlling for other variables such as parent’s education, high school marks, gender, etc.
5. The PISA reading scores were much better at discriminating between those who attend university and those who do not than other variables, such as self-reported secondary school marks, or parents’ education (OECD, 2010a).
6. The PISA reading, math and science scores themselves have been used as an outcome measure of educational achievement. In Switzerland, both first and second-generation students had significantly lower PISA scores, on average, than their counterparts with Swiss born parents (OECD, 2001a). A Swiss study found that social origin was one of the most important factors accounting for the difference in PISA score outcomes between children with and without immigrant backgrounds (Coradi Vellacott and Wolter, 2002). Meunier (2010) found that for Switzerland, differences in individual characteristics, family background and school characteristics could account for the majority of the PISA reading literacy gap between both first and second-generation students on one hand, and students with Swiss born parents on the other. A

119UNTAPPED SKILLS: REALISING THE POTENTIAL OF IMMIGRANT STUDENTS © OECD 2012
POST-SECONDARY ATTENDANCE OF IMMIGRANTS IN SWITZERLAND AND CANADA6
study based on the 2003 PISA reading test scores concluded that controlling only for differences in parental educational and occupational background reduced the PISA performance gap but did not by eliminate it (OECD, 2006). The association between PISA reading scores and family background is important in the discussion section.
7. Because of changes in the Swiss system during the early 1990s, and more recently with a 2002/03 treaty on the free movement of labour in the European Union, the composition of migration to Switzerland is shifting. Many more highly skilled immigrants are entering Switzerland from nations such as Germany and France, and a smaller share of immigrants are lower-skilled from the Balkan countries, Turkey or Portugal. See Cattaneo and Wolter (2012) for an analysis of how these changes have affected student performance in PISA 2009.
8. See Bertschy, et al. (2009) and Meyer (2009) for a description of the school system.
9. The over-representation of students with immigrant backgrounds in the lower academic streams appears to be related to more than marks and school performance. Sacchi, et al. (2011) found that the transition from compulsory to upper secondary school in Switzerland is strongly shaped by the students’ social origins and cultural backgrounds, irrespective of their school achievements as measured by PISA reading scores and academic record. Haeberlin, et al. (2004) found similar results. Students with immigrant backgrounds, but with equal school performance, were much less likely to be recommended for “higher level” school streams than were students with strictly Swiss backgrounds. Coradi, Vellacott and Wolter (2004) discuss the degree of equity in the Swiss school system across immigrant and other groups.
10. These designations are those of the International Standard Classification of Education (ISCED).
11. However, many students enter the Tertiary B level at an older age, so that perhaps half of the students who graduate from Tertiary B have not entered the system by age 23. Thus, by focusing on the educational outcomes of 23-year-olds we are under-representing the ultimate participation in Tertiary B level in particular.
12. These are preferred to logit or probit models because the coefficients can be interpreted directly. Also, most of the probabilities are not close to either zero or one, and hence all three types of models (logit, probit and linear probability) give approximately the same result.
13. Five “plausible values” of the PISA reading score were used in the analysis, as opposed to a single value. This approach is necessary because not all students were administered all PISA questions; responses to those not asked are probabilistically imputed five times. See the PISA Data Analysis Manual, OECD (2009) for more details. The regressions are run 5 times with the 5 values, and the average value of the coefficients used. Also, bootstap re-sampling methods are used to estimate standard errors incorporating complex survey design effects.
14. The same population of students with PISA scores at age 15, and who remain in the sample in 2007 at age 23, is employed. The dependent variable is the probability of attending a tertiary level institution by age 23. With the exception of the “generational” variables, the independent variables are the same as those used in the earlier described regression models. Rather than employing a binary variable that denotes generational status (1st, 2nd, 2.5 or 3rd-and-higher) as in the earlier regressions, a “source region” variable is used that denotes the country of birth of the student if a 1st or 3rd-plus generation student, and of the parent if a second-generation student. The source country variable has seven levels for Switzerland, and eleven for Canada. For Switzerland, the categories for this variable include Switzerland (i.e. students without an immigrant background or 3rd-and-higher generation), Germany/France/Austria/Belgium, Italy, Spain/Portugal, Yugoslavia/Albania/Kosovo, Turkey, and Other. For Canada, the categories are Canada (i.e. students without an immigrant background or the 3rd-and-higher generation), China, India, Other East or South East Asia, Other Asia, United States, Central/South America, United Kingdom, northern/western Europe, other Europe, Africa and others. Some aggregation of categories was necessary in cases where sample sizes were too small.
15. As noted earlier, the language of the test is often not the immigrant student’s home language, and this may affect the test score. This may be true among some second-generation students as well, where the share who are low-performers is also high (61%). However, the PISA reading literacy scores are strongly correlated with post-secondary attendance, and no doubt play a significant role in tertiary attendance patterns.
16. The estimate is smaller, at minus 4.1 percentage points, and not statistically significant. In model 3 (Figure 6.5a), when the secondary school streaming variable is added, the gap becomes marginally significant at – 8.8 percentage points. The gap increases in this model because second-generation students were more likely to be in the pre-gymnasial stream that leads to tertiary schooling than 3rd-plus generation students. (This was observed primarily in the French-speaking Cantons, not the German-speaking ones). The result is that, after one accounts for this difference through the control variable, the likelihood gap increases.
17. If both the parents and student held aspirations to attend the post-secondary level, they were about 20 percentage points more likely to attend than those who did not, after controlling for parental education and PISA score (Table 6.3). This is an important difference. Students in single parent or blended families were about 10 percentage points less likely to attend than their counterparts in two parent families. A 10-percentage-point difference in PISA reading scores resulted in about a 0.8-percentage-point difference in the likelihood of attending. Students whose parents had high school or less education were from 10 to 15 percentage points less likely to continue as compared to families where both parents had a post-secondary education.

120 © OECD 2012 UNTAPPED SKILLS: REALISING THE POTENTIAL OF IMMIGRANT STUDENTS
POST-SECONDARY ATTENDANCE OF IMMIGRANTS IN SWITZERLAND AND CANADA6
References
Abada, T., F. Hou, and B. Ram (2009), “Ethnic Differences in Educational Attainment Among the Second Generation of Immigrants”, Canadian Journal of Sociology, Vol. 34, No. 1, pp. 1-28.
Bertschy K., M.A. Cattaneo and S.C. Wolter (2009), PISA and the Transition into the Labour Market, Labour, Vol. 23, pp. 111-139.
Bonikowska, A. (2008), “Explaining the Education Gap Between Children of Immigrants and the Native Born: Allocation of Human Capital Investments in Immigrant Families’’, Canadian Economics Association 42nd Annual Meeting, University of British Columbia, Vancouver.
Boyd, M. (2002), “Educational attainments of immigrant offspring: Success or segmented assimilation?”, International Migration Review, Vol. 36, No. 4, pp. 1037–1060.
Cattaneo, M. A. and S. C. Wolter (2012), “Migration policy can boost PISA results: Findings from a natural experiment”, IZA Discussion Paper Series, No. 6300, Institute for the Study of Labour, Bonn.
Childs, S., R. Finnie and R. Mueller (2010), “Why do so many immigrants and their children attend university? Some (more) evidence for Canada”, Graduate School of Public and International Affairs Working Paper, University of Ottawa.
Coradi Vellacott, M. and S.C. Wolter (2002), “Origine sociale et égalité des chances”, Preparé pour la vie? Les compétences de base des jeunes – Rapport national de l’enquête PISA 2000, in OFS/CDIP, Office fédéral de la statistique, Neuchâtel, pp. 88-109.
Falter, J.M. (2009), Transitions to Upper Secondary Education: Parental Background and Skills, Department of Economics, Geneva.
Foley, K., V. Gallipoli and D. Green (2010), “Ability, Parental Valuation of Education and the High School Dropout Decision”, Canadian Labour Market and Skills Researcher Network Working Paper, No. 60.
Haeberlin, U., Imdorf, C. and Kronig, W. (2004), “Von der Schule in die Berufslehre. Untersuchungen zur Benachteiligung von ausländischen und von weiblichen Jugendlichen bei der Lehrstellensuche”, Haupt, Bern.
Heath A., C. Rothon and E. Kilpi (2008), “The Second Generation in Western Europe: Education, Unemployment, and Occupational Attainment”, Annual Review of Sociology, Vol. 34, pp. 211-35.
Hum, D. and W. Simpson (2007), “The Legacy of Immigration: Labour Market Performance and Education in the Second Generation”, Applied Economics, Vol. 39, pp.1985-2009.
Meunier, M. (2010), “Immigration and Student Achievement: Evidence from Switzerland”, Cahier de recherche No HES- SO/HEG-GE/C-10/3/1-CH, University of Applied Sciences, Switzerland.
Meyer, T. (2009), “Can ‘Vocationalisation’ of Education go too Far? The Case of Switzerland”, European Journal of Vocational Education, Vol. 46, No. 1, pp. 28-40.
Meyer, T. and Bertschy, K. (2011), “The Long and Winding Road from Education to Labour Market: The TREE Cohort Six Years After Leaving Compulsory School”, in M. Bergman, S. Hupka-Brunner, A. Keller, T. Meyer and B. E. Stalder (eds.), Youth Transitions in Switzerland: Results from the TREE Panel Study, Zurich, pp. 92-119.
OECD (2001a), Knowledge and Skills for Life: First Results from PISA 2000, PISA, OECD Publishing.
OECD (2001b), Manual for the PISA 2000 Database, OECD Publishing.
OECD (2006), Where Immigrant Students Succeed – A Comparative Review of Performance and Engagement in PISA 2003, OECD Publishing.
OECD (2009), PISA Data Analysis Manual: SAS Second Edition, OECD Publishing.
OECD (2010a), Pathways to Success: How Knowledge and Skills at Age 15 Shape Future Lives in Canada, OECD Publishing.
OECD (2010b), PISA 2009 Results: What Students Know and Can Do: Student Performance in Reading, Mathematics and Science (Volume I), PISA, OECD Publishing.
OPET (2011), Vocational Education and Training in Switzerland 2011, Facts and Figures, Federal Office for Professional Education and Technology (OPET), Bern.
Picot, G. and F. Hou (2010), “Seeking Success in Canada and the United States, Labour Market Outcomes Among the Children of Immigrants”, Equal Opportunities, The Labour Market Integration of the Children of Immigrants, OECD Publishing.
Picot, G. and F. Hou (2012), “Immigrant Status and Secondary School Performance as Determinants of Post-Secondary Participation: A Comparison of Canada and Switzerland”, OECD Education Working Paper Series, No. 77, OECD Publishing.
Sacchi, S., Hupka-Brunner, S., Stalder, B. E. and Gangl, M. (2011), “Die Bedeutung von sozialer Herkunft und Migrationshintergrund für den Übertritt in anerkannte nachobligatorische Ausbildungen in der Schweiz”, in M. M. Bergman, S. Hupka-Brunner, A. Keller, T. Meyer and B. E. Stalder (eds.), Youth Transitions in Switzerland: Results from the TREE Panel Study, Zurich, pp. 120-156.

121UNTAPPED SKILLS: REALISING THE POTENTIAL OF IMMIGRANT STUDENTS © OECD 2012
POST-SECONDARY ATTENDANCE OF IMMIGRANTS IN SWITZERLAND AND CANADA6
Stalder, B. E., Meyer, T. and Hupka-Brunner, S. (2011), “Leistungsschwach – bildungsarm? Ergebnisse der TREE-Studie zu den PISA-Kompetenzen als Prädiktoren für Bildungschancen in der Sekundarstufe II”, in M. M. Bergman, S. Hupka-Brunner, A. Keller, T. Meyer and B. E. Stalder (eds.), Youth Transitions in Switzerland: Results from the TREE Panel Study, Zurich, pp. 201-216.
Thompson, S. and K. Hillman (2010), Against the Odds: Influences on the Post-school Success of “Lowest Performers”, National Center for Vocational Education Research (NCVER), Adelaide, SA, Australia.

123Untapped SkillS: RealiSing the potential of immigRant StUdentS © OECD 2012
Annex A TECHNICAL BACKGROUND
This report discusses only statistically significant differences or changes. These are denoted in darker colours in figures and in bold font in tables. See Annex A of OECD (2010), PISA 2009 Results: What Students Know and Can Do (Volume I), PISA, OECD Publishing, for further information.
For further technical details please refer to:
OECD (2010), PISA 2009 Results: Overcoming Social Background: Equity in Learning Opportunities and Outcomes (Volume II), Annex A, PISA, OECD Publishing.
OECD (2012), PISA 2009 Technical Report, PISA, OECD Publishing.
Heath, A. and E. Kilpi-Jakonen (2012), “Immigrant Children’s Age at Arrival and Assessment Results”, OECD Education Working Paper Series, no. 75, OECD Publishing.
Picot, G. and F. Hou (2012), “Immigrant Status and Secondary School Performance as Determinants of Post-Secondary Participation: A Comparison of Canada and Switzerland”, OECD Education Working Paper Series, no. 77, OECD Publishing.


125UNTAPPED SKILLS: REALISING THE POTENTIAL OF IMMIGRANT STUDENTS © OECD 2012
Annex B DATA TABLES ON IMMIGRANT STUDENTS

126 © OECD 2012 UNTAPPED SKILLS: REALISING THE POTENTIAL OF IMMIGRANT STUDENTS
ANNEX B: DATA TABLES ON IMMIGRANT STUDENTS
Table B1.1 The foreign-born population aged 15 and older by country of residence and region of birth, circa 2000
Total (thousands)
Region of origin (percentages)
Population with birth
status unknown
(%)
Proportion of foreign-born in the population
(%)Africa Asia EuropeNorth
America Oceania
South, Central America and the
Carribean
Foreign-born but region
unspecified Total
of which: OECD
countries
OEC
D Australia 3 860.2 4.3 27.0 54.4 1.8 10.5 1.9 0.0 100.0 58.1 19.3 27.4
Austria 923.7 2.4 6.4 89.1 0.8 0.2 1.1 m 100.0 50.0 0.1 13.8
Belgium 1 019.3 22.8 6.1 67.6 1.4 0.1 2.0 m 100.0 66.1 0.1 12.0
Canada 5 355.2 5.2 35.2 43.1 4.6 0.9 11.0 0.0 100.0 44.3 m 22.4
Chile 162.6 0.8 4.5 18.7 4.8 0.8 69.0 1.5 100.0 24.8 133.4 1.5
Czech Republic 437.0 0.4 4.7 92.9 0.5 0.1 0.3 1.1 100.0 77.3 39.3 5.2
Denmark 319.3 8.2 30.2 55.7 3.0 0.6 2.4 m 100.0 50.1 7.2 7.4
Estonia 243.0 m 3.5 96.4 0.1 m 0.0 m 100.0 1.3 3.6 21.8
Finland 112.4 7.2 13.5 74.3 3.2 0.5 1.4 m 100.0 40.6 4.0 2.7
France 5 600.2 49.0 7.7 40.8 0.9 0.1 1.5 m 100.0 39.7 m 11.7
Germany 7 832.0 2.3 12.3 68.6 0.5 m 0.7 15.7 100.0 41.8 67.3 12.5
Greece 999.9 5.1 8.4 80.8 3.1 2.0 0.6 m 100.0 28.2 0.1 10.8
Hungary 275.5 0.6 3.7 94.3 0.9 0.1 0.4 m 100.0 23.6 m 3.2
Ireland 333.0 6.5 7.5 77.8 5.4 1.9 0.9 0.1 100.0 80.3 m 11.0
Israel 1 771.0 17.3 18.5 58.8 2.5 0.1 2.8 m 100.0 14.9 0.1 39.8
Italy 2 020.9 20.2 9.3 55.4 3.4 0.9 10.9 m 100.0 39.1 m 4.1
Japan 1 142.4 0.4 76.0 2.4 3.5 0.7 16.9 m 100.0 5.8 1.3 1.1
Luxembourg 129.8 4.1 2.8 90.4 0.9 0.1 1.1 0.7 100.0 85.0 1.3 36.6
Mexico 241.5 0.3 4.1 18.5 46.5 0.3 30.3 0.1 100.0 65.2 72.2 0.4
Netherlands 1 419.9 15.1 22.8 37.3 1.0 0.6 20.5 2.7 100.0 28.9 2.8 11.2
New Zealand 624.1 4.8 24.6 43.3 2.9 23.8 0.7 m 100.0 54.7 19.2 22.5
Norway 305.9 9.5 30.5 50.1 4.9 0.4 4.5 0.1 100.0 45.4 m 8.3
Poland 737.7 0.3 1.3 95.3 0.8 0.0 0.1 2.1 100.0 20.1 70.0 2.4
Portugal 585.9 56.7 2.7 27.3 1.8 0.1 11.4 m 100.0 25.8 m 6.7
Slovak Republic 113.2 0.2 1.3 97.5 0.8 m 0.2 m 100.0 85.0 358.3 2.9
Slovenia 164.4 0.2 0.3 98.9 0.3 0.1 0.2 m 100.0 8.7 m 9.9
Spain 1 914.9 19.4 4.1 37.3 1.0 0.2 37.9 m 100.0 32.2 0.2 5.5
Sweden 933.8 6.0 24.1 62.1 1.5 0.3 6.0 m 100.0 47.8 0.0 14.4
Switzerland 1 454.2 4.2 6.4 77.8 1.7 0.3 3.4 6.1 100.0 62.6 17.2 25.1
Turkey 1 130.6 0.4 6.4 91.4 1.0 0.2 m 0.7 100.0 34.6 1.1 2.4
United Kingdom 4 503.5 16.9 32.8 34.5 4.3 3.5 7.2 0.9 100.0 38.6 m 9.4
United States 31 389.9 2.7 25.0 17.3 2.8 0.8 51.5 0.0 100.0 46.9 m 14.5
Total OECD 75 715.8 9.1 21.3 38.6 2.5 1.5 25.1 1.9 100.0 44.4 10.2 8.9
Total non-OECD 16 687.4 0.8 37.9 51.9 0.3 0.1 7.8 1.2 100.0 7.7 4.5 3.0
Total 92 403.2 7.6 24.3 41.0 2.1 1.2 22.0 1.8 100.0 37.8 9.2 6.6
Part
ners Argentina 1 457.5 0.1 1.9 29.2 0.6 0.0 66.5 1.6 100.0 28.8 m 5.6
Brazil 651.2 2.3 17.7 58.4 1.5 0.1 19.9 0.2 100.0 68.2 m 0.5
Bulgaria 29.7 1.2 17.4 79.7 0.9 m 0.7 m 100.0 22.8 0.2 0.4
Colombia 75.6 0.7 4.9 16.6 8.3 0.7 66.1 2.7 100.0 26.6 732.0 0.3
Croatia 558.1 0.1 0.1 99.4 0.2 0.1 0.1 m 100.0 3.0 3.7 15.2
Indonesia 18.2 m 29.0 5.1 m 2.7 m 63.2 100.0 18.1 210.6 0.0
Jordan 291.4 32.6 18.8 2.1 m m m 46.4 100.0 m 0.3 9.1
Kyrgyzstan 354.7 m 49.2 50.0 m m m 0.7 100.0 0.5 m 11.6
Latvia 369.0 0.0 4.2 95.7 0.1 0.0 0.0 m 100.0 1.3 0.0 20.9
Lithuania 198.2 m 6.0 93.4 0.5 0.0 0.1 m 100.0 3.4 11.0 7.1
Panama 73.7 0.3 21.1 7.6 5.2 0.1 65.6 m 100.0 15.1 2.3 3.8
Peru 60.3 0.5 11.3 27.1 11.3 0.9 48.8 m 100.0 42.0 m 0.3
Romania 117.4 m 11.3 80.6 0.9 m m 7.3 100.0 15.8 0.6 0.7
Russian Federation 10 708.5 0.1 48.3 51.4 0.0 0.0 0.1 0.1 100.0 2.1 m 8.9
Serbia 861.0 0.1 0.1 99.7 0.0 0.0 0.0 m 100.0 2.1 1.1 13.6
Singapore 512.7 m 98.7 0.7 0.2 m m 0.4 100.0 m m 22.5
Thailand 228.2 m 87.9 7.4 2.3 1.3 m 1.1 100.0 13.3 47.7 0.5
Trinidad and Tobago 36.6 m 1.6 4.5 2.7 m 76.6 14.6 100.0 7.2 3.6 4.4
Uruguay 78.9 0.3 2.2 51.2 1.5 0.3 44.4 0.2 100.0 50.6 m 3.3
Source: United Nations (2011), Trends in International Migrant Stock.
Please refer to the Reader’s Guide for information concerning the symbols replacing missing data.
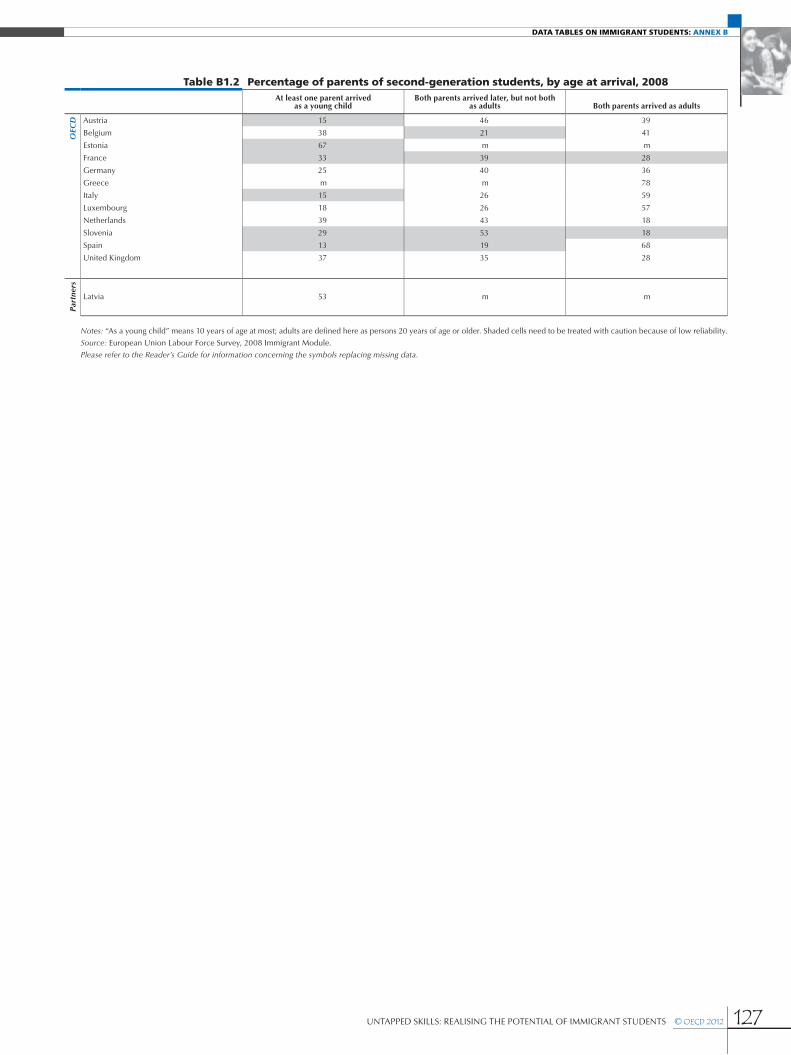
127UNTAPPED SKILLS: REALISING THE POTENTIAL OF IMMIGRANT STUDENTS © OECD 2012
DATA TABLES ON IMMIGRANT STUDENTS: ANNEX B
Table B1.2 Percentage of parents of second-generation students, by age at arrival, 2008At least one parent arrived
as a young childBoth parents arrived later, but not both
as adults Both parents arrived as adults
OEC
D Austria 15 46 39
Belgium 38 21 41
Estonia 67 m m
France 33 39 28
Germany 25 40 36
Greece m m 78
Italy 15 26 59
Luxembourg 18 26 57
Netherlands 39 43 18
Slovenia 29 53 18
Spain 13 19 68
United Kingdom 37 35 28
Part
ners
Latvia 53 m m
Notes: “As a young child” means 10 years of age at most; adults are defined here as persons 20 years of age or older. Shaded cells need to be treated with caution because of low reliability.
Source: European Union Labour Force Survey, 2008 Immigrant Module.
Please refer to the Reader’s Guide for information concerning the symbols replacing missing data.

128 © OECD 2012 UNTAPPED SKILLS: REALISING THE POTENTIAL OF IMMIGRANT STUDENTS
ANNEX B: DATA TABLES ON IMMIGRANT STUDENTS
Table B1.3 Proportion of students, by immigrant statusProportion of students
Non-immigrant students Second-generation students First-generation studentsImmigrant students (first- and
second-generation)
% S.E. % S.E. % S.E. % S.E.
OEC
D Australia 76.8 (1.1) 12.1 (0.7) 11.1 (0.6) 23.2 (1.1)
Austria 84.8 (1.2) 10.5 (0.9) 4.8 (0.6) 15.2 (1.2)
Belgium 85.2 (1.1) 7.8 (0.7) 6.9 (0.7) 14.8 (1.1)
Canada 75.6 (1.3) 13.7 (0.8) 10.7 (0.7) 24.4 (1.3)
Chile 99.5 (0.1) 0.1 (0.0) 0.4 (0.1) 0.5 (0.1)
Czech Republic 97.7 (0.2) 1.4 (0.2) 0.8 (0.1) 2.3 (0.2)
Denmark 91.4 (0.4) 5.9 (0.3) 2.8 (0.2) 8.6 (0.4)
Estonia 92.0 (0.6) 7.4 (0.6) 0.6 (0.1) 8.0 (0.6)
Finland 97.4 (0.3) 1.1 (0.2) 1.4 (0.2) 2.6 (0.3)
France 86.9 (1.4) 10.0 (1.0) 3.2 (0.5) 13.1 (1.4)
Germany 82.4 (1.0) 11.7 (0.8) 5.9 (0.4) 17.6 (1.0)
Greece 91.0 (0.8) 2.9 (0.3) 6.1 (0.7) 9.0 (0.8)
Hungary 97.9 (0.3) 0.9 (0.1) 1.2 (0.2) 2.1 (0.3)
Iceland 97.6 (0.2) 0.4 (0.1) 1.9 (0.2) 2.4 (0.2)
Ireland 91.7 (0.6) 1.4 (0.2) 6.8 (0.5) 8.3 (0.6)
Israel 80.3 (1.1) 12.6 (0.7) 7.1 (0.7) 19.7 (1.1)
Italy 94.5 (0.3) 1.3 (0.1) 4.2 (0.2) 5.5 (0.3)
Japan 99.7 (0.1) 0.1 (0.0) 0.1 (0.0) 0.3 (0.1)
Korea 100.0 (0.0) c c c c c c
Luxembourg 59.8 (0.7) 24.0 (0.6) 16.1 (0.5) 40.2 (0.7)
Mexico 98.1 (0.2) 0.7 (0.1) 1.1 (0.1) 1.9 (0.2)
Netherlands 87.9 (1.4) 8.9 (1.1) 3.2 (0.5) 12.1 (1.4)
New Zealand 75.3 (1.0) 8.0 (0.6) 16.7 (0.7) 24.7 (1.0)
Norway 93.2 (0.6) 3.6 (0.4) 3.2 (0.3) 6.8 (0.6)
Poland 100.0 (0.0) c c c c c c
Portugal 94.5 (0.5) 2.7 (0.3) 2.8 (0.3) 5.5 (0.5)
Slovak Republic 99.5 (0.1) 0.3 (0.1) 0.3 (0.1) 0.5 (0.1)
Slovenia 92.2 (0.4) 6.4 (0.4) 1.4 (0.2) 7.8 (0.4)
Spain 90.5 (0.5) 1.1 (0.1) 8.4 (0.5) 9.5 (0.5)
Sweden 88.3 (1.2) 8.0 (0.8) 3.7 (0.5) 11.7 (1.2)
Switzerland 76.5 (0.9) 15.1 (0.7) 8.4 (0.5) 23.5 (0.9)
Turkey 99.5 (0.1) 0.4 (0.1) 0.1 (0.1) 0.5 (0.1)
United Kingdom 89.4 (1.0) 5.8 (0.7) 4.8 (0.4) 10.6 (1.0)
United States 80.5 (1.3) 13.0 (1.1) 6.4 (0.5) 19.5 (1.3)
OECD average 89.6 (0.1) 6.2 (0.1) 4.8 (0.1) 11.0 (0.1)
Part
ners Albania 99.4 (0.2) 0.5 (0.2) 0.1 (0.1) 0.6 (0.2)
Argentina 96.4 (0.5) 2.2 (0.3) 1.5 (0.3) 3.6 (0.5)
Azerbaijan 96.9 (0.6) 2.3 (0.5) 0.8 (0.1) 3.1 (0.6)
Brazil 99.2 (0.1) 0.5 (0.1) 0.3 (0.1) 0.8 (0.1)
Bulgaria 99.5 (0.1) 0.2 (0.1) 0.3 (0.1) 0.5 (0.1)
Colombia 99.7 (0.1) 0.3 (0.1) 0.0 (0.0) 0.3 (0.1)
Croatia 89.3 (0.6) 7.2 (0.5) 3.5 (0.3) 10.7 (0.6)
Dubai (UAE) 28.6 (0.4) 26.4 (0.6) 45.0 (0.6) 71.4 (0.4)
Hong Kong-China 60.6 (1.5) 23.9 (0.8) 15.5 (1.0) 39.4 (1.5)
Indonesia 99.7 (0.1) c c 0.3 (0.1) 0.3 (0.1)
Jordan 86.2 (0.9) 10.5 (0.7) 3.3 (0.3) 13.8 (0.9)
Kazakhstan 88.4 (1.1) 7.2 (0.8) 4.4 (0.6) 11.6 (1.1)
Kyrgyzstan 98.1 (0.3) 1.1 (0.2) 0.8 (0.2) 1.9 (0.3)
Latvia 95.5 (0.5) 4.1 (0.5) 0.4 (0.1) 4.5 (0.5)
Liechtenstein 69.7 (2.5) 13.7 (1.8) 16.7 (1.9) 30.3 (2.5)
Lithuania 98.3 (0.3) 1.6 (0.3) 0.2 (0.1) 1.7 (0.3)
Macao-China 29.6 (0.6) 54.9 (0.6) 15.5 (0.4) 70.4 (0.6)
Montenegro 93.4 (0.4) 2.5 (0.3) 4.1 (0.3) 6.6 (0.4)
Panama 96.1 (0.8) 1.4 (0.3) 2.5 (0.7) 3.9 (0.8)
Peru 99.6 (0.1) 0.3 (0.1) 0.2 (0.1) 0.4 (0.1)
Qatar 53.6 (0.4) 20.0 (0.4) 26.4 (0.4) 46.4 (0.4)
Romania 99.7 (0.1) 0.1 (0.0) 0.2 (0.1) 0.3 (0.1)
Russian Federation 87.9 (0.7) 7.2 (0.7) 4.9 (0.4) 12.1 (0.7)
Serbia 90.5 (0.6) 5.2 (0.4) 4.3 (0.4) 9.5 (0.6)
Shanghai-China 99.5 (0.1) 0.1 (0.0) 0.5 (0.1) 0.5 (0.1)
Singapore 85.6 (0.7) 4.8 (0.4) 9.6 (0.5) 14.4 (0.7)
Chinese Taipei 99.6 (0.1) 0.2 (0.1) 0.2 (0.1) 0.4 (0.1)
Thailand 100.0 (0.0) c c c c c c
Trinidad and Tobago 97.7 (0.2) 1.2 (0.2) 1.0 (0.1) 2.3 (0.2)
Tunisia 99.7 (0.1) 0.2 (0.1) 0.1 (0.1) 0.3 (0.1)
Uruguay 99.4 (0.1) 0.3 (0.1) 0.3 (0.1) 0.6 (0.1)
Source: PISA 2009 Database.
Please refer to the Reader’s Guide for information concerning the symbols replacing missing data.

129UNTAPPED SKILLS: REALISING THE POTENTIAL OF IMMIGRANT STUDENTS © OECD 2012
DATA TABLES ON IMMIGRANT STUDENTS: ANNEX B
Table B1.4Proportion of students, by immigrant status and language spoken at homeResults based on students’ self-reports
Non-immigrant students speaking the language of assessment at
home
Non-immigrant students speaking another language
at home
Second-generation students speaking the language of assessment at
home
Second-generation students speaking another language
at home
First-generation students speaking the language of assessment at
home
First-generation students speaking another language
at home
Immigrant students (first- and second-generation)
speaking the language of
assessment at home
Immigrant students (first- and second-generation)
speaking another language at home
% S.E. % S.E. % S.E. % S.E. % S.E. % S.E. % S.E. % S.E.
OEC
D Australia 76.3 (1.1) 0.8 (0.1) 8.3 (0.4) 3.6 (0.3) 6.3 (0.3) 4.7 (0.5) 14.7 (0.6) 8.3 (0.7)Austria 86.2 (1.1) 1.3 (0.2) 2.3 (0.3) 6.3 (0.6) 1.0 (0.3) 2.9 (0.3) 3.3 (0.5) 9.3 (0.8)Belgium 71.8 (1.4) 14.4 (0.7) 3.3 (0.3) 3.8 (0.4) 3.4 (0.6) 3.2 (0.4) 6.8 (0.7) 7.0 (0.7)Canada 73.7 (1.3) 2.6 (0.2) 8.6 (0.6) 4.7 (0.4) 3.6 (0.3) 6.9 (0.5) 12.1 (0.7) 11.6 (0.8)Chile 99.1 (0.1) 0.4 (0.1) 0.1 (0.0) 0.0 (0.0) 0.4 (0.1) 0.0 (0.0) 0.5 (0.1) 0.0 (0.0)Czech Republic 97.6 (0.2) 0.5 (0.1) 0.9 (0.2) 0.3 (0.1) 0.1 (0.1) 0.6 (0.1) 1.0 (0.2) 0.9 (0.1)Denmark 92.1 (0.4) 0.5 (0.1) 2.8 (0.2) 2.3 (0.2) 0.7 (0.1) 1.6 (0.2) 3.6 (0.2) 3.9 (0.2)Estonia 90.2 (0.7) 1.9 (0.3) 6.6 (0.6) 0.8 (0.2) 0.5 (0.1) 0.1 (0.0) 7.1 (0.6) 0.9 (0.2)Finland 95.6 (0.4) 1.8 (0.2) 0.4 (0.1) 0.7 (0.1) 0.3 (0.1) 1.2 (0.2) 0.7 (0.1) 1.9 (0.3)France 85.7 (1.3) 2.3 (0.4) 6.1 (0.7) 3.0 (0.4) 1.1 (0.2) 1.7 (0.3) 7.2 (0.8) 4.8 (0.6)Germany 83.4 (1.0) 1.4 (0.2) 5.1 (0.5) 5.0 (0.5) 1.3 (0.2) 3.8 (0.4) 6.4 (0.5) 8.9 (0.7)Greece 90.0 (0.9) 1.3 (0.3) 2.6 (0.3) 0.3 (0.1) 2.7 (0.4) 3.2 (0.5) 5.3 (0.5) 3.5 (0.5)Hungary 97.1 (0.4) 0.8 (0.3) 0.9 (0.1) 0.0 (0.0) 1.1 (0.2) 0.1 (0.1) 2.0 (0.2) 0.1 (0.1)Iceland 96.4 (0.3) 1.3 (0.2) 0.2 (0.1) 0.2 (0.1) 0.3 (0.1) 1.6 (0.2) 0.5 (0.1) 1.8 (0.2)Ireland 89.8 (1.0) 2.2 (0.9) 1.3 (0.2) 0.1 (0.1) 3.1 (0.3) 3.5 (0.4) 4.4 (0.4) 3.6 (0.4)Israel 77.4 (1.3) 4.2 (0.7) 9.3 (0.6) 2.6 (0.3) 1.7 (0.2) 4.7 (0.6) 11.1 (0.6) 7.3 (0.8)Italy 84.0 (0.4) 10.7 (0.4) 0.8 (0.1) 0.5 (0.1) 1.0 (0.1) 3.1 (0.2) 1.7 (0.1) 3.6 (0.2)Japan 99.6 (0.1) 0.1 (0.0) 0.1 (0.0) 0.0 (0.0) 0.1 (0.0) 0.1 (0.0) 0.2 (0.1) 0.1 (0.0)Korea 99.9 (0.0) 0.1 (0.0) c c c c c c c c c c c cLuxembourg 2.6 (0.3) 60.6 (0.7) 4.2 (0.3) 17.6 (0.6) 4.4 (0.2) 10.7 (0.5) 8.6 (0.4) 28.2 (0.7)Mexico 96.1 (0.3) 2.2 (0.2) 0.7 (0.1) 0.1 (0.0) 0.8 (0.1) 0.3 (0.1) 1.5 (0.1) 0.3 (0.1)Netherlands 87.6 (1.4) 1.5 (0.5) 5.3 (0.8) 2.5 (0.4) 1.0 (0.2) 2.1 (0.3) 6.3 (0.9) 4.7 (0.6)New Zealand 72.5 (1.1) 2.8 (0.2) 5.0 (0.4) 3.0 (0.4) 7.9 (0.5) 8.7 (0.5) 13.0 (0.7) 11.7 (0.6)Norway 91.2 (0.6) 2.0 (0.2) 1.2 (0.2) 2.4 (0.4) 0.3 (0.1) 2.9 (0.3) 1.6 (0.2) 5.3 (0.5)Poland 99.4 (0.1) 0.6 (0.1) c c c c c c c c c c c cPortugal 94.2 (0.5) 0.6 (0.1) 2.5 (0.3) 0.2 (0.1) 1.7 (0.2) 0.8 (0.1) 4.2 (0.4) 1.0 (0.2)Slovak Republic 94.3 (0.8) 5.2 (0.8) 0.2 (0.1) 0.1 (0.0) 0.2 (0.1) 0.1 (0.1) 0.4 (0.1) 0.2 (0.1)Slovenia 91.6 (0.4) 1.2 (0.2) 2.9 (0.3) 3.0 (0.3) 0.3 (0.1) 1.0 (0.2) 3.2 (0.3) 4.0 (0.3)Spain 76.6 (1.0) 13.9 (0.9) 0.6 (0.1) 0.5 (0.1) 4.9 (0.4) 3.5 (0.3) 5.5 (0.4) 4.0 (0.4)Sweden 88.6 (1.1) 1.2 (0.2) 2.9 (0.3) 4.0 (0.6) 0.6 (0.1) 2.8 (0.4) 3.5 (0.3) 6.8 (0.8)Switzerland 75.6 (0.9) 3.1 (0.3) 6.2 (0.6) 7.4 (0.4) 3.0 (0.5) 4.8 (0.3) 9.2 (0.7) 12.2 (0.6)Turkey 95.8 (0.6) 3.7 (0.5) 0.4 (0.1) 0.0 (0.0) 0.1 (0.1) 0.0 (0.0) 0.5 (0.1) 0.1 (0.0)United Kingdom 88.4 (1.0) 1.3 (0.2) 4.0 (0.6) 1.8 (0.3) 1.5 (0.2) 3.1 (0.3) 5.5 (0.7) 4.9 (0.5)United States 79.3 (1.4) 1.4 (0.2) 6.0 (0.6) 6.9 (0.6) 1.7 (0.2) 4.7 (0.5) 7.8 (0.6) 11.5 (0.9)OECD average 85.9 (0.1) 4.4 (0.1) 3.2 (0.1) 2.6 (0.1) 1.8 (0.0) 2.8 (0.1) 5.0 (0.1) 5.4 (0.1)
Part
ners Albania 98.4 (0.3) 1.0 (0.2) 0.5 (0.2) 0.0 (0.0) 0.1 (0.1) 0.0 (0.0) 0.6 (0.2) 0.0 (0.0)
Argentina 95.9 (0.5) 0.7 (0.1) 1.8 (0.3) 0.2 (0.1) 1.0 (0.2) 0.4 (0.1) 2.8 (0.4) 0.6 (0.2)Azerbaijan 90.0 (1.2) 6.9 (1.0) 2.0 (0.5) 0.3 (0.1) 0.6 (0.1) 0.2 (0.1) 2.6 (0.6) 0.5 (0.2)Brazil 98.6 (0.2) 0.6 (0.1) 0.5 (0.1) 0.0 (0.0) 0.3 (0.1) 0.0 (0.0) 0.8 (0.1) 0.0 (0.0)Bulgaria 89.1 (1.8) 10.5 (1.7) 0.1 (0.1) 0.1 (0.0) 0.0 (0.0) 0.2 (0.1) 0.2 (0.1) 0.3 (0.1)Colombia 99.3 (0.1) 0.4 (0.1) 0.3 (0.1) 0.0 (0.0) 0.1 (0.0) 0.0 (0.0) 0.3 (0.1) 0.0 (0.0)Croatia 88.0 (0.7) 1.3 (0.4) 7.0 (0.5) 0.2 (0.1) 3.3 (0.3) 0.2 (0.1) 10.4 (0.6) 0.3 (0.1)Dubai (UAE) 16.1 (0.4) 9.4 (0.4) 12.8 (0.5) 14.4 (0.5) 20.5 (0.6) 26.9 (0.6) 33.3 (0.7) 41.3 (0.7)Hong Kong-China 57.8 (1.6) 2.8 (0.8) 22.8 (0.8) 1.2 (0.2) 12.2 (0.8) 3.3 (0.5) 35.0 (1.2) 4.5 (0.6)Indonesia 35.5 (2.1) 64.3 (2.1) c c c c 0.0 (0.0) 0.2 (0.1) 0.0 (0.0) 0.2 (0.1)Jordan 84.0 (0.9) 2.3 (0.3) 10.0 (0.7) 0.5 (0.1) 3.0 (0.3) 0.3 (0.1) 12.9 (0.9) 0.9 (0.1)Kazakhstan 79.4 (1.3) 9.0 (0.8) 6.7 (0.8) 0.6 (0.2) 3.9 (0.6) 0.5 (0.1) 10.5 (1.1) 1.1 (0.2)Kyrgyzstan 79.6 (1.6) 18.6 (1.6) 1.0 (0.1) 0.2 (0.1) 0.6 (0.2) 0.2 (0.1) 1.5 (0.3) 0.3 (0.1)Latvia 87.1 (1.3) 8.6 (1.2) 3.3 (0.4) 0.7 (0.2) 0.3 (0.1) 0.1 (0.1) 3.5 (0.5) 0.8 (0.2)Liechtenstein 69.5 (3.0) 0.7 (0.5) 8.1 (1.5) 5.7 (1.4) 7.6 (1.6) 8.5 (1.6) 15.8 (2.1) 14.1 (2.1)Lithuania 94.7 (0.8) 3.6 (0.7) 1.0 (0.2) 0.6 (0.2) 0.1 (0.1) 0.1 (0.0) 1.1 (0.2) 0.7 (0.2)Macao-China 24.1 (0.6) 5.5 (0.2) 50.6 (0.6) 4.3 (0.2) 14.2 (0.4) 1.3 (0.2) 64.9 (0.6) 5.6 (0.2)Montenegro 92.4 (0.4) 1.0 (0.2) 2.3 (0.3) 0.2 (0.1) 3.6 (0.3) 0.5 (0.2) 5.9 (0.4) 0.7 (0.2)Panama 92.4 (1.4) 3.9 (0.9) 0.8 (0.2) 0.4 (0.1) 1.4 (0.4) 1.2 (0.4) 2.1 (0.4) 1.6 (0.4)Peru 94.7 (0.8) 4.9 (0.8) 0.3 (0.1) 0.0 (0.0) 0.1 (0.1) 0.0 (0.0) 0.4 (0.1) 0.0 (0.0)Qatar 34.2 (0.4) 19.4 (0.3) 13.1 (0.4) 6.9 (0.3) 14.0 (0.3) 12.5 (0.3) 27.0 (0.4) 19.4 (0.4)Romania 96.6 (0.6) 3.1 (0.6) 0.1 (0.1) 0.0 (0.0) 0.1 (0.1) 0.1 (0.0) 0.2 (0.1) 0.1 (0.0)Russian Federation 80.9 (1.4) 7.0 (1.1) 5.9 (0.5) 1.3 (0.7) 3.8 (0.4) 1.1 (0.2) 9.8 (0.6) 2.3 (0.8)Serbia 89.0 (0.6) 1.6 (0.3) 5.1 (0.4) 0.1 (0.1) 4.1 (0.4) 0.2 (0.1) 9.2 (0.6) 0.3 (0.1)Shanghai-China 98.1 (0.3) 1.3 (0.2) 0.1 (0.0) 0.0 (0.0) 0.3 (0.1) 0.1 (0.1) 0.4 (0.1) 0.1 (0.1)Singapore 37.8 (0.8) 48.0 (1.0) 1.4 (0.2) 3.4 (0.3) 1.6 (0.2) 7.9 (0.4) 3.0 (0.3) 11.3 (0.5)Chinese Taipei 77.9 (1.2) 21.7 (1.2) 0.2 (0.1) 0.0 (0.0) 0.1 (0.1) 0.1 (0.0) 0.3 (0.1) 0.1 (0.0)Thailand 51.4 (1.7) 48.6 (1.7) c c c c c c c c c c c cTrinidad and Tobago 95.4 (0.3) 2.3 (0.2) 1.2 (0.2) 0.1 (0.1) 0.7 (0.1) 0.4 (0.1) 1.8 (0.2) 0.5 (0.1)
Tunisia 99.6 (0.1) 0.1 (0.0) 0.2 (0.1) 0.0 (0.0) 0.1 (0.1) 0.0 (0.0) 0.3 (0.1) 0.0 (0.0)Uruguay 97.3 (0.2) 2.2 (0.2) 0.2 (0.1) 0.0 (0.0) 0.2 (0.1) 0.1 (0.1) 0.4 (0.1) 0.1 (0.1)
Source: PISA 2009 Database.
Please refer to the Reader’s Guide for information concerning the symbols replacing missing data.

130 © OECD 2012 UNTAPPED SKILLS: REALISING THE POTENTIAL OF IMMIGRANT STUDENTS
ANNEX B: DATA TABLES ON IMMIGRANT STUDENTS
Table B1.5Sampled immigrant1 and non-immigrant students, by test language and language spoken at home
Language of test
Percent immigrant students
Percent speaking another language at home
Non-immigrant students Immigrant students
% SE % SE % SE
OEC
D Australia ENGLISH 23.0 (1.1) 1.0 (0.1) 36.2 (1.8)
Austria GERMAN 12.5 (1.0) 1.5 (0.2) 73.9 (2.8)
Belgium DUTCH 6.8 (0.9) 22.6 (1.4) 54.9 (6.0)
FRENCH 21.8 (2.2) 8.1 (0.7) 49.7 (3.3)
GERMAN 20.8 (1.4) 32.6 (1.9) 41.8 (4.5)
Canada ENGLISH 26.6 (1.5) 2.2 (0.2) 46.4 (1.5)
FRENCH 13.8 (1.9) 6.7 (0.5) 66.2 (3.6)
Chile SPANISH 0.5 (0.1) 0.4 (0.1) c c
Czech Republic CZECH 1.9 (0.2) 0.5 (0.1) 45.9 (5.0)
Denmark DANISH 7.4 (0.4) 0.5 (0.1) 52.0 (1.9)
Estonia ESTONIAN 2.4 (0.3) 2.1 (0.4) 36.3 (6.4)
RUSSIAN 32.2 (2.6) 1.5 (0.7) 2.6 (1.3)
Finland FINNISH 2.7 (0.4) 0.7 (0.2) 73.9 (4.4)
SWEDISH 1.3 (0.3) 18.7 (1.1) c c
France FRENCH 11.9 (1.3) 2.6 (0.4) 39.8 (2.4)
Germany GERMAN 15.3 (1.0) 1.6 (0.2) 58.0 (2.6)
Greece GREEK 8.8 (0.8) 1.4 (0.3) 39.4 (3.4)
Hungary HUNGARIAN 2.1 (0.3) 0.8 (0.3) 6.6 (2.9)
Iceland ICELANDIC 2.3 (0.3) 1.3 (0.2) 78.7 (4.6)
Ireland ENGLISH 8.1 (0.6) 0.6 (0.2) 44.9 (3.9)
IRISH c c c c c c
Israel ARABIC 1.4 (0.6) 5.1 (0.8) c c
HEBREW 22.8 (1.3) 3.7 (1.2) 39.5 (2.6)
Italy GERMAN 3.1 (0.7) 97.5 (0.5) 87.3 (12.2)
ITALIAN 5.3 (0.2) 10.6 (0.4) 67.3 (2.0)
SLOVENIAN c c c c c c
Japan JAPANESE 0.3 (0.1) 0.1 (0.0) c c
Korea KOREAN 0.0 (0.0) 0.1 (0.0) c c
Luxembourg ENGLISH c c c c c c
FRENCH 81.1 (1.5) 59.1 (4.1) 64.1 (1.9)
GERMAN 23.2 (0.7) 98.6 (0.3) 91.9 (0.9)
Mexico SPANISH 1.8 (0.2) 2.2 (0.2) 18.1 (3.2)
Netherlands DUTCH 10.9 (1.3) 1.6 (0.5) 42.6 (2.7)
New Zealand ENGLISH 24.7 (1.1) 3.7 (0.3) 47.4 (1.5)
Norway NORWEGIAN 6.9 (0.6) 2.1 (0.3) 76.9 (2.2)
Poland POLISH 0.0 (0.0) 0.6 (0.1) c c
Portugal PORTUGUESE 5.2 (0.4) 0.6 (0.1) 19.1 (2.7)
Slovak Republic HUNGARIAN 0.0 (0.0) 1.7 (0.7) m m
SLOVAK 0.5 (0.1) 5.4 (0.8) c c
Slovenia ITALIAN c c c c c c
SLOVENIAN 7.2 (0.4) 1.2 (0.2) 55.4 (3.0)
Spain BASQUE 0.5 (0.2) 27.2 (3.2) c c
CATALAN 11.3 (1.2) 45.7 (4.0) 80.2 (5.1)
GALICIAN 3.8 (0.5) 57.2 (3.5) 91.1 (3.7)
SPANISH 9.9 (0.6) 2.9 (0.7) 29.5 (3.4)
VALENCIAN 5.2 (2.9) 54.7 (14.7) c c
Sweden ENGLISH c c c c c c
SWEDISH 10.2 (1.0) 1.2 (0.2) 65.8 (2.3)
Switzerland FRENCH 30.2 (2.0) 3.5 (0.6) 39.4 (4.0)
GERMAN 17.0 (0.9) 3.2 (0.4) 71.6 (2.0)
ITALIAN 36.6 (2.8) 23.8 (4.9) 35.1 (8.1)
Turkey TURKISH 0.5 (0.1) 3.7 (0.5) c c
United Kingdom ENGLISH 10.5 (1.0) 0.9 (0.2) 47.4 (3.2)
WELSH 0.0 (0.0) 70.7 (5.2) m m
United States ENGLISH 19.3 (1.3) 1.7 (0.3) 59.8 (1.9)
[Part 1/2]

131UNTAPPED SKILLS: REALISING THE POTENTIAL OF IMMIGRANT STUDENTS © OECD 2012
DATA TABLES ON IMMIGRANT STUDENTS: ANNEX B
Table B1.5Sampled immigrant1 and non-immigrant students, by test language and language spoken at home (continued)
Language of test
Percent immigrant students Percent speaking another language at home
Non-immigrant students Immigrant students
% SE % SE % SE
Part
ners Albania ALBANIAN 0.6 (0.2) 1.0 (0.2) c c
Argentina SPANISH 3.4 (0.5) 0.8 (0.1) 17.1 (3.7)
Azerbaijan AZERBAIJANI 3.1 (0.6) 7.1 (1.1) 17.1 (4.9)
Brazil PORTUGUESE 0.8 (0.2) 0.6 (0.1) 4.3 (3.1)
Bulgaria BULGARIAN 0.5 (0.1) 10.6 (1.8) c c
Chinese Taipei CHINESE 0.4 (0.1) 21.8 (1.2) c c
Colombia SPANISH 0.3 (0.1) 0.4 (0.1) c c
Croatia CROATIAN 10.7 (0.6) 1.5 (0.4) 3.1 (0.8)
Dubai (UAE) ARABIC 39.2 (1.2) 4.6 (0.8) 6.8 (1.5)
ENGLISH 86.7 (0.4) 87.3 (1.6) 62.9 (0.9)
Hong Kong-China CHINESE 39.5 (1.4) 0.8 (0.2) 8.3 (0.8)
ENGLISH 38.8 (9.3) 90.5 (1.7) 72.7 (7.2)
Indonesia INDONESIAN 0.3 (0.1) 64.5 (2.2) c c
Jordan ARABIC 13.8 (0.9) 2.6 (0.4) 6.2 (0.9)
Kazakhstan KAZAKH 10.8 (1.4) 1.9 (0.4) 1.7 (1.0)
RUSSIAN 13.0 (1.8) 23.0 (1.8) 19.7 (3.6)
Kyrgyzstan KYRGYZ 0.5 (0.2) 2.7 (0.4) c c
RUSSIAN 4.2 (0.6) 61.1 (3.3) 23.0 (7.4)
UZBEK 3.8 (2.7) 3.3 (1.0) c c
Latvia LATVIAN 1.8 (0.3) 9.9 (1.4) 50.7 (9.8)
RUSSIAN 14.5 (1.7) 5.0 (2.8) 3.8 (1.8)
Liechtenstein GERMAN 29.9 (2.9) 1.0 (0.7) 47.3 (5.1)
Lithuania LITHUANIAN 1.2 (0.2) 3.4 (0.7) 48.7 (8.8)
POLISH 5.7 (2.7) 13.0 (5.3) c c
RUSSIAN 15.5 (3.7) 2.1 (1.6) c c
Macao-China CHINESE 73.0 (0.6) 0.6 (0.2) 1.2 (0.2)
ENGLISH 48.9 (2.0) 98.6 (0.7) 94.3 (1.4)
PORTUGUESE c c c c c c
Montenegro ALBANIAN c c c c c c
MONTENEGRIN 6.8 (0.4) 1.1 (0.2) 9.9 (3.1)
Panama SPANISH 3.7 (0.8) 4.0 (0.9) 42.8 (5.1)
Peru SPANISH 0.4 (0.1) 4.9 (0.8) c c
Qatar ARABIC 39.3 (0.6) 4.3 (0.3) 5.7 (0.5)
ENGLISH 56.1 (0.6) 96.0 (0.5) 76.0 (0.9)
Romania HUNGARIAN 0.0 (0.0) 0.4 (0.4) m m
ROMANIAN 0.3 (0.1) 3.2 (0.6) c c
Russian Federation RUSSIAN 12.1 (0.8) 8.0 (1.3) 19.4 (5.6)
Serbia HUNGARIAN 11.1 (3.4) 1.7 (1.3) c c
SERBIAN 9.4 (0.6) 1.8 (0.3) 2.8 (0.8)
Shanghai-China CHINESE 0.5 (0.1) 1.3 (0.2) c c
Singapore ENGLISH 14.3 (0.7) 55.9 (1.0) 78.9 (1.4)
Thailand THAI 0.0 (0.0) 48.6 (1.7) m m
Trinidad and Tobago ENGLISH 2.3 (0.2) 2.3 (0.2) 21.4 (4.2)
Tunisia ARABIC 0.3 (0.1) 0.1 (0.0) c c
Uruguay SPANISH 0.5 (0.1) 2.2 (0.2) c c
1. The term “immigrant” is used to designate children of immigrants, some of whom may have been born in the country of residence.
[Part 2/2]

132 © OECD 2012 UNTAPPED SKILLS: REALISING THE POTENTIAL OF IMMIGRANT STUDENTS
ANNEX B: DATA TABLES ON IMMIGRANT STUDENTS
Table B1.6Percentage of immigrant students in PISA 2000 and 2009Results based on students’ self-reports
Percentage of immigrant students Change in the percentage of immigrant students
PISA 2000 PISA 2009Change between 2000 and 2009
(PISA 2009 - PISA 2000)
% S.E. % S.E. % dif. S.E.
OEC
D Australia 22.6 (1.8) 23.2 (1.1) 0.6 (2.1)
Austria 11.0 (0.9) m m m m
Belgium 12.0 (1.1) 14.8 (1.1) 2.8 (1.6)
Canada 20.5 (1.0) 24.4 (1.3) 3.8 (1.7)
Chile 0.3 (0.1) 0.5 (0.1) 0.2 (0.1)
Czech Republic 1.1 (0.2) 2.3 (0.2) 1.2 (0.3)
Denmark 6.2 (0.6) 8.6 (0.4) 2.5 (0.7)
Finland 1.3 (0.2) 2.6 (0.3) 1.3 (0.4)
France 12.0 (0.9) 13.1 (1.4) 1.1 (1.6)
Germany 15.2 (0.8) 17.6 (1.0) 2.4 (1.3)
Greece 4.8 (0.9) 9.0 (0.8) 4.2 (1.2)
Hungary 1.7 (0.2) 2.1 (0.3) 0.4 (0.3)
Iceland 0.8 (0.2) 2.4 (0.2) 1.6 (0.3)
Ireland 2.3 (0.3) 8.3 (0.6) 5.9 (0.7)
Israel 25.0 (1.7) 19.7 (1.1) -5.2 (2.0)
Italy 0.9 (0.2) 5.5 (0.3) 4.6 (0.3)
Japan 0.1 (0.1) 0.3 (0.1) 0.1 (0.1)
Korea m m 0.0 (0.0) m m
Luxembourg m m 40.2 (0.7) m m
Mexico 3.6 (0.4) 1.9 (0.2) -1.7 (0.4)
Netherlands m m 12.1 (1.4) m m
New Zealand 19.6 (1.1) 24.7 (1.0) 5.0 (1.5)
Norway 4.6 (0.4) 6.8 (0.6) 2.2 (0.7)
Poland 0.3 (0.1) 0.0 (0.0) -0.2 (0.1)
Portugal 3.1 (0.3) 5.5 (0.5) 2.3 (0.5)
Spain 2.0 (0.4) 9.5 (0.5) 7.5 (0.6)
Sweden 10.5 (0.9) 11.7 (1.2) 1.2 (1.5)
Switzerland 20.7 (0.9) 23.5 (0.9) 2.8 (1.3)
United Kingdom m m 10.6 (1.0) m m
United States 13.6 (2.1) 19.5 (1.3) 5.9 (2.5)
OECD average-26 8.3 (0.2) 11.0 (0.2) 2.1 (0.2)
Part
ners Albania 0.8 (0.2) 0.6 (0.2) -0.1 (0.3)
Argentina 2.3 (0.5) 3.6 (0.5) 1.3 (0.7)
Brazil 0.4 (0.1) 0.8 (0.1) 0.4 (0.2)
Bulgaria 0.4 (0.1) 0.5 (0.1) 0.1 (0.2)
Hong Kong-China 43.8 (1.0) 39.4 (1.5) -4.4 (1.8)
Indonesia 0.4 (0.1) 0.3 (0.1) -0.1 (0.1)
Latvia 22.1 (2.4) 4.5 (0.5) -17.6 (2.4)
Liechtenstein 20.6 (2.1) 30.3 (2.5) 9.8 (3.3)
Peru 0.3 (0.1) 0.4 (0.1) 0.2 (0.1)
Romania 0.2 (0.1) 0.3 (0.1) 0.2 (0.1)
Russian Federation 4.6 (0.6) 12.1 (0.7) 7.5 (1.0)
Thailand 0.7 (0.5) 0.0 c c c
Note: Values that are statistically significant are indicated in bold (see Annex A).
Source: PISA 2009 Results, Volume V, Table V.4.4.
Please refer to the Reader’s Guide for information concerning the symbols replacing missing data.
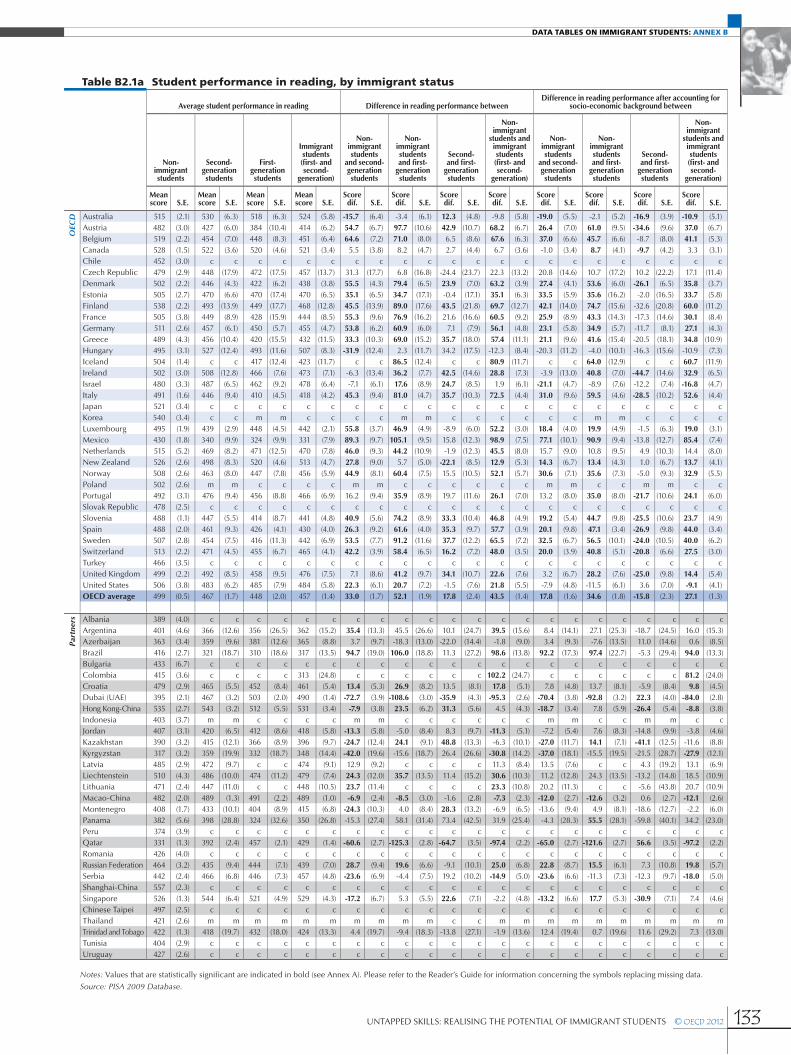
133UNTAPPED SKILLS: REALISING THE POTENTIAL OF IMMIGRANT STUDENTS © OECD 2012
DATA TABLES ON IMMIGRANT STUDENTS: ANNEX B
Table B2.1a Student performance in reading, by immigrant status
Average student performance in reading Difference in reading performance betweenDifference in reading performance after accounting for
socio-economic background between
Non-immigrant students
Second-generation students
First-generation students
Immigrant students (first- and second-
generation)
Non-immigrant students
and second-generation students
Non-immigrant students and first-
generation students
Second- and first-
generation students
Non-immigrant
students and immigrant students (first- and second-
generation)
Non-immigrant students
and second-generation students
Non-immigrant students and first-
generation students
Second- and first-
generation students
Non-immigrant
students and immigrant students (first- and second-
generation)
Mean score S.E.
Mean score S.E.
Mean score S.E.
Mean score S.E.
Score dif. S.E.
Score dif. S.E.
Score dif. S.E.
Score dif. S.E.
Score dif. S.E.
Score dif. S.E.
Score dif. S.E.
Score dif. S.E.
OEC
D Australia 515 (2.1) 530 (6.3) 518 (6.3) 524 (5.8) -15.7 (6.4) -3.4 (6.1) 12.3 (4.8) -9.8 (5.8) -19.0 (5.5) -2.1 (5.2) -16.9 (3.9) -10.9 (5.1)Austria 482 (3.0) 427 (6.0) 384 (10.4) 414 (6.2) 54.7 (6.7) 97.7 (10.6) 42.9 (10.7) 68.2 (6.7) 26.4 (7.0) 61.0 (9.5) -34.6 (9.6) 37.0 (6.7)Belgium 519 (2.2) 454 (7.0) 448 (8.3) 451 (6.4) 64.6 (7.2) 71.0 (8.0) 6.5 (8.6) 67.6 (6.3) 37.0 (6.6) 45.7 (6.6) -8.7 (8.0) 41.1 (5.3)Canada 528 (1.5) 522 (3.6) 520 (4.6) 521 (3.4) 5.5 (3.8) 8.2 (4.7) 2.7 (4.4) 6.7 (3.6) -1.0 (3.4) 8.7 (4.1) -9.7 (4.2) 3.3 (3.1)Chile 452 (3.0) c c c c c c c c c c c c c c c c c c c c c cCzech Republic 479 (2.9) 448 (17.9) 472 (17.5) 457 (13.7) 31.3 (17.7) 6.8 (16.8) -24.4 (23.7) 22.3 (13.2) 20.8 (14.6) 10.7 (17.2) 10.2 (22.2) 17.1 (11.4)Denmark 502 (2.2) 446 (4.3) 422 (6.2) 438 (3.8) 55.5 (4.3) 79.4 (6.5) 23.9 (7.0) 63.2 (3.9) 27.4 (4.1) 53.6 (6.0) -26.1 (6.5) 35.8 (3.7)Estonia 505 (2.7) 470 (6.6) 470 (17.4) 470 (6.5) 35.1 (6.5) 34.7 (17.1) -0.4 (17.1) 35.1 (6.3) 33.5 (5.9) 35.6 (16.2) -2.0 (16.5) 33.7 (5.8)Finland 538 (2.2) 493 (13.9) 449 (17.7) 468 (12.8) 45.5 (13.9) 89.0 (17.6) 43.5 (21.8) 69.7 (12.7) 42.1 (14.0) 74.7 (15.6) -32.6 (20.8) 60.0 (11.2)France 505 (3.8) 449 (8.9) 428 (15.9) 444 (8.5) 55.3 (9.6) 76.9 (16.2) 21.6 (16.6) 60.5 (9.2) 25.9 (8.9) 43.3 (14.3) -17.3 (14.6) 30.1 (8.4)Germany 511 (2.6) 457 (6.1) 450 (5.7) 455 (4.7) 53.8 (6.2) 60.9 (6.0) 7.1 (7.9) 56.1 (4.8) 23.1 (5.8) 34.9 (5.7) -11.7 (8.1) 27.1 (4.3)Greece 489 (4.3) 456 (10.4) 420 (15.5) 432 (11.5) 33.3 (10.3) 69.0 (15.2) 35.7 (18.0) 57.4 (11.1) 21.1 (9.6) 41.6 (15.4) -20.5 (18.1) 34.8 (10.9)Hungary 495 (3.1) 527 (12.4) 493 (11.6) 507 (8.3) -31.9 (12.4) 2.3 (11.7) 34.2 (17.5) -12.3 (8.4) -20.3 (11.2) -4.0 (10.1) -16.3 (15.6) -10.9 (7.3)Iceland 504 (1.4) c c 417 (12.4) 423 (11.7) c c 86.5 (12.4) c c 80.9 (11.7) c c 64.0 (12.9) c c 60.7 (11.9)Ireland 502 (3.0) 508 (12.8) 466 (7.6) 473 (7.1) -6.3 (13.4) 36.2 (7.7) 42.5 (14.6) 28.8 (7.3) -3.9 (13.0) 40.8 (7.0) -44.7 (14.6) 32.9 (6.5)Israel 480 (3.3) 487 (6.5) 462 (9.2) 478 (6.4) -7.1 (6.1) 17.6 (8.9) 24.7 (8.5) 1.9 (6.1) -21.1 (4.7) -8.9 (7.6) -12.2 (7.4) -16.8 (4.7)Italy 491 (1.6) 446 (9.4) 410 (4.5) 418 (4.2) 45.3 (9.4) 81.0 (4.7) 35.7 (10.3) 72.5 (4.4) 31.0 (9.6) 59.5 (4.6) -28.5 (10.2) 52.6 (4.4)Japan 521 (3.4) c c c c c c c c c c c c c c c c c c c c c cKorea 540 (3.4) c c m m c c c c m m c c c c c c m m c c c cLuxembourg 495 (1.9) 439 (2.9) 448 (4.5) 442 (2.1) 55.8 (3.7) 46.9 (4.9) -8.9 (6.0) 52.2 (3.0) 18.4 (4.0) 19.9 (4.9) -1.5 (6.3) 19.0 (3.1)Mexico 430 (1.8) 340 (9.9) 324 (9.9) 331 (7.9) 89.3 (9.7) 105.1 (9.5) 15.8 (12.3) 98.9 (7.5) 77.1 (10.1) 90.9 (9.4) -13.8 (12.7) 85.4 (7.4)Netherlands 515 (5.2) 469 (8.2) 471 (12.5) 470 (7.8) 46.0 (9.3) 44.2 (10.9) -1.9 (12.3) 45.5 (8.0) 15.7 (9.0) 10.8 (9.5) 4.9 (10.3) 14.4 (8.0)New Zealand 526 (2.6) 498 (8.3) 520 (4.6) 513 (4.7) 27.8 (9.0) 5.7 (5.0) -22.1 (8.5) 12.9 (5.3) 14.3 (6.7) 13.4 (4.3) 1.0 (6.7) 13.7 (4.1)Norway 508 (2.6) 463 (8.0) 447 (7.8) 456 (5.9) 44.9 (8.1) 60.4 (7.5) 15.5 (10.5) 52.1 (5.7) 30.6 (7.1) 35.6 (7.3) -5.0 (9.3) 32.9 (5.5)Poland 502 (2.6) m m c c c c m m c c c c c c m m c c m m c cPortugal 492 (3.1) 476 (9.4) 456 (8.8) 466 (6.9) 16.2 (9.4) 35.9 (8.9) 19.7 (11.6) 26.1 (7.0) 13.2 (8.0) 35.0 (8.0) -21.7 (10.6) 24.1 (6.0)Slovak Republic 478 (2.5) c c c c c c c c c c c c c c c c c c c c c cSlovenia 488 (1.1) 447 (5.5) 414 (8.7) 441 (4.8) 40.9 (5.6) 74.2 (8.9) 33.3 (10.4) 46.8 (4.9) 19.2 (5.4) 44.7 (9.8) -25.5 (10.6) 23.7 (4.9)Spain 488 (2.0) 461 (9.3) 426 (4.1) 430 (4.0) 26.3 (9.2) 61.6 (4.0) 35.3 (9.7) 57.7 (3.9) 20.1 (9.8) 47.1 (3.4) -26.9 (9.8) 44.0 (3.4)Sweden 507 (2.8) 454 (7.5) 416 (11.3) 442 (6.9) 53.5 (7.7) 91.2 (11.6) 37.7 (12.2) 65.5 (7.2) 32.5 (6.7) 56.5 (10.1) -24.0 (10.5) 40.0 (6.2)Switzerland 513 (2.2) 471 (4.5) 455 (6.7) 465 (4.1) 42.2 (3.9) 58.4 (6.5) 16.2 (7.2) 48.0 (3.5) 20.0 (3.9) 40.8 (5.1) -20.8 (6.6) 27.5 (3.0)Turkey 466 (3.5) c c c c c c c c c c c c c c c c c c c c c cUnited Kingdom 499 (2.2) 492 (8.5) 458 (9.5) 476 (7.5) 7.1 (8.6) 41.2 (9.7) 34.1 (10.7) 22.6 (7.6) 3.2 (6.7) 28.2 (7.6) -25.0 (9.8) 14.4 (5.4)United States 506 (3.8) 483 (6.2) 485 (7.9) 484 (5.8) 22.3 (6.1) 20.7 (7.2) -1.5 (7.6) 21.8 (5.5) -7.9 (4.8) -11.5 (6.1) 3.6 (7.0) -9.1 (4.1)OECD average 499 (0.5) 467 (1.7) 448 (2.0) 457 (1.4) 33.0 (1.7) 52.1 (1.9) 17.8 (2.4) 43.5 (1.4) 17.8 (1.6) 34.6 (1.8) -15.8 (2.3) 27.1 (1.3)
Part
ners Albania 389 (4.0) c c c c c c c c c c c c c c c c c c c c c c
Argentina 401 (4.6) 366 (12.6) 356 (26.5) 362 (15.2) 35.4 (13.3) 45.5 (26.6) 10.1 (24.7) 39.5 (15.6) 8.4 (14.1) 27.1 (25.3) -18.7 (24.5) 16.0 (15.3)Azerbaijan 363 (3.4) 359 (9.6) 381 (12.6) 365 (8.8) 3.7 (9.7) -18.3 (13.0) -22.0 (14.4) -1.8 (9.0) 3.4 (9.3) -7.6 (13.5) 11.0 (14.6) 0.6 (8.5)Brazil 416 (2.7) 321 (18.7) 310 (18.6) 317 (13.5) 94.7 (19.0) 106.0 (18.8) 11.3 (27.2) 98.6 (13.8) 92.2 (17.3) 97.4 (22.7) -5.3 (29.4) 94.0 (13.3)Bulgaria 433 (6.7) c c c c c c c c c c c c c c c c c c c c c cColombia 415 (3.6) c c c c 313 (24.8) c c c c c c 102.2 (24.7) c c c c c c 81.2 (24.0)Croatia 479 (2.9) 465 (5.5) 452 (8.4) 461 (5.4) 13.4 (5.3) 26.9 (8.2) 13.5 (8.1) 17.8 (5.1) 7.8 (4.8) 13.7 (8.1) -5.9 (8.4) 9.8 (4.5)Dubai (UAE) 395 (2.1) 467 (3.2) 503 (2.0) 490 (1.4) -72.7 (3.9) -108.6 (3.0) -35.9 (4.3) -95.3 (2.6) -70.4 (3.8) -92.8 (3.2) 22.3 (4.0) -84.0 (2.8)Hong Kong-China 535 (2.7) 543 (3.2) 512 (5.5) 531 (3.4) -7.9 (3.8) 23.5 (6.2) 31.3 (5.6) 4.5 (4.3) -18.7 (3.4) 7.8 (5.9) -26.4 (5.4) -8.8 (3.8)Indonesia 403 (3.7) m m c c c c m m c c c c c c m m c c m m c cJordan 407 (3.1) 420 (6.5) 412 (8.6) 418 (5.8) -13.3 (5.8) -5.0 (8.4) 8.3 (9.7) -11.3 (5.1) -7.2 (5.4) 7.6 (8.3) -14.8 (9.9) -3.8 (4.6)Kazakhstan 390 (3.2) 415 (12.1) 366 (8.9) 396 (9.7) -24.7 (12.4) 24.1 (9.1) 48.8 (13.3) -6.3 (10.1) -27.0 (11.7) 14.1 (7.1) -41.1 (12.5) -11.6 (8.8)Kyrgyzstan 317 (3.2) 359 (19.9) 332 (18.7) 348 (14.4) -42.0 (19.6) -15.6 (18.7) 26.4 (26.6) -30.8 (14.2) -37.0 (18.1) -15.5 (19.5) -21.5 (28.7) -27.9 (12.1)Latvia 485 (2.9) 472 (9.7) c c 474 (9.1) 12.9 (9.2) c c c c 11.3 (8.4) 13.5 (7.6) c c 4.3 (19.2) 13.1 (6.9)Liechtenstein 510 (4.3) 486 (10.0) 474 (11.2) 479 (7.4) 24.3 (12.0) 35.7 (13.5) 11.4 (15.2) 30.6 (10.3) 11.2 (12.8) 24.3 (13.5) -13.2 (14.8) 18.5 (10.9)Lithuania 471 (2.4) 447 (11.0) c c 448 (10.5) 23.7 (11.4) c c c c 23.3 (10.8) 20.2 (11.3) c c -5.6 (43.8) 20.7 (10.9)Macao-China 482 (2.0) 489 (1.3) 491 (2.2) 489 (1.0) -6.9 (2.4) -8.5 (3.0) -1.6 (2.8) -7.3 (2.3) -12.0 (2.7) -12.6 (3.2) 0.6 (2.7) -12.1 (2.6)Montenegro 408 (1.7) 433 (10.1) 404 (8.9) 415 (6.8) -24.3 (10.3) 4.0 (8.4) 28.3 (13.2) -6.9 (6.5) -13.6 (9.4) 4.9 (8.1) -18.6 (12.7) -2.2 (6.0)Panama 382 (5.6) 398 (28.8) 324 (32.6) 350 (26.8) -15.3 (27.4) 58.1 (31.4) 73.4 (42.5) 31.9 (25.4) -4.3 (28.3) 55.5 (28.1) -59.8 (40.1) 34.2 (23.0)Peru 374 (3.9) c c c c c c c c c c c c c c c c c c c c c cQatar 331 (1.3) 392 (2.4) 457 (2.1) 429 (1.4) -60.6 (2.7) -125.3 (2.8) -64.7 (3.5) -97.4 (2.2) -65.0 (2.7) -121.6 (2.7) 56.6 (3.5) -97.2 (2.2)Romania 426 (4.0) c c c c c c c c c c c c c c c c c c c c c cRussian Federation 464 (3.2) 435 (9.4) 444 (7.1) 439 (7.0) 28.7 (9.4) 19.6 (6.6) -9.1 (10.1) 25.0 (6.8) 22.8 (8.7) 15.5 (6.1) 7.3 (10.8) 19.8 (5.7)Serbia 442 (2.4) 466 (6.8) 446 (7.3) 457 (4.8) -23.6 (6.9) -4.4 (7.5) 19.2 (10.2) -14.9 (5.0) -23.6 (6.6) -11.3 (7.3) -12.3 (9.7) -18.0 (5.0)Shanghai-China 557 (2.3) c c c c c c c c c c c c c c c c c c c c c cSingapore 526 (1.3) 544 (6.4) 521 (4.9) 529 (4.3) -17.2 (6.7) 5.3 (5.5) 22.6 (7.1) -2.2 (4.8) -13.2 (6.6) 17.7 (5.3) -30.9 (7.1) 7.4 (4.6)Chinese Taipei 497 (2.5) c c c c c c c c c c c c c c c c c c c c c cThailand 421 (2.6) m m m m m m m m m m c c m m m m m m m m m mTrinidad and Tobago 422 (1.3) 418 (19.7) 432 (18.0) 424 (13.3) 4.4 (19.7) -9.4 (18.3) -13.8 (27.1) -1.9 (13.6) 12.4 (19.4) 0.7 (19.6) 11.6 (29.2) 7.3 (13.0)Tunisia 404 (2.9) c c c c c c c c c c c c c c c c c c c c c cUruguay 427 (2.6) c c c c c c c c c c c c c c c c c c c c c c
Notes: Values that are statistically significant are indicated in bold (see Annex A). Please refer to the Reader’s Guide for information concerning the symbols replacing missing data.
Source: PISA 2009 Database.

134 © OECD 2012 UNTAPPED SKILLS: REALISING THE POTENTIAL OF IMMIGRANT STUDENTS
ANNEX B: DATA TABLES ON IMMIGRANT STUDENTS
Table B2.1bStudent performance in mathematics, by immigrant statusResults based on students’ self-reports
Average student performance in mathematics Difference in mathematics performance between
Non-immigrant students
Second-generation students
First-generation students
Immigrant students (first- and second-
generation)
non-immigrant students
and second-generation students
non-immigrant students and first-
generation students
second- and first-
generation students
non-immigrant
students and immigrant students (first- and second-
generation)
non-immigrant students
and second-generation students,
after accounting for socio-economic
background
non-immigrant students and first-
generation students,
after accounting for socio-economic
background
second- and first-
generation students,
after accounting for socio-economic
background
non-immigrant
students and immigrant students (first- and second-
generation), after
accounting for socio-economic
background
Mean score S.E.
Mean score S.E.
Mean score S.E.
Mean score S.E.
Score dif. S.E.
Score dif. S.E.
Score dif. S.E.
Score dif. S.E.
Score dif. S.E.
Score dif. S.E.
Score dif. S.E.
Score dif. S.E.
OEC
D Australia 513 (2.2) 532 (6.8) 519 (6.4) 526 (6.3) -18.9 (6.8) -6.2 (6.1) 12.8 (4.5) -12.8 (6.1) -22.3 (6.0) -4.9 (5.3) -17.5 (3.6) -14.0 (5.5)Austria 507 (2.7) 450 (6.0) 431 (8.1) 444 (5.4) 57.1 (6.5) 75.7 (8.4) 18.6 (8.7) 63.0 (5.9) 30.1 (6.5) 41.0 (8.5) -11.0 (8.4) 33.4 (6.1)Belgium 529 (2.3) 459 (7.3) 454 (7.7) 456 (5.9) 70.4 (7.5) 75.0 (7.9) 4.6 (9.2) 72.6 (6.2) 42.1 (6.9) 49.8 (7.0) -7.7 (8.9) 45.7 (5.4)Canada 531 (1.6) 519 (3.5) 523 (4.6) 521 (3.4) 12.2 (3.7) 7.6 (4.6) -4.6 (4.2) 10.2 (3.5) 5.5 (3.3) 8.2 (3.9) -2.7 (4.0) 6.7 (3.0)Chile 423 (3.0) c c c c c c c c c c c c c c c c c c c c c cCzech Republic 494 (2.8) 452 (17.6) 490 (15.5) 466 (13.5) 42.2 (17.7) 4.2 (14.9) -38.1 (21.6) 28.2 (13.4) 30.0 (13.8) 8.4 (14.6) 21.7 (18.4) 22.0 (11.1)Denmark 510 (2.8) 447 (4.3) 426 (5.5) 440 (3.5) 63.6 (4.7) 84.2 (6.0) 20.6 (6.9) 70.2 (4.1) 37.0 (4.7) 60.5 (6.1) -23.5 (6.6) 44.5 (4.2)Estonia 516 (2.5) 479 (7.5) 475 (19.9) 479 (7.5) 36.6 (7.4) 40.5 (19.5) 3.9 (19.5) 36.9 (7.2) 34.9 (6.6) 41.2 (18.0) -6.3 (18.2) 35.4 (6.5)Finland 542 (2.2) 498 (12.7) 479 (14.2) 487 (9.5) 44.0 (12.6) 63.5 (14.2) 19.4 (20.1) 54.9 (9.4) 40.8 (13.0) 51.0 (12.6) -10.2 (20.0) 46.4 (8.1)France 507 (3.3) 443 (8.6) 430 (14.8) 440 (8.1) 63.1 (9.2) 76.9 (15.7) 13.7 (15.6) 66.4 (8.9) 33.2 (8.5) 42.5 (12.5) -9.2 (12.5) 35.4 (8.0)Germany 527 (2.8) 469 (6.5) 464 (5.9) 468 (5.0) 57.5 (6.6) 62.5 (5.8) 5.0 (7.9) 59.1 (5.1) 24.1 (6.2) 34.0 (5.5) -9.9 (7.9) 27.5 (4.6)Greece 472 (3.9) 446 (9.1) 407 (11.7) 420 (9.2) 25.9 (9.0) 64.8 (11.8) 39.0 (13.8) 52.2 (9.2) 14.0 (8.5) 37.8 (12.1) -23.8 (13.8) 29.9 (9.0)Hungary 491 (3.4) 512 (13.7) 492 (13.1) 501 (9.4) -21.5 (13.5) -1.6 (13.0) 20.0 (18.9) -10.1 (9.4) -9.3 (12.3) -8.2 (11.2) -1.1 (17.4) -8.7 (7.9)Iceland 510 (1.4) c c 440 (11.9) 443 (11.3) c c 69.7 (12.1) c c 67.3 (11.4) c c 43.6 (12.6) c c 43.9 (11.6)Ireland 492 (2.7) 496 (12.3) 467 (6.6) 472 (6.1) -4.5 (12.7) 25.2 (7.0) 29.6 (14.1) 20.0 (6.5) -2.2 (13.0) 29.3 (6.4) -31.5 (14.4) 23.8 (6.0)Israel 452 (3.0) 455 (7.4) 441 (8.1) 450 (6.4) -3.1 (7.0) 11.5 (8.0) 14.6 (8.5) 2.2 (6.1) -18.1 (5.4) -15.4 (6.1) -2.7 (7.0) -17.2 (4.5)Italy 487 (1.9) 450 (7.8) 420 (4.4) 427 (3.9) 37.1 (8.0) 67.4 (4.9) 30.3 (9.1) 60.2 (4.4) 24.9 (7.8) 48.7 (5.0) -23.8 (8.9) 42.9 (4.5)Japan 530 (3.3) c c c c c c c c c c c c c c c c c c c c c cKorea 548 (4.0) c c m m c c c c m m c c c c c c m m c c c cLuxembourg 511 (1.8) 456 (2.9) 466 (4.4) 460 (2.2) 54.4 (3.6) 44.5 (5.0) -10.0 (5.8) 50.4 (3.1) 19.1 (4.0) 18.6 (4.9) 0.5 (6.0) 18.9 (3.2)Mexico 423 (1.7) 330 (11.0) 329 (8.5) 329 (6.8) 92.3 (10.9) 94.2 (7.9) 1.9 (13.7) 93.4 (6.3) 80.9 (11.0) 80.9 (8.1) -0.0 (13.8) 80.9 (6.5)Netherlands 534 (4.6) 477 (8.9) 479 (12.0) 477 (8.2) 56.9 (9.1) 55.1 (10.8) -1.8 (12.1) 56.4 (7.9) 25.3 (8.6) 20.8 (9.3) 4.5 (9.5) 24.2 (7.8)New Zealand 523 (2.5) 494 (7.0) 524 (4.6) 514 (4.4) 29.6 (7.4) -0.4 (4.8) -30.0 (7.5) 9.3 (4.8) 16.2 (5.2) 7.3 (4.2) 8.9 (5.8) 10.1 (3.7)Norway 502 (2.4) 463 (8.7) 445 (9.0) 455 (6.3) 38.4 (8.8) 56.8 (8.7) 18.4 (12.0) 47.0 (6.1) 23.2 (7.5) 30.6 (8.4) -7.4 (10.5) 26.6 (5.8)Poland 496 (2.8) m m c c c c m m c c c c c c m m c c m m c cPortugal 490 (3.0) 450 (10.7) 461 (9.3) 455 (7.7) 40.2 (10.7) 28.8 (9.5) -11.3 (12.9) 34.5 (7.8) 36.7 (9.0) 27.3 (8.6) 9.4 (11.6) 32.0 (6.7)Slovak Republic 498 (3.0) c c c c c c c c c c c c c c c c c c c c c cSlovenia 507 (1.2) 459 (5.5) 416 (10.3) 452 (5.0) 47.5 (5.4) 90.5 (10.4) 43.0 (11.5) 55.2 (4.9) 23.7 (5.5) 58.1 (11.0) -34.4 (11.5) 29.8 (5.2)Spain 491 (2.1) 456 (10.8) 425 (4.2) 428 (4.1) 35.0 (10.4) 65.9 (4.2) 30.9 (11.1) 62.4 (4.0) 28.6 (10.4) 51.2 (3.4) -22.6 (10.6) 48.6 (3.3)Sweden 504 (2.8) 447 (7.5) 428 (11.6) 441 (7.3) 56.8 (7.7) 75.7 (11.9) 18.9 (11.1) 62.8 (7.7) 36.4 (6.7) 42.4 (9.7) -5.9 (8.8) 38.3 (6.6)Switzerland 550 (3.2) 494 (4.8) 475 (6.7) 487 (4.3) 56.3 (4.4) 74.9 (6.3) 18.6 (7.3) 62.9 (3.8) 33.0 (4.6) 56.4 (4.7) -23.4 (6.3) 41.5 (3.6)Turkey 447 (4.5) c c c c c c c c c c c c c c c c c c c c c cUnited Kingdom 497 (2.4) 486 (6.7) 460 (8.6) 474 (6.0) 11.9 (6.5) 37.5 (8.6) 25.7 (9.7) 23.5 (5.9) 8.5 (4.7) 25.0 (6.5) -16.5 (8.8) 15.9 (3.6)United States 494 (3.8) 464 (5.4) 477 (8.2) 468 (5.6) 30.3 (5.7) 17.6 (7.7) -12.7 (7.0) 26.1 (5.5) 1.5 (4.5) -12.9 (6.4) 14.4 (6.6) -3.2 (4.3)OECD average 501 (0.5) 466 (1.7) 455 (1.9) 460 (1.3) 37.4 (1.7) 48.6 (1.9) 10.4 (2.3) 43.7 (1.3) 22.1 (1.6) 31.2 (1.7) -8.6 (2.2) 27.2 (1.2)
Part
ners Albania 381 (3.9) c c c c c c c c c c c c c c c c c c c c c c
Argentina 391 (4.1) 363 (11.2) 361 (23.0) 362 (13.0) 27.9 (11.2) 29.5 (23.5) 1.6 (22.3) 28.5 (13.3) 4.5 (11.3) 12.8 (21.9) -8.3 (22.1) 7.8 (12.4)Azerbaijan 431 (2.9) 437 (8.4) 425 (10.9) 434 (6.7) -5.5 (8.5) 6.5 (11.0) 12.1 (13.9) -2.5 (6.9) -4.7 (8.5) 10.0 (11.1) -14.6 (13.9) -1.0 (7.0)Brazil 389 (2.4) 311 (13.1) 289 (12.6) 303 (10.7) 77.8 (13.5) 99.7 (12.9) 21.9 (16.2) 85.5 (11.2) 75.6 (13.3) 91.9 (17.6) -16.4 (20.1) 81.2 (11.5)Bulgaria 431 (5.9) c c c c c c c c c c c c c c c c c c c c c cColombia 383 (3.2) c c c c 297 (17.9) c c c c c c 86.1 (18.2) c c c c c c 66.8 (18.3)Croatia 462 (3.1) 455 (6.1) 447 (7.9) 452 (5.5) 7.0 (5.5) 15.0 (7.4) 8.0 (8.2) 9.6 (4.8) 1.3 (5.2) 1.7 (7.3) -0.4 (8.6) 1.4 (4.4)Dubai (UAE) 388 (2.1) 463 (3.1) 494 (2.0) 483 (1.3) -74.9 (3.8) -106.4 (2.7) -31.5 (4.4) -94.7 (2.3) -72.9 (3.8) -91.9 (2.8) 19.0 (4.1) -84.5 (2.5)Hong Kong-China 561 (3.1) 562 (4.0) 521 (5.5) 546 (4.0) -1.4 (4.4) 39.6 (6.1) 41.0 (5.6) 14.7 (4.6) -15.1 (3.9) 19.6 (5.6) -34.7 (5.3) -2.2 (4.0)Indonesia 372 (3.7) m m c c c c m m c c c c c c m m c c m m c cJordan 387 (3.6) 398 (7.3) 407 (8.4) 400 (6.6) -10.7 (6.4) -19.2 (8.0) -8.5 (9.0) -12.7 (5.7) -4.1 (5.9) -5.9 (7.3) 1.8 (8.9) -4.5 (5.0)Kazakhstan 403 (3.0) 448 (15.0) 383 (7.5) 423 (11.8) -45.5 (15.1) 20.2 (7.7) 65.6 (14.0) -20.8 (11.9) -47.3 (14.3) 12.1 (6.7) -59.4 (13.4) -25.0 (10.9)Kyrgyzstan 333 (2.9) 374 (14.9) 362 (15.7) 369 (11.8) -40.9 (14.9) -29.3 (15.7) 11.6 (19.6) -36.0 (11.9) -36.9 (13.9) -29.4 (14.9) -7.5 (20.9) -33.7 (9.9)Latvia 483 (3.0) 465 (9.1) c c 467 (8.6) 18.5 (8.9) c c c c 16.6 (8.4) 19.3 (7.3) c c 7.6 (17.5) 18.6 (6.9)Liechtenstein 543 (5.1) 526 (11.4) 519 (15.3) 522 (9.9) 16.8 (12.9) 24.2 (17.4) 7.3 (18.7) 20.8 (12.4) -1.3 (11.9) 8.5 (16.1) -9.8 (16.9) 4.2 (11.7)Lithuania 479 (2.6) 461 (12.4) c c 462 (11.2) 17.6 (12.7) c c c c 16.7 (11.4) 14.7 (11.1) c c -0.0 (44.7) 14.7 (10.1)Macao-China 522 (2.1) 529 (1.6) 523 (2.9) 528 (1.2) -6.9 (2.7) -0.5 (3.9) 6.4 (3.6) -5.5 (2.6) -12.4 (2.8) -5.0 (3.8) -7.4 (3.5) -10.7 (2.7)Montenegro 403 (2.0) 426 (11.0) 408 (10.9) 415 (8.0) -23.7 (11.1) -5.6 (10.3) 18.1 (15.4) -12.6 (7.4) -13.5 (10.0) -4.8 (9.9) -8.7 (14.6) -8.1 (6.9)Panama 368 (4.7) 395 (28.8) 330 (34.3) 353 (27.5) -26.8 (27.7) 38.0 (33.3) 64.8 (43.6) 14.9 (26.3) -18.4 (28.8) 35.6 (31.1) -54.0 (42.3) 16.4 (24.7)Peru 368 (4.0) c c c c c c c c c c c c c c c c c c c c c cQatar 335 (1.3) 379 (1.9) 442 (2.0) 415 (1.4) -44.5 (2.3) -107.7 (2.8) -63.2 (3.0) -80.5 (2.2) -49.6 (2.2) -103.8 (2.8) 54.2 (2.9) -80.4 (2.1)Romania 428 (3.4) c c c c c c c c c c c c c c c c c c c c c cRussian Federation 471 (3.3) 446 (5.1) 461 (6.8) 452 (5.0) 25.3 (5.3) 10.9 (6.2) -14.4 (6.5) 19.5 (4.8) 19.6 (4.8) 6.7 (5.4) 12.9 (6.8) 14.4 (3.8)Serbia 443 (2.8) 466 (9.4) 443 (7.9) 455 (7.0) -23.3 (9.3) 0.0 (7.6) 23.4 (10.7) -12.7 (6.7) -23.3 (8.9) -8.0 (7.3) -15.3 (9.9) -16.3 (6.5)Shanghai-China 601 (2.7) c c c c c c c c c c c c c c c c c c c c c cSingapore 560 (1.7) 577 (5.5) 582 (5.3) 581 (4.1) -17.2 (5.9) -22.1 (6.0) -4.8 (7.2) -20.5 (4.9) -13.4 (6.0) -9.3 (5.9) -4.1 (7.1) -10.6 (4.9)Chinese Taipei 545 (3.4) c c c c c c c c c c c c c c c c c c c c c cThailand 419 (3.2) m m m m m m m m m m c c m m m m m m m m m mTrinidad and Tobago 418 (1.3) 394 (18.0) 424 (15.5) 408 (12.3) 24.5 (18.1) -5.7 (15.9) -30.3 (23.6) 10.7 (12.6) 32.2 (18.0) 4.0 (17.5) 28.2 (25.7) 19.9 (12.5)Tunisia 372 (3.0) c c c c c c c c c c c c c c c c c c c c c cUruguay 428 (2.6) c c c c c c c c c c c c c c c c c c c c c c
Note: Values that are statistically significant are indicated in bold (see Annex A).Source: PISA 2009 Database.Please refer to the Reader’s Guide for information concerning the symbols replacing missing data.

135UNTAPPED SKILLS: REALISING THE POTENTIAL OF IMMIGRANT STUDENTS © OECD 2012
DATA TABLES ON IMMIGRANT STUDENTS: ANNEX B
Table B2.1cStudent performance in science, by immigrant statusResults based on students’ self-reports
Average student performance in science Difference in science performance between
Non-immigrant students
Second-generation students
First-generation students
Immigrant students (first- and second-
generation)
non-immigrant students
and second-generation students
non-immigrant students and first-
generation students
second- and first-
generation students
non-immigrant
students and immigrant students (first- and second-
generation)
non-immigrant students
and second-generation students,
after accounting for socio-economic
background
non-immigrant students and first-
generation students,
after accounting for socio-economic
background
second- and first-
generation students,
after accounting for socio-economic
background
non-immigrant
students and immigrant students (first- and second-
generation), after
accounting for socio-economic
background
Mean score S.E.
Mean score S.E.
Mean score S.E.
Mean score S.E.
Score dif. S.E.
Score dif. S.E.
Score dif. S.E.
Score dif. S.E.
Score dif. S.E.
Score dif. S.E.
Score dif. S.E.
Score dif. S.E.
OEC
D Australia 529 (2.2) 537 (7.4) 526 (6.9) 531 (6.7) -7.7 (7.5) 3.3 (6.6) 10.9 (5.0) -2.4 (6.6) -11.2 (6.6) 4.8 (5.7) -16.0 (4.2) -3.5 (5.9)Austria 508 (3.0) 434 (6.6) 405 (12.9) 425 (7.1) 74.2 (6.9) 103.5 (12.9) 29.3 (12.9) 83.4 (7.2) 44.8 (7.0) 65.8 (11.4) -21.0 (11.1) 51.2 (7.0)Belgium 521 (2.3) 447 (7.0) 441 (8.8) 444 (6.3) 74.0 (7.3) 80.4 (8.4) 6.3 (9.4) 77.0 (6.2) 46.2 (6.9) 55.4 (7.4) -9.2 (9.1) 50.5 (5.5)Canada 535 (1.5) 515 (4.0) 521 (4.9) 518 (3.7) 19.3 (4.1) 13.6 (4.9) -5.7 (4.7) 16.8 (3.9) 12.8 (3.5) 14.2 (4.3) -1.4 (4.2) 13.4 (3.3)Chile 450 (2.9) c c c c c c c c c c c c c c c c c c c c c cCzech Republic 502 (3.0) 452 (20.4) 498 (16.3) 469 (15.4) 49.8 (20.6) 3.7 (15.5) -46.1 (24.0) 32.8 (15.3) 38.3 (16.3) 7.8 (15.7) 30.5 (21.2) 27.1 (12.6)Denmark 508 (2.6) 430 (4.6) 415 (6.7) 426 (4.1) 77.3 (4.9) 92.3 (6.9) 15.0 (7.6) 82.1 (4.4) 47.3 (4.8) 64.2 (6.4) -17.0 (7.1) 52.7 (4.2)Estonia 532 (2.7) 489 (6.6) 492 (18.1) 489 (6.5) 43.4 (6.6) 40.0 (17.9) -3.4 (18.0) 43.2 (6.4) 41.8 (6.0) 40.8 (16.7) 1.0 (17.1) 41.7 (5.8)Finland 556 (2.3) 494 (16.4) 463 (16.1) 477 (11.8) 62.2 (16.2) 93.6 (16.0) 31.4 (23.3) 79.7 (11.5) 58.8 (16.3) 80.6 (14.5) -21.9 (23.2) 70.8 (10.3)France 508 (3.8) 443 (8.9) 430 (14.2) 440 (8.7) 64.5 (9.2) 77.5 (14.6) 13.0 (13.6) 67.6 (9.1) 35.3 (8.1) 44.0 (12.7) -8.7 (12.2) 37.3 (7.9)Germany 538 (2.5) 462 (6.3) 461 (6.0) 462 (5.2) 76.3 (6.3) 77.0 (5.9) 0.7 (7.3) 76.5 (5.1) 42.7 (5.7) 48.3 (5.4) -5.6 (7.2) 44.6 (4.5)Greece 475 (3.9) 446 (8.6) 417 (15.4) 426 (11.2) 29.1 (8.5) 58.7 (15.1) 29.6 (17.1) 49.2 (10.9) 17.0 (7.7) 31.6 (15.0) -14.6 (16.6) 26.8 (10.5)Hungary 503 (3.1) 530 (12.1) 505 (12.1) 515 (8.5) -26.4 (12.2) -1.4 (12.3) 25.0 (17.5) -12.0 (8.7) -15.6 (11.5) -7.2 (10.7) -8.4 (16.4) -10.8 (7.5)Iceland 499 (1.4) c c 420 (12.5) 423 (12.0) c c 78.2 (12.6) c c 75.7 (12.0) c c 53.0 (13.3) c c 53.1 (12.2)Ireland 513 (3.4) 522 (13.3) 486 (8.0) 492 (7.4) -9.4 (13.9) 27.1 (8.3) 36.5 (15.2) 20.8 (7.7) -7.0 (13.9) 31.6 (7.8) -38.6 (15.4) 24.8 (7.2)Israel 460 (3.0) 467 (6.4) 438 (8.6) 457 (6.0) -6.9 (6.5) 21.5 (8.5) 28.4 (8.3) 3.3 (6.0) -21.4 (5.4) -5.1 (6.8) -16.4 (7.1) -15.7 (4.8)Italy 494 (1.8) 451 (8.5) 411 (5.2) 420 (4.8) 42.7 (8.7) 83.0 (5.5) 40.3 (9.8) 73.4 (5.1) 28.9 (8.9) 61.9 (5.1) -33.1 (9.5) 53.9 (4.9)Japan 540 (3.4) c c c c c c c c c c c c c c c c c c c c c cKorea 539 (3.4) c c m m c c c c m m c c c c c c m m c c c cLuxembourg 509 (1.8) 445 (2.8) 457 (4.2) 450 (2.1) 64.1 (3.6) 52.6 (4.7) -11.5 (5.4) 59.5 (3.0) 24.6 (3.8) 23.9 (4.6) 0.7 (5.6) 24.3 (3.1)Mexico 419 (1.7) 363 (10.1) 342 (7.7) 350 (6.4) 55.7 (10.2) 77.1 (7.3) 21.4 (12.5) 68.6 (6.1) 44.0 (10.1) 63.5 (7.4) -19.5 (12.4) 55.8 (6.1)Netherlands 532 (5.2) 466 (12.0) 457 (13.7) 464 (11.0) 66.0 (12.4) 75.1 (12.5) 9.1 (13.6) 68.4 (11.0) 31.6 (12.2) 38.2 (11.1) -6.6 (12.0) 33.3 (10.8)New Zealand 540 (2.8) 498 (8.9) 528 (4.7) 518 (5.1) 41.5 (9.5) 12.2 (5.2) -29.3 (8.8) 21.7 (5.7) 27.8 (7.1) 20.0 (4.5) 7.7 (6.9) 22.5 (4.5)Norway 505 (2.6) 443 (8.8) 432 (7.8) 438 (5.8) 62.1 (8.8) 73.2 (7.5) 11.0 (11.9) 67.3 (5.5) 46.9 (7.9) 47.0 (7.4) -0.1 (10.6) 46.9 (5.5)Poland 510 (2.4) m m c c c c m m c c c c c c m m c c m m c cPortugal 496 (2.9) 474 (9.2) 464 (8.7) 469 (6.5) 21.4 (9.0) 31.4 (8.8) 10.0 (12.3) 26.5 (6.4) 18.4 (7.6) 30.8 (7.9) -12.4 (11.2) 24.6 (5.4)Slovak Republic 491 (2.9) c c c c c c c c c c c c c c c c c c c c c cSlovenia 518 (1.3) 458 (5.9) 435 (9.2) 454 (5.0) 60.1 (6.1) 83.0 (9.4) 22.9 (11.4) 64.2 (5.2) 39.7 (5.8) 55.5 (10.2) -15.7 (11.5) 42.5 (5.2)Spain 495 (2.0) 467 (8.5) 431 (4.1) 435 (3.9) 27.9 (8.2) 63.8 (4.1) 36.0 (9.2) 59.8 (3.8) 21.9 (8.4) 49.8 (3.5) -27.9 (9.1) 46.6 (3.2)Sweden 506 (2.6) 440 (8.6) 408 (11.7) 430 (7.9) 65.7 (8.9) 97.8 (11.9) 32.1 (12.1) 76.0 (8.2) 45.1 (8.1) 64.1 (9.9) -19.0 (9.9) 51.0 (7.4)Switzerland 533 (2.7) 471 (4.4) 465 (6.7) 469 (3.8) 62.1 (3.8) 68.1 (6.7) 6.0 (7.7) 64.2 (3.4) 39.4 (4.1) 50.0 (5.1) -10.6 (6.8) 43.3 (3.0)Turkey 455 (3.5) c c c c c c c c c c c c c c c c c c c c c cUnited Kingdom 519 (2.5) 508 (9.1) 483 (10.5) 497 (8.5) 11.0 (9.4) 36.1 (10.7) 25.1 (9.8) 22.4 (8.9) 7.3 (5.7) 21.5 (8.1) -14.2 (8.6) 13.7 (5.4)United States 510 (3.9) 475 (5.0) 481 (8.1) 477 (5.2) 35.6 (5.3) 28.8 (7.4) -6.8 (7.4) 33.3 (5.0) 5.4 (4.3) -3.1 (6.3) 8.5 (6.9) 2.6 (3.9)OECD average 507 (0.5) 468 (1.8) 454 (2.0) 459 (1.4) 42.1 (1.8) 55.4 (1.9) 12.5 (2.4) 50.0 (1.4) 26.3 (1.7) 37.6 (1.8) -10.7 (2.3) 33.0 (1.3)
Part
ners Albania 394 (3.8) c c c c c c c c c c c c c c c c c c c c c c
Argentina 404 (4.6) 366 (12.5) 359 (25.9) 363 (15.3) 37.5 (12.9) 45.4 (25.9) 7.9 (23.6) 40.7 (15.5) 12.0 (13.8) 27.2 (24.9) -15.2 (24.2) 18.2 (15.1)Azerbaijan 374 (3.1) 380 (11.5) 397 (14.8) 384 (9.5) -5.9 (11.6) -23.2 (14.8) -17.3 (19.7) -10.2 (9.6) -5.9 (10.1) -14.9 (15.0) 9.0 (19.2) -8.2 (8.2)Brazil 408 (2.4) 338 (12.8) 313 (17.4) 330 (9.8) 70.0 (13.2) 94.9 (17.2) 24.9 (23.3) 78.7 (10.0) 67.6 (13.8) 86.3 (24.5) -18.6 (29.0) 74.1 (11.8)Bulgaria 443 (5.8) c c c c c c c c c c c c c c c c c c c c c cColombia 404 (3.6) c c c c 327 (21.0) c c c c c c 76.8 (21.3) c c c c c c 57.4 (22.1)Croatia 489 (2.8) 470 (5.5) 460 (7.7) 467 (5.1) 19.0 (5.1) 29.0 (7.3) 10.0 (8.0) 22.3 (4.5) 13.6 (4.7) 16.3 (7.2) -2.7 (8.4) 14.5 (4.1)Dubai (UAE) 402 (2.2) 472 (3.3) 512 (1.9) 497 (1.5) -70.0 (3.9) -110.4 (2.9) -40.4 (4.2) -95.4 (2.6) -67.8 (3.9) -95.5 (3.0) 27.8 (4.0) -84.7 (2.8)Hong Kong-China 552 (3.2) 558 (3.6) 527 (5.7) 546 (3.8) -6.5 (3.9) 24.6 (6.1) 31.1 (5.7) 5.8 (4.2) -18.1 (3.5) 7.9 (5.9) -26.0 (5.6) -8.3 (3.7)Indonesia 383 (3.8) m m c c c c m m c c c c c c m m c c m m c cJordan 416 (3.4) 436 (6.8) 436 (9.5) 436 (6.0) -19.6 (6.2) -19.9 (9.1) -0.3 (10.5) -19.6 (5.3) -13.6 (5.7) -7.6 (8.5) -6.0 (10.5) -12.2 (4.7)Kazakhstan 400 (3.1) 431 (12.4) 371 (8.9) 409 (10.3) -31.8 (12.4) 28.5 (8.7) 60.3 (12.9) -9.1 (10.3) -33.6 (11.8) 20.6 (7.6) -54.2 (12.2) -13.3 (9.3)Kyrgyzstan 332 (2.9) 387 (16.8) 361 (21.5) 376 (13.3) -55.7 (16.6) -29.0 (21.6) 26.7 (27.5) -44.4 (13.1) -51.6 (16.2) -28.9 (22.3) -22.8 (28.5) -42.0 (12.6)Latvia 495 (3.0) 471 (8.6) c c 474 (8.0) 24.1 (8.3) c c c c 21.5 (7.7) 24.8 (7.2) c c 16.2 (16.5) 23.4 (6.5)Liechtenstein 534 (4.8) 502 (11.2) 482 (11.7) 491 (7.9) 31.1 (13.3) 51.8 (14.1) 20.7 (16.5) 42.5 (10.9) 15.1 (13.2) 37.9 (14.0) -22.8 (15.5) 27.8 (11.2)Lithuania 493 (3.0) 468 (10.1) c c 471 (9.1) 25.3 (10.4) c c c c 22.2 (9.2) 23.5 (9.7) c c 25.7 (39.9) 21.1 (8.7)Macao-China 506 (1.9) 515 (1.8) 511 (2.5) 514 (1.4) -8.9 (2.7) -5.4 (3.3) 3.5 (3.5) -8.1 (2.4) -13.3 (2.9) -8.9 (3.4) -4.4 (3.5) -12.3 (2.6)Montenegro 402 (2.1) 416 (10.5) 404 (7.9) 409 (6.4) -13.6 (10.7) -2.3 (7.5) 11.3 (12.8) -6.6 (6.2) -4.2 (10.1) -1.5 (7.5) -2.7 (12.5) -2.5 (6.0)Panama 387 (4.8) 390 (27.4) 331 (22.8) 352 (20.6) -3.1 (26.3) 56.3 (22.0) 59.4 (34.0) 35.1 (19.5) 6.4 (27.0) 54.1 (19.9) -47.7 (32.9) 37.1 (17.8)Peru 372 (3.5) c c c c c c c c c c c c c c c c c c c c c cQatar 342 (1.5) 395 (2.3) 458 (2.3) 431 (1.6) -52.5 (2.8) -116.0 (2.9) -63.5 (3.4) -88.7 (2.4) -56.8 (2.8) -112.4 (2.9) 55.6 (3.4) -88.5 (2.4)Romania 429 (3.3) c c c c c c c c c c c c c c c c c c c c c cRussian Federation 483 (3.2) 461 (5.4) 451 (7.0) 457 (5.0) 21.3 (5.3) 32.1 (6.1) 10.8 (7.2) 25.7 (4.4) 16.0 (4.7) 28.3 (5.6) -12.3 (7.4) 21.0 (3.6)Serbia 443 (2.3) 468 (8.1) 449 (7.3) 459 (5.6) -25.0 (8.2) -6.1 (7.4) 18.9 (10.8) -16.4 (5.6) -25.0 (8.1) -13.0 (7.1) -12.0 (10.3) -19.5 (5.6)Shanghai-China 576 (2.2) c c c c c c c c c c c c c c c c c c c c c cSingapore 540 (1.6) 554 (6.5) 554 (5.3) 554 (4.4) -13.8 (6.5) -13.7 (5.9) 0.1 (7.7) -13.7 (4.9) -9.5 (6.2) -0.2 (5.7) -9.3 (7.3) -3.3 (4.7)Chinese Taipei 522 (2.6) c c c c c c c c c c c c c c c c c c c c c cThailand 425 (3.0) m m m m m m m m m m c c m m m m m m m m m mTrinidad and Tobago 415 (1.2) 405 (20.9) 425 (18.8) 414 (13.5) 9.5 (20.9) -10.6 (19.0) -20.1 (29.7) 0.3 (13.6) 17.6 (20.4) 3.5 (20.1) 14.0 (31.1) 11.4 (13.2)Tunisia 401 (2.7) c c c c c c c c c c c c c c c c c c c c c cUruguay 428 (2.5) c c c c c c c c c c c c c c c c c c c c c c
Note: Values that are statistically significant are indicated in bold (see Annex A).Source: PISA 2009 Database.Please refer to the Reader’s Guide for information concerning the symbols replacing missing data.

136 © OECD 2012 UNTAPPED SKILLS: REALISING THE POTENTIAL OF IMMIGRANT STUDENTS
ANNEX B: DATA TABLES ON IMMIGRANT STUDENTS
Table B2.1d
Proportion of immigrant students below the 25th. 50th and 75th percentile of performance among non-immigrant studentsResults based on students’ self-reports
Proportion of students among children of immigrants below the…
25th percentile of performance among non-immigrant students
50th percentile of performance among non-immigrant students
75th percentile of performance among non-immigrant students
% S.E. % S.E. % S.E.
OEC
D Australia 23.4 (1.6) 45.7 (2.3) 70.9 (2.5)Austria 51.6 (3.6) 76.8 (2.4) 91.8 (1.3)Belgium 51.0 (2.6) 76.0 (2.4) 90.8 (1.6)Canada 28.4 (1.5) 53.2 (1.7) 75.7 (1.5)Chile c c c c c cCzech Republic 35.5 (6.6) 56.3 (5.7) 74.0 (6.1)Denmark 54.7 (2.4) 78.3 (2.1) 91.9 (1.7)Estonia 38.0 (3.7) 65.6 (3.6) 88.4 (2.0)Finland 56.1 (5.8) 75.3 (4.7) 88.3 (3.4)France 48.5 (3.9) 72.6 (3.3) 88.9 (2.0)Germany 48.3 (2.4) 73.7 (2.6) 90.7 (1.5)Greece 47.6 (4.5) 74.3 (3.7) 89.5 (2.3)Hungary 19.6 (5.7) 45.2 (5.5) 73.4 (5.7)Iceland 56.6 (7.1) 79.8 (5.0) 93.8 (3.5)Ireland 39.5 (3.5) 61.8 (3.3) 81.2 (2.8)Israel 24.7 (2.2) 52.9 (3.0) 76.2 (2.3)Italy 54.9 (1.9) 77.9 (1.8) 92.5 (1.3)Japan c c c c c cKorea c c c c c cLuxembourg 46.7 (1.1) 69.1 (1.0) 86.2 (0.9)Mexico 72.2 (3.6) 88.7 (2.4) 96.1 (1.5)Netherlands 42.4 (5.2) 74.0 (3.5) 89.9 (2.2)New Zealand 32.1 (2.0) 55.6 (2.0) 75.7 (1.7)Norway 48.3 (3.1) 73.3 (2.8) 88.4 (2.5)Poland c c c c c cPortugal 36.1 (4.2) 65.1 (4.0) 84.8 (2.9)Slovak Republic c c c c c cSlovenia 40.9 (3.4) 72.2 (3.1) 90.9 (1.7)Spain 50.5 (2.4) 78.6 (1.8) 92.0 (1.2)Sweden 50.7 (3.6) 74.7 (3.0) 90.1 (2.0)Switzerland 45.9 (2.0) 69.5 (2.2) 85.9 (1.5)Turkey c c c c c cUnited Kingdom 33.9 (3.8) 57.4 (3.6) 81.7 (2.2)United States 32.8 (2.5) 60.9 (3.0) 82.8 (2.2)OECD average 43.2 (0.7) 68.0 (0.6) 85.8 (0.5)
Part
ners Albania c c c c c c
Argentina 36.2 (6.5) 65.6 (6.1) 84.4 (4.3)Azerbaijan 20.6 (4.3) 48.8 (7.1) 75.2 (7.2)Brazil 73.1 (7.8) 89.5 (5.3) 95.1 (3.8)Bulgaria c c c c c cColombia 71.8 (11.1) 92.6 (5.3) 98.1 (3.7)Croatia 31.2 (2.9) 61.1 (2.9) 80.3 (2.3)Dubai (UAE) 6.3 (0.6) 17.3 (0.6) 37.2 (1.2)Hong Kong-China 26.5 (1.6) 54.0 (1.9) 77.2 (1.6)Indonesia c c c c c cJordan 22.4 (2.3) 44.8 (3.1) 69.4 (2.8)Kazakhstan 26.0 (3.5) 49.4 (4.0) 70.8 (4.0)Kyrgyzstan 22.0 (5.0) 39.4 (5.9) 57.0 (7.8)Latvia 33.0 (5.9) 54.2 (4.9) 78.1 (4.0)Liechtenstein 39.6 (5.9) 62.7 (5.5) 86.5 (5.5)Lithuania 35.9 (7.2) 60.4 (6.2) 81.6 (5.2)Macao-China 21.2 (0.9) 45.8 (1.1) 73.6 (0.8)Montenegro 21.5 (3.4) 47.7 (4.0) 74.5 (3.0)Panama 45.1 (9.9) 62.0 (8.3) 73.8 (6.5)Peru c c c c c cQatar 7.7 (0.5) 18.3 (0.7) 37.5 (0.8)Romania c c c c c cRussian Federation 34.8 (3.7) 61.1 (3.3) 82.8 (2.2)Serbia 20.5 (2.3) 43.1 (2.7) 70.0 (3.2)Shanghai-China c c c c c cSingapore 25.2 (1.7) 48.5 (2.7) 73.4 (1.9)Chinese Taipei c c c c c cThailand m m m m m mTrinidad and Tobago 32.9 (5.2) 50.6 (5.5) 67.7 (4.8)Tunisia c c c c c cUruguay c c c c c c
Source: PISA 2009 Database.
Please refer to the Reader’s Guide for information concerning the symbols replacing missing data.

137UNTAPPED SKILLS: REALISING THE POTENTIAL OF IMMIGRANT STUDENTS © OECD 2012
DATA TABLES ON IMMIGRANT STUDENTS: ANNEX B
Table B2.1e Proportion of top performers in reading, by immigrant status% of top performing students (Levels 5 and 6) among…
Difference between non-immigrant
students and second-generation students
Difference between non-immigrant
students and first-generation students
Difference between non-
immigrant students and immigrant
students (first- and second-generation)
Non-immigrant students
Second-generation students
First-generation students
Immigrant students (first- and second-generation)
% S.E. % S.E. % S.E. % S.E. % dif. S.E. % dif. S.E. % dif. S.E.
OEC
D Australia 12.1 (0.6) 16.5 (2.8) 14.9 (2.2) 15.7 (2.3) -4.4 (2.7) -2.7 (2.2) -3.6 (2.2)Austria 5.7 (0.6) 0.9 (0.5) 1.1 (0.8) 1.0 (0.4) 4.8 (0.7) 4.6 (0.9) 4.7 (0.6)Belgium 12.6 (0.7) 4.0 (1.1) 4.9 (1.1) 4.4 (0.9) 8.7 (1.3) 7.7 (1.3) 8.2 (1.1)Canada 13.0 (0.5) 12.0 (1.2) 14.7 (1.6) 13.2 (1.1) 1.0 (1.3) -1.7 (1.6) -0.2 (1.2)Chile 1.3 (0.3) c c c c c c c c c c c cCzech Republic 5.1 (0.4) 4.0 (3.3) 7.2 (4.5) 5.2 (2.7) 1.2 (3.1) -2.1 (4.5) -0.0 (2.6)Denmark 5.2 (0.5) 0.9 (0.4) 0.7 (0.7) 0.9 (0.3) 4.2 (0.7) 4.4 (0.8) 4.3 (0.6)Estonia 6.5 (0.7) 1.9 (1.2) 4.0 (3.7) 2.0 (1.1) 4.6 (1.3) 2.5 (3.7) 4.4 (1.2)Finland 14.8 (0.8) 7.8 (4.6) 6.6 (3.6) 7.1 (2.8) 7.0 (4.6) 8.2 (3.6) 7.7 (2.9)France 10.5 (1.1) 3.8 (1.3) 5.2 (2.5) 4.1 (1.2) 6.7 (1.6) 5.4 (2.9) 6.4 (1.6)Germany 9.4 (0.8) 2.6 (0.8) 2.5 (1.5) 2.6 (0.8) 6.7 (1.1) 6.9 (1.9) 6.8 (1.1)Greece 6.1 (0.6) 4.0 (1.8) 0.5 (0.4) 1.6 (0.7) 2.1 (2.0) 5.6 (0.7) 4.4 (0.9)Hungary 6.1 (0.7) 11.3 (4.7) 2.3 (2.7) 6.1 (2.7) -5.1 (4.7) 3.8 (2.7) -0.0 (2.7)Iceland 8.8 (0.6) c c 2.6 (2.7) 2.8 (2.6) c c 6.2 (3.0) c (2.9)Ireland 7.4 (0.6) 10.5 (5.6) 4.4 (1.5) 5.5 (1.6) -3.1 (5.6) 3.0 (1.5) 1.9 (1.7)Israel 7.8 (0.7) 8.5 (1.7) 4.9 (1.6) 7.2 (1.1) -0.7 (1.8) 2.9 (1.6) 0.6 (1.3)Italy 6.1 (0.3) 2.4 (1.5) 0.9 (0.6) 1.3 (0.5) 3.7 (1.6) 5.2 (0.6) 4.9 (0.6)Japan 13.5 (0.9) c c c c c c c c c c c cKorea 13.0 (1.1) c c m m c c c c m m c cLuxembourg 6.7 (0.7) 2.3 (0.5) 7.4 (1.0) 4.3 (0.5) 4.4 (0.7) -0.7 (1.2) 2.4 (0.8)Mexico 0.4 (0.1) 0.0 (0.1) 0.0 (0.0) 0.0 (0.0) 0.4 (0.1) 0.4 (0.1) 0.4 (0.1)Netherlands 10.8 (1.2) 3.1 (1.3) 5.7 (3.8) 3.8 (1.3) 7.6 (1.7) 5.1 (3.5) 7.0 (1.4)New Zealand 16.0 (1.0) 12.2 (2.3) 17.7 (1.7) 15.9 (1.3) 3.9 (2.6) -1.6 (1.8) 0.1 (1.6)Norway 8.8 (0.9) 4.5 (1.9) 2.8 (1.8) 3.7 (1.4) 4.3 (2.2) 6.0 (1.8) 5.1 (1.6)Poland 7.3 (0.6) m m c c c c m m c c m cPortugal 5.0 (0.5) 4.2 (2.6) 1.6 (1.0) 2.9 (1.4) 0.8 (2.4) 3.4 (1.1) 2.1 (1.2)Slovak Republic 4.5 (0.5) c c c c c c c c c c c cSlovenia 4.9 (0.6) 1.7 (0.9) 0.0 (0.0) 1.4 (0.7) 3.2 (1.0) 4.9 (0.6) 3.5 (0.9)Spain 3.6 (0.3) 2.2 (1.5) 0.9 (0.5) 1.1 (0.5) 1.4 (1.5) 2.7 (0.7) 2.6 (0.6)Sweden 10.0 (0.7) 3.1 (1.3) 2.8 (1.9) 3.0 (1.1) 6.9 (1.3) 7.2 (1.9) 7.0 (1.2)Switzerland 9.3 (0.8) 4.6 (1.0) 4.8 (1.5) 4.7 (0.9) 4.7 (1.0) 4.5 (1.4) 4.6 (0.8)Turkey 1.9 (0.4) c c c c c c c c c c c cUnited Kingdom 8.5 (0.5) 6.1 (2.0) 4.5 (1.7) 5.4 (1.4) 2.4 (2.0) 4.0 (1.8) 3.1 (1.4)United States 10.6 (1.0) 7.0 (1.5) 9.5 (2.1) 7.9 (1.4) 3.5 (1.8) 1.0 (1.9) 2.7 (1.5)OECD average 8.0 (0.1) 5.3 (0.4) 4.8 (0.4) 4.8 (0.3) 3.0 (0.4) 3.5 (0.4) 3.4 (0.3)
Part
ners Albania 0.2 (0.1) c c c c c c c c c c c c
Argentina 1.0 (0.2) 0.2 (0.6) 0.4 (1.4) 0.3 (0.8) 0.8 (0.7) 0.6 (1.4) 0.7 (0.9)Azerbaijan 0.0 (0.0) 0.0 (0.0) 0.0 (0.0) 0.0 (0.0) 0.0 (0.0) 0.0 (0.0) 0.0 (0.0)Brazil 1.4 (0.2) 0.1 (0.2) 0.0 (0.0) 0.0 (0.1) 1.3 (0.3) 1.4 (0.2) 1.3 (0.3)Bulgaria 2.9 (0.5) c c c c c c c c c c c cColombia 0.6 (0.2) c c c c 0.0 (0.0) c c c c c (0.2)Croatia 3.3 (0.5) 2.1 (1.0) 2.7 (1.7) 2.3 (0.9) 1.3 (1.1) 0.7 (1.6) 1.1 (0.9)Dubai (UAE) 0.4 (0.1) 4.3 (0.8) 9.5 (0.9) 7.6 (0.7) -4.0 (0.8) -9.1 (0.9) -7.2 (0.7)Hong Kong-China 12.7 (0.9) 14.8 (1.4) 8.0 (1.2) 12.1 (1.0) -2.1 (1.4) 4.7 (1.3) 0.6 (1.1)Indonesia 0.0 (0.0) m m c c c c m m c c m cJordan 0.2 (0.1) 0.3 (0.3) 0.6 (0.9) 0.4 (0.3) -0.1 (0.2) -0.4 (1.0) -0.1 (0.3)Kazakhstan 0.3 (0.1) 0.8 (0.9) 0.4 (0.7) 0.6 (0.6) -0.5 (0.9) -0.0 (0.7) -0.3 (0.7)Kyrgyzstan 0.1 (0.1) 0.3 (1.0) 0.0 (0.0) 0.2 (0.6) -0.2 (0.9) 0.1 (0.1) -0.1 (0.5)Latvia 2.9 (0.5) 3.4 (1.2) c c 3.5 (1.3) -0.5 (1.2) c c -0.6 (1.3)Liechtenstein 6.0 (2.0) 1.5 (3.0) 2.0 (2.5) 1.8 (1.8) 4.5 (3.6) 4.0 (3.5) 4.2 (2.8)Lithuania 3.1 (0.4) 0.9 (1.4) c c 1.5 (1.5) 2.2 (1.4) c c 1.6 (1.5)Macao-China 2.7 (0.5) 2.9 (0.3) 3.4 (0.7) 3.0 (0.3) -0.1 (0.6) -0.7 (0.8) -0.3 (0.5)Montenegro 0.6 (0.2) 0.5 (1.2) 0.9 (0.7) 0.7 (0.6) 0.1 (1.1) -0.2 (0.8) -0.1 (0.6)Panama 0.6 (0.3) 0.6 (1.1) 1.7 (2.2) 1.3 (1.5) 0.0 (1.1) -1.1 (2.2) -0.7 (1.5)Peru 0.5 (0.2) c c c c c c c c c c c cQatar 0.3 (0.1) 1.0 (0.3) 5.6 (0.6) 3.6 (0.4) -0.7 (0.4) -5.3 (0.6) -3.3 (0.4)Romania 0.7 (0.2) c c c c c c c c c c c cRussian Federation 3.4 (0.5) 1.3 (0.9) 2.1 (1.1) 1.7 (0.7) 2.1 (1.2) 1.3 (1.2) 1.8 (0.9)Serbia 0.8 (0.2) 2.4 (1.7) 0.3 (0.8) 1.5 (0.8) -1.7 (1.7) 0.4 (0.8) -0.7 (0.9)Shanghai-China 19.7 (1.1) c c c c c c c c c c c cSingapore 15.4 (0.6) 22.8 (4.2) 15.1 (2.2) 17.6 (1.7) -7.4 (4.2) 0.4 (2.4) -2.2 (1.8)Chinese Taipei 5.3 (0.9) c c c c c c c c c c c cThailand 0.3 (0.2) m m m m m m m m m m m mTrinidad and Tobago 2.3 (0.3) 6.6 (4.5) 6.9 (2.8) 6.7 (2.5) -4.3 (4.5) -4.6 (2.8) -4.4 (2.5)Tunisia 0.2 (0.1) c c c c c c c c c c c cUruguay 1.8 (0.3) c c c c c c c c c c c c
Note: Values that are statistically significant are indicated in bold (see Annex A).
Source: PISA 2009 Database.
Please refer to the Reader’s Guide for information concerning the symbols replacing missing data.

138 © OECD 2012 UNTAPPED SKILLS: REALISING THE POTENTIAL OF IMMIGRANT STUDENTS
ANNEX B: DATA TABLES ON IMMIGRANT STUDENTS
Table B2.1f Proportion of lowest performers in reading, by immigrant status% of lowest performing students (below Level 2) among…
Difference between non-immigrant
students and second-generation students
Difference between non-immigrant
students and first-generation students
Difference between non-
immigrant students and immigrant
students (first- and second-generation)
Non-immigrant students
Second-generation students
First-generation students
Immigrant students (first- and second-generation)
% S.E. % S.E. % S.E. % S.E. % dif. S.E. % dif. S.E. % dif. S.E.
OEC
D
Australia 13.8 (0.6) 10.9 (1.2) 15.0 (1.5) 12.9 (1.1) 2.9 (1.2) -1.2 (1.6) 0.9 (1.2)Austria 23.0 (1.2) 43.1 (3.8) 64.1 (6.0) 49.7 (3.6) -20.1 (3.9) -41.1 (6.1) -26.7 (3.8)Belgium 13.6 (0.8) 32.5 (2.7) 36.2 (3.8) 34.2 (2.6) -18.9 (2.7) -22.6 (3.7) -20.6 (2.5)Canada 9.1 (0.5) 9.9 (1.3) 13.4 (1.4) 11.4 (1.0) -0.7 (1.3) -4.2 (1.5) -2.3 (1.1)Chile 29.5 (1.5) c c c c c c c c c c c cCzech Republic 22.6 (1.3) 34.0 (7.6) 29.3 (8.2) 32.3 (6.1) -11.4 (7.6) -6.8 (8.2) -9.7 (6.2)Denmark 12.8 (0.9) 31.7 (2.1) 42.8 (3.9) 35.3 (2.0) -18.9 (2.2) -30.1 (3.8) -22.5 (2.1)Estonia 12.2 (0.9) 22.0 (3.5) 24.8 (8.5) 22.2 (3.3) -9.8 (3.3) -12.6 (8.5) -10.0 (3.1)Finland 7.5 (0.5) 17.6 (5.8) 38.7 (7.9) 29.3 (5.7) -10.1 (5.8) -31.2 (7.8) -21.9 (5.7)France 16.8 (1.3) 35.2 (4.0) 42.2 (7.1) 36.8 (3.9) -18.3 (4.2) -25.3 (7.2) -20.0 (4.1)Germany 14.0 (1.0) 29.8 (2.8) 34.5 (2.9) 31.4 (2.2) -15.8 (2.8) -20.5 (2.8) -17.4 (2.2)Greece 19.1 (1.8) 31.1 (4.9) 43.0 (6.8) 39.2 (4.8) -12.0 (4.8) -23.9 (6.6) -20.1 (4.5)Hungary 17.3 (1.4) 7.3 (5.3) 15.4 (5.4) 12.0 (4.0) 10.0 (5.3) 1.9 (5.3) 5.3 (3.9)Iceland 15.6 (0.6) c c 44.1 (6.9) 42.8 (6.0) c c -28.6 (6.9) -27.2 cIreland 14.7 (1.1) 11.4 (6.4) 30.8 (3.7) 27.4 (3.4) 3.3 (6.4) -16.1 (3.6) -12.7 (3.4)Israel 24.7 (1.1) 21.3 (2.2) 30.1 (3.6) 24.5 (2.2) 3.5 (2.1) -5.4 (3.5) 0.3 (2.1)Italy 19.2 (0.6) 34.1 (4.1) 50.5 (2.4) 46.6 (2.1) -14.9 (4.1) -31.3 (2.5) -27.4 (2.2)Japan 13.3 (1.1) c c c c c c c c c c c cKorea 5.5 (0.8) c c m m c c c c m m c cLuxembourg 17.4 (0.9) 37.2 (1.7) 38.1 (1.7) 37.6 (1.2) -19.8 (2.0) -20.7 (2.0) -20.2 (1.5)Mexico 38.2 (0.9) 76.9 (6.4) 85.7 (3.0) 82.2 (3.5) -38.6 (6.3) -47.5 (2.9) -44.0 (3.4)Netherlands 12.7 (1.5) 20.0 (3.8) 28.6 (5.7) 22.3 (3.8) -7.4 (4.0) -16.0 (5.5) -9.7 (3.9)New Zealand 12.5 (0.8) 21.5 (3.4) 15.3 (1.5) 17.3 (1.7) -9.0 (3.5) -2.8 (1.6) -4.8 (1.8)Norway 13.5 (0.8) 25.8 (5.0) 35.8 (5.2) 30.5 (4.0) -12.3 (4.9) -22.3 (5.1) -17.0 (3.9)Poland 14.3 (0.8) m m c c c c m m c c c mPortugal 16.7 (1.2) 18.0 (4.4) 31.6 (4.4) 24.8 (3.6) -1.3 (4.4) -14.9 (4.4) -8.2 (3.5)Slovak Republic 21.7 (1.2) c c c c c c c c c c c cSlovenia 19.5 (0.6) 32.7 (3.5) 45.0 (6.5) 34.9 (3.3) -13.3 (3.5) -25.5 (6.6) -15.4 (3.3)Spain 17.1 (0.8) 25.6 (5.3) 40.2 (2.7) 38.6 (2.6) -8.5 (5.3) -23.1 (2.4) -21.5 (2.4)Sweden 14.3 (0.9) 30.4 (3.0) 47.7 (5.2) 35.9 (2.9) -16.1 (3.1) -33.4 (5.3) -21.6 (3.0)Switzerland 12.6 (0.7) 26.3 (1.9) 33.9 (2.7) 29.0 (1.8) -13.7 (1.9) -21.3 (2.7) -16.4 (1.8)Turkey 23.8 (1.4) c c c c c c c c c c c cUnited Kingdom 16.7 (0.7) 19.7 (3.5) 28.8 (5.0) 23.8 (3.0) -3.0 (3.6) -12.0 (5.1) -7.1 (3.1)United States 16.0 (1.0) 19.5 (2.3) 23.2 (3.1) 20.7 (2.1) -3.5 (2.2) -7.2 (3.1) -4.7 (2.0)OECD average 16.8 (0.2) 26.9 (0.8) 36.0 (0.9) 31.6 (0.6) -10.3 (0.8) -19.5 (0.9) -15.1 (0.6)
Part
ners Albania 55.6 (1.9) c c c c c c c c c c c c
Argentina 50.5 (2.0) 66.8 (5.8) 65.4 (8.2) 66.2 (5.9) -16.3 (6.1) -14.9 (8.3) -15.7 (6.1)Azerbaijan 72.3 (1.7) 75.5 (6.3) 63.3 (11.0) 72.4 (6.3) -3.1 (6.2) 9.0 (11.1) -0.1 (6.2)Brazil 48.0 (1.3) 87.9 (6.9) 91.5 (8.8) 89.2 (5.3) -40.0 (7.0) -43.5 (9.0) -41.2 (5.5)Bulgaria 39.6 (2.6) c c c c c c c c c c c cColombia 46.1 (1.9) c c c c 89.8 (7.7) c c c c -43.7 cCroatia 21.5 (1.3) 24.7 (3.1) 31.5 (4.8) 26.9 (2.7) -3.1 (3.0) -9.9 (4.7) -5.4 (2.6)Dubai (UAE) 54.4 (1.3) 26.4 (1.4) 16.2 (0.7) 20.0 (0.6) 28.0 (2.0) 38.1 (1.6) 34.4 (1.5)Hong Kong-China 8.1 (0.9) 6.1 (0.8) 11.7 (2.0) 8.3 (1.0) 2.0 (1.1) -3.6 (2.2) -0.2 (1.3)Indonesia 53.0 (2.3) m m c c c c m m c c c mJordan 47.6 (1.6) 41.5 (3.2) 44.3 (4.8) 42.2 (2.9) 6.1 (2.8) 3.3 (4.9) 5.4 (2.7)Kazakhstan 58.9 (1.6) 49.1 (5.2) 68.7 (4.7) 56.5 (4.0) 9.8 (5.3) -9.8 (4.8) 2.4 (4.2)Kyrgyzstan 83.1 (1.2) 60.2 (7.8) 76.8 (10.2) 67.2 (7.1) 22.8 (7.6) 6.3 (10.2) 15.8 (7.0)Latvia 17.0 (1.2) 24.1 (5.9) c c 23.8 (5.3) -7.1 (5.7) c c -6.8 (5.1)Liechtenstein 12.5 (1.9) 17.6 (6.9) 24.6 (6.9) 21.5 (4.9) -5.2 (7.2) -12.1 (7.6) -9.0 (5.7)Lithuania 23.3 (1.2) 32.8 (6.9) c c 32.3 (6.4) -9.5 (7.0) c c -9.0 (6.6)Macao-China 16.9 (1.1) 13.6 (0.6) 13.3 (1.2) 13.6 (0.6) 3.3 (1.3) 3.6 (1.7) 3.4 (1.3)Montenegro 49.2 (1.0) 40.3 (6.2) 51.0 (5.0) 46.9 (3.9) 8.9 (6.3) -1.7 (4.8) 2.3 (3.8)Panama 61.7 (2.5) 52.5 (12.0) 74.0 (8.2) 66.3 (7.6) 9.2 (11.3) -12.3 (8.2) -4.6 (7.3)Peru 63.4 (1.7) c c c c c c c c c c c cQatar 79.2 (0.6) 55.9 (1.2) 32.3 (0.9) 42.5 (0.7) 23.3 (1.3) 46.9 (1.1) 36.7 (1.0)Romania 40.1 (2.0) c c c c c c c c c c c cRussian Federation 25.5 (1.3) 36.5 (5.0) 33.8 (4.1) 35.4 (3.6) -11.0 (5.2) -8.3 (4.0) -9.9 (3.7)Serbia 32.8 (1.3) 25.3 (3.8) 29.8 (4.2) 27.3 (3.1) 7.5 (4.0) 3.0 (4.3) 5.5 (3.2)Shanghai-China 3.8 (0.5) c c c c c c c c c c c cSingapore 12.1 (0.5) 9.6 (1.8) 13.5 (1.7) 12.2 (1.4) 2.5 (1.9) -1.4 (1.8) -0.1 (1.5)Chinese Taipei 15.0 (0.9) c c c c c c c c c c c cThailand 42.8 (1.5) m m m m m m m m m m m mTrinidad and Tobago 42.9 (0.7) 47.0 (8.3) 41.9 (6.7) 44.7 (5.1) -4.1 (8.3) 1.0 (6.7) -1.8 (5.1)Tunisia 50.0 (1.6) c c c c c c c c c c c cUruguay 41.4 (1.2) c c c c c c c c c c c c
Note: Values that are statistically significant are indicated in bold (see Annex A).
Source: PISA 2009 Database.
Please refer to the Reader’s Guide for information concerning the symbols replacing missing data.

139UNTAPPED SKILLS: REALISING THE POTENTIAL OF IMMIGRANT STUDENTS © OECD 2012
DATA TABLES ON IMMIGRANT STUDENTS: ANNEX B
Table B2.2aSocio-economic background, by immigrant statusResults based on students’ self-reports
PISA index of social, economic and cultural status
Non-immigrant students
Second-generation students
First-generation students
Immigrant students (first- and second-generation)
Difference between non-
immigrant students and
second-generation students
Difference between non-
immigrant students and
first-generation students
Difference between
second- and first-generation
students
Difference between non-
immigrant students and immigrant
students (first- and second-generation)
Mean S.E. Mean S.E. Mean S.E. Mean S.E. Dif. S.E. Dif. S.E. Dif. S.E. Dif. S.E.
OEC
D Australia 0.35 (0.01) 0.28 (0.04) 0.41 (0.03) 0.34 (0.03) 0.07 (0.04) -0.06 (0.03) -0.13 (0.04) 0.01 (0.03)Austria 0.17 (0.02) -0.50 (0.04) -0.68 (0.11) -0.55 (0.04) 0.67 (0.04) 0.85 (0.11) 0.18 (0.12) 0.73 (0.05)Belgium 0.28 (0.02) -0.32 (0.07) -0.23 (0.07) -0.27 (0.06) 0.60 (0.07) 0.51 (0.07) -0.09 (0.08) 0.56 (0.06)Canada 0.53 (0.01) 0.34 (0.04) 0.57 (0.04) 0.44 (0.04) 0.18 (0.04) -0.04 (0.04) -0.23 (0.05) 0.08 (0.04)Chile -0.57 (0.04) c c c c c c c c c c c c c cCzech Republic -0.08 (0.01) -0.32 (0.13) -0.01 (0.13) -0.21 (0.10) 0.24 (0.13) -0.07 (0.13) -0.31 (0.19) 0.13 (0.10)Denmark 0.36 (0.03) -0.42 (0.05) -0.33 (0.07) -0.39 (0.04) 0.78 (0.05) 0.69 (0.07) -0.09 (0.08) 0.75 (0.04)Estonia 0.16 (0.02) 0.10 (0.06) 0.19 (0.20) 0.10 (0.06) 0.06 (0.06) -0.02 (0.20) -0.09 (0.21) 0.06 (0.06)Finland 0.38 (0.02) 0.26 (0.13) -0.10 (0.18) 0.06 (0.12) 0.12 (0.13) 0.48 (0.18) 0.35 (0.21) 0.32 (0.12)France -0.05 (0.03) -0.65 (0.06) -0.68 (0.15) -0.66 (0.06) 0.60 (0.06) 0.63 (0.15) 0.03 (0.16) 0.60 (0.05)Germany 0.32 (0.02) -0.46 (0.04) -0.30 (0.06) -0.40 (0.04) 0.78 (0.05) 0.62 (0.06) -0.15 (0.07) 0.72 (0.04)Greece 0.04 (0.03) -0.35 (0.09) -0.78 (0.06) -0.64 (0.05) 0.39 (0.09) 0.82 (0.07) 0.43 (0.11) 0.68 (0.06)Hungary -0.19 (0.03) 0.05 (0.16) -0.33 (0.12) -0.17 (0.10) -0.24 (0.16) 0.14 (0.13) 0.38 (0.20) -0.03 (0.11)Iceland 0.74 (0.02) c c -0.17 (0.11) -0.08 (0.10) c c 0.91 (0.11) c c 0.81 (0.11)Ireland 0.04 (0.03) 0.10 (0.15) 0.14 (0.06) 0.13 (0.06) -0.05 (0.15) -0.10 (0.06) -0.05 (0.15) -0.09 (0.06)Israel 0.04 (0.02) -0.21 (0.07) -0.41 (0.07) -0.28 (0.06) 0.25 (0.07) 0.45 (0.07) 0.20 (0.08) 0.32 (0.06)Italy -0.09 (0.01) -0.56 (0.09) -0.77 (0.06) -0.72 (0.05) 0.47 (0.09) 0.68 (0.06) 0.21 (0.10) 0.63 (0.05)Japan -0.01 (0.01) c c c c c c c c c c c c c cKorea -0.15 (0.03) c c m m c c c c m m c c c cLuxembourg 0.55 (0.01) -0.46 (0.03) -0.18 (0.04) -0.35 (0.02) 1.02 (0.04) 0.74 (0.05) -0.28 (0.06) 0.91 (0.03)Mexico -1.19 (0.03) -1.71 (0.13) -1.80 (0.11) -1.77 (0.09) 0.52 (0.13) 0.61 (0.10) 0.09 (0.16) 0.57 (0.08)Netherlands 0.38 (0.02) -0.47 (0.06) -0.43 (0.14) -0.46 (0.07) 0.84 (0.06) 0.80 (0.14) -0.04 (0.13) 0.83 (0.07)New Zealand 0.08 (0.02) -0.15 (0.06) 0.23 (0.03) 0.11 (0.03) 0.23 (0.06) -0.15 (0.03) -0.37 (0.06) -0.03 (0.03)Norway 0.51 (0.02) 0.08 (0.08) -0.17 (0.08) -0.03 (0.06) 0.43 (0.08) 0.68 (0.08) 0.25 (0.12) 0.54 (0.06)Poland -0.28 (0.02) m m c c c c m m c c m m c cPortugal -0.31 (0.04) -0.42 (0.11) -0.33 (0.08) -0.37 (0.07) 0.10 (0.11) 0.02 (0.09) -0.08 (0.12) 0.06 (0.08)Slovak Republic -0.09 (0.02) c c c c c c c c c c c c c cSlovenia 0.12 (0.01) -0.46 (0.05) -0.65 (0.11) -0.50 (0.04) 0.59 (0.05) 0.77 (0.11) 0.18 (0.12) 0.62 (0.05)Spain -0.27 (0.03) -0.49 (0.11) -0.77 (0.05) -0.74 (0.05) 0.22 (0.10) 0.50 (0.06) 0.28 (0.12) 0.47 (0.05)Sweden 0.40 (0.02) -0.05 (0.05) -0.39 (0.12) -0.16 (0.05) 0.44 (0.05) 0.78 (0.12) 0.34 (0.12) 0.55 (0.05)Switzerland 0.21 (0.02) -0.39 (0.05) -0.27 (0.08) -0.35 (0.05) 0.61 (0.04) 0.49 (0.08) -0.12 (0.08) 0.56 (0.04)Turkey -1.16 (0.05) c c c c c c c c c c c c c cUnited Kingdom 0.23 (0.02) 0.14 (0.12) -0.07 (0.09) 0.04 (0.09) 0.09 (0.12) 0.30 (0.09) 0.21 (0.11) 0.18 (0.09)United States 0.31 (0.04) -0.38 (0.08) -0.41 (0.10) -0.39 (0.08) 0.69 (0.07) 0.72 (0.10) 0.03 (0.08) 0.70 (0.07)OECD average 0.05 (0.00) -0.27 (0.02) -0.31 (0.02) -0.30 (0.01) 0.40 (0.02) 0.45 (0.02) 0.04 (0.02) 0.44 (0.01)
Part
ners Albania -0.95 (0.04) c c c c c c c c c c c c c c
Argentina -0.60 (0.05) -1.23 (0.10) -1.09 (0.15) -1.17 (0.10) 0.64 (0.11) 0.49 (0.14) -0.15 (0.15) 0.58 (0.10)Azerbaijan -0.64 (0.03) -0.70 (0.19) -0.14 (0.14) -0.56 (0.16) 0.06 (0.19) -0.50 (0.14) -0.56 (0.23) -0.08 (0.16)Brazil -1.15 (0.03) -1.25 (0.26) -1.50 (0.40) -1.34 (0.23) 0.10 (0.26) 0.35 (0.40) 0.25 (0.46) 0.18 (0.24)Bulgaria -0.10 (0.04) c c c c c c c c c c c c c cColombia -1.14 (0.05) c c c c -1.91 (0.26) c c c c c c 0.77 (0.26)Croatia -0.15 (0.02) -0.33 (0.07) -0.57 (0.06) -0.40 (0.05) 0.18 (0.07) 0.42 (0.06) 0.24 (0.08) 0.26 (0.05)Dubai (UAE) 0.25 (0.02) 0.30 (0.02) 0.61 (0.01) 0.50 (0.01) -0.04 (0.03) -0.36 (0.03) -0.32 (0.03) -0.24 (0.03)Hong Kong-China -0.53 (0.05) -1.11 (0.03) -1.38 (0.04) -1.22 (0.03) 0.58 (0.04) 0.85 (0.06) 0.27 (0.05) 0.69 (0.05)Indonesia -1.55 (0.06) m m c c c c m m c c m m c cJordan -0.60 (0.03) -0.37 (0.07) -0.10 (0.09) -0.31 (0.07) -0.23 (0.07) -0.51 (0.08) -0.28 (0.10) -0.30 (0.06)Kazakhstan -0.49 (0.03) -0.56 (0.08) -0.76 (0.09) -0.63 (0.07) 0.06 (0.08) 0.27 (0.09) 0.20 (0.09) 0.14 (0.07)Kyrgyzstan -0.65 (0.02) -0.53 (0.18) -0.66 (0.27) -0.59 (0.18) -0.11 (0.18) 0.01 (0.26) 0.12 (0.27) -0.06 (0.18)Latvia -0.13 (0.03) -0.11 (0.11) c c -0.07 (0.10) -0.02 (0.11) c c c c -0.06 (0.10)Liechtenstein 0.25 (0.05) -0.33 (0.14) -0.25 (0.14) -0.28 (0.10) 0.57 (0.15) 0.50 (0.14) -0.08 (0.21) 0.53 (0.10)Lithuania -0.04 (0.02) -0.13 (0.14) c c -0.11 (0.12) 0.09 (0.14) c c c c 0.07 (0.12)Macao-China -0.44 (0.02) -0.83 (0.02) -0.75 (0.03) -0.81 (0.01) 0.39 (0.03) 0.31 (0.04) -0.08 (0.03) 0.38 (0.03)Montenegro -0.25 (0.02) 0.09 (0.10) -0.23 (0.08) -0.11 (0.07) -0.34 (0.10) -0.02 (0.08) 0.32 (0.11) -0.14 (0.07)Panama -0.81 (0.08) -0.39 (0.14) -0.91 (0.22) -0.72 (0.17) -0.41 (0.15) 0.10 (0.23) 0.51 (0.26) -0.08 (0.18)Peru -1.30 (0.05) c c c c c c c c c c c c c cQatar 0.51 (0.01) 0.31 (0.02) 0.66 (0.01) 0.51 (0.01) 0.20 (0.03) -0.15 (0.02) -0.36 (0.03) 0.00 (0.02)Romania -0.36 (0.03) c c c c c c c c c c c c c cRussian Federation -0.19 (0.02) -0.34 (0.05) -0.31 (0.07) -0.33 (0.04) 0.15 (0.05) 0.11 (0.07) -0.03 (0.08) 0.13 (0.04)Serbia 0.08 (0.02) 0.08 (0.07) -0.15 (0.07) -0.03 (0.05) 0.00 (0.07) 0.24 (0.06) 0.23 (0.09) 0.11 (0.05)Shanghai-China -0.49 (0.03) c c c c c c c c c c c c c cSingapore -0.46 (0.01) -0.38 (0.06) -0.19 (0.03) -0.25 (0.03) -0.07 (0.06) -0.27 (0.04) -0.20 (0.07) -0.20 (0.03)Chinese Taipei -0.32 (0.02) c c c c c c c c c c c c c cThailand -1.31 (0.04) m m m m m m m m m m m m m mTrinidad and Tobago -0.58 (0.02) -0.40 (0.14) 0.05 (0.15) -0.20 (0.11) -0.18 (0.14) -0.64 (0.16) -0.46 (0.20) -0.38 (0.11)Tunisia -1.20 (0.05) c c c c c c c c c c c c c cUruguay -0.70 (0.03) c c c c c c c c c c c c c c
Note: Values that are statistically significant are indicated in bold (see Annex A).
Source: PISA 2009 Database.
Please refer to the Reader’s Guide for information concerning the symbols replacing missing data.

140 © OECD 2012 UNTAPPED SKILLS: REALISING THE POTENTIAL OF IMMIGRANT STUDENTS
ANNEX B: DATA TABLES ON IMMIGRANT STUDENTS
Table B2.2bHighest parental education, by immigrant statusResults based on students’ self-reports
Highest parental education (years)
Non-immigrant students
Second-generation students
First-generation students
Immigrant students (first- and second-generation)
Difference between non-
immigrant students and
second-generation students
Difference between non-
immigrant students and
first-generation students
Difference between
second- and first-generation
students
Difference between non-
immigrant students and immigrant
students (first- and second-generation)
Mean S.E. Mean S.E. Mean S.E. Mean S.E. Dif. S.E. Dif. S.E. Dif. S.E. Dif. S.E.
OEC
D Australia 13.3 (0.0) 13.3 (0.1) 13.8 (0.1) 13.5 (0.1) -0.0 (0.1) 0.5 (0.1) 0.6 (0.1) 0.3 (0.1)Austria 13.9 (0.0) 12.7 (0.1) 12.0 (0.3) 12.5 (0.1) -1.2 (0.1) -1.9 (0.3) -0.6 (0.4) -1.4 (0.1)Belgium 14.4 (0.0) 12.9 (0.3) 13.4 (0.2) 13.1 (0.2) -1.5 (0.3) -1.1 (0.2) 0.5 (0.3) -1.3 (0.2)Canada 14.9 (0.0) 14.5 (0.1) 15.6 (0.1) 15.0 (0.1) -0.4 (0.1) 0.6 (0.1) 1.1 (0.1) 0.0 (0.1)Chile 12.5 (0.1) c c c c c c c c c c c c c cCzech Republic 13.5 (0.0) 13.2 (0.4) 13.9 (0.3) 13.4 (0.3) -0.3 (0.4) 0.4 (0.3) 0.7 (0.5) -0.1 (0.3)Denmark 14.3 (0.1) 12.5 (0.2) 13.5 (0.2) 12.8 (0.1) -1.8 (0.2) -0.8 (0.2) 1.0 (0.3) -1.5 (0.1)Estonia 13.9 (0.0) 14.3 (0.1) 14.4 (0.5) 14.3 (0.1) 0.4 (0.1) 0.4 (0.5) 0.0 (0.6) 0.4 (0.1)Finland 14.9 (0.0) 14.8 (0.4) 13.9 (0.5) 14.3 (0.4) -0.0 (0.4) -0.9 (0.5) -0.9 (0.6) -0.5 (0.4)France 13.1 (0.1) 11.3 (0.2) 11.6 (0.4) 11.4 (0.2) -1.8 (0.2) -1.4 (0.4) 0.4 (0.5) -1.7 (0.2)Germany 14.5 (0.1) 12.6 (0.2) 13.9 (0.3) 13.0 (0.2) -2.0 (0.3) -0.7 (0.3) 1.3 (0.4) -1.6 (0.2)Greece 13.7 (0.1) 13.9 (0.3) 13.1 (0.3) 13.3 (0.2) 0.2 (0.3) -0.6 (0.3) -0.8 (0.4) -0.3 (0.2)Hungary 12.9 (0.1) 13.7 (0.4) 13.0 (0.4) 13.3 (0.3) 0.8 (0.4) 0.1 (0.4) -0.7 (0.5) 0.4 (0.3)Iceland 15.6 (0.0) c c 14.8 (0.4) 14.9 (0.4) c c -0.8 (0.4) c c -0.7 (0.4)Ireland 13.2 (0.1) 13.0 (0.4) 14.1 (0.2) 13.9 (0.2) -0.2 (0.4) 0.9 (0.2) 1.1 (0.4) 0.7 (0.2)Israel 13.4 (0.1) 13.1 (0.2) 13.1 (0.2) 13.1 (0.2) -0.4 (0.2) -0.3 (0.2) 0.1 (0.3) -0.3 (0.2)Italy 12.9 (0.0) 12.7 (0.3) 12.9 (0.3) 12.8 (0.2) -0.2 (0.3) -0.0 (0.2) 0.2 (0.4) -0.1 (0.2)Japan 14.1 (0.0) c c c c c c c c c c c c c cKorea 13.7 (0.1) c c m m c c c c m m c c c cLuxembourg 14.7 (0.1) 11.3 (0.1) 12.7 (0.2) 11.8 (0.1) -3.4 (0.1) -2.0 (0.2) 1.4 (0.2) -2.8 (0.1)Mexico 10.9 (0.1) 9.5 (0.5) 9.3 (0.4) 9.4 (0.3) -1.3 (0.5) -1.6 (0.3) -0.2 (0.6) -1.5 (0.3)Netherlands 14.2 (0.1) 11.8 (0.3) 11.9 (0.5) 11.9 (0.3) -2.4 (0.2) -2.3 (0.5) 0.1 (0.5) -2.4 (0.2)New Zealand 12.9 (0.0) 13.0 (0.1) 13.7 (0.1) 13.5 (0.1) 0.1 (0.1) 0.8 (0.1) 0.7 (0.1) 0.6 (0.1)Norway 14.0 (0.0) 13.3 (0.2) 13.1 (0.3) 13.2 (0.2) -0.7 (0.2) -0.9 (0.3) -0.2 (0.4) -0.8 (0.2)Poland 12.2 (0.1) m m c c c c m m c c m m c cPortugal 10.8 (0.1) 11.8 (0.3) 13.0 (0.4) 12.4 (0.2) 1.1 (0.3) 2.2 (0.3) 1.1 (0.5) 1.6 (0.2)Slovak Republic 13.3 (0.1) c c c c c c c c c c c c c cSlovenia 13.0 (0.0) 11.8 (0.1) 12.0 (0.3) 11.8 (0.1) -1.2 (0.1) -1.0 (0.3) 0.2 (0.4) -1.1 (0.1)Spain 12.1 (0.1) 12.0 (0.4) 12.0 (0.2) 12.0 (0.2) -0.1 (0.4) -0.0 (0.2) 0.0 (0.4) -0.0 (0.2)Sweden 13.9 (0.0) 13.3 (0.2) 12.2 (0.4) 12.9 (0.2) -0.7 (0.2) -1.8 (0.4) -1.1 (0.4) -1.0 (0.2)Switzerland 14.3 (0.1) 12.6 (0.2) 13.4 (0.3) 12.9 (0.2) -1.7 (0.2) -0.9 (0.3) 0.7 (0.3) -1.4 (0.2)Turkey 8.8 (0.1) c c c c c c c c c c c c c cUnited Kingdom 14.2 (0.0) 13.9 (0.3) 13.9 (0.3) 13.9 (0.3) -0.3 (0.3) -0.3 (0.3) -0.0 (0.3) -0.3 (0.3)United States 14.1 (0.1) 11.9 (0.3) 12.2 (0.3) 12.0 (0.3) -2.1 (0.3) -1.9 (0.3) 0.3 (0.3) -2.0 (0.2)OECD average 13.4 (0.0) 12.8 (0.1) 13.1 (0.1) 12.9 (0.0) -0.8 (0.1) -0.5 (0.1) 0.3 (0.1) -0.7 (0.0)
Part
ners Albania 12.2 (0.1) c c c c c c c c c c c c c c
Argentina 12.5 (0.2) 10.7 (0.5) 11.4 (0.6) 11.0 (0.4) -1.8 (0.5) -1.1 (0.6) 0.8 (0.8) -1.5 (0.4)Azerbaijan 13.9 (0.1) 13.9 (0.4) 14.9 (0.4) 14.1 (0.3) -0.0 (0.4) 1.0 (0.4) 1.0 (0.5) 0.2 (0.3)Brazil 10.2 (0.1) 10.4 (1.4) 11.0 (1.9) 10.6 (1.2) 0.2 (1.5) 0.8 (2.0) 0.6 (2.3) 0.4 (1.2)Bulgaria 13.8 (0.1) c c c c c c c c c c c c c cColombia 10.7 (0.1) c c c c 9.3 (0.8) c c c c c c -1.4 (0.8)Croatia 13.6 (0.1) 13.1 (0.2) 12.8 (0.2) 13.0 (0.1) -0.5 (0.2) -0.8 (0.2) -0.4 (0.3) -0.6 (0.2)Dubai (UAE) 12.5 (0.1) 14.4 (0.1) 15.3 (0.0) 15.0 (0.0) 1.9 (0.1) 2.8 (0.1) 0.9 (0.1) 2.5 (0.1)Hong Kong-China 11.5 (0.1) 10.0 (0.1) 9.7 (0.1) 9.9 (0.1) -1.5 (0.1) -1.9 (0.2) -0.4 (0.2) -1.7 (0.1)Indonesia 9.9 (0.2) m m c c c c m m c c m m c cJordan 12.9 (0.1) 13.6 (0.2) 14.3 (0.2) 13.8 (0.2) 0.7 (0.2) 1.4 (0.2) 0.7 (0.3) 0.9 (0.1)Kazakhstan 14.2 (0.0) 14.0 (0.1) 13.9 (0.2) 14.0 (0.1) -0.2 (0.1) -0.3 (0.2) -0.1 (0.2) -0.3 (0.1)Kyrgyzstan 13.2 (0.0) 12.9 (0.3) 13.3 (0.4) 13.1 (0.3) -0.4 (0.3) 0.1 (0.4) 0.5 (0.5) -0.2 (0.3)Latvia 13.7 (0.1) 13.9 (0.3) c c 14.0 (0.2) 0.1 (0.3) c c 1.3 (0.5) 0.3 (0.2)Liechtenstein 13.5 (0.2) 12.1 (0.5) 12.4 (0.6) 12.2 (0.4) -1.5 (0.5) -1.2 (0.6) 0.3 (0.8) -1.3 (0.4)Lithuania 13.5 (0.0) 13.5 (0.3) c c 13.6 (0.3) -0.0 (0.3) c c 1.1 (1.0) 0.1 (0.3)Macao-China 10.7 (0.1) 9.9 (0.1) 10.3 (0.1) 10.0 (0.1) -0.8 (0.1) -0.4 (0.1) 0.4 (0.1) -0.7 (0.1)Montenegro 12.7 (0.0) 13.2 (0.3) 13.2 (0.3) 13.2 (0.2) 0.5 (0.3) 0.5 (0.3) 0.0 (0.4) 0.5 (0.2)Panama 12.7 (0.2) 12.1 (0.5) 13.6 (0.5) 13.1 (0.3) -0.6 (0.5) 0.9 (0.5) 1.5 (0.7) 0.4 (0.4)Peru 11.5 (0.1) c c c c c c c c c c c c c cQatar 13.5 (0.0) 13.7 (0.1) 15.1 (0.0) 14.5 (0.0) 0.2 (0.1) 1.6 (0.1) 1.4 (0.1) 1.0 (0.1)Romania 13.2 (0.1) c c c c c c c c c c c c c cRussian Federation 13.3 (0.0) 13.1 (0.1) 13.1 (0.2) 13.1 (0.1) -0.1 (0.1) -0.1 (0.2) 0.0 (0.2) -0.1 (0.1)Serbia 13.3 (0.1) 13.7 (0.2) 13.1 (0.2) 13.4 (0.2) 0.4 (0.2) -0.2 (0.2) -0.5 (0.3) 0.1 (0.2)Shanghai-China 12.6 (0.1) c c c c c c c c c c c c c cSingapore 10.9 (0.0) 10.9 (0.1) 11.7 (0.1) 11.4 (0.1) 0.1 (0.1) 0.8 (0.1) 0.7 (0.2) 0.6 (0.1)Chinese Taipei 12.7 (0.1) c c c c c c c c c c c c c cThailand 9.7 (0.1) m m m m m m m m m m m m m mTrinidad and Tobago 12.4 (0.1) 12.8 (0.5) 14.0 (0.5) 13.3 (0.4) 0.4 (0.5) 1.6 (0.5) 1.1 (0.6) 0.9 (0.4)Tunisia 10.6 (0.2) c c c c c c c c c c c c c cUruguay 11.0 (0.1) c c c c c c c c c c c c c c
Note: Values that are statistically significant are indicated in bold (see Annex A).
Source: PISA 2009 Database.
Please refer to the Reader’s Guide for information concerning the symbols replacing missing data.

141UNTAPPED SKILLS: REALISING THE POTENTIAL OF IMMIGRANT STUDENTS © OECD 2012
DATA TABLES ON IMMIGRANT STUDENTS: ANNEX B
Table B2.2cNumber of books in the home, by immigrant statusResults based on students’ self-reports
Number of books in the home
Non-immigrant students
Second-generation students
First-generation students
Immigrant students (first- and second-generation)
Difference between non-
immigrant students and
second-generation students
Difference between non-
immigrant students and
first-generation students
Difference between
second- and first-generation
students
Difference between non-
immigrant students and immigrant
students (first- and second-generation)
Mean S.E. Mean S.E. Mean S.E. Mean S.E. Dif. S.E. Dif. S.E. Dif. S.E. Dif. S.E.
OEC
D Australia 180.0 (2.4) 154.8 (6.6) 144.8 (5.9) 150.0 (5.4) -25.2 (6.7) -35.2 (5.9) -10.0 (6.4) -30.0 (5.5)Austria 158.1 (3.5) 62.1 (4.7) 72.4 (10.4) 65.3 (4.8) -96.0 (5.7) -85.7 (11.3) 10.3 (10.9) -92.8 (6.0)Belgium 141.4 (2.4) 95.3 (7.5) 91.9 (7.3) 93.7 (5.7) -46.0 (7.3) -49.5 (7.3) -3.4 (9.4) -47.6 (5.7)Canada 167.8 (2.1) 127.7 (4.5) 124.1 (6.7) 126.1 (4.3) -40.1 (5.0) -43.8 (6.8) -3.6 (7.1) -41.7 (4.7)Chile 73.2 (2.2) c c c c c c c c c c c c c cCzech Republic 142.7 (2.6) 109.6 (20.7) 66.8 (12.2) 93.9 (14.1) -33.1 (21.4) -75.9 (12.3) -42.8 (24.0) -48.8 (14.8)Denmark 141.8 (3.4) 79.4 (5.8) 76.2 (9.4) 78.4 (5.0) -62.4 (5.9) -65.6 (10.3) -3.2 (11.0) -63.4 (5.6)Estonia 168.4 (3.2) 162.0 (9.6) 160.3 (32.4) 161.9 (8.7) -6.4 (9.4) -8.2 (32.3) -1.7 (35.6) -6.6 (8.4)Finland 162.2 (3.0) 132.3 (21.0) 115.8 (19.5) 123.1 (15.5) -29.9 (21.0) -46.4 (19.9) -16.5 (26.6) -39.1 (15.7)France 140.6 (5.4) 75.1 (6.3) 65.7 (11.1) 72.8 (5.9) -65.5 (6.4) -74.9 (11.9) -9.4 (11.8) -67.8 (6.3)Germany 172.7 (3.6) 87.8 (6.5) 89.3 (8.6) 88.3 (5.6) -84.8 (6.7) -83.4 (9.4) 1.5 (9.8) -84.3 (6.2)Greece 136.7 (3.9) 99.7 (15.3) 50.2 (4.9) 66.4 (6.7) -37.0 (15.5) -86.5 (6.6) -49.5 (16.1) -70.3 (7.7)Hungary 184.6 (4.6) 180.6 (29.0) 160.2 (25.1) 168.9 (18.9) -4.0 (29.3) -24.4 (24.5) -20.4 (38.3) -15.7 (18.6)Iceland 188.2 (3.1) c c 79.5 (13.1) 96.9 (13.9) c c -108.7 (13.2) c c -91.3 (14.3)Ireland 142.9 (4.1) 160.0 (26.4) 116.5 (10.3) 124.2 (9.8) 17.2 (26.5) -26.4 (10.3) -43.5 (28.7) -18.7 (9.8)Israel 156.0 (5.5) 131.7 (9.1) 95.3 (9.0) 118.4 (7.9) -24.4 (7.9) -60.7 (9.1) -36.4 (9.4) -37.6 (7.0)Italy 139.7 (1.9) 92.4 (8.1) 51.8 (3.7) 61.4 (3.7) -47.3 (8.1) -87.9 (3.9) -40.6 (8.8) -78.3 (3.7)Japan 149.4 (2.9) c c c c c c c c c c c c c cKorea 180.4 (4.5) c c m m c c c c m m c c c cLuxembourg 229.1 (3.3) 117.3 (4.2) 128.3 (4.9) 121.7 (2.9) -111.8 (5.4) -100.8 (6.4) 11.0 (7.0) -107.4 (4.7)Mexico 49.9 (1.4) 48.5 (7.5) 32.0 (6.9) 38.5 (5.2) -1.4 (7.3) -18.0 (6.1) -16.6 (9.9) -11.4 (4.5)Netherlands 142.2 (4.9) 56.4 (5.0) 74.0 (15.4) 61.1 (5.5) -85.8 (6.9) -68.2 (14.2) 17.6 (16.1) -81.1 (6.2)New Zealand 167.0 (3.2) 124.9 (8.7) 152.0 (5.8) 143.2 (5.3) -42.1 (8.7) -15.0 (7.0) 27.1 (9.7) -23.9 (6.2)Norway 183.1 (3.2) 108.3 (14.1) 90.5 (10.7) 100.0 (9.3) -74.8 (14.4) -92.6 (11.1) -17.8 (16.9) -83.1 (9.7)Poland 125.9 (3.4) m m c c c c m m c c m m c cPortugal 111.6 (3.4) 96.4 (11.7) 76.5 (9.9) 86.4 (7.7) -15.1 (11.9) -35.1 (10.7) -19.9 (14.6) -25.2 (8.3)Slovak Republic 115.8 (3.0) c c c c c c c c c c c c c cSlovenia 121.7 (2.0) 56.2 (6.0) 49.4 (12.8) 55.0 (5.5) -65.5 (6.1) -72.3 (12.8) -6.8 (14.0) -66.7 (5.6)Spain 168.0 (3.2) 107.2 (12.8) 55.4 (3.1) 61.2 (3.1) -60.8 (12.8) -112.6 (4.2) -51.8 (13.4) -106.7 (4.0)Sweden 197.7 (3.2) 102.8 (6.7) 81.6 (12.2) 96.0 (5.6) -94.9 (7.2) -116.1 (11.9) -21.2 (14.6) -101.7 (5.8)Switzerland 155.8 (3.4) 83.4 (4.7) 97.8 (8.0) 88.6 (3.5) -72.4 (5.3) -58.0 (9.1) 14.4 (10.5) -67.2 (4.8)Turkey 79.7 (3.5) c c c c c c c c c c c c c cUnited Kingdom 145.0 (2.9) 122.0 (10.8) 100.5 (10.7) 112.3 (8.0) -23.1 (10.3) -44.5 (11.0) -21.4 (15.0) -32.7 (7.7)United States 133.3 (5.0) 68.0 (5.2) 68.4 (7.7) 68.1 (5.1) -65.3 (6.7) -65.0 (9.2) 0.4 (7.4) -65.2 (6.8)OECD average 148.6 (0.6) 105.3 (2.4) 91.7 (2.3) 97.2 (1.5) -48.1 (2.4) -62.9 (2.4) -13.1 (3.3) -57.4 (1.6)
Part
ners Albania 51.9 (2.9) c c c c c c c c c c c c c c
Argentina 73.6 (3.8) 53.2 (9.3) 52.8 (18.9) 53.1 (10.6) -20.4 (10.2) -20.9 (19.4) -0.5 (18.7) -20.6 (11.4)Azerbaijan 62.5 (2.4) 42.5 (8.6) 69.5 (21.8) 49.0 (9.6) -20.1 (8.4) 6.9 (22.4) 27.0 (21.0) -13.5 (9.7)Brazil 40.8 (1.2) 34.1 (14.9) 19.7 (4.5) 29.1 (10.0) -6.7 (15.0) -21.1 (4.4) -14.4 (15.6) -11.7 (10.1)Bulgaria 121.2 (4.7) c c c c c c c c c c c c c cColombia 44.3 (1.7) c c c c c c c c c c c c c cCroatia 85.0 (2.5) 74.1 (6.0) 43.4 (5.5) 64.1 (4.5) -10.9 (6.4) -41.7 (5.5) -30.8 (8.0) -21.0 (4.8)Dubai (UAE) 105.9 (4.2) 101.0 (4.5) 124.4 (2.9) 115.8 (2.2) -4.8 (6.6) 18.5 (4.6) 23.4 (5.8) 9.9 (4.6)Hong Kong-China 110.3 (5.2) 71.3 (3.3) 48.7 (2.7) 62.4 (2.6) -39.0 (5.3) -61.6 (4.9) -22.6 (3.7) -47.9 (4.8)Indonesia 54.6 (2.1) m m c c c c m m c c m m c cJordan 66.6 (2.1) 75.7 (5.5) 80.6 (11.8) 76.8 (5.0) 9.1 (5.5) 14.0 (12.2) 4.9 (13.2) 10.3 (5.2)Kazakhstan 92.0 (4.2) 102.5 (9.5) 63.0 (10.2) 87.6 (8.8) 10.4 (9.2) -29.1 (10.4) -39.5 (10.7) -4.4 (8.7)Kyrgyzstan 55.2 (2.5) 124.4 (21.5) 54.2 (14.6) 94.3 (13.8) 69.2 (20.9) -1.0 (14.5) -70.2 (26.7) 39.1 (13.1)Latvia 141.8 (3.4) 160.0 (17.4) c c 161.9 (16.5) 18.2 (17.2) c c 21.2 (35.5) 20.1 (16.3)Liechtenstein 176.7 (9.8) 125.9 (19.6) 169.7 (22.6) 150.2 (15.0) -50.9 (21.8) -7.0 (24.4) 43.9 (30.9) -26.5 (17.6)Lithuania 112.3 (2.6) 123.5 (18.5) c c 122.8 (18.4) 11.2 (18.8) c c -7.7 (77.0) 10.5 (18.6)Macao-China 71.5 (2.4) 59.3 (1.6) 59.8 (3.1) 59.4 (1.2) -12.2 (3.0) -11.7 (3.6) 0.5 (3.9) -12.1 (2.7)Montenegro 115.1 (2.4) 159.6 (15.8) 88.6 (9.8) 115.8 (8.3) 44.5 (16.4) -26.6 (10.0) -71.0 (20.1) 0.6 (8.8)Panama 51.6 (3.9) 47.0 (8.6) 64.0 (12.3) 57.9 (8.9) -4.6 (8.9) 12.4 (13.1) 17.0 (14.7) 6.3 (9.4)Peru 49.5 (2.0) c c c c c c c c c c c c c cQatar 132.0 (2.3) 130.2 (3.8) 123.3 (2.9) 126.3 (2.3) -1.8 (4.1) -8.7 (4.0) -6.8 (4.8) -5.7 (3.3)Romania 100.1 (4.2) c c c c c c c c c c c c c cRussian Federation 143.4 (3.3) 113.6 (10.7) 105.8 (8.6) 110.5 (7.2) -29.8 (10.9) -37.6 (8.6) -7.9 (14.0) -32.9 (7.3)Serbia 89.1 (2.1) 88.6 (7.0) 63.4 (7.8) 77.2 (5.5) -0.5 (7.5) -25.8 (8.0) -25.2 (10.4) -11.9 (5.8)Shanghai-China 113.7 (3.1) c c c c c c c c c c c c c cSingapore 121.9 (2.0) 119.7 (9.3) 123.7 (6.0) 122.3 (5.4) -2.2 (10.1) 1.7 (6.6) 3.9 (10.5) 0.4 (6.2)Chinese Taipei 134.8 (3.3) c c c c c c c c c c c c c cThailand 65.4 (2.0) m m m m m m m m m m m m m mTrinidad and Tobago 141.3 (2.6) 189.0 (25.5) 144.8 (20.3) 169.1 (17.5) 47.7 (25.9) 3.5 (20.2) -44.2 (30.5) 27.8 (17.8)Tunisia 40.4 (2.1) c c c c c c c c c c c c c cUruguay 74.5 (2.0) c c c c c c c c c c c c c c
Note: Values that are statistically significant are indicated in bold (see Annex A).
Source: PISA 2009 Database.
Please refer to the Reader’s Guide for information concerning the symbols replacing missing data.

142 © OECD 2012 UNTAPPED SKILLS: REALISING THE POTENTIAL OF IMMIGRANT STUDENTS
ANNEX B: DATA TABLES ON IMMIGRANT STUDENTS
Table B2.2dHighest parental occupational status. by immigrant statusResults based on students’ self-reports
Highest parental occupational status
Non-immigrant students
Second-generation students
First-generation students
Immigrant students (first- and second-generation)
Difference between non-
immigrant students and
second-generation students
Difference between non-
immigrant students and
first-generation students
Difference between
second- and first-generation
students
Difference between non-
immigrant students and immigrant
students (first- and second-generation)
Mean S.E. Mean S.E. Mean S.E. Mean S.E. Dif. S.E. Dif. S.E. Dif. S.E. Dif. S.E.
OEC
D Australia 53.3 (0.2) 51.7 (0.8) 55.3 (0.7) 53.4 (0.6) -1.6 (0.8) 2.1 (0.7) 3.6 (0.9) 0.2 (0.6)Austria 49.7 (0.4) 40.1 (0.7) 41.2 (1.6) 40.4 (0.7) -9.7 (0.8) -8.6 (1.6) 1.1 (1.7) -9.4 (0.8)Belgium 51.3 (0.3) 42.4 (1.1) 44.1 (1.2) 43.2 (1.0) -8.9 (1.1) -7.3 (1.2) 1.7 (1.2) -8.1 (1.0)Canada 53.8 (0.2) 49.2 (0.6) 55.2 (0.8) 51.8 (0.6) -4.6 (0.6) 1.4 (0.8) 6.0 (0.9) -2.0 (0.6)Chile 43.1 (0.5) c c c c c c c c c c c c c cCzech Republic 48.1 (0.3) 44.5 (1.9) 51.8 (2.6) 47.3 (1.6) -3.6 (1.9) 3.7 (2.6) 7.3 (3.1) -0.8 (1.6)Denmark 51.7 (0.5) 42.4 (0.8) 42.4 (1.4) 42.4 (0.8) -9.2 (0.8) -9.3 (1.5) -0.0 (1.4) -9.2 (0.8)Estonia 50.4 (0.4) 47.3 (1.3) c c 47.8 (1.3) -3.1 (1.3) c c 5.6 (3.7) -2.7 (1.3)Finland 53.1 (0.4) 52.3 (2.5) 48.1 (2.0) 50.0 (1.6) -0.8 (2.5) -5.0 (2.1) -4.2 (3.2) -3.1 (1.6)France 48.0 (0.6) 39.2 (1.1) 40.3 (2.3) 39.5 (1.0) -8.8 (1.0) -7.7 (2.2) 1.1 (2.4) -8.5 (0.9)Germany 50.7 (0.4) 40.6 (0.7) 41.8 (1.1) 41.0 (0.6) -10.2 (0.8) -8.9 (1.0) 1.2 (1.2) -9.7 (0.6)Greece 50.1 (0.6) 41.7 (1.6) 33.5 (1.0) 36.2 (1.0) -8.3 (1.6) -16.5 (1.2) -8.2 (1.9) -13.8 (1.1)Hungary 47.7 (0.4) 51.9 (2.9) 42.6 (2.0) 46.7 (1.7) 4.1 (2.8) -5.1 (2.0) -9.2 (3.4) -1.1 (1.7)Iceland 56.3 (0.3) c c 39.5 (1.9) 41.6 (1.7) c c -16.7 (1.9) c c -14.7 (1.7)Ireland 49.8 (0.5) 53.0 (3.1) 52.1 (1.3) 52.2 (1.2) 3.2 (3.1) 2.3 (1.3) -1.0 (3.2) 2.5 (1.2)Israel 53.8 (0.4) 51.3 (1.1) 46.8 (1.1) 49.7 (0.9) -2.6 (1.0) -7.0 (1.2) -4.5 (1.4) -4.1 (0.8)Italy 47.5 (0.2) 40.8 (1.4) 35.1 (0.6) 36.4 (0.6) -6.7 (1.4) -12.4 (0.6) -5.7 (1.5) -11.1 (0.6)Japan 51.5 (0.3) c c c c c c c c c c c c c cKorea 50.1 (0.4) c c m m c c c c m m c c c cLuxembourg 52.1 (0.3) 39.7 (0.5) 45.6 (0.7) 42.0 (0.4) -12.5 (0.6) -6.6 (0.8) 5.9 (0.9) -10.1 (0.5)Mexico 41.6 (0.4) 34.1 (1.2) 35.9 (1.2) 35.2 (0.9) -7.4 (1.2) -5.7 (1.1) 1.8 (1.6) -6.4 (0.9)Netherlands 52.6 (0.4) 42.3 (1.1) 43.2 (2.2) 42.5 (1.1) -10.3 (1.1) -9.4 (2.2) 0.9 (2.2) -10.1 (1.1)New Zealand 52.0 (0.3) 48.0 (1.2) 55.1 (0.6) 52.8 (0.7) -4.0 (1.2) 3.1 (0.7) 7.1 (1.1) 0.9 (0.7)Norway 55.8 (0.4) 49.9 (1.4) 48.9 (1.7) 49.4 (1.1) -5.9 (1.4) -6.9 (1.6) -1.0 (2.2) -6.4 (1.1)Poland 44.7 (0.4) m m c c c c m m c c m m c cPortugal 44.4 (0.5) 41.0 (1.5) 40.9 (1.2) 41.0 (0.9) -3.3 (1.5) -3.4 (1.3) -0.1 (2.0) -3.4 (1.0)Slovak Republic 45.7 (0.4) c c c c c c c c c c c c c cSlovenia 51.0 (0.3) 43.0 (1.0) 37.6 (2.1) 42.0 (0.9) -8.0 (1.0) -13.5 (2.1) -5.5 (2.2) -9.0 (1.0)Spain 46.6 (0.5) 44.1 (2.0) 38.5 (0.8) 39.1 (0.7) -2.5 (1.8) -8.1 (0.9) -5.6 (2.1) -7.5 (0.8)Sweden 52.9 (0.4) 46.7 (1.0) 47.8 (2.0) 47.0 (0.9) -6.2 (1.1) -5.1 (2.0) 1.1 (2.1) -5.9 (1.0)Switzerland 52.7 (0.4) 43.2 (0.7) 45.1 (1.2) 43.9 (0.7) -9.5 (0.6) -7.6 (1.2) 2.0 (1.2) -8.8 (0.6)Turkey 41.3 (0.5) c c c c c c c c c c c c c cUnited Kingdom 49.9 (0.3) 50.0 (2.0) 48.9 (1.4) 49.5 (1.6) 0.1 (2.0) -1.0 (1.4) -1.1 (1.7) -0.4 (1.5)United States 53.9 (0.5) 44.8 (1.0) 43.7 (1.5) 44.5 (1.0) -9.1 (1.0) -10.2 (1.4) -1.1 (1.3) -9.4 (1.0)OECD average 49.9 (0.1) 45.0 (0.3) 44.5 (0.3) 44.6 (0.2) -5.5 (0.3) -6.3 (0.3) -0.0 (0.4) -6.2 (0.2)
Part
ners Albania 43.6 (0.5) c c c c c c c c c c c c c c
Argentina 44.8 (0.7) 35.1 (1.6) 35.3 (2.2) 35.2 (1.4) -9.7 (1.7) -9.5 (2.3) 0.2 (2.5) -9.7 (1.6)Azerbaijan 46.8 (0.5) 47.6 (2.5) 54.3 (3.0) 49.3 (2.1) 0.7 (2.5) 7.4 (3.1) 6.7 (4.1) 2.5 (2.1)Brazil 42.7 (0.4) 38.0 (2.6) 32.9 (4.2) 36.5 (2.5) -4.7 (2.6) -9.9 (4.1) -5.1 (4.2) -6.3 (2.5)Bulgaria 48.4 (0.6) c c c c c c c c c c c c c cColombia 41.7 (0.6) c c c c c c c c c c c c c cCroatia 47.7 (0.4) 44.8 (1.0) 40.7 (1.1) 43.5 (0.8) -2.9 (1.0) -7.0 (1.1) -4.1 (1.2) -4.2 (0.9)Dubai (UAE) 62.7 (0.4) 61.1 (0.4) 64.3 (0.3) 63.1 (0.2) -1.6 (0.6) 1.6 (0.5) 3.2 (0.5) 0.4 (0.5)Hong Kong-China 48.8 (0.6) 40.4 (0.4) 39.0 (0.6) 39.8 (0.4) -8.5 (0.6) -9.8 (0.8) -1.3 (0.7) -9.0 (0.6)Indonesia 37.1 (0.6) m m c c c c m m c c m m c cJordan 48.1 (0.4) 49.8 (1.2) 52.7 (1.6) 50.5 (1.1) 1.7 (1.2) 4.6 (1.6) 2.9 (1.8) 2.4 (1.0)Kazakhstan 48.0 (0.5) 45.7 (1.2) 45.4 (1.7) 45.6 (1.1) -2.3 (1.2) -2.6 (1.6) -0.4 (1.7) -2.4 (1.1)Kyrgyzstan 47.4 (0.5) 44.3 (2.8) c c 45.3 (3.1) -3.1 (2.7) c c 2.4 (4.4) -2.1 (3.0)Latvia 47.5 (0.5) 46.4 (1.5) c c 47.0 (1.6) -1.1 (1.5) c c 7.4 (6.0) -0.5 (1.5)Liechtenstein 53.4 (1.0) 45.5 (2.9) 47.6 (2.4) 46.7 (1.9) -7.9 (2.8) -5.8 (2.5) 2.1 (3.7) -6.7 (1.9)Lithuania 49.6 (0.4) 48.2 (2.5) c c 48.3 (2.4) -1.5 (2.5) c c 1.3 (8.3) -1.4 (2.4)Macao-China 48.3 (0.3) 42.6 (0.2) 44.6 (0.5) 43.0 (0.2) -5.7 (0.4) -3.6 (0.6) 2.0 (0.5) -5.2 (0.4)Montenegro 47.3 (0.3) 52.8 (1.7) 48.0 (1.3) 49.8 (1.2) 5.5 (1.7) 0.7 (1.4) -4.8 (1.8) 2.5 (1.2)Panama 46.5 (1.1) 51.7 (1.5) 42.1 (3.4) 45.9 (2.7) 5.3 (2.0) -4.4 (3.5) -9.6 (3.6) -0.6 (3.0)Peru 40.8 (0.6) c c c c c c c c c c c c c cQatar 59.4 (0.2) 58.5 (0.4) 64.3 (0.3) 61.9 (0.2) -0.9 (0.4) 5.0 (0.3) 5.9 (0.5) 2.6 (0.3)Romania 44.0 (0.6) c c c c c c c c c c c c c cRussian Federation 50.4 (0.4) 47.4 (1.0) 47.3 (1.3) 47.4 (0.7) -3.0 (1.0) -3.1 (1.3) -0.1 (1.7) -3.0 (0.7)Serbia 48.3 (0.4) 47.5 (0.9) 44.6 (0.9) 46.2 (0.6) -0.8 (0.9) -3.7 (0.9) -2.8 (1.3) -2.1 (0.6)Shanghai-China 49.6 (0.4) c c c c c c c c c c c c c cSingapore 53.6 (0.2) 54.4 (1.0) 59.3 (0.7) 57.7 (0.6) 0.8 (1.0) 5.7 (0.8) 4.9 (1.3) 4.0 (0.6)Chinese Taipei 47.2 (0.3) c c c c c c c c c c c c c cThailand 37.2 (0.5) m m m m m m m m m m m m m mTrinidad and Tobago 45.5 (0.3) 46.5 (2.4) 56.0 (2.7) 50.5 (1.9) 1.0 (2.4) 10.5 (2.8) 9.5 (3.3) 5.0 (1.9)Tunisia 37.0 (0.6) c c c c c c c c c c c c c cUruguay 44.4 (0.4) c c c c c c c c c c c c c c
Note: Values that are statistically significant are indicated in bold (see Annex A).
Source: PISA 2009 Database.
Please refer to the Reader’s Guide for information concerning the symbols replacing missing data.

143UNTAPPED SKILLS: REALISING THE POTENTIAL OF IMMIGRANT STUDENTS © OECD 2012
DATA TABLES ON IMMIGRANT STUDENTS: ANNEX B
Table B2.2eCultural possessions, by immigrant statusResults based on students’ self-reports
Cultural possessions
Non-immigrant students
Second-generation students
First-generation students
Immigrant students (first- and second-generation)
Difference between non-
immigrant students and
second-generation students
Difference between non-
immigrant students and
first-generation students
Difference between
second- and first-generation
students
Difference between non-
immigrant students and immigrant
students (first- and second-generation)
Mean S.E. Mean S.E. Mean S.E. Mean S.E. Dif. S.E. Dif. S.E. Dif. S.E. Dif. S.E.
OEC
D Australia -0.10 (0.02) -0.13 (0.04) -0.11 (0.03) -0.12 (0.03) -0.02 (0.04) -0.00 (0.03) 0.02 (0.05) -0.01 (0.03)Austria -0.12 (0.02) -0.54 (0.04) -0.39 (0.06) -0.50 (0.03) -0.43 (0.04) -0.27 (0.07) 0.16 (0.07) -0.38 (0.04)Belgium -0.24 (0.02) -0.53 (0.05) -0.45 (0.06) -0.49 (0.04) -0.29 (0.06) -0.21 (0.06) 0.08 (0.06) -0.25 (0.05)Canada -0.13 (0.01) -0.11 (0.04) -0.05 (0.03) -0.09 (0.03) 0.02 (0.04) 0.07 (0.03) 0.06 (0.05) 0.04 (0.03)Chile 0.01 (0.02) c c c c c c c c c c c c c cCzech Republic -0.40 (0.02) -0.68 (0.10) -0.58 (0.13) -0.64 (0.08) -0.28 (0.11) -0.18 (0.14) 0.10 (0.17) -0.24 (0.09)Denmark -0.32 (0.03) -0.92 (0.04) -0.99 (0.07) -0.94 (0.04) -0.60 (0.05) -0.67 (0.07) -0.07 (0.08) -0.62 (0.04)Estonia 0.31 (0.02) 0.41 (0.04) 0.27 (0.15) 0.40 (0.04) 0.10 (0.04) -0.05 (0.15) -0.14 (0.15) 0.08 (0.04)Finland 0.17 (0.02) -0.06 (0.14) -0.06 (0.14) -0.06 (0.09) -0.22 (0.14) -0.23 (0.14) -0.01 (0.21) -0.23 (0.10)France -0.23 (0.03) -0.42 (0.06) -0.40 (0.10) -0.41 (0.06) -0.19 (0.07) -0.17 (0.10) 0.02 (0.11) -0.19 (0.06)Germany -0.04 (0.02) -0.38 (0.04) -0.32 (0.06) -0.36 (0.03) -0.34 (0.05) -0.28 (0.06) 0.06 (0.07) -0.32 (0.04)Greece 0.44 (0.02) 0.16 (0.08) -0.01 (0.07) 0.05 (0.06) -0.28 (0.08) -0.45 (0.08) -0.17 (0.11) -0.39 (0.06)Hungary 0.22 (0.03) 0.37 (0.15) 0.32 (0.18) 0.34 (0.11) 0.14 (0.15) 0.09 (0.18) -0.05 (0.26) 0.12 (0.12)Iceland 0.40 (0.01) c c -0.38 (0.11) -0.38 (0.10) c c -0.78 (0.11) c c -0.78 (0.10)Ireland -0.43 (0.02) -0.30 (0.13) -0.37 (0.05) -0.36 (0.05) 0.13 (0.13) 0.06 (0.05) -0.07 (0.13) 0.07 (0.05)Israel -0.03 (0.02) -0.24 (0.06) -0.44 (0.07) -0.31 (0.05) -0.22 (0.05) -0.41 (0.07) -0.20 (0.08) -0.29 (0.05)Italy -0.01 (0.01) -0.38 (0.06) -0.53 (0.04) -0.49 (0.03) -0.37 (0.06) -0.52 (0.04) -0.14 (0.08) -0.48 (0.03)Japan -0.35 (0.02) c c c c c c c c c c c c c cKorea 0.52 (0.02) c c m m c c c c m m c c c cLuxembourg 0.37 (0.02) -0.13 (0.03) -0.02 (0.04) -0.09 (0.02) -0.50 (0.04) -0.39 (0.04) 0.11 (0.05) -0.45 (0.03)Mexico -0.21 (0.01) -0.31 (0.09) -0.39 (0.06) -0.36 (0.05) -0.10 (0.09) -0.19 (0.06) -0.09 (0.10) -0.16 (0.05)Netherlands -0.26 (0.03) -0.70 (0.05) -0.61 (0.09) -0.67 (0.04) -0.43 (0.05) -0.35 (0.09) 0.09 (0.12) -0.41 (0.04)New Zealand -0.34 (0.02) -0.63 (0.06) -0.37 (0.04) -0.45 (0.03) -0.28 (0.07) -0.02 (0.05) 0.26 (0.08) -0.10 (0.04)Norway 0.25 (0.02) -0.18 (0.08) -0.34 (0.07) -0.25 (0.05) -0.43 (0.09) -0.59 (0.07) -0.16 (0.12) -0.50 (0.06)Poland 0.14 (0.02) m m c c c c m m c c m m c cPortugal 0.18 (0.02) 0.15 (0.12) -0.22 (0.08) -0.03 (0.07) -0.03 (0.12) -0.40 (0.09) -0.37 (0.13) -0.21 (0.07)Slovak Republic 0.41 (0.02) c c c c c c c c c c c c c cSlovenia 0.33 (0.01) -0.29 (0.06) -0.37 (0.10) -0.30 (0.05) -0.61 (0.06) -0.69 (0.09) -0.08 (0.11) -0.63 (0.05)Spain 0.24 (0.02) -0.21 (0.10) -0.27 (0.03) -0.26 (0.03) -0.45 (0.09) -0.51 (0.04) -0.06 (0.10) -0.50 (0.03)Sweden 0.33 (0.02) -0.13 (0.06) -0.21 (0.09) -0.16 (0.05) -0.46 (0.06) -0.53 (0.09) -0.07 (0.11) -0.48 (0.05)Switzerland -0.28 (0.02) -0.45 (0.03) -0.35 (0.08) -0.41 (0.04) -0.17 (0.03) -0.07 (0.08) 0.10 (0.08) -0.14 (0.04)Turkey 0.52 (0.02) c c c c c c c c c c c c c cUnited Kingdom -0.20 (0.02) -0.17 (0.10) -0.27 (0.05) -0.21 (0.06) 0.04 (0.09) -0.07 (0.05) -0.10 (0.10) -0.01 (0.06)United States -0.25 (0.03) -0.48 (0.05) -0.47 (0.06) -0.48 (0.04) -0.23 (0.05) -0.22 (0.07) 0.01 (0.07) -0.22 (0.05)OECD average 0.03 (0.00) -0.27 (0.02) -0.30 (0.02) -0.29 (0.01) -0.24 (0.02) -0.29 (0.02) -0.03 (0.02) -0.27 (0.01)
Part
ners Albania 0.12 (0.03) c c c c c c c c c c c c c c
Argentina 0.03 (0.03) -0.21 (0.09) -0.17 (0.12) -0.19 (0.08) -0.24 (0.10) -0.20 (0.12) 0.04 (0.15) -0.22 (0.08)Azerbaijan -0.62 (0.02) -0.73 (0.12) -0.65 (0.10) -0.71 (0.09) -0.10 (0.12) -0.03 (0.10) 0.07 (0.15) -0.08 (0.09)Brazil -0.35 (0.01) -0.46 (0.14) -0.16 (0.21) -0.36 (0.13) -0.11 (0.14) 0.19 (0.21) 0.30 (0.24) -0.01 (0.13)Bulgaria 0.24 (0.03) c c c c c c c c c c c c c cColombia 0.07 (0.02) c c c c c c c c c c c c c cCroatia -0.36 (0.02) -0.51 (0.06) -0.76 (0.06) -0.59 (0.05) -0.15 (0.06) -0.41 (0.07) -0.25 (0.07) -0.24 (0.05)Dubai (UAE) -0.19 (0.02) -0.03 (0.03) 0.16 (0.02) 0.09 (0.02) 0.16 (0.04) 0.35 (0.03) 0.19 (0.03) 0.28 (0.03)Hong Kong-China 0.02 (0.03) -0.14 (0.03) -0.32 (0.05) -0.21 (0.03) -0.16 (0.04) -0.34 (0.06) -0.18 (0.06) -0.23 (0.04)Indonesia -0.10 (0.02) m m c c c c m m c c m m c cJordan -0.45 (0.02) -0.48 (0.05) -0.33 (0.06) -0.45 (0.04) -0.03 (0.05) 0.12 (0.06) 0.15 (0.08) 0.00 (0.04)Kazakhstan 0.55 (0.02) 0.51 (0.06) 0.51 (0.09) 0.51 (0.06) -0.04 (0.05) -0.05 (0.09) -0.01 (0.08) -0.04 (0.06)Kyrgyzstan 0.29 (0.02) 0.28 (0.12) -0.04 (0.22) 0.14 (0.13) -0.01 (0.12) -0.33 (0.22) -0.32 (0.22) -0.15 (0.13)Latvia -0.19 (0.02) 0.02 (0.09) c c 0.01 (0.08) 0.20 (0.09) c c -0.08 (0.22) 0.20 (0.09)Liechtenstein 0.04 (0.07) -0.20 (0.15) -0.04 (0.14) -0.11 (0.10) -0.24 (0.16) -0.07 (0.16) 0.16 (0.20) -0.14 (0.13)Lithuania 0.01 (0.02) -0.27 (0.15) c c -0.30 (0.14) -0.28 (0.15) c c -0.33 (0.34) -0.31 (0.14)Macao-China 0.39 (0.02) 0.33 (0.02) 0.42 (0.03) 0.35 (0.01) -0.06 (0.03) 0.03 (0.03) 0.09 (0.03) -0.04 (0.02)Montenegro 0.30 (0.02) 0.27 (0.11) 0.18 (0.08) 0.21 (0.07) -0.04 (0.11) -0.12 (0.09) -0.09 (0.12) -0.09 (0.08)Panama -0.01 (0.04) -0.29 (0.10) 0.07 (0.13) -0.06 (0.09) -0.28 (0.10) 0.08 (0.13) 0.36 (0.17) -0.06 (0.09)Peru 0.12 (0.02) c c c c c c c c c c c c c cQatar -0.01 (0.01) -0.13 (0.02) -0.10 (0.02) -0.11 (0.01) -0.12 (0.03) -0.08 (0.02) 0.04 (0.03) -0.10 (0.02)Romania 0.28 (0.02) c c c c c c c c c c c c c cRussian Federation 0.17 (0.02) -0.07 (0.06) 0.06 (0.08) -0.02 (0.05) -0.23 (0.06) -0.11 (0.09) 0.12 (0.09) -0.18 (0.06)Serbia 0.87 (0.02) 0.83 (0.06) 0.65 (0.07) 0.75 (0.05) -0.04 (0.06) -0.22 (0.07) -0.18 (0.09) -0.12 (0.05)Shanghai-China 0.33 (0.02) c c c c c c c c c c c c c cSingapore -0.46 (0.01) -0.32 (0.07) -0.17 (0.05) -0.22 (0.04) 0.15 (0.07) 0.30 (0.06) 0.15 (0.08) 0.25 (0.05)Chinese Taipei -0.25 (0.02) c c c c c c c c c c c c c cThailand 0.48 (0.02) m m m m m m m m m m m m m mTrinidad and Tobago 0.20 (0.01) 0.17 (0.10) 0.03 (0.10) 0.10 (0.08) -0.03 (0.10) -0.17 (0.11) -0.14 (0.14) -0.10 (0.08)
Tunisia 0.40 (0.02) c c c c c c c c c c c c c cUruguay -0.04 (0.02) c c c c c c c c c c c c c c
Note: Values that are statistically significant are indicated in bold (see Annex A).
Source: PISA 2009 Database.
Please refer to the Reader’s Guide for information concerning the symbols replacing missing data.
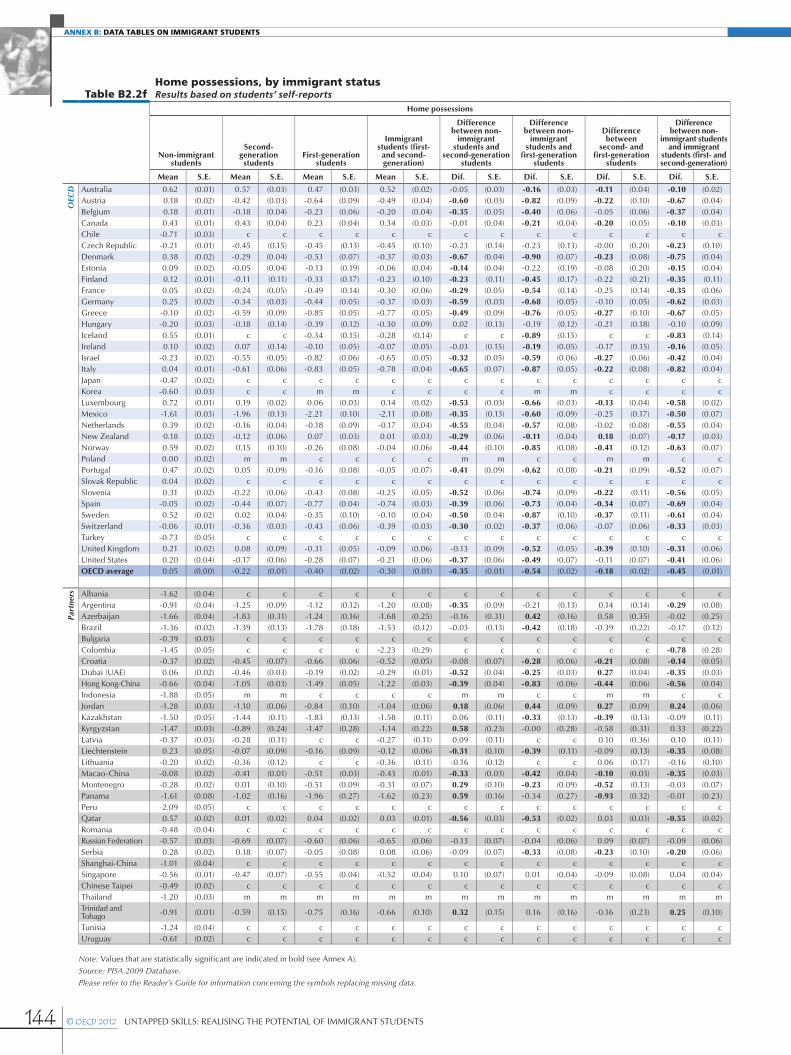
144 © OECD 2012 UNTAPPED SKILLS: REALISING THE POTENTIAL OF IMMIGRANT STUDENTS
ANNEX B: DATA TABLES ON IMMIGRANT STUDENTS
Table B2.2fHome possessions, by immigrant statusResults based on students’ self-reports
Home possessions
Non-immigrant students
Second-generation students
First-generation students
Immigrant students (first- and second-generation)
Difference between non-
immigrant students and
second-generation students
Difference between non-
immigrant students and
first-generation students
Difference between
second- and first-generation
students
Difference between non-
immigrant students and immigrant
students (first- and second-generation)
Mean S.E. Mean S.E. Mean S.E. Mean S.E. Dif. S.E. Dif. S.E. Dif. S.E. Dif. S.E.
OEC
D Australia 0.62 (0.01) 0.57 (0.03) 0.47 (0.03) 0.52 (0.02) -0.05 (0.03) -0.16 (0.03) -0.11 (0.04) -0.10 (0.02)Austria 0.18 (0.02) -0.42 (0.03) -0.64 (0.09) -0.49 (0.04) -0.60 (0.03) -0.82 (0.09) -0.22 (0.10) -0.67 (0.04)Belgium 0.18 (0.01) -0.18 (0.04) -0.23 (0.06) -0.20 (0.04) -0.35 (0.05) -0.40 (0.06) -0.05 (0.06) -0.37 (0.04)Canada 0.43 (0.01) 0.43 (0.04) 0.23 (0.04) 0.34 (0.03) -0.01 (0.04) -0.21 (0.04) -0.20 (0.05) -0.10 (0.03)Chile -0.71 (0.03) c c c c c c c c c c c c c cCzech Republic -0.21 (0.01) -0.45 (0.15) -0.45 (0.13) -0.45 (0.10) -0.23 (0.14) -0.23 (0.13) -0.00 (0.20) -0.23 (0.10)Denmark 0.38 (0.02) -0.29 (0.04) -0.53 (0.07) -0.37 (0.03) -0.67 (0.04) -0.90 (0.07) -0.23 (0.08) -0.75 (0.04)Estonia 0.09 (0.02) -0.05 (0.04) -0.13 (0.19) -0.06 (0.04) -0.14 (0.04) -0.22 (0.19) -0.08 (0.20) -0.15 (0.04)Finland 0.12 (0.01) -0.11 (0.11) -0.33 (0.17) -0.23 (0.10) -0.23 (0.11) -0.45 (0.17) -0.22 (0.21) -0.35 (0.11)France 0.05 (0.02) -0.24 (0.05) -0.49 (0.14) -0.30 (0.06) -0.29 (0.05) -0.54 (0.14) -0.25 (0.14) -0.35 (0.06)Germany 0.25 (0.02) -0.34 (0.03) -0.44 (0.05) -0.37 (0.03) -0.59 (0.03) -0.68 (0.05) -0.10 (0.05) -0.62 (0.03)Greece -0.10 (0.02) -0.59 (0.09) -0.85 (0.05) -0.77 (0.05) -0.49 (0.09) -0.76 (0.05) -0.27 (0.10) -0.67 (0.05)Hungary -0.20 (0.03) -0.18 (0.14) -0.39 (0.12) -0.30 (0.09) 0.02 (0.13) -0.19 (0.12) -0.21 (0.18) -0.10 (0.09)Iceland 0.55 (0.01) c c -0.34 (0.15) -0.28 (0.14) c c -0.89 (0.15) c c -0.83 (0.14)Ireland 0.10 (0.02) 0.07 (0.14) -0.10 (0.05) -0.07 (0.05) -0.03 (0.15) -0.19 (0.05) -0.17 (0.15) -0.16 (0.05)Israel -0.23 (0.02) -0.55 (0.05) -0.82 (0.06) -0.65 (0.05) -0.32 (0.05) -0.59 (0.06) -0.27 (0.06) -0.42 (0.04)Italy 0.04 (0.01) -0.61 (0.06) -0.83 (0.05) -0.78 (0.04) -0.65 (0.07) -0.87 (0.05) -0.22 (0.08) -0.82 (0.04)Japan -0.47 (0.02) c c c c c c c c c c c c c cKorea -0.60 (0.03) c c m m c c c c m m c c c cLuxembourg 0.72 (0.01) 0.19 (0.02) 0.06 (0.03) 0.14 (0.02) -0.53 (0.03) -0.66 (0.03) -0.13 (0.04) -0.58 (0.02)Mexico -1.61 (0.03) -1.96 (0.13) -2.21 (0.10) -2.11 (0.08) -0.35 (0.13) -0.60 (0.09) -0.25 (0.17) -0.50 (0.07)Netherlands 0.39 (0.02) -0.16 (0.04) -0.18 (0.09) -0.17 (0.04) -0.55 (0.04) -0.57 (0.08) -0.02 (0.08) -0.55 (0.04)New Zealand 0.18 (0.02) -0.12 (0.06) 0.07 (0.03) 0.01 (0.03) -0.29 (0.06) -0.11 (0.04) 0.18 (0.07) -0.17 (0.03)Norway 0.59 (0.02) 0.15 (0.10) -0.26 (0.08) -0.04 (0.06) -0.44 (0.10) -0.85 (0.08) -0.41 (0.12) -0.63 (0.07)Poland 0.00 (0.02) m m c c c c m m c c m m c cPortugal 0.47 (0.02) 0.05 (0.09) -0.16 (0.08) -0.05 (0.07) -0.41 (0.09) -0.62 (0.08) -0.21 (0.09) -0.52 (0.07)Slovak Republic 0.04 (0.02) c c c c c c c c c c c c c cSlovenia 0.31 (0.02) -0.22 (0.06) -0.43 (0.08) -0.25 (0.05) -0.52 (0.06) -0.74 (0.09) -0.22 (0.11) -0.56 (0.05)Spain -0.05 (0.02) -0.44 (0.07) -0.77 (0.04) -0.74 (0.03) -0.39 (0.06) -0.73 (0.04) -0.34 (0.07) -0.69 (0.04)Sweden 0.52 (0.02) 0.02 (0.04) -0.35 (0.10) -0.10 (0.04) -0.50 (0.04) -0.87 (0.10) -0.37 (0.11) -0.61 (0.04)Switzerland -0.06 (0.01) -0.36 (0.03) -0.43 (0.06) -0.39 (0.03) -0.30 (0.02) -0.37 (0.06) -0.07 (0.06) -0.33 (0.03)Turkey -0.73 (0.05) c c c c c c c c c c c c c cUnited Kingdom 0.21 (0.02) 0.08 (0.09) -0.31 (0.05) -0.09 (0.06) -0.13 (0.09) -0.52 (0.05) -0.39 (0.10) -0.31 (0.06)United States 0.20 (0.04) -0.17 (0.06) -0.28 (0.07) -0.21 (0.06) -0.37 (0.06) -0.49 (0.07) -0.11 (0.07) -0.41 (0.06)OECD average 0.05 (0.00) -0.22 (0.01) -0.40 (0.02) -0.30 (0.01) -0.35 (0.01) -0.54 (0.02) -0.18 (0.02) -0.45 (0.01)
Part
ners Albania -1.62 (0.04) c c c c c c c c c c c c c c
Argentina -0.91 (0.04) -1.25 (0.09) -1.12 (0.12) -1.20 (0.08) -0.35 (0.09) -0.21 (0.13) 0.14 (0.14) -0.29 (0.08)Azerbaijan -1.66 (0.04) -1.83 (0.31) -1.24 (0.16) -1.68 (0.25) -0.16 (0.31) 0.42 (0.16) 0.58 (0.35) -0.02 (0.25)Brazil -1.36 (0.02) -1.39 (0.13) -1.78 (0.18) -1.53 (0.12) -0.03 (0.13) -0.42 (0.18) -0.39 (0.22) -0.17 (0.12)Bulgaria -0.39 (0.03) c c c c c c c c c c c c c cColombia -1.45 (0.05) c c c c -2.23 (0.29) c c c c c c -0.78 (0.28)Croatia -0.37 (0.02) -0.45 (0.07) -0.66 (0.06) -0.52 (0.05) -0.08 (0.07) -0.28 (0.06) -0.21 (0.08) -0.14 (0.05)Dubai (UAE) 0.06 (0.02) -0.46 (0.03) -0.19 (0.02) -0.29 (0.01) -0.52 (0.04) -0.25 (0.03) 0.27 (0.04) -0.35 (0.03)Hong Kong-China -0.66 (0.04) -1.05 (0.03) -1.49 (0.05) -1.22 (0.03) -0.39 (0.04) -0.83 (0.06) -0.44 (0.06) -0.56 (0.04)Indonesia -1.88 (0.05) m m c c c c m m c c m m c cJordan -1.28 (0.03) -1.10 (0.06) -0.84 (0.10) -1.04 (0.06) 0.18 (0.06) 0.44 (0.09) 0.27 (0.09) 0.24 (0.06)Kazakhstan -1.50 (0.05) -1.44 (0.11) -1.83 (0.13) -1.58 (0.11) 0.06 (0.11) -0.33 (0.13) -0.39 (0.13) -0.09 (0.11)Kyrgyzstan -1.47 (0.03) -0.89 (0.24) -1.47 (0.28) -1.14 (0.22) 0.58 (0.23) -0.00 (0.28) -0.58 (0.31) 0.33 (0.22)Latvia -0.37 (0.03) -0.28 (0.11) c c -0.27 (0.11) 0.09 (0.11) c c 0.10 (0.36) 0.10 (0.11)Liechtenstein 0.23 (0.05) -0.07 (0.09) -0.16 (0.09) -0.12 (0.06) -0.31 (0.10) -0.39 (0.11) -0.09 (0.13) -0.35 (0.08)Lithuania -0.20 (0.02) -0.36 (0.12) c c -0.36 (0.11) -0.16 (0.12) c c 0.06 (0.17) -0.16 (0.10)Macao-China -0.08 (0.02) -0.41 (0.01) -0.51 (0.03) -0.43 (0.01) -0.33 (0.03) -0.42 (0.04) -0.10 (0.03) -0.35 (0.03)Montenegro -0.28 (0.02) 0.01 (0.10) -0.51 (0.09) -0.31 (0.07) 0.29 (0.10) -0.23 (0.09) -0.52 (0.13) -0.03 (0.07)Panama -1.61 (0.08) -1.02 (0.16) -1.96 (0.27) -1.62 (0.23) 0.59 (0.16) -0.34 (0.27) -0.93 (0.32) -0.01 (0.23)Peru -2.09 (0.05) c c c c c c c c c c c c c cQatar 0.57 (0.02) 0.01 (0.02) 0.04 (0.02) 0.03 (0.01) -0.56 (0.03) -0.53 (0.02) 0.03 (0.03) -0.55 (0.02)Romania -0.48 (0.04) c c c c c c c c c c c c c cRussian Federation -0.57 (0.03) -0.69 (0.07) -0.60 (0.06) -0.65 (0.06) -0.13 (0.07) -0.04 (0.06) 0.09 (0.07) -0.09 (0.06)Serbia 0.28 (0.02) 0.18 (0.07) -0.05 (0.08) 0.08 (0.06) -0.09 (0.07) -0.33 (0.08) -0.23 (0.10) -0.20 (0.06)Shanghai-China -1.01 (0.04) c c c c c c c c c c c c c cSingapore -0.56 (0.01) -0.47 (0.07) -0.55 (0.04) -0.52 (0.04) 0.10 (0.07) 0.01 (0.04) -0.09 (0.08) 0.04 (0.04)Chinese Taipei -0.49 (0.02) c c c c c c c c c c c c c cThailand -1.20 (0.03) m m m m m m m m m m m m m mTrinidad and Tobago -0.91 (0.01) -0.59 (0.15) -0.75 (0.16) -0.66 (0.10) 0.32 (0.15) 0.16 (0.16) -0.16 (0.23) 0.25 (0.10)
Tunisia -1.24 (0.04) c c c c c c c c c c c c c cUruguay -0.61 (0.02) c c c c c c c c c c c c c c
Note: Values that are statistically significant are indicated in bold (see Annex A).
Source: PISA 2009 Database.
Please refer to the Reader’s Guide for information concerning the symbols replacing missing data.

145UNTAPPED SKILLS: REALISING THE POTENTIAL OF IMMIGRANT STUDENTS © OECD 2012
DATA TABLES ON IMMIGRANT STUDENTS: ANNEX B
Table B2.2gHome educational resources, by immigrant statusResults based on students’ self-reports
Home educational resources
Non-immigrant students
Second-generation students
First-generation students
Immigrant students (first- and second-generation)
Difference between non-
immigrant students and
second-generation students
Difference between non-
immigrant students and
first-generation students
Difference between
second- and first-generation
students
Difference between non-
immigrant students and immigrant
students (first- and second-generation)
Mean S.E. Mean S.E. Mean S.E. Mean S.E. Dif. S.E. Dif. S.E. Dif. S.E. Dif. S.E.
OEC
D Australia -0.08 (0.01) 0.01 (0.03) -0.03 (0.04) -0.01 (0.03) 0.09 (0.03) 0.04 (0.04) -0.04 (0.04) 0.07 (0.03)Austria -0.09 (0.02) -0.39 (0.05) -0.59 (0.10) -0.45 (0.06) -0.30 (0.05) -0.50 (0.10) -0.20 (0.10) -0.36 (0.06)Belgium 0.09 (0.01) -0.13 (0.04) -0.27 (0.06) -0.19 (0.04) -0.22 (0.05) -0.36 (0.06) -0.14 (0.07) -0.29 (0.04)Canada 0.06 (0.01) 0.20 (0.03) 0.23 (0.03) 0.22 (0.03) 0.14 (0.03) 0.17 (0.03) 0.03 (0.04) 0.16 (0.03)Chile -0.17 (0.03) c c c c c c c c c c c c c cCzech Republic 0.09 (0.01) -0.23 (0.19) 0.00 (0.15) -0.15 (0.13) -0.32 (0.19) -0.09 (0.15) 0.23 (0.25) -0.24 (0.13)Denmark 0.16 (0.02) 0.09 (0.03) -0.18 (0.06) 0.00 (0.03) -0.07 (0.03) -0.34 (0.06) -0.27 (0.07) -0.16 (0.03)Estonia 0.30 (0.01) 0.26 (0.04) 0.16 (0.14) 0.26 (0.04) -0.03 (0.04) -0.14 (0.14) -0.11 (0.16) -0.04 (0.04)Finland -0.31 (0.01) -0.25 (0.10) -0.21 (0.17) -0.23 (0.11) 0.06 (0.10) 0.10 (0.17) 0.05 (0.19) 0.08 (0.10)France -0.29 (0.02) -0.37 (0.06) -0.42 (0.16) -0.38 (0.05) -0.08 (0.06) -0.13 (0.16) -0.05 (0.18) -0.09 (0.06)Germany 0.22 (0.02) -0.04 (0.05) -0.19 (0.07) -0.09 (0.04) -0.26 (0.05) -0.42 (0.07) -0.16 (0.08) -0.31 (0.04)Greece 0.20 (0.03) -0.16 (0.11) -0.25 (0.07) -0.22 (0.08) -0.35 (0.11) -0.44 (0.08) -0.09 (0.10) -0.41 (0.08)Hungary 0.04 (0.03) 0.01 (0.16) -0.17 (0.16) -0.09 (0.12) -0.03 (0.16) -0.21 (0.17) -0.18 (0.23) -0.13 (0.12)Iceland 0.32 (0.01) c c -0.18 (0.14) -0.21 (0.13) c c -0.51 (0.15) c c -0.53 (0.14)Ireland -0.36 (0.02) -0.35 (0.11) -0.37 (0.06) -0.37 (0.05) 0.00 (0.12) -0.01 (0.06) -0.01 (0.12) -0.01 (0.05)Israel -1.05 (0.02) -1.25 (0.05) -1.35 (0.05) -1.29 (0.04) -0.20 (0.05) -0.30 (0.05) -0.10 (0.06) -0.24 (0.04)Italy 0.10 (0.01) -0.28 (0.07) -0.40 (0.05) -0.37 (0.04) -0.38 (0.07) -0.50 (0.05) -0.12 (0.09) -0.47 (0.04)Japan -0.46 (0.02) c c c c c c c c c c c c c cKorea -0.14 (0.02) c c m m c c c c m m c c c cLuxembourg 0.27 (0.01) 0.07 (0.03) -0.04 (0.04) 0.03 (0.02) -0.20 (0.04) -0.31 (0.04) -0.11 (0.05) -0.25 (0.03)Mexico -0.95 (0.02) -1.38 (0.12) -1.43 (0.07) -1.41 (0.06) -0.44 (0.12) -0.49 (0.07) -0.05 (0.15) -0.47 (0.06)Netherlands 0.07 (0.02) -0.12 (0.05) -0.19 (0.09) -0.14 (0.05) -0.20 (0.06) -0.27 (0.09) -0.07 (0.10) -0.21 (0.05)New Zealand -0.31 (0.02) -0.37 (0.05) -0.19 (0.03) -0.25 (0.03) -0.06 (0.05) 0.12 (0.03) 0.18 (0.06) 0.06 (0.03)Norway 0.33 (0.01) 0.34 (0.08) -0.10 (0.09) 0.14 (0.06) 0.01 (0.08) -0.43 (0.08) -0.44 (0.11) -0.20 (0.06)Poland 0.49 (0.01) m m c c c c m m c c m m c cPortugal 0.20 (0.02) 0.00 (0.12) -0.14 (0.08) -0.07 (0.08) -0.20 (0.12) -0.34 (0.09) -0.14 (0.13) -0.27 (0.08)Slovak Republic 1.12 (0.02) c c c c c c c c c c c c c cSlovenia 0.55 (0.01) 0.40 (0.05) 0.32 (0.10) 0.39 (0.04) -0.15 (0.05) -0.23 (0.10) -0.08 (0.11) -0.17 (0.04)Spain -0.09 (0.01) -0.35 (0.11) -0.57 (0.04) -0.54 (0.04) -0.26 (0.11) -0.48 (0.04) -0.22 (0.11) -0.45 (0.04)Sweden 0.10 (0.02) -0.04 (0.05) -0.21 (0.08) -0.10 (0.04) -0.15 (0.05) -0.31 (0.07) -0.16 (0.08) -0.20 (0.04)Switzerland 0.05 (0.02) -0.12 (0.03) -0.22 (0.04) -0.15 (0.02) -0.17 (0.03) -0.27 (0.04) -0.10 (0.05) -0.21 (0.02)Turkey 0.48 (0.04) c c c c c c c c c c c c c cUnited Kingdom -0.08 (0.02) 0.16 (0.05) -0.04 (0.05) 0.07 (0.04) 0.24 (0.05) 0.04 (0.06) -0.21 (0.08) 0.15 (0.04)United States -0.23 (0.03) -0.34 (0.06) -0.31 (0.07) -0.33 (0.05) -0.11 (0.06) -0.08 (0.07) 0.03 (0.07) -0.10 (0.05)OECD average 0.02 (0.00) -0.17 (0.02) -0.26 (0.02) -0.21 (0.01) -0.13 (0.02) -0.24 (0.02) -0.09 (0.02) -0.19 (0.01)
Part
ners Albania -0.76 (0.04) c c c c c c c c c c c c c c
Argentina -0.39 (0.03) -0.59 (0.10) -0.48 (0.17) -0.55 (0.10) -0.20 (0.10) -0.09 (0.17) 0.11 (0.17) -0.15 (0.10)Azerbaijan -0.61 (0.03) -0.81 (0.22) -0.13 (0.14) -0.64 (0.19) -0.20 (0.22) 0.48 (0.15) 0.68 (0.27) -0.03 (0.19)Brazil -0.58 (0.02) -0.87 (0.09) -0.66 (0.14) -0.80 (0.07) -0.29 (0.09) -0.07 (0.13) 0.22 (0.16) -0.22 (0.08)Bulgaria -0.06 (0.03) c c c c c c c c c c c c c cColombia -0.52 (0.04) c c c c -0.95 (0.22) c c c c c c -0.43 (0.22)Croatia 0.12 (0.02) 0.11 (0.05) -0.14 (0.07) 0.03 (0.04) -0.00 (0.05) -0.26 (0.07) -0.25 (0.09) -0.09 (0.04)Dubai (UAE) -0.26 (0.02) -0.03 (0.02) 0.16 (0.02) 0.09 (0.01) 0.24 (0.03) 0.42 (0.03) 0.18 (0.03) 0.35 (0.02)Hong Kong-China -0.03 (0.03) -0.12 (0.03) -0.45 (0.04) -0.25 (0.02) -0.09 (0.04) -0.42 (0.06) -0.33 (0.05) -0.22 (0.04)Indonesia -1.07 (0.04) m m c c c c m m c c m m c cJordan -0.52 (0.03) -0.44 (0.07) -0.30 (0.10) -0.41 (0.06) 0.09 (0.06) 0.23 (0.09) 0.14 (0.10) 0.12 (0.06)Kazakhstan -0.43 (0.04) -0.32 (0.09) -0.71 (0.12) -0.47 (0.10) 0.10 (0.09) -0.28 (0.12) -0.38 (0.11) -0.04 (0.09)Kyrgyzstan -0.98 (0.03) -0.44 (0.33) -0.97 (0.30) -0.66 (0.25) 0.54 (0.32) 0.01 (0.30) -0.53 (0.41) 0.31 (0.25)Latvia 0.29 (0.02) 0.29 (0.10) c c 0.30 (0.09) 0.01 (0.10) c c 0.10 (0.16) 0.01 (0.09)Liechtenstein -0.01 (0.06) -0.30 (0.11) -0.36 (0.15) -0.34 (0.10) -0.29 (0.13) -0.35 (0.16) -0.06 (0.18) -0.33 (0.12)Lithuania 0.21 (0.02) 0.01 (0.11) c c 0.04 (0.10) -0.20 (0.11) c c 0.28 (0.30) -0.17 (0.10)Macao-China 0.24 (0.02) 0.14 (0.02) 0.15 (0.03) 0.14 (0.02) -0.10 (0.03) -0.09 (0.03) 0.01 (0.03) -0.10 (0.02)Montenegro 0.02 (0.02) 0.09 (0.11) -0.13 (0.10) -0.05 (0.07) 0.06 (0.12) -0.16 (0.10) -0.22 (0.14) -0.07 (0.08)Panama -0.66 (0.06) -0.43 (0.10) -0.85 (0.19) -0.70 (0.15) 0.23 (0.11) -0.19 (0.20) -0.42 (0.21) -0.04 (0.16)Peru -0.73 (0.04) c c c c c c c c c c c c c cQatar -0.13 (0.01) -0.02 (0.02) 0.20 (0.02) 0.11 (0.01) 0.12 (0.03) 0.33 (0.02) 0.22 (0.03) 0.24 (0.02)Romania 0.40 (0.03) c c c c c c c c c c c c c cRussian Federation 0.33 (0.02) 0.10 (0.15) 0.29 (0.08) 0.18 (0.11) -0.23 (0.14) -0.04 (0.08) 0.19 (0.12) -0.15 (0.11)Serbia 1.48 (0.02) 1.56 (0.08) 1.41 (0.07) 1.49 (0.06) 0.08 (0.08) -0.07 (0.07) -0.15 (0.10) 0.01 (0.05)Shanghai-China -0.19 (0.03) c c c c c c c c c c c c c cSingapore -0.05 (0.01) 0.04 (0.06) 0.11 (0.04) 0.09 (0.03) 0.09 (0.06) 0.17 (0.04) 0.07 (0.07) 0.14 (0.03)Chinese Taipei -0.03 (0.02) c c c c c c c c c c c c c cThailand -0.31 (0.03) m m m m m m m m m m m m m mTrinidad and Tobago -0.30 (0.01) -0.19 (0.12) -0.36 (0.12) -0.27 (0.08) 0.11 (0.12) -0.06 (0.12) -0.17 (0.16) 0.03 (0.09)
Tunisia 0.09 (0.04) c c c c c c c c c c c c c cUruguay 0.44 (0.02) c c c c c c c c c c c c c c
Note: Values that are statistically significant are indicated in bold (see Annex A).
Source: PISA 2009 Database.
Please refer to the Reader’s Guide for information concerning the symbols replacing missing data.

146 © OECD 2012 UNTAPPED SKILLS: REALISING THE POTENTIAL OF IMMIGRANT STUDENTS
ANNEX B: DATA TABLES ON IMMIGRANT STUDENTS
Table B2.2hWealth, by immigrant statusResults based on students’ self-reports
Wealth index
Non-immigrant students
Second-generation students
First-generation students
Immigrant students (first- and second-generation)
Difference between non-
immigrant students and
second-generation students
Difference between non-
immigrant students and
first-generation students
Difference between
second- and first-generation
students
Difference between non-
immigrant students and immigrant
students (first- and second-generation)
Mean S.E. Mean S.E. Mean S.E. Mean S.E. Dif. S.E. Dif. S.E. Dif. S.E. Dif. S.E.
OEC
D Australia 0.77 (0.01) 0.69 (0.03) 0.59 (0.03) 0.64 (0.03) -0.07 (0.03) -0.18 (0.03) -0.11 (0.04) -0.13 (0.02)Austria 0.21 (0.02) -0.26 (0.04) -0.55 (0.08) -0.35 (0.03) -0.47 (0.04) -0.75 (0.08) -0.28 (0.09) -0.56 (0.04)Belgium -0.06 (0.01) -0.35 (0.05) -0.40 (0.07) -0.38 (0.04) -0.29 (0.05) -0.34 (0.07) -0.05 (0.07) -0.31 (0.05)Canada 0.52 (0.01) 0.51 (0.04) 0.21 (0.04) 0.38 (0.04) -0.01 (0.04) -0.31 (0.04) -0.29 (0.04) -0.14 (0.03)Chile -0.67 (0.03) c c c c c c c c c c c c c cCzech Republic -0.22 (0.01) -0.30 (0.11) -0.32 (0.12) -0.31 (0.08) -0.09 (0.11) -0.10 (0.12) -0.02 (0.17) -0.09 (0.08)Denmark 0.41 (0.02) -0.37 (0.04) -0.56 (0.09) -0.43 (0.04) -0.78 (0.05) -0.97 (0.09) -0.19 (0.10) -0.84 (0.04)Estonia -0.01 (0.02) -0.23 (0.07) -0.25 (0.18) -0.23 (0.06) -0.22 (0.07) -0.23 (0.18) -0.02 (0.19) -0.22 (0.06)Finland 0.23 (0.02) 0.03 (0.12) -0.16 (0.13) -0.07 (0.09) -0.19 (0.12) -0.38 (0.13) -0.19 (0.18) -0.30 (0.09)France 0.12 (0.02) -0.09 (0.04) -0.39 (0.12) -0.17 (0.06) -0.21 (0.04) -0.51 (0.12) -0.30 (0.11) -0.28 (0.05)Germany 0.21 (0.02) -0.28 (0.03) -0.37 (0.05) -0.31 (0.03) -0.49 (0.04) -0.58 (0.05) -0.08 (0.06) -0.52 (0.03)Greece -0.25 (0.02) -0.69 (0.07) -0.90 (0.05) -0.83 (0.04) -0.44 (0.07) -0.65 (0.05) -0.21 (0.09) -0.58 (0.04)Hungary -0.35 (0.02) -0.37 (0.12) -0.46 (0.11) -0.43 (0.08) -0.02 (0.11) -0.11 (0.11) -0.09 (0.16) -0.07 (0.08)Iceland 0.56 (0.01) c c -0.03 (0.15) 0.05 (0.14) c c -0.59 (0.15) c c -0.51 (0.14)Ireland 0.29 (0.02) 0.20 (0.14) 0.04 (0.05) 0.07 (0.05) -0.09 (0.14) -0.25 (0.05) -0.16 (0.15) -0.23 (0.05)Israel -0.20 (0.03) -0.49 (0.05) -0.74 (0.06) -0.58 (0.04) -0.29 (0.05) -0.54 (0.06) -0.25 (0.06) -0.38 (0.04)Italy 0.12 (0.01) -0.41 (0.06) -0.56 (0.04) -0.53 (0.04) -0.53 (0.06) -0.68 (0.04) -0.15 (0.07) -0.64 (0.04)Japan -0.48 (0.01) c c c c c c c c c c c c c cKorea (0.02) c c m m c c c c m m c c c cLuxembourg 0.59 (0.02) 0.25 (0.02) 0.05 (0.03) 0.17 (0.02) -0.34 (0.03) -0.53 (0.03) -0.20 (0.04) -0.42 (0.02)Mexico -1.59 (0.03) -1.89 (0.13) -2.16 (0.11) -2.05 (0.08) -0.30 (0.13) -0.56 (0.11) -0.26 (0.18) -0.46 (0.08)Netherlands 0.50 (0.02) 0.02 (0.05) -0.05 (0.08) 0.00 (0.05) -0.49 (0.05) -0.55 (0.08) -0.06 (0.08) -0.50 (0.04)New Zealand 0.27 (0.02) 0.03 (0.06) 0.10 (0.03) 0.08 (0.03) -0.24 (0.06) -0.16 (0.03) 0.08 (0.07) -0.19 (0.03)Norway 0.67 (0.01) 0.33 (0.09) -0.02 (0.09) 0.17 (0.07) -0.34 (0.10) -0.69 (0.09) -0.35 (0.12) -0.50 (0.07)Poland -0.18 (0.02) m m c c c c m m c c m m c cPortugal 0.52 (0.02) 0.07 (0.06) -0.03 (0.07) 0.02 (0.05) -0.45 (0.06) -0.55 (0.07) -0.10 (0.08) -0.50 (0.05)Slovak Republic 0.13 (0.02) c c c c c c c c c c c c c cSlovenia 0.27 (0.02) 0.01 (0.05) -0.16 (0.08) -0.02 (0.04) -0.26 (0.05) -0.43 (0.08) -0.17 (0.10) -0.29 (0.05)Spain -0.16 (0.01) -0.38 (0.06) -0.67 (0.04) -0.64 (0.04) -0.22 (0.06) -0.51 (0.04) -0.29 (0.07) -0.48 (0.04)Sweden 0.54 (0.02) 0.16 (0.05) -0.27 (0.09) 0.02 (0.04) -0.38 (0.04) -0.81 (0.09) -0.44 (0.10) -0.52 (0.04)Switzerland -0.12 (0.01) -0.33 (0.03) -0.42 (0.05) -0.36 (0.03) -0.21 (0.03) -0.30 (0.05) -0.09 (0.05) -0.24 (0.03)Turkey -1.02 (0.04) c c c c c c c c c c c c c cUnited Kingdom 0.30 (0.01) 0.09 (0.09) -0.34 (0.05) -0.11 (0.05) -0.22 (0.08) -0.64 (0.05) -0.42 (0.10) -0.41 (0.05)United States 0.50 (0.04) 0.20 (0.05) 0.04 (0.06) 0.15 (0.05) -0.30 (0.05) -0.46 (0.06) -0.16 (0.06) -0.35 (0.05)OECD average 0.04 (0.00) -0.14 (0.01) -0.31 (0.02) -0.22 (0.01) -0.29 (0.01) -0.48 (0.02) -0.18 (0.02) -0.38 (0.01)
Part
ners Albania -1.67 (0.03) c c c c c c c c c c c c c c
Argentina -0.94 (0.04) -1.23 (0.08) -1.12 (0.13) -1.19 (0.07) -0.29 (0.08) -0.17 (0.13) 0.12 (0.15) -0.24 (0.07)Azerbaijan -1.58 (0.03) -1.69 (0.32) -1.13 (0.16) -1.55 (0.25) -0.11 (0.32) 0.46 (0.16) 0.57 (0.36) 0.03 (0.25)Brazil -1.25 (0.02) -1.17 (0.14) -1.71 (0.18) -1.35 (0.14) 0.08 (0.14) -0.46 (0.18) -0.54 (0.20) -0.11 (0.14)Bulgaria -0.34 (0.03) c c c c c c c c c c c c c cColombia -1.44 (0.05) c c c c -2.16 (0.25) c c c c c c -0.71 (0.25)Croatia -0.42 (0.02) -0.43 (0.06) -0.47 (0.06) -0.44 (0.05) -0.01 (0.06) -0.05 (0.06) -0.04 (0.08) -0.03 (0.05)Dubai (UAE) 0.40 (0.02) -0.45 (0.03) -0.25 (0.02) -0.32 (0.01) -0.85 (0.03) -0.64 (0.03) 0.21 (0.03) -0.72 (0.02)Hong Kong-China -0.85 (0.03) -1.24 (0.02) -1.57 (0.04) -1.37 (0.03) -0.38 (0.03) -0.72 (0.05) -0.33 (0.04) -0.51 (0.03)Indonesia -1.79 (0.06) m m c c c c m m c c m m c cJordan -1.25 (0.03) -1.06 (0.05) -0.80 (0.09) (0.05) 0.18 (0.05) 0.44 (0.09) 0.26 (0.09) 0.25 (0.05)Kazakhstan -1.76 (0.04) -1.70 (0.10) -2.01 (0.09) -1.82 (0.08) 0.05 (0.10) -0.25 (0.09) -0.31 (0.12) -0.06 (0.08)Kyrgyzstan -1.34 (0.02) -0.85 (0.17) -1.27 (0.23) -1.03 (0.17) 0.50 (0.17) 0.07 (0.23) -0.43 (0.25) 0.32 (0.17)Latvia -0.50 (0.02) -0.45 (0.10) c c -0.45 (0.10) 0.05 (0.10) c c 0.07 (0.34) 0.06 (0.10)Liechtenstein 0.23 (0.05) 0.05 (0.12) -0.17 (0.08) -0.07 (0.07) -0.18 (0.12) -0.40 (0.09) -0.22 (0.14) -0.30 (0.08)Lithuania -0.23 (0.02) -0.28 (0.08) c c -0.27 (0.08) -0.04 (0.08) c c 0.11 (0.21) -0.03 (0.08)Macao-China -0.28 (0.02) -0.64 (0.01) -0.81 (0.02) -0.68 (0.01) -0.36 (0.03) -0.54 (0.03) -0.17 (0.03) -0.40 (0.03)Montenegro -0.28 (0.02) 0.04 (0.11) -0.44 (0.09) -0.25 (0.08) 0.31 (0.12) -0.16 (0.09) -0.47 (0.15) 0.02 (0.08)Panama -1.73 (0.08) -0.98 (0.18) -2.22 (0.32) -1.78 (0.28) 0.75 (0.17) -0.49 (0.30) -1.24 (0.37) -0.05 (0.27)Peru -2.26 (0.04) c c c c c c c c c c c c c cQatar 1.02 (0.01) 0.22 (0.02) 0.18 (0.02) 0.20 (0.01) -0.80 (0.02) -0.84 (0.02) -0.04 (0.03) -0.82 (0.02)Romania -0.54 (0.03) c c c c c c c c c c c c c cRussian Federation -0.79 (0.02) -0.80 (0.05) -0.74 (0.05) -0.78 (0.04) -0.00 (0.05) 0.05 (0.05) 0.05 (0.07) 0.02 (0.04)Serbia -0.10 (0.02) -0.23 (0.06) -0.37 (0.07) -0.29 (0.05) -0.13 (0.06) -0.28 (0.07) -0.15 (0.09) -0.20 (0.05)Shanghai-China -1.26 (0.03) c c c c c c c c c c c c c cSingapore -0.73 (0.01) -0.69 (0.06) -0.86 (0.04) -0.80 (0.03) 0.03 (0.06) -0.13 (0.04) -0.17 (0.07) -0.08 (0.04)Chinese Taipei -0.58 (0.02) c c c c c c c c c c c c c cThailand -1.29 (0.03) m m m m m m m m m m m m m mTrinidad and Tobago -1.12 (0.01) -0.82 (0.12) -0.89 (0.15) -0.85 (0.09) 0.29 (0.12) 0.23 (0.15) -0.06 (0.21) 0.27 (0.09)
Tunisia -1.66 (0.04) c c c c c c c c c c c c c cUruguay -0.66 (0.02) c c c c c c c c c c c c c c
Note: Values that are statistically significant are indicated in bold (see Annex A).
Source: PISA 2009 Database.
Please refer to the Reader’s Guide for information concerning the symbols replacing missing data.

147UNTAPPED SKILLS: REALISING THE POTENTIAL OF IMMIGRANT STUDENTS © OECD 2012
DATA TABLES ON IMMIGRANT STUDENTS: ANNEX B
Table B2.2iLow maternal education, by immigrant statusResults based on students’ self-reports
Proportion of students whose mother has educational attainment of lower secondary education at best
Non-immigrant students
Second-generation students
First-generation students
Immigrant students (first- and second-generation)
Difference between non-
immigrant students and
second-generation students
Difference between non-
immigrant students and
first-generation students
Difference between
second- and first-generation
students
Difference between non-
immigrant students and immigrant
students (first- and second-generation)
% S.E. % S.E. % S.E. % S.E. % dif. S.E. % dif. S.E. % dif. S.E. % dif. S.E.
OEC
D Australia 4.77 (0.29) 10.02 (1.2) 5.95 (1.1) 8.06 (1.0) -5.25 -(1.2) -1.18 (1.1) 4.07 (1.1) -3.29 (1.0)Austria 5.36 (0.43) 31.73 (2.4) 34.10 (3.4) 32.48 (1.9) -26.37 -(2.3) -28.74 (3.4) -2.37 (4.3) -27.12 (1.9)Belgium 7.12 (0.37) 33.23 (2.9) 21.99 (2.4) 27.93 (2.0) -26.11 -(3.0) -14.87 (2.5) 11.24 (3.6) -20.81 (2.1)Canada 5.39 (0.26) 12.53 (1.4) 7.80 (1.1) 10.44 (1.0) -7.14 -(1.4) -2.41 (1.1) 4.72 (1.6) -5.05 (1.0)Chile 34.00 (1.36) c c c c c c c c c c c c c cCzech Republic 3.09 (0.30) 14.61 (6.9) 10.04 (5.6) 12.90 (4.5) -11.51 -(6.8) -6.94 (5.6) 4.57 (9.5) -9.81 (4.4)Denmark 9.82 (0.67) 41.09 (2.2) 30.84 (3.4) 37.80 (2.0) -31.26 -(2.2) -21.02 (3.5) 10.25 (3.7) -27.98 (2.1)Estonia 5.08 (0.34) 5.87 (1.8) 6.05 (3.8) 5.88 (1.6) -0.79 -(1.7) -0.97 (3.9) -0.18 (4.4) -0.80 (1.6)Finland 8.12 (0.41) 17.05 (5.5) 23.88 (6.2) 20.83 (4.6) -8.94 -(5.4) -15.76 (6.1) -6.83 (7.5) -12.72 (4.5)France 15.00 (0.73) 49.37 (2.2) 42.54 (5.8) 47.67 (2.3) -34.37 -(2.2) -27.55 (5.7) 6.83 (6.0) -32.67 (2.2)Germany 16.13 (0.91) 38.81 (2.6) 32.61 (3.8) 36.61 (2.3) -22.68 -(2.8) -16.48 (4.1) 6.20 (4.3) -20.48 (2.6)Greece 21.79 (1.13) 9.57 (2.3) 23.35 (3.4) 18.77 (2.4) 12.22 -(2.7) -1.56 (3.7) -13.78 (4.0) 3.02 (2.8)Hungary 16.00 (1.01) 9.29 (5.5) 12.52 (5.6) 11.14 (4.0) 6.70 -(5.3) 3.48 (5.6) -3.23 (7.7) 4.85 (4.0)Iceland 23.28 (0.74) c c 25.29 (6.6) 23.26 (6.0) c c -2.01 (6.6) c c 0.02 (6.1)Ireland 17.62 (0.93) 23.78 (5.9) 9.91 (1.9) 12.32 (2.1) -6.16 -(5.9) 7.71 (2.3) 13.87 (5.7) 5.30 (2.5)Israel 10.93 (0.61) 13.84 (2.1) 10.33 (2.2) 12.61 (1.7) -2.91 -(2.1) 0.60 (2.3) 3.51 (2.7) -1.68 (1.7)Italy 35.47 (0.52) 39.54 (3.4) 30.82 (2.2) 32.97 (2.0) -4.07 -(3.3) 4.65 (2.3) 8.72 (3.7) 2.50 (2.0)Japan 3.20 (0.21) c c c c c c c c c c c c c cKorea 10.86 (0.65) c c m m c c c c m m c c c cLuxembourg 17.26 (0.75) 52.92 (1.6) 41.31 (1.8) 48.27 (1.2) -35.66 -(1.7) -24.05 (1.9) 11.61 (2.4) -31.01 (1.4)Mexico 61.32 (0.88) 73.17 (5.7) 74.37 (3.7) 73.88 (3.5) -11.84 -(5.6) -13.04 (3.5) -1.20 (6.1) -12.56 (3.4)Netherlands 9.87 (0.60) 46.74 (2.6) 42.08 (5.4) 45.62 (2.4) -36.87 -(2.5) -32.21 (5.6) 4.65 (5.9) -35.75 (2.5)New Zealand 14.05 (0.63) 17.25 (2.1) 8.49 (1.0) 11.06 (1.0) -3.20 -(2.2) 5.57 (1.1) 8.76 (2.3) 2.99 (1.1)Norway 3.79 (0.30) 16.39 (3.1) 21.08 (3.8) 18.55 (2.3) -12.60 -(3.1) -17.29 (3.8) -4.69 (5.1) -14.76 (2.3)Poland 8.04 (0.58) m m c c c c m m c c m m c cPortugal 58.90 (1.30) 54.45 (4.3) 38.81 (5.1) 46.56 (3.0) 4.45 -(4.2) 20.09 (5.1) 15.64 (7.3) 12.34 (3.0)Slovak Republic 3.20 (0.38) c c c c c c c c c c c c c cSlovenia 9.32 (0.48) 27.12 (2.6) 47.31 (5.8) 30.79 (2.5) -17.79 -(2.6) -37.99 (5.8) -20.19 (6.4) -21.47 (2.5)Spain 40.57 (1.19) 37.74 (4.8) 38.02 (2.1) 37.99 (2.0) 2.83 -(4.8) 2.55 (2.5) -0.28 (5.2) 2.59 (2.3)Sweden 8.23 (0.47) 22.93 (2.8) 28.52 (3.9) 24.76 (2.2) -14.69 -(2.9) -20.28 (3.8) -5.59 (4.9) -16.53 (2.2)Switzerland 15.59 (0.61) 47.36 (2.2) 43.76 (3.1) 46.08 (1.9) -31.77 -(2.2) -28.17 (3.1) 3.60 (3.6) -30.49 (1.9)Turkey 80.11 (1.22) c c c c c c c c c c c c c cUnited Kingdom 5.55 (0.37) 20.05 (4.3) 21.40 (4.2) 20.67 (3.8) -14.51 -(4.3) -15.85 (4.2) -1.35 (4.0) -15.12 (3.7)United States 5.51 (0.44) 34.65 (3.1) 32.21 (3.3) 33.84 (2.8) -29.14 -(3.1) -26.71 (3.3) 2.44 (3.2) -28.33 (2.7)OECD average 17.48 (0.12) 29.67 (0.7) 27.34 (0.7) 28.21 (0.5) -13.68 (0.7) -11.09 (0.8) 2.26 (1.0) -11.96 (0.5)
Part
ners Albania 39.06 (1.56) c c c c c c c c c c c c c c
Argentina 39.28 (1.45) 54.14 (5.1) 42.87 (5.6) 49.40 (3.7) -14.86 -(5.0) -3.59 -(5.5) 11.27 (7.7) -10.12 (3.6)Azerbaijan 7.57 (0.61) 10.52 (3.4) 8.29 (5.0) 9.98 (2.5) -2.95 -(3.5) -0.72 -(4.9) 2.23 (6.9) -2.41 (2.6)Brazil 54.76 (1.04) 58.80 (9.6) 54.84 (16.6) 57.41 (9.4) -4.04 -(9.7) -0.09 -(16.7) 3.95 (17.1) -2.65 (9.6)Bulgaria 10.47 (1.09) c c c c c c c c c c c c c cColombia 51.82 (1.45) c c c c 70.14 (10.1) c c c c c c -18.32 (10.1)Croatia 13.24 (0.67) 24.83 (2.6) 27.91 (3.6) 25.85 (2.2) -11.59 -(2.5) -14.67 -(3.6) -3.08 (4.1) -12.61 (2.2)Dubai (UAE) 34.54 (1.19) 15.66 (1.0) 7.02 (0.6) 10.22 (0.5) 18.88 -(1.6) 27.52 -(1.3) 8.64 (1.3) 24.32 (1.3)Hong Kong-China 37.96 (1.66) 61.20 (1.6) 69.05 (1.8) 64.28 (1.3) -23.24 -(2.1) -31.09 -(2.5) -7.85 (2.2) -26.32 (2.0)Indonesia 64.48 (2.02) m m c c c c m m c c m m c cJordan 32.02 (1.02) 25.32 (2.1) 18.60 (3.9) 23.75 (1.9) 6.70 -(2.2) 13.42 -(3.9) 6.72 (4.2) 8.27 (2.0)Kazakhstan 2.40 (0.31) 3.80 (1.2) 9.86 (3.1) 6.09 (1.6) -1.40 -(1.2) -7.46 -(3.1) -6.06 (3.1) -3.69 (1.6)Kyrgyzstan 2.37 (0.26) 7.85 (4.4) 3.11 (3.6) 5.85 (3.4) -5.48 -(4.4) -0.74 -(3.6) 4.74 (4.5) -3.48 (3.4)Latvia 3.80 (0.47) 1.35 (0.8) c c 1.24 (0.7) 2.45 -(0.9) c c c c 2.57 (0.9)Liechtenstein 20.04 (2.46) 43.84 (7.4) 45.02 (6.4) 44.49 (4.7) -23.80 -(7.8) -24.99 -(6.8) -1.18 (10.0) -24.46 (5.3)Lithuania 2.55 (0.25) 3.33 (1.8) c c 3.01 (1.7) -0.79 -(1.8) c c c c -0.47 (1.6)Macao-China 59.82 (1.15) 75.19 (0.8) 64.65 (1.6) 72.87 (0.8) -15.37 -(1.4) -4.83 -(2.2) 10.55 (1.7) -13.06 (1.4)Montenegro 12.63 (0.91) 9.08 (4.6) 11.71 (4.1) 10.68 (3.2) 3.56 -(4.8) 0.93 -(3.6) -2.63 (5.9) 1.95 (2.9)Panama 33.35 (2.20) 32.19 (7.5) 39.14 (6.8) 36.74 (5.4) 1.16 -(8.4) -5.79 -(7.0) -6.95 (10.1) -3.39 (6.0)Peru 43.41 (1.60) c c c c c c c c c c c c c cQatar 23.94 (0.55) 24.69 (1.0) 10.72 (0.7) 16.77 (0.6) -0.75 -(1.2) 13.21 -(0.9) 13.96 (1.3) 7.17 (0.8)Romania 11.88 (0.71) c c c c c c c c c c c c c cRussian Federation 2.65 (0.34) 7.86 (4.9) 5.79 (2.1) 7.01 (3.4) -5.21 -(5.0) -3.14 -(2.1) 2.07 (4.5) -4.37 (3.4)Serbia 11.40 (0.70) 11.21 (3.4) 8.72 (1.7) 10.08 (2.2) 0.20 -(3.4) 2.68 -(1.8) 2.49 (3.5) 1.33 (2.3)Shanghai-China 37.68 (1.40) c c c c c c c c c c c c c cSingapore 22.86 (0.61) 26.26 (2.6) 12.91 (1.4) 17.36 (1.3) -3.40 -(2.6) 9.95 -(1.6) 13.35 (2.9) 5.50 (1.5)Chinese Taipei 26.39 (0.90) c c c c c c c c c c c c c cThailand 68.11 (1.36) m m m m m m m m m m m m m mTrinidad and Tobago 23.32 (0.80) 29.27 (7.4) 18.01 (5.4) 24.10 (4.9) -5.95 -(7.5) 5.31 -(5.5) 11.26 (8.8) -0.78 (5.0)
Tunisia 66.85 (1.69) c c c c c c c c c c c c c cUruguay 59.88 (1.02) c c c c c c c c c c c c c c
Note: Values that are statistically significant are indicated in bold (see Annex A).
Source: PISA 2009 Database.
Please refer to the Reader’s Guide for information concerning the symbols replacing missing data.

148 © OECD 2012 UNTAPPED SKILLS: REALISING THE POTENTIAL OF IMMIGRANT STUDENTS
ANNEX B: DATA TABLES ON IMMIGRANT STUDENTS
Table B2.3aStandard deviation in reading performance. by immigrant statusResults based on students’ self-reports
Non-immigrant students Second-generation students First-generation studentsImmigrant students (first- and
second-generation)
S.D. S.E. S.D. S.E. S.D. S.E. S.D. S.E.
OEC
D Australia 96.2 (1.1) 98.0 (4.0) 104.2 (3.8) 101.2 (3.4)
Austria 96.9 (2.1) 89.4 (3.5) 100.2 (6.6) 95.0 (3.0)
Belgium 95.7 (1.5) 102.3 (4.4) 103.6 (4.6) 102.9 (3.5)
Canada 87.9 (0.9) 88.6 (2.2) 99.4 (2.6) 93.5 (1.8)
Chile 81.8 (1.7) c c c c c c
Czech Republic 91.6 (1.6) 114.2 (9.2) 102.7 (9.1) 110.5 (7.3)
Denmark 80.9 (1.3) 83.2 (2.5) 83.5 (3.7) 84.0 (2.2)
Estonia 82.1 (1.6) 82.6 (5.9) 90.8 (10.0) 83.2 (5.3)
Finland 85.0 (1.0) 88.3 (8.3) 115.4 (10.5) 106.2 (7.8)
France 102.3 (3.1) 105.1 (4.4) 114.9 (8.9) 107.9 (4.6)
Germany 91.3 (2.0) 94.2 (3.9) 91.1 (4.8) 93.2 (3.3)
Greece 92.6 (2.4) 98.3 (5.8) 95.4 (8.6) 97.7 (6.6)
Hungary 89.6 (2.2) 80.4 (9.9) 77.2 (6.1) 80.0 (5.5)
Iceland 94.0 (1.2) c c 102.6 (11.7) 103.3 (10.3)
Ireland 92.1 (2.2) 88.3 (8.3) 100.3 (5.1) 99.5 (4.6)
Israel 108.7 (2.4) 101.1 (3.6) 108.0 (4.7) 104.3 (3.3)
Italy 93.6 (1.5) 102.4 (6.8) 93.5 (4.1) 96.9 (3.4)
Japan 99.6 (2.9) c c c c c c
Korea 78.1 (2.1) c c m m c c
Luxembourg 92.9 (1.3) 99.8 (2.3) 121.2 (3.1) 109.0 (1.8)
Mexico 81.9 (1.0) 84.3 (8.8) 88.9 (10.1) 87.5 (7.5)
Netherlands 87.7 (1.9) 76.9 (3.5) 89.9 (7.3) 80.5 (3.5)
New Zealand 99.4 (1.9) 105.7 (4.6) 106.2 (2.8) 106.5 (2.5)
Norway 89.3 (1.2) 92.5 (7.6) 92.0 (6.6) 92.5 (5.4)
Poland 88.2 (1.2) m m c c c c
Portugal 85.8 (1.6) 82.4 (6.3) 82.0 (4.9) 82.7 (4.1)
Slovak Republic 89.4 (1.9) c c c c c c
Slovenia 89.2 (0.9) 85.7 (3.2) 85.7 (6.2) 86.6 (2.6)
Spain 85.0 (1.2) 85.1 (5.5) 86.0 (2.5) 86.6 (2.4)
Sweden 93.7 (1.5) 97.5 (4.6) 106.1 (6.8) 101.7 (4.3)
Switzerland 88.2 (1.4) 94.6 (2.1) 104.2 (4.5) 98.4 (2.1)
Turkey 81.4 (1.7) c c c c c c
United Kingdom 93.1 (1.1) 93.8 (4.1) 96.9 (4.5) 96.7 (3.1)
United States 95.5 (1.7) 92.1 (3.0) 101.4 (3.7) 95.3 (2.6)
OECD average 90.6 (0.3) 92.9 (1.1) 98.0 (1.2) 95.8 (0.9)
Part
ners Albania 97.0 (1.8) c c c c c c
Argentina 106.8 (3.1) 99.1 (7.4) 121.0 (17.2) 108.2 (9.7)
Azerbaijan 75.3 (1.9) 71.7 (6.8) 61.8 (8.9) 69.8 (5.6)
Brazil 92.4 (1.4) 77.1 (13.8) 69.9 (12.7) 74.8 (9.5)
Bulgaria 110.9 (2.5) c c c c c c
Colombia 85.7 (1.9) c c c c 73.8 (22.4)
Croatia 86.6 (1.6) 86.4 (3.6) 88.6 (5.3) 87.3 (3.1)
Dubai (UAE) 92.0 (1.7) 96.6 (2.2) 96.6 (1.5) 98.1 (1.2)
Hong Kong-China 83.5 (1.9) 81.0 (2.0) 84.7 (3.1) 83.9 (2.1)
Indonesia 66.1 (2.0) m m c c c c
Jordan 87.2 (1.8) 90.7 (4.7) 93.6 (5.8) 91.4 (3.6)
Kazakhstan 89.8 (1.6) 97.0 (5.8) 90.4 (5.0) 97.5 (5.0)
Kyrgyzstan 96.5 (2.1) 126.0 (10.8) 92.2 (15.1) 113.4 (9.3)
Latvia 79.4 (1.5) 83.8 (4.8) c c 84.3 (4.5)
Liechtenstein 82.2 (4.1) 77.5 (7.9) 82.8 (9.0) 80.3 (5.9)
Lithuania 85.8 (1.6) 83.5 (7.5) c c 85.2 (7.3)
Macao-China 78.0 (1.4) 74.5 (1.1) 74.7 (1.9) 74.5 (0.9)
Montenegro 92.4 (1.2) 90.6 (7.2) 89.0 (7.1) 90.6 (4.9)
Panama 94.5 (3.2) 116.7 (9.9) 137.4 (13.9) 134.7 (10.9)
Peru 97.2 (2.4) c c c c c c
Qatar 94.7 (1.0) 104.0 (1.6) 109.7 (1.7) 112.0 (1.2)
Romania 89.4 (2.3) c c c c c c
Russian Federation 88.2 (1.8) 89.7 (7.1) 90.1 (4.9) 90.0 (4.6)
Serbia 82.5 (1.5) 84.3 (3.7) 76.6 (4.7) 81.4 (2.8)
Shanghai-China 79.3 (1.6) c c c c c c
Singapore 96.2 (1.0) 98.9 (5.3) 98.4 (3.6) 99.1 (3.5)
Chinese Taipei 85.1 (1.9) c c c c c c
Thailand 71.8 (1.9) m m m m m m
Trinidad and Tobago 109.8 (1.4) 126.9 (11.4) 144.4 (14.9) 134.9 (8.8)
Tunisia 84.9 (1.8) c c c c c c
Uruguay 98.1 (1.7) c c c c c c
Source: PISA 2009 Database.Please refer to the Reader’s Guide for information concerning the symbols replacing missing data.

149UNTAPPED SKILLS: REALISING THE POTENTIAL OF IMMIGRANT STUDENTS © OECD 2012
DATA TABLES ON IMMIGRANT STUDENTS: ANNEX B
Table B2.3bStandard deviation in mathematics performance. by immigrant statusResults based on students’ self-reports
Non-immigrant students Second-generation students First-generation studentsImmigrant students (first- and
second-generation)
S.D. S.E. S.D. S.E. S.D. S.E. S.D. S.E.
OEC
D Australia 90.9 (0.9) 97.1 (4.4) 100.6 (3.6) 99.0 (3.7)
Austria 93.8 (2.1) 85.5 (3.7) 91.1 (6.9) 87.7 (3.4)
Belgium 99.3 (1.6) 96.1 (3.7) 98.1 (4.9) 97.0 (3.4)
Canada 85.7 (1.0) 85.9 (2.0) 95.7 (2.9) 90.4 (1.9)
Chile 79.4 (1.7) c c c c c c
Czech Republic 92.5 (1.7) 107.3 (9.0) 94.9 (12.8) 104.3 (8.2)
Denmark 84.3 (1.4) 84.2 (2.4) 85.6 (4.4) 85.2 (2.3)
Estonia 79.8 (1.3) 84.3 (7.7) 93.5 (11.4) 85.0 (7.1)
Finland 81.5 (1.1) 82.3 (8.1) 108.9 (13.2) 98.1 (9.3)
France 97.8 (2.3) 94.6 (4.6) 107.8 (8.6) 98.0 (4.8)
Germany 95.6 (1.8) 95.9 (3.5) 91.9 (4.3) 94.6 (2.9)
Greece 87.7 (1.9) 89.8 (6.5) 83.9 (8.7) 87.7 (6.6)
Hungary 91.8 (2.8) 82.5 (12.0) 85.2 (9.1) 84.3 (7.8)
Iceland 89.1 (1.2) c c 98.9 (12.6) 98.4 (11.0)
Ireland 83.8 (1.6) 79.0 (10.3) 87.7 (4.1) 86.8 (4.0)
Israel 102.4 (2.2) 97.2 (4.4) 101.5 (5.3) 99.0 (3.9)
Italy 91.7 (1.8) 93.2 (6.0) 86.6 (3.6) 89.1 (3.0)
Japan 93.3 (2.2) c c c c c c
Korea 87.8 (2.5) c c m m c c
Luxembourg 89.8 (1.4) 91.8 (2.6) 110.0 (2.7) 99.6 (1.9)
Mexico 76.3 (1.0) 88.2 (9.0) 77.2 (8.4) 81.8 (6.3)
Netherlands 87.2 (1.7) 78.4 (4.0) 91.6 (6.2) 82.1 (3.6)
New Zealand 92.7 (2.1) 101.7 (3.9) 101.0 (2.9) 102.2 (2.3)
Norway 83.4 (1.2) 94.0 (6.5) 95.8 (6.1) 95.2 (4.7)
Poland 87.7 (1.3) m m c c c c
Portugal 90.7 (1.5) 96.6 (6.6) 81.4 (4.8) 89.4 (3.7)
Slovak Republic 95.1 (2.3) c c c c c c
Slovenia 94.3 (0.9) 85.0 (3.9) 87.5 (6.1) 87.0 (3.3)
Spain 88.2 (1.1) 94.6 (7.0) 87.0 (2.6) 88.4 (2.4)
Sweden 89.4 (1.3) 89.1 (3.5) 102.9 (8.1) 94.1 (3.8)
Switzerland 92.6 (1.5) 98.4 (2.8) 108.9 (4.8) 102.6 (2.6)
Turkey 93.1 (3.0) c c c c c c
United Kingdom 85.1 (1.3) 83.7 (4.1) 87.4 (3.7) 86.3 (3.1)
United States 90.1 (1.8) 85.6 (2.9) 90.4 (3.7) 87.4 (2.7)
OECD average 89.5 (0.3) 90.5 (1.1) 94.0 (1.3) 92.2 (0.9)
Part
ners Albania 88.6 (2.1) c c c c c c
Argentina 92.6 (2.7) 87.2 (7.5) 103.3 (17.1) 93.8 (9.3)
Azerbaijan 64.4 (2.3) 52.9 (4.2) 51.8 (13.1) 52.9 (4.8)
Brazil 80.3 (1.7) 58.8 (10.4) 43.4 (9.7) 54.9 (8.4)
Bulgaria 97.7 (2.9) c c c c c c
Colombia 74.6 (1.7) c c c c 57.0 (11.0)
Croatia 88.1 (1.8) 86.7 (4.0) 86.1 (5.1) 86.5 (3.4)
Dubai (UAE) 76.6 (1.5) 90.3 (2.0) 91.3 (1.4) 92.2 (1.0)
Hong Kong-China 94.2 (2.0) 92.1 (2.5) 94.5 (3.1) 95.2 (2.4)
Indonesia 69.9 (2.3) m m c c c c
Jordan 80.4 (2.3) 85.8 (5.6) 83.8 (5.1) 85.4 (4.6)
Kazakhstan 80.7 (1.7) 99.7 (11.2) 83.3 (6.8) 99.1 (10.0)
Kyrgyzstan 79.6 (2.1) 92.3 (8.5) 83.3 (12.0) 88.4 (7.4)
Latvia 78.5 (1.4) 86.6 (5.3) c c 86.6 (5.2)
Liechtenstein 83.0 (4.2) 76.1 (8.5) 109.0 (14.0) 95.2 (9.4)
Lithuania 87.3 (1.7) 83.1 (8.2) c c 84.5 (7.5)
Macao-China 84.5 (1.9) 84.7 (1.1) 85.0 (2.6) 84.8 (1.1)
Montenegro 84.0 (1.6) 85.7 (7.2) 86.5 (8.1) 86.5 (5.6)
Panama 77.8 (2.9) 105.6 (9.5) 118.7 (14.3) 118.1 (13.3)
Peru 89.4 (2.5) c c c c c c
Qatar 76.5 (1.1) 87.1 (1.8) 101.5 (1.6) 100.5 (1.1)
Romania 79.1 (2.2) c c c c c c
Russian Federation 84.4 (2.2) 78.3 (3.9) 84.6 (4.4) 81.2 (2.8)
Serbia 89.5 (1.7) 98.0 (7.1) 84.2 (6.3) 92.7 (5.8)
Shanghai-China 102.5 (2.0) c c c c c c
Singapore 103.6 (1.2) 98.1 (4.3) 105.1 (3.8) 102.8 (3.2)
Chinese Taipei 103.9 (2.3) c c c c c c
Thailand 79.1 (2.5) m m m m m m
Trinidad and Tobago 97.8 (1.2) 113.0 (11.4) 116.7 (8.4) 115.3 (7.1)
Tunisia 77.2 (2.3) c c c c c c
Uruguay 90.7 (1.6) c c c c c c
Source: PISA 2009 Database.
Please refer to the Reader’s Guide for information concerning the symbols replacing missing data.

150 © OECD 2012 UNTAPPED SKILLS: REALISING THE POTENTIAL OF IMMIGRANT STUDENTS
ANNEX B: DATA TABLES ON IMMIGRANT STUDENTS
Table B2.3cStandard deviation in science performance, by immigrant statusResults based on students’ self-reports
Non-immigrant students Second-generation students First-generation studentsImmigrant students (first- and
second-generation)
S.D. S.E. S.D. S.E. S.D. S.E. S.D. S.E.
OEC
D Australia 98.0 (1.1) 103.5 (5.5) 109.8 (4.4) 106.7 (4.6)
Austria 96.8 (2.2) 89.9 (3.6) 105.4 (6.0) 95.9 (3.0)
Belgium 98.5 (1.9) 101.9 (4.4) 104.0 (5.3) 102.9 (3.8)
Canada 86.8 (1.0) 90.2 (2.3) 99.3 (2.6) 94.3 (1.8)
Chile 80.7 (1.4) c c c c c c
Czech Republic 96.4 (1.9) 122.8 (11.1) 98.5 (11.1) 116.3 (9.6)
Denmark 88.2 (1.4) 88.5 (2.9) 89.4 (5.0) 89.1 (2.7)
Estonia 82.6 (1.4) 83.0 (6.4) 87.8 (12.0) 83.3 (6.0)
Finland 87.8 (1.2) 99.3 (11.3) 112.2 (9.4) 107.5 (7.9)
France 99.7 (3.0) 98.5 (4.7) 103.8 (8.3) 99.9 (4.6)
Germany 95.2 (1.9) 96.5 (3.5) 95.3 (4.0) 96.1 (2.7)
Greece 89.5 (1.8) 89.8 (5.2) 92.9 (12.6) 92.9 (9.4)
Hungary 86.1 (2.9) 79.0 (8.2) 81.4 (8.6) 81.0 (6.3)
Iceland 93.7 (1.2) c c 101.5 (11.1) 102.9 (9.6)
Ireland 94.9 (2.1) 89.9 (10.3) 101.1 (5.0) 100.1 (4.8)
Israel 104.0 (2.1) 103.0 (4.6) 110.9 (5.3) 106.8 (4.3)
Italy 94.3 (1.6) 97.0 (4.9) 101.0 (4.2) 101.5 (3.6)
Japan 98.8 (2.5) c c c c c c
Korea 80.8 (2.2) c c m m c c
Luxembourg 92.6 (1.5) 98.6 (2.3) 123.6 (3.3) 109.4 (1.9)
Mexico 75.8 (0.9) 85.1 (7.2) 73.4 (7.3) 78.9 (5.3)
Netherlands 92.7 (1.9) 88.9 (5.8) 97.9 (8.0) 91.4 (5.1)
New Zealand 103.0 (2.6) 112.5 (5.0) 110.2 (2.8) 111.7 (2.9)
Norway 86.9 (1.1) 97.6 (6.9) 92.0 (5.4) 95.1 (4.3)
Poland 86.1 (1.2) m m c c c c
Portugal 82.5 (1.4) 83.6 (6.3) 76.8 (4.8) 80.3 (3.9)
Slovak Republic 94.4 (2.3) c c c c c c
Slovenia 92.0 (1.0) 89.0 (3.9) 87.1 (7.4) 89.1 (3.4)
Spain 85.0 (1.1) 81.8 (5.4) 85.4 (2.5) 85.8 (2.6)
Sweden 94.7 (1.4) 97.5 (4.5) 107.5 (8.6) 101.8 (4.5)
Switzerland 89.1 (1.5) 94.0 (2.3) 107.5 (3.9) 99.1 (2.1)
Turkey 80.1 (2.0) c c c c c c
United Kingdom 96.5 (1.3) 95.9 (5.3) 98.8 (4.2) 98.0 (3.9)
United States 96.5 (1.9) 91.3 (2.8) 99.5 (3.6) 94.1 (2.3)
OECD average 91.2 (0.3) 94.4 (1.1) 98.4 (1.3) 96.8 (1.0)
Part
ners Albania 86.6 (1.6) c c c c c c
Argentina 100.8 (3.2) 94.7 (9.0) 108.7 (21.4) 100.5 (12.2)
Azerbaijan 74.1 (1.6) 68.5 (6.2) 51.1 (7.6) 65.1 (5.3)
Brazil 83.2 (1.3) 56.3 (10.1) 66.1 (12.8) 61.2 (6.9)
Bulgaria 103.4 (2.5) c c c c c c
Colombia 80.3 (1.8) c c c c 61.8 (9.8)
Croatia 84.1 (1.7) 84.6 (4.2) 84.9 (5.3) 84.7 (3.4)
Dubai (UAE) 86.2 (1.7) 95.5 (2.4) 97.9 (1.6) 98.9 (1.3)
Hong Kong-China 87.1 (2.2) 83.5 (2.5) 89.0 (3.3) 87.0 (2.4)
Indonesia 68.7 (2.1) m m c c c c
Jordan 86.0 (1.9) 88.4 (4.9) 92.9 (5.7) 89.5 (3.8)
Kazakhstan 85.1 (1.7) 94.0 (6.0) 87.2 (5.4) 96.0 (5.3)
Kyrgyzstan 88.7 (2.1) 111.2 (13.4) 98.3 (12.2) 106.4 (10.0)
Latvia 77.3 (1.7) 81.3 (5.2) c c 82.7 (5.4)
Liechtenstein 84.9 (3.8) 81.0 (6.7) 87.3 (8.9) 84.8 (5.9)
Lithuania 84.4 (2.1) 84.0 (8.5) c c 85.2 (8.1)
Macao-China 76.4 (1.5) 75.0 (1.1) 76.2 (2.2) 75.3 (1.0)
Montenegro 86.8 (1.4) 87.1 (7.0) 83.1 (5.6) 84.7 (4.3)
Panama 85.9 (2.6) 110.7 (12.0) 116.6 (10.1) 117.8 (8.1)
Peru 88.7 (2.1) c c c c c c
Qatar 81.5 (1.1) 93.0 (1.7) 104.2 (1.7) 104.4 (1.1)
Romania 78.7 (1.9) c c c c c c
Russian Federation 89.3 (1.9) 85.3 (4.4) 88.5 (5.0) 86.7 (3.1)
Serbia 82.6 (1.6) 87.1 (3.9) 79.1 (4.2) 84.0 (3.2)
Shanghai-China 81.1 (1.6) c c c c c c
Singapore 103.0 (1.1) 103.6 (5.0) 107.6 (3.3) 106.3 (3.0)
Chinese Taipei 85.6 (1.6) c c c c c c
Thailand 79.5 (2.0) m m m m m m
Trinidad and Tobago 106.2 (1.1) 129.8 (12.5) 135.3 (13.9) 132.3 (8.1)
Tunisia 81.3 (1.9) c c c c c c
Uruguay 95.6 (1.6) c c c c c c
Source: PISA 2009 Database.
Please refer to the Reader’s Guide for information concerning the symbols replacing missing data.

151UNTAPPED SKILLS: REALISING THE POTENTIAL OF IMMIGRANT STUDENTS © OECD 2012
DATA TABLES ON IMMIGRANT STUDENTS: ANNEX B
Table B2.4Interquartile range of performance, by immigrant statusResults based on students’ self-reports
Performance in readingInterquartile range of performance: Performance
difference between 75th and 25th percentile
Non-immigrant studentsSecond-generation
students First-generation studentsImmigrant students (first- and second-generation)
Non-immigrant students
Second-generation students
First-generation students
Immigrant students (first- and second-
generation)25th
percentile75th
percentile25th
percentile75th
percentile25th
percentile75th
percentile25th
percentile75th
percentile
Score S.E. Score S.E. Score S.E. Score S.E. Score S.E. Score S.E. Score S.E. Score S.E. Score dif. Score dif. Score dif. Score dif.
OEC
D Australia 452 (3.0) 583 (2.1) 465 (6.6) 599 (8.8) 450 (7.2) 589 (8.0) 458 (5.5) 594 (7.2) 131 134 140 137Austria 414 (4.5) 554 (3.5) 358 (10.2) 491 (7.0) 312 (15.0) 451 (19.0) 343 (7.4) 482 (8.3) 140 133 139 139Belgium 454 (3.1) 590 (2.2) 384 (8.6) 529 (10.2) 375 (12.7) 521 (10.5) 379 (7.0) 524 (9.1) 137 145 146 144Canada 469 (2.0) 590 (1.8) 465 (5.3) 583 (4.5) 448 (6.0) 594 (5.8) 458 (4.6) 588 (4.4) 121 118 146 130Chile 396 (3.9) 508 (3.3) c c c c c c c c c c c c 111 c c cCzech Republic 415 (4.4) 545 (3.4) 352 (40.8) 539 (24.9) 397 (33.1) 555 (18.0) 370 (29.7) 548 (15.2) 130 187 158 178Denmark 448 (3.1) 559 (2.6) 391 (4.6) 504 (9.1) 365 (10.8) 479 (10.7) 382 (4.9) 496 (6.5) 111 112 115 114Estonia 450 (3.3) 562 (2.6) 416 (10.6) 530 (7.6) 401 (36.0) 535 (21.9) 416 (10.0) 531 (7.7) 112 114 134 115Finland 484 (2.8) 598 (2.3) 435 (21.9) 561 (40.0) 363 (22.6) 540 (25.7) 390 (21.0) 546 (23.0) 115 126 176 156France 442 (5.2) 578 (4.0) 378 (12.2) 527 (10.6) 345 (28.9) 503 (17.9) 372 (11.2) 521 (10.2) 137 148 158 149Germany 451 (4.0) 578 (3.3) 396 (8.3) 527 (8.5) 385 (8.1) 519 (9.6) 392 (6.6) 524 (7.3) 127 131 134 132Greece 428 (6.5) 554 (3.4) 390 (14.8) 520 (15.2) 359 (19.0) 485 (12.3) 368 (14.8) 496 (11.8) 126 130 126 128Hungary 435 (4.3) 560 (3.6) 477 (18.9) 585 (28.8) 434 (19.7) 552 (20.1) 453 (21.4) 562 (15.1) 124 108 118 109Iceland 443 (2.3) 569 (2.2) c c c c 349 (24.1) 476 (20.1) 353 (21.2) 491 (24.5) 126 c 127 139Ireland 444 (3.8) 566 (3.1) 448 (25.0) 561 (34.1) 392 (11.4) 544 (12.2) 400 (10.7) 547 (9.2) 122 113 152 147Israel 409 (4.6) 558 (3.1) 419 (7.9) 559 (9.4) 387 (14.7) 541 (10.4) 409 (7.3) 554 (8.8) 149 140 155 144Italy 429 (2.2) 559 (1.7) 378 (14.3) 521 (8.4) 346 (8.5) 473 (7.7) 353 (7.0) 488 (6.9) 130 144 127 136Japan 460 (4.8) 591 (3.0) c c c c c c c c c c c c 131 c c cKorea 491 (3.9) 596 (3.3) c c c c m m m m c c c c 104 c m cLuxembourg 435 (3.3) 562 (2.1) 371 (5.2) 512 (5.9) 360 (10.9) 536 (6.3) 367 (4.4) 519 (3.3) 126 140 177 152Mexico 375 (2.2) 487 (1.9) 286 (16.0) 400 (19.8) 275 (12.3) 374 (11.8) 280 (10.2) 381 (10.3) 112 114 99 102Netherlands 449 (7.4) 581 (5.4) 417 (9.5) 518 (10.5) 398 (14.3) 531 (21.0) 414 (9.3) 521 (9.8) 132 101 133 107New Zealand 460 (3.3) 597 (3.0) 418 (14.2) 581 (9.0) 446 (7.0) 601 (6.5) 438 (7.0) 594 (6.0) 136 162 154 156Norway 449 (3.5) 571 (3.0) 407 (12.4) 524 (13.7) 382 (13.8) 510 (11.6) 394 (8.8) 517 (8.8) 122 117 128 124Poland 444 (3.2) 565 (3.1) m m m m c c c c c c c c 122 m c cPortugal 436 (4.6) 553 (3.2) 425 (12.5) 529 (15.5) 391 (15.1) 516 (14.7) 408 (7.6) 523 (10.6) 118 105 125 115Slovak Republic 417 (3.8) 543 (2.8) c c c c c c c c c c c c 125 c c cSlovenia 427 (2.2) 554 (1.9) 385 (10.4) 504 (7.3) 354 (14.9) 477 (18.8) 379 (9.1) 499 (6.6) 128 119 123 121Spain 435 (2.8) 547 (2.1) 406 (18.3) 516 (17.9) 368 (7.0) 483 (4.4) 372 (7.9) 487 (3.9) 113 109 115 115Sweden 447 (3.7) 571 (3.3) 388 (11.9) 522 (11.1) 348 (15.4) 489 (20.0) 372 (10.3) 512 (11.1) 124 133 142 140Switzerland 455 (2.9) 576 (2.8) 403 (6.0) 539 (6.7) 379 (9.4) 531 (13.7) 395 (5.1) 537 (6.6) 121 136 153 141Turkey 411 (3.8) 523 (4.5) c c c c c c c c c c c c 112 c c cUnited Kingdom 436 (2.6) 565 (3.2) 426 (16.1) 556 (10.9) 399 (13.2) 521 (9.3) 410 (8.7) 544 (7.8) 129 130 122 133United States 440 (4.2) 574 (4.4) 423 (6.4) 542 (8.9) 411 (9.1) 554 (12.0) 419 (6.0) 546 (9.0) 135 119 143 127OECD average 439 (0.7) 564 (0.5) 404 (2.9) 533 (3.1) 379 (3.2) 517 (2.8) 391 (2.2) 524 (2.0) 125 129 138 133
Part
ners Albania 323 (4.9) 459 (4.8) c c c c c c c c c c c c 136 c c c
Argentina 333 (5.8) 475 (6.3) 299 (19.2) 441 (28.2) 293 (53.6) 441 (29.1) 299 (20.8) 440 (25.2) 143 142 148 142Azerbaijan 312 (4.3) 414 (4.0) 319 (16.5) 408 (19.2) 343 (22.7) 428 (22.8) 325 (10.5) 414 (14.2) 101 89 85 89Brazil 352 (2.6) 477 (3.9) 272 (31.2) 357 (27.8) 264 (40.4) 365 (41.6) 270 (23.8) 360 (20.2) 125 85 101 90Bulgaria 357 (8.2) 514 (6.2) c c c c c c c c c c c c 157 c c cColombia 358 (4.4) 474 (3.8) c c c c c c c c 270 (65.5) 364 (26.5) 116 c c 94Croatia 419 (4.5) 541 (3.2) 408 (8.8) 529 (8.3) 392 (14.7) 511 (13.7) 403 (7.9) 524 (7.9) 121 121 118 122Dubai (UAE) 332 (2.9) 461 (4.0) 403 (4.7) 536 (4.4) 440 (3.5) 574 (3.4) 426 (2.6) 560 (2.4) 129 133 134 134Hong Kong-China 484 (3.8) 594 (3.1) 493 (4.5) 599 (4.0) 459 (7.9) 570 (5.4) 480 (4.7) 589 (3.8) 110 105 111 109Indonesia 358 (4.0) 447 (4.7) m m m m c c c c c c c c 89 m c cJordan 354 (3.9) 467 (3.4) 364 (9.3) 484 (7.5) 356 (16.3) 472 (10.9) 362 (8.4) 481 (7.0) 113 119 117 119Kazakhstan 328 (3.2) 451 (4.0) 343 (11.4) 490 (15.0) 304 (9.1) 424 (11.0) 325 (10.2) 469 (16.1) 123 148 120 143Kyrgyzstan 252 (3.3) 378 (4.1) 256 (32.1) 457 (31.7) 281 (34.8) 407 (32.4) 270 (26.5) 432 (23.8) 126 201 126 161Latvia 430 (3.8) 541 (3.4) 410 (15.9) 534 (11.5) c c c c 411 (14.3) 535 (9.7) 111 123 c 124Liechtenstein 455 (7.5) 568 (7.9) 434 (23.0) 549 (16.5) 406 (20.5) 537 (18.5) 416 (20.7) 541 (9.0) 114 115 132 125Lithuania 413 (3.4) 532 (3.0) 389 (16.3) 517 (17.4) c c c c 388 (14.8) 516 (16.6) 119 127 c 129Macao-China 431 (3.4) 538 (2.7) 440 (2.2) 541 (1.9) 439 (3.3) 544 (4.1) 440 (1.8) 541 (1.6) 108 101 104 101Montenegro 346 (2.4) 474 (2.3) 373 (21.5) 500 (18.0) 347 (14.9) 462 (11.6) 354 (10.0) 475 (10.2) 128 126 115 122Panama 319 (5.9) 444 (7.1) 313 (35.2) 491 (37.1) 214 (24.4) 415 (66.0) 236 (40.0) 453 (42.2) 125 178 201 217Peru 308 (4.2) 441 (5.1) c c c c c c c c c c c c 133 c c cQatar 265 (1.7) 392 (2.3) 321 (3.7) 464 (3.4) 383 (3.7) 535 (3.6) 351 (2.7) 507 (2.0) 127 143 153 156Romania 366 (5.7) 488 (4.7) c c c c c c c c c c c c 122 c c cRussian Federation 406 (4.0) 522 (3.5) 377 (15.5) 494 (10.1) 387 (10.4) 504 (11.1) 382 (10.5) 498 (7.7) 117 116 117 115Serbia 388 (3.2) 500 (2.6) 407 (10.1) 521 (9.0) 391 (12.4) 500 (9.8) 401 (7.6) 512 (7.4) 112 113 109 110Shanghai-China 505 (3.4) 613 (2.8) c c c c c c c c c c c c 108 c c cSingapore 461 (2.2) 596 (2.2) 479 (13.7) 619 (13.9) 452 (6.6) 592 (9.1) 460 (6.6) 602 (6.1) 135 140 141 141Chinese Taipei 441 (3.0) 556 (2.9) c c c c c c c c c c c c 115 c c cThailand 373 (3.2) 469 (2.6) m m m m m m m m m m m m 96 m m mTrinidad and Tobago 348 (2.5) 500 (2.2) 316 (36.7) 507 (46.5) 313 (28.5) 556 (24.8) 319 (24.5) 533 (23.4) 151 191 243 214Tunisia 349 (3.4) 463 (3.4) c c c c c c c c c c c c 114 c c cUruguay 361 (3.3) 495 (3.1) c c c c c c c c c c c c 134 c c c
Source: PISA 2009 Database.
Please refer to the Reader’s Guide for information concerning the symbols replacing missing data.

152 © OECD 2012 UNTAPPED SKILLS: REALISING THE POTENTIAL OF IMMIGRANT STUDENTS
ANNEX B: DATA TABLES ON IMMIGRANT STUDENTS
Table B2.5Standard deviation in socio-economic background, by immigrant statusResults based on students’ self-reports
Non-immigrant students Second-generation students First-generation studentsImmigrant students (first- and
second-generation)
S.D. S.E. S.D. S.E. S.D. S.E. S.D. S.E.
OEC
D Australia 0.73 (0.00) 0.82 (0.02) 0.80 (0.02) 0.81 (0.02)
Austria 0.77 (0.01) 0.77 (0.03) 1.22 (0.09) 0.94 (0.05)
Belgium 0.88 (0.01) 1.04 (0.04) 1.10 (0.05) 1.07 (0.04)
Canada 0.80 (0.01) 0.91 (0.03) 0.88 (0.03) 0.91 (0.02)
Chile 1.14 (0.02) c c c c c c
Czech Republic 0.70 (0.01) 0.84 (0.06) 0.75 (0.07) 0.82 (0.06)
Denmark 0.83 (0.01) 0.99 (0.03) 0.97 (0.04) 0.98 (0.03)
Estonia 0.80 (0.01) 0.80 (0.04) 0.94 (0.07) 0.81 (0.04)
Finland 0.77 (0.01) 0.95 (0.11) 1.11 (0.11) 1.05 (0.09)
France 0.79 (0.01) 0.93 (0.04) 1.15 (0.09) 0.98 (0.04)
Germany 0.83 (0.01) 0.94 (0.04) 0.99 (0.06) 0.96 (0.03)
Greece 0.99 (0.01) 0.87 (0.06) 0.79 (0.05) 0.84 (0.05)
Hungary 0.97 (0.02) 0.92 (0.07) 0.75 (0.10) 0.85 (0.06)
Iceland 0.88 (0.01) c c 0.85 (0.08) 0.87 (0.07)
Ireland 0.84 (0.01) 0.83 (0.13) 0.89 (0.05) 0.88 (0.05)
Israel 0.83 (0.01) 1.06 (0.06) 1.00 (0.05) 1.04 (0.05)
Italy 1.01 (0.01) 1.12 (0.06) 0.89 (0.05) 0.95 (0.04)
Japan 0.72 (0.01) c c c c c c
Korea 0.82 (0.01) c c m m c c
Luxembourg 0.84 (0.01) 1.11 (0.02) 1.31 (0.03) 1.20 (0.02)
Mexico 1.30 (0.01) 1.10 (0.07) 1.26 (0.07) 1.20 (0.05)
Netherlands 0.77 (0.01) 0.97 (0.04) 1.16 (0.07) 1.02 (0.03)
New Zealand 0.77 (0.01) 0.84 (0.03) 0.79 (0.02) 0.82 (0.02)
Norway 0.71 (0.01) 0.90 (0.06) 0.98 (0.06) 0.94 (0.04)
Poland 0.88 (0.01) m m c c c c
Portugal 1.18 (0.02) 1.19 (0.06) 0.99 (0.06) 1.09 (0.04)
Slovak Republic 0.84 (0.01) c c c c c c
Slovenia 0.87 (0.01) 0.80 (0.04) 0.89 (0.08) 0.82 (0.04)
Spain 1.09 (0.02) 1.04 (0.06) 0.95 (0.03) 0.97 (0.03)
Sweden 0.76 (0.01) 0.85 (0.03) 1.26 (0.10) 1.01 (0.05)
Switzerland 0.79 (0.01) 0.91 (0.02) 1.11 (0.03) 0.99 (0.02)
Turkey 1.22 (0.02) c c c c c c
United Kingdom 0.76 (0.01) 0.92 (0.05) 0.99 (0.05) 0.96 (0.04)
United States 0.85 (0.02) 1.01 (0.03) 1.09 (0.03) 1.03 (0.03)
OECD average 0.87 (0.00) 0.94 (0.01) 1.00 (0.01) 0.96 (0.01)
Part
ners Albania 1.04 (0.02) c c c c c c
Argentina 1.20 (0.03) 0.88 (0.08) 1.14 (0.10) 1.00 (0.07)
Azerbaijan 0.99 (0.02) 1.01 (0.09) 1.01 (0.09) 1.04 (0.08)
Brazil 1.21 (0.01) 1.01 (0.07) 1.09 (0.17) 1.04 (0.09)
Bulgaria 0.97 (0.02) c c c c c c
Colombia 1.27 (0.02) c c c c 1.21 (0.18)
Croatia 0.90 (0.01) 1.01 (0.04) 0.83 (0.04) 0.96 (0.04)
Dubai (UAE) 0.97 (0.02) 0.76 (0.02) 0.62 (0.01) 0.69 (0.01)
Hong Kong-China 1.01 (0.02) 0.86 (0.02) 0.93 (0.03) 0.90 (0.02)
Indonesia 1.10 (0.02) m m c c c c
Jordan 1.05 (0.02) 1.01 (0.04) 0.95 (0.06) 1.01 (0.04)
Kazakhstan 0.82 (0.01) 0.84 (0.04) 0.85 (0.06) 0.85 (0.04)
Kyrgyzstan 0.93 (0.01) 0.96 (0.10) 1.15 (0.14) 1.04 (0.08)
Latvia 0.87 (0.01) 0.95 (0.05) c c 0.96 (0.05)
Liechtenstein 0.84 (0.04) 0.97 (0.08) 1.12 (0.06) 1.05 (0.05)
Lithuania 0.97 (0.01) 0.98 (0.06) c c 0.95 (0.05)
Macao-China 0.93 (0.02) 0.79 (0.01) 0.90 (0.02) 0.81 (0.01)
Montenegro 0.95 (0.01) 0.93 (0.06) 0.96 (0.05) 0.96 (0.03)
Panama 1.35 (0.04) 0.90 (0.10) 1.22 (0.10) 1.14 (0.07)
Peru 1.26 (0.03) c c c c c c
Qatar 1.00 (0.01) 0.88 (0.02) 0.69 (0.02) 0.80 (0.01)
Romania 0.91 (0.03) c c c c c c
Russian Federation 0.80 (0.01) 0.77 (0.02) 0.76 (0.04) 0.77 (0.02)
Serbia 0.98 (0.01) 0.96 (0.04) 0.84 (0.04) 0.92 (0.03)
Shanghai-China 1.04 (0.02) c c c c c c
Singapore 0.80 (0.01) 0.92 (0.04) 0.70 (0.03) 0.79 (0.02)
Chinese Taipei 0.82 (0.01) c c c c c c
Thailand 1.19 (0.02) m m m m m m
Trinidad and Tobago 0.92 (0.01) 1.18 (0.11) 1.03 (0.08) 1.14 (0.07)
Tunisia 1.31 (0.02) c c c c c c
Uruguay 1.22 (0.02) c c c c c c
Source: PISA 2009 Database.
Please refer to the Reader’s Guide for information concerning the symbols replacing missing data.

153UNTAPPED SKILLS: REALISING THE POTENTIAL OF IMMIGRANT STUDENTS © OECD 2012
DATA TABLES ON IMMIGRANT STUDENTS: ANNEX B
Table B2.6a Reading performance in PISA 2000 and 2009, by immigrant backgroundReading performance in PISA 2000 Reading performance in PISA 2009 Change between 2000 and 2009 (PISA 2009 - PISA 2000)
Non-immigrant students Immigrant students Non-immigrant students Immigrant students Non-immigrant students Immigrant students
Mean score S.E. Mean score S.E. Mean score S.E. Mean score S.E. Score dif. S.E. Score dif. S.E.
OEC
D Australia 532 (3.6) 520 (6.7) 515 (2.1) 524 (5.8) -18 (4.2) 4 (8.9)
Austria 502 (2.8) 409 (7.2) 482 (3.0) 414 (6.2) -21 (4.1) 5 (9.5)
Belgium 522 (3.8) 417 (7.6) 519 (2.2) 451 (6.4) -3 (4.4) 35 (9.9)
Canada 538 (1.5) 526 (3.2) 528 (1.5) 521 (3.4) -10 (2.2) -5 (4.7)
Chile 411 (3.6) c c 452 (3.0) c c 41 (4.7) c c
Czech Republic 501 (2.1) 463 (15.1) 479 (2.9) 457 (13.7) -22 (3.6) -7 (20.3)
Denmark 504 (2.2) 424 (7.6) 502 (2.2) 438 (3.8) -2 (3.1) 15 (8.5)
Estonia m m m m m m m m m m m m
Finland 548 (2.6) 476 (12.8) 538 (2.2) 468 (12.8) -9 (3.4) -8 (18.1)
France 512 (2.8) 464 (6.2) 505 (3.8) 444 (8.5) -7 (4.7) -20 (10.5)
Germany 507 (2.3) 423 (6.1) 511 (2.6) 455 (4.7) 4 (3.5) 32 (7.7)
Greece 478 (4.7) 413 (16.3) 489 (4.3) 432 (11.5) 11 (6.3) 18 (19.9)
Hungary 482 (4.0) 489 (11.2) 495 (3.1) 507 (8.3) 13 (5.0) 19 (13.9)
Iceland 509 (1.5) c c 504 (1.4) 423 (11.7) -5 (2.1) c c
Ireland 528 (3.2) 552 (11.0) 502 (3.0) 473 (7.1) -26 (4.4) -79 (13.1)
Israel 456 (9.6) 459 (9.9) 480 (3.3) 478 (6.4) 23 (10.1) 19 (11.8)
Italy 489 (2.9) 450 (13.3) 491 (1.6) 418 (4.2) 2 (3.3) -31 (13.9)
Japan 525 (5.1) c c 521 (3.4) c c -4 (6.2) c c
Korea m m m m 540 (3.4) c c m m c c
Luxembourg m m m m m m m m m m m m
Mexico 427 (3.3) 345 (8.1) 430 (1.8) 331 (7.9) 3 (3.8) -14 (11.3)
Netherlands m m m m m m m m m m m m
New Zealand 538 (2.7) 507 (7.1) 526 (2.6) 513 (4.7) -12 (3.7) 6 (8.5)
Norway 510 (2.7) 454 (6.7) 508 (2.6) 456 (5.9) -2 (3.8) 1 (8.9)
Poland 482 (4.4) c c 502 (2.6) c c 20 (5.1) c c
Portugal 472 (4.5) 457 (12.1) 492 (3.1) 466 (6.9) 20 (5.5) 9 (13.9)
Slovak Republic m m m m m m m m m m m m
Slovenia m m m m m m m m m m m m
Spain 494 (2.6) 457 (13.1) 488 (2.0) 430 (4.0) -7 (3.3) -27 (13.7)
Sweden 523 (2.1) 465 (5.4) 507 (2.8) 442 (6.9) -16 (3.5) -24 (8.7)
Switzerland 514 (4.0) 428 (4.8) 513 (2.2) 465 (4.1) -1 (4.5) 37 (6.3)
Turkey m m m m m m m m m m m m
United Kingdom m m m m m m m m m m m m
United States 511 (6.5) 472 (14.1) 506 (3.8) 484 (5.8) -5 (7.5) 12 (15.2)
OECD average 501 (0.8) 458 (2.1) 501 (0.5) 456 (1.6) -1 (0.9) -0 (2.6)
Part
ners Albania 351 (3.3) 296 (18.0) 389 (4.0) c c 38 (5.2) c c
Argentina 422 (9.2) 364 (22.7) 401 (4.6) 362 (15.2) -21 (10.3) -3 (27.3)
Azerbaijan m m m m m m m m m m m m
Brazil 398 (3.0) c c 416 (2.7) 317 (13.5) 17 (4.0) c c
Bulgaria 434 (4.9) c c 433 (6.7) c c -0 (8.3) c c
Colombia m m m m m m m m m m m m
Croatia m m m m m m m m m m m m
Dubai (UAE) m m m m m m m m m m m m
Hong Kong-China 531 (3.3) 521 (3.2) 535 (2.7) 531 (3.4) 4 (4.2) 10 (4.7)
Indonesia 372 (3.7) 294 (16.4) 403 (3.7) c c 31 (5.2) c c
Jordan m m m m m m m m m m m m
Kazakhstan m m m m m m m m m m m m
Kyrgyzstan m m m m m m m m m m m m
Latvia 462 (6.0) 452 (6.9) 485 (2.9) 474 (9.1) 23 (6.7) 22 (11.4)
Liechtenstein 500 (5.0) 419 (13.7) 510 (4.3) 479 (7.4) 10 (6.6) 61 (15.6)
Lithuania m m m m m m m m m m m m
Macao-China m m m m m m m m m m m m
Montenegro m m m m m m m m m m m m
Panama m m m m m m m m m m m m
Peru 331 (4.3) c c 374 (3.9) c c 43 (5.8) c c
Qatar m m m m m m m m m m m m
Romania 428 (3.5) c c 426 (4.0) c c -3 (5.3) c c
Russian Federation 463 (4.3) 456 (6.1) 464 (3.2) 439 (7.0) 1 (5.4) -17 (9.3)
Serbia m m m m m m m m m m m m
Shanghai-China m m m m m m m m m m m m
Singapore m m m m m m m m m m m m
Chinese Taipei m m m m m m m m m m m m
Thailand 432 (3.2) c c 421 (2.6) m m -10 (4.2) c c
Trinidad and Tobago m m m m m m m m m m m m
Tunisia m m m m m m m m m m m m
Uruguay m m m m m m m m m m m m
Note: Values that are statistically significant are indicated in bold (see Annex A).
Source: PISA 2009 Database.
Please refer to the Reader’s Guide for information concerning the symbols replacing missing data.

154 © OECD 2012 UNTAPPED SKILLS: REALISING THE POTENTIAL OF IMMIGRANT STUDENTS
ANNEX B: DATA TABLES ON IMMIGRANT STUDENTS
Table B2.6b Reading performance dispersion in PISA 2000 and 2009, by immigrant backgroundPerformance dispersion in reading PISA 2000 Performance dispersion in reading PISA 2009 Change between 2000 and 2009 (PISA 2009 - PISA 2000)
Non-immigrant students Immigrant students Non-immigrant students Immigrant students Non-immigrant students Immigrant students
Mean S.E. Mean S.E. Mean S.E. Mean S.E. Dif. S.E. Dif. S.E.
OEC
D Australia 100.0 (1.6) 105.5 (3.3) 96.3 (1.1) 101.2 (3.4) -3.77 (1.9) -4.3 (4.7)
Austria 92.4 (2.0) 106.2 (4.9) 96.9 (2.1) 95.0 (3.0) 4.5 (2.9) -11.19 (5.7)
Belgium 99.4 (3.0) 105.1 (3.6) 95.7 (1.5) 102.9 (3.5) -3.71 (3.3) -2.2 (5.0)
Canada 92.8 (1.2) 98.1 (1.9) 87.9 (0.9) 93.5 (1.8) -4.93 (1.5) -4.59 (2.6)
Chile 89.4 (1.7) c c 81.8 (1.7) c c -7.64 (2.4) c c
Czech Republic 85.7 (1.3) 95.3 (10.6) 91.6 (1.6) 110.5 (7.3) 5.88 (2.1) 15.19 (12.9)
Denmark 94.2 (1.6) 99.0 (5.6) 80.9 (1.3) 84.0 (2.2) -13.28 (2.1) -15 (6.0)
Estonia m m m m m m m m m m m m
Finland 88.7 (2.6) 109.9 (11.0) 85.0 (1.0) 106.2 (7.9) -3.65 (2.8) -3.72 (13.5)
France 89.6 (1.9) 90.4 (3.0) 102.4 (3.1) 107.9 (4.6) 12.73 (3.6) 17.52 (5.5)
Germany 93.7 (1.6) 103.6 (4.0) 91.3 (2.0) 93.2 (3.3) -2.41 (2.5) -10.41 (5.2)
Greece 95.3 (2.5) 104.5 (11.6) 92.6 (2.4) 97.7 (6.6) -2.73 (3.4) -6.83 (13.4)
Hungary 92.7 (2.0) 92.0 (6.0) 89.6 (2.2) 80.0 (5.5) -3.08 (3.0) -11.98 (8.1)
Iceland 91.1 (1.4) c c 94.0 (1.2) 103.4 (10.3) 2.85 (1.9) c c
Ireland 93.2 (1.7) 77.8 (8.7) 92.1 (2.2) 99.5 (4.7) -1.13 (2.8) 21.72 (9.8)
Israel 106.8 (4.8) 106.4 (6.1) 108.7 (2.4) 104.3 (3.3) 1.83 (5.3) -2.17 (6.9)
Italy 90.5 (2.6) 81.3 (8.1) 93.6 (1.5) 96.9 (3.4) 3.1 (3.0) 15.58 (8.8)
Japan 84.5 (3.1) c c 99.6 (2.9) c c 15.06 (4.2) c c
Korea m m m m 78.1 (2.1) c c m m c c
Luxembourg m m m m m m m m m m m m
Mexico 84.2 (2.1) 76.6 (6.1) 81.9 (1.0) 87.5 (7.5) -2.37 (2.3) 10.89 (9.7)
Netherlands m m m m m m m m m m m m
New Zealand 102.8 (2.0) 117.5 (3.8) 99.4 (1.9) 106.5 (2.5) -3.37 (2.7) -10.96 (4.5)
Norway 101.5 (1.8) 106.4 (5.2) 89.3 (1.2) 92.5 (5.4) -12.26 (2.2) -13.87 (7.5)
Poland 97.6 (2.9) c c 88.2 (1.2) c c -9.4 (3.1) c c
Portugal 96.2 (1.9) 103.9 (6.3) 85.8 (1.6) 82.7 (4.2) -10.37 (2.4) -21.14 (7.5)
Slovak Republic m m m m m m m m m m m m
Slovenia m m m m m m m m m m m m
Spain 84.1 (1.2) 91.1 (6.4) 85.0 (1.2) 86.6 (2.4) 0.94 (1.7) -4.48 (6.8)
Sweden 89.0 (1.2) 97.2 (2.9) 93.7 (1.5) 101.7 (4.3) 4.7 (1.9) 4.52 (5.1)
Switzerland 92.4 (2.0) 105.9 (2.8) 88.2 (1.5) 98.4 (2.1) -4.14 (2.5) -7.44 (3.5)
Turkey m m m m m m m m m m m m
United Kingdom m m m m m m m m m m m m
United States 102.4 (2.7) 114.5 (5.9) 95.5 (1.7) 95.3 (2.6) -6.87 (3.2) -19.21 (6.4)
OECD average 93.5 (0.4) 99.5 (1.4) 91.3 (0.3) 96.8 (1.0) -1.67 (0.6) -2.91 (1.7)
Part
ners Albania 98.8 (1.9) 88.5 (11.7) 97.0 (1.8) c c -1.8 (2.6) c c
Argentina 106.8 (3.4) 110.1 (12.3) 106.8 (3.1) 108.2 (9.7) 0.1 (4.6) -1.8 (15.7)
Azerbaijan m m m m m m m m m m m m
Brazil 85.3 (1.9) c c 92.4 (1.4) 74.8 (9.6) 7.1 (2.4) c c
Bulgaria 100.4 (3.1) c c 110.9 (2.5) c c 10.5 (4.0) c c
Colombia m m m m m m m m m m m m
Croatia m m m m m m m m m m m m
Dubai (UAE) m m m m m m m m m m m m
Hong Kong-China 81.9 (2.6) 83.8 (2.3) 83.5 (1.9) 83.9 (2.1) 1.5 (3.2) 0.1 (3.1)
Indonesia 71.4 (2.5) 50.6 (14.2) 66.1 (2.0) c c -5.3 (3.2) c c
Jordan m m m m m m m m m m m m
Kazakhstan m m m m m m m m m m m m
Kyrgyzstan m m m m m m m m m m m m
Latvia 102.3 (2.3) 98.4 (5.0) 79.4 (1.6) 84.3 (4.5) -22.9 (2.8) -14.1 (6.7)
Liechtenstein 88.2 (3.7) 101.7 (8.6) 82.2 (4.1) 80.3 (5.9) -6.0 (5.5) -21.4 (10.4)
Lithuania m m m m m m m m m m m m
Macao-China m m m m m m m m m m m m
Montenegro m m m m m m m m m m m m
Panama m m m m m m m m m m m m
Peru 94.9 (2.1) c c 97.2 (2.4) c c 2.3 (3.2) c c
Qatar m m m m m m m m m m m m
Romania 102.3 (2.5) c c 89.4 (2.3) c c -13.0 (3.4) c c
Russian Federation 91.6 (1.8) 92.1 (4.2) 88.2 (1.8) 90.0 (4.6) -3.4 (2.6) -2.2 (6.3)
Serbia m m m m m m m m m m m m
Shanghai-China m m m m m m m m m m m m
Singapore m m m m m m m m m m m m
Chinese Taipei m m m m m m m m m m m m
Thailand 76.4 (1.7) c c 71.8 (1.9) m m -4.5 (2.5) c c
Trinidad and Tobago m m m m m m m m m m m m
Tunisia m m m m m m m m m m m m
Uruguay m m m m m m m m m m m m
Note: Values that are statistically significant are indicated in bold (see Annex A).
Source: PISA 2009 Database.
Please refer to the Reader’s Guide for information concerning the symbols replacing missing data.

155UNTAPPED SKILLS: REALISING THE POTENTIAL OF IMMIGRANT STUDENTS © OECD 2012
DATA TABLES ON IMMIGRANT STUDENTS: ANNEX B
Table B2.6c Socio-economic background in PISA 2000 and 2009, by immigrant backgroundSocio-economic background in PISA 2000 Socio-economic background in PISA 2009 Change between 2000 and 2009 (PISA 2009 - PISA 2000)
Non-immigrant students Immigrant students Non-immigrant students Immigrant students Non-immigrant students Immigrant students
Mean S.E. Mean S.E. Mean S.E. Mean S.E. Dif. S.E. Dif. S.E.
OEC
D Australia 0.29 (0.03) 0.26 (0.06) 0.35 (0.01) 0.34 (0.03) 0.06 (0.0) 0.08 (0.1)
Austria 0.07 (0.02) -0.64 (0.06) 0.17 (0.02) -0.55 (0.04) 0.1 (0.0) 0.09 (0.1)
Belgium 0.24 (0.02) -0.49 (0.06) 0.28 (0.02) -0.27 (0.06) 0.04 (0.0) 0.22 (0.1)
Canada 0.64 (0.01) 0.58 (0.03) 0.53 (0.01) 0.44 (0.04) -0.11 (0.0) -0.14 (0.1)
Chile -0.62 (0.04) c c -0.57 (0.04) c c 0.05 (0.1) c c
Czech Republic -0.03 (0.02) -0.41 (0.11) -0.08 (0.01) -0.21 (0.10) -0.05 (0.0) 0.2 (0.1)
Denmark 0.33 (0.03) -0.43 (0.10) 0.36 (0.03) -0.39 (0.04) 0.03 (0.0) 0.04 (0.1)
Estonia m m m m m m m m m m m m
Finland 0.05 (0.02) -0.14 (0.15) 0.38 (0.02) 0.06 (0.12) 0.33 (0.0) 0.2 (0.2)
France -0.06 (0.02) -0.74 (0.07) -0.05 (0.03) -0.66 (0.06) 0.01 (0.0) 0.08 (0.1)
Germany 0.35 (0.02) -0.37 (0.06) 0.32 (0.02) -0.40 (0.04) -0.03 (0.0) -0.03 (0.1)
Greece -0.10 (0.04) -0.32 (0.08) 0.04 (0.03) -0.64 (0.05) 0.14 (0.1) -0.32 (0.1)
Hungary -0.27 (0.03) 0.01 (0.10) -0.19 (0.03) -0.17 (0.10) 0.08 (0.0) -0.18 (0.1)
Iceland 0.53 (0.01) c c 0.74 (0.02) -0.08 (0.10) 0.21 (0.0) c c
Ireland -0.04 (0.03) 0.23 (0.13) 0.04 (0.03) 0.13 (0.06) 0.08 (0.0) -0.1 (0.1)
Israel 0.16 (0.05) 0.13 (0.06) 0.04 (0.02) -0.28 (0.06) -0.12 (0.1) -0.41 (0.1)
Italy 0.04 (0.02) -0.52 (0.19) -0.09 (0.01) -0.72 (0.05) -0.13 (0.0) -0.2 (0.2)
Japan m m m m -0.01 (0.01) c c m m c c
Korea m m m m -0.15 (0.03) c c m m c c
Luxembourg m m m m m m m m m m m m
Mexico -1.19 (0.06) -1.81 (0.10) -1.19 (0.03) -1.77 (0.09) 0 (0.1) 0.04 (0.1)
Netherlands m m m m m m m m m m m m
New Zealand 0.10 (0.02) 0.14 (0.04) 0.08 (0.02) 0.11 (0.03) -0.02 (0.0) -0.03 (0.1)
Norway 0.40 (0.02) -0.16 (0.06) 0.51 (0.02) -0.03 (0.06) 0.11 (0.0) 0.13 (0.1)
Poland -0.22 (0.03) c c -0.28 (0.02) c c -0.06 (0.0) c c
Portugal -0.39 (0.05) -0.10 (0.14) -0.31 (0.04) -0.37 (0.07) 0.08 (0.1) -0.27 (0.2)
Slovak Republic m m m m m m m m m m m m
Slovenia m m m m m m m m m m m m
Spain -0.55 (0.05) -0.87 (0.18) -0.27 (0.03) -0.74 (0.05) 0.28 (0.1) 0.13 (0.2)
Sweden 0.41 (0.02) -0.14 (0.05) 0.40 (0.02) -0.16 (0.05) -0.01 (0.0) -0.02 (0.1)
Switzerland 0.19 (0.03) -0.43 (0.04) 0.21 (0.02) -0.35 (0.05) 0.02 (0.0) 0.08 (0.1)
Turkey m m m m m m m m m m m m
United Kingdom m m m m m m m m m m m m
United States 0.42 (0.04) -0.14 (0.16) 0.31 (0.04) -0.39 (0.08) -0.11 (0.1) -0.25 (0.2)
OECD average 0.03 (0.01) -0.29 (0.02) 0.06 (0.00) -0.31 (0.01) 0.04 (0.0) -0.03 (0.0)
Part
ners Albania -0.64 (0.02) -0.64 (0.18) -0.95 (0.04) c c -0.31 (0.04) c c
Argentina -0.58 (0.08) -1.00 (0.11) -0.60 (0.05) -1.17 (0.10) -0.02 (0.09) -0.17 (0.15)
Azerbaijan m m m m m m m m m m m m
Brazil -1.09 (0.04) c c -1.15 (0.03) -1.34 (0.23) -0.06 (0.05) c c
Bulgaria 0.13 (0.04) c c -0.10 (0.04) c c -0.23 (0.06) c c
Colombia m m m m m m m m m m m m
Croatia m m m m m m m m m m m m
Dubai (UAE) m m m m m m m m m m m m
Hong Kong-China -0.62 (0.03) -1.08 (0.03) -0.53 (0.05) -1.22 (0.03) 0.09 (0.06) -0.14 (0.04)
Indonesia -1.57 (0.04) -1.56 (0.23) -1.55 (0.06) c c 0.02 (0.07) c c
Jordan m m m m m m m m m m m m
Kazakhstan m m m m m m m m m m m m
Kyrgyzstan m m m m m m m m m m m m
Latvia 0.01 (0.03) -0.15 (0.04) -0.13 (0.03) -0.07 (0.10) -0.14 (0.04) 0.08 (0.11)
Liechtenstein 0.06 (0.05) -0.58 (0.14) 0.25 (0.05) -0.28 (0.10) 0.19 (0.07) 0.30 (0.17)
Lithuania m m m m m m m m m m m m
Macao-China m m m m m m m m m m m m
Montenegro m m m m m m m m m m m m
Panama m m m m m m m m m m m m
Peru -1.21 (0.04) c c -1.30 (0.05) c c -0.09 (0.06) c c
Qatar m m m m m m m m m m m m
Romania -0.66 (0.04) c c -0.36 (0.03) c c 0.30 (0.05) c c
Russian Federation -0.53 (0.03) -0.49 (0.06) -0.19 (0.02) -0.33 (0.04) 0.34 (0.04) 0.16 (0.07)
Serbia m m m m m m m m m m m m
Shanghai-China m m m m m m m m m m m m
Singapore m m m m m m m m m m m m
Chinese Taipei m m m m m m m m m m m m
Thailand -1.58 (0.04) c c -1.31 (0.04) m m 0.27 (0.06) c c
Trinidad and Tobago m m m m m m m m m m m m
Tunisia m m m m m m m m m m m m
Uruguay m m m m m m m m m m m m
Note: Values that are statistically significant are indicated in bold (see Annex A).
Source: PISA 2009 Database.
Please refer to the Reader’s Guide for information concerning the symbols replacing missing data.

156 © OECD 2012 UNTAPPED SKILLS: REALISING THE POTENTIAL OF IMMIGRANT STUDENTS
ANNEX B: DATA TABLES ON IMMIGRANT STUDENTS
Table B2.6d Socio-economic dispersion in PISA 2000 and 2009, by immigrant backgroundSocio-economic dispersion in PISA 2000 Socio-economic dispersion in PISA 2009 Change between 2000 and 2009 (PISA 2009 - PISA 2000)
Non-immigrant students Immigrant students Non-immigrant students Immigrant students Non-immigrant students Immigrant students
Mean S.E. Mean S.E. Mean S.E. Mean S.E. Dif. S.E. Dif. S.E.
OEC
D Australia 0.79 (0.02) 0.84 (0.03) 0.73 (0.00) 0.81 (0.02) -0.06 (0.0) -0.03 (0.0)
Austria 0.80 (0.01) 1.00 (0.05) 0.77 (0.01) 0.94 (0.05) -0.03 (0.0) -0.06 (0.1)
Belgium 0.82 (0.01) 1.00 (0.03) 0.88 (0.01) 1.07 (0.04) 0.06 (0.0) 0.07 (0.1)
Canada 0.76 (0.01) 0.88 (0.02) 0.80 (0.01) 0.91 (0.02) 0.04 (0.0) 0.03 (0.0)
Chile 1.11 (0.02) c c 1.14 (0.02) c c 0.03 (0.0) c c
Czech Republic 0.71 (0.01) 0.86 (0.08) 0.70 (0.01) 0.82 (0.06) -0.01 (0.0) -0.04 (0.1)
Denmark 0.89 (0.01) 1.12 (0.04) 0.83 (0.01) 0.98 (0.03) -0.06 (0.0) -0.14 (0.1)
Estonia m m m m m m m m m m m m
Finland 0.93 (0.01) 1.16 (0.08) 0.77 (0.01) 1.05 (0.09) -0.16 (0.0) -0.11 (0.1)
France 0.78 (0.01) 1.01 (0.03) 0.79 (0.01) 0.98 (0.04) 0.01 (0.0) -0.03 (0.1)
Germany 0.85 (0.01) 0.98 (0.05) 0.83 (0.01) 0.96 (0.03) -0.02 (0.0) -0.02 (0.1)
Greece 1.05 (0.02) 0.82 (0.06) 0.99 (0.01) 0.84 (0.05) -0.06 (0.0) 0.02 (0.1)
Hungary 0.89 (0.02) 0.88 (0.08) 0.97 (0.02) 0.85 (0.06) 0.08 (0.0) -0.03 (0.1)
Iceland 0.90 (0.01) c c 0.88 (0.01) 0.87 (0.07) -0.02 (0.0) c c
Ireland 0.86 (0.01) 0.93 (0.07) 0.84 (0.01) 0.88 (0.05) -0.02 (0.0) -0.05 (0.1)
Israel 0.83 (0.02) 0.89 (0.04) 0.83 (0.01) 1.04 (0.05) 0 (0.0) 0.15 (0.1)
Italy 0.95 (0.01) 0.93 (0.09) 1.01 (0.01) 0.95 (0.04) 0.06 (0.0) 0.02 (0.1)
Japan m m m m 0.72 (0.01) c c m m c c
Korea m m m m 0.82 (0.01) c c m m c c
Luxembourg m m m m m m m m m m m m
Mexico 1.21 (0.04) 1.07 (0.07) 1.30 (0.01) 1.20 (0.05) 0.09 (0.0) 0.13 (0.1)
Netherlands m m m m m m m m m m m m
New Zealand 0.77 (0.01) 0.92 (0.03) 0.77 (0.01) 0.82 (0.02) 0 (0.0) -0.1 (0.0)
Norway 0.81 (0.01) 1.02 (0.06) 0.71 (0.01) 0.94 (0.04) -0.1 (0.0) -0.08 (0.1)
Poland 0.87 (0.01) c c 0.88 (0.01) c c 0.01 (0.0) c c
Portugal 1.13 (0.02) 1.22 (0.05) 1.18 (0.02) 1.09 (0.04) 0.05 (0.0) -0.13 (0.1)
Slovak Republic m m m m m m m m m m m m
Slovenia m m m m m m m m m m m m
Spain 1.12 (0.02) 1.17 (0.07) 1.09 (0.02) 0.97 (0.03) -0.03 (0.0) -0.2 (0.1)
Sweden 0.76 (0.01) 0.89 (0.03) 0.76 (0.01) 1.01 (0.05) 0 (0.0) 0.12 (0.1)
Switzerland 0.86 (0.02) 1.01 (0.02) 0.79 (0.01) 0.99 (0.02) -0.07 (0.0) -0.02 (0.0)
Turkey m m m m m m m m m m m m
United Kingdom m m m m m m m m m m m m
United States 0.77 (0.01) 1.08 (0.04) 0.85 (0.02) 1.03 (0.03) 0.08 (0.0) -0.05 (0.1)
OECD average 0.89 (0.00) 0.99 (0.01) 0.88 (0.00) 0.96 (0.01) -0.01 (0.0) -0.03 (0.0)
Part
ners Albania 0.91 (0.01) 0.91 (0.10) 1.04 (0.02) c c 0.13 (0.02) c c
Argentina 1.14 (0.03) 0.85 (0.05) 1.20 (0.03) 1.00 (0.07) 0.06 (0.04) 0.15 (0.09)
Azerbaijan m m m m m m m m m m m m
Brazil 1.17 (0.02) c c 1.21 (0.01) 1.04 (0.09) 0.04 (0.02) c c
Bulgaria 0.81 (0.02) c c 0.97 (0.02) c c 0.16 (0.03) c c
Colombia m m m m m m m m m m m m
Croatia m m m m m m m m m m m m
Dubai (UAE) m m m m m m m m m m m m
Hong Kong-China 0.90 (0.02) 0.77 (0.03) 1.01 (0.02) 0.90 (0.02) 0.11 (0.03) 0.13 (0.04)
Indonesia 0.96 (0.02) 0.87 (0.07) 1.10 (0.02) c c 0.14 (0.03) c c
Jordan m m m m m m m m m m m m
Kazakhstan m m m m m m m m m m m m
Kyrgyzstan m m m m m m m m m m m m
Latvia 0.75 (0.02) 0.75 (0.02) 0.87 (0.01) 0.96 (0.05) 0.12 (0.02) 0.21 (0.05)
Liechtenstein 0.80 (0.03) 1.06 (0.12) 0.84 (0.04) 1.05 (0.05) 0.04 (0.05) -0.01 (0.13)
Lithuania m m m m m m m m m m m m
Macao-China m m m m m m m m m m m m
Montenegro m m m m m m m m m m m m
Panama m m m m m m m m m m m m
Peru 1.10 (0.02) c c 1.26 (0.03) c c 0.16 (0.04) c c
Qatar m m m m m m m m m m m m
Romania 1.11 (0.02) c c 0.91 (0.03) c c -0.20 (0.04) c c
Russian Federation 0.78 (0.01) 0.80 (0.03) 0.80 (0.01) 0.77 (0.02) 0.02 (0.01) -0.03 (0.04)
Serbia m m m m m m m m m m m m
Shanghai-China m m m m m m m m m m m m
Singapore m m m m m m m m m m m m
Chinese Taipei m m m m m m m m m m m m
Thailand 0.99 (0.03) c c 1.19 (0.02) m m 0.20 (0.04) c c
Trinidad and Tobago m m m m m m m m m m m m
Tunisia m m m m m m m m m m m m
Uruguay m m m m m m m m m m m m
Note: Values that are statistically significant are indicated in bold (see Annex A).
Source: PISA 2009 Database.
Please refer to the Reader’s Guide for information concerning the symbols replacing missing data.

157UNTAPPED SKILLS: REALISING THE POTENTIAL OF IMMIGRANT STUDENTS © OECD 2012
DATA TABLES ON IMMIGRANT STUDENTS: ANNEX B
Table B2.6ePerformance in reading and socio-economic background in PISA 2000 and 2009, second-generation students
Mean performanceStandard deviation of
performanceChange between 2000 and
2009 (PISA 2009-PISA 2000)Mean socio-economic
backgroundStandard deviation of socio-
economic backgroundChange between 2000 and
2009 (PISA 2009-PISA 2000)
2000 2009 2000 2009Mean
performance
Standard deviation of performance 2000 2009 2000 2009
Mean socio-economic
background
Standard deviation of socio-economic
background
Mean score S.E.
Mean score S.E. S.D. S.E. S.D. S.E.
Score dif. S.E.
S.D. dif. S.E. Mean S.E. Mean S.E. S.D. S.E. S.D S.E.
Mean dif. S.E.
S.D. dif. S.E.
OEC
D Australia 528 (7.1) 530 (6.3) 100 (4.3) 98 (4.0) 2 (9.4) -2 (5.9) 0.21 (0.06) 0.28 (0.04) 0.82 (0.03) 0.82 (0.02) 0.07 (0.07) 0.00 (0.04)Austria 429 (10.6) 427 (6.0) 107 (6.4) 89 (3.5) -2 (12.2) -17 (7.3) -0.70 (0.10) -0.50 (0.04) 1.07 (0.08) 0.77 (0.03) 0.20 (0.11) -0.30 (0.09)Belgium 411 (8.7) 454 (7.0) 102 (3.8) 102 (4.4) 44 (11.1) 0 (5.8) -0.66 (0.06) -0.32 (0.07) 0.95 (0.03) 1.04 (0.04) 0.34 (0.09) 0.09 (0.05)Canada 539 (3.1) 522 (3.6) 95 (2.4) 89 (2.2) -17 (4.8) -6 (3.3) 0.58 (0.03) 0.34 (0.04) 0.88 (0.02) 0.91 (0.03) -0.24 (0.05) 0.03 (0.04)Chile c c c c c c c c c c c c c c c c c c c c c c c cCzech Republic c c 448 (17.9) c c 114 (9.2) c c c c c c -0.32 (0.13) c c 0.84 (0.06) c c c cDenmark 409 (13.9) 446 (4.3) 106 (11.4) 83 (2.5) 37 (14.6) -23 (11.7) -0.61 (0.20) -0.42 (0.05) 1.29 (0.09) 0.99 (0.03) 0.19 (0.21) -0.30 (0.09)Estonia m m m m m m m m m m m m m m m m m m m m m m m mFinland c c 493 (13.9) c c 88 (8.3) c c c c c c 0.26 (0.13) c c 0.95 (0.11) c c c cFrance 471 (6.2) 449 (8.9) 88 (3.4) 105 (4.4) -21 (10.8) 17 (5.6) -0.73 (0.07) -0.65 (0.06) 1.00 (0.04) 0.93 (0.04) 0.08 (0.09) -0.07 (0.06)Germany 432 (9.0) 457 (6.1) 103 (5.4) 94 (3.9) 25 (10.8) -9 (6.6) -0.28 (0.08) -0.46 (0.04) 1.03 (0.06) 0.94 (0.04) -0.18 (0.09) -0.09 (0.07)Greece c c 456 (10.4) c c 98 (5.8) c c c c c c -0.35 (0.09) c c 0.87 (0.06) c c c cHungary c c 527 (12.4) c c 80 (9.9) c c c c c c 0.05 (0.16) c c 0.92 (0.07) c c c cIceland c c c c c c c c c c c c c c c c c c c c c c c cIreland 519 (20.2) 508 (12.8) 89 (11.2) 88 (8.3) -11 (23.9) -1 (14.0) -0.08 (0.17) 0.10 (0.15) 0.99 (0.12) 0.83 (0.13) 0.18 (0.23) -0.16 (0.18)Israel 461 (9.1) 487 (6.5) 99 (6.1) 101 (3.6) 26 (11.2) 2 (7.0) 0.12 (0.06) -0.21 (0.07) 0.90 (0.06) 1.06 (0.06) -0.33 (0.09) 0.16 (0.08)Italy c c 446 (9.4) c c 102 (6.8) c c c c c c -0.56 (0.09) c c 1.12 (0.06) c c c cJapan c c c c c c c c c c c c m m c c m m c c c c c cKorea m m c c m m c c c c c c m m c c m m c c c c c cLuxembourg m m m m m m m m m m m m m m m m m m m m m m m mMexico 378 (15.3) 340 (9.9) 85 (11.5) 84 (8.8) -38 (18.2) -1 (14.5) -1.64 (0.22) -1.71 (0.13) 1.21 (0.14) 1.10 (0.07) -0.07 (0.26) -0.11 (0.16)Netherlands m m m m m m m m m m m m m m m m m m m m m m m mNew Zealand 507 (10.3) 498 (8.3) 119 (6.6) 106 (4.6) -9 (13.2) -13 (8.0) -0.20 (0.06) -0.15 (0.06) 0.93 (0.03) 0.84 (0.03) 0.05 (0.08) -0.09 (0.04)Norway 464 (10.6) 463 (8.0) 95 (7.4) 93 (7.7) -1 (13.3) -2 (10.6) -0.04 (0.12) 0.08 (0.08) 0.88 (0.06) 0.90 (0.06) 0.12 (0.14) 0.02 (0.08)Poland c c m m c c m m c c c c c c m m c c m m c c c cPortugal 463 (14.3) 476 (9.4) 106 (7.9) 82 (6.3) 13 (17.1) -24 (10.1) -0.23 (0.18) -0.42 (0.11) 1.30 (0.07) 1.19 (0.06) -0.19 (0.21) -0.11 (0.09)Slovak Republic m m m m m m m m m m m m m m m m m m m m m m m mSlovenia m m m m m m m m m m m m m m m m m m m m m m m mSpain 450 (15.9) 461 (9.3) 82 (15.4) 85 (5.5) 11 (18.4) 3 (16.4) -1.37 (0.19) -0.49 (0.11) 0.93 (0.17) 1.04 (0.06) 0.88 (0.22) 0.11 (0.18)Sweden 485 (7.3) 454 (7.5) 93 (5.5) 97 (4.6) -31 (10.5) 5 (7.1) -0.02 (0.07) -0.05 (0.05) 0.84 (0.03) 0.85 (0.03) -0.03 (0.09) 0.01 (0.04)Switzerland 460 (6.8) 471 (4.5) 98 (3.8) 95 (2.1) 11 (8.1) -4 (4.4) -0.23 (0.06) -0.39 (0.05) 1.03 (0.03) 0.91 (0.02) -0.16 (0.08) -0.12 (0.04)Turkey m m m m m m m m m m m m m m m m m m m m m m m mUnited Kingdom m m m m m m m m m m m m m m m m m m m m m m m mUnited States 478 (19.4) 483 (6.2) 122 (8.8) 92 (3.0) 6 (20.4) -30 (9.3) -0.11 (0.18) -0.38 (0.08) 1.08 (0.05) 1.01 (0.03) -0.27 (0.20) -0.07 (0.06)OECD average 464 (2.9) 468 (2.0) 99 (1.9) 94 (1.3) 3 (3.4) -6 (2.3) -0.35 (0.03) -0.29 (0.02) 1.01 (0.02) 0.95 (0.01) 0.04 (0.04) -0.06 (0.02)
Part
ners Albania c c c c c c c c c c c c c c c c c c c c c c c c
Argentina 360 (26.2) 366 (12.6) 110.1 (14.1) 99 (7.4) 5 (29.0) -10.97 (15.9) -0.95 (0.13) -1.23 (0.10) 0.87 (0.06) 0.88 (0.08) -0.28 (0.16) 0.01 (0.10)Azerbaijan m m m m m m m m m m m m m m m m m m m m m m m mBrazil c c 321 (18.7) c c 77 (13.8) c c c c c c -1.25 (0.26) c c 1.01 (0.07) c c c cBulgaria c c c c c c c c c c c c c c c c c c c c c c c cColombia m m m m m m m m m m m m m m m m m m m m m m m mCroatia m m m m m m m m m m m m m m m m m m m m m m m mDubai (UAE) m m m m m m m m m m m m m m m m m m m m m m m mHong Kong-China 532 (3.2) 543 (3.2) 81.8 (2.5) 81 (2.0) 11 (4.5) -0.79 (3.2) -0.97 (0.03) -1.11 (0.03) 0.73 (0.02) 0.86 (0.02) -0.14 (0.04) 0.13 (0.03)Indonesia c c m m c c m m c c c c c c m m c c m m c c c cJordan m m m m m m m m m m m m m m m m m m m m m m m mKazakhstan m m m m m m m m m m m m m m m m m m m m m m m mKyrgyzstan m m m m m m m m m m m m m m m m m m m m m m m mLatvia 423 (15.1) 472 (9.7) 95.6 (9.0) 84 (4.8) 49 (18.0) -11.8 (10.2) -0.20 (0.18) -0.11 (0.11) 0.85 (0.07) 0.95 (0.05) 0.09 (0.21) 0.10 (0.09)Liechtenstein 446 (14.8) 486 (10.0) 85.5 (11.2) 78 (7.9) 39 (17.9) -7.99 (13.8) c c -0.33 (0.14) c c 0.97 (0.08) c c c cLithuania m m m m m m m m m m m m m m m m m m m m m m m mMacao-China m m m m m m m m m m m m m m m m m m m m m m m mMontenegro m m m m m m m m m m m m m m m m m m m m m m m mPanama m m m m m m m m m m m m m m m m m m m m m m m mPeru c c c c c c c c c c c c c c c c c c c c c c c cQatar m m m m m m m m m m m m m m m m m m m m m m m mRomania c c c c c c c c c c c c c c c c c c c c c c c cRussian Federation 452 (9.9) 435 (9.4) 96.8 (8.3) 90 (7.1) -17 (13.7) -7.06 (10.9) -0.48 (0.06) -0.34 (0.05) 0.77 (0.04) 0.77 (0.02) 0.14 (0.08) 0.00 (0.04)Serbia m m m m m m m m m m m m m m m m m m m m m m m mShanghai-China m m m m m m m m m m m m m m m m m m m m m m m mSingapore m m m m m m m m m m m m m m m m m m m m m m m mChinese Taipei m m m m m m m m m m m m m m m m m m m m m m m mThailand c c m m c c m m c c c c c c m m c c m m c c c cTrinidad and Tobago m m m m m m m m m m m m m m m m m m m m m m m m
Tunisia m m m m m m m m m m m m m m m m m m m m m m m mUruguay m m m m m m m m m m m m m m m m m m m m m m m m
Note: Values that are statistically significant are indicated in bold (see Annex A).
Source: PISA 2009 Database.
Please refer to the Reader’s Guide for information concerning the symbols replacing missing data.

158 © OECD 2012 UNTAPPED SKILLS: REALISING THE POTENTIAL OF IMMIGRANT STUDENTS
ANNEX B: DATA TABLES ON IMMIGRANT STUDENTS
Table B2.6fPerformance in reading and socio-economic background in PISA 2000 and 2009, first-generation students
Mean performanceStandard deviation of
performanceChange between 2000 and
2009 (PISA 2009-PISA 2000)Mean socio-economic
backgroundStandard deviation of socio-
economic backgroundChange between 2000 and
2009 (PISA 2009-PISA 2000)
2000 2009 2000 2009Mean
performance
Standard deviation of performance 2000 2009 2000 2009
Mean socio-economic
background
Standard deviation of socio-economic
background
Mean score S.E.
Mean score S.E. S.D. S.E. S.D. S.E.
Score dif. S.E.
S.D. dif. S.E. Mean S.E. Mean S.E. S.D. S.E. S.D S.E.
Mean dif. S.E.
S.D. dif. S.E.
OEC
D Australia 513 (9.3) 518 (6.3) 109 (4.4) 104 (3.8) 5 (11.2) -5 (5.7) 0.30 (0.08) 0.41 (0.03) 0.86 (0.05) 0.80 (0.02) 0.11 (0.09) -0.06 (0.05)Austria 398 (8.9) 384 (10.4) 104 (6.1) 100 (6.6) -13 (13.7) -4 (9.0) -0.61 (0.07) -0.68 (0.11) 0.95 (0.05) 1.22 (0.09) -0.07 (0.13) 0.27 (0.10)Belgium 431 (9.5) 448 (8.3) 112 (6.1) 104 (4.6) 16 (12.6) -8 (7.6) -0.06 (0.09) -0.23 (0.07) 1.01 (0.05) 1.10 (0.05) -0.17 (0.11) 0.09 (0.07)Canada 511 (4.9) 520 (4.6) 100 (2.3) 99 (2.6) 9 (6.7) -0 (3.5) 0.57 (0.04) 0.57 (0.04) 0.89 (0.04) 0.88 (0.03) 0.00 (0.06) -0.01 (0.05)Chile c c c c c c c c c c c c c c c c c c c c c c c cCzech Republic c c 472 (17.5) c c 103 (9.1) c c c c c c -0.01 (0.13) c c 0.75 (0.07) c c c cDenmark 433 (7.6) 422 (6.2) 93 (5.0) 83 (3.7) -11 (9.8) -10 (6.2) -0.31 (0.08) -0.33 (0.07) 0.99 (0.05) 0.97 (0.04) -0.02 (0.11) -0.02 (0.06)Estonia m m m m m m m m m m m m m m m m m m m m m m m mFinland 468 (12.9) 449 (17.7) 103 (10.5) 115 (10.5) -18 (21.9) 13 (14.8) -0.24 (0.15) -0.10 (0.18) 1.07 (0.07) 1.11 (0.11) 0.14 (0.23) 0.04 (0.13)France 434 (11.5) 428 (15.9) 96 (6.4) 115 (8.9) -6 (19.7) 19 (10.9) -0.75 (0.11) -0.68 (0.15) 1.04 (0.07) 1.15 (0.09) 0.07 (0.19) 0.11 (0.11)Germany 419 (7.5) 450 (5.7) 104 (5.1) 91 (4.8) 32 (9.4) -13 (7.0) -0.41 (0.08) -0.30 (0.06) 0.95 (0.06) 0.99 (0.06) 0.11 (0.10) 0.04 (0.08)Greece 403 (17.5) 420 (15.5) 100 (11.9) 95 (8.6) 17 (23.4) -5 (14.6) -0.33 (0.09) -0.78 (0.06) 0.79 (0.06) 0.79 (0.05) -0.45 (0.11) 0.00 (0.08)Hungary 486 (11.6) 493 (11.6) 89 (6.7) 77 (6.1) 7 (16.4) -12 (9.1) -0.02 (0.11) -0.33 (0.12) 0.87 (0.08) 0.75 (0.10) -0.31 (0.16) -0.12 (0.13)Iceland c c 417 (12.4) c c 103 (11.8) c c c c c c -0.17 (0.11) c c 0.85 (0.08) c c c cIreland 573 (9.2) 466 (7.6) 62 (7.8) 100 (5.1) -107 (11.9) 38 (9.3) 0.41 (0.15) 0.14 (0.06) 0.85 (0.07) 0.89 (0.05) -0.27 (0.16) 0.04 (0.09)Israel 456 (15.2) 462 (9.2) 119 (8.0) 108 (4.7) 6 (17.7) -11 (9.3) 0.15 (0.09) -0.41 (0.07) 0.87 (0.06) 1.00 (0.05) -0.56 (0.11) 0.13 (0.08)Italy c c 410 (4.5) c c 94 (4.1) c c c c c c -0.77 (0.06) c c 0.89 (0.04) c c c cJapan c c c c c c c c c c c c m m c c m m c c c c c cKorea m m m m m m m m m m m m m m m m m m m m m m m mLuxembourg m m m m m m m m m m m m m m m m m m m m m m m mMexico 329 (8.2) 324 (9.9) 67 (6.7) 89 (10.1) -5 (12.8) 22 (12.1) -1.89 (0.12) -1.80 (0.11) 1.00 (0.07) 1.26 (0.07) 0.09 (0.16) 0.26 (0.10)Netherlands m m m m m m m m m m m m m m m m m m m m m m m mNew Zealand 507 (7.6) 520 (4.6) 117 (5.3) 106 (2.8) 13 (8.9) -11 (5.9) 0.29 (0.05) 0.23 (0.03) 0.88 (0.04) 0.79 (0.02) -0.06 (0.06) -0.09 (0.04)Norway 449 (8.5) 447 (7.8) 112 (6.3) 92 (6.6) -2 (11.6) -19 (9.1) -0.21 (0.08) -0.17 (0.08) 1.07 (0.08) 0.98 (0.06) 0.04 (0.11) -0.09 (0.10)Poland c c c c c c c c c c c c c c c c c c c c c c c cPortugal 450 (15.8) 456 (8.8) 101 (11.4) 82 (4.9) 6 (18.1) -19 (12.4) 0.07 (0.14) -0.33 (0.08) 1.10 (0.07) 0.99 (0.06) -0.40 (0.16) -0.11 (0.09)Slovak Republic m m m m m m m m m m m m m m m m m m m m m m m mSlovenia m m m m m m m m m m m m m m m m m m m m m m m mSpain 460 (17.8) 426 (4.1) 95 (8.0) 86 (2.5) -34 (18.3) -9 (8.3) -0.67 (0.21) -0.77 (0.05) 1.20 (0.06) 0.95 (0.03) -0.10 (0.22) -0.25 (0.07)Sweden 450 (7.2) 416 (11.3) 98 (4.6) 106 (6.8) -34 (13.4) 8 (8.2) -0.23 (0.06) -0.39 (0.12) 0.91 (0.04) 1.26 (0.10) -0.16 (0.13) 0.35 (0.11)Switzerland 402 (6.1) 455 (6.7) 105 (3.4) 104 (4.5) 53 (9.1) -0 (5.7) -0.59 (0.05) -0.27 (0.08) 0.96 (0.03) 1.11 (0.03) 0.32 (0.09) 0.15 (0.04)Turkey m m m m m m m m m m m m m m m m m m m m m m m mUnited Kingdom m m m m m m m m m m m m m m m m m m m m m m m mUnited States 466 (10.0) 485 (7.9) 105 (5.8) 101 (3.7) 20 (12.7) -3 (6.9) -0.19 (0.14) -0.41 (0.10) 1.09 (0.06) 1.09 (0.03) -0.22 (0.17) 0.00 (0.07)OECD average 452 (2.5) 447 (2.1) 100 (1.6) 98 (1.4) -2 (3.3) -2 (2.1) -0.24 (0.02) -0.33 (0.02) 0.97 (0.01) 0.98 (0.01) -0.10 (0.03) 0.04 (0.02)
Part
ners Albania c c c c c c c c c c c c c c c c c c c c c c c c
Argentina c c 356 (26.5) c c 121.0 (17.2) c c c c c c -1.09 (0.15) c c 1.14 (0.10) c c c cAzerbaijan m m m m m m m m m m m m m m m m m m m m m m m mBrazil c c 310 (18.6) c c 69.9 (12.7) c c c c c c -1.50 (0.40) c c 1.09 (0.17) c c c cBulgaria c c c c c c c c c c c c c c c c c c c c c c c cColombia m m m m m m m m m m m m m m m m m m m m m m m mCroatia m m m m m m m m m m m m m m m m m m m m m m m mDubai (UAE) m m m m m m m m m m m m m m m m m m m m m m m mHong Kong-China 504 (4.8) 512 (5.5) 84.0 (3.4) 84.7 (3.1) 7 (7.3) 0.74 (4.6) -1.24 (0.06) -1.38 (0.04) 0.80 (0.07) 0.93 (0.03) -0.14 (0.07) 0.13 (0.08)Indonesia c c c c c c c c c c c c c c c c c c c c c c c cJordan m m m m m m m m m m m m m m m m m m m m m m m mKazakhstan m m m m m m m m m m m m m m m m m m m m m m m mKyrgyzstan m m m m m m m m m m m m m m m m m m m m m m m mLatvia 454 (7.3) c c 98.3 (5.3) c c c c c c -0.15 (0.04) c c 0.74 (0.02) c c c c c cLiechtenstein 392 (21.4) 474 (11.2) 109.8 (13.0) 82.8 (9.0) 82 (24.1) -27.04 (15.8) -0.59 (0.24) -0.25 (0.14) 1.22 (0.18) 1.12 (0.06) 0.34 (0.28) -0.10 (0.19)Lithuania m m m m m m m m m m m m m m m m m m m m m m m mMacao-China m m m m m m m m m m m m m m m m m m m m m m m mMontenegro m m m m m m m m m m m m m m m m m m m m m m m mPanama m m m m m m m m m m m m m m m m m m m m m m m mPeru c c c c c c c c c c c c c c c c c c c c c c c cQatar m m m m m m m m m m m m m m m m m m m m m m m mRomania c c c c c c c c c c c c c c c c c c c c c c c cRussian Federation 458 (9.6) 444 (7.1) 89.3 (4.7) 90.1 (4.9) -13 (12.0) 0.82 (6.8) -0.49 (0.08) -0.31 (0.07) 0.82 (0.04) 0.76 (0.04) 0.18 (0.11) -0.06 (0.06)Serbia m m m m m m m m m m m m m m m m m m m m m m m mShanghai-China m m m m m m m m m m m m m m m m m m m m m m m mSingapore m m m m m m m m m m m m m m m m m m m m m m m mChinese Taipei m m m m m m m m m m m m m m m m m m m m m m m mThailand c c m m c c m m c c c c c c m m c c m m c c c cTrinidad and Tobago m m m m m m m m m m m m m m m m m m m m m m m mTunisia m m m m m m m m m m m m m m m m m m m m m m m mUruguay m m m m m m m m m m m m m m m m m m m m m m m m
Note: Values that are statistically significant are indicated in bold (see Annex A).
Source: PISA 2009 Database.
Please refer to the Reader’s Guide for information concerning the symbols replacing missing data.

159UNTAPPED SKILLS: REALISING THE POTENTIAL OF IMMIGRANT STUDENTS © OECD 2012
DATA TABLES ON IMMIGRANT STUDENTS: ANNEX B
Table B3.1
Percentage of students and reading performance, by immigrant status and language spoken at homeResults based on students’ self-reports
Percentage of students
Non-immigrant students speaking the language of
assessment at home
Non-immigrant students speaking another language
at home
Second-generation students speaking the
language of assessment at home
Second-generation students speaking another
language at home
First-generation students speaking the language of
assessment at home
First-generation students speaking another language
at home
% S.E. % S.E. % S.E. % S.E. % S.E. % S.E.
OEC
D Australia 76.3 (1.1) 0.8 (0.1) 8.3 (0.4) 3.6 (0.3) 6.3 (0.3) 4.7 (0.5)Austria 86.2 (1.1) 1.3 (0.2) 2.3 (0.3) 6.3 (0.6) 1.0 (0.3) 2.9 (0.3)Belgium 71.8 (1.4) 14.4 (0.7) 3.3 (0.3) 3.8 (0.4) 3.4 (0.6) 3.2 (0.4)Canada 73.7 (1.3) 2.6 (0.2) 8.6 (0.6) 4.7 (0.4) 3.6 (0.3) 6.9 (0.5)Chile 99.1 (0.1) 0.4 (0.1) 0.1 (0.0) 0.0 (0.0) 0.4 (0.1) 0.0 (0.0)Czech Republic 97.6 (0.2) 0.5 (0.1) 0.9 (0.2) 0.3 (0.1) 0.1 (0.1) 0.6 (0.1)Denmark 92.1 (0.4) 0.5 (0.1) 2.8 (0.2) 2.3 (0.2) 0.7 (0.1) 1.6 (0.2)Estonia 90.2 (0.7) 1.9 (0.3) 6.6 (0.6) 0.8 (0.2) 0.5 (0.1) 0.1 (0.0)Finland 95.6 (0.4) 1.8 (0.2) 0.4 (0.1) 0.7 (0.1) 0.3 (0.1) 1.2 (0.2)France 85.7 (1.3) 2.3 (0.4) 6.1 (0.7) 3.0 (0.4) 1.1 (0.2) 1.7 (0.3)Germany 83.4 (1.0) 1.4 (0.2) 5.1 (0.5) 5.0 (0.5) 1.3 (0.2) 3.8 (0.4)Greece 90.0 (0.9) 1.3 (0.3) 2.6 (0.3) 0.3 (0.1) 2.7 (0.4) 3.2 (0.5)Hungary 97.1 (0.4) 0.8 (0.3) 0.9 (0.1) 0.0 (0.0) 1.1 (0.2) 0.1 (0.1)Iceland 96.4 (0.3) 1.3 (0.2) 0.2 (0.1) 0.2 (0.1) 0.3 (0.1) 1.6 (0.2)Ireland 89.8 (1.0) 2.2 (0.9) 1.3 (0.2) 0.1 (0.1) 3.1 (0.3) 3.5 (0.4)Israel 77.4 (1.3) 4.2 (0.7) 9.3 (0.6) 2.6 (0.3) 1.7 (0.2) 4.7 (0.6)Italy 84.0 (0.4) 10.7 (0.4) 0.8 (0.1) 0.5 (0.1) 1.0 (0.1) 3.1 (0.2)Japan 99.6 (0.1) 0.1 (0.0) 0.1 (0.0) 0.0 (0.0) 0.1 (0.0) 0.1 (0.0)Korea 99.9 (0.0) 0.1 (0.0) c c c c c c c cLuxembourg 2.6 (0.3) 60.6 (0.7) 4.2 (0.3) 17.6 (0.6) 4.4 (0.2) 10.7 (0.5)Mexico 96.1 (0.3) 2.2 (0.2) 0.7 (0.1) 0.1 (0.0) 0.8 (0.1) 0.3 (0.1)Netherlands 87.6 (1.4) 1.5 (0.5) 5.3 (0.8) 2.5 (0.4) 1.0 (0.2) 2.1 (0.3)New Zealand 72.5 (1.1) 2.8 (0.2) 5.0 (0.4) 3.0 (0.4) 7.9 (0.5) 8.7 (0.5)Norway 91.2 (0.6) 2.0 (0.2) 1.2 (0.2) 2.4 (0.4) 0.3 (0.1) 2.9 (0.3)Poland 99.4 (0.1) 0.6 (0.1) c c c c c c c cPortugal 94.2 (0.5) 0.6 (0.1) 2.5 (0.3) 0.2 (0.1) 1.7 (0.2) 0.8 (0.1)Slovak Republic 94.3 (0.8) 5.2 (0.8) 0.2 (0.1) 0.1 (0.0) 0.2 (0.1) 0.1 (0.1)Slovenia 91.6 (0.4) 1.2 (0.2) 2.9 (0.3) 3.0 (0.3) 0.3 (0.1) 1.0 (0.2)Spain 76.6 (1.0) 13.9 (0.9) 0.6 (0.1) 0.5 (0.1) 4.9 (0.4) 3.5 (0.3)Sweden 88.6 (1.1) 1.2 (0.2) 2.9 (0.3) 4.0 (0.6) 0.6 (0.1) 2.8 (0.4)Switzerland 75.6 (0.9) 3.1 (0.3) 6.2 (0.6) 7.4 (0.4) 3.0 (0.5) 4.8 (0.3)Turkey 95.8 (0.6) 3.7 (0.5) 0.4 (0.1) 0.0 (0.0) 0.1 (0.1) 0.0 (0.0)United Kingdom 88.4 (1.0) 1.3 (0.2) 4.0 (0.6) 1.8 (0.3) 1.5 (0.2) 3.1 (0.3)United States 79.3 (1.4) 1.4 (0.2) 6.0 (0.6) 6.9 (0.6) 1.7 (0.2) 4.7 (0.5)OECD average 85.9 (0.1) 4.4 (0.1) 3.2 (0.1) 2.6 (0.1) 1.8 (0.0) 2.8 (0.1)
Part
ners Albania 98.4 (0.3) 1.0 (0.2) 0.5 (0.2) 0.0 (0.0) 0.1 (0.1) 0.0 (0.0)
Argentina 95.9 (0.5) 0.7 (0.1) 1.8 (0.3) 0.2 (0.1) 1.0 (0.2) 0.4 (0.1)Azerbaijan 90.0 (1.2) 6.9 (1.0) 2.0 (0.5) 0.3 (0.1) 0.6 (0.1) 0.2 (0.1)Brazil 98.6 (0.2) 0.6 (0.1) 0.5 (0.1) 0.0 (0.0) 0.3 (0.1) 0.0 (0.0)Bulgaria 89.1 (1.8) 10.5 (1.7) 0.1 (0.1) 0.1 (0.0) 0.0 (0.0) 0.2 (0.1)Colombia 99.3 (0.1) 0.4 (0.1) 0.3 (0.1) 0.0 (0.0) 0.1 (0.0) 0.0 (0.0)Croatia 88.0 (0.7) 1.3 (0.4) 7.0 (0.5) 0.2 (0.1) 3.3 (0.3) 0.2 (0.1)Dubai (UAE) 16.1 (0.4) 9.4 (0.4) 12.8 (0.5) 14.4 (0.5) 20.5 (0.6) 26.9 (0.6)Hong Kong-China 57.8 (1.6) 2.8 (0.8) 22.8 (0.8) 1.2 (0.2) 12.2 (0.8) 3.3 (0.5)Indonesia 35.5 (2.1) 64.3 (2.1) c c c c 0.0 (0.0) 0.2 (0.1)Jordan 84.0 (0.9) 2.3 (0.3) 10.0 (0.7) 0.5 (0.1) 3.0 (0.3) 0.3 (0.1)Kazakhstan 79.4 (1.3) 9.0 (0.8) 6.7 (0.8) 0.6 (0.2) 3.9 (0.6) 0.5 (0.1)Kyrgyzstan 79.6 (1.6) 18.6 (1.6) 1.0 (0.1) 0.2 (0.1) 0.6 (0.2) 0.2 (0.1)Latvia 87.1 (1.3) 8.6 (1.2) 3.3 (0.4) 0.7 (0.2) 0.3 (0.1) 0.1 (0.1)Liechtenstein 69.5 (3.0) 0.7 (0.5) 8.1 (1.5) 5.7 (1.4) 7.6 (1.6) 8.5 (1.6)Lithuania 94.7 (0.8) 3.6 (0.7) 1.0 (0.2) 0.6 (0.2) 0.1 (0.1) 0.1 (0.0)Macao-China 24.1 (0.6) 5.5 (0.2) 50.6 (0.6) 4.3 (0.2) 14.2 (0.4) 1.3 (0.2)Montenegro 92.4 (0.4) 1.0 (0.2) 2.3 (0.3) 0.2 (0.1) 3.6 (0.3) 0.5 (0.2)Panama 92.4 (1.4) 3.9 (0.9) 0.8 (0.2) 0.4 (0.1) 1.4 (0.4) 1.2 (0.4)Peru 94.7 (0.8) 4.9 (0.8) 0.3 (0.1) 0.0 (0.0) 0.1 (0.1) 0.0 (0.0)Qatar 34.2 (0.4) 19.4 (0.3) 13.1 (0.4) 6.9 (0.3) 14.0 (0.3) 12.5 (0.3)Romania 96.6 (0.6) 3.1 (0.6) 0.1 (0.1) 0.0 (0.0) 0.1 (0.1) 0.1 (0.0)Russian Federation 80.9 (1.4) 7.0 (1.1) 5.9 (0.5) 1.3 (0.7) 3.8 (0.4) 1.1 (0.2)Serbia 89.0 (0.6) 1.6 (0.3) 5.1 (0.4) 0.1 (0.1) 4.1 (0.4) 0.2 (0.1)Shanghai-China 98.1 (0.3) 1.3 (0.2) 0.1 (0.0) 0.0 (0.0) 0.3 (0.1) 0.1 (0.1)Singapore 37.8 (0.8) 48.0 (1.0) 1.4 (0.2) 3.4 (0.3) 1.6 (0.2) 7.9 (0.4)Chinese Taipei 77.9 (1.2) 21.7 (1.2) 0.2 (0.1) 0.0 (0.0) 0.1 (0.1) 0.1 (0.0)Thailand 51.4 (1.7) 48.6 (1.7) c c c c c c c cTrinidad and Tobago 95.4 (0.3) 2.3 (0.2) 1.2 (0.2) 0.1 (0.1) 0.7 (0.1) 0.4 (0.1)Tunisia 99.6 (0.1) 0.1 (0.0) 0.2 (0.1) 0.0 (0.0) 0.1 (0.1) 0.0 (0.0)Uruguay 97.3 (0.2) 2.2 (0.2) 0.2 (0.1) 0.0 (0.0) 0.2 (0.1) 0.1 (0.1)
Note: Values that are statistically significant are indicated in bold (see Annex A).
Source: PISA 2009 Database.
Please refer to the Reader’s Guide for information concerning the symbols replacing missing data.
[Part 1/3]

160 © OECD 2012 UNTAPPED SKILLS: REALISING THE POTENTIAL OF IMMIGRANT STUDENTS
ANNEX B: DATA TABLES ON IMMIGRANT STUDENTS
Table B3.1
Percentage of students and reading performance, by immigrant status and language spoken at home (continued)Results based on students’ self-reports
Reading performance
Non-immigrant students speaking another language
at home
Non-immigrant students speaking the language of
assessment at home
Second-generation students speaking another
language at home
Second-generation students speaking the
language of assessment at home
First-generation students speaking another language
at home
First-generation students speaking the language of
assessment at home
Mean score S.E. Mean score S.E. Mean score S.E. Mean score S.E. Mean score S.E. Mean score S.E.
OEC
D Australia 461 (12.2) 516 (2.0) 527 (9.2) 534 (6.0) 505 (11.8) 530 (4.8)Austria 431 (19.1) 485 (3.0) 429 (7.3) 441 (11.6) 387 (11.1) 416 (28.5)Belgium 505 (5.2) 524 (2.4) 442 (10.7) 480 (8.3) 435 (10.5) 463 (12.9)Canada 495 (5.3) 530 (1.5) 517 (5.7) 530 (3.9) 516 (5.5) 535 (6.3)Chile c c 452 (3.0) c c c c m m c cCzech Republic c c 481 (2.8) c c 459 (17.1) 485 (21.5) c cDenmark 456 (20.7) 503 (2.2) 440 (5.6) 464 (6.3) 420 (8.3) 442 (10.5)Estonia 470 (9.2) 506 (2.7) 454 (14.5) 472 (6.9) c c c cFinland 499 (8.0) 539 (2.2) 476 (16.7) c c 446 (19.7) c cFrance 436 (14.9) 509 (3.8) 433 (13.3) 470 (9.6) 431 (18.6) 451 (21.3)Germany 493 (13.4) 513 (2.6) 448 (8.3) 483 (8.0) 450 (8.1) 480 (11.2)Greece 412 (16.7) 490 (4.4) c c 457 (10.0) 404 (20.3) 441 (16.6)Hungary c c 496 (3.1) c c 527 (12.8) c c 494 (11.6)Iceland 451 (16.0) 505 (1.4) c c c c 425 (14.6) c cIreland 507 (14.2) 503 (3.0) c c 511 (13.3) 444 (11.4) 494 (9.5)Israel 444 (20.0) 484 (3.4) 523 (9.2) 486 (6.6) 476 (8.9) 464 (12.6)Italy 452 (3.7) 504 (1.4) 443 (12.1) 471 (10.3) 410 (4.9) 431 (9.9)Japan c c 522 (3.4) c c c c c c c cKorea c c 541 (3.4) m m c c m m m mLuxembourg 500 (2.0) 517 (11.7) 439 (3.5) 501 (6.9) 433 (6.0) 540 (8.3)Mexico 354 (7.4) 432 (1.8) c c 347 (10.2) 284 (14.9) 350 (8.8)Netherlands 510 (23.1) 517 (5.2) 463 (10.8) 477 (10.6) 471 (15.1) 483 (20.8)New Zealand 432 (9.4) 530 (2.5) 469 (13.3) 516 (8.9) 491 (6.0) 553 (5.9)Norway 466 (10.9) 509 (2.5) 453 (9.4) 484 (13.4) 440 (7.8) c cPoland c c 503 (2.6) m m m m m m c cPortugal 493 (14.9) 493 (3.1) c c 486 (9.1) 455 (10.5) 463 (11.5)Slovak Republic 413 (12.3) 483 (2.6) c c c c c c c cSlovenia 464 (14.4) 489 (1.1) 439 (6.7) 466 (8.6) 412 (11.3) c cSpain 489 (4.1) 488 (2.0) 458 (14.1) 466 (11.9) 414 (6.1) 436 (4.5)Sweden 454 (19.4) 509 (2.7) 445 (8.2) 473 (10.2) 415 (13.2) c cSwitzerland 490 (7.9) 517 (2.2) 465 (5.2) 498 (5.6) 436 (6.0) 507 (10.9)Turkey 409 (11.1) 468 (3.6) c c c c c c c cUnited Kingdom 433 (11.5) 501 (2.3) 471 (10.1) 504 (8.9) 457 (10.3) 470 (11.8)United States 453 (14.5) 507 (3.8) 473 (7.2) 496 (8.1) 476 (8.4) 513 (12.8)OECD average 460 (2.5) 502 (0.6) 462 (2.2) 481 (1.9) 439 (2.4) 474 (2.9)
Part
ners Albania 367 (19.9) 389 (4.0) m m c c c c c c
Argentina c c 404 (4.6) c c 376 (13.1) c c 377 (26.7)Azerbaijan 386 (10.7) 361 (3.4) c c 359 (10.3) c c c cBrazil 362 (12.4) 416 (2.7) c c 322 (18.9) c c 305 (20.9)Bulgaria 343 (10.0) 446 (6.5) c c c c c c c cColombia 371 (25.8) 416 (3.6) m m c c m m c cCroatia 470 (21.5) 479 (2.9) c c 466 (5.4) c c 454 (8.5)Dubai (UAE) 415 (4.4) 386 (2.9) 463 (3.8) 480 (5.0) 488 (3.0) 528 (3.4)Hong Kong-China 466 (8.8) 540 (2.8) 497 (14.8) 546 (3.2) 484 (12.3) 520 (5.0)Indonesia 400 (3.6) 409 (6.4) m m m m c c c cJordan 388 (12.9) 408 (3.1) 389 (19.2) 423 (6.6) c c 420 (9.2)Kazakhstan 405 (8.3) 389 (3.2) 381 (18.4) 418 (12.9) 411 (18.6) 360 (9.4)Kyrgyzstan 359 (6.7) 308 (3.3) c c 373 (24.1) c c c cLatvia 472 (9.2) 488 (3.0) c c 484 (9.6) c c c cLiechtenstein c c 513 (4.5) c c c c c c c cLithuania 433 (7.5) 473 (2.5) c c 435 (13.3) c c c cMacao-China 450 (3.6) 492 (2.3) 451 (4.5) 494 (1.4) 447 (8.7) 496 (2.5)Montenegro 362 (14.5) 411 (1.7) c c 439 (10.0) c c 415 (7.7)Panama 317 (20.3) 385 (5.5) c c 413 (35.5) c c 371 (42.6)Peru 272 (7.6) 381 (4.0) m m c c c c c cQatar 326 (2.3) 336 (1.6) 390 (5.4) 394 (2.7) 470 (3.7) 449 (3.0)Romania 361 (13.1) 428 (4.0) m m c c c c c cRussian Federation 421 (9.1) 468 (3.3) 389 (26.1) 446 (6.0) 392 (14.4) 459 (7.7)Serbia 406 (12.4) 443 (2.4) c c 466 (6.9) c c 446 (7.2)Shanghai-China 493 (12.1) 558 (2.3) m m c c c c c cSingapore 503 (1.9) 561 (2.0) 526 (7.5) 591 (13.4) 516 (5.4) 559 (9.4)Chinese Taipei 472 (4.1) 510 (2.6) c c c c c c c cThailand 413 (3.5) 431 (3.3) m m m m m m m mTrinidad and Tobago 351 (14.6) 425 (1.3) c c 418 (19.8) c c 423 (26.4)Tunisia c c 404 (2.9) m m c c c c c cUruguay 383 (9.0) 430 (2.5) c c c c c c c c
Note: Values that are statistically significant are indicated in bold (see Annex A).
Source: PISA 2009 Database.
Please refer to the Reader’s Guide for information concerning the symbols replacing missing data.
[Part 2/3]

161UNTAPPED SKILLS: REALISING THE POTENTIAL OF IMMIGRANT STUDENTS © OECD 2012
DATA TABLES ON IMMIGRANT STUDENTS: ANNEX B
Table B3.1
Percentage of students and reading performance, by immigrant status and language spoken at home (continued)Results based on students’ self-reports
Difference in reading performance between non-immigrant students speaking the language of assessment at home and…
Non-immigrant students speaking another
language at home
Second-generation students speaking another
language at home
Second-generation students
speaking the language of
assessment at home
First-generation students speaking another
language at home
First-generation students
speaking the language of
assessment at home
Non-immigrant students speaking another
language at home, after adjusting for
socio-economic background
Second-generation students
speaking another language at home, after adjusting for
socio-economic background
Second-generation
students speaking the language of assessment at home, after adjusting for
socio-economic background
First-generation students speaking another
language at home, after adjusting for
socio-economic background
First-generation students
speaking the language of
assessment at home, after adjusting for
socio-economic background
Score dif. S.E.
Score dif. S.E.
Score dif. S.E.
Score dif. S.E.
Score dif. S.E.
Score dif. S.E.
Score dif. S.E.
Score dif. S.E.
Score dif. S.E.
Score dif. S.E.
OEC
D Australia 55 (12.2) -11 (9.1) -18 (6.2) 11 (11.7) -14 (4.5) 45 (12.1) -24 (8.2) -17 (5.4) 5 (10.0) -7 (4.0)Austria 54 (18.9) 56 (8.0) 44 (11.9) 98 (11.4) 69 (28.5) 38 (15.7) 22 (7.9) 22 (13.0) 54 (11.4) 58 (20.7)Belgium 19 (5.5) 82 (10.9) 45 (8.3) 89 (10.5) 61 (12.7) 7 (5.0) 46 (10.0) 26 (8.0) 54 (8.1) 43 (10.3)Canada 35 (5.3) 13 (5.9) -0 (4.0) 14 (5.8) -5 (6.1) 33 (4.8) 2 (5.5) -3 (3.6) 13 (5.3) -1 (5.5)Chile c c c c c c m m c c c c c c c c m m c cCzech Republic c c c c 22 (16.9) -3 (21.0) c c c c c c 9 (16.1) -0 (19.9) c cDenmark 47 (20.5) 62 (5.7) 39 (6.2) 83 (8.4) 61 (11.0) 36 (19.8) 30 (5.1) 15 (5.8) 53 (7.8) 41 (11.3)Estonia 36 (9.5) 52 (14.9) 34 (6.8) c c c c 31 (9.5) 44 (14.8) 33 (6.2) c c c cFinland 40 (8.0) 63 (16.9) c c 93 (19.5) c c 47 (7.8) 58 (17.3) c c 76 (17.6) c cFrance 73 (15.4) 76 (14.0) 39 (9.9) 78 (18.7) 58 (21.8) 56 (12.5) 31 (14.2) 17 (9.0) 35 (18.7) 41 (17.9)Germany 21 (13.3) 66 (8.3) 30 (7.9) 63 (8.2) 34 (11.4) 17 (12.6) 30 (8.2) 6 (7.5) 39 (7.8) 10 (11.0)Greece 78 (17.4) c c 34 (9.9) 87 (20.1) 50 (16.3) 61 (15.4) c c 22 (9.5) 57 (21.8) 25 (15.3)Hungary c c c c -31 (12.8) c c 2 (11.8) c c c c -22 (11.2) c c -4 (10.5)Iceland 54 (16.1) c c c c 80 (14.7) c c 57 (15.8) c c c c 55 (15.3) c cIreland -5 (14.1) c c -9 (13.9) 59 (11.4) 8 (10.0) -0 (12.0) c c -7 (13.5) 57 (10.9) 20 (9.0)Israel 40 (20.3) -39 (9.5) -2 (6.5) 8 (9.5) 20 (12.2) 37 (17.4) -48 (10.3) -16 (5.5) -16 (8.6) -16 (13.4)Italy 53 (3.8) 62 (12.4) 34 (10.3) 95 (5.3) 73 (9.9) 34 (3.4) 43 (12.9) 21 (8.9) 71 (5.1) 59 (9.2)Japan c c c c c c c c c c c c c c c c c c c cKorea c c m m c c m m m m c c m m c c m m m mLuxembourg 17 (11.6) 77 (12.6) 15 (14.1) 83 (13.8) -23 (13.6) 9 (11.9) 30 (13.2) 5 (13.9) 40 (14.0) -23 (13.3)Mexico 79 (7.6) c c 85 (10.2) 148 (14.7) 82 (8.4) 54 (7.4) c c 72 (10.4) 122 (13.8) 71 (7.8)Netherlands 6 (23.7) 54 (11.7) 40 (11.7) 46 (12.8) 34 (21.1) 1 (22.1) 14 (12.2) 15 (11.0) 12 (12.0) 0 (16.8)New Zealand 98 (9.4) 60 (13.7) 14 (9.4) 38 (6.5) -23 (6.0) 75 (9.9) 40 (11.9) 4 (6.4) 36 (5.9) -7 (5.6)Norway 44 (10.0) 56 (9.8) 25 (12.9) 69 (7.6) c c 44 (9.0) 39 (8.9) 17 (10.8) 43 (7.5) c cPoland c c m m m m m m c c c c m m m m m m c cPortugal -1 (14.6) c c 7 (9.2) 38 (10.7) 30 (11.5) 6 (13.3) c c 7 (8.0) 39 (9.9) 30 (10.5)Slovak Republic 71 (12.3) c c c c c c c c 49 (9.5) c c c c c c c cSlovenia 24 (14.7) 50 (6.9) 23 (8.4) 77 (11.5) c c 18 (14.4) 24 (7.0) 7 (8.7) 41 (12.0) c cSpain -0 (4.0) 30 (13.9) 23 (11.9) 74 (5.8) 52 (4.8) -0 (4.6) 23 (14.4) 16 (12.6) 59 (5.6) 38 (4.3)Sweden 55 (19.1) 64 (8.4) 36 (10.3) 94 (13.4) c c 43 (16.9) 37 (7.8) 23 (9.9) 60 (11.4) c cSwitzerland 26 (7.7) 51 (4.8) 19 (5.2) 81 (6.0) 9 (10.7) 25 (6.7) 24 (5.0) 5 (7.1) 52 (5.7) 14 (8.4)Turkey 59 (12.1) c c c c c c c c 30 (12.1) c c c c c c c cUnited Kingdom 68 (11.5) 30 (10.2) -3 (9.2) 43 (10.6) 31 (11.7) 62 (11.0) 16 (7.8) -1 (8.2) 26 (8.4) 27 (11.4)United States 55 (14.5) 34 (7.6) 11 (7.8) 31 (8.4) -6 (11.7) 28 (13.0) -10 (6.6) -5 (6.1) -8 (6.4) -19 (10.5)OECD average 43 (2.6) 47 (2.3) 21 (2.0) 65 (2.4) 29 (2.9) 34 (2.4) 23 (2.3) 10 (1.9) 41 (2.3) 19 (2.5)
Part
ners Albania 22 (19.9) m m c c c c c c 22 (15.2) m m c c c c c c
Argentina c c c c 28 (13.7) c c 27 (26.9) c c c c -1 (12.9) c c 9 (26.7)Azerbaijan -24 (11.0) c c 2 (10.6) c c c c -15 (8.5) c c 3 (10.1) c c c cBrazil 54 (12.4) c c 94 (19.2) c c 112 (21.0) 65 (12.7) c c 91 (17.4) c c 97 (25.0)Bulgaria 103 (10.5) c c c c c c c c 61 (10.4) c c c c c c c cColombia 45 (25.8) m m c c m m c c 67 (23.7) m m c c m m c cCroatia 9 (21.6) c c 13 (5.3) c c 26 (8.3) 6 (17.5) c c 7 (4.8) c c 12 (8.1)Dubai (UAE) -29 (5.5) -78 (5.2) -94 (6.0) -102 (4.2) -143 (4.7) 3 (5.3) -64 (5.1) -81 (5.9) -80 (4.1) -110 (4.9)Hong Kong-China 73 (9.2) 43 (15.2) -6 (3.7) 55 (12.7) 20 (6.0) 89 (8.1) 43 (14.8) -18 (3.3) 37 (12.4) 3 (5.7)Indonesia 9 (6.4) m m m m c c c c -6 (4.7) m m m m c c c cJordan 20 (12.7) 19 (19.4) -15 (5.7) c c -12 (9.0) 25 (14.3) 28 (20.9) -9 (5.1) c c -0 (8.7)Kazakhstan -17 (8.0) 8 (18.8) -29 (13.2) -23 (18.9) 28 (9.6) -9 (6.6) -0 (19.5) -30 (12.1) -21 (17.1) 18 (7.5)Kyrgyzstan -52 (6.5) c c -65 (23.9) c c c c -30 (5.4) c c -56 (20.3) c c c cLatvia 16 (9.6) c c 4 (9.4) c c c c 7 (8.1) c c 7 (7.3) c c c cLiechtenstein c c c c c c c c c c c c c c c c c c c cLithuania 41 (7.9) c c 38 (13.9) c c c c 32 (7.2) c c 30 (13.9) c c c cMacao-China 42 (4.3) 41 (4.7) -2 (2.7) 45 (9.2) -5 (3.4) 54 (4.3) 47 (4.7) -8 (2.9) 50 (9.3) -9 (3.5)Montenegro 48 (14.6) c c -29 (10.2) c c -4 (8.0) 36 (15.4) c c -17 (10.0) c c -2 (8.0)Panama 68 (21.1) c c -27 (34.9) c c 14 (42.0) 56 (12.6) c c -12 (37.1) c c 25 (36.9)Peru 109 (8.3) m m c c c c c c 61 (8.7) m m c c c c c cQatar 10 (2.8) -54 (5.4) -58 (3.0) -134 (4.3) -113 (3.5) 22 (2.8) -52 (5.4) -60 (3.1) -125 (4.4) -104 (3.6)Romania 67 (13.2) m m c c c c c c 48 (10.9) m m c c c c c cRussian Federation 47 (9.6) 79 (26.1) 22 (6.1) 76 (14.4) 9 (7.4) 32 (7.7) 63 (27.3) 18 (6.0) 61 (13.6) 6 (6.9)Serbia 37 (12.3) c c -23 (7.0) c c -3 (7.3) 20 (12.1) c c -23 (6.7) c c -11 (7.1)Shanghai-China 65 (12.1) m m c c c c c c 41 (10.4) m m c c c c c cSingapore 58 (3.0) 35 (7.5) -30 (13.3) 46 (5.7) 2 (9.5) 28 (3.2) 10 (7.2) -20 (12.8) 37 (5.6) 7 (9.2)Chinese Taipei 38 (4.5) c c c c c c c c 22 (4.3) c c c c c c c cThailand 18 (4.4) m m m m m m m m -2 (3.6) m m m m m m m mTrinidad and Tobago 74 (14.9) c c 7 (19.8) c c 2 (26.8) 70 (15.0) c c 13 (19.3) c c -0 (18.7)Tunisia c c m m c c c c c c c c m m c c c c c cUruguay 47 (9.0) c c c c c c c c 25 (8.4) c c c c c c c c
Note: Values that are statistically significant are indicated in bold (see Annex A).
Source: PISA 2009 Database.
Please refer to the Reader’s Guide for information concerning the symbols replacing missing data.
[Part 3/3]

162 © OECD 2012 UNTAPPED SKILLS: REALISING THE POTENTIAL OF IMMIGRANT STUDENTS
ANNEX B: DATA TABLES ON IMMIGRANT STUDENTS
Table B3.2Performance difference in reading with non-immigrant students adjusting for mother’s educational attainment
Second-generation students First-generation students Mother’s education: Lower
secondary (ISCED 2)Mother’s education: Upper
secondary (ISCED 3-4 )Mother’s education: Tertiary
(ISCED 5-6)
Coef. S.E. Coef. S.E. Coef. S.E. Coef. S.E. Coef. S.E.
OEC
D Australia 17.4 (6.4) 1.5 (5.6) 5.3 (10.3) 39.9 (9.8) 75.5 (10.1)Austria -38.7 (7.5) -78.4 (12.4) 29.2 (14.5) 69.5 (14.8) 98.3 (15.2)Belgium -46.4 (7.5) -56.1 (7.9) 39.3 (8.2) 33.2 (6.9) 75.5 (7.3)Canada 0.3 (3.6) -7.3 (4.5) 17.7 (9.5) 33.9 (8.7) 57.6 (8.8)Chile c c c c c c c c c cCzech Republic -21.4 (14.9) -5.0 (17.2) c c c c c cDenmark -36.7 (5.1) -65.2 (7.3) 4.0 (7.4) 35.9 (7.4) 56.7 (7.2)Estonia -35.3 (6.8) -36.7 (17.3) c c c c c cFinland -40.5 (13.1) -82.4 (16.4) 22.9 (9.4) 31.0 (7.8) 60.4 (7.3)France -29.3 (9.1) -56.9 (14.0) 24.0 (11.8) 53.8 (12.4) 83.6 (12.8)Germany -37.4 (6.6) -56.3 (7.3) 2.3 (10.4) 55.6 (9.9) 77.8 (10.6)Greece -39.5 (12.5) -64.1 (13.3) 6.5 (8.5) 43.5 (8.4) 63.8 (9.0)Hungary m m m m m m m m m mIceland c c -85.2 (14.8) 30.9 (19.4) 48.4 (19.8) 71.6 (19.1)Ireland 6.6 (13.8) -44.8 (7.5) 15.3 (9.7) 46.5 (8.6) 70.6 (9.3)Israel 12.1 (5.9) -11.9 (7.5) 17.0 (8.4) 67.8 (8.8) 123.9 (9.1)Italy -39.6 (8.1) -77.0 (5.2) 32.3 (5.3) 71.3 (6.1) 72.1 (6.4)Japan c c c c c c c c c cKorea c c m m c c c c c cLuxembourg -31.6 (7.6) -28.9 (17.5) 28.6 (7.1) 52.6 (9.1) 72.2 (13.9)Mexico -80.7 (12.3) -93.6 (11.1) 28.8 (2.4) 54.8 (3.4) 57.7 (3.1)Netherlands -34.7 (9.1) -24.5 (11.5) 20.4 (7.9) 28.5 (8.1) 46.0 (8.5)New Zealand -19.3 (8.3) -17.1 (4.9) 49.4 (12.0) 64.4 (10.9) 98.2 (11.3)Norway -36.7 (8.9) -46.3 (8.1) 62.4 (12.6) 66.1 (11.1) 88.0 (11.1)Poland m m c c c c c c c cPortugal -17.5 (8.8) -49.4 (8.6) 18.4 (3.7) 46.3 (4.3) 69.7 (5.7)Slovak Republic c c c c c c c c c cSlovenia -26.7 (6.7) -57.1 (12.2) 10.5 (39.6) 40.5 (38.9) 79.7 (38.6)Spain -28.0 (10.4) -62.1 (4.0) 16.3 (3.7) 36.9 (3.8) 59.7 (4.4)Sweden -36.2 (6.7) -71.0 (10.7) 37.9 (11.6) 70.3 (10.7) 84.9 (11.0)Switzerland -28.2 (4.5) -46.2 (6.7) 12.6 (8.2) 43.8 (9.0) 60.6 (9.9)Turkey c c c c c c c c c cUnited Kingdom -2.3 (8.4) -33.9 (8.2) 29.3 (11.2) 56.5 (11.0) 80.8 (11.3)United States -4.6 (5.6) -6.6 (7.0) -4.6 (7.0) 23.5 (6.8) 61.5 (8.0)OECD average -26.0 (1.7) -46.8 (2.1) 22.3 (2.5) 48.6 (2.5) 73.8 (2.5)
Part
ners Albania c c c c c c c c c c
Argentina -22.9 (12.9) -44.5 (25.6) 36.1 (6.9) 49.4 (6.5) 69.6 (7.0)Azerbaijan -4.4 (9.4) 15.1 (13.2) 19.4 (11.0) 17.7 (10.3) 42.8 (10.6)Brazil -94.1 (19.5) -106.3 (22.5) 25.0 (3.2) 49.6 (3.7) 56.7 (7.4)Bulgaria c c c c c c c c c cColombia c c c c c c c c c cCroatia -8.0 (5.9) -20.4 (8.4) 0.1 (13.2) 44.4 (13.6) 55.7 (14.3)Dubai (UAE) 56.6 (8.9) 83.5 (8.9) 22.7 (7.4) 47.5 (8.1) 81.4 (9.4)Hong Kong-China 13.5 (3.6) -15.7 (5.6) 5.3 (3.5) 20.8 (3.8) 36.6 (8.6)Indonesia m m c c c c c c c cJordan 11.6 (5.8) 1.9 (8.9) 18.5 (4.2) 31.2 (4.5) 51.6 (5.6)Kazakhstan 27.7 (13.1) -19.2 (7.9) c c c c c cKyrgyzstan 41.8 (19.5) 13.5 (18.8) c c c c c cLatvia -14.5 (8.5) c c c c c c c cLiechtenstein -8.3 (17.2) -24.6 (12.0) c c c c c cLithuania -25.5 (12.3) c c c c c c c cMacao-China 7.8 (4.7) 8.3 (6.9) 5.8 (2.8) 10.0 (4.6) 13.2 (9.5)Montenegro 19.8 (10.9) -5.4 (9.7) 20.4 (12.1) 66.5 (15.0) 86.1 (17.5)Panama 22.2 (27.2) -57.3 (29.4) 12.7 (7.4) 35.0 (8.3) 59.5 (10.7)Peru c c c c c c c c c cQatar 61.1 (8.2) 119.3 (10.9) 13.1 (7.5) 20.3 (7.6) 42.2 (9.7)Romania c c c c c c c c c cRussian Federation -23.7 (6.3) -14.7 (6.8) c c c c c cSerbia 21.4 (7.3) 4.8 (6.9) 13.6 (15.7) 50.3 (17.1) 56.5 (17.6)Shanghai-China c c c c c c c c c cSingapore 15.9 (7.0) -18.9 (5.5) 10.0 (7.2) 49.4 (4.7) 76.2 (6.5)Chinese Taipei c c c c c c c c c cThailand m m m m m m m m m mTrinidad and Tobago -8.5 (25.4) 10.5 (29.5) 18.6 (10.2) 29.0 (6.8) 51.2 (10.5)Tunisia c c c c c c c c c cUruguay c c c c c c c c c c
Note: Coefficient of OLS regression with dummies. Values that are statistically significant are indicated in bold (see Annex A). Note reference category for mothers’ education is primary education or less.
Source: PISA 2009 Database.
Please refer to the Reader’s Guide for information concerning the symbols replacing missing data.

163UNTAPPED SKILLS: REALISING THE POTENTIAL OF IMMIGRANT STUDENTS © OECD 2012
DATA TABLES ON IMMIGRANT STUDENTS: ANNEX B
Table B3.3Performance difference in reading with non-immigrant students adjusting for mother’s educational attainment and language spoken at home
Second-generation students First-generation students
Does not speak the assessment language
at home
Mother’s education: Lower secondary
(ISCED 2)
Mother’s education: Upper secondary (ISCED
3-4 )Mother’s education: Tertiary (ISCED 5-6)
Coef. S.E. Coef. S.E. Coef. S.E. Coef. S.E. Coef. S.E. Coef. S.E.
OEC
D Australia 22.5 (5.4) 7.6 (4.6) -14.6 (7.1) 0.1 (10.6) 34.3 (10.4) 70.7 (10.7)Austria -24.8 (10.8) -58.8 (14.7) -14.8 (10.0) 34.5 (15.1) 76.3 (15.4) 105.1 (15.8)Belgium -38.9 (8.3) -50.6 (9.1) -15.3 (5.3) 38.5 (8.5) 33.4 (7.3) 74.7 (7.7)Canada 7.8 (3.6) 6.0 (4.7) -18.3 (3.5) 18.3 (9.4) 33.6 (8.6) 57.2 (8.7)Chile c c c c c c c c c c c cCzech Republic -5.2 (16.1) 12.8 (22.6) -7.3 (21.0) c c c c c cDenmark -22.0 (5.8) -49.2 (8.8) -19.5 (7.0) 3.2 (7.7) 34.7 (7.6) 55.7 (7.5)Estonia -33.0 (6.8) -28.7 (18.0) -33.3 (7.9) c c c c c cFinland -18.0 (14.4) -53.5 (17.7) -36.7 (7.5) 22.4 (9.4) 30.4 (7.7) 59.9 (7.3)France -13.4 (9.1) -28.0 (13.6) -38.1 (10.6) 19.0 (11.9) 47.4 (12.4) 77.9 (13.1)Germany -19.9 (6.9) -33.2 (9.6) -22.9 (8.0) -6.3 (11.7) 47.1 (10.6) 71.3 (11.3)Greece -33.4 (12.4) -39.7 (13.3) -42.6 (13.1) 4.8 (8.5) 40.7 (8.2) 61.9 (8.8)Hungary m m m m m m m m m m m mIceland c c -47.7 (18.0) -44.7 (16.4) 29.9 (19.3) 48.4 (19.8) 72.2 (19.0)Ireland 7.5 (13.7) -32.6 (9.1) -20.6 (11.5) 17.1 (9.8) 47.9 (8.7) 72.4 (9.4)Israel 18.3 (6.6) 6.4 (11.8) -15.9 (12.0) 17.0 (8.8) 70.6 (9.2) 127.2 (9.6)Italy -22.1 (7.6) -54.3 (5.4) -40.5 (3.6) 27.2 (4.8) 62.7 (5.0) 64.0 (5.3)Japan c c c c c c c c c c c cKorea c c m m c c c c c c c cLuxembourg -36.4 (5.1) -32.3 (13.3) -46.5 (12.0) 25.3 (6.8) 48.2 (8.0) 63.8 (10.3)Mexico -78.4 (10.9) -70.4 (6.8) -62.9 (7.5) 26.1 (2.3) 52.3 (3.4) 56.3 (3.0)Netherlands -31.2 (10.5) -17.6 (14.1) -6.2 (11.1) 22.5 (8.5) 29.0 (8.8) 47.0 (9.1)New Zealand 1.2 (7.6) 13.8 (5.2) -63.3 (6.5) 41.8 (11.8) 55.6 (10.8) 90.4 (11.3)Norway -12.0 (11.6) -13.4 (11.7) -39.0 (9.1) 60.9 (12.7) 64.1 (11.2) 85.6 (11.2)Poland m m c c c c c c c c c cPortugal -14.0 (9.4) -42.5 (10.3) -12.3 (11.8) 19.0 (3.8) 46.6 (4.3) 70.1 (5.7)Slovak Republic c c c c c c c c c c c cSlovenia -12.8 (7.7) -42.8 (13.4) -19.2 (9.0) 9.3 (40.2) 38.9 (39.4) 78.7 (39.0)Spain -26.3 (10.5) -60.8 (4.1) -4.2 (4.4) 16.0 (3.8) 36.9 (3.9) 59.0 (4.4)Sweden -16.4 (9.4) -41.9 (13.1) -34.4 (10.0) 33.4 (12.2) 65.8 (11.5) 80.5 (11.8)Switzerland -6.2 (5.2) -23.4 (6.7) -32.4 (4.8) 7.5 (7.9) 36.9 (8.6) 53.6 (9.4)Turkey c c c c c c c c c c c cUnited Kingdom 4.8 (8.7) -15.0 (9.0) -26.0 (7.9) 25.0 (11.2) 50.7 (10.8) 75.1 (11.3)United States 3.3 (6.3) 5.5 (8.5) -18.2 (6.5) -8.0 (6.9) 17.8 (6.8) 55.0 (7.9)OECD average -15.3 (1.8) -29.0 (2.3) -27.8 (1.9) 20.2 (2.5) 46.0 (2.5) 71.4 (2.5)
Part
ners Albania c c c c c c c c c c c c
Argentina -3.6 (14.4) -21.4 (26.5) -75.1 (18.7) 35.3 (6.9) 50.2 (6.4) 71.4 (6.9)Azerbaijan -5.9 (9.4) 14.3 (12.9) 20.0 (9.4) 19.5 (10.8) 17.5 (10.3) 42.1 (10.5)Brazil -93.0 (19.8) -100.5 (23.1) -54.1 (11.5) 24.8 (3.3) 50.1 (3.7) 57.6 (7.4)Bulgaria c c c c c c c c c c c cColombia c c c c c c c c c c c cCroatia -7.7 (5.9) -19.4 (8.5) -12.1 (19.4) 1.1 (13.4) 45.4 (13.8) 57.2 (14.4)Dubai (UAE) 60.0 (8.7) 86.1 (8.4) -26.0 (7.3) 31.5 (8.2) 60.9 (8.9) 96.1 (9.8)Hong Kong-China 13.6 (3.6) -5.9 (4.9) -59.2 (9.9) 3.7 (3.4) 20.0 (3.6) 43.2 (6.0)Indonesia m m c c c c c c c c c cJordan 12.2 (5.7) 5.9 (8.6) -24.8 (11.4) 17.8 (4.2) 31.0 (4.6) 52.6 (5.4)Kazakhstan 28.0 (13.1) -19.1 (7.8) 16.8 (6.4) c c c c c cKyrgyzstan 45.6 (20.3) 16.2 (19.6) 41.2 (6.5) c c c c c cLatvia -11.4 (8.4) c c -15.2 (8.9) c c c c c cLiechtenstein -0.8 (18.7) -9.4 (14.8) -37.5 (17.0) c c c c c cLithuania -14.0 (12.9) c c -31.9 (7.7) c c c c c cMacao-China 3.8 (4.3) 3.6 (6.1) -48.5 (14.2) 6.9 (2.8) 16.0 (4.4) 25.3 (8.2)Montenegro 20.9 (10.4) -0.3 (9.1) -41.7 (13.3) 18.0 (12.3) 63.7 (13.9) 82.6 (16.4)Panama 53.6 (30.1) -32.6 (27.1) -58.5 (12.0) 11.6 (7.9) 33.5 (7.8) 57.7 (10.2)Peru c c c c c c c c c c c cQatar 60.9 (8.3) 120.7 (11.2) -5.5 (12.1) 14.0 (7.5) 21.2 (7.7) 44.8 (10.0)Romania c c c c c c c c c c c cRussian Federation -20.9 (6.2) -9.6 (7.0) -40.7 (9.5) c c c c c cSerbia 21.7 (7.3) 5.3 (7.1) -20.1 (10.3) 10.8 (16.0) 47.2 (17.4) 53.3 (17.8)Shanghai-China c c c c c c c c c c c cSingapore 21.9 (7.1) -2.9 (5.8) -43.1 (4.0) 6.9 (7.6) 35.9 (4.6) 51.4 (6.2)Chinese Taipei c c c c c c c c c c c cThailand m m m m m m m m m m m mTrinidad and Tobago -7.2 (26.2) 34.8 (29.9) -68.8 (14.3) 18.7 (10.3) 29.4 (6.9) 53.0 (10.5)Tunisia c c c c c c c c c c c cUruguay c c c c c c c c c c c c
Note: Coefficient of OLS regression with dummies. Values that are statistically significant are indicated in bold (see Annex A). Note reference category for mothers’ education is primary education or less. Does not speak the language of assessment at home is defined for both immigrant and non-immigrant students, i.e. it is possible to have a value of 1 on this dummy variable and not be an immigrant student.Source: PISA 2009 Database.Please refer to the Reader’s Guide for information concerning the symbols replacing missing data.
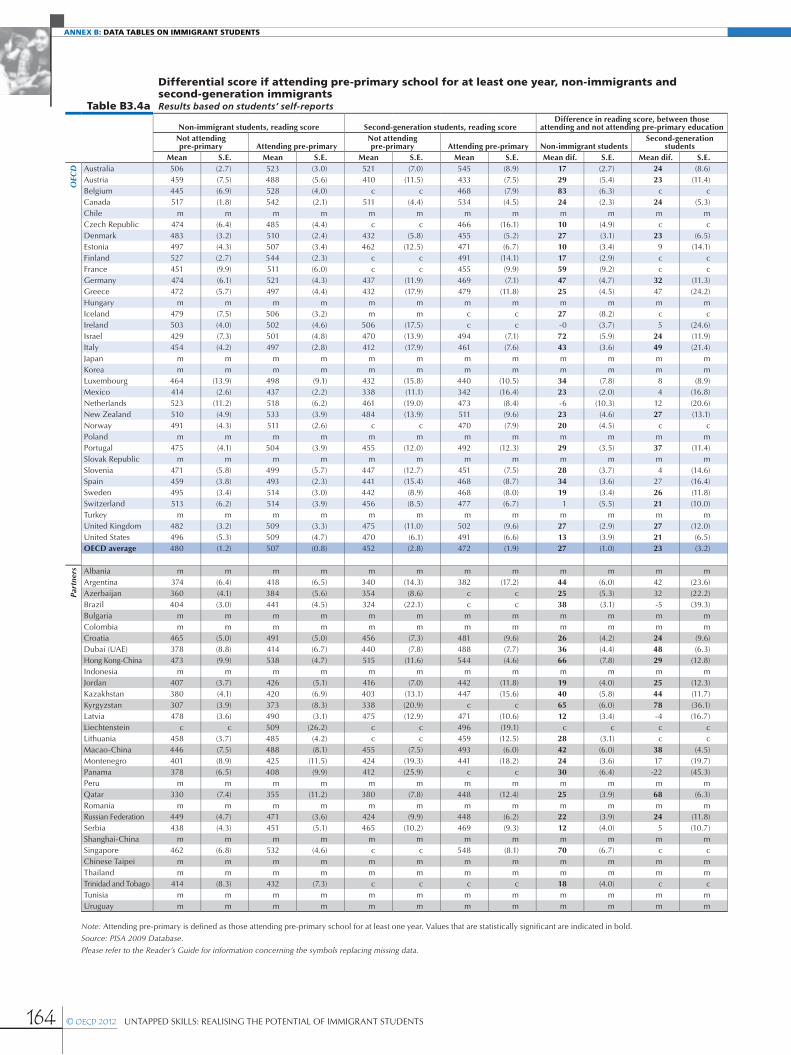
164 © OECD 2012 UNTAPPED SKILLS: REALISING THE POTENTIAL OF IMMIGRANT STUDENTS
ANNEX B: DATA TABLES ON IMMIGRANT STUDENTS
Table B3.4a
Differential score if attending pre-primary school for at least one year, non-immigrants and second-generation immigrantsResults based on students’ self-reports
Non-immigrant students, reading score Second-generation students, reading scoreDifference in reading score, between those
attending and not attending pre-primary educationNot attending pre-primary Attending pre-primary
Not attending pre-primary Attending pre-primary Non-immigrant students
Second-generation students
Mean S.E. Mean S.E. Mean S.E. Mean S.E. Mean dif. S.E. Mean dif. S.E.
OEC
D Australia 506 (2.7) 523 (3.0) 521 (7.0) 545 (8.9) 17 (2.7) 24 (8.6)Austria 459 (7.5) 488 (5.6) 410 (11.5) 433 (7.5) 29 (5.4) 23 (11.4)Belgium 445 (6.9) 528 (4.0) c c 468 (7.9) 83 (6.3) c cCanada 517 (1.8) 542 (2.1) 511 (4.4) 534 (4.5) 24 (2.3) 24 (5.3)Chile m m m m m m m m m m m mCzech Republic 474 (6.4) 485 (4.4) c c 466 (16.1) 10 (4.9) c cDenmark 483 (3.2) 510 (2.4) 432 (5.8) 455 (5.2) 27 (3.1) 23 (6.5)Estonia 497 (4.3) 507 (3.4) 462 (12.5) 471 (6.7) 10 (3.4) 9 (14.1)Finland 527 (2.7) 544 (2.3) c c 491 (14.1) 17 (2.9) c cFrance 451 (9.9) 511 (6.0) c c 455 (9.9) 59 (9.2) c cGermany 474 (6.1) 521 (4.3) 437 (11.9) 469 (7.1) 47 (4.7) 32 (11.3)Greece 472 (5.7) 497 (4.4) 432 (17.9) 479 (11.8) 25 (4.5) 47 (24.2)Hungary m m m m m m m m m m m mIceland 479 (7.5) 506 (3.2) m m c c 27 (8.2) c cIreland 503 (4.0) 502 (4.6) 506 (17.5) c c -0 (3.7) 5 (24.6)Israel 429 (7.3) 501 (4.8) 470 (13.9) 494 (7.1) 72 (5.9) 24 (11.9)Italy 454 (4.2) 497 (2.8) 412 (17.9) 461 (7.6) 43 (3.6) 49 (21.4)Japan m m m m m m m m m m m mKorea m m m m m m m m m m m mLuxembourg 464 (13.9) 498 (9.1) 432 (15.8) 440 (10.5) 34 (7.8) 8 (8.9)Mexico 414 (2.6) 437 (2.2) 338 (11.1) 342 (16.4) 23 (2.0) 4 (16.8)Netherlands 523 (11.2) 518 (6.2) 461 (19.0) 473 (8.4) -6 (10.3) 12 (20.6)New Zealand 510 (4.9) 533 (3.9) 484 (13.9) 511 (9.6) 23 (4.6) 27 (13.1)Norway 491 (4.3) 511 (2.6) c c 470 (7.9) 20 (4.5) c cPoland m m m m m m m m m m m mPortugal 475 (4.1) 504 (3.9) 455 (12.0) 492 (12.3) 29 (3.5) 37 (11.4)Slovak Republic m m m m m m m m m m m mSlovenia 471 (5.8) 499 (5.7) 447 (12.7) 451 (7.5) 28 (3.7) 4 (14.6)Spain 459 (3.8) 493 (2.3) 441 (15.4) 468 (8.7) 34 (3.6) 27 (16.4)Sweden 495 (3.4) 514 (3.0) 442 (8.9) 468 (8.0) 19 (3.4) 26 (11.8)Switzerland 513 (6.2) 514 (3.9) 456 (8.5) 477 (6.7) 1 (5.5) 21 (10.0)Turkey m m m m m m m m m m m mUnited Kingdom 482 (3.2) 509 (3.3) 475 (11.0) 502 (9.6) 27 (2.9) 27 (12.0)United States 496 (5.3) 509 (4.7) 470 (6.1) 491 (6.6) 13 (3.9) 21 (6.5)OECD average 480 (1.2) 507 (0.8) 452 (2.8) 472 (1.9) 27 (1.0) 23 (3.2)
Part
ners Albania m m m m m m m m m m m m
Argentina 374 (6.4) 418 (6.5) 340 (14.3) 382 (17.2) 44 (6.0) 42 (23.6)Azerbaijan 360 (4.1) 384 (5.6) 354 (8.6) c c 25 (5.3) 32 (22.2)Brazil 404 (3.0) 441 (4.5) 324 (22.1) c c 38 (3.1) -5 (39.3)Bulgaria m m m m m m m m m m m mColombia m m m m m m m m m m m mCroatia 465 (5.0) 491 (5.0) 456 (7.3) 481 (9.6) 26 (4.2) 24 (9.6)Dubai (UAE) 378 (8.8) 414 (6.7) 440 (7.8) 488 (7.7) 36 (4.4) 48 (6.3)Hong Kong-China 473 (9.9) 538 (4.7) 515 (11.6) 544 (4.6) 66 (7.8) 29 (12.8)Indonesia m m m m m m m m m m m mJordan 407 (3.7) 426 (5.1) 416 (7.0) 442 (11.8) 19 (4.0) 25 (12.3)Kazakhstan 380 (4.1) 420 (6.9) 403 (13.1) 447 (15.6) 40 (5.8) 44 (11.7)Kyrgyzstan 307 (3.9) 373 (8.3) 338 (20.9) c c 65 (6.0) 78 (36.1)Latvia 478 (3.6) 490 (3.1) 475 (12.9) 471 (10.6) 12 (3.4) -4 (16.7)Liechtenstein c c 509 (26.2) c c 496 (19.1) c c c cLithuania 458 (3.7) 485 (4.2) c c 459 (12.5) 28 (3.1) c cMacao-China 446 (7.5) 488 (8.1) 455 (7.5) 493 (6.0) 42 (6.0) 38 (4.5)Montenegro 401 (8.9) 425 (11.5) 424 (19.3) 441 (18.2) 24 (3.6) 17 (19.7)Panama 378 (6.5) 408 (9.9) 412 (25.9) c c 30 (6.4) -22 (45.3)Peru m m m m m m m m m m m mQatar 330 (7.4) 355 (11.2) 380 (7.8) 448 (12.4) 25 (3.9) 68 (6.3)Romania m m m m m m m m m m m mRussian Federation 449 (4.7) 471 (3.6) 424 (9.9) 448 (6.2) 22 (3.9) 24 (11.8)Serbia 438 (4.3) 451 (5.1) 465 (10.2) 469 (9.3) 12 (4.0) 5 (10.7)Shanghai-China m m m m m m m m m m m mSingapore 462 (6.8) 532 (4.6) c c 548 (8.1) 70 (6.7) c cChinese Taipei m m m m m m m m m m m mThailand m m m m m m m m m m m mTrinidad and Tobago 414 (8.3) 432 (7.3) c c c c 18 (4.0) c cTunisia m m m m m m m m m m m mUruguay m m m m m m m m m m m m
Note: Attending pre-primary is defined as those attending pre-primary school for at least one year. Values that are statistically significant are indicated in bold.
Source: PISA 2009 Database.
Please refer to the Reader’s Guide for information concerning the symbols replacing missing data.

165UNTAPPED SKILLS: REALISING THE POTENTIAL OF IMMIGRANT STUDENTS © OECD 2012
DATA TABLES ON IMMIGRANT STUDENTS: ANNEX B
Table B3.4b
Performance difference in reading with non-immigrant students adjusting for mother’s educational attainment, language spoken at home and attendance to pre-primary with second-generation specific effects
Second-generation students
First-generation students
Does not speak the assessment
language at home
Attendance to pre-primary
schooling for at least a year
Second-generation student that attended pre-primary schooling for at least a year
Mother’s education:
Lower secondary (ISCED 2)
Mother’s education:
Upper secondary (ISCED 3-4)
Mother’s education:
Tertiary (ISCED 5-6)
Coef. S.E. Coef. S.E. Coef. S.E. Coef. S.E. Coef. S.E. Coef. S.E. Coef. S.E. Coef. S.E.
OEC
D Australia 22.1 (5.8) 8.9 (4.6) -13.5 (7.0) 13.0 (2.4) 3.5 (8.6) -2.1 (10.8) 30.5 (10.3) 66.0 (10.6)Austria -22.9 (16.7) -39.8 (14.4) -19.0 (10.1) 25.1 (6.0) -0.1 (14.6) 14.9 (13.2) 51.8 (13.3) 80.2 (13.8)Belgium -62.9 (25.2) -24.3 (8.2) -13.2 (4.8) 69.9 (6.0) 25.6 (25.7) 38.8 (8.6) 31.2 (7.7) 70.0 (8.1)Canada 6.5 (4.8) 5.7 (4.8) -18.3 (3.5) 21.1 (2.1) -2.1 (5.4) 17.8 (9.5) 28.4 (8.9) 49.8 (9.0)Chile c c c c c c m m m m m m m m m mCzech Republic 38.4 (33.1) 2.2 (20.6) 3.2 (17.8) 8.7 (5.0) -42.8 (35.1) c c c c c cDenmark -15.4 (8.6) -43.8 (9.1) -16.4 (6.9) 23.6 (2.9) -10.3 (9.1) 3.2 (7.7) 33.9 (7.7) 53.7 (7.5)Estonia -33.5 (14.4) -29.1 (18.0) -34.4 (8.0) 8.4 (4.1) 0.4 (15.2) c c c c c cFinland 0.3 (29.6) -51.3 (17.9) -37.6 (7.5) 13.2 (3.0) -25.9 (32.4) 20.4 (9.1) 27.1 (7.6) 55.5 (7.1)France -12.4 (23.5) -18.3 (13.6) -32.5 (9.1) 43.4 (8.4) -6.3 (23.1) 12.6 (12.5) 38.9 (13.3) 69.8 (13.9)Germany -15.6 (13.2) -26.1 (9.4) -24.4 (8.0) 34.1 (5.1) -2.8 (14.3) -9.1 (11.8) 37.5 (10.8) 61.1 (11.4)Greece -42.5 (18.8) -36.7 (13.6) -39.1 (13.0) 19.9 (3.9) 23.7 (21.3) 2.5 (8.5) 38.0 (8.1) 58.3 (8.6)Hungary m m m m m m m m m m m m m m m mIceland c c -42.6 (18.0) -43.9 (16.6) 14.6 (7.2) c c 29.5 (19.1) 47.5 (19.6) 70.9 (18.8)Ireland 2.2 (19.5) -30.0 (9.4) -21.9 (11.9) -2.1 (3.4) c c 16.3 (9.9) 47.8 (8.8) 72.1 (9.5)Israel 40.6 (15.0) 7.7 (10.9) -13.9 (10.3) 50.1 (5.7) -33.2 (15.1) 17.5 (8.7) 56.0 (9.1) 107.2 (9.4)Italy -5.6 (18.3) -44.5 (5.6) -38.9 (3.5) 34.5 (3.2) -14.6 (19.9) 23.6 (4.6) 58.3 (4.8) 60.5 (5.1)Japan c c c c c c m m m m m m m m m mKorea c c m m c c m m m m m m m m m mLuxembourg -34.0 (12.6) -25.7 (12.6) -45.8 (11.8) 19.6 (6.8) -0.7 (11.9) 24.6 (6.9) 47.5 (8.0) 63.4 (10.4)Mexico -75.1 (13.8) -68.1 (7.0) -60.8 (7.1) 12.5 (1.8) -4.9 (20.1) 24.8 (2.3) 49.9 (3.3) 53.9 (3.0)Netherlands -31.7 (24.3) -16.8 (13.9) -5.5 (11.2) 2.0 (9.5) -1.0 (25.0) 17.7 (8.5) 21.0 (7.7) 38.7 (7.9)New Zealand 11.0 (12.0) 18.0 (5.2) -63.1 (6.5) 18.9 (3.9) -11.4 (14.1) 40.6 (11.8) 53.8 (10.9) 87.3 (11.3)Norway -34.1 (24.3) -8.1 (11.9) -38.1 (9.2) 16.7 (4.4) 24.0 (20.9) 57.6 (12.7) 60.5 (11.2) 80.7 (11.2)Poland m m c c c c m m m m c c c c c cPortugal -15.1 (12.4) -41.0 (9.5) -10.1 (10.9) 16.7 (3.0) 2.6 (14.0) 17.7 (3.8) 43.3 (4.2) 65.0 (5.4)Slovak Republic c c c c m m m m m m c c c c c cSlovenia -2.8 (13.1) -38.5 (13.9) -15.9 (9.2) 19.7 (4.1) -17.7 (14.1) -3.1 (40.8) 21.3 (40.0) 58.8 (39.5)Spain -8.3 (17.0) -53.8 (4.0) -4.1 (4.4) 28.6 (3.4) -18.0 (16.4) 14.3 (3.6) 34.1 (3.4) 56.0 (4.1)Sweden -16.4 (11.6) -38.0 (12.3) -34.3 (9.4) 15.0 (3.3) 5.0 (12.6) 26.0 (11.9) 59.0 (11.3) 73.3 (11.6)Switzerland -21.3 (8.6) -23.7 (6.8) -31.7 (5.1) 2.7 (5.3) 19.4 (9.1) 5.4 (8.9) 34.9 (9.7) 51.7 (10.4)Turkey c c c c m m m m m m m m m m m mUnited Kingdom 6.6 (12.9) -12.2 (9.0) -20.4 (7.4) 23.0 (2.8) -4.0 (14.8) 25.1 (10.9) 50.4 (10.5) 74.2 (11.0)United States -2.6 (7.6) 5.9 (8.6) -17.9 (6.6) 4.7 (3.8) 9.1 (8.4) -8.3 (6.8) 16.7 (6.6) 53.4 (7.7)OECD average -12.5 (3.4) -24.6 (2.3) -26.3 (1.8) 20.6 (0.9) -3.3 (3.7) 17.1 (2.5) 40.8 (2.5) 65.2 (2.5)
Part
ners Albania c c c c m m m m m m m m m m m m
Argentina -7.2 (15.8) -21.4 (26.0) -68.8 (17.6) 33.0 (6.2) 1.1 (23.1) 30.3 (6.7) 44.2 (6.0) 63.9 (6.5)Azerbaijan -7.7 (10.4) 13.0 (12.9) 17.6 (9.1) 18.0 (4.9) c c 19.6 (10.9) 18.1 (10.3) 40.8 (10.5)Brazil -81.1 (26.7) -106.9 (29.5) -51.6 (11.8) 29.3 (3.1) c c 21.9 (3.0) 44.1 (3.5) 54.4 (6.7)Bulgaria c c c c m m m m m m m m m m m mColombia c c c c m m m m m m m m m m m mCroatia -2.9 (7.1) -14.5 (8.5) -10.3 (19.8) 16.7 (4.0) -5.2 (9.8) -0.1 (13.6) 39.7 (14.0) 49.6 (14.4)Dubai (UAE) 49.8 (8.5) 85.9 (8.2) -29.7 (7.0) 25.7 (4.4) 13.7 (7.0) 29.8 (8.0) 56.2 (8.8) 87.7 (9.7)Hong Kong-China 33.3 (12.2) 2.4 (4.9) -52.4 (9.8) 47.0 (6.0) -21.5 (12.1) 2.7 (3.3) 18.2 (3.5) 40.0 (6.2)Indonesia m m c c m m m m m m m m m m m mJordan 8.9 (6.6) 3.8 (8.2) -26.1 (12.2) 15.0 (4.0) 6.4 (9.9) 19.6 (4.3) 30.4 (4.5) 53.5 (5.2)Kazakhstan 26.6 (12.9) -21.6 (7.4) 13.9 (6.6) 34.1 (5.5) 0.6 (12.4) c c c c c cKyrgyzstan 34.3 (23.3) 8.7 (18.6) 32.8 (5.8) 50.7 (6.7) c c c c c c c cLatvia 1.7 (12.3) c c -13.4 (8.4) 6.3 (3.2) -20.6 (15.1) c c c c c cLiechtenstein -121.1 (35.1) -10.4 (14.4) -35.5 (15.2) c c 132.7 (27.1) c c c c c cLithuania -34.6 (19.9) c c -32.4 (7.6) 20.4 (3.6) 23.1 (25.4) c c c c c cMacao-China 0.9 (6.8) 6.1 (5.9) -43.3 (14.1) 30.0 (4.8) 2.4 (6.9) 6.2 (2.7) 15.2 (4.3) 25.1 (8.1)Montenegro 22.6 (15.8) -1.6 (8.9) -41.0 (14.0) 14.5 (6.1) -8.1 (21.4) 20.9 (12.6) 59.1 (14.0) 75.0 (15.5)Panama 86.3 (24.7) -38.2 (27.9) -62.9 (12.8) 24.9 (7.8) c c 8.1 (8.5) 34.8 (8.2) 54.7 (9.5)Peru c c c c m m m m m m m m m m m mQatar 52.6 (6.9) 115.6 (11.3) -9.8 (11.8) 28.7 (4.9) 33.0 (10.5) 10.8 (7.1) 16.4 (7.3) 37.7 (9.3)Romania c c c c m m m m m m m m m m m mRussian Federation -13.1 (11.2) -7.7 (6.9) -37.9 (9.2) 16.8 (3.6) -8.0 (12.5) c c c c c cSerbia 24.0 (9.4) 4.8 (7.1) -21.7 (10.2) 9.2 (3.2) -6.6 (12.8) 14.0 (15.2) 47.9 (16.2) 52.8 (16.7)Shanghai-China c c c c m m m m m m m m m m m mSingapore 20.1 (22.5) 5.5 (5.5) -42.2 (4.0) 49.0 (5.4) 2.2 (23.0) 5.5 (7.4) 33.7 (4.6) 50.3 (6.2)Chinese Taipei c c c c m m m m m m m m m m m mThailand m m m m m m m m m m m m m m m mTrinidad and Tobago 37.6 (41.0) 47.1 (29.8) -63.8 (14.0) 13.0 (4.7) c c 18.3 (10.2) 29.9 (6.8) 53.4 (10.3)Tunisia c c c c c c m m m m m m m m m mUruguay c c c c m m m m m m m m m m m m
Note: Coefficient of OLS regression with dummies. Values that are statistically significant are indicated in bold (see Annex A). Note reference category for mothers’ education is primary education or less. Does not speak the language of assessment at home is defined for both immigrant and non-immigrant students, i.e. it is possible to have a value of 1 on this dummy variable and not be an immigrant student. Attending pre-primary is defined as those attending pre-primary school for at least one year.Source: PISA 2009 Database.Please refer to the Reader’s Guide for information concerning the symbols replacing missing data.

166 © OECD 2012 UNTAPPED SKILLS: REALISING THE POTENTIAL OF IMMIGRANT STUDENTS
ANNEX B: DATA TABLES ON IMMIGRANT STUDENTS
Table B3.5
Performance difference in reading among students by immigrant background adjusting for mother’s educational attainment, language spoken at home and number of books at home, separate regressions
Second-generation students
Over 100 books at homeDoes not speak the assessment
language at homeMother’s education: Lower
secondary (ISCED 2)Mother’s education: Upper
secondary (ISCED 3-4 )Mother’s education: Tertiary
(ISCED 5-6) Coef. S.E. Coef. S.E. Coef. S.E. Coef. S.E. Coef. S.E.
OEC
D Australia 41.7 (6.5) 1.4 (7.7) 10.2 (14.4) 15.9 (16.1) 43.6 (16.2)Austria 39.1 (14.8) -0.4 (12.0) 38.1 (15.8) 60.1 (14.9) 73.7 (19.9)Belgium 62.2 (12.7) -25.6 (10.6) 44.8 (19.9) 15.2 (16.1) 38.1 (16.3)Canada 41.5 (5.7) -7.1 (5.3) 8.4 (15.4) 8.1 (11.8) 15.0 (12.4)Chile c c c c c c c c c cCzech Republic 70.6 (39.0) c c c c c c c cDenmark 40.2 (11.5) -13.8 (8.6) 10.4 (10.3) 33.9 (10.1) 28.7 (12.7)Estonia 23.9 (11.8) -15.7 (16.6) c c c c c cFinland c c c c c c c c c cFrance 67.8 (13.5) -19.5 (12.3) 6.9 (16.1) 25.0 (17.1) 18.1 (17.3)Germany 63.9 (11.1) -32.2 (10.6) -15.7 (15.8) 13.2 (14.3) 22.4 (16.9)Greece 14.1 (17.7) c c c c c c c cHungary c c c c c c c c c cIceland c c c c c c c c c cIreland c c c c c c c c c cIsrael 30.2 (8.8) 24.8 (9.0) 29.1 (24.0) 45.0 (19.1) 84.7 (19.1)Italy 34.8 (14.3) -27.1 (16.1) c c c c c cJapan c c c c c c c c c cKorea c c c c m m m m c cLuxembourg 41.6 (8.0) -34.9 (11.1) -3.1 (10.9) 11.6 (11.5) 24.5 (12.8)Mexico c c c c 4.0 (22.5) c c -9.7 (33.1)Netherlands 54.1 (11.5) -10.2 (11.1) 28.2 (13.5) 24.4 (13.8) 21.7 (18.9)New Zealand 60.2 (11.9) -36.5 (13.2) c c c c c cNorway 40.0 (26.0) -25.9 (15.3) c c c c c cPoland m m m m m m m m m mPortugal 37.8 (14.7) c c 23.8 (23.4) 29.5 (25.5) 65.9 (21.6)Slovak Republic c c c c c c c c c cSlovenia 23.3 (17.6) -21.5 (12.7) c c c c c cSpain 59.1 (21.5) -11.6 (20.0) 13.8 (25.5) 23.9 (21.1) 3.7 (26.3)Sweden 18.3 (13.3) -28.4 (11.5) c c c c c cSwitzerland 59.4 (8.1) -20.5 (7.5) 17.7 (11.7) 12.4 (13.3) 28.4 (13.4)Turkey c c c c c c c c c cUnited Kingdom 52.7 (13.2) -19.5 (11.5) 43.2 (23.5) 44.6 (23.9) 42.8 (25.5)United States 51.7 (11.0) -8.2 (8.9) 5.4 (10.8) 13.5 (9.4) 37.9 (10.0)OECD average 44.7 (3.3) -16.6 (2.7) 16.6 (4.5) 25.1 (4.3) 33.7 (4.8)
Part
ners Albania c c c c c c c c c c
Argentina c c c c c c c c c cAzerbaijan c c c c c c c c c cBrazil c c c c c c c c c cBulgaria c c c c c c c c c cColombia c c c c c c c c c cCroatia 39.2 (12.7) c c c c c c c cDubai (UAE) 36.4 (9.2) -19.9 (8.6) 27.4 (17.6) 59.8 (17.7) 95.4 (15.3)Hong Kong-China 16.9 (7.1) -58.5 (14.8) 2.3 (6.1) 15.4 (6.2) 23.0 (12.9)Indonesia m m m m m m m m m mJordan 16.3 (11.1) -27.4 (18.1) 14.4 (15.0) 26.5 (13.2) 36.7 (15.0)Kazakhstan 59.8 (12.9) -29.9 (16.3) c c c c c cKyrgyzstan c c c c c c c c m mLatvia 38.2 (15.4) c c c c m m m mLiechtenstein c c c c c c c c c cLithuania c c c c c c c c c cMacao-China 12.7 (4.1) -46.8 (17.2) 6.2 (3.8) 7.2 (5.0) 16.5 (10.8)Montenegro 9.9 (23.5) c c c c m m c cPanama c c c c c c c c c cPeru c c c c c c c c c cQatar 9.3 (5.8) -7.7 (15.1) 20.7 (13.8) 42.8 (11.3) 78.6 (14.5)Romania c c c c m m c c c cRussian Federation 51.1 (9.8) -20.6 (15.8) c c c c c cSerbia 42.0 (14.0) c c c c c c c cShanghai-China c c c c c c c c c cSingapore 35.7 (14.3) -36.5 (15.6) c c 6.6 (14.7) 34.4 (22.5)Chinese Taipei c c c c c c c c c cThailand m m m m m m m m m mTrinidad and Tobago c c c c c c c c c cTunisia c c c c c c c c c cUruguay c c c c c c c c c c
Note: Coefficient of OLS regression with dummies. for each group of students: first-. second- and non-immigrants. Values that are statistically significant are indicated in bold (see Annex A). Note reference category for mothers’ education is primary education or less. Does not speak the language of assessment at home is defined for both immigrant and non-immigrant students, i.e. it is possible to have a value of 1 on this dummy variable and not be an immigrant student.
Source: PISA 2009 Database.
Please refer to the Reader’s Guide for information concerning the symbols replacing missing data.
[Part 1/3]

167UNTAPPED SKILLS: REALISING THE POTENTIAL OF IMMIGRANT STUDENTS © OECD 2012
DATA TABLES ON IMMIGRANT STUDENTS: ANNEX B
Table B3.5
Performance difference in reading among students by immigrant background adjusting for mother’s educational attainment, language spoken at home and number of books at home, separate regressions (continued)
First-generation students
Over 100 books at homeDoes not speak the assessment
language at homeMother’s education: Lower
secondary (ISCED 2)Mother’s education: Upper
secondary (ISCED 3-4 )Mother’s education: Tertiary
(ISCED 5-6) Coef. S.E. Coef. S.E. Coef. S.E. Coef. S.E. Coef. S.E.
OEC
D Australia 55.6 (9.1) -10.4 (10.9) -7.4 (23.6) 41.7 (19.4) 67.9 (18.9)Austria 87.9 (24.7) -1.7 (23.7) 2.9 (24.4) 55.7 (24.5) 46.7 (24.9)Belgium 75.2 (13.9) -12.7 (13.6) 29.8 (23.2) 35.5 (15.7) 55.5 (15.6)Canada 53.8 (6.3) -10.7 (6.7) 26.0 (24.4) 38.3 (17.6) 64.9 (17.6)Chile c c c c c c c c c cCzech Republic c c c c c c c c c cDenmark 25.1 (20.3) -15.0 (12.5) 27.1 (21.7) 35.3 (19.6) 44.6 (14.7)Estonia c c c c c c c c c cFinland c c c c c c c c c cFrance c c 4.5 (23.8) c c c c c cGermany 70.3 (17.7) -13.0 (15.3) c c c c c cGreece c c -33.5 (16.6) c c c c c cHungary c c c c c c c c c cIceland c c c c c c c c c cIreland 62.9 (15.6) -39.4 (13.7) c c c c c cIsrael 24.6 (13.4) -0.4 (15.0) c c c c c cItaly 82.1 (11.5) -12.0 (9.9) 34.4 (19.8) 63.7 (17.1) 43.8 (15.6)Japan c c c c c c c c c cKorea m m m m m m m m m mLuxembourg 84.2 (12.6) -48.8 (12.2) 27.1 (12.3) 28.2 (15.3) 56.5 (22.3)Mexico c c -67.0 (15.2) -9.7 (16.1) c c 36.0 (17.0)Netherlands c c -5.6 (20.2) c c c c 49.3 (27.6)New Zealand 58.5 (7.9) -47.2 (8.3) c c c c c cNorway 38.0 (20.0) c c c c c c c cPoland c m c c c c m m m mPortugal c c -12.9 (15.6) c c c c c cSlovak Republic c m c c c c c c m mSlovenia c c c c c c c c c cSpain 57.2 (8.9) -23.4 (7.5) 25.3 (8.7) 37.8 (8.5) 52.7 (9.7)Sweden 108.1 (19.9) c c c c 57.1 (27.5) 68.0 (29.5)Switzerland 69.0 (12.2) -44.4 (9.8) 10.4 (12.0) 4.9 (13.9) 44.8 (13.8)Turkey c c c c c c c c c cUnited Kingdom 47.9 (14.5) -3.5 (13.2) 22.8 (29.4) 13.6 (21.2) 44.2 (24.1)United States 45.3 (18.5) -18.0 (13.3) 15.3 (16.6) 25.2 (17.1) 74.7 (17.6)OECD average 61.5 (3.7) -20.7 (3.3) 17.0 (5.8) 36.4 (5.4) 53.5 (5.3)
Part
ners Albania c c c c c c c c c c
Argentina c c c c c c c c c cAzerbaijan c c c c c c c c c cBrazil c c c c c c c c c cBulgaria c c c c c c c c c cColombia c m c c c c c c c cCroatia c c c c c c c c c cDubai (UAE) 46.7 (6.2) -33.5 (7.6) 53.7 (16.5) 92.4 (14.8) 120.7 (15.5)Hong Kong-China 23.9 (11.4) -34.9 (12.1) 8.0 (8.5) 18.8 (8.4) 37.8 (16.9)Indonesia c c c c c c c c c cJordan 23.6 (19.8) c c c c c c c cKazakhstan 84.9 (17.8) 49.4 (17.4) c c c c c cKyrgyzstan c c c c c c c c c cLatvia c c c c m m c c c cLiechtenstein c c c c c c c c c cLithuania c c c c m m c c c cMacao-China 17.5 (9.1) -58.7 (13.3) 14.5 (5.7) 30.4 (6.7) 37.6 (12.7)Montenegro 52.6 (17.5) c c c c c c c cPanama c c c c c c c c c cPeru c c c c c c c c c cQatar 25.6 (7.7) 19.7 (10.0) 50.7 (16.9) 89.0 (13.1) 117.2 (14.3)Romania c c c c c c c c c cRussian Federation 21.0 (14.3) -53.2 (16.3) c c c c c cSerbia 22.1 (18.2) c c c c c c c cShanghai-China c c c c c c c c c cSingapore 54.4 (9.0) -35.3 (10.1) c c 44.3 (17.4) 52.5 (16.0)Chinese Taipei c c c c c c c c c cThailand m m m m m m m m m mTrinidad and Tobago 44.2 (45.0) c c c c c c c cTunisia c c c c c c c c c cUruguay c c c c c c c c c c
Note: Coefficient of OLS regression with dummies. for each group of students: first-. second- and non-immigrants. Values that are statistically significant are indicated in bold (see Annex A). Note reference category for mothers’ education is primary education or less. Does not speak the language of assessment at home is defined for both immigrant and non-immigrant students, i.e. it is possible to have a value of 1 on this dummy variable and not be an immigrant student.
Source: PISA 2009 Database.
Please refer to the Reader’s Guide for information concerning the symbols replacing missing data.
[Part 2/3]

168 © OECD 2012 UNTAPPED SKILLS: REALISING THE POTENTIAL OF IMMIGRANT STUDENTS
ANNEX B: DATA TABLES ON IMMIGRANT STUDENTS
Table B3.5
Performance difference in reading among students by immigrant background adjusting for mother’s educational attainment, language spoken at home and number of books at home, separate regressions (continued)
Non-immigrant students
Over 100 books at homeDoes not speak the assessment
language at homeMother’s education: Lower
secondary (ISCED 2)Mother’s education: Upper
secondary (ISCED 3-4 )Mother’s education: Tertiary
(ISCED 5-6) Coef. S.E. Coef. S.E. Coef. S.E. Coef. S.E. Coef. S.E.
OEC
D Australia 51.4 (2.4) -40.1 (12.2) 15.0 (18.0) 46.7 (17.7) 73.2 (17.6)Austria 74.3 (4.7) -27.8 (16.2) c c c c c cBelgium 49.3 (3.1) -9.2 (5.5) 35.6 (10.4) 30.0 (9.5) 61.0 (9.8)Canada 46.9 (2.1) -31.8 (5.2) 43.9 (13.3) 56.0 (12.2) 72.7 (12.1)Chile m m c c m m m m m mCzech Republic 64.0 (4.1) c c c c c c c cDenmark 41.9 (3.1) -37.2 (20.6) c c c c c cEstonia 37.0 (3.8) -30.7 (9.5) c c c c c cFinland 47.1 (2.4) -38.4 (7.6) 18.0 (9.1) 23.0 (7.8) 45.4 (7.4)France 65.8 (4.6) -63.4 (14.2) 28.5 (20.9) 50.2 (20.4) 64.5 (20.4)Germany 57.4 (3.8) -9.9 (13.8) 0.0 (15.3) 48.8 (14.4) 61.0 (14.7)Greece 39.2 (4.4) -61.7 (15.8) -0.1 (8.7) 32.7 (8.5) 48.9 (9.0)Hungary m m c c m m m m m mIceland 43.5 (3.9) -65.0 (19.0) c c c c c cIreland 57.5 (3.5) -0.2 (11.6) 13.4 (10.7) 35.0 (9.3) 45.8 (10.0)Israel 38.1 (4.4) -35.2 (15.2) 18.9 (9.9) 73.9 (10.3) 121.7 (10.6)Italy 48.0 (2.4) -37.1 (3.5) 25.0 (5.2) 51.0 (5.3) 42.9 (5.4)Japan m m c c m m m m m mKorea m m c c m m m m m mLuxembourg 56.1 (5.7) -10.7 (11.6) 43.3 (12.1) 59.0 (13.6) 59.2 (13.3)Mexico 31.3 (2.6) -63.1 (7.1) 25.6 (2.3) 49.9 (3.3) 49.9 (2.7)Netherlands 52.8 (4.9) -4.9 (21.4) 17.4 (10.5) 21.5 (11.3) 29.8 (11.2)New Zealand 53.3 (4.1) -83.2 (10.2) 46.4 (13.5) 53.6 (12.4) 78.7 (12.8)Norway 51.7 (2.7) -44.0 (11.0) c c c c c cPoland m m c c c c c c c cPortugal 33.7 (3.3) -2.3 (16.9) 15.4 (3.9) 38.9 (4.3) 52.2 (5.3)Slovak Republic m m m m c c c c c cSlovenia 51.3 (4.0) -17.0 (14.7) c c c c c cSpain 45.6 (2.3) -1.1 (5.0) 9.4 (4.1) 24.7 (4.1) 37.9 (4.4)Sweden 57.7 (3.3) -36.9 (17.8) 35.1 (18.8) 55.9 (18.3) 63.4 (18.5)Switzerland 52.1 (3.0) -23.4 (6.8) 3.6 (16.0) 32.0 (15.3) 34.9 (16.1)Turkey m m m m m m m m m mUnited Kingdom 68.3 (2.9) -58.5 (11.7) 30.9 (12.0) 51.1 (10.9) 64.1 (11.1)United States 62.9 (4.2) -30.2 (12.6) -39.9 (14.7) -15.9 (14.1) 8.0 (14.6)OECD average 51.0 (0.7) -33.2 (2.6) 19.3 (2.8) 40.9 (2.7) 55.7 (2.7)
Part
ners Albania m m m m m m m m m m
Argentina 59.3 (6.3) c c 36.1 (6.8) 43.8 (6.2) 57.4 (6.2)Azerbaijan 34.8 (4.8) 15.8 (9.2) 17.1 (10.7) 14.8 (10.6) 34.4 (10.8)Brazil 32.8 (6.7) -57.3 (11.3) 22.3 (3.2) 47.4 (3.8) 54.1 (6.7)Bulgaria m m m m m m m m m mColombia m m m m m m m m m mCroatia 41.3 (4.3) -6.8 (19.2) 7.9 (17.0) 45.3 (16.3) 49.3 (16.8)Dubai (UAE) 16.3 (6.7) 10.2 (10.8) 28.4 (7.8) 33.1 (8.0) 51.6 (10.7)Hong Kong-China 41.3 (4.0) -82.6 (10.2) 3.8 (4.8) 15.1 (4.8) 28.5 (6.2)Indonesia m m m m m m m m m mJordan 16.8 (4.5) -16.7 (14.5) 20.9 (4.6) 32.3 (4.8) 56.6 (5.3)Kazakhstan 48.4 (6.3) 18.0 (6.4) c c c c c cKyrgyzstan 65.4 (7.1) 38.9 (6.1) c c c c c cLatvia 36.9 (3.6) -7.9 (8.5) c c c c c cLiechtenstein 57.6 (15.3) c c c c c c c cLithuania 43.2 (3.6) -36.3 (6.9) c c c c c cMacao-China 29.1 (6.3) -50.0 (15.2) 2.5 (4.6) 17.9 (6.2) 17.8 (8.0)Montenegro 42.7 (8.2) -37.9 (15.4) 16.6 (12.0) 52.4 (11.8) 62.5 (13.6)Panama 53.4 (10.2) -62.0 (15.0) 12.0 (8.0) 31.9 (8.3) 52.1 (9.6)Peru m m m m m m m m m mQatar 21.0 (4.6) -17.0 (16.0) 5.6 (7.6) -2.2 (6.7) 10.9 (9.3)Romania m m m m m m m m m mRussian Federation 46.5 (4.0) -32.1 (10.6) c c c c c cSerbia 44.4 (4.0) -29.6 (11.4) 3.0 (15.9) 36.1 (17.7) 34.9 (17.9)Shanghai-China m m m m m m m m m mSingapore 41.0 (4.0) -37.6 (3.9) 9.3 (8.0) 32.5 (4.9) 39.1 (6.2)Chinese Taipei m m m m m m m m m mThailand m m m m m m m m m mTrinidad and Tobago 27.9 (4.7) -80.7 (14.3) 13.5 (10.5) 23.7 (6.8) 43.3 (9.9)Tunisia m m c c m m m m m mUruguay c c m m m m m m m m
Note: Coefficient of OLS regression with dummies. for each group of students: first-. second- and non-immigrants. Values that are statistically significant are indicated in bold (see Annex A). Note reference category for mothers’ education is primary education or less. Does not speak the language of assessment at home is defined for both immigrant and non-immigrant students, i.e. it is possible to have a value of 1 on this dummy variable and not be an immigrant student.
Source: PISA 2009 Database.
Please refer to the Reader’s Guide for information concerning the symbols replacing missing data.
[Part 3/3]

169UNTAPPED SKILLS: REALISING THE POTENTIAL OF IMMIGRANT STUDENTS © OECD 2012
DATA TABLES ON IMMIGRANT STUDENTS: ANNEX B
Table B3.6Share of individuals in a school by percentage of students who speak a language different from the test language as main language, by migration status
Non-immigrant students
0 to 10% 10 to 20% 20 to 40% 40% or more
Mean S.E. Mean S.E. Mean S.E. Mean S.E.
OEC
D Australia 0.79 (0.02) 0.13 (0.02) 0.07 (0.01) 0.01 (0.00)
Austria 0.76 (0.03) 0.13 (0.03) 0.09 (0.02) 0.03 (0.01)
Belgium 0.28 (0.03) 0.31 (0.03) 0.3 (0.03) 0.11 (0.02)
Canada 0.7 (0.02) 0.13 (0.02) 0.13 (0.02) 0.05 (0.01)
Chile m m m m m m m m
Czech Republic 0.99 (0.01) 0.01 (0.01) 0 (0.00) 0 (0.00)
Denmark 0.78 (0.03) 0.16 (0.03) 0.05 (0.01) 0.01 (0.00)
Estonia 0.92 (0.02) 0.05 (0.02) 0.03 (0.01) 0 (0.00)
Finland 0.93 (0.02) 0.05 (0.02) 0.01 (0.00) 0.01 (0.00)
France 0.78 (0.03) 0.16 (0.03) 0.05 (0.02) 0.01 (0.01)
Germany 0.72 (0.03) 0.17 (0.03) 0.09 (0.02) 0.02 (0.01)
Greece 0.95 (0.02) 0.03 (0.01) 0.01 (0.00) 0.01 (0.01)
Hungary m m m m m m m m
Iceland 0.95 (0.02) 0.04 (0.02) 0.01 (0.01) 0 (0.00)
Ireland 0.89 (0.03) 0.07 (0.02) 0.01 (0.01) 0.02 (0.01)
Israel 0.65 (0.04) 0.24 (0.03) 0.08 (0.02) 0.03 (0.01)
Italy 0.53 (0.02) 0.23 (0.02) 0.16 (0.02) 0.07 (0.01)
Japan m m m m m m m m
Korea m m m m m m m m
Luxembourg 0 (0.00) 0 (0.00) 0.01 (0.01) 0.99 (0.01)
Mexico 0.95 (0.01) 0.02 (0.01) 0.01 (0.00) 0.01 (0.00)
Netherlands 0.89 (0.02) 0.06 (0.02) 0.03 (0.01) 0.02 (0.01)
New Zealand 0.55 (0.04) 0.28 (0.04) 0.14 (0.03) 0.03 (0.01)
Norway 0.75 (0.03) 0.2 (0.03) 0.04 (0.01) 0.01 (0.00)
Poland m m m m m m m m
Portugal 0.99 (0.00) 0.01 (0.00) 0 (0.00) 0 (0.00)
Slovak Republic m m m m m m m m
Slovenia 0.89 (0.02) 0.07 (0.02) 0.04 (0.01) 0 (0.00)
Spain 0.63 (0.03) 0.11 (0.02) 0.08 (0.02) 0.18 (0.02)
Sweden 0.77 (0.03) 0.17 (0.03) 0.04 (0.01) 0.02 (0.01)
Switzerland 0.41 (0.04) 0.35 (0.04) 0.2 (0.03) 0.04 (0.01)
Turkey m m m m m m m m
United Kingdom 0.88 (0.02) 0.08 (0.02) 0.03 (0.01) 0.01 (0.00)
United States 0.72 (0.04) 0.09 (0.02) 0.16 (0.03) 0.04 (0.01)
OECD average 0.74 (0.01) 0.12 (0.00) 0.07 (0.00) 0.06 (0.00)
Part
ners Albania m m m m m m m m
Argentina 0.98 (0.01) 0.02 (0.01) 0 (0.00) 0 (0.00)
Azerbaijan 0.8 (0.04) 0.1 (0.03) 0.05 (0.02) 0.05 (0.02)
Brazil 1 (0.00) 0 (0.00) 0 (0.00) 0 (0.00)
Bulgaria m m m m m m m m
Colombia m m m m m m m m
Croatia 0.96 (0.01) 0.02 (0.01) 0.01 (0.01) 0.01 (0.01)
Dubai (UAE) 0.52 (0.08) 0.12 (0.04) 0.04 (0.03) 0.33 (0.06)
Hong Kong-China 0.9 (0.03) 0.05 (0.02) 0.01 (0.01) 0.04 (0.02)
Indonesia m m m m m m m m
Jordan 0.95 (0.02) 0.04 (0.01) 0.01 (0.01) 0.01 (0.01)
Kazakhstan 0.62 (0.04) 0.21 (0.03) 0.14 (0.03) 0.04 (0.02)
Kyrgyzstan 0.58 (0.04) 0.04 (0.02) 0.19 (0.03) 0.2 (0.03)
Latvia 0.77 (0.04) 0.13 (0.03) 0.07 (0.02) 0.03 (0.01)
Liechtenstein 0.36 (0.27) 0.38 (0.22) 0.26 (0.17) 0 (0.00)
Lithuania 0.9 (0.02) 0.05 (0.02) 0.01 (0.01) 0.04 (0.01)
Macao-China 0.77 (0.09) 0 (0.00) 0.03 (0.02) 0.2 (0.09)
Montenegro 1 (0.00) 0 (0.00) 0 (0.00) 0 (0.00)
Panama 0.95 (0.02) 0.03 (0.01) 0 (0.00) 0.02 (0.02)
Peru m m m m m m m m
Qatar 0.6 (0.07) 0.03 (0.02) 0.02 (0.01) 0.35 (0.07)
Romania m m m m m m m m
Russian Federation 0.83 (0.03) 0.05 (0.02) 0.07 (0.02) 0.05 (0.02)
Serbia 0.97 (0.01) 0.02 (0.01) 0.01 (0.01) 0 (0.00)
Shanghai-China m m m m m m m m
Singapore 0.01 (0.01) 0.04 (0.02) 0.11 (0.02) 0.85 (0.03)
Chinese Taipei m m m m m m m m
Thailand m m m m m m m m
Trinidad and Tobago 0.95 (0.02) 0.04 (0.02) 0 (0.00) 0 (0.00)
Tunisia m m m m m m m m
Uruguay m m m m m m m m
Source: PISA 2009 Database.
Please refer to the Reader’s Guide for information concerning the symbols replacing missing data.
[Part 1/3]

170 © OECD 2012 UNTAPPED SKILLS: REALISING THE POTENTIAL OF IMMIGRANT STUDENTS
ANNEX B: DATA TABLES ON IMMIGRANT STUDENTS
Table B3.6Share of individuals in a school by percentage of students who speak a language different from the test language as main language, by migration status (continued)
Second-generation students
0 to 10% 10 to 20% 20 to 40% 40% or more
Mean S.E. Mean S.E. Mean S.E. Mean S.E.
OEC
D Australia 0.41 (0.04) 0.24 (0.04) 0.21 (0.04) 0.15 (0.05)
Austria 0.28 (0.05) 0.18 (0.05) 0.29 (0.06) 0.25 (0.07)
Belgium 0.14 (0.03) 0.19 (0.03) 0.32 (0.05) 0.35 (0.06)
Canada 0.22 (0.03) 0.2 (0.04) 0.36 (0.05) 0.22 (0.04)
Chile m m m m m m m m
Czech Republic 0.89 (0.05) 0.08 (0.05) 0.02 (0.02) 0 (0.00)
Denmark 0.36 (0.05) 0.26 (0.04) 0.29 (0.05) 0.1 (0.03)
Estonia 0.92 (0.03) 0.05 (0.03) 0.03 (0.01) 0 (0.00)
Finland 0.76 (0.08) 0.22 (0.08) 0.01 (0.01) 0.01 (0.01)
France 0.37 (0.06) 0.3 (0.06) 0.27 (0.07) 0.06 (0.04)
Germany 0.37 (0.05) 0.21 (0.04) 0.23 (0.05) 0.19 (0.06)
Greece 0.83 (0.09) 0.09 (0.08) 0.09 (0.06) 0.0 (0.00)
Hungary m m m m m m m m
Iceland c c c c c c c c
Ireland 0.88 (0.05) 0.04 (0.03) 0.04 (0.03) 0.05 (0.04)
Israel 0.42 (0.05) 0.28 (0.05) 0.23 (0.05) 0.07 (0.03)
Italy 0.4 (0.04) 0.27 (0.04) 0.24 (0.04) 0.09 (0.03)
Japan m m m m m m m m
Korea m m m m m m m m
Luxembourg 0.02 (0.02) 0 (0.00) 0.03 (0.03) 0.94 (0.04)
Mexico 0.86 (0.05) 0.04 (0.02) 0.01 (0.01) 0.1 (0.05)
Netherlands 0.5 (0.08) 0.12 (0.04) 0.3 (0.09) 0.08 (0.05)
New Zealand 0.22 (0.04) 0.21 (0.04) 0.42 (0.07) 0.16 (0.06)
Norway 0.33 (0.06) 0.29 (0.07) 0.18 (0.07) 0.19 (0.10)
Poland m m m m m m m m
Portugal 0.98 (0.01) 0.02 (0.01) 0 (0.00) 0 (0.00)
Slovak Republic m m m m m m m m
Slovenia 0.55 (0.08) 0.13 (0.04) 0.32 (0.08) 0 (0.00)
Spain 0.48 (0.07) 0.18 (0.04) 0.05 (0.02) 0.29 (0.07)
Sweden 0.33 (0.05) 0.28 (0.06) 0.2 (0.06) 0.19 (0.07)
Switzerland 0.19 (0.03) 0.35 (0.04) 0.32 (0.04) 0.14 (0.03)
Turkey m m m m m m m m
United Kingdom 0.38 (0.07) 0.19 (0.07) 0.24 (0.09) 0.18 (0.07)
United States 0.13 (0.03) 0.08 (0.03) 0.52 (0.07) 0.27 (0.07)
OECD average 0.47 (0.01) 0.17 (0.01) 0.20 (0.01) 0.16 (0.01)
Part
ners Albania m m m m m m m m
Argentina 0.92 (0.05) 0.08 (0.05) 0 (0.00) 0 (0.00)
Azerbaijan 0.67 (0.10) 0.11 (0.06) 0.1 (0.06) 0.12 (0.07)
Brazil 1 (0.00) 0 (0.00) 0 (0.00) 0 (0.00)
Bulgaria m m m m m m m m
Colombia m m m m m m m m
Croatia 0.97 (0.02) 0.02 (0.01) 0.01 (0.01) 0.01 (0.01)
Dubai (UAE) 0.18 (0.05) 0.1 (0.04) 0.06 (0.02) 0.66 (0.06)
Hong Kong-China 0.87 (0.03) 0.08 (0.03) 0.02 (0.01) 0.02 (0.01)
Indonesia m m m m m m m m
Jordan 0.94 (0.03) 0.04 (0.02) 0.02 (0.02) 0 (0.00)
Kazakhstan 0.62 (0.08) 0.26 (0.07) 0.09 (0.03) 0.04 (0.02)
Kyrgyzstan 0.15 (0.05) 0.11 (0.07) 0.47 (0.10) 0.28 (0.09)
Latvia 0.86 (0.05) 0.05 (0.02) 0.05 (0.04) 0.04 (0.02)
Liechtenstein 0.22 (0.21) 0.53 (0.24) 0.25 (0.19) 0 (0.00)
Lithuania 0.63 (0.10) 0.12 (0.05) 0 (0.00) 0.25 (0.10)
Macao-China 0.89 (0.05) 0 (0.00) 0.03 (0.03) 0.08 (0.04)
Montenegro 1 (0.00) 0 (0.00) 0 (0.00) 0 (0.00)
Panama 0.53 (0.12) 0.22 (0.10) 0.19 (0.12) 0.07 (0.07)
Peru m m m m m m m m
Qatar 0.56 (0.06) 0.06 (0.02) 0.02 (0.01) 0.36 (0.06)
Romania m m m m m m m m
Russian Federation 0.75 (0.08) 0.07 (0.03) 0.08 (0.03) 0.11 (0.08)
Serbia 0.97 (0.01) 0.02 (0.01) 0.01 (0.01) 0 (0.00)
Shanghai-China m m m m m m m m
Singapore 0.02 (0.02) 0.05 (0.03) 0.11 (0.03) 0.82 (0.04)
Chinese Taipei m m m m m m m m
Thailand m m m m m m m m
Trinidad and Tobago 0.89 (0.05) 0.1 (0.05) 0.01 (0.01) 0 (0.00)
Tunisia m m m m m m m m
Uruguay m m m m m m m m
Source: PISA 2009 Database.
Please refer to the Reader’s Guide for information concerning the symbols replacing missing data.
[Part 2/3]
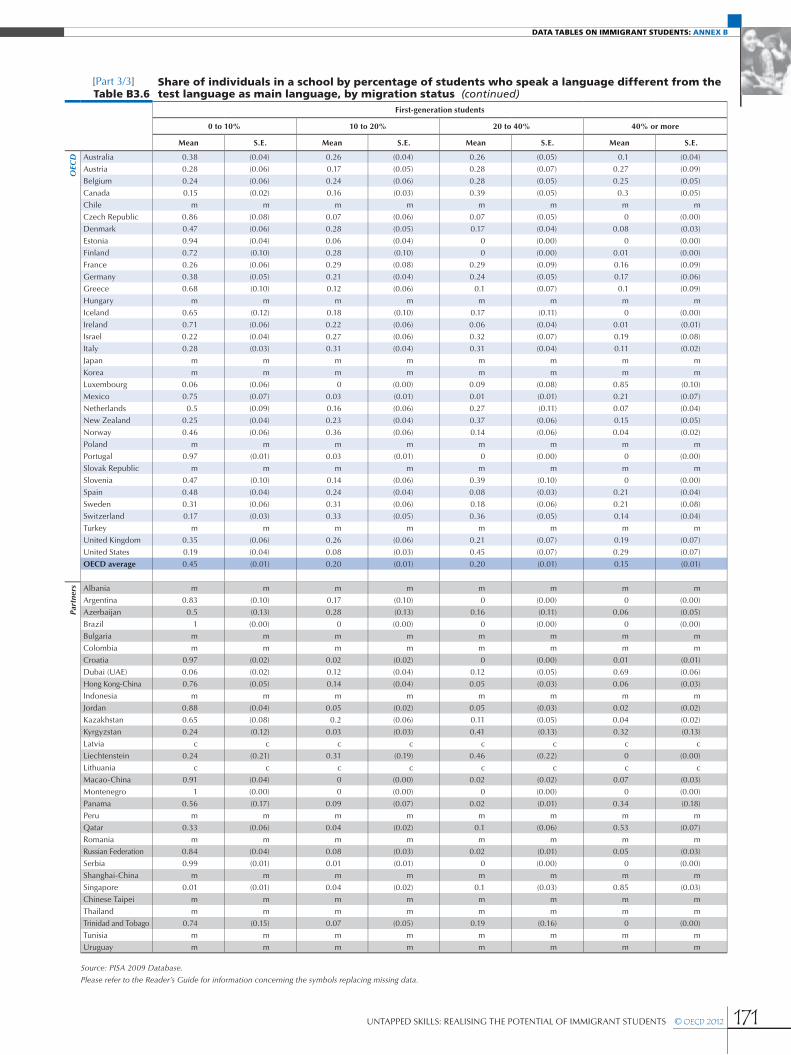
171UNTAPPED SKILLS: REALISING THE POTENTIAL OF IMMIGRANT STUDENTS © OECD 2012
DATA TABLES ON IMMIGRANT STUDENTS: ANNEX B
Table B3.6Share of individuals in a school by percentage of students who speak a language different from the test language as main language, by migration status (continued)
First-generation students
0 to 10% 10 to 20% 20 to 40% 40% or more
Mean S.E. Mean S.E. Mean S.E. Mean S.E.
OEC
D Australia 0.38 (0.04) 0.26 (0.04) 0.26 (0.05) 0.1 (0.04)
Austria 0.28 (0.06) 0.17 (0.05) 0.28 (0.07) 0.27 (0.09)
Belgium 0.24 (0.06) 0.24 (0.06) 0.28 (0.05) 0.25 (0.05)
Canada 0.15 (0.02) 0.16 (0.03) 0.39 (0.05) 0.3 (0.05)
Chile m m m m m m m m
Czech Republic 0.86 (0.08) 0.07 (0.06) 0.07 (0.05) 0 (0.00)
Denmark 0.47 (0.06) 0.28 (0.05) 0.17 (0.04) 0.08 (0.03)
Estonia 0.94 (0.04) 0.06 (0.04) 0 (0.00) 0 (0.00)
Finland 0.72 (0.10) 0.28 (0.10) 0 (0.00) 0.01 (0.00)
France 0.26 (0.06) 0.29 (0.08) 0.29 (0.09) 0.16 (0.09)
Germany 0.38 (0.05) 0.21 (0.04) 0.24 (0.05) 0.17 (0.06)
Greece 0.68 (0.10) 0.12 (0.06) 0.1 (0.07) 0.1 (0.09)
Hungary m m m m m m m m
Iceland 0.65 (0.12) 0.18 (0.10) 0.17 (0.11) 0 (0.00)
Ireland 0.71 (0.06) 0.22 (0.06) 0.06 (0.04) 0.01 (0.01)
Israel 0.22 (0.04) 0.27 (0.06) 0.32 (0.07) 0.19 (0.08)
Italy 0.28 (0.03) 0.31 (0.04) 0.31 (0.04) 0.11 (0.02)
Japan m m m m m m m m
Korea m m m m m m m m
Luxembourg 0.06 (0.06) 0 (0.00) 0.09 (0.08) 0.85 (0.10)
Mexico 0.75 (0.07) 0.03 (0.01) 0.01 (0.01) 0.21 (0.07)
Netherlands 0.5 (0.09) 0.16 (0.06) 0.27 (0.11) 0.07 (0.04)
New Zealand 0.25 (0.04) 0.23 (0.04) 0.37 (0.06) 0.15 (0.05)
Norway 0.46 (0.06) 0.36 (0.06) 0.14 (0.06) 0.04 (0.02)
Poland m m m m m m m m
Portugal 0.97 (0.01) 0.03 (0.01) 0 (0.00) 0 (0.00)
Slovak Republic m m m m m m m m
Slovenia 0.47 (0.10) 0.14 (0.06) 0.39 (0.10) 0 (0.00)
Spain 0.48 (0.04) 0.24 (0.04) 0.08 (0.03) 0.21 (0.04)
Sweden 0.31 (0.06) 0.31 (0.06) 0.18 (0.06) 0.21 (0.08)
Switzerland 0.17 (0.03) 0.33 (0.05) 0.36 (0.05) 0.14 (0.04)
Turkey m m m m m m m m
United Kingdom 0.35 (0.06) 0.26 (0.06) 0.21 (0.07) 0.19 (0.07)
United States 0.19 (0.04) 0.08 (0.03) 0.45 (0.07) 0.29 (0.07)
OECD average 0.45 (0.01) 0.20 (0.01) 0.20 (0.01) 0.15 (0.01)
Part
ners Albania m m m m m m m m
Argentina 0.83 (0.10) 0.17 (0.10) 0 (0.00) 0 (0.00)
Azerbaijan 0.5 (0.13) 0.28 (0.13) 0.16 (0.11) 0.06 (0.05)
Brazil 1 (0.00) 0 (0.00) 0 (0.00) 0 (0.00)
Bulgaria m m m m m m m m
Colombia m m m m m m m m
Croatia 0.97 (0.02) 0.02 (0.02) 0 (0.00) 0.01 (0.01)
Dubai (UAE) 0.06 (0.02) 0.12 (0.04) 0.12 (0.05) 0.69 (0.06)
Hong Kong-China 0.76 (0.05) 0.14 (0.04) 0.05 (0.03) 0.06 (0.03)
Indonesia m m m m m m m m
Jordan 0.88 (0.04) 0.05 (0.02) 0.05 (0.03) 0.02 (0.02)
Kazakhstan 0.65 (0.08) 0.2 (0.06) 0.11 (0.05) 0.04 (0.02)
Kyrgyzstan 0.24 (0.12) 0.03 (0.03) 0.41 (0.13) 0.32 (0.13)
Latvia c c c c c c c c
Liechtenstein 0.24 (0.21) 0.31 (0.19) 0.46 (0.22) 0 (0.00)
Lithuania c c c c c c c c
Macao-China 0.91 (0.04) 0 (0.00) 0.02 (0.02) 0.07 (0.03)
Montenegro 1 (0.00) 0 (0.00) 0 (0.00) 0 (0.00)
Panama 0.56 (0.17) 0.09 (0.07) 0.02 (0.01) 0.34 (0.18)
Peru m m m m m m m m
Qatar 0.33 (0.06) 0.04 (0.02) 0.1 (0.06) 0.53 (0.07)
Romania m m m m m m m m
Russian Federation 0.84 (0.04) 0.08 (0.03) 0.02 (0.01) 0.05 (0.03)
Serbia 0.99 (0.01) 0.01 (0.01) 0 (0.00) 0 (0.00)
Shanghai-China m m m m m m m m
Singapore 0.01 (0.01) 0.04 (0.02) 0.1 (0.03) 0.85 (0.03)
Chinese Taipei m m m m m m m m
Thailand m m m m m m m m
Trinidad and Tobago 0.74 (0.15) 0.07 (0.05) 0.19 (0.16) 0 (0.00)
Tunisia m m m m m m m m
Uruguay m m m m m m m m
Source: PISA 2009 Database.
Please refer to the Reader’s Guide for information concerning the symbols replacing missing data.
[Part 3/3]
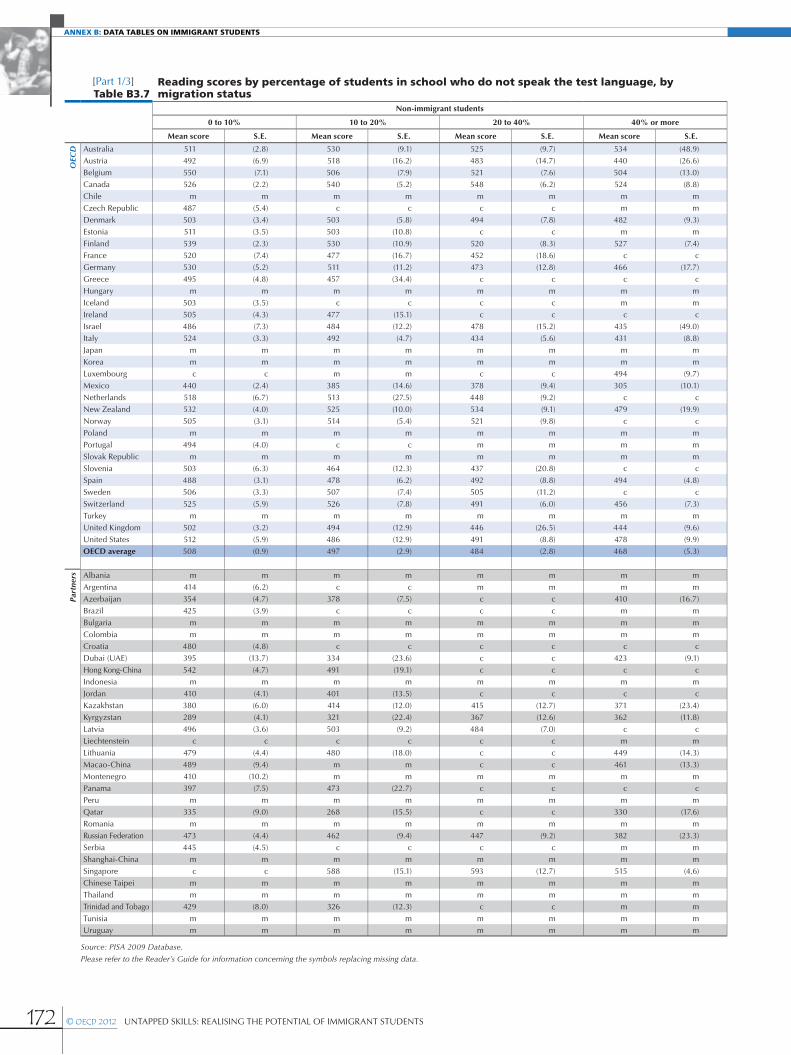
172 © OECD 2012 UNTAPPED SKILLS: REALISING THE POTENTIAL OF IMMIGRANT STUDENTS
ANNEX B: DATA TABLES ON IMMIGRANT STUDENTS
Table B3.7Reading scores by percentage of students in school who do not speak the test language, by migration status
Non-immigrant students
0 to 10% 10 to 20% 20 to 40% 40% or more
Mean score S.E. Mean score S.E. Mean score S.E. Mean score S.E.
OEC
D Australia 511 (2.8) 530 (9.1) 525 (9.7) 534 (48.9)Austria 492 (6.9) 518 (16.2) 483 (14.7) 440 (26.6)Belgium 550 (7.1) 506 (7.9) 521 (7.6) 504 (13.0)Canada 526 (2.2) 540 (5.2) 548 (6.2) 524 (8.8)Chile m m m m m m m mCzech Republic 487 (5.4) c c c c m mDenmark 503 (3.4) 503 (5.8) 494 (7.8) 482 (9.3)Estonia 511 (3.5) 503 (10.8) c c m mFinland 539 (2.3) 530 (10.9) 520 (8.3) 527 (7.4)France 520 (7.4) 477 (16.7) 452 (18.6) c cGermany 530 (5.2) 511 (11.2) 473 (12.8) 466 (17.7)Greece 495 (4.8) 457 (34.4) c c c cHungary m m m m m m m mIceland 503 (3.5) c c c c m mIreland 505 (4.3) 477 (15.1) c c c cIsrael 486 (7.3) 484 (12.2) 478 (15.2) 435 (49.0)Italy 524 (3.3) 492 (4.7) 434 (5.6) 431 (8.8)Japan m m m m m m m mKorea m m m m m m m mLuxembourg c c m m c c 494 (9.7)Mexico 440 (2.4) 385 (14.6) 378 (9.4) 305 (10.1)Netherlands 518 (6.7) 513 (27.5) 448 (9.2) c cNew Zealand 532 (4.0) 525 (10.0) 534 (9.1) 479 (19.9)Norway 505 (3.1) 514 (5.4) 521 (9.8) c cPoland m m m m m m m mPortugal 494 (4.0) c c m m m mSlovak Republic m m m m m m m mSlovenia 503 (6.3) 464 (12.3) 437 (20.8) c cSpain 488 (3.1) 478 (6.2) 492 (8.8) 494 (4.8)Sweden 506 (3.3) 507 (7.4) 505 (11.2) c cSwitzerland 525 (5.9) 526 (7.8) 491 (6.0) 456 (7.3)Turkey m m m m m m m mUnited Kingdom 502 (3.2) 494 (12.9) 446 (26.5) 444 (9.6)United States 512 (5.9) 486 (12.9) 491 (8.8) 478 (9.9)OECD average 508 (0.9) 497 (2.9) 484 (2.8) 468 (5.3)
Part
ners Albania m m m m m m m m
Argentina 414 (6.2) c c m m m mAzerbaijan 354 (4.7) 378 (7.5) c c 410 (16.7)Brazil 425 (3.9) c c c c m mBulgaria m m m m m m m mColombia m m m m m m m mCroatia 480 (4.8) c c c c c cDubai (UAE) 395 (13.7) 334 (23.6) c c 423 (9.1)Hong Kong-China 542 (4.7) 491 (19.1) c c c cIndonesia m m m m m m m mJordan 410 (4.1) 401 (13.5) c c c cKazakhstan 380 (6.0) 414 (12.0) 415 (12.7) 371 (23.4)Kyrgyzstan 289 (4.1) 321 (22.4) 367 (12.6) 362 (11.8)Latvia 496 (3.6) 503 (9.2) 484 (7.0) c cLiechtenstein c c c c c c m mLithuania 479 (4.4) 480 (18.0) c c 449 (14.3)Macao-China 489 (9.4) m m c c 461 (13.3)Montenegro 410 (10.2) m m m m m mPanama 397 (7.5) 473 (22.7) c c c cPeru m m m m m m m mQatar 335 (9.0) 268 (15.5) c c 330 (17.6)Romania m m m m m m m mRussian Federation 473 (4.4) 462 (9.4) 447 (9.2) 382 (23.3)Serbia 445 (4.5) c c c c m mShanghai-China m m m m m m m mSingapore c c 588 (15.1) 593 (12.7) 515 (4.6)Chinese Taipei m m m m m m m mThailand m m m m m m m mTrinidad and Tobago 429 (8.0) 326 (12.3) c c m mTunisia m m m m m m m mUruguay m m m m m m m m
Source: PISA 2009 Database.
Please refer to the Reader’s Guide for information concerning the symbols replacing missing data.
[Part 1/3]

173UNTAPPED SKILLS: REALISING THE POTENTIAL OF IMMIGRANT STUDENTS © OECD 2012
DATA TABLES ON IMMIGRANT STUDENTS: ANNEX B
Table B3.7Reading scores by percentage of students in school who do not speak the test language, by migration status (continued)
Second-generation students
0 to 10% 10 to 20% 20 to 40% 40% or more
Mean score S.E. Mean score S.E. Mean score S.E. Mean score S.E.
OEC
D Australia 524 (5.4) 526 (10.4) 520 (11.7) 563 (35.5)Austria 465 (11.0) 469 (14.9) 437 (14.2) 408 (21.1)Belgium 509 (13.5) 471 (13.4) 477 (13.6) 419 (16.3)Canada 525 (6.7) 528 (6.0) 524 (7.1) 516 (12.0)Chile m m m m m m m mCzech Republic 488 (12.9) c c c c m mDenmark 471 (8.2) 451 (7.3) 419 (5.6) 410 (13.7)Estonia 473 (6.2) c c c c m mFinland 502 (14.6) c c c c c cFrance 476 (14.9) 442 (17.2) 437 (25.3) c cGermany 501 (7.7) 480 (16.8) 435 (12.8) 422 (15.8)Greece 479 (12.3) c c c c m mHungary m m m m m m m mIceland c c c c m m m mIreland 509 (13.9) c c c c c cIsrael 489 (10.5) 493 (15.5) 468 (18.7) c cItaly 494 (11.3) 458 (17.5) 411 (10.1) 374 (30.2)Japan m m m m m m m mKorea m m m m m m m mLuxembourg c c m m c c 432 (10.2)Mexico 363 (9.2) c c c c c cNetherlands 490 (9.8) 458 (21.2) 449 (19.4) c cNew Zealand 550 (11.0) 499 (11.7) 495 (18.3) 462 (20.2)Norway 476 (12.5) 454 (11.2) c c c cPoland m m m m m m m mPortugal 480 (12.7) c c m m m mSlovak Republic m m m m m m m mSlovenia 483 (8.9) 432 (17.7) 420 (14.0) m mSpain 476 (11.6) 433 (14.2) 442 (27.2) 457 (21.3)Sweden 474 (10.0) 470 (10.1) 434 (11.2) 402 (13.6)Switzerland 500 (12.5) 494 (10.9) 451 (7.8) 413 (7.6)Turkey m m m m m m m mUnited Kingdom 517 (9.5) 502 (23.0) 479 (15.7) c cUnited States 527 (14.4) 497 (10.9) 474 (8.4) 470 (6.5)OECD average 490 (2.2) 475 (3.4) 457 (3.7) 442 (5.3)
Part
ners Albania m m m m m m m m
Argentina 376 (12.7) c c m m m mAzerbaijan 353 (8.8) c c c c c cBrazil 326 (20.3) m m m m m mBulgaria m m m m m m m mColombia m m m m m m m mCroatia 467 (7.3) c c c c c cDubai (UAE) 408 (12.3) 479 (30.3) 544 (13.4) 481 (7.9)Hong Kong-China 550 (4.7) 508 (16.0) c c c cIndonesia m m m m m m m mJordan 425 (6.8) 382 (30.1) c c c cKazakhstan 402 (24.4) 447 (16.8) 430 (19.2) c cKyrgyzstan c c c c c c c cLatvia 492 (9.6) c c c c c cLiechtenstein c c c c c c m mLithuania 439 (15.2) c c m m c cMacao-China 492 (6.5) m m c c 471 (21.5)Montenegro 441 (14.2) m m m m m mPanama 413 (25.1) c c c c c cPeru m m m m m m m mQatar 383 (8.3) 374 (35.9) c c 408 (20.0)Romania m m m m m m m mRussian Federation 453 (5.2) c c c c c cSerbia 469 (8.3) c c c c m mShanghai-China m m m m m m m mSingapore c c c c c c 529 (7.9)Chinese Taipei m m m m m m m mThailand m m m m m m m mTrinidad and Tobago 436 (29.7) c c c c m mTunisia m m m m m m m mUruguay m m m m m m m m
Source: PISA 2009 Database.
Please refer to the Reader’s Guide for information concerning the symbols replacing missing data.
[Part 2/3]

174 © OECD 2012 UNTAPPED SKILLS: REALISING THE POTENTIAL OF IMMIGRANT STUDENTS
ANNEX B: DATA TABLES ON IMMIGRANT STUDENTS
Table B3.7Reading scores by percentage of students in school who do not speak the test language, by migration status (continued)
First-generation students
0 to 10% 10 to 20% 20 to 40% 40% or more
Mean score S.E. Mean score S.E. Mean score S.E. Mean score S.E.
OEC
D Australia 519 (6.4) 523 (9.8) 494 (9.3) 570 (36.5)Austria 451 (21.1) 418 (34.7) 431 (21.3) 365 (31.8)Belgium 477 (15.3) 446 (25.5) 472 (13.3) 430 (13.0)Canada 539 (9.1) 536 (10.4) 522 (8.2) 517 (12.2)Chile m m m m m m m mCzech Republic 461 (21.1) c c c c m mDenmark 426 (11.8) 424 (7.7) 401 (7.5) 409 (21.7)Estonia c c c c m m m mFinland 466 (16.4) c c m m c cFrance 487 (18.7) 404 (21.3) 435 (34.9) c cGermany 486 (10.0) 470 (17.4) 429 (13.1) 421 (19.2)Greece 456 (10.1) c c c c c cHungary m m m m m m m mIceland 435 (14.4) c c c c m mIreland 485 (8.2) 449 (22.5) c c c cIsrael 465 (13.9) 445 (19.4) 464 (18.6) 475 (13.9)Italy 477 (7.7) 432 (8.3) 396 (6.1) 368 (19.0)Japan m m m m m m m mKorea m m m m m m m mLuxembourg c c m m c c 424 (16.9)Mexico 352 (7.5) c c c c 265 (14.0)Netherlands 508 (14.2) c c 430 (11.2) c cNew Zealand 544 (9.2) 504 (10.1) 526 (8.3) 495 (21.4)Norway 454 (12.0) 445 (8.2) c c c cPoland m m m m m m m mPortugal 458 (8.3) c c m m m mSlovak Republic m m m m m m m mSlovenia c c c c c c m mSpain 437 (4.5) 414 (11.2) 427 (18.6) 418 (6.7)Sweden 418 (17.4) 406 (9.3) c c c cSwitzerland 490 (19.6) 478 (17.3) 432 (7.3) 398 (7.8)Turkey m m m m m m m mUnited Kingdom 474 (11.2) 473 (15.4) 449 (21.2) c cUnited States 514 (18.0) c c 481 (11.9) 463 (17.2)OECD average 470 (2.8) 454 (4.3) 453 (4.1) 430 (5.2)
Part
ners Albania m m m m m m m m
Argentina 394 (15.4) c c m m m mAzerbaijan c c c c c c c cBrazil 310 (16.3) m m m m m mBulgaria m m m m m m m mColombia m m m m m m m mCroatia 454 (9.0) c c m m c cDubai (UAE) 442 (18.6) 542 (21.9) 572 (8.5) 495 (8.0)Hong Kong-China 529 (5.1) 481 (11.7) c c c cIndonesia m m m m m m m mJordan 420 (11.3) c c c c c cKazakhstan 361 (10.7) 363 (18.5) c c c cKyrgyzstan c c c c c c c cLatvia c c c c c c c cLiechtenstein c c c c c c m mLithuania c c c c m m m mMacao-China 492 (7.0) m m c c 469 (24.7)Montenegro 409 (9.3) m m m m m mPanama 413 (35.7) c c c c c cPeru m m m m m m m mQatar 406 (8.5) 385 (34.5) c c 478 (11.7)Romania m m m m m m m mRussian Federation 456 (8.3) c c c c c cSerbia 449 (7.2) c c m m m mShanghai-China m m m m m m m mSingapore c c c c 590 (13.5) 510 (7.8)Chinese Taipei m m m m m m m mThailand m m m m m m m mTrinidad and Tobago 413 (29.6) c c c c m mTunisia m m m m m m m mUruguay m m m m m m m m
Source: PISA 2009 Database.
Please refer to the Reader’s Guide for information concerning the symbols replacing missing data.
[Part 3/3]

175UNTAPPED SKILLS: REALISING THE POTENTIAL OF IMMIGRANT STUDENTS © OECD 2012
DATA TABLES ON IMMIGRANT STUDENTS: ANNEX B
Table B3.8Performance difference in reading of non-immigrant students adjusting for mother’s educational attainment, language spoken at home and percentage that do not speak the test language
10 to 20% students do not speak the test
language as first language
20 to 40% students do not speak the test
language as first language
40% or more students do not speak the test
language as first language
Second-generation students
First-generation students
Does not speak the assessment
language at home
Mother’s education:
Lower secondary (ISCED 2)
Mother’s education:
Upper secondary (ISCED 3-4 )
Mother’s education:
Tertiary (ISCED 5-6)
Coef. S.E. Coef. S.E. Coef. S.E. Coef. S.E. Coef. S.E. Coef. S.E. Coef. S.E. Coef. S.E. Coef. S.E.
OEC
D Australia 17.0 (7.5) 7.2 (8.6) 61.2 (29.7) 13.5 (3.7) 2.7 (4.2) -22.8 (4.9) 4.3 (10.7) 39.9 (10.6) 75.5 (10.8)Austria 20.2 (15.7) -9.8 (15.2) -50.1 (21.4) -11.9 (8.6) -33.8 (13.4) -16.4 (8.0) 20.7 (15.5) 49.5 (15.8) 75.7 (16.6)Belgium -34.6 (9.5) -19.6 (9.3) -37.1 (12.2) -38.7 (8.2) -49.5 (9.2) -3.6 (3.8) 39.5 (8.4) 33.9 (7.1) 69.7 (7.7)Canada 12.2 (5.4) 16.9 (6.1) 8.5 (7.7) 1.0 (4.0) 2.1 (4.9) -20.0 (3.8) 19.7 (11.3) 31.7 (10.6) 53.5 (10.7)Chile m m m m m m c c c c c c m m m m m mCzech Republic c c c c m m m m m m m m m c m m m mDenmark 1.0 (5.9) -7.8 (6.8) -12.7 (8.3) -24.2 (6.8) -57.2 (9.0) -10.8 (7.6) -1.9 (8.5) 30.9 (8.7) 53.7 (8.5)Estonia m m c c m m m m m m m m m c m m m mFinland m m m m m m m m m m m m m m m m m mFrance -37.5 (15.4) -42.0 (18.4) c c -6.6 (7.9) -16.6 (12.4) -18.4 (8.5) c (10.6) 32.1 (11.8) 61.0 (12.5)Germany -17.5 (11.0) -47.9 (11.0) -59.7 (15.9) -15.2 (6.0) -29.6 (8.7) -4.7 (7.0) -9.5 (11.6) 38.0 (10.6) 60.1 (11.2)Greece m m c c c c m m m m m m c m m m m mHungary m m m m m m m m m m m m m m m m m mIceland c c c c m m c c m m m m m m m m m mIreland -20.4 (13.7) c c c c 8.9 (14.1) -22.1 (9.4) -27.2 (12.2) c (10.1) 47.6 (9.2) 72.0 (9.9)Israel -1.6 (10.1) -10.1 (13.7) -22.4 (24.4) 15.9 (6.3) 8.6 (11.9) -11.2 (8.5) 21.6 (8.3) 72.3 (9.2) 129.6 (9.5)Italy -28.0 (5.2) -79.5 (6.2) -81.0 (9.5) -21.3 (6.5) -48.9 (4.5) -4.0 (2.6) 26.2 (4.7) 52.2 (4.9) 50.1 (5.2)Japan m m m m m m c c c c c c m m m m m mKorea m m m m m m c c m m c c m m m m m mLuxembourg m m c c c c m m m m m m c m m m m mMexico -40.5 (11.7) -41.9 (9.8) -101.2 (12.4) -68.4 (9.2) -66.3 (7.0) -17.6 (6.9) 19.3 (2.3) 44.8 (3.5) 49.1 (3.2)Netherlands -7.1 (25.0) -54.5 (14.8) c c -18.2 (9.0) -9.1 (11.7) -1.2 (8.0) c (8.6) 23.0 (8.9) 42.3 (9.3)New Zealand -8.6 (8.5) 0.4 (8.6) -22.0 (14.2) 2.1 (7.0) 12.1 (5.3) -59.2 (6.0) 44.7 (12.4) 59.4 (11.4) 92.8 (12.1)Norway 8.2 (5.7) 14.3 (11.3) c c -19.0 (11.9) -17.7 (11.8) -37.7 (9.4) c (12.2) 64.2 (11.0) 84.5 (11.0)Poland m m m m m m m m c c c c m c m m m mPortugal c c m m m m m m m m m m m m m m m mSlovak Republic m m m m m m c c c c m m m c m m m mSlovenia m m m m c c m m m m m m c m m m m mSpain -9.8 (5.7) 1.0 (8.2) 7.9 (5.6) -25.6 (10.8) -58.6 (4.0) -10.5 (3.8) 15.3 (3.8) 36.2 (3.8) 58.1 (4.4)Sweden 1.8 (7.8) -6.6 (10.4) -45.0 (9.8) -10.7 (9.7) -43.2 (13.1) -31.8 (10.0) 30.2 (11.9) 61.9 (11.2) 75.2 (11.5)Switzerland 2.5 (9.3) -31.0 (8.2) -63.5 (9.3) -6.0 (5.1) -22.4 (6.3) -19.6 (4.4) 11.6 (7.6) 39.3 (7.8) 57.7 (8.3)Turkey m m m m m m c c c c m m m m m m m mUnited Kingdom -4.7 (10.3) -39.3 (20.0) -48.9 (9.4) 16.1 (8.4) -9.0 (10.1) -11.8 (7.8) 15.7 (10.9) 40.8 (10.1) 65.2 (10.4)United States -21.9 (11.9) -19.9 (9.1) -26.2 (9.1) 11.1 (6.2) 11.3 (8.5) -13.5 (6.5) -8.0 (7.0) 14.3 (6.9) 49.4 (7.9)OECD average -8.9 (2.6) -20.6 (2.7) -32.8 (3.8) -10.4 (1.9) -23.5 (2.1) -18.0 (1.7) 16.6 (2.3) 42.7 (2.2) 67.1 (2.3)
Part
ners Albania m m m m m m c c c c m m m m m m m m
Argentina c c m m m m m m m m m m m m m m m mAzerbaijan 17.5 (8.5) c c 43.7 (13.6) -0.6 (10.0) 10.0 (12.1) 8.9 (5.4) 27.0 (10.5) 25.7 (10.7) 49.2 (10.7)Brazil c c c c m m m m m m m m m m m m m mBulgaria m m m m m m c c c c m m m m m m m mColombia m m m m m m c c c c m m m m m m m mCroatia c c c c c c m m m m m m c m m m m mDubai (UAE) 39.0 (25.9) 93.3 (16.1) 43.3 (14.0) 49.2 (9.3) 69.8 (9.5) -33.9 (5.1) 26.8 (9.1) 47.3 (10.1) 75.6 (11.2)Hong Kong-China -42.1 (15.0) c c c c 14.2 (3.5) -3.6 (4.4) -24.2 (7.6) c (3.4) 18.5 (3.8) 44.7 (6.2)Indonesia m m m m m m m m c c m m m m m m m mJordan -17.3 (18.8) c c c c 10.5 (5.6) 6.6 (9.1) -15.0 (8.4) c (4.2) 29.6 (4.4) 52.4 (5.2)Kazakhstan 30.2 (12.0) 29.8 (13.2) -9.0 (21.1) 25.7 (15.6) -19.8 (7.9) 12.5 (5.0) 78.4 c 96.0 (29.0) 139.8 (29.3)Kyrgyzstan 25.6 (19.1) 75.8 (12.8) 67.7 (13.6) 18.7 (18.4) 0.7 (23.0) -4.2 (6.5) -5.8 c 20.4 (21.5) 53.1 (21.9)Latvia m m m m c c m m c c m m c c m m m mLiechtenstein c c c c m m m m m m m m m c m m m mLithuania m m c c m m m m c c m m m c m m m mMacao-China m m c c m m m m m m m m m m m m m mMontenegro m m m m m m m m m m m m m m m m m mPanama m m c c c c m m m m m m c m m m m mPeru m m m m m m c c c c m m m m m m m mQatar -40.2 (20.8) c c 56.7 (16.2) 60.3 (8.1) 109.9 (10.7) -51.5 (7.9) 12.2 (8.2) 17.4 (8.1) 37.9 (10.4)Romania m m m m m m c c c c m m m m m m m mRussian Federation -9.9 (10.6) -22.3 (11.0) -67.8 (22.2) -18.8 (6.3) -14.9 (7.8) -18.6 (8.6) 29.9 c 38.7 (39.2) 71.8 (38.4)Serbia c c c c m m m m m m m m m m m m m mShanghai-China m m m m m m c c c c m m m m m m m mSingapore c c c c c c 20.4 (6.8) -3.0 (5.6) -33.6 (3.3) c (7.5) 33.5 (4.6) 43.8 (6.1)Chinese Taipei m m m m m m c c c c m m m m m m m mThailand m m m m m m m m m m m m m m m m m mTrinidad and Tobago m m c c m m m m m m m m m m m m m mTunisia m m m m m m c c c c c c m m m m m mUruguay m m m m m m c c c c m m m m m m m m
Note: Coefficient of OLS regression with dummies. Values that are statistically significant are indicated in bold (see Annex A). Note reference category for mothers’ education is primary education or less. Does not speak the language of assessment at home is defined for both immigrant and non-immigrant students, i.e. it is possible to have a value of 1 on this dummy variable and not be an immigrant student.
Source: PISA 2009 Database.
Please refer to the Reader’s Guide for information concerning the symbols replacing missing data.

176 © OECD 2012 UNTAPPED SKILLS: REALISING THE POTENTIAL OF IMMIGRANT STUDENTS
ANNEX B: DATA TABLES ON IMMIGRANT STUDENTS
Table B3.9 Share of students attending test language remedial classes, by migration backgroundNon-immigrant students Second-generation students First-generation students
% S.E. % S.E. % S.E.
OEC
D Australia 4.1 (0.3) 5.7 (0.8) 9.7 (0.9)
Austria 3.9 (0.4) 11.9 (2.1) 19.8 (3.0)
Belgium 1.8 (0.2) 4.3 (0.9) 5.6 (1.4)
Canada 3.7 (0.2) 5.0 (0.7) 9.0 (0.9)
Chile m m m m m m
Czech Republic 4.5 (0.4) 1.4 (0.8) 22.6 (6.7)
Denmark 2.4 (0.3) 11.6 (1.5) 20.4 (2.4)
Estonia 11.3 (0.7) 6.6 (1.6) 9.5 (5.2)
Finland 1.9 (0.2) 4.0 (2.5) 18.6 (4.2)
France 15.4 (0.9) 21.2 (2.4) 22.3 (3.8)
Germany 5.7 (0.4) 10.8 (1.4) 10.1 (2.1)
Greece 18.3 (0.7) 11.4 (2.9) 9.9 (2.7)
Hungary m m m m m m
Iceland 8.2 (0.4) c c 31.8 (6.4)
Ireland 2.8 (0.3) 0.0 (0.0) 12.8 (2.7)
Israel 12.3 (0.6) 9.5 (1.7) 14.8 (1.9)
Italy 6.5 (0.3) 10.5 (2.6) 16.5 (1.7)
Japan m m m m m m
Korea m m m m m m
Luxembourg 2.7 (0.3) 5.8 (0.8) 6.5 (0.9)
Mexico 16.5 (0.5) 35.6 (4.9) 39.1 (3.8)
Netherlands 3.4 (0.4) 9.0 (2.4) 8.7 (2.9)
New Zealand 3.8 (0.3) 6.9 (1.8) 11.6 (1.1)
Norway 3.2 (0.3) 5.9 (1.5) 15.2 (3.1)
Poland m m m m m m
Portugal 11.3 (1.0) 11.7 (3.6) 10.2 (2.4)
Slovak Republic m m m m m m
Slovenia 5.9 (0.4) 10.1 (2.2) 20.2 (5.2)
Spain 12.1 (0.9) 11.3 (2.5) 22.2 (1.3)
Sweden 4.0 (0.4) 9.1 (1.6) 16.7 (2.7)
Switzerland 4.0 (0.5) 8.3 (0.9) 10.3 (1.3)
Turkey m m m m m m
United Kingdom 15.8 (0.8) 21.5 (2.7) 30.4 (3.9)
United States 5.5 (0.4) 8.2 (1.4) 11.7 (2.0)
OECD average 7.1 (0.1) 9.9 (0.4) 16.2 (0.6)
Part
ners Albania m m m m m m
Argentina 8.8 (0.6) 10.3 (3.7) 8.2 (3.9)
Azerbaijan 41.8 (1.3) 38.1 (5.4) 15.6 (7.8)
Brazil 10.0 (0.4) 13.4 (5.0) 32.1 (9.7)
Bulgaria m m m m m m
Colombia m m m m m m
Croatia 5.2 (0.4) 7.7 (1.7) 8.0 (2.4)
Dubai (UAE) 14.6 (0.9) 12.9 (0.9) 11.5 (0.6)
Hong Kong-China 12.6 (0.7) 11.4 (1.1) 10.8 (1.1)
Indonesia m m m m m m
Jordan 26.0 (0.9) 20.2 (2.0) 20.4 (3.6)
Kazakhstan 54.3 (1.5) 54.1 (3.5) 56.7 (3.5)
Kyrgyzstan 23.4 (0.9) 7.6 (3.1) 20.6 (8.2)
Latvia 4.8 (0.4) 4.1 (2.2) c c
Liechtenstein 4.0 (1.1) 10.6 (4.4) 13.6 (4.6)
Lithuania 8.7 (0.5) 7.5 (2.9) c c
Macao-China 6.2 (0.6) 3.6 (0.4) 4.0 (0.6)
Montenegro 5.6 (0.6) 3.5 (1.7) 7.5 (4.2)
Panama 25.3 (1.6) 23.9 (10.0) 39.6 (7.8)
Peru m m m m m m
Qatar 26.8 (0.6) 19.1 (0.9) 15.1 (0.9)
Romania m m m m m m
Russian Federation 41.5 (1.3) 50.3 (2.5) 46.1 (3.9)
Serbia 5.2 (0.6) 4.5 (1.4) 7.2 (2.6)
Shanghai-China m m m m m m
Singapore 30.0 (0.6) 32.9 (3.2) 33.0 (1.8)
Chinese Taipei m m m m m m
Thailand m m m m m m
Trinidad and Tobago 10.5 (0.5) 11.0 (5.6) 12.3 (5.8)
Tunisia m m m m m m
Uruguay m m m m m m
Source: PISA 2009 Database.
Please refer to the Reader’s Guide for information concerning the symbols replacing missing data.

177Untapped SkillS: RealiSing the potential of immigRant StUdentS © OECD 2012
data tables on immigrant students: annex b
table b4.1a age-at-arrival profiles of young people from different countries of origin
Country of residence
Country of origin
Africa Britain China France Germany Portugal Turkey Former USSRFormer
Yugoslavia All immigrants
OEC
D Australia 25.9 -5.7 48.5 12.9
Austria -22.1 18.0 22.0 7.5
Belgium 26.2 9.7 24.0 -2.5 9.9
Denmark -9.1 23.7
Estonia 8.4 9.0
Finland 52.6 22.2
Germany 48.9 32.5 36.5 36.0
Greece 6.4 14.7 9.9
Ireland 3.7 21.4
Israel 70.9 41.1 53.4
Luxembourg 54.2 4.3 18.4 60.2 6.9
New Zealand 41.5 15.1 35.0 16.5
Portugal 36.2 16.4
Switzerland 19.9 5.8 27.9 -7.4 34.7 1.9
Part
ners Croatia 6.2 4.2
Hong Kong-China -1.3 -1.5
Kazakhstan 22.6 23.7
Macao-China -7.9 -7.4
Montenegro 4.4 6.0
Russian Federation 9.1 9.6
Serbia 17.9 17.4
Former Yugoslavia -4.3 -1.7
Notes: in 2003 Serbia and Montenegro constituted the Republic of Yugoslavia whereas by 2006 they had separated.
Minimum sample size: 40, estimates based on samples less than 100 are in bold; all estimates control for PISA year (2009 as reference), gender (male as reference) and student’s grade (10th as reference). All immigrants refers to immigrant students of all origins.
Source: PISA pooled data 2003, 2006, 2009. See Heath and Kilpi-Jakonen (2012).
table b4.1bage-at-arrival profiles of young people from different countries of origin in linguistically similar countries of destination
Country of residence
Country of origin
China (Shanghai
557)
New Zealand
(526)Germany
(511)France (505)
Britain (499)
Former USSR
(Russia 464)
Former Yugoslavia
(Serbia 442)
Brazil (416)
Jordan* (HDI 0.681)
Egypt* (HDI
0.620)
South Africa* (HDI
0.597)
Yemen* (HDI 0.439)
All immigrants
Hong Kong (535) -1.3 -1.5
New Zealand (526) 15.1 36.9 16.5
Belgium (519) 9.7 9.9
Australia (515) 15.6 -5.7 11.3 12.9
Switzerland (513) 5.8 19.9 1.9
Estonia (505) 8.4 9.0
Ireland (502) 3.7 21.4
Luxembourg (495) 4.3 6.9
Portugal (492) 9.7 16.4
Greece (489) 14.7 9.9
Austria (482) -22.1 7.5
Macao-China (482) -7.9 -7.4
Notes: *non-test language speakers specifically excluded.
Minimum sample size: 40, estimates based on samples less than 100 are in bold; all estimates control for PISA year (2009 as reference), gender (male as reference) and student’s grade (10th as reference). All immigrants refers to immigrant students of all origins.
Source: PISA pooled data 2003, 2006, 2009, OECD (2010) for country scores, and UNDP’s Human Development Index (HDI) for 2009. See Heath and Kilpi-Jakonen (2012).

178 © OECD 2012 UNtAPPED SKILLS: REALISING tHE POtENtIAL OF IMMIGRANt StUDENtS
annex b: data tables on immigrant students
table b4.2age at arrival effects for different types of immigrants in western countries
Model 1 Model 2 Model 3 Model 4
No interactionsInteraction with immigrant
category Interaction with country Both interactions
Coef. S.E. Sign. Coef. S.E. Sign. Coef. S.E. Sign. Coef. S.E. Sign.
Age at arrival (log transformed) 18.5 (5.3) *** 7.6 (4.5) * 20.9 (4.3) *** 11.8 (7.1)
Sending country (linguistically-similar western country as reference)
Linguistically-dissimilar western country -30.4 (9.9) ** -41.4 (22.7) * -29.3 (11.7) ** -41.5 (62.0)
Linguistically-similar non-western country -23.7 (17.7) -15.7 (18.5) -23.1 (15.7) -10.7 (24.0)
Linguistically-dissimilar non-western country -51.4 (12.2) *** -92.5 (12.0) *** -50.5 (12.9) *** -89.6 (110.2)
Age at arrival interaction with immigrant category
x different, western 7.5 (13.0) 8.0 (14.1)
x similar, non-western -4.2 (10.1) -6.9 (11.6)
x different, non-western 21.7 (8.3) ** 20.8 (9.9) **
Country of destination (Australia as reference)
Austria -40.8 (18.1) ** -44.5 (19.3) ** -39.9 (28.6) -25.1 (25.9)
Belgium -31.4 (10.5) ** -33.3 (10.6) ** -29.4 (15.0) * -36.7 (15.9) **
Czech Republic -31.2 (23.5) -34.2 (22.6) -51.1 (61.3) -54.8 (66.6)
Denmark -13.6 (21.0) -18.1 (22.4) -44.5 (46.7) -21.8 (46.2)
Estonia -9.3 (22.0) -15.7 (23.3) 16.7 (78.6) 39.5 (79.4)
Finland 67.0 (26.6) ** 64.5 (27.2) ** 4.3 (49.1) 23.8 (46.5)
Germany -1.7 (21.8) -5.0 (23.1) -42.4 (30.5) -25.7 (29.1)
Greece -45.8 (14.5) ** -49.0 (15.7) ** -32.1 (33.8) -10.9 (30.3)
Ireland 11.8 (13.3) 12.6 (12.7) 40.1 (27.0) 31.2 (28.5)
Israel -24.7 (12.3) ** -28.2 (13.4) ** -113.0 (37.1) ** -94.5 (35.9) **
Italy -51.2 (13.3) *** -54.0 (12.5) *** -26.9 (27.0) -31.0 (27.7)
Luxembourg -48.9 (15.8) ** -50.6 (16.4) ** -36.6 (18.1) ** -38.5 (17.8) **
Netherlands -9.8 (16.7) -11.8 (17.2) 6.5 (49.1) 14.0 (49.9)
New Zealand -16.8 (7.2) ** -16.4 (7.3) ** -11.1 (12.5) -13.1 (12.5)
Portugal -24.6 (19.0) -26.0 (20.0) -6.9 (22.0) -22.0 (23.0)
Switzerland -25.2 (17.4) -29.2 (18.5) 13.0 (16.5) 15.0 (16.0)
United Kingdom -29.1 (13.7) ** -27.9 (13.8) ** -59.5 (32.0) * -58.3 (32.9) *
Age at arrival interaction with country of destination
x Austria -1.3 (10.0) -9.6 (10.2)
x Belgium -1.5 (6.8) 1.9 (6.7)
x Czech Republic 10.0 (26.2) 10.7 (30.0)
x Denmark 12.2 (20.5) 0.5 (21.4)
x Estonia -11.4 (32.7) -23.1 (33.6)
x Finland 28.8 (20.2) 18.4 (20.3)
x Germany 17.0 (11.7) 8.1 (13.4)
x Greece -6.9 (12.2) -18.0 (11.1)
x Ireland -15.6 (11.6) -10.1 (12.1)
x Israel 37.5 (15.2) ** 27.6 (15.2) *
x Italy -14.0 (12.7) -12.8 (14.5)
x Luxembourg -6.5 (7.0) -6.4 (10.0)
x Netherlands -8.1 (21.0) -12.3 (22.5)
x New Zealand -3.2 (7.7) -1.6 (7.9)
x Portugal -11.0 (9.8) -2.2 (14.2)
x Switzerland -17.8 (7.9) ** -20.4 (9.6) **
x United Kingdom 16.8 (13.8) 17.0 (14.3)
Notes: *p<0.10, **p<0.05, ***p<0.001
All countries have equal weight in these analyses; all estimates control for PISA year (2009 as reference), gender (male as reference) and student’s grade (10th as reference).
Source: PISA pooled data 2003, 2006, 2009. See Heath and Kilpi-Jakonen (2012).

179Untapped SkillS: RealiSing the potential of immigRant StUdentS © OECD 2012
data tables on immigrant students: annex b
table b4.3estimated Pisa scores of immigrants who arrived at or before age 5 and other groups’ score differences compared to early arrivals by country of destination
PISA reading score of first-generation students who arrived at or before age 5
Performance difference between first-generation students who arrived at or before age 5 and…
First-generation students who arrived at ages 6-11
First-generation students who arrived at ages 12 and above
Second-generation students Non-immigrant students
Mean score S.E. Sign. Coef. S.E. Sign. Coef. S.E. Sign. Coef. S.E. Sign. Coef. S.E. Sign.
OEC
D Australia 507 (5.3) *** -6.7 (5.0) -24.1 (5.0) *** -4.1 (3.8) -7.4 (4.5) *
Austria 430 (6.4) *** 4.0 (10.5) -20.6 (13.0) -8.0 (7.9) 46.2 (5.0) ***
Belgium 526 (6.0) *** 0.1 (7.7) -20.1 (7.8) ** -26.9 (5.7) *** 19.4 (5.5) ***
Canada 516 (3.8) *** -2.5 (4.8) -27.4 (5.7) *** 1.7 (3.7) 5.5 (3.7)
Chile m m m m m m m m m m
Czech Republic 492 (15.5) *** 11.2 (18.3) -78.8 (30.7) ** -50.8 (19.2) ** -10.4 (14.7)
Denmark 504 (10.2) *** -19.5 (9.3) ** -33.0 (21.9) -18.2 (7.6) ** 41.3 (6.3) ***
Estonia m m m m m m m m m m
Finland 486 (22.9) *** -13.0 (16.7) -20.2 (14.5) 8.0 (14.5) 50.5 (9.7) ***
France 500 (9.0) *** -2.5 (13.3) -5.9 (13.6) -6.3 (8.6) 30.7 (8.1) ***
Germany 501 (6.1) *** 6.4 (8.0) -65.8 (17.1) *** -17.6 (6.1) ** 43.1 (5.6) ***
Greece 456 (6.2) *** 28.3 (9.8) ** -35.4 (16.1) ** -2.4 (9.3) 13.1 (5.4) **
Hungary 525 (8.6) *** -11.8 (17.8) -13.9 (14.7) -3.8 (12.1) -10.9 (8.1)
Iceland 414 (15.6) *** -5.6 (18.4) -103.0 (24.2) *** 52.2 (25.3) ** 63.7 (15.3) ***
Ireland 515 (11.2) *** 3.5 (12.1) -32.5 (10.5) ** -9.9 (12.2) 2.5 (11.1)
Israel 487 (7.9) *** -21.1 (9.8) ** -91.7 (18.6) *** -16.8 (7.2) ** -18.9 (7.0) **
Italy 464 (6.8) *** 18.9 (9.0) ** -4.1 (9.5) 7.3 (9.5) 21.4 (6.3) **
Japan m m m m m m m m m m
Korea m m m m m m m m m m
Luxembourg 486 (3.4) *** -3.6 (5.5) -13.2 (6.6) ** -2.4 (3.7) 45.2 (3.6) ***
Mexico 363 (11.6) *** 32.9 (21.0) 38.4 (33.1) 20.9 (16.7) 82.6 (11.0) ***
Netherlands 510 (9.4) *** -21.8 (10.8) ** -9.5 (22.4) -19.5 (7.8) ** 22.3 (7.2) **
New Zealand 449 (7.1) *** 1.7 (6.9) -21.8 (8.0) ** -16.1 (7.2) ** 4.1 (6.5)
Norway 440 (9.3) *** -19.9 (12.9) -40.8 (16.7) ** -1.9 (11.1) 45.2 (9.2) ***
Poland m m m m m m m m m m
Portugal 509 (9.7) *** 18.6 (10.3) * -17.7 (11.2) 14.8 (9.7) 17.7 (9.1) *
Slovak Republic m m m m m m m m m m
Slovenia 443 (6.7) *** -24.8 (16.4) -75.2 (18.1) *** -16.3 (7.4) ** 18.9 (6.6) **
Spain 478 (7.0) *** 15.0 (6.9) ** -6.4 (7.6) 15.1 (10.3) 30.3 (6.7) ***
Sweden 482 (12.1) *** -6.5 (11.2) -47.3 (16.6) ** 23.5 (6.3) *** 62.1 (6.3) ***
Switzerland 471 (6.5) *** -6.8 (5.8) -2.4 (10.6) 22.3 (4.2) *** 67.4 (4.0) ***
turkey m m m m m m m m m m
United Kingdom 426 (12.1) *** 17.5 (12.1) -18.4 (12.3) 32.8 (11.4) ** 37.7 (11.4) **
United States 473 (8.0) *** -7.8 (9.9) -33.6 (13.9) ** -1.7 (7.1) 23.8 (6.5) ***
OECD average 468 (1.7) *** 1.1 (1.9) -20.3 (2.2) *** 1.7 (1.4) 25.1 (1.4) ***
Part
ners Croatia 459 (6.2) *** 7.4 (7.7) -10.6 (15.2) 3.9 (6.3) 19.7 (5.2) ***
Dubai (UAE) 487 (4.0) *** 7.4 (4.9) 18.7 (5.8) ** -39.5 (4.7) *** -105.4 (4.0) ***
Hong Kong-China 547 (4.7) *** 12.1 (4.8) ** 1.5 (5.9) -6.8 (3.8) * -14.5 (3.9) ***
Kazakhstan 355 (23.3) *** 1.2 (21.3) -28.5 (24.1) 33.9 (23.5) 7.5 (22.1)
Jordan 417 (6.6) *** 5.7 (10.8) 0.0 (9.5) -12.0 (6.3) * -30.3 (5.5) ***
Macao-China 528 (5.8) *** 13.4 (6.5) ** 14.7 (6.5) ** -14.2 (5.6) ** -18.3 (5.6) **
Montenegro 426 (9.0) *** -7.0 (12.2) -10.1 (16.5) 0.7 (11.5) -18.8 (8.1) **
Qatar 406 (3.3) *** 29.3 (5.2) *** 52.0 (4.7) *** -46.9 (3.5) *** -97.9 (3.4) ***
Russian Federation 466 (6.8) *** -6.8 (9.8) -18.1 (11.0) -4.4 (7.7) 8.7 (5.7)
Serbia 483 (9.2) *** -8.1 (14.0) -33.7 (19.2) * 7.2 (7.2) -11.2 (5.3) **
Singapore 544 (8.4) *** 13.7 (12.3) 0.8 (10.7) -3.8 (9.7) -23.7 (8.3) **
Former Yugoslavia 460 (14.6) *** -5.1 (13.2) -1.1 (33.1) -24.5 (11.8) ** -22.9 (10.4) **
Notes: Significance*p<0.10, **p<0.05, ***p<0.001.
Only countries with a sample of at least 100 immigrant students included; all estimates control for PISA year (2009 as reference), gender (male as reference) and student’s grade (10th as reference).
Source: PISA pooled data 2003, 2006, 2009. See Heath and Kilpi-Jakonen (2012).

180 © OECD 2012 UNtAPPED SKILLS: REALISING tHE POtENtIAL OF IMMIGRANt StUDENtS
annex b: data tables on immigrant students
table b4.4
estimated Pisa scores of immigrants who arrived at or before age 5 and other groups’ score differences compared to early arrivals by country of destination before and after controls for parental education and socio-economic status
PISA reading score of those who arrived at or before age 5
Difference compared to early arrivals
Arrival ages 6-11 Arrival ages 12 and above
Before controls After controls Before controls After controls Before controls After controls
Mean score S.E. Sign.
Mean score S.E. Sign.
Score dif. S.E. Sign.
Score dif. S.E. Sign.
Score dif. S.E. Sign.
Score dif. S.E. Sign.
OEC
D Australia 515 (5.1) *** 518 (5.0) *** -4.6 (5.0) -7.1 (4.5) -24.1 (4.7) *** -29.2 (4.4) ***
Austria 434 (6.3) *** 468 (6.4) *** 2.1 (11.2) -1.9 (10.4) -17.0 (13.7) -23.0 (11.0) **
Belgium 533 (6.8) *** 534 (6.5) *** 2.3 (8.6) -1.8 (8.1) -23.2 (7.5) ** -26.9 (7.2) ***
Canada 522 (3.8) *** 520 (3.8) *** -3.7 (4.9) -7.5 (4.9) -29.6 (6.2) *** -35.6 (6.0) ***
Czech Republic 496 (14.8) *** 506 (12.3) *** 9.5 (18.0) 0.2 (15.6) -77.7 (32.1) ** -72.1 (25.5) **
Denmark 506 (11.1) *** 508 (11.1) *** -15.5 (11.0) -15.8 (10.2) -32.1 (21.5) -38.1 (20.9) *
Finland 487 (24.2) *** 478 (23.7) *** -11.2 (17.5) -19.4 (16.5) -19.2 (16.7) -40.8 (16.5) **
France 507 (9.8) *** 521 (8.7) *** -4.2 (13.6) -11.7 (13.0) 2.5 (14.3) -12.9 (12.9)
Germany 507 (6.7) *** 522 (6.4) *** 7.6 (9.2) 2.3 (9.5) -50.9 (15.4) *** -69.5 (14.1) ***
Greece 458 (6.2) *** 475 (6.0) *** 26.7 (9.9) ** 18.7 (9.7) * -32.4 (16.5) ** -46.0 (16.0) **
Hungary 524 (8.8) *** 541 (10.2) *** -12.1 (18.1) -8.0 (17.9) -13.7 (15.3) -10.4 (15.6)
Iceland 417 (16.2) *** 433 (17.4) *** -7.8 (18.8) -8.1 (19.7) -104.6 (24.0) *** -102.7 (25.2) ***
Ireland 515 (11.4) *** 507 (10.0) *** 5.8 (12.6) 3.6 (11.1) -20.4 (12.9) -20.1 (12.5)
Israel 502 (7.9) *** 508 (7.5) *** -24.8 (10.6) ** -18.8 (10.6) * -97.6 (20.0) *** -87.1 (18.6) ***
Italy 467 (7.1) *** 481 (6.7) *** 16.8 (9.4) * 13.3 (9.7) -6.9 (9.9) -15.7 (9.3) *
Luxembourg 491 (3.6) *** 495 (3.9) *** -3.3 (5.4) -6.7 (4.7) -11.2 (6.8) * -19.7 (6.3) **
Mexico 366 (12.3) *** 383 (12.6) *** 49.1 (17.8) ** 45.1 (16.6) ** 36.8 (36.3) 16.7 (32.7)
Netherlands 516 (10.4) *** 522 (10.0) *** -17.8 (13.0) -15.2 (13.3) -2.6 (26.5) -15.6 (24.7)
New Zealand 464 (7.2) *** 464 (6.4) *** -3.1 (6.8) -4.3 (6.1) -30.3 (7.4) *** -29.4 (6.9) ***
Norway 456 (8.5) *** 456 (8.7) *** -25.6 (11.8) ** -31.3 (10.6) ** -44.8 (16.5) ** -56.0 (16.1) ***
Portugal 511 (9.5) *** 511 (10.1) *** 19.3 (9.9) * 18.2 (9.8) * -14.2 (10.9) -14.0 (10.8)
Slovenia 447 (6.8) *** 467 (7.6) *** -20.0 (16.8) -10.9 (14.6) -74.6 (19.3) *** -53.4 (19.2) **
Spain 486 (6.8) *** 489 (7.2) *** 7.9 (7.2) 8.3 (7.5) -10.4 (7.4) -10.6 (7.5)
Sweden 485 (12.0) *** 481 (9.4) *** 12.0 (11.6) 3.6 (10.9) -20.3 (17.5) -29.2 (15.9) *
Switzerland 473 (6.7) *** 491 (6.3) *** -4.5 (5.9) -10.0 (5.3) * 0.6 (11.1) -14.6 (10.4)
United Kingdom 456 (12.3) *** 461 (10.4) *** 3.9 (13.5) 6.6 (12.4) -27.2 (13.6) ** -25.5 (13.0) *
United States 478 (7.6) *** 501 (7.7) *** -9.3 (9.9) -6.6 (9.0) -31.6 (15.7) ** -44.0 (14.2) **
OECD average 474 (1.7) *** 488 (1.4) *** 1.5 (2.0) -4.4 (1.8) ** -18.5 (2.2) *** -28.8 (2.0) ***
Part
ners Croatia 459 (6.2) *** 483 (6.4) *** 9.9 (7.7) 4.3 (7.1) -7.6 (16.6) -18.8 (16.5)
Dubai (UAE) 487 (4.1) *** 479 (4.3) *** 7.9 (4.9) 6.8 (4.8) 18.5 (5.9) ** 16.3 (5.7) **
Hong Kong-China 548 (4.7) *** 564 (4.9) *** 10.8 (4.6) ** 12.8 (4.5) ** 3.0 (5.6) 2.2 (5.6)
Jordan 421 (6.5) *** 427 (6.4) *** 7.8 (11.0) -1.2 (10.0) -2.5 (9.9) -14.0 (10.1)
Kazakhstan 353 (24.5) *** 356 (22.6) *** 2.1 (22.9) -0.1 (20.8) -19.2 (24.9) -20.4 (24.1)
Macao-China 528 (6.0) *** 525 (7.2) *** 13.3 (6.8) ** 13.7 (6.8) ** 15.2 (6.3) ** 15.8 (6.3) **
Montenegro 430 (9.4) *** 421 (9.1) *** 1.4 (12.3) 5.6 (12.3) -15.1 (16.3) -2.8 (16.9)
Qatar 417 (3.5) *** 411 (3.6) *** 29.1 (5.4) *** 25.3 (5.4) *** 53.6 (4.7) *** 47.8 (4.7) ***
Russian Federation 466 (6.9) *** 465 (7.2) *** -6.1 (9.9) -8.7 (10.0) -19.7 (11.0) * -25.5 (11.5) **
Serbia 484 (9.4) *** 478 (8.5) *** -2.5 (13.7) -0.6 (12.6) -34.9 (19.2) * -43.6 (18.1) **
Singapore 547 (8.5) *** 551 (8.5) *** 10.3 (12.5) 6.3 (12.6) 0.7 (10.4) -7.5 (10.7)
Former Yugoslavia 460 (14.9) *** 449 (14.3) *** -4.2 (13.9) 12.3 (13.4) -7.9 (32.6) -13.6 (32.6)
Notes: *p<0.10, **p<0.05, ***p<0.001.
Only countries with a sample of at least 100 immigrant students included; all estimates control for PISA year (2009 as reference), gender (male as reference) and student’s grade (10th as reference); after controls models also include parental education (highest education, ISCED Levels 5A and 6 as reference) and highest parental ISEI score (standardised); number of observations is constant within countries, those with missing data for parents’ education and socio-economic status excluded from all models.
Source: PISA pooled data 2003, 2006, 2009. See Heath and Kilpi-Jakonen (2012).
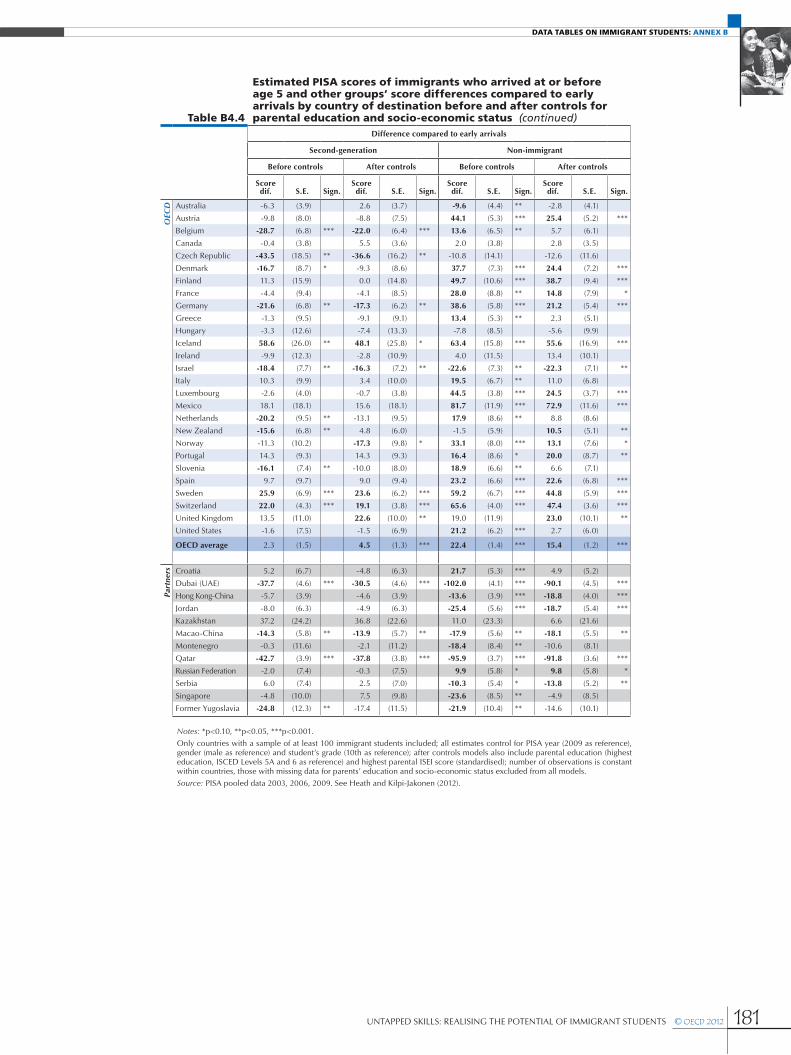
181Untapped SkillS: RealiSing the potential of immigRant StUdentS © OECD 2012
data tables on immigrant students: annex b
table b4.4
estimated Pisa scores of immigrants who arrived at or before age 5 and other groups’ score differences compared to early arrivals by country of destination before and after controls for parental education and socio-economic status (continued)
Difference compared to early arrivals
Second-generation Non-immigrant
Before controls After controls Before controls After controls
Score dif. S.E. Sign.
Score dif. S.E. Sign.
Score dif. S.E. Sign.
Score dif. S.E. Sign.
OEC
D Australia -6.3 (3.9) 2.6 (3.7) -9.6 (4.4) ** -2.8 (4.1)
Austria -9.8 (8.0) -8.8 (7.5) 44.1 (5.3) *** 25.4 (5.2) ***
Belgium -28.7 (6.8) *** -22.0 (6.4) *** 13.6 (6.5) ** 5.7 (6.1)
Canada -0.4 (3.8) 5.5 (3.6) 2.0 (3.8) 2.8 (3.5)
Czech Republic -43.5 (18.5) ** -36.6 (16.2) ** -10.8 (14.1) -12.6 (11.6)
Denmark -16.7 (8.7) * -9.3 (8.6) 37.7 (7.3) *** 24.4 (7.2) ***
Finland 11.3 (15.9) 0.0 (14.8) 49.7 (10.6) *** 38.7 (9.4) ***
France -4.4 (9.4) -4.1 (8.5) 28.0 (8.8) ** 14.8 (7.9) *
Germany -21.6 (6.8) ** -17.3 (6.2) ** 38.6 (5.8) *** 21.2 (5.4) ***
Greece -1.3 (9.5) -9.1 (9.1) 13.4 (5.3) ** 2.3 (5.1)
Hungary -3.3 (12.6) -7.4 (13.3) -7.8 (8.5) -5.6 (9.9)
Iceland 58.6 (26.0) ** 48.1 (25.8) * 63.4 (15.8) *** 55.6 (16.9) ***
Ireland -9.9 (12.3) -2.8 (10.9) 4.0 (11.5) 13.4 (10.1)
Israel -18.4 (7.7) ** -16.3 (7.2) ** -22.6 (7.3) ** -22.3 (7.1) **
Italy 10.3 (9.9) 3.4 (10.0) 19.5 (6.7) ** 11.0 (6.8)
Luxembourg -2.6 (4.0) -0.7 (3.8) 44.5 (3.8) *** 24.5 (3.7) ***
Mexico 18.1 (18.1) 15.6 (18.1) 81.7 (11.9) *** 72.9 (11.6) ***
Netherlands -20.2 (9.5) ** -13.1 (9.5) 17.9 (8.6) ** 8.8 (8.6)
New Zealand -15.6 (6.8) ** 4.8 (6.0) -1.5 (5.9) 10.5 (5.1) **
Norway -11.3 (10.2) -17.3 (9.8) * 33.1 (8.0) *** 13.1 (7.6) *
Portugal 14.3 (9.3) 14.3 (9.3) 16.4 (8.6) * 20.0 (8.7) **
Slovenia -16.1 (7.4) ** -10.0 (8.0) 18.9 (6.6) ** 6.6 (7.1)
Spain 9.7 (9.7) 9.0 (9.4) 23.2 (6.6) *** 22.6 (6.8) ***
Sweden 25.9 (6.9) *** 23.6 (6.2) *** 59.2 (6.7) *** 44.8 (5.9) ***
Switzerland 22.0 (4.3) *** 19.1 (3.8) *** 65.6 (4.0) *** 47.4 (3.6) ***
United Kingdom 13.5 (11.0) 22.6 (10.0) ** 19.0 (11.9) 23.0 (10.1) **
United States -1.6 (7.5) -1.5 (6.9) 21.2 (6.2) *** 2.7 (6.0)
OECD average 2.3 (1.5) 4.5 (1.3) *** 22.4 (1.4) *** 15.4 (1.2) ***
Part
ners Croatia 5.2 (6.7) -4.8 (6.3) 21.7 (5.3) *** 4.9 (5.2)
Dubai (UAE) -37.7 (4.6) *** -30.5 (4.6) *** -102.0 (4.1) *** -90.1 (4.5) ***
Hong Kong-China -5.7 (3.9) -4.6 (3.9) -13.6 (3.9) *** -18.8 (4.0) ***
Jordan -8.0 (6.3) -4.9 (6.3) -25.4 (5.6) *** -18.7 (5.4) ***
Kazakhstan 37.2 (24.2) 36.8 (22.6) 11.0 (23.3) 6.6 (21.6)
Macao-China -14.3 (5.8) ** -13.9 (5.7) ** -17.9 (5.6) ** -18.1 (5.5) **
Montenegro -0.3 (11.6) -2.1 (11.2) -18.4 (8.4) ** -10.6 (8.1)
Qatar -42.7 (3.9) *** -37.8 (3.8) *** -95.9 (3.7) *** -91.8 (3.6) ***
Russian Federation -2.0 (7.4) -0.3 (7.5) 9.9 (5.8) * 9.8 (5.8) *
Serbia 6.0 (7.4) 2.5 (7.0) -10.3 (5.4) * -13.8 (5.2) **
Singapore -4.8 (10.0) 7.5 (9.8) -23.6 (8.5) ** -4.9 (8.5)
Former Yugoslavia -24.8 (12.3) ** -17.4 (11.5) -21.9 (10.4) ** -14.6 (10.1)
Notes: *p<0.10, **p<0.05, ***p<0.001.
Only countries with a sample of at least 100 immigrant students included; all estimates control for PISA year (2009 as reference), gender (male as reference) and student’s grade (10th as reference); after controls models also include parental education (highest education, ISCED Levels 5A and 6 as reference) and highest parental ISEI score (standardised); number of observations is constant within countries, those with missing data for parents’ education and socio-economic status excluded from all models.
Source: PISA pooled data 2003, 2006, 2009. See Heath and Kilpi-Jakonen (2012).

182 © OECD 2012 UNTAPPED SKILLS: REALISING THE POTENTIAL OF IMMIGRANT STUDENTS
ANNEX B: DATA TABLES ON IMMIGRANT STUDENTS
Table B5.1aPrevalence and average reading performance across mother’s education, by immigrant statusResults based on students’ self-reports
Percentage of students in each category
Distribution of educational attainment of mother
At best primary Lower secondary
Non-immigrant studentsSecond-generation
students First-generation students Non-immigrant studentsSecond-generation
students First-generation students
% S.E. % S.E. % S.E. % S.E. % S.E. % S.E.
OEC
D Australia 0.3 (0.1) 4.4 (0.8) 2.7 (0.6) 4.4 (0.3) 5.7 (0.8) 3.3 (0.7)Austria 0.6 (0.2) 9.2 (1.5) 17.8 (3.2) 4.8 (0.4) 22.5 (1.9) 16.3 (3.5)Belgium 2.5 (0.2) 22.7 (2.4) 13.9 (2.1) 4.6 (0.3) 10.6 (1.5) 8.1 (1.5)Canada 0.5 (0.1) 6.1 (1.0) 4.4 (0.8) 4.9 (0.2) 6.4 (0.8) 3.4 (0.6)Chile 11.2 (0.7) c c c c 22.8 (1.0) c c c cCzech Republic 0.3 (0.1) 3.8 (3.2) 1.3 (1.0) 2.8 (0.3) 10.8 (4.2) 8.7 (5.6)Denmark 0.3 (0.1) 19.9 (1.9) 16.2 (2.6) 9.6 (0.7) 21.2 (1.8) 14.6 (2.7)Estonia 0.2 (0.1) 0.0 (0.0) 0.0 (0.0) 4.8 (0.4) 5.9 (1.8) 6.1 (3.8)Finland 3.2 (0.3) 4.3 (2.6) 17.4 (4.7) 4.9 (0.4) 12.8 (4.5) 6.5 (3.4)France 0.9 (0.2) 18.1 (2.0) 11.6 (3.6) 14.1 (0.7) 31.2 (2.7) 31.0 (4.4)Germany 1.2 (0.2) 20.7 (2.1) 8.9 (2.1) 15.0 (0.9) 18.2 (1.6) 23.8 (3.6)Greece 8.1 (0.5) 2.4 (1.2) 5.8 (2.6) 13.7 (0.9) 7.2 (1.8) 17.6 (2.4)Hungary 1.0 (0.2) 0.0 (0.0) 0.0 (0.0) 15.0 (0.9) 9.3 (5.5) 12.5 (5.6)Iceland 0.9 (0.2) c c 0.0 (0.0) 22.4 (0.7) c c 25.3 (6.6)Ireland 3.8 (0.4) 3.6 (2.6) 4.6 (1.4) 13.8 (0.8) 20.2 (5.9) 5.3 (1.4)Israel 4.8 (0.4) 8.7 (2.0) 7.8 (1.8) 6.1 (0.5) 5.2 (0.9) 2.5 (1.0)Italy 4.4 (0.2) 10.4 (2.7) 10.9 (1.8) 31.1 (0.4) 29.1 (3.0) 20.0 (1.5)Japan 0.0 (0.0) c c c c 3.2 (0.2) c c c cKorea 2.9 (0.3) c c m m 8.0 (0.6) c c m mLuxembourg 2.7 (0.3) 35.0 (1.6) 26.9 (1.7) 14.6 (0.8) 17.9 (1.3) 14.4 (1.3)Mexico 35.5 (0.8) 57.0 (5.5) 57.9 (3.9) 25.8 (0.4) 16.2 (3.6) 16.5 (2.5)Netherlands 2.3 (0.3) 34.8 (2.7) 34.2 (4.8) 7.6 (0.5) 12.0 (2.3) 7.9 (2.5)New Zealand 2.4 (0.2) 4.5 (1.1) 3.6 (0.7) 11.7 (0.6) 12.8 (2.0) 4.9 (0.8)Norway 0.4 (0.1) 11.3 (2.3) 13.6 (3.4) 3.4 (0.3) 5.1 (1.9) 7.4 (2.0)Poland 0.2 (0.1) m m c c 7.9 (0.6) m m c cPortugal 36.6 (1.2) 30.7 (3.9) 14.5 (2.8) 22.3 (0.7) 23.8 (2.8) 24.4 (4.0)Slovak Republic 0.5 (0.1) c c c c 2.7 (0.3) c c c cSlovenia 0.3 (0.1) 0.7 (0.3) 3.2 (2.1) 9.1 (0.5) 26.4 (2.5) 44.1 (6.1)Spain 15.6 (0.9) 18.4 (3.5) 16.4 (1.9) 25.0 (0.8) 19.4 (3.6) 21.7 (1.8)Sweden 0.9 (0.1) 10.2 (1.9) 19.8 (3.3) 7.3 (0.5) 12.7 (2.0) 8.7 (2.5)Switzerland 0.8 (0.1) 15.3 (2.2) 15.1 (1.6) 14.8 (0.6) 32.1 (1.4) 28.7 (2.1)Turkey 62.8 (1.4) c c c c 17.3 (0.6) c c c cUnited Kingdom 0.9 (0.1) 9.1 (2.7) 12.1 (3.2) 4.7 (0.3) 11.0 (2.4) 9.3 (1.7)United States 0.7 (0.2) 21.6 (2.5) 18.3 (2.5) 4.8 (0.4) 13.1 (1.4) 13.9 (1.6)OECD average 6.2 (0.1) 14.2 (0.5) 12.8 (0.5) 11.3 (0.1) 15.5 (0.5) 14.5 (0.6)
Part
ners Albania 13.4 (1.1) c c c c 25.7 (1.1) c c c c
Argentina 28.0 (1.4) 45.3 (5.0) 35.3 (4.8) 11.3 (0.6) 8.9 (3.3) 7.6 (3.5)Azerbaijan 1.8 (0.3) 0.5 (0.5) 3.5 (3.5) 5.8 (0.5) 10.1 (3.5) 4.8 (3.7)Brazil 33.7 (1.1) 42.4 (13.2) 40.4 (17.8) 21.1 (0.6) 16.4 (12.1) 14.4 (8.8)Bulgaria 1.8 (0.3) c c c c 8.7 (1.0) c c c cColombia 34.9 (1.5) c c c c 16.9 (0.6) c c c cCroatia 0.8 (0.2) 2.3 (0.9) 5.0 (1.7) 12.4 (0.6) 22.6 (2.5) 23.0 (3.6)Dubai (UAE) 20.7 (1.1) 8.2 (0.7) 2.4 (0.3) 13.8 (1.0) 7.4 (0.7) 4.7 (0.4)Hong Kong-China 20.6 (1.2) 35.1 (1.3) 40.5 (2.0) 17.4 (0.9) 26.1 (1.4) 28.5 (2.1)Indonesia 45.1 (2.0) m m c c 19.4 (0.8) m m c cJordan 13.1 (0.7) 10.1 (1.4) 7.4 (2.3) 18.9 (0.7) 15.2 (1.7) 11.3 (2.8)Kazakhstan 0.1 (0.1) 0.7 (0.5) 1.2 (1.0) 2.3 (0.3) 3.1 (1.1) 8.7 (2.7)Kyrgyzstan 0.5 (0.1) 0.0 (0.0) 0.0 (0.0) 1.9 (0.2) 7.9 (4.4) 3.1 (3.6)Latvia 0.2 (0.1) 0.0 (0.0) c c 3.6 (0.5) 1.4 (0.8) c cLiechtenstein 1.0 (0.7) 16.3 (5.8) 21.1 (5.7) 19.1 (2.6) 27.5 (6.9) 23.9 (6.4)Lithuania 0.4 (0.1) 3.3 (1.8) c c 2.1 (0.2) 0.0 (0.0) c cMacao-China 32.2 (1.1) 37.1 (0.8) 27.5 (1.5) 27.7 (1.1) 38.1 (0.8) 37.1 (1.8)Montenegro 1.5 (0.2) 0.0 (0.0) 5.4 (4.3) 11.2 (0.9) 9.1 (4.6) 6.3 (1.8)Panama 24.6 (1.9) 17.3 (4.9) 25.0 (5.0) 8.8 (0.6) 14.9 (4.6) 14.2 (6.6)Peru 33.1 (1.5) c c c c 10.4 (0.5) c c c cQatar 17.6 (0.4) 18.8 (0.9) 6.5 (0.5) 6.3 (0.4) 5.9 (0.6) 4.2 (0.5)Romania 4.1 (0.5) c c c c 7.8 (0.5) c c c cRussian Federation 0.1 (0.1) 1.9 (1.4) 0.4 (0.5) 2.6 (0.3) 6.0 (3.6) 5.4 (1.9)Serbia 1.3 (0.3) 0.5 (0.6) 1.1 (0.8) 10.1 (0.6) 10.8 (2.9) 7.6 (1.7)Shanghai-China 8.6 (0.7) c c c c 29.1 (1.2) c c c cSingapore 17.0 (0.6) 17.9 (2.3) 8.0 (1.2) 5.9 (0.4) 8.3 (1.9) 5.0 (1.0)Chinese Taipei 7.7 (0.4) c c c c 18.7 (0.7) c c c cThailand 56.8 (1.2) m m m m 11.3 (0.6) m m m mTrinidad and Tobago 15.5 (0.7) 22.4 (6.1) 6.9 (3.8) 7.8 (0.4) 6.9 (3.9) 11.1 (4.1)Tunisia 51.8 (1.7) c c c c 15.0 (0.7) c c c cUruguay 31.5 (0.9) c c c c 28.3 (0.8) c c c c
Note: At best primary is defined as MISCED = 0 or 1; Lower secondary is defined as MISCED = 2 , Upper secondary is defined as MISCED = 3 or 4 and Tertiary is defined as MISCED = 5 or 6.
Source: PISA 2009 Database.
Please refer to the Reader’s Guide for information concerning the symbols replacing missing data.
[Part 1/4]

183UNTAPPED SKILLS: REALISING THE POTENTIAL OF IMMIGRANT STUDENTS © OECD 2012
DATA TABLES ON IMMIGRANT STUDENTS: ANNEX B
Table B5.1aPrevalence and average reading performance across mother’s education, by immigrant status (cont.)Results based on students’ self-reports
Percentage of students in each category
Distribution of educational attainment of mother
Upper secondary Tertiary
Non-immigrant studentsSecond-generation
students First-generation students Non-immigrant studentsSecond-generation
students First-generation students
% S.E. % S.E. % S.E. % S.E. % S.E. % S.E.
OEC
D Australia 53.7 (0.7) 48.1 (2.0) 40.6 (1.4) 41.5 (0.7) 41.9 (2.2) 53.5 (1.3)Austria 69.1 (0.8) 49.9 (2.8) 43.9 (3.9) 25.5 (0.8) 18.4 (2.0) 22.0 (3.3)Belgium 38.3 (0.8) 30.2 (2.3) 32.8 (2.4) 54.6 (0.8) 36.6 (3.1) 45.2 (2.5)Canada 33.5 (0.5) 32.0 (1.5) 22.2 (1.5) 61.1 (0.5) 55.5 (2.0) 70.0 (1.9)Chile 42.7 (1.0) c c c c 23.3 (0.9) c c c cCzech Republic 75.8 (0.6) 63.5 (6.3) 58.7 (8.8) 21.1 (0.6) 22.0 (4.9) 31.2 (7.9)Denmark 33.0 (0.8) 23.4 (1.8) 27.9 (3.1) 57.2 (1.0) 35.5 (2.5) 41.3 (3.6)Estonia 48.6 (1.0) 43.5 (3.4) 37.9 (10.0) 46.4 (1.0) 50.6 (3.7) 56.0 (11.5)Finland 19.8 (0.7) 20.9 (6.1) 11.7 (4.1) 72.1 (0.8) 62.0 (8.3) 64.4 (5.9)France 42.0 (1.1) 25.3 (2.1) 23.3 (3.7) 43.0 (1.4) 25.3 (2.3) 34.1 (6.2)Germany 58.4 (1.1) 36.9 (2.4) 32.0 (3.4) 25.4 (1.1) 24.3 (2.2) 35.4 (2.9)Greece 41.4 (0.8) 51.2 (5.1) 49.6 (4.0) 36.8 (1.2) 39.2 (5.0) 27.0 (3.9)Hungary 52.8 (1.1) 59.2 (7.7) 54.1 (7.9) 31.2 (1.1) 31.5 (7.5) 33.4 (7.6)Iceland 33.0 (0.7) c c 38.8 (6.0) 43.8 (0.9) c c 35.9 (5.9)Ireland 44.5 (1.0) 45.1 (7.1) 29.7 (2.3) 37.9 (1.0) 31.1 (6.0) 60.4 (2.8)Israel 44.3 (1.1) 36.2 (2.0) 34.8 (3.2) 44.8 (1.1) 50.0 (2.4) 54.9 (4.0)Italy 40.1 (0.4) 30.8 (3.0) 42.8 (2.1) 24.4 (0.4) 29.6 (3.8) 26.4 (2.1)Japan 49.1 (0.9) c c c c 47.7 (0.9) c c c cKorea 56.0 (1.1) c c m m 33.1 (1.3) c c m mLuxembourg 40.1 (1.0) 25.4 (1.5) 20.3 (1.7) 42.7 (1.0) 21.7 (1.2) 38.4 (1.6)Mexico 12.6 (0.4) 7.9 (2.8) 4.6 (1.0) 26.1 (0.7) 18.9 (5.1) 21.1 (3.4)Netherlands 48.9 (1.1) 29.7 (2.3) 21.7 (3.4) 41.3 (1.2) 23.6 (3.4) 36.2 (4.7)New Zealand 48.8 (1.0) 43.9 (3.2) 32.1 (2.0) 37.2 (1.0) 38.9 (2.6) 59.5 (2.1)Norway 35.9 (0.8) 36.5 (3.4) 32.2 (3.9) 60.3 (0.9) 47.1 (4.2) 46.7 (4.2)Poland 73.4 (1.0) m m c c 18.5 (1.0) m m c cPortugal 20.7 (0.7) 20.9 (3.2) 25.2 (3.5) 20.5 (1.1) 24.7 (3.1) 36.0 (4.3)Slovak Republic 76.3 (0.8) c c c c 20.5 (0.8) c c c cSlovenia 57.1 (0.7) 58.9 (2.9) 30.5 (5.3) 33.6 (0.8) 14.0 (2.2) 22.2 (4.9)Spain 27.1 (0.6) 31.1 (4.7) 29.5 (1.5) 32.3 (1.2) 31.2 (5.5) 32.5 (2.2)Sweden 28.4 (0.8) 21.9 (2.7) 23.0 (3.6) 63.4 (0.9) 55.1 (3.1) 48.5 (3.9)Switzerland 47.0 (1.1) 23.4 (1.5) 20.5 (1.9) 37.4 (0.9) 29.2 (1.9) 35.7 (3.5)Turkey 12.7 (0.7) c c c c 7.2 (0.8) c c c cUnited Kingdom 48.4 (0.8) 36.6 (3.2) 27.9 (2.9) 46.1 (0.8) 43.3 (3.0) 50.7 (4.5)United States 42.3 (1.3) 36.7 (2.1) 32.8 (2.9) 52.2 (1.5) 28.7 (2.6) 35.0 (3.6)OECD average 44.0 (0.2) 35.9 (0.7) 31.5 (0.8) 38.5 (0.2) 34.4 (0.8) 41.2 (0.9)
Part
ners Albania 38.6 (1.3) c c c c 22.4 (1.2) c c c c
Argentina 18.1 (0.7) 26.0 (4.4) 12.0 (3.6) 42.6 (1.4) 19.8 (4.6) 45.1 (5.1)Azerbaijan 43.5 (1.5) 47.0 (8.2) 34.8 (10.0) 49.0 (1.5) 42.5 (9.2) 56.9 (10.2)Brazil 23.9 (0.8) 9.5 (5.6) 14.1 (9.4) 21.3 (0.6) 31.7 (9.3) 31.0 (16.8)Bulgaria 54.7 (1.5) c c c c 34.8 (1.6) c c c cColombia 14.4 (0.7) c c c c 33.8 (1.3) c c c cCroatia 53.0 (1.0) 48.4 (3.2) 49.8 (3.5) 33.8 (1.1) 26.8 (2.6) 22.3 (2.9)Dubai (UAE) 33.0 (1.3) 30.6 (1.5) 24.0 (1.1) 32.5 (1.1) 53.8 (1.5) 69.0 (1.2)Hong Kong-China 49.2 (1.2) 34.3 (1.4) 25.4 (1.6) 12.9 (1.1) 4.5 (0.6) 5.5 (1.1)Indonesia 24.5 (1.4) m m c c 11.0 (1.1) m m c cJordan 33.6 (0.9) 34.7 (2.5) 21.4 (3.0) 34.4 (1.1) 39.9 (2.6) 60.0 (4.3)Kazakhstan 20.9 (0.9) 21.8 (2.3) 19.8 (2.3) 76.8 (1.0) 74.4 (3.1) 70.4 (3.7)Kyrgyzstan 34.8 (0.9) 30.0 (7.4) 32.7 (8.5) 62.9 (1.0) 62.2 (8.7) 64.2 (9.4)Latvia 48.1 (1.2) 49.2 (5.4) c c 48.1 (1.3) 49.4 (5.4) c cLiechtenstein 46.1 (3.2) 33.0 (7.6) 27.4 (7.7) 33.9 (3.0) 23.2 (6.1) 27.6 (7.1)Lithuania 48.2 (0.8) 47.9 (6.7) c c 49.2 (0.9) 48.8 (6.2) c cMacao-China 25.9 (1.1) 19.9 (0.8) 24.9 (1.5) 14.3 (0.9) 4.9 (0.4) 10.5 (1.0)Montenegro 67.4 (1.2) 63.4 (6.2) 61.1 (4.0) 19.9 (0.6) 27.5 (5.4) 27.2 (3.8)Panama 15.4 (1.0) 29.0 (10.4) 9.4 (5.0) 51.3 (2.0) 38.8 (10.6) 51.4 (5.2)Peru 37.8 (1.1) c c c c 18.8 (1.1) c c c cQatar 29.6 (0.7) 31.8 (1.2) 27.0 (0.9) 46.5 (0.7) 43.5 (1.4) 62.3 (1.0)Romania 55.4 (1.0) c c c c 32.7 (1.2) c c c cRussian Federation 13.8 (0.6) 15.5 (2.1) 20.9 (2.9) 83.6 (0.7) 76.7 (5.4) 73.3 (3.7)Serbia 48.1 (0.9) 42.2 (3.9) 52.9 (3.4) 40.5 (0.8) 46.6 (3.8) 38.4 (3.4)Shanghai-China 30.4 (0.8) c c c c 32.0 (1.1) c c c cSingapore 51.4 (0.8) 42.6 (3.1) 30.0 (2.1) 25.7 (0.7) 31.1 (3.2) 57.1 (2.2)Chinese Taipei 32.3 (0.7) c c c c 41.3 (0.9) c c c cThailand 19.6 (0.7) m m m m 12.3 (1.1) m m m mTrinidad and Tobago 52.8 (1.0) 38.5 (7.9) 34.7 (6.5) 23.8 (0.8) 32.2 (7.4) 47.3 (6.8)Tunisia 22.4 (1.1) c c c c 10.7 (0.9) c c c cUruguay 17.0 (0.6) c c c c 23.1 (0.7) c c c c
Note: At best primary is defined as MISCED = 0 or 1; Lower secondary is defined as MISCED = 2 , Upper secondary is defined as MISCED = 3 or 4 and Tertiary is defined as MISCED = 5 or 6.
Source: PISA 2009 Database.
Please refer to the Reader’s Guide for information concerning the symbols replacing missing data.
[Part 2/4]

184 © OECD 2012 UNTAPPED SKILLS: REALISING THE POTENTIAL OF IMMIGRANT STUDENTS
ANNEX B: DATA TABLES ON IMMIGRANT STUDENTS
Table B5.1aPrevalence and average reading performance across mother’s education, by immigrant status (cont.)Results based on students’ self-reports
Student performance on the reading scale
Distribution of educational attainment of mother
At best primary Lower secondary
Non-immigrant studentsSecond-generation
students First-generation students Non-immigrant studentsSecond-generation
students First-generation students
Mean score S.E. Mean score S.E. Mean score S.E. Mean score S.E. Mean score S.E. Mean score S.E.
OEC
D Australia 453 (15.5) 497 (15.3) 450 (16.8) 468 (5.0) 511 (11.7) 450 (14.5)Austria c c 382 (11.3) 347 (16.4) 431 (9.1) 414 (11.1) 358 (15.5)Belgium 461 (9.0) 432 (12.9) 413 (11.4) 505 (5.9) 482 (13.7) 441 (25.4)Canada 455 (12.6) 506 (12.4) 456 (17.9) 496 (6.0) 515 (12.8) 483 (18.8)Chile 410 (4.5) c c c c 422 (3.8) c c c cCzech Republic c c c c c c 444 (9.0) c c c cDenmark c c 426 (6.6) 401 (9.7) 461 (4.5) 437 (6.0) 418 (16.1)Estonia c c m m m m 470 (7.9) c c c cFinland 491 (7.1) c c c c 511 (5.6) c c c cFrance 427 (20.1) 437 (15.4) c c 468 (6.1) 459 (9.7) 451 (21.1)Germany 444 (12.4) 439 (10.7) c c 463 (5.0) 437 (11.0) 424 (12.8)Greece 446 (8.3) c c c c 452 (6.9) c c 412 (41.3)Hungary 367 (18.2) m m m m 426 (5.6) c c c cIceland c c c c m m 482 (3.2) c c c cIreland 456 (9.9) c c c c 470 (4.3) c c c cIsrael 388 (10.0) 429 (14.4) c c 407 (7.4) 461 (12.7) c cItaly 433 (6.4) c c 372 (11.2) 468 (2.6) 430 (14.7) 400 (10.2)Japan m m m m m m 488 (7.4) c c c cKorea 492 (10.7) m m m m 515 (6.0) m m m mLuxembourg 424 (11.1) 426 (5.2) 393 (8.7) 480 (5.4) 434 (7.8) 424 (9.1)Mexico 401 (2.2) 344 (10.9) 322 (9.5) 430 (1.7) 354 (18.3) 325 (12.7)Netherlands 485 (8.5) 451 (9.7) 449 (11.2) 504 (8.2) 472 (9.5) c cNew Zealand 455 (12.5) c c c c 509 (4.8) 487 (17.4) 517 (15.4)Norway c c c c c c 493 (7.1) c c c cPoland c c m m m m 446 (5.2) m m c cPortugal 465 (4.2) 441 (13.6) c c 483 (3.6) 474 (14.0) 452 (15.5)Slovak Republic c c m m m m 396 (13.2) c c c cSlovenia c c c c c c 444 (4.1) 434 (10.8) 420 (16.2)Spain 456 (3.3) 439 (20.5) 388 (6.3) 471 (2.6) 454 (19.8) 420 (6.4)Sweden 432 (17.0) c c c c 474 (6.6) 423 (15.4) c cSwitzerland 456 (22.5) 451 (15.8) 417 (7.8) 481 (3.9) 466 (6.3) 427 (7.2)Turkey 455 (3.3) c c c c 462 (4.8) c c c cUnited Kingdom 428 (9.7) c c 429 (16.9) 465 (6.2) 487 (12.5) 452 (23.6)United States c c 462 (6.1) 443 (11.7) 455 (6.4) 469 (10.5) 454 (12.9)OECD average 443 (2.4) 438 (3.3) 406 (3.5) 466 (1.1) 455 (2.9) 429 (4.3)
Part
ners Albania 361 (6.7) c c c c 369 (5.4) c c m m
Argentina 360 (4.8) 362 (18.9) c c 397 (7.3) c c c cAzerbaijan 335 (11.2) c c c c 354 (6.4) c c c cBrazil 387 (2.5) 310 (33.1) c c 412 (3.4) c c c cBulgaria 301 (16.7) m m c c 356 (8.7) c c c cColombia 385 (4.4) c c c c 407 (4.4) c c c cCroatia 430 (16.9) c c c c 436 (4.9) 435 (9.9) 418 (14.9)Dubai (UAE) 366 (4.6) 396 (9.7) 382 (12.7) 387 (5.3) 419 (12.5) 445 (8.4)Hong Kong-China 520 (4.6) 536 (4.6) 502 (7.7) 523 (4.4) 540 (5.0) 512 (7.1)Indonesia 389 (3.2) m m c c 396 (4.3) m m c cJordan 377 (4.5) 403 (11.2) c c 397 (4.0) 416 (10.0) c cKazakhstan c c c c c c 345 (12.9) c c c cKyrgyzstan c c m m m m 270 (12.7) c c c cLatvia c c m m m m 459 (9.7) c c m mLiechtenstein c c c c c c 477 (13.1) c c c cLithuania c c c c m m 432 (8.1) m m m mMacao-China 479 (3.7) 486 (2.1) 476 (4.3) 479 (3.9) 492 (2.4) 492 (4.2)Montenegro 353 (11.7) m m c c 366 (4.9) c c c cPanama 347 (6.5) c c c c 359 (7.1) c c c cPeru 326 (3.5) c c c c 356 (4.7) c c c cQatar 329 (2.8) 342 (4.4) 354 (7.7) 332 (5.5) 365 (11.1) 413 (9.6)Romania 348 (7.7) m m c c 414 (6.3) m m m mRussian Federation c c c c c c 405 (10.7) c c c cSerbia 394 (18.5) c c c c 407 (5.8) c c c cShanghai-China 514 (6.2) c c c c 539 (2.9) c c c cSingapore 480 (3.4) 519 (12.5) 464 (16.0) 493 (6.7) c c c cChinese Taipei 465 (4.5) c c c c 475 (3.3) c c c cThailand 410 (2.6) m m m m 413 (4.2) m m m mTrinidad and Tobago 400 (4.1) c c c c 416 (6.6) c c c cTunisia 393 (2.6) c c c c 407 (3.9) c c c cUruguay 388 (3.2) c c c c 413 (3.4) c c c c
Note: At best primary is defined as MISCED = 0 or 1; Lower secondary is defined as MISCED = 2 , Upper secondary is defined as MISCED = 3 or 4 and Tertiary is defined as MISCED = 5 or 6.
Source: PISA 2009 Database.
Please refer to the Reader’s Guide for information concerning the symbols replacing missing data.
[Part 3/4]

185UNTAPPED SKILLS: REALISING THE POTENTIAL OF IMMIGRANT STUDENTS © OECD 2012
DATA TABLES ON IMMIGRANT STUDENTS: ANNEX B
Table B5.1aPrevalence and average reading performance across mother’s education, by immigrant status (cont.)Results based on students’ self-reports
Student performance on the reading scale
Distribution of educational attainment of mother
Upper secondary Tertiary
Non-immigrant studentsSecond-generation
students First-generation students Non-immigrant studentsSecond-generation
students First-generation studentsMean score S.E. Mean score S.E. Mean score S.E. Mean score S.E. Mean score S.E. Mean score S.E.
OEC
D Australia 505 (2.0) 520 (5.8) 509 (7.6) 541 (2.6) 555 (8.1) 541 (6.4)Austria 479 (3.1) 436 (8.4) 394 (16.9) 509 (4.0) 457 (11.7) 431 (17.0)Belgium 502 (2.8) 451 (9.4) 452 (11.2) 545 (2.3) 489 (10.6) 485 (9.5)Canada 516 (1.8) 520 (4.8) 500 (6.9) 540 (1.9) 533 (4.1) 536 (4.6)Chile 461 (3.2) c c c c 491 (3.4) c c c cCzech Republic 479 (2.8) 442 (18.9) 472 (17.1) 498 (4.8) c c c cDenmark 495 (2.8) 461 (7.1) 429 (13.0) 516 (2.5) 470 (9.5) 441 (12.9)Estonia 500 (2.7) 458 (7.2) c c 516 (3.5) 480 (9.1) c cFinland 520 (3.4) c c c c 549 (2.4) 506 (18.1) 480 (19.6)France 504 (3.9) 472 (15.8) c c 535 (4.6) 477 (13.8) 469 (16.9)Germany 519 (2.5) 481 (8.4) 454 (11.1) 543 (4.1) 487 (13.6) 486 (11.9)Greece 490 (4.7) 451 (12.1) 436 (12.3) 513 (3.7) 466 (15.9) 412 (20.8)Hungary 495 (2.8) c c c c 536 (4.5) c c c cIceland 499 (2.9) c c c c 523 (2.3) c c c cIreland 503 (3.5) c c 444 (11.1) 526 (3.3) c c 488 (8.8)Israel 464 (3.6) 473 (8.2) 459 (9.5) 522 (3.9) 527 (6.7) 499 (10.2)Italy 507 (1.6) 468 (9.3) 430 (6.7) 508 (2.4) 458 (21.0) 419 (7.3)Japan 508 (3.9) c c c c 543 (3.5) c c c cKorea 539 (2.9) m m m m 557 (4.8) c c m mLuxembourg 502 (3.0) 451 (6.0) 446 (10.8) 508 (3.3) 480 (7.3) 519 (7.1)Mexico 456 (2.8) c c c c 459 (2.4) 345 (34.3) 338 (33.5)Netherlands 512 (5.8) 480 (11.1) c c 530 (5.4) 487 (16.8) 510 (20.6)New Zealand 526 (3.0) 504 (8.5) 506 (7.4) 560 (3.4) 537 (12.7) 543 (5.9)Norway 497 (2.8) 462 (10.0) 443 (17.5) 519 (2.9) 479 (11.2) 473 (12.1)Poland 497 (2.3) m m m m 554 (3.9) m m m mPortugal 512 (3.3) 488 (15.4) 436 (15.9) 535 (4.5) 522 (11.5) 485 (13.5)Slovak Republic 477 (2.5) c c c c 503 (4.2) c c m mSlovenia 479 (1.8) 459 (6.2) 391 (14.9) 520 (2.5) 444 (18.2) c cSpain 493 (2.4) 480 (12.8) 428 (6.2) 516 (2.8) 460 (17.0) 452 (6.7)Sweden 504 (3.7) 471 (11.6) 424 (16.4) 519 (3.2) 482 (8.3) 456 (16.6)Switzerland 517 (2.5) 474 (6.6) 452 (11.2) 530 (3.4) 498 (7.5) 507 (10.2)Turkey 504 (4.9) c c c c 530 (7.1) c c c cUnited Kingdom 497 (2.6) 502 (10.8) 449 (13.0) 522 (2.9) 509 (11.0) 487 (12.0)United States 489 (3.4) 482 (8.3) 477 (9.4) 526 (4.8) 517 (10.1) 533 (10.4)OECD average 498 (0.5) 473 (2.1) 449 (2.7) 525 (0.6) 486 (2.9) 478 (3.0)
Part
ners Albania 406 (4.1) c c c c 409 (6.9) c c c c
Argentina 411 (5.5) c c c c 432 (5.6) c c c cAzerbaijan 353 (4.1) 335 (13.8) c c 378 (3.9) 386 (12.5) c cBrazil 437 (3.5) c c c c 445 (4.8) c c c cBulgaria 429 (6.5) c c c c 474 (7.6) c c c cColombia 429 (5.0) c c m m 446 (4.9) c c c cCroatia 482 (3.0) 470 (7.6) 460 (12.1) 493 (4.3) 483 (9.0) 473 (17.7)Dubai (UAE) 397 (4.2) 455 (5.2) 485 (4.5) 420 (4.7) 494 (3.8) 518 (2.3)Hong Kong-China 541 (3.1) 553 (4.5) 525 (6.4) 558 (5.6) 555 (12.8) 544 (21.6)Indonesia 417 (4.8) m m c c 438 (7.9) m m c cJordan 410 (3.2) 427 (6.7) 419 (14.3) 433 (4.0) 432 (10.1) 426 (9.1)Kazakhstan 357 (4.1) 371 (13.6) 347 (14.6) 401 (3.3) 432 (12.8) 381 (9.5)Kyrgyzstan 291 (3.9) c c c c 336 (3.8) 378 (23.2) c cLatvia 474 (2.9) 450 (11.5) c c 501 (3.6) 497 (10.2) c cLiechtenstein 518 (8.1) c c c c 526 (7.8) c c c cLithuania 454 (3.1) 436 (15.2) c c 493 (2.8) 457 (17.2) c cMacao-China 489 (3.3) 491 (3.0) 502 (4.3) 489 (5.5) 497 (7.7) 504 (9.0)Montenegro 412 (1.7) 421 (12.5) 422 (9.3) 432 (3.5) c c 402 (13.5)Panama 382 (6.2) c c c c 407 (8.1) 369 (37.3) 359 (51.3)Peru 399 (3.9) c c c c 432 (8.0) c c c cQatar 325 (2.6) 387 (4.7) 448 (4.1) 338 (2.0) 422 (3.8) 475 (2.8)Romania 428 (4.1) c c c c 437 (5.6) c c c cRussian Federation 434 (5.1) 417 (19.2) 404 (15.3) 471 (3.2) 448 (6.0) 458 (9.9)Serbia 445 (2.5) 460 (6.6) 452 (9.5) 451 (3.1) 477 (11.1) 448 (8.4)Shanghai-China 558 (2.6) c c c c 584 (3.1) m m c cSingapore 532 (2.2) 534 (9.3) 512 (9.1) 557 (2.7) 584 (14.7) 539 (6.6)Chinese Taipei 491 (2.8) c c c c 521 (3.3) c c c cThailand 430 (3.1) m m m m 474 (6.0) m m m mTrinidad and Tobago 429 (2.0) c c c c 450 (4.1) c c 460 (28.7)Tunisia 423 (4.3) c c c c 433 (8.1) m m c cUruguay 457 (3.9) c c c c 484 (4.0) c c c c
Note: At best primary is defined as MISCED = 0 or 1; Lower secondary is defined as MISCED = 2 , Upper secondary is defined as MISCED = 3 or 4 and Tertiary is defined as MISCED = 5 or 6.
Source: PISA 2009 Database.
Please refer to the Reader’s Guide for information concerning the symbols replacing missing data.
[Part 4/4]

186 © OECD 2012 UNTAPPED SKILLS: REALISING THE POTENTIAL OF IMMIGRANT STUDENTS
ANNEX B: DATA TABLES ON IMMIGRANT STUDENTS
Table B5.1bAverage reading performance across mother’s education, by immigrant statusResults based on students’ self-reports
Average reading performanceDistribution of educational attainment of mother
Less than upper-secondary Upper secondary TertiaryNon-
immigrant students
Second-generation students
First-generation students
Immigrant students
Non-immigrant students
Second-generation students
First-generation students
Immigrant students
Non-immigrant students
Second-generation students
First-generation students
Immigrant students
Mean S.E. Mean S.E. Mean S.E. Mean S.E. Mean S.E. Mean S.E. Mean S.E. Mean S.E. Mean S.E. Mean S.E. Mean S.E. Mean S.E.
OEC
D Australia 465.6 (4.8) 505.4 (11.6) 448.9 (10.0) 485.0 (8.6) 503.8 (2.0) 520.0 (5.7) 508.3 (7.5) 514.8 (5.8) 540.1 (2.6) 554.8 (8.0) 540.8 (6.4) 547.2 (6.3)Austria 423.1 (9.5) 404.5 (9.8) 348.4 (12.0) 385.8 (7.8) 478.7 (3.1) 435.6 (8.3) 390.8 (16.4) 422.5 (8.4) 507.6 (4.0) 453.3 (11.9) 430.6 (17.0) 445.4 (10.8)Belgium 485.6 (5.2) 447.5 (8.8) 421.6 (12.4) 437.9 (7.0) 500.0 (2.8) 449.9 (9.2) 449.4 (11.3) 449.7 (8.8) 543.9 (2.3) 483.8 (10.3) 480.3 (11.0) 482.0 (8.1)Canada 491.4 (5.5) 508.0 (9.3) 466.9 (13.1) 494.5 (8.3) 515.0 (1.8) 519.3 (4.7) 498.5 (7.0) 512.0 (4.0) 539.4 (1.8) 531.8 (4.1) 534.8 (4.8) 533.3 (3.6)Chile 417.2 (3.4) c c c c c c 460.5 (3.2) c c c c c c 489.1 (3.5) c c c c c cCzech Republic 435.8 (8.1) c c c c c c 478.6 (2.8) 436.9 (20.2) 471.8 (17.1) 449.1 (14.7) 497.1 (4.8) c c c c 519.5 (23.6)Denmark 460.0 (4.5) 430.1 (3.8) 407.3 (9.1) 424.4 (4.0) 493.7 (2.9) 459.1 (6.8) 427.5 (12.8) 447.8 (6.3) 515.9 (2.5) 467.6 (9.5) 441.2 (12.4) 458.3 (8.2)Estonia 467.4 (7.5) c c c c c c 499.5 (2.7) 458.3 (7.2) c c 460.9 (6.8) 515.2 (3.5) 480.4 (9.1) c c 478.3 (9.0)Finland 500.8 (4.6) c c c c c c 519.3 (3.3) c c c c c c 548.3 (2.4) 505.6 (18.1) 480.3 (19.6) 491.4 (13.6)France 462.6 (5.5) 448.2 (9.3) 421.8 (22.0) 442.2 (8.5) 502.0 (3.9) 464.0 (14.7) c c 453.2 (14.5) 534.9 (4.7) 469.2 (13.7) 468.5 (16.4) 469.0 (11.5)Germany 459.9 (4.8) 430.7 (8.2) 412.2 (10.4) 425.2 (6.7) 518.7 (2.5) 473.0 (8.0) 457.5 (10.8) 468.4 (6.8) 541.1 (4.0) 480.1 (13.7) 482.8 (11.6) 481.2 (10.5)Greece 448.5 (6.3) c c 410.3 (30.6) 414.5 (26.3) 490.1 (4.6) 451.3 (12.1) 435.7 (12.2) 441.0 (8.9) 512.7 (3.7) 466.4 (15.9) 412.0 (20.8) 434.8 (15.7)Hungary 422.5 (5.8) c c c c c c 494.9 (2.7) c c c c 511.4 (9.7) 535.7 (4.5) c c c c c cIceland 479.6 (3.2) c c c c c c 498.4 (2.9) c c c c 427.4 (19.4) 522.4 (2.3) c c c c 433.4 (21.1)Ireland 464.1 (4.4) c c c c 453.2 (17.4) 501.6 (3.5) c c 441.4 (11.3) 460.1 (10.3) 525.1 (3.4) c c 487.6 (8.8) 488.8 (8.7)Israel 398.8 (6.9) 439.6 (10.4) 408.0 (27.1) 430.1 (11.3) 463.7 (3.6) 472.7 (8.0) 457.6 (9.5) 467.6 (6.7) 521.4 (3.9) 526.3 (6.5) 497.6 (9.7) 515.6 (6.1)Italy 462.9 (2.6) 426.1 (12.0) 389.2 (7.7) 400.0 (6.0) 506.4 (1.6) 463.8 (9.8) 427.3 (6.6) 434.3 (5.8) 508.0 (2.3) 458.3 (21.0) 418.2 (7.2) 428.9 (8.0)Japan 485.7 (7.4) c c c c c c 507.0 (3.9) c c c c c c 542.3 (3.5) c c c c c cKorea 506.8 (6.8) m m m m m m 538.7 (2.9) m m m m m m 556.1 (4.8) c c m m c cLuxembourg 470.6 (4.8) 428.0 (4.1) 402.6 (6.7) 419.4 (3.4) 500.8 (3.0) 449.8 (6.0) 440.6 (11.2) 446.6 (5.5) 506.7 (3.3) 480.4 (7.2) 517.8 (7.0) 500.7 (4.6)Mexico 412.5 (1.7) 346.1 (9.7) 320.7 (7.6) 330.7 (6.6) 456.3 (2.8) c c c c 307.2 (29.4) 459.0 (2.4) 344.6 (34.2) 335.5 (32.7) 338.9 (24.2)Netherlands 495.1 (7.4) 456.4 (8.3) 448.6 (9.7) 454.6 (7.0) 511.3 (5.8) 479.8 (11.0) c c 483.6 (9.4) 529.5 (5.3) 487.4 (16.8) 505.2 (19.8) 493.6 (14.3)New Zealand 496.6 (4.8) 489.2 (13.8) 472.9 (12.4) 480.3 (8.9) 523.4 (3.0) 497.9 (8.6) 506.2 (6.9) 503.2 (5.8) 557.5 (3.4) 536.4 (12.4) 542.1 (5.9) 540.9 (5.5)Norway 480.1 (6.9) c c c c 420.2 (9.6) 496.5 (2.8) 463.3 (10.4) 441.3 (16.9) 454.0 (9.5) 519.0 (2.9) 477.1 (11.3) 473.2 (12.1) 475.3 (8.4)Poland 446.0 (5.0) m m c c c c 496.8 (2.3) m m m m m m 554.0 (3.9) m m m m m mPortugal 471.4 (3.3) 455.0 (11.1) 446.1 (11.9) 451.3 (8.7) 511.5 (3.4) 486.7 (15.0) 436.2 (15.9) 459.4 (10.8) 533.9 (4.5) 521.9 (11.5) 485.1 (13.5) 499.9 (8.5)Slovak Republic 386.0 (11.5) c c c c c c 476.4 (2.5) c c c c c c 502.8 (4.2) c c m m c cSlovenia 444.2 (4.2) 431.1 (10.5) 415.7 (15.2) 426.8 (8.8) 478.3 (1.8) 457.0 (6.3) 390.9 (14.9) 450.4 (6.0) 519.2 (2.5) 443.6 (18.2) c c 445.5 (14.0)Spain 465.1 (2.6) 446.3 (14.6) 406.4 (4.7) 410.7 (5.1) 492.2 (2.5) 479.1 (12.6) 428.1 (6.1) 434.2 (5.7) 515.8 (2.8) 459.9 (16.8) 452.5 (6.6) 453.3 (6.0)Sweden 466.9 (6.5) 417.5 (13.9) 370.6 (14.7) 399.1 (10.2) 502.7 (3.7) 469.6 (10.9) 424.4 (16.4) 454.5 (9.7) 518.1 (3.2) 481.0 (8.4) 456.0 (15.9) 473.6 (7.4)Switzerland 479.2 (3.9) 460.2 (7.7) 423.7 (5.4) 447.8 (5.9) 515.8 (2.6) 472.3 (6.6) 450.7 (10.0) 465.0 (5.8) 528.4 (3.4) 496.7 (7.4) 502.2 (10.8) 498.9 (5.9)Turkey 455.4 (3.3) c c c c c c 502.5 (5.0) c c c c c c 526.6 (7.1) c c c c c cUnited Kingdom 456.3 (5.8) 461.6 (11.3) 438.4 (16.2) 450.8 (11.3) 495.9 (2.5) 500.0 (11.1) 447.5 (12.7) 480.2 (9.2) 520.9 (2.9) 505.5 (11.4) 481.5 (9.9) 493.7 (8.1)United States 457.9 (6.8) 464.5 (5.8) 447.2 (10.0) 459.0 (5.2) 488.6 (3.4) 480.8 (8.1) 475.4 (9.3) 479.1 (7.1) 526.1 (4.8) 516.4 (10.1) 533.2 (10.2) 522.8 (8.3)OECD average 459.4 (1.0) 444.8 (2.3) 415.6 (3.1) 432.3 (2.1) 497.6 (0.5) 471.3 (2.1) 447.9 (2.6) 456.9 (2.0) 523.9 (0.6) 484.5 (2.9) 476.5 (2.9) 479.4 (2.2)
Part
ners Albania 365.9 (4.9) c c c c c c 404.1 (4.1) c c c c c c 407.2 (6.8) c c c c c c
Argentina 370.1 (4.7) 363.4 (18.0) c c 360.2 (16.8) 409.0 (5.5) c c c c c c 431.5 (5.6) c c c c 353.3 (24.4)Azerbaijan 348.2 (6.1) c c c c c c 351.8 (4.1) 334.9 (13.8) c c 343.2 (12.2) 377.1 (3.9) 386.4 (12.5) c c 385.9 (10.9)Brazil 396.1 (2.6) 329.5 (29.6) 309.8 (16.4) 322.9 (20.6) 436.7 (3.5) c c c c c c 443.7 (4.8) c c c c 289.5 (11.9)Bulgaria 345.7 (8.3) c c c c c c 427.7 (6.4) c c c c c c 473.5 (7.6) c c c c c cColombia 392.2 (3.9) c c c c c c 428.8 (5.0) c c m m c c 445.9 (4.9) c c c c c cCroatia 435.1 (5.0) 436.3 (10.3) 418.3 (12.9) 430.0 (8.1) 481.0 (3.0) 470.3 (7.6) 459.8 (12.1) 466.7 (7.1) 492.4 (4.3) 482.9 (9.0) 472.7 (17.7) 480.0 (8.4)Dubai (UAE) 374.0 (3.4) 406.1 (7.8) 425.4 (6.7) 414.5 (5.4) 397.1 (4.1) 454.0 (5.2) 484.4 (4.4) 471.4 (3.3) 418.3 (4.7) 493.6 (3.8) 518.0 (2.3) 510.4 (1.8)Hong Kong-China 520.9 (3.6) 537.7 (3.8) 505.4 (5.9) 524.0 (3.8) 541.2 (3.1) 553.3 (4.5) 525.3 (6.4) 544.3 (3.8) 558.3 (5.6) 552.6 (12.7) 543.8 (21.6) 548.8 (13.4)Indonesia 391.2 (3.2) m m c c c c 417.1 (4.8) m m c c c c 438.2 (7.9) m m c c c cJordan 387.6 (3.5) 408.6 (8.0) 405.7 (17.1) 408.1 (6.9) 407.6 (3.3) 425.4 (6.5) 419.3 (14.3) 424.4 (6.2) 431.3 (4.0) 429.4 (11.1) 420.2 (10.6) 426.5 (8.4)Kazakhstan 341.9 (12.4) c c c c 329.3 (16.0) 357.4 (4.1) 371.3 (13.6) 346.3 (14.6) 362.3 (11.2) 400.7 (3.3) 429.6 (12.8) 380.3 (9.5) 411.7 (10.3)Kyrgyzstan 269.4 (10.8) c c c c c c 290.4 (3.9) c c c c c c 334.4 (3.8) 377.7 (23.2) c c 362.8 (15.4)Latvia 457.5 (8.6) c c m m c c 473.2 (3.0) 449.7 (11.5) c c 453.2 (11.3) 500.4 (3.6) 497.1 (10.2) c c 496.0 (9.4)Liechtenstein 473.5 (12.5) c c c c 453.7 (10.7) 518.5 (7.9) c c c c c c 525.8 (7.8) c c c c c cLithuania 425.8 (7.4) c c m m c c 453.4 (3.1) 440.4 (15.5) c c 440.5 (16.0) 492.7 (2.8) 457.2 (17.2) c c 457.3 (15.4)Macao-China 479.2 (2.9) 488.5 (1.6) 484.4 (3.0) 487.7 (1.3) 488.9 (3.3) 490.6 (3.0) 502.1 (4.3) 493.5 (2.5) 486.9 (5.5) 496.9 (7.7) 503.2 (8.9) 499.3 (6.2)Montenegro 363.6 (4.3) c c c c c c 410.8 (1.7) 421.1 (12.5) 422.3 (9.2) 421.8 (7.3) 431.3 (3.5) c c 397.8 (13.6) 428.5 (12.8)Panama 349.2 (5.8) c c c c 328.4 (26.2) 381.7 (6.1) c c c c c c 406.2 (8.2) 365.7 (38.1) 358.9 (51.3) 360.8 (38.0)Peru 332.5 (2.9) c c c c c c 398.0 (3.9) c c c c c c 427.3 (8.0) c c c c c cQatar 328.8 (2.6) 347.1 (3.9) 377.5 (6.7) 358.1 (3.4) 324.6 (2.5) 387.3 (4.7) 447.5 (4.0) 419.2 (3.0) 337.3 (2.0) 421.6 (3.8) 474.6 (2.8) 456.2 (2.2)Romania 390.1 (6.3) m m c c c c 427.6 (4.1) c c c c c c 436.0 (5.6) c c c c c cRussian Federation 407.4 (10.6) c c c c 384.8 (26.2) 434.0 (5.0) 414.9 (18.4) 404.3 (15.3) 409.9 (11.3) 470.9 (3.2) 447.7 (6.0) 457.0 (9.5) 451.4 (5.6)Serbia 404.3 (6.4) 434.8 (17.2) c c 433.9 (12.1) 444.9 (2.5) 460.2 (6.6) 449.7 (9.5) 454.9 (6.5) 450.5 (3.1) 477.4 (10.9) 446.2 (8.4) 464.6 (7.0)Shanghai-China 533.5 (3.4) c c c c c c 558.2 (2.6) c c c c c c 583.3 (3.2) m m c c c cSingapore 483.6 (3.1) 508.7 (10.2) 470.4 (12.5) 489.6 (8.1) 531.4 (2.2) 534.3 (9.3) 512.2 (9.1) 521.4 (6.3) 557.1 (2.7) 584.5 (14.6) 538.7 (6.6) 548.6 (6.4)Chinese Taipei 471.4 (2.8) c c c c c c 490.3 (2.8) c c c c c c 520.9 (3.3) c c c c c cThailand 410.3 (2.6) m m m m m m 429.5 (3.1) m m m m m m 473.4 (6.0) m m m m m mTrinidad and Tobago 404.3 (3.6) c c c c c c 426.8 (1.9) c c c c 401.3 (23.5) 447.2 (4.3) c c 459.6 (28.7) 469.8 (24.6)Tunisia 394.8 (2.6) c c c c c c 421.3 (4.3) c c c c c c 431.7 (8.0) m m c c c cUruguay 399.3 (2.5) c c c c c c 456.5 (3.9) c c c c c c 483.1 (4.0) c c c c c c
Note:Less than upper secondary is defined as MISCED = 0, 1 or 2 , Upper secondary is defined as MISCED = 3 or 4 and Tertiary is defined as MISCED = 5 or 6.
Source: PISA 2009 Database.
Please refer to the Reader’s Guide for information concerning the symbols replacing missing data.

187UNTAPPED SKILLS: REALISING THE POTENTIAL OF IMMIGRANT STUDENTS © OECD 2012
DATA TABLES ON IMMIGRANT STUDENTS: ANNEX B
Table B5.2Sample sizes and estimated number of students in schools having less than 20 responding studentsResults based on students’ self-reports
Proportion of students excluded when considering each category
Weighted sample Unweighted sample
Immigrants
Does not speak the assessment language
at homeMothers having less than
upper secondary Immigrants
Does not speak the assessment language
at homeMothers having less than
upper secondary
% S.E. % S.E. % S.E. % S.E. % S.E. % S.E.
OEC
D Australia 2.1 (0.6) 2.1 (0.6) 2.5 (0.7) 1.7 (0.1) 1.7 (0.1) 2.1 (0.1)
Austria 16.2 (2.3) 18.5 (2.5) 19.3 (2.2) 12.2 (0.4) 13.9 (0.4) 15.1 (0.4)
Belgium 6.0 (1.1) 8.2 (1.4) 6.8 (1.1) 5.4 (0.2) 7.7 (0.3) 6.2 (0.3)
Canada 20.3 (1.7) 22.9 (1.9) 20.9 (1.6) 17.0 (0.2) 18.7 (0.3) 17.1 (0.2)
Chile 5.0 (0.9) 5.0 (0.9) 4.6 (0.8) 4.1 (0.3) 4.1 (0.3) 3.6 (0.2)
Czech Republic 25.0 (2.2) 26.7 (2.3) 26.6 (2.4) 19.6 (0.5) 21.3 (0.5) 21.0 (0.5)
Denmark 29.2 (2.7) 37.0 (2.8) 31.4 (2.3) 31.9 (0.6) 45.4 (0.6) 35.9 (0.6)
Estonia 17.3 (2.1) 17.7 (2.1) 16.9 (2.1) 9.2 (0.4) 9.6 (0.4) 8.8 (0.4)
Finland 0.8 (0.3) 0.8 (0.3) 0.8 (0.3) 2.0 (0.2) 2.0 (0.2) 2.0 (0.2)
France 8.8 (1.6) 14.5 (2.4) 14.3 (2.6) 7.3 (0.4) 12.5 (0.5) 12.4 (0.5)
Germany 26.7 (2.7) 38.2 (2.7) 32.3 (2.9) 26.2 (0.6) 38.0 (0.7) 32.1 (0.7)
Greece 10.2 (1.5) 10.9 (1.7) 10.2 (1.5) 5.4 (0.3) 5.8 (0.3) 5.4 (0.3)
Hungary 13.1 (1.8) 13.1 (1.8) 13.1 (1.8) 6.9 (0.4) 6.9 (0.4) 6.9 (0.4)
Iceland 16.5 (0.2) 17.0 (0.2) 15.9 (0.2) 16.0 (0.6) 16.6 (0.6) 15.5 (0.6)
Ireland 7.6 (1.9) 7.6 (1.9) 6.0 (1.4) 7.3 (0.4) 7.3 (0.4) 5.9 (0.4)
Israel 6.5 (1.6) 7.2 (1.6) 7.0 (1.7) 3.6 (0.2) 4.4 (0.3) 4.0 (0.3)
Italy 6.1 (0.6) 13.2 (1.0) 6.4 (0.6) 5.2 (0.1) 11.2 (0.2) 5.1 (0.1)
Japan 0.8 (0.4) 0.8 (0.4) 1.3 (0.7) 0.7 (0.1) 0.7 (0.1) 1.1 (0.1)
Korea 3.4 (1.0) 3.4 (1.0) 3.4 (1.0) 3.9 (0.3) 3.9 (0.3) 3.9 (0.3)
Luxembourg 0.9 (0.0) 0.9 (0.0) 0.9 (0.0) 1.0 (0.1) 1.0 (0.1) 1.0 (0.1)
Mexico 18.2 (1.1) 19.4 (1.1) 17.3 (1.0) 9.4 (0.1) 10.0 (0.2) 8.7 (0.1)
Netherlands 3.7 (1.3) 4.9 (1.6) 4.3 (1.5) 3.8 (0.3) 4.8 (0.3) 3.8 (0.3)
New Zealand 6.0 (1.4) 6.0 (1.4) 17.1 (2.5) 4.8 (0.3) 4.8 (0.3) 14.9 (0.5)
Norway 7.2 (1.2) 7.6 (1.2) 9.9 (1.6) 5.8 (0.3) 6.3 (0.4) 8.5 (0.4)
Poland 6.0 (1.0) 6.0 (1.0) 5.6 (1.0) 6.2 (0.3) 6.2 (0.3) 5.8 (0.3)
Portugal 6.4 (1.6) 6.7 (1.6) 6.4 (1.6) 5.4 (0.3) 5.8 (0.3) 5.4 (0.3)
Slovak Republic 19.2 (1.7) 19.2 (1.7) 18.8 (1.7) 15.0 (0.5) 15.0 (0.5) 14.6 (0.5)
Slovenia 15.2 (0.7) 16.9 (0.6) 15.2 (0.7) 21.5 (0.5) 23.9 (0.5) 21.1 (0.5)
Spain 2.7 (0.6) 3.1 (0.7) 2.7 (0.6) 4.3 (0.1) 4.5 (0.1) 4.4 (0.1)
Sweden 4.4 (1.0) 6.1 (1.3) 6.0 (1.3) 4.7 (0.3) 6.2 (0.4) 6.1 (0.4)
Switzerland 10.4 (1.9) 12.9 (2.1) 11.2 (1.9) 10.1 (0.3) 12.4 (0.3) 11.5 (0.3)
Turkey 4.8 (1.1) 4.8 (1.1) 4.8 (1.1) 3.2 (0.2) 3.2 (0.2) 3.2 (0.2)
United Kingdom 6.2 (1.6) 7.8 (1.7) 15.1 (2.4) 5.6 (0.2) 6.5 (0.2) 12.5 (0.3)
United States 4.8 (1.7) 4.8 (1.7) 4.8 (1.7) 3.7 (0.3) 3.7 (0.3) 3.7 (0.3)
OECD average 9.9 (0.3) 11.5 (0.3) 11.2 (0.3) 8.5 (0.1) 10.2 (0.1) 9.7 (0.1)
Part
ners Albania 24.4 (2.7) 24.4 (2.7) 24.4 (2.7) 12.7 (0.5) 12.7 (0.5) 12.7 (0.5)
Argentina 18.1 (2.2) 20.7 (2.4) 18.6 (2.6) 12.9 (0.5) 15.1 (0.5) 13.2 (0.5)
Azerbaijan 10.3 (1.9) 10.3 (1.9) 9.7 (1.9) 8.3 (0.4) 8.3 (0.4) 7.8 (0.4)
Brazil 19.1 (1.4) 21.5 (1.6) 18.7 (1.4) 17.8 (0.3) 19.9 (0.3) 17.0 (0.3)
Bulgaria 12.4 (2.1) 12.4 (2.1) 11.6 (2.0) 11.0 (0.5) 11.0 (0.5) 10.6 (0.5)
Colombia 6.4 (1.8) 6.7 (1.8) 6.4 (1.8) 5.8 (0.3) 6.4 (0.3) 5.8 (0.3)
Croatia 1.2 (0.7) 1.2 (0.7) 0.8 (0.6) 0.8 (0.1) 0.8 (0.1) 0.4 (0.1)
Dubai (UAE) 9.5 (0.1) 12.4 (0.1) 8.8 (0.1) 13.8 (0.5) 18.1 (0.5) 12.7 (0.4)
Hong Kong-China 0.4 (0.7) 0.4 (0.7) 0.4 (0.7) 0.4 (0.1) 0.4 (0.1) 0.4 (0.1)
Indonesia 8.8 (1.7) 9.3 (1.6) 8.4 (1.6) 9.2 (0.4) 9.6 (0.4) 8.8 (0.4)
Jordan 4.4 (0.7) 4.4 (0.7) 4.0 (0.8) 2.7 (0.2) 2.7 (0.2) 2.4 (0.2)
Kazakhstan 14.3 (2.5) 14.7 (2.5) 13.9 (2.5) 8.8 (0.4) 9.2 (0.4) 8.4 (0.4)
Kyrgyzstan 8.8 (1.7) 9.7 (1.7) 8.8 (1.7) 6.1 (0.3) 6.5 (0.3) 6.1 (0.3)
Latvia 27.1 (2.5) 29.1 (2.6) 27.1 (2.5) 14.4 (0.5) 16.7 (0.6) 14.4 (0.5)
Liechtenstein 26.1 (0.3) 26.1 (0.3) 20.0 (0.3) 26.1 (2.4) 26.1 (2.4) 20.1 (2.2)
Lithuania 13.9 (1.1) 14.5 (1.2) 13.4 (1.1) 12.3 (0.5) 12.9 (0.5) 11.9 (0.5)
Macao-China 0.4 (0.0) 0.8 (0.0) 0.4 (0.0) 0.4 (0.1) 0.8 (0.1) 0.4 (0.1)
Montenegro 3.3 (1.7) 3.3 (1.7) 3.0 (1.7) 1.7 (0.2) 1.7 (0.2) 1.3 (0.2)
Panama 34.8 (4.6) 38.0 (4.8) 29.3 (4.7) 28.7 (0.7) 30.9 (0.7) 25.4 (0.7)
Peru 17.4 (2.2) 18.2 (2.3) 15.2 (2.0) 12.7 (0.4) 13.7 (0.4) 10.8 (0.4)
Qatar 5.5 (0.1) 6.5 (0.1) 5.3 (0.1) 5.2 (0.2) 6.1 (0.3) 5.0 (0.2)
Romania 11.0 (1.3) 11.0 (1.3) 11.0 (1.3) 5.8 (0.3) 5.8 (0.3) 5.8 (0.3)
Russian Federation 18.1 (2.0) 18.1 (2.0) 18.1 (2.0) 11.9 (0.4) 11.9 (0.4) 11.9 (0.4)
Serbia 3.0 (0.8) 3.0 (0.8) 2.9 (0.8) 3.0 (0.2) 3.0 (0.2) 2.7 (0.2)
Shanghai-China 1.0 (0.7) 1.0 (0.7) 1.0 (0.7) 0.7 (0.1) 0.7 (0.1) 0.7 (0.1)
Singapore 0.0 (0.0) 0.0 (0.0) 0.0 (0.0) 0.0 (0.0) 0.0 (0.0) 0.0 (0.0)
Chinese Taipei 0.1 (0.1) 1.1 (0.6) 0.1 (0.1) 0.1 (0.0) 0.9 (0.1) 0.1 (0.0)
Thailand 8.9 (0.9) 8.9 (0.9) 8.9 (0.9) 8.5 (0.4) 8.5 (0.4) 8.5 (0.4)
Trinidad and Tobago 7.1 (0.2) 9.7 (0.3) 7.2 (0.3) 8.9 (0.4) 10.9 (0.5) 8.4 (0.4)
Tunisia 2.0 (0.5) 2.0 (0.5) 2.4 (0.7) 2.6 (0.2) 2.6 (0.2) 3.0 (0.2)
Uruguay 12.9 (1.3) 13.4 (1.3) 12.1 (1.5) 11.0 (0.4) 11.7 (0.4) 10.4 (0.4)
Source: PISA 2009 Database.

188 © OECD 2012 UNTAPPED SKILLS: REALISING THE POTENTIAL OF IMMIGRANT STUDENTS
ANNEX B: DATA TABLES ON IMMIGRANT STUDENTS
Table B5.3
Differences between reading outcomes of immigrant and non-immigrant students before and after adjusting for mother’s education and immigrant-specific interaction effectsResults based on students’ self-reports
Distribution of educational attainment of mother
First-generation students Second generation students
Observed difference
After adjusting for mother’s educational
attainment
Including immigrant-specific effects of
educational attainment Observed difference
After adjusting for mother’s educational
attainment
Including immigrant-specific effects of
educational attainment
Coef. S.E. Coef. S.E. Coef. S.E. Coef. S.E. Coef. S.E. Coef. S.E.
OEC
D Australia 3.4 (6.1) 1.3 (5.7) -4.5 (21.3) 15.7 (6.4) 18.0 (5.9) 48.8 (21.3)Austria -97.7 (10.6) -80.2 (11.6) c c -54.7 (6.7) -39.0 (7.4) c cBelgium -71.0 (8.0) -58.1 (8.9) -44.2 (15.0) -64.6 (7.2) -47.6 (6.5) -23.2 (13.4)Canada -8.2 (4.7) -8.3 (4.4) -2.4 (21.8) -5.5 (3.8) -0.2 (3.6) 42.0 (17.4)Chile c c c c c c c c c c c cCzech Republic -6.8 (16.8) -4.0 (16.1) c c -31.3 (17.7) -23.8 (15.7) c cDenmark -79.4 (6.5) -65.5 (6.6) c c -55.5 (4.3) -37.5 (4.9) c cEstonia -34.7 (17.1) -36.5 (17.0) c c -35.1 (6.5) -35.1 (6.4) c cFinland -89.0 (17.6) -81.5 (16.3) c c -45.5 (13.9) -39.9 (13.6) c cFrance -76.9 (16.2) -59.4 (14.5) c c -55.3 (9.6) -32.7 (9.1) 18.2 (32.5)Germany -60.9 (6.0) -56.0 (6.3) c c -53.8 (6.2) -43.4 (6.8) -11.5 (14.5)Greece -69.0 (15.2) -63.4 (15.2) c c -33.3 (10.3) -39.0 (10.1) c cHungary -2.3 (11.7) -7.2 (12.7) c c 31.9 (12.4) 25.6 (10.2) c cIceland -86.5 (12.4) -84.9 (13.0) c c c c c c c cIreland -36.2 (7.7) -43.5 (7.4) c c 6.3 (13.4) 8.9 (13.3) c cIsrael -17.6 (8.9) -13.3 (7.4) c c 7.1 (6.1) 11.8 (4.8) 38.8 (16.1)Italy -81.0 (4.7) -78.0 (4.7) -61.8 (13.5) -45.3 (9.4) -40.6 (9.5) c cJapan c c c c c c c c c c c cKorea m m m m m m c c c c c cLuxembourg -46.9 (4.9) -30.7 (5.2) -35.8 (14.1) -55.8 (3.7) -31.8 (4.1) -3.0 (11.9)Mexico -105.1 (9.5) -95.7 (9.8) -78.7 (9.2) -89.3 (9.7) -80.0 (10.5) -56.3 (10.5)Netherlands -44.2 (10.9) -25.6 (10.9) -27.7 (12.9) -46.0 (9.3) -32.4 (9.5) -23.9 (11.6)New Zealand -5.7 (5.0) -15.6 (4.8) c c -27.8 (9.0) -20.2 (8.3) c cNorway -60.4 (7.5) -46.0 (8.3) c c -44.9 (8.1) -36.3 (8.2) c cPoland c c c c c c m m m m m mPortugal -35.9 (8.9) -47.9 (8.6) c c -16.2 (9.4) -17.8 (8.2) -23.1 (14.3)Slovak Republic c c c c c c c c c c c cSlovenia -74.2 (8.9) -56.6 (9.5) c c -40.9 (5.6) -27.5 (5.7) c cSpain -61.6 (4.0) -61.5 (3.6) -67.5 (6.7) -26.3 (9.2) -27.8 (10.3) -17.3 (20.2)Sweden -91.2 (11.6) -69.2 (10.9) c c -53.5 (7.7) -36.2 (7.2) c cSwitzerland -58.4 (6.5) -46.9 (6.1) -38.8 (22.5) -42.2 (3.9) -28.2 (3.8) -5.3 (24.7)Turkey c c c c c c c c c c c cUnited Kingdom -41.2 (9.7) -35.7 (8.4) 5.7 (19.1) -7.1 (8.6) -3.1 (8.2) c cUnited States -20.7 (7.2) -6.6 (6.8) c c -22.3 (6.1) -4.8 (6.0) c cOECD average -52.1 (1.9) -45.6 (1.9) -35.6 (5.2) -33.0 (1.7) -24.5 (1.7) -1.3 (5.3)
Part
ners Albania c c c c c c c c c c c c
Argentina -45.5 (26.6) -44.6 (27.0) c c -35.4 (13.3) -22.4 (12.8) -0.6 (18.9)Azerbaijan 18.3 (13.0) 14.7 (13.6) c c -3.7 (9.7) -3.7 (9.2) c cBrazil -106.0 (18.8) -106.0 (22.9) c c -94.7 (19.0) -93.6 (19.4) -76.9 (33.1)Bulgaria c c c c c c c c c c c cColombia c c c c c c c c c c c cCroatia -26.9 (8.2) -19.9 (8.1) c c -13.4 (5.3) -7.6 (5.1) c cDubai (UAE) 108.6 (3.0) 84.3 (3.8) 19.8 (12.1) 72.7 (3.9) 57.2 (4.0) 29.0 (11.0)Hong Kong-China -23.5 (6.2) -16.0 (6.1) -17.0 (8.7) 7.9 (3.8) 13.8 (3.6) 17.4 (6.1)Indonesia c c c c c c m m m m m mJordan 5.0 (8.4) -0.2 (8.0) c c 13.3 (5.8) 10.9 (5.7) 23.9 (12.2)Kazakhstan -24.1 (9.1) -19.8 (8.4) c c 24.7 (12.4) 25.9 (12.0) c cKyrgyzstan 15.6 (18.7) 14.5 (18.3) c c 42.0 (19.6) 42.8 (18.6) c cLatvia c c c c c c -12.9 (9.2) -13.9 (8.3) c cLiechtenstein -35.7 (13.5) -25.8 (15.1) c c -24.3 (12.0) -13.3 (12.5) c cLithuania c c c c c c -23.7 (11.4) -23.1 (12.2) c cMacao-China 8.5 (3.0) 8.0 (3.1) -4.3 (6.1) 6.9 (2.4) 7.7 (2.6) 6.7 (4.4)Montenegro -4.0 (8.4) -5.6 (7.9) c c 24.3 (10.3) 20.6 (9.5) c cPanama -58.1 (31.4) -57.1 (31.3) c c 15.3 (27.4) 19.1 (31.0) c cPeru c c c c c c c c c c c cQatar 125.3 (2.8) 119.5 (2.8) 25.9 (8.0) 60.6 (2.7) 61.6 (2.6) 13.6 (5.0)Romania c c c c c c c c c c c cRussian Federation -19.6 (6.6) -15.2 (6.6) c c -28.7 (9.4) -23.7 (6.7) c cSerbia 4.4 (7.5) 3.3 (7.3) c c 23.6 (6.9) 22.2 (6.8) c cShanghai-China c c c c c c c c c c c cSingapore -5.3 (5.5) -18.3 (5.4) -16.9 (16.5) 17.2 (6.7) 16.1 (6.7) 38.3 (13.2)Chinese Taipei c c c c c c c c c c c cThailand m m m m m m m m m m m mTrinidad and Tobago 9.4 (18.3) 12.7 (18.4) c c -4.4 (19.7) -5.2 (21.5) c cTunisia c c c c c c c c c c c cUruguay c c c c c c c c c c c c
Note: At best primary is defined as MISCED = 0 or 1; Lower secondary is defined as MISCED = 2 , Upper secondary defined as MISCED = 3 or 4 and Tertiary defined as MISCED = 5 or 6. Values that are statistically significant are indicated in bold (see Annex A).
Source: PISA 2009 Database.
Please refer to the Reader’s Guide for information concerning the symbols replacing missing data.
[Part 1/2]

189UNTAPPED SKILLS: REALISING THE POTENTIAL OF IMMIGRANT STUDENTS © OECD 2012
DATA TABLES ON IMMIGRANT STUDENTS: ANNEX B
Table B5.3
Differences between reading outcomes of immigrant and non-immigrant students before and after adjusting for mother’s education and immigrant-specific interaction effects (continued)Results based on students’ self-reports
Interaction terms with mother’s education
First-generation students Second-generation students
Lower secondary Upper secondary Tertiary Lower secondary Upper secondary Tertiary
Coef. S.E. Coef. S.E. Coef. S.E. Coef. S.E. Coef. S.E. Coef. S.E.
OEC
D Australia -10.4 (26.3) 8.9 (23.1) 5.2 (21.7) -5.0 (20.9) -32.7 (20.7) -34.2 (20.6)Austria c c c c c c c c c c c cBelgium -21.3 (25.8) -6.5 (16.0) -19.5 (17.9) -1.9 (20.6) -27.0 (15.1) -36.9 (16.4)Canada -12.9 (29.8) -14.1 (22.4) -2.2 (21.5) -22.2 (21.0) -37.6 (17.8) -49.5 (17.6)Chile c c c c c c c c c c c cCzech Republic c c c c c c c c c c c cDenmark c c c c c c c c c c c cEstonia c c c c c c c c c c c cFinland c c c c 61.6 (34.6) c c c c -58.7 (52.5)France 40.6 (33.9) c c -10.8 (32.5) -27.2 (34.2) -56.2 (31.1) -83.9 (36.2)Germany 4.8 (27.2) -14.1 (25.7) -11.2 (27.3) -17.9 (18.3) -34.3 (14.9) -49.4 (19.0)Greece -2.0 (45.9) -16.8 (21.3) -63.2 (30.0) c c -30.4 (28.3) -37.9 (31.1)Hungary c c c c c c c c c c c cIceland c c c c c c c c c c c cIreland c c -21.5 (39.8) 1.3 (40.1) c c c c c cIsrael c c -10.6 (32.5) -28.3 (30.9) 15.8 (21.6) -29.8 (17.1) -33.9 (17.0)Italy -6.6 (16.1) -17.3 (15.6) -28.0 (13.9) -18.8 (28.7) -24.4 (24.9) -31.6 (31.2)Japan c c c c c c c c c c c cKorea m m m m m m c c c c c cLuxembourg -21.0 (18.2) -24.3 (16.9) 47.0 (15.4) -41.9 (16.5) -47.9 (14.6) -23.2 (15.0)Mexico -32.2 (17.5) c c -44.7 (32.7) -19.5 (20.5) c c -58.2 (37.1)Netherlands c c c c 3.4 (20.9) -5.7 (14.4) -7.7 (14.3) -18.2 (17.7)New Zealand 34.2 (27.8) 12.0 (24.1) 13.8 (23.8) -80.4 (33.2) -82.6 (29.3) -78.1 (31.1)Norway c c c c c c c c c c c cPoland c c c c c c m m m m m mPortugal 3.5 (16.8) -43.2 (20.7) -16.8 (19.1) 12.1 (17.9) -1.7 (20.9) 11.1 (17.0)Slovak Republic c c c c c c c c c c c cSlovenia c c c c c c c c c c c cSpain 16.6 (9.1) 3.4 (8.5) 4.2 (9.0) 0.1 (28.2) 4.3 (22.2) -38.6 (25.2)Sweden c c -6.2 (29.5) 10.1 (29.2) -23.5 (26.9) -10.5 (24.4) -14.5 (23.6)Switzerland -14.4 (25.1) -26.3 (25.4) 12.6 (23.5) -10.3 (24.8) -38.2 (26.5) -26.4 (25.7)Turkey c c c c c c c c c c c cUnited Kingdom -17.0 (27.0) -54.2 (19.0) -45.1 (19.0) 13.2 (21.8) -7.0 (21.7) -26.4 (21.0)United States c c c c c c c c c c c cOECD average -2.7 (7.0) -15.4 (6.2) -5.8 (5.9) -14.6 (5.9) -29.0 (5.5) -38.3 (6.4)
Part
ners Albania c c c c c c c c c c c c
Argentina c c c c c c c c c c c cAzerbaijan c c c c c c c c 16.3 (31.0) 42.5 (30.3)Brazil c c c c c c c c c c c cBulgaria c c c c c c c c c c c cColombia c c c c c c c c c c c cCroatia -4.8 (26.5) -8.7 (26.2) -7.2 (27.9) -23.8 (41.5) -33.6 (42.8) -32.4 (41.8)Dubai (UAE) 40.9 (16.8) 67.6 (12.9) 80.0 (12.4) 3.5 (17.3) 28.0 (13.2) 46.3 (11.8)Hong Kong-China 4.2 (11.3) 1.1 (10.0) 2.6 (21.2) -1.0 (8.4) -5.3 (7.7) -23.1 (14.1)Indonesia c c c c c c m m m m m mJordan c c -29.8 (25.7) -52.6 (23.4) -5.1 (16.0) -6.1 (13.8) -25.8 (14.5)Kazakhstan c c c c c c c c c c c cKyrgyzstan c c c c c c c c c c c cLatvia c c c c c c c c c c c cLiechtenstein c c c c c c c c c c c cLithuania c c c c c c c c c c c cMacao-China 16.4 (8.0) 17.5 (8.5) 20.6 (13.2) 5.2 (6.3) -5.0 (6.6) 3.4 (11.2)Montenegro c c 70.3 (50.6) 25.4 (52.7) c c 10.2 (12.4) c cPanama c c c c 29.7 (48.5) c c c c -123.7 (45.6)Peru c c c c c c c c c c c cQatar 56.8 (12.8) 97.1 (9.3) 111.4 (8.7) 20.0 (14.8) 49.2 (7.1) 70.7 (6.9)Romania c c c c c c c c c c c cRussian Federation c c c c c c c c c c c cSerbia c c 25.4 (51.7) 16.2 (51.1) c c -72.6 (32.9) -61.1 (34.2)Shanghai-China c c c c c c c c c c c cSingapore c c -2.3 (18.6) -1.5 (17.6) c c -35.4 (16.3) -10.9 (19.2)Chinese Taipei c c c c c c c c c c c cThailand m m m m m m m m m m m mTrinidad and Tobago c c c c 80.9 (61.2) c c c c c cTunisia c c c c c c c c c c c cUruguay c c c c c c c c c c c c
Note: At best primary is defined as MISCED = 0 or 1; Lower secondary is defined as MISCED = 2 , Upper secondary defined as MISCED = 3 or 4 and Tertiary defined as MISCED = 5 or 6. Values that are statistically significant are indicated in bold (see Annex A).
Source: PISA 2009 Database.
Please refer to the Reader’s Guide for information concerning the symbols replacing missing data.
[Part 2/2]

190 © OECD 2012 UNTAPPED SKILLS: REALISING THE POTENTIAL OF IMMIGRANT STUDENTS
ANNEX B: DATA TABLES ON IMMIGRANT STUDENTS
Table B5.4Concentration of children of immigrants in schools according to various characteristics, PISA 2009Results based on students’ self-reports
Percent of all children of immigrants who are in the top quartile (4th) Children of immigrants as a percentage of all students in the top quartile (4th)
Quartiles defined by Quartiles defined by
Percentage of children of immigrants in schools
Percentage of children of immigrants speaking
another language at home
Percentage of students with mothers having less
than upper secondary education
Percentage of children of immigrants in schools
Percentage of children of immigrants speaking
another language at home
Percentage of students with mothers having less
than upper secondary education
% S.E. % S.E. % S.E. % S.E. % S.E. % S.E.
OEC
D Australia 55.9 (3.7) 53.4 (4.3) 30.0 (4.2) 51.6 (2.0) 44.0 (3.5) 20.1 (3.7)Austria 68.3 (4.4) 65.8 (5.3) 46.5 (5.9) 36.1 (2.3) 32.2 (3.0) 20.5 (3.4)Belgium 69.6 (3.4) 58.4 (5.1) 48.6 (4.4) 39.0 (2.6) 29.0 (3.2) 23.7 (3.2)Canada 64.0 (4.1) 60.4 (4.5) 29.8 (4.4) 65.4 (2.0) 54.4 (4.1) 23.7 (3.9)Chile c c c c c c 1.7 (0.3) 0.5 (0.2) 0.2 (0.1)Czech Republic 76.0 (5.8) 59.8 (7.4) 32.1 (8.8) 6.5 (0.5) 3.9 (0.7) 2.3 (0.8)Denmark 66.3 (3.5) 58.0 (4.8) 51.0 (4.0) 20.6 (1.7) 14.9 (1.9) 13.9 (1.9)Estonia 82.4 (2.6) 29.7 (7.1) 18.5 (6.1) 29.5 (2.3) 7.3 (2.3) 4.9 (2.0)Finland 81.2 (4.2) 78.0 (5.4) 34.3 (8.4) 8.5 (0.7) 7.5 (0.9) 2.9 (1.0)France 70.3 (4.8) 63.3 (5.8) 53.0 (6.7) 39.0 (3.0) 29.2 (4.0) 24.7 (4.8)Germany 59.7 (4.7) 47.7 (5.4) 43.9 (4.9) 40.9 (2.9) 21.8 (2.8) 21.1 (3.2)Greece 72.0 (4.0) 61.3 (5.7) 42.1 (5.8) 19.9 (1.7) 15.0 (2.2) 10.3 (2.0)Hungary 68.3 (6.5) 35.7 (6.6) 20.8 (4.9) 5.5 (0.5) 2.7 (0.6) 1.4 (0.5)Iceland 76.2 (5.7) 73.1 (6.0) 35.1 (6.1) 6.3 (0.9) 5.3 (0.9) 2.4 (0.6)Ireland 55.0 (5.9) 47.8 (5.7) 25.6 (5.0) 17.3 (1.0) 12.1 (1.8) 3.7 (1.3)Israel 59.4 (4.7) 55.4 (5.2) 17.5 (4.2) 45.9 (2.6) 37.9 (4.2) 11.2 (3.5)Italy 71.9 (2.3) 64.8 (2.7) 28.4 (3.2) 13.3 (0.5) 10.9 (0.7) 4.3 (0.7)Japan c c c c c c 1.1 (0.2) 0.4 (0.1) 0.4 (0.2)Korea c c c c c c 0.1 (0.1) 0.1 (0.1) 0.0 (0.0)Luxembourg 41.7 (0.8) 37.5 (0.8) 35.9 (0.8) 67.6 (1.2) 52.4 (1.1) 44.2 (1.1)Mexico 95.8 (1.2) 36.0 (3.6) 47.1 (5.5) 6.0 (0.4) 2.0 (0.3) 2.7 (0.4)Netherlands 70.2 (4.8) 62.4 (6.8) 57.5 (6.6) 33.7 (4.2) 25.2 (5.2) 25.6 (4.9)New Zealand 53.3 (3.3) 52.6 (3.3) 25.2 (3.5) 52.7 (1.4) 48.9 (2.0) 16.5 (2.9)Norway 63.8 (5.1) 60.5 (5.1) 31.4 (5.5) 17.2 (1.6) 14.3 (2.0) 5.9 (1.8)Poland c c c c c c 0.1 (0.1) 0.0 (0.0) 0.0 (0.0)Portugal 72.3 (3.4) 52.3 (6.8) 10.5 (2.7) 15.3 (1.0) 8.8 (1.7) 1.0 (0.5)Slovak Republic c c c c c c 2.0 (0.4) 0.9 (0.3) 0.9 (0.4)Slovenia 71.9 (2.5) 66.6 (3.1) 43.2 (2.7) 20.1 (1.2) 17.0 (1.2) 10.4 (0.9)Spain 66.2 (3.3) 54.1 (4.4) 22.3 (3.7) 25.2 (1.1) 17.4 (1.7) 6.2 (1.3)Sweden 66.0 (5.0) 62.9 (4.8) 41.6 (6.6) 30.6 (2.8) 26.7 (2.9) 14.8 (3.5)Switzerland 47.5 (4.0) 42.9 (4.0) 37.0 (3.8) 44.7 (1.5) 33.4 (3.7) 25.3 (3.1)Turkey c c c c c c 2.1 (0.5) 0.6 (0.2) 0.2 (0.1)United Kingdom 80.0 (2.7) 75.0 (4.2) 50.1 (6.7) 34.3 (2.8) 31.2 (3.4) 20.9 (3.8)United States 68.7 (4.2) 67.5 (4.8) 53.5 (6.4) 54.8 (2.2) 51.2 (3.5) 36.4 (4.8)OECD average 67.6 (0.8) 56.5 (1.0) 36.2 (1.0) 25.1 (0.3) 19.4 (0.4) 11.8 (0.4)
Part
ners Albania c c c c c c 1.3 (0.2) 0.5 (0.2) 0.2 (0.1)
Argentina 79.0 (5.0) 51.5 (9.7) 45.5 (9.3) 11.8 (1.5) 6.7 (2.0) 5.4 (1.5)Azerbaijan 83.9 (5.5) 37.0 (9.1) 28.1 (9.2) 8.6 (1.0) 3.4 (0.9) 2.7 (1.1)Brazil 100.0 (0.0) 21.2 (8.5) 26.4 (9.8) 3.0 (0.4) 0.6 (0.3) 0.8 (0.3)Bulgaria c c c c c c 2.0 (0.4) 1.6 (0.4) 0.5 (0.4)Colombia c c c c c c 1.3 (0.3) 0.3 (0.1) 0.5 (0.2)Croatia 55.1 (4.4) 28.7 (3.7) 23.6 (3.4) 23.8 (1.2) 7.5 (1.5) 5.1 (1.2)Dubai (UAE) 34.7 (0.4) 32.9 (0.3) 11.9 (0.4) 99.9 (0.1) 32.1 (0.6) 2.7 (0.1)Hong Kong-China 39.1 (4.6) 33.7 (4.2) 33.7 (3.8) 61.6 (1.7) 36.8 (5.3) 35.4 (5.0)Indonesia c c c c c c 1.2 (0.4) 1.1 (0.4) 0.3 (0.2)Jordan 57.6 (4.7) 35.0 (4.2) 13.3 (4.6) 32.8 (1.4) 12.1 (2.4) 3.7 (2.5)Kazakhstan 71.9 (4.7) 50.4 (6.7) 32.8 (7.0) 31.9 (3.2) 18.8 (3.8) 11.3 (3.0)Kyrgyzstan 95.3 (2.2) 48.4 (6.5) 41.0 (8.3) 6.8 (0.6) 3.4 (0.6) 2.9 (0.7)Latvia 83.8 (3.6) 43.3 (10.7) 39.5 (10.1) 16.2 (1.5) 7.2 (2.2) 6.6 (2.1)Liechtenstein 36.0 (5.3) 35.1 (4.9) 28.5 (4.4) c c c c c cLithuania 95.6 (1.8) 65.9 (7.4) 37.5 (10.4) 6.9 (0.9) 4.5 (0.8) 2.6 (0.9)Macao-China 30.1 (0.4) 23.2 (0.4) 28.1 (0.4) 84.9 (1.0) 13.7 (0.3) 47.5 (1.0)Montenegro 60.5 (3.1) 43.3 (2.8) 18.7 (2.1) 15.4 (1.2) 9.2 (0.9) 3.2 (0.5)Panama 90.9 (3.9) 65.0 (9.9) 17.0 (10.8) 11.3 (1.7) 8.1 (2.0) 0.3 (0.2)Peru c c c c c c 1.8 (0.3) 0.5 (0.2) 0.7 (0.3)Qatar 50.2 (0.5) 45.2 (0.5) 17.0 (0.5) 90.3 (0.6) 66.5 (0.6) 0.0 (0.0)Romania c c c c c c 1.4 (0.2) 0.6 (0.2) 0.5 (0.2)Russian Federation 51.3 (6.6) 38.3 (7.7) 29.7 (8.2) 25.0 (2.9) 13.7 (4.1) 10.0 (4.6)Serbia 58.5 (4.4) 28.3 (4.6) 19.9 (4.1) 22.0 (1.0) 7.5 (1.5) 4.6 (1.4)Shanghai-China c c c c c c 2.1 (0.3) 0.8 (0.2) 1.1 (0.3)Singapore 45.0 (1.9) 43.0 (1.6) 23.1 (1.3) 25.9 (1.3) 20.5 (1.1) 4.1 (0.4)Chinese Taipei c c c c c c 1.6 (0.3) 0.7 (0.3) 0.7 (0.3)Thailand m m m m m m 0.0 (0.0) 0.0 (0.0) 0.0 (0.0)Trinidad and Tobago 84.8 (3.7) 56.3 (5.4) 24.9 (5.0) 7.3 (0.8) 4.5 (0.6) 1.9 (0.5)Tunisia c c c c c c 1.3 (0.3) 0.6 (0.3) 0.3 (0.1)Uruguay c c c c c c 2.1 (0.3) 0.9 (0.3) 0.2 (0.1)
Source: PISA 2009 Database.
Please refer to the Reader’s Guide for information concerning the symbols replacing missing data.
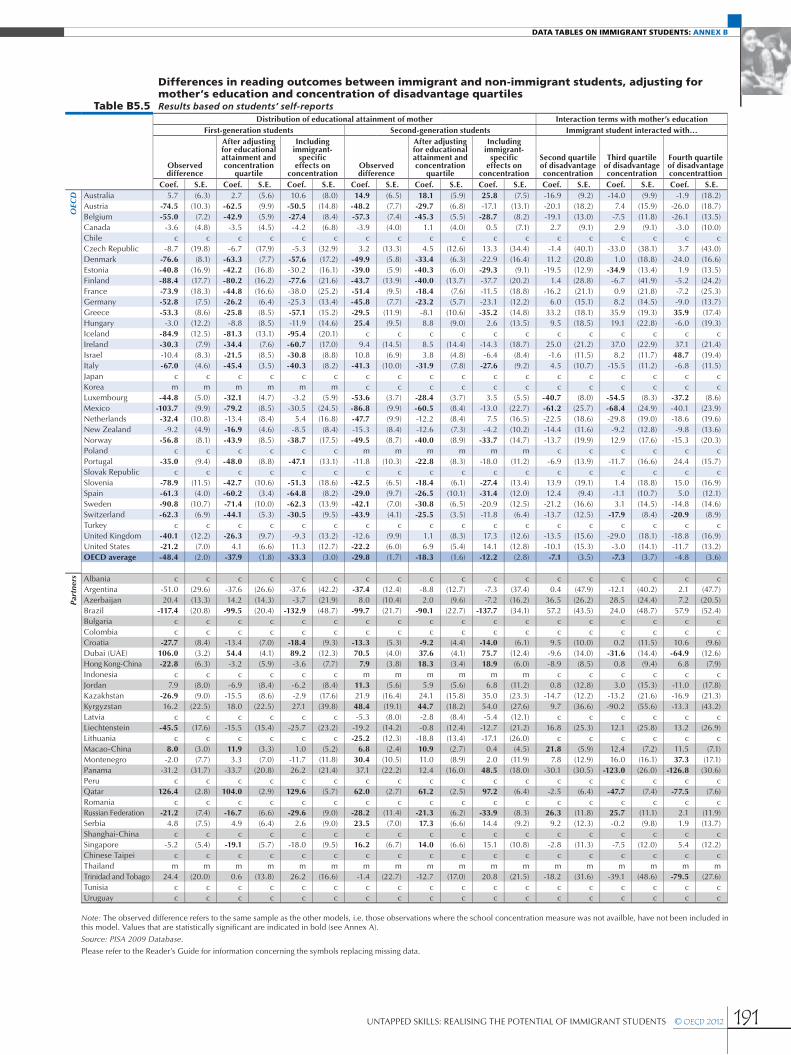
191UNTAPPED SKILLS: REALISING THE POTENTIAL OF IMMIGRANT STUDENTS © OECD 2012
DATA TABLES ON IMMIGRANT STUDENTS: ANNEX B
Table B5.5
Differences in reading outcomes between immigrant and non-immigrant students, adjusting for mother’s education and concentration of disadvantage quartilesResults based on students’ self-reports
Distribution of educational attainment of mother Interaction terms with mother’s educationFirst-generation students Second-generation students Immigrant student interacted with…
Observed difference
After adjusting for educational attainment and concentration
quartile
Including immigrant-
specific effects on
concentrationObserved difference
After adjusting for educational attainment and concentration
quartile
Including immigrant-
specific effects on
concentration
Second quartile of disadvantage concentration
Third quartile of disadvantage concentration
Fourth quartile of disadvantage concentrattion
Coef. S.E. Coef. S.E. Coef. S.E. Coef. S.E. Coef. S.E. Coef. S.E. Coef. S.E. Coef. S.E. Coef. S.E.
OEC
D Australia 5.7 (6.3) 2.7 (5.6) 10.6 (8.0) 14.9 (6.5) 18.1 (5.9) 25.8 (7.5) -16.9 (9.2) -14.0 (9.9) -1.9 (18.2)Austria -74.5 (10.3) -62.5 (9.9) -50.5 (14.8) -48.2 (7.7) -29.7 (6.8) -17.1 (13.1) -20.1 (18.2) 7.4 (15.9) -26.0 (18.7)Belgium -55.0 (7.2) -42.9 (5.9) -27.4 (8.4) -57.3 (7.4) -45.3 (5.5) -28.7 (8.2) -19.1 (13.0) -7.5 (11.8) -26.1 (13.5)Canada -3.6 (4.8) -3.5 (4.5) -4.2 (6.8) -3.9 (4.0) 1.1 (4.0) 0.5 (7.1) 2.7 (9.1) 2.9 (9.1) -3.0 (10.0)Chile c c c c c c c c c c c c c c c c c cCzech Republic -8.7 (19.8) -6.7 (17.9) -5.3 (32.9) 3.2 (13.3) 4.5 (12.6) 13.3 (34.4) -1.4 (40.1) -33.0 (38.1) 3.7 (43.0)Denmark -76.6 (8.1) -63.3 (7.7) -57.6 (17.2) -49.9 (5.8) -33.4 (6.3) -22.9 (16.4) 11.2 (20.8) 1.0 (18.8) -24.0 (16.6)Estonia -40.8 (16.9) -42.2 (16.8) -30.2 (16.1) -39.0 (5.9) -40.3 (6.0) -29.3 (9.1) -19.5 (12.9) -34.9 (13.4) 1.9 (13.5)Finland -88.4 (17.7) -80.2 (16.2) -77.6 (21.6) -43.7 (13.9) -40.0 (13.7) -37.7 (20.2) 1.4 (28.8) -6.7 (41.9) -5.2 (24.2)France -73.9 (18.3) -44.8 (16.6) -38.0 (25.2) -51.4 (9.5) -18.4 (7.6) -11.5 (18.8) -16.2 (21.1) 0.9 (21.8) -7.2 (25.3)Germany -52.8 (7.5) -26.2 (6.4) -25.3 (13.4) -45.8 (7.7) -23.2 (5.7) -23.1 (12.2) 6.0 (15.1) 8.2 (14.5) -9.0 (13.7)Greece -53.3 (8.6) -25.8 (8.5) -57.1 (15.2) -29.5 (11.9) -8.1 (10.6) -35.2 (14.8) 33.2 (18.1) 35.9 (19.3) 35.9 (17.4)Hungary -3.0 (12.2) -8.8 (8.5) -11.9 (14.6) 25.4 (9.5) 8.8 (9.0) 2.6 (13.5) 9.5 (18.5) 19.1 (22.8) -6.0 (19.3)Iceland -84.9 (12.5) -81.3 (13.1) -95.4 (20.1) c c c c c c c c c c c cIreland -30.3 (7.9) -34.4 (7.6) -60.7 (17.0) 9.4 (14.5) 8.5 (14.4) -14.3 (18.7) 25.0 (21.2) 37.0 (22.9) 37.1 (21.4)Israel -10.4 (8.3) -21.5 (8.5) -30.8 (8.8) 10.8 (6.9) 3.8 (4.8) -6.4 (8.4) -1.6 (11.5) 8.2 (11.7) 48.7 (19.4)Italy -67.0 (4.6) -45.4 (3.5) -40.3 (8.2) -41.3 (10.0) -31.9 (7.8) -27.6 (9.2) 4.5 (10.7) -15.5 (11.2) -6.8 (11.5)Japan c c c c c c c c c c c c c c c c c cKorea m m m m m m c c c c c c c c c c c cLuxembourg -44.8 (5.0) -32.1 (4.7) -3.2 (5.9) -53.6 (3.7) -28.4 (3.7) 3.5 (5.5) -40.7 (8.0) -54.5 (8.3) -37.2 (8.6)Mexico -103.7 (9.9) -79.2 (8.5) -30.5 (24.5) -86.8 (9.9) -60.5 (8.4) -13.0 (22.7) -61.2 (25.7) -68.4 (24.9) -40.1 (23.9)Netherlands -32.4 (10.8) -13.4 (8.4) 5.4 (16.8) -47.7 (9.9) -12.2 (8.4) 7.5 (16.5) -22.5 (18.6) -29.8 (19.0) -18.6 (19.6)New Zealand -9.2 (4.9) -16.9 (4.6) -8.5 (8.4) -15.3 (8.4) -12.6 (7.3) -4.2 (10.2) -14.4 (11.6) -9.2 (12.8) -9.8 (13.6)Norway -56.8 (8.1) -43.9 (8.5) -38.7 (17.5) -49.5 (8.7) -40.0 (8.9) -33.7 (14.7) -13.7 (19.9) 12.9 (17.6) -15.3 (20.3)Poland c c c c c c m m m m m m c c c c c cPortugal -35.0 (9.4) -48.0 (8.8) -47.1 (13.1) -11.8 (10.3) -22.8 (8.3) -18.0 (11.2) -6.9 (13.9) -11.7 (16.6) 24.4 (15.7)Slovak Republic c c c c c c c c c c c c c c c c c cSlovenia -78.9 (11.5) -42.7 (10.6) -51.3 (18.6) -42.5 (6.5) -18.4 (6.1) -27.4 (13.4) 13.9 (19.1) 1.4 (18.8) 15.0 (16.9)Spain -61.3 (4.0) -60.2 (3.4) -64.8 (8.2) -29.0 (9.7) -26.5 (10.1) -31.4 (12.0) 12.4 (9.4) -1.1 (10.7) 5.0 (12.1)Sweden -90.8 (10.7) -71.4 (10.0) -62.3 (13.9) -42.1 (7.0) -30.8 (6.5) -20.9 (12.5) -21.2 (16.6) 3.1 (14.5) -14.8 (14.6)Switzerland -62.3 (6.9) -44.1 (5.3) -30.5 (9.5) -43.9 (4.1) -25.5 (3.5) -11.8 (6.4) -13.7 (12.5) -17.9 (8.4) -20.9 (8.9)Turkey c c c c c c c c c c c c c c c c c cUnited Kingdom -40.1 (12.2) -26.3 (9.7) -9.3 (13.2) -12.6 (9.9) 1.1 (8.3) 17.3 (12.6) -13.5 (15.6) -29.0 (18.1) -18.8 (16.9)United States -21.2 (7.0) 4.1 (6.6) 11.3 (12.7) -22.2 (6.0) 6.9 (5.4) 14.1 (12.8) -10.1 (15.3) -3.0 (14.1) -11.7 (13.2)OECD average -48.4 (2.0) -37.9 (1.8) -33.3 (3.0) -29.8 (1.7) -18.3 (1.6) -12.2 (2.8) -7.1 (3.5) -7.3 (3.7) -4.8 (3.6)
Part
ners Albania c c c c c c c c c c c c c c c c c c
Argentina -51.0 (29.6) -37.6 (26.6) -37.6 (42.2) -37.4 (12.4) -8.8 (12.7) -7.3 (37.4) 0.4 (47.9) -12.1 (40.2) 2.1 (47.7)Azerbaijan 20.4 (13.3) 14.2 (14.3) -3.7 (21.9) 8.0 (10.4) 2.0 (9.6) -7.2 (16.2) 36.5 (26.2) 28.5 (24.4) 7.2 (20.5)Brazil -117.4 (20.8) -99.5 (20.4) -132.9 (48.7) -99.7 (21.7) -90.1 (22.7) -137.7 (34.1) 57.2 (43.5) 24.0 (48.7) 57.9 (52.4)Bulgaria c c c c c c c c c c c c c c c c c cColombia c c c c c c c c c c c c c c c c c cCroatia -27.7 (8.4) -13.4 (7.0) -18.4 (9.3) -13.3 (5.3) -9.2 (4.4) -14.0 (6.1) 9.5 (10.0) 0.2 (11.5) 10.6 (9.6)Dubai (UAE) 106.0 (3.2) 54.4 (4.1) 89.2 (12.3) 70.5 (4.0) 37.6 (4.1) 75.7 (12.4) -9.6 (14.0) -31.6 (14.4) -64.9 (12.6)Hong Kong-China -22.8 (6.3) -3.2 (5.9) -3.6 (7.7) 7.9 (3.8) 18.3 (3.4) 18.9 (6.0) -8.9 (8.5) 0.8 (9.4) 6.8 (7.9)Indonesia c c c c c c m m m m m m c c c c c cJordan 7.9 (8.0) -6.9 (8.4) -6.2 (8.4) 11.3 (5.6) 5.9 (5.6) 6.8 (11.2) 0.8 (12.8) 3.0 (15.3) -11.0 (17.8)Kazakhstan -26.9 (9.0) -15.5 (8.6) -2.9 (17.6) 21.9 (16.4) 24.1 (15.8) 35.0 (23.3) -14.7 (12.2) -13.2 (21.6) -16.9 (21.3)Kyrgyzstan 16.2 (22.5) 18.0 (22.5) 27.1 (39.8) 48.4 (19.1) 44.7 (18.2) 54.0 (27.6) 9.7 (36.6) -90.2 (55.6) -13.3 (43.2)Latvia c c c c c c -5.3 (8.0) -2.8 (8.4) -5.4 (12.1) c c c c c cLiechtenstein -45.5 (17.6) -15.5 (15.4) -25.7 (23.2) -19.2 (14.2) -0.8 (12.4) -12.7 (21.2) 16.8 (25.3) 12.1 (25.8) 13.2 (26.9)Lithuania c c c c c c -25.2 (12.3) -18.8 (13.4) -17.1 (26.0) c c c c c cMacao-China 8.0 (3.0) 11.9 (3.3) 1.0 (5.2) 6.8 (2.4) 10.9 (2.7) 0.4 (4.5) 21.8 (5.9) 12.4 (7.2) 11.5 (7.1)Montenegro -2.0 (7.7) 3.3 (7.0) -11.7 (11.8) 30.4 (10.5) 11.0 (8.9) 2.0 (11.9) 7.8 (12.9) 16.0 (16.1) 37.3 (17.1)Panama -31.2 (31.7) -33.7 (20.8) 26.2 (21.4) 37.1 (22.2) 12.4 (16.0) 48.5 (18.0) -30.1 (30.5) -123.0 (26.0) -126.8 (30.6)Peru c c c c c c c c c c c c c c c c c cQatar 126.4 (2.8) 104.0 (2.9) 129.6 (5.7) 62.0 (2.7) 61.2 (2.5) 97.2 (6.4) -2.5 (6.4) -47.7 (7.4) -77.5 (7.6)Romania c c c c c c c c c c c c c c c c c cRussian Federation -21.2 (7.4) -16.7 (6.6) -29.6 (9.0) -28.2 (11.4) -21.3 (6.2) -33.9 (8.3) 26.3 (11.8) 25.7 (11.1) 2.1 (11.9)Serbia 4.8 (7.5) 4.9 (6.4) 2.6 (9.0) 23.5 (7.0) 17.3 (6.6) 14.4 (9.2) 9.2 (12.3) -0.2 (9.8) 1.9 (13.7)Shanghai-China c c c c c c c c c c c c c c c c c cSingapore -5.2 (5.4) -19.1 (5.7) -18.0 (9.5) 16.2 (6.7) 14.0 (6.6) 15.1 (10.8) -2.8 (11.3) -7.5 (12.0) 5.4 (12.2)Chinese Taipei c c c c c c c c c c c c c c c c c cThailand m m m m m m m m m m m m m m m m m mTrinidad and Tobago 24.4 (20.0) 0.6 (13.8) 26.2 (16.6) -1.4 (22.7) -12.7 (17.0) 20.8 (21.5) -18.2 (31.6) -39.1 (48.6) -79.5 (27.6)Tunisia c c c c c c c c c c c c c c c c c cUruguay c c c c c c c c c c c c c c c c c c
Note: The observed difference refers to the same sample as the other models, i.e. those observations where the school concentration measure was not availble, have not been included in this model. Values that are statistically significant are indicated in bold (see Annex A).
Source: PISA 2009 Database.
Please refer to the Reader’s Guide for information concerning the symbols replacing missing data.

192 © OECD 2012 UNTAPPED SKILLS: REALISING THE POTENTIAL OF IMMIGRANT STUDENTS
ANNEX B: DATA TABLES ON IMMIGRANT STUDENTS
Table B5.6Correlations between reading outcomes and various measures of student concentration in schoolsResults based on students’ self-reports
Correlation between student performance in reading and concentration measures
Immigrant students Non-immigrant students
Proportion of immigrant students at the school
Proportion of children of immigrants not speaking
the test language at home
Proportion of students with low educated
mothersProportion of immigrant
students at the school
Proportion of children of immigrants not speaking
the test language at home
Proportion of students with low educated
mothers
Corr. S.E. Corr. S.E. Corr. S.E. Corr. S.E. Corr. S.E. Corr. S.E.
OEC
D Australia 0.15 (0.10) 0.13 (0.12) -0.24 (0.05) 0.11 (0.03) 0.09 (0.04) -0.20 (0.02)Austria -0.29 (0.08) -0.25 (0.08) -0.46 (0.06) -0.05 (0.04) -0.04 (0.05) -0.26 (0.05)Belgium -0.26 (0.07) -0.26 (0.07) -0.35 (0.05) -0.17 (0.03) -0.17 (0.03) -0.34 (0.03)Canada -0.03 (0.04) 0.01 (0.04) -0.15 (0.05) 0.12 (0.02) 0.11 (0.02) -0.12 (0.02)Chile c c c c c c c c c c -0.49 (0.02)Czech Republic 0.16 (0.08) 0.14 (0.07) -0.28 (0.10) 0.07 (0.05) 0.09 (0.05) -0.22 (0.04)Denmark -0.23 (0.04) -0.15 (0.05) -0.23 (0.04) -0.03 (0.03) -0.02 (0.03) -0.15 (0.03)Estonia 0.06 (0.08) -0.06 (0.09) -0.02 (0.06) -0.16 (0.03) -0.07 (0.03) -0.06 (0.03)Finland -0.30 (0.11) -0.29 (0.10) -0.13 (0.11) 0.03 (0.03) 0.02 (0.03) -0.09 (0.03)France -0.26 (0.10) -0.14 (0.13) -0.45 (0.07) -0.21 (0.05) -0.17 (0.06) -0.47 (0.06)Germany -0.35 (0.05) -0.22 (0.05) -0.58 (0.05) -0.23 (0.04) -0.21 (0.05) -0.52 (0.04)Greece -0.25 (0.05) -0.19 (0.04) -0.40 (0.09) -0.16 (0.04) -0.17 (0.03) -0.37 (0.04)Hungary 0.01 (0.17) -0.03 (0.09) -0.58 (0.08) 0.14 (0.06) 0.07 (0.03) -0.57 (0.02)Iceland -0.24 (0.14) 0.16 (0.11) -0.09 (0.10) -0.01 (0.02) -0.00 (0.02) -0.12 (0.02)Ireland -0.14 (0.07) -0.21 (0.07) -0.10 (0.08) 0.06 (0.04) 0.00 (0.04) -0.28 (0.03)Israel -0.11 (0.06) 0.00 (0.06) -0.38 (0.06) 0.10 (0.04) 0.10 (0.04) -0.49 (0.03)Italy -0.32 (0.03) -0.32 (0.04) -0.49 (0.03) -0.12 (0.03) -0.13 (0.02) -0.47 (0.02)Japan c c c c c c c c c c -0.41 (0.04)Korea c c c c c c c c c c -0.40 (0.04)Luxembourg 0.02 (0.02) -0.36 (0.02) -0.52 (0.01) -0.31 (0.02) -0.36 (0.02) -0.40 (0.02)Mexico -0.38 (0.10) -0.15 (0.05) -0.43 (0.11) -0.24 (0.03) -0.06 (0.04) -0.45 (0.02)Netherlands -0.27 (0.11) -0.22 (0.10) -0.34 (0.09) -0.17 (0.05) -0.12 (0.05) -0.35 (0.05)New Zealand -0.13 (0.04) -0.14 (0.04) -0.24 (0.05) 0.07 (0.03) 0.04 (0.03) -0.23 (0.04)Norway -0.14 (0.08) -0.13 (0.07) -0.19 (0.06) 0.03 (0.03) 0.02 (0.03) -0.06 (0.03)Poland c c c c c c c c c c -0.17 (0.03)Portugal -0.32 (0.08) -0.28 (0.06) -0.33 (0.07) -0.01 (0.03) -0.10 (0.04) -0.39 (0.03)Slovak Republic c c c c c c c c c c -0.33 (0.04)Slovenia -0.34 (0.06) -0.34 (0.07) -0.40 (0.05) -0.24 (0.01) -0.24 (0.01) -0.51 (0.01)Spain -0.05 (0.05) -0.18 (0.04) -0.23 (0.04) -0.03 (0.02) -0.06 (0.02) -0.31 (0.03)Sweden -0.23 (0.07) -0.18 (0.05) -0.22 (0.04) -0.03 (0.03) -0.04 (0.03) -0.15 (0.03)Switzerland -0.18 (0.07) -0.29 (0.03) -0.44 (0.03) -0.15 (0.03) -0.18 (0.04) -0.38 (0.03)Turkey c c c c c c c c c c -0.47 (0.03)United Kingdom -0.13 (0.09) -0.26 (0.08) -0.29 (0.06) -0.07 (0.03) -0.08 (0.04) -0.21 (0.03)United States -0.10 (0.04) -0.11 (0.04) -0.25 (0.05) -0.08 (0.03) -0.08 (0.04) -0.26 (0.03)OECD average -0.17 (0.02) -0.15 (0.01) -0.31 (0.01) -0.06 (0.01) -0.06 (0.01) -0.32 (0.01)
Part
ners Albania c c c c c c c c c c -0.33 (0.04)
Argentina 0.16 (0.17) 0.10 (0.14) -0.29 (0.13) -0.05 (0.04) 0.01 (0.08) -0.47 (0.03)Azerbaijan -0.13 (0.11) 0.18 (0.17) -0.24 (0.07) 0.17 (0.05) 0.16 (0.05) -0.19 (0.05)Brazil 0.02 (0.15) 0.07 (0.19) -0.15 (0.22) -0.15 (0.03) 0.01 (0.05) -0.43 (0.02)Bulgaria c c c c c c c c c c -0.39 (0.05)Colombia c c c c c c c c c c -0.44 (0.03)Croatia 0.03 (0.07) -0.04 (0.11) -0.34 (0.05) -0.09 (0.04) -0.06 (0.08) -0.37 (0.03)Dubai (UAE) 0.30 (0.02) -0.06 (0.02) -0.45 (0.01) 0.08 (0.03) 0.18 (0.03) -0.31 (0.02)Hong Kong-China -0.21 (0.05) -0.31 (0.06) -0.33 (0.04) -0.13 (0.06) -0.21 (0.05) -0.34 (0.04)Indonesia c c c c c c c c c c -0.40 (0.05)Jordan 0.00 (0.09) -0.19 (0.08) -0.19 (0.07) 0.13 (0.04) -0.04 (0.03) -0.17 (0.03)Kazakhstan 0.04 (0.21) 0.10 (0.09) -0.30 (0.08) 0.07 (0.04) 0.08 (0.07) -0.18 (0.05)Kyrgyzstan 0.09 (0.15) -0.17 (0.17) -0.32 (0.12) 0.27 (0.04) 0.08 (0.07) -0.14 (0.04)Latvia 0.07 (0.10) -0.09 (0.09) -0.20 (0.07) -0.05 (0.04) -0.04 (0.04) -0.15 (0.03)Liechtenstein -0.37 (0.10) -0.59 (0.08) -0.65 (0.07) -0.47 (0.04) -0.70 (0.03) -0.73 (0.03)Lithuania 0.21 (0.09) 0.29 (0.09) 0.19 (0.10) -0.07 (0.04) -0.03 (0.04) -0.17 (0.03)Macao-China 0.05 (0.02) -0.13 (0.02) -0.07 (0.02) -0.11 (0.02) -0.20 (0.02) -0.16 (0.02)Montenegro 0.03 (0.07) -0.19 (0.07) -0.36 (0.06) 0.10 (0.01) -0.14 (0.01) -0.45 (0.01)Panama -0.15 (0.25) -0.38 (0.23) -0.71 (0.05) 0.14 (0.08) 0.02 (0.08) -0.48 (0.06)Peru c c c c c c c c c c -0.58 (0.03)Qatar 0.44 (0.01) 0.33 (0.01) -0.43 (0.01) 0.21 (0.02) 0.10 (0.02) -0.10 (0.01)Romania c c c c c c c c c c -0.38 (0.06)Russian Federation -0.25 (0.13) -0.30 (0.10) -0.29 (0.09) -0.08 (0.05) -0.13 (0.05) -0.16 (0.03)Serbia 0.09 (0.09) 0.19 (0.10) -0.39 (0.05) 0.11 (0.04) 0.09 (0.07) -0.35 (0.04)Shanghai-China c c c c c c c c c c -0.46 (0.04)Singapore -0.03 (0.08) -0.12 (0.06) -0.38 (0.04) 0.16 (0.01) 0.08 (0.01) -0.41 (0.01)Chinese Taipei c c c c c c c c c c -0.38 (0.03)Thailand c c c c c c c c c c -0.41 (0.04)Trinidad and Tobago 0.24 (0.07) 0.32 (0.06) -0.59 (0.08) -0.00 (0.02) 0.08 (0.01) -0.44 (0.01)Tunisia c c c c c c c c c c -0.38 (0.04)Uruguay c c c c c c c c c c -0.52 (0.02)
Note: Values that are statistically significant are indicated in bold (see Annex A).
Source: PISA 2009 Database.
Please refer to the Reader’s Guide for information concerning the symbols replacing missing data.

193UNTAPPED SKILLS: REALISING THE POTENTIAL OF IMMIGRANT STUDENTS © OECD 2012
DATA TABLES ON IMMIGRANT STUDENTS: ANNEX B
Table B5.7Students by mother’s education in disadvantaged schoolsResults based on students’ self-reports
Students of low educated mothers in disadvantaged schools as a percentage of all students with low educated mothers
Students with highly educated mothers in disadvantaged schools as a percentage of all students with highly educated mothers
Immigrant students Non-immigrant students Immigrant students Non-immigrant students
% S.E. % S.E. % S.E. % S.E.
OEC
D Australia 66.0 (6.3) 52.6 (4.3) 22.7 (4.0) 16.6 (2.3)Austria 64.2 (5.7) 51.7 (6.4) 39.1 (7.3) 14.5 (2.8)Belgium 76.5 (3.7) 47.0 (4.3) 30.6 (4.5) 16.0 (2.2)Canada 66.4 (6.3) 58.3 (4.4) 23.8 (3.9) 18.6 (2.0)Chile c c 46.7 (5.2) c c 7.3 (1.4)Czech Republic c c 72.2 (4.7) 25.5 (9.5) 21.6 (3.5)Denmark 68.3 (5.0) 44.4 (5.1) 36.4 (4.6) 18.6 (3.0)Estonia c c 56.1 (5.0) 13.4 (5.4) 21.5 (2.8)Finland c c 46.6 (5.2) 28.6 (8.0) 21.7 (3.3)France 62.8 (6.4) 43.8 (5.3) 36.5 (7.4) 13.1 (2.4)Germany 58.5 (6.4) 45.8 (4.9) 31.3 (5.3) 13.0 (2.5)Greece 56.8 (10.7) 49.6 (4.6) 30.6 (4.3) 14.1 (2.7)Hungary c c 60.8 (4.6) c c 9.1 (1.3)Iceland c c 43.2 (1.9) c c 17.6 (0.8)Ireland 26.2 (8.8) 47.2 (5.6) 28.6 (6.0) 15.6 (3.2)Israel 47.2 (7.1) 80.6 (2.7) 7.3 (3.0) 12.3 (1.6)Italy 40.1 (5.4) 43.7 (2.1) 18.7 (4.2) 11.0 (1.0)Japan c c 66.0 (4.4) c c 14.9 (1.6)Korea m m 54.7 (5.0) c c 14.7 (2.8)Luxembourg 48.7 (1.8) 27.4 (2.2) 15.7 (1.8) 11.1 (0.9)Mexico 52.5 (5.9) 35.7 (2.2) 25.8 (7.3) 7.5 (0.7)Netherlands 71.4 (6.0) 40.6 (5.2) 41.7 (9.1) 15.3 (2.7)New Zealand 40.1 (6.0) 47.3 (4.7) 18.0 (3.0) 17.3 (2.7)Norway 57.8 (8.0) 53.6 (5.6) 18.1 (4.8) 21.4 (3.0)Poland c c 55.3 (5.3) m m 14.9 (3.1)Portugal 12.4 (3.8) 37.0 (4.2) 10.8 (3.3) 6.7 (1.2)Slovak Republic c c 83.1 (3.7) c c 18.4 (3.0)Slovenia 71.1 (4.5) 56.0 (2.6) 29.4 (6.6) 11.0 (0.8)Spain 30.8 (5.0) 42.3 (4.1) 15.3 (3.6) 10.7 (1.5)Sweden 59.7 (8.1) 45.0 (5.1) 37.5 (6.7) 19.6 (2.8)Switzerland 49.3 (4.3) 39.7 (4.5) 25.1 (3.9) 14.2 (2.2)Turkey c c 30.0 (3.8) c c 2.7 (0.9)United Kingdom 79.8 (8.1) 57.1 (4.6) 42.5 (7.0) 17.7 (2.3)United States 79.0 (4.2) 42.3 (6.4) 25.4 (5.7) 12.8 (2.5)OECD average 55.9 (1.3) 50.1 (0.8) 26.1 (1.1) 14.5 (0.4)
Part
ners Albania c c 42.1 (5.2) c c 12.5 (2.9)
Argentina 59.1 (10.1) 40.2 (5.3) 32.2 (9.8) 12.7 (2.1)Azerbaijan c c 58.5 (5.0) 16.9 (6.7) 19.9 (3.3)Brazil 49.1 (15.1) 37.6 (3.5) 0.9 (1.0) 9.6 (1.4)Bulgaria c c 70.8 (6.9) c c 12.1 (2.7)Colombia c c 37.9 (5.2) c c 10.5 (1.9)Croatia 44.7 (5.2) 57.0 (4.1) 16.0 (4.1) 16.8 (1.9)Dubai (UAE) 51.4 (2.5) 86.4 (1.5) 4.5 (0.4) 28.4 (2.1)Hong Kong-China 41.4 (4.3) 32.1 (4.4) 9.4 (3.5) 2.6 (1.0)Indonesia c c 35.5 (4.6) c c 4.6 (1.4)Jordan 24.1 (6.2) 45.3 (4.3) 7.5 (3.4) 14.7 (2.7)Kazakhstan 76.8 (10.1) 73.1 (6.0) 26.1 (6.5) 20.4 (3.2)Kyrgyzstan c c 68.9 (6.2) 31.0 (9.9) 21.8 (3.5)Latvia c c 75.3 (6.2) 32.1 (10.8) 19.0 (3.4)Liechtenstein 39.4 (6.7) 39.6 (7.2) c c 19.9 (4.7)Lithuania c c 74.9 (4.5) 43.2 (11.8) 17.1 (2.3)Macao-China 31.3 (0.6) 23.7 (1.2) 15.1 (2.3) 6.4 (1.5)Montenegro c c 57.5 (1.9) 12.7 (3.4) 16.3 (1.2)Panama 28.4 (17.6) 49.1 (7.8) 10.5 (8.4) 12.8 (3.4)Peru c c 44.6 (4.7) c c 7.0 (1.3)Qatar 49.6 (2.0) 64.3 (1.3) 7.0 (0.6) 14.8 (0.7)Romania c c 52.2 (5.0) c c 18.1 (3.3)Russian Federation c c 75.9 (6.1) 23.0 (5.6) 21.9 (3.6)Serbia 44.0 (12.9) 58.4 (5.2) 18.7 (4.1) 18.3 (2.6)Shanghai-China c c 44.7 (4.8) c c 8.6 (1.6)Singapore 46.2 (4.3) 42.8 (1.5) 18.4 (1.7) 15.1 (1.0)Chinese Taipei c c 42.9 (4.3) c c 16.3 (2.6)Thailand m m 34.4 (3.9) m m 2.7 (0.8)Trinidad and Tobago c c 43.9 (1.5) 14.3 (7.4) 13.3 (1.2)Tunisia c c 33.8 (4.3) c c 5.3 (1.3)Uruguay c c 35.8 (3.4) c c 6.2 (1.0)
Note: Disadvantaged schools are those in the country-specific fourth quartile of the concentration measure of students with low educated mothers at the school level (these are the 25% of school with the highest proportion of students with low educated mothers). Students with low educated mothers are those whose mother’s educational attainment is lower than upper secondary education. Students with highly educated mothers are those whose mother’s educational attainment is tertiary education.
Source: PISA 2009 Database.
Please refer to the Reader’s Guide for information concerning the symbols replacing missing data.

194 © OECD 2012 UNTAPPED SKILLS: REALISING THE POTENTIAL OF IMMIGRANT STUDENTS
ANNEX B: DATA TABLES ON IMMIGRANT STUDENTS
Table B5.8Students in disadvantaged schools from low occupation status familiesResults based on students’ self-reports
Students in disadvantaged schools from low occupation status familiesStudents in disadvantaged schools with tertiary-educated mothers from low
occupation status families
Immigrant students Non-immigrant students Immigrant students Non-immigrant students
% S.E. % S.E. % S.E. % S.E.
OEC
D Australia 34.8 (3.6) 28.4 (1.6) 15.5 (2.7) 15.1 (1.6)Austria 58.9 (4.0) 32.9 (3.6) 46.2 (7.9) 23.6 (4.3)Belgium 60.3 (3.1) 37.8 (2.3) 38.2 (5.5) 22.7 (2.2)Canada 39.8 (2.4) 25.5 (1.6) 25.1 (2.6) 16.4 (1.6)Chile c c 68.8 (1.6) m m 29.9 (4.3)Czech Republic c c 35.2 (2.6) c c 16.6 (3.5)Denmark 56.7 (2.7) 36.3 (2.8) 38.2 (5.7) 24.4 (2.8)Estonia 44.1 (7.9) 31.4 (1.8) c c 17.9 (2.3)Finland 35.9 (7.7) 30.3 (2.0) c c 21.8 (1.9)France 72.6 (3.1) 51.0 (3.1) 56.9 (8.2) 39.4 (4.9)Germany 63.0 (3.4) 35.2 (2.8) 36.6 (6.8) 29.1 (5.6)Greece 74.2 (3.8) 43.0 (3.7) c c 15.5 (4.6)Hungary c c 54.1 (2.1) c c 25.0 (3.9)Iceland c c 24.5 (1.6) c c 6.4 (1.6)Ireland 26.8 (6.6) 43.0 (2.1) 18.1 (8.2) 26.9 (3.1)Israel 58.2 (5.0) 43.8 (2.3) 8.3 (4.1) 20.5 (3.6)Italy 77.7 (3.3) 54.3 (1.0) 80.4 (6.5) 26.0 (2.6)Japan c c 39.7 (1.7) c c 28.7 (2.6)Korea m m 32.7 (2.2) m m 16.1 (3.8)Luxembourg 71.5 (2.0) 33.0 (2.4) 43.0 (6.6) 19.9 (4.2)Mexico 74.7 (3.7) 72.7 (1.0) c c 34.2 (2.6)Netherlands 69.7 (4.2) 30.7 (2.2) 61.2 (8.4) 20.8 (2.9)New Zealand 34.0 (2.7) 27.7 (2.1) 20.9 (4.9) 15.6 (3.1)Norway 40.9 (6.0) 15.3 (1.4) c c 10.4 (1.4)Poland m m 51.0 (2.8) m m 5.1 (2.1)Portugal 50.1 (6.7) 61.3 (2.1) c c 24.1 (4.6)Slovak Republic c c 44.5 (3.1) m m 22.5 (2.6)Slovenia 61.3 (5.1) 36.8 (1.5) c c 11.6 (2.4)Spain 67.7 (5.0) 59.9 (1.5) 48.1 (9.9) 26.4 (3.9)Sweden 52.5 (4.6) 33.7 (2.1) 42.1 (4.9) 26.3 (2.3)Switzerland 63.3 (2.6) 31.7 (2.1) 42.2 (5.9) 25.7 (4.5)Turkey c c 59.1 (2.2) m m c cUnited Kingdom 35.6 (7.4) 36.4 (2.5) 17.5 (3.5) 25.7 (2.6)United States 64.1 (2.8) 30.0 (1.9) 28.5 (4.9) 18.0 (2.2)OECD average 55.5 (0.9) 40.3 (0.4) 37.0 (1.5) 21.5 (0.6)
Part
ners Albania c c 58.5 (2.9) m m 37.0 (6.2)
Argentina 80.4 (4.8) 60.9 (2.3) c c 45.0 (3.9)Azerbaijan 44.8 (17.5) 42.2 (2.9) c c 31.1 (2.7)Brazil c c 68.4 (1.6) c c 41.5 (3.6)Bulgaria c c 55.5 (4.0) m m 29.8 (6.9)Colombia c c 69.3 (1.5) c c 39.1 (5.2)Croatia 60.9 (3.6) 45.3 (1.8) c c 25.5 (2.9)Dubai (UAE) 6.7 (1.5) 2.8 (0.7) 3.3 (1.4) 0.0 (0.0)Hong Kong-China 62.4 (2.5) 43.2 (2.2) c c c cIndonesia c c 85.4 (1.5) m m c cJordan 58.6 (7.6) 44.6 (2.7) c c 11.0 (2.7)Kazakhstan 46.9 (3.4) 41.8 (2.1) 34.9 (4.4) 32.7 (1.7)Kyrgyzstan c c 51.1 (3.3) c c 40.4 (3.1)Latvia 42.3 (10.5) 34.6 (2.1) 26.2 (12.3) 22.9 (2.9)Liechtenstein c c c c c c c cLithuania c c 39.8 (2.3) c c 20.5 (2.4)Macao-China 37.4 (1.4) 31.0 (2.3) 16.3 (6.0) c cMontenegro 49.0 (7.0) 45.9 (1.4) c c 19.1 (3.4)Panama c c 64.7 (3.4) c c 43.4 (4.0)Peru c c 81.9 (1.8) c c 71.3 (5.9)Qatar 10.2 (1.2) 7.3 (0.9) 7.6 (2.7) 1.3 (0.7)Romania c c 56.6 (2.5) c c 42.2 (4.3)Russian Federation 37.1 (6.5) 34.7 (2.7) 35.9 (7.2) 28.9 (2.3)Serbia 47.5 (4.6) 37.8 (1.7) 28.2 (8.3) 22.2 (2.6)Shanghai-China c c 46.0 (1.7) c c 27.0 (4.1)Singapore 25.4 (3.4) 30.1 (1.4) 3.3 (1.9) 9.0 (2.1)Chinese Taipei c c 48.7 (2.4) c c 28.3 (2.6)Thailand m m 86.3 (1.4) m m c cTrinidad and Tobago c c 50.3 (2.1) c c 28.5 (5.0)Tunisia c c 78.3 (2.3) m m c cUruguay c c 65.3 (1.8) c c 27.0 (4.8)
Note: Disadvantaged schools are those in the country-specific fourth quartile of the concentration measure of students with low educated mothers at the school level (these are the 25% of school with the highest proportion of students with low educated mothers). Students with low occupational status families are those with a HISEI lower than 40. HISEI is the highest international social and economic index.
Source: PISA 2009 Database.
Please refer to the Reader’s Guide for information concerning the symbols replacing missing data.

195UNTAPPED SKILLS: REALISING THE POTENTIAL OF IMMIGRANT STUDENTS © OECD 2012
DATA TABLES ON IMMIGRANT STUDENTS: ANNEX B
Table B5.9
Performance among students in the top or bottom school disadvantage quartiles and those with mothers with high or low education levels, all studentsResults based on students’ self-reports
Mean performance Difference in scores between
Students in the bottom quartile
of school disadvantage
(25% lowest % of students with low educated mothers)
Students in the second quartile
of school disadvantage
Students in the third quartile
of school disadvantage
Students in the top quartile of school
disadvantage (25% highest % of students with
low educated mothers)
Students with low educated mothers
Students with highly educated
mothers
Students in the bottom
and top school disadvantage
quartiles
Students with mothers having
high or low education
Mean score S.E.
Mean score S.E.
Mean score S.E.
Mean score S.E.
Mean score S.E.
Mean score S.E.
Score dif. S.E.
Score dif. S.E.
OEC
D Australia 544 (5.3) 523 (4.5) 506 (4.8) 489 (6.0) 471 (4.3) 541 (2.8) 55 (7.9) 70 (4.3)Austria 520 (7.3) 493 (9.5) 499 (8.8) 438 (10.3) 404 (6.6) 499 (4.0) 82 (13.6) 95 (7.1)Belgium 563 (7.9) 534 (6.1) 499 (6.3) 463 (6.4) 465 (3.9) 535 (2.5) 100 (10.8) 70 (4.5)Canada 544 (3.5) 530 (3.0) 527 (4.5) 512 (3.7) 491 (4.7) 537 (1.7) 31 (5.0) 46 (4.8)Chile 511 (5.5) 462 (5.7) 432 (5.1) 409 (5.6) 416 (3.4) 487 (3.6) 102 (7.6) 71 (4.4)Czech Republic 503 (6.4) 502 (5.7) 491 (8.7) 454 (7.3) 432 (7.4) 496 (4.9) 49 (9.7) 65 (7.9)Denmark 525 (5.1) 496 (6.0) 487 (4.8) 484 (4.5) 451 (3.7) 512 (2.5) 40 (6.7) 62 (4.1)Estonia 506 (5.1) 510 (7.1) 507 (5.4) 502 (3.9) 467 (6.6) 511 (3.4) 4 (6.7) 44 (7.0)Finland 546 (4.2) 537 (4.5) 536 (4.5) 523 (4.3) 496 (4.7) 547 (2.4) 23 (5.9) 50 (4.5)France 565 (11.7) 539 (8.1) 477 (9.2) 441 (11.0) 456 (4.6) 529 (4.4) 125 (17.7) 73 (6.4)Germany 571 (5.6) 543 (5.6) 518 (7.4) 453 (7.8) 448 (4.2) 529 (4.2) 118 (10.0) 81 (5.7)Greece 527 (4.4) 503 (7.4) 494 (6.5) 433 (11.7) 444 (6.2) 506 (3.9) 94 (12.4) 62 (5.5)Hungary 566 (5.2) 533 (6.2) 501 (6.1) 440 (6.6) 421 (6.0) 534 (4.6) 125 (8.3) 113 (7.4)Iceland 518 (3.0) 504 (2.9) 492 (3.3) 488 (3.2) 477 (3.2) 520 (2.2) 30 (4.4) 43 (4.1)Ireland 533 (5.5) 506 (6.1) 488 (8.5) 474 (6.8) 461 (4.0) 519 (3.3) 60 (8.7) 58 (4.2)Israel 536 (5.7) 514 (5.3) 474 (8.1) 395 (7.1) 401 (6.3) 516 (3.8) 141 (9.1) 115 (6.7)Italy 544 (3.3) 514 (3.7) 478 (4.5) 432 (4.5) 459 (2.6) 503 (2.4) 112 (5.6) 44 (3.2)Japan 561 (7.6) 553 (5.6) 519 (6.4) 456 (8.4) 483 (7.3) 542 (3.6) 106 (11.2) 59 (7.6)Korea 572 (5.0) 559 (4.7) 540 (6.4) 492 (7.7) 504 (7.2) 555 (4.9) 80 (9.3) 51 (7.2)Luxembourg 539 (2.0) 503 (2.1) 425 (2.7) 421 (2.3) 436 (2.6) 503 (2.7) 118 (3.1) 67 (3.6)Mexico 485 (3.6) 440 (3.9) 418 (3.1) 388 (4.3) 408 (1.9) 455 (2.4) 97 (5.5) 47 (2.3)Netherlands 551 (7.8) 535 (17.1) 498 (10.3) 458 (7.4) 479 (5.8) 526 (5.5) 93 (11.1) 47 (5.3)New Zealand 553 (5.5) 542 (6.7) 529 (4.7) 499 (6.9) 493 (4.0) 551 (3.2) 54 (9.1) 58 (4.5)Norway 508 (5.0) 511 (5.3) 502 (5.4) 495 (3.9) 465 (6.0) 516 (2.8) 13 (6.3) 51 (5.7)Poland 519 (5.4) 503 (6.1) 501 (4.7) 476 (4.2) 444 (5.1) 553 (3.9) 43 (7.1) 109 (6.4)Portugal 538 (5.7) 499 (3.7) 478 (6.7) 450 (6.1) 470 (3.2) 531 (4.5) 88 (8.7) 61 (4.8)Slovak Republic 514 (5.7) 510 (4.7) 474 (7.8) 447 (8.4) 384 (11.3) 503 (4.2) 66 (10.5) 119 (11.9)Slovenia 548 (1.9) 532 (2.5) 464 (1.9) 433 (2.0) 440 (3.8) 516 (2.7) 115 (2.8) 76 (4.7)Spain 518 (3.9) 490 (3.4) 471 (4.0) 450 (4.2) 460 (2.5) 509 (2.8) 68 (5.6) 49 (3.4)Sweden 526 (6.0) 497 (5.8) 486 (5.4) 476 (5.6) 447 (6.1) 513 (3.2) 50 (8.5) 66 (6.5)Switzerland 555 (8.0) 525 (7.5) 483 (4.8) 451 (3.8) 463 (3.9) 522 (3.5) 104 (9.2) 58 (4.7)Turkey 527 (7.3) 471 (8.1) 447 (5.7) 434 (4.7) 454 (3.2) 523 (7.5) 94 (8.5) 68 (7.3)United Kingdom 531 (5.5) 511 (4.4) 490 (6.4) 471 (6.5) 454 (5.4) 516 (2.7) 60 (9.2) 63 (6.3)United States 538 (8.5) 514 (5.4) 483 (7.0) 461 (4.7) 458 (4.3) 525 (4.8) 77 (9.7) 67 (5.8)OECD average 535 (1.0) 513 (1.1) 489 (1.1) 458 (1.1) 453 (0.9) 520 (0.6) 77 (1.5) 67 (1.0)
Part
ners Albania 431 (8.8) 410 (10.6) 375 (8.0) 355 (7.7) 363 (4.8) 400 (7.3) 76 (11.5) 37 (7.7)
Argentina 481 (8.4) 415 (10.5) 386 (7.7) 362 (9.6) 369 (4.8) 429 (5.6) 119 (12.3) 60 (6.4)Azerbaijan 392 (7.5) 366 (5.6) 343 (8.4) 342 (6.5) 348 (6.0) 377 (3.8) 50 (10.6) 29 (6.2)Brazil 486 (5.7) 412 (8.3) 402 (4.9) 389 (3.8) 393 (2.6) 437 (4.9) 97 (6.8) 44 (4.9)Bulgaria 489 (11.7) 480 (13.2) 420 (16.3) 374 (10.4) 342 (8.1) 469 (7.6) 116 (16.9) 126 (9.6)Colombia 469 (6.4) 425 (6.3) 381 (7.9) 387 (5.0) 390 (4.1) 444 (5.1) 82 (8.1) 54 (5.4)Croatia 529 (6.7) 475 (7.5) 463 (7.2) 435 (4.7) 433 (4.3) 491 (4.1) 94 (8.0) 57 (5.2)Dubai (UAE) 530 (2.4) 499 (2.6) 440 (2.0) 390 (2.1) 389 (3.2) 492 (1.8) 140 (3.0) 103 (3.8)Hong Kong-China 577 (5.4) 544 (8.4) 516 (6.8) 497 (6.2) 523 (2.8) 556 (5.7) 80 (8.4) 33 (6.3)Indonesia 442 (8.5) 408 (7.4) 389 (6.2) 374 (5.6) 390 (3.2) 437 (8.3) 68 (9.9) 46 (8.1)Jordan 432 (7.3) 408 (5.8) 402 (6.4) 388 (7.1) 388 (3.2) 425 (4.5) 44 (10.3) 37 (4.4)Kazakhstan 413 (6.9) 405 (6.5) 382 (7.6) 367 (6.5) 338 (9.2) 402 (3.2) 46 (10.4) 63 (9.6)Kyrgyzstan 329 (6.4) 333 (5.9) 306 (8.9) 298 (8.6) 270 (10.1) 331 (3.8) 31 (11.6) 61 (10.8)Latvia 504 (4.6) 504 (4.4) 498 (5.2) 475 (4.1) 457 (8.6) 499 (3.5) 29 (6.7) 43 (8.6)Liechtenstein c c c c c c c c 463 (8.3) 515 (7.5) c c 53 (11.4)Lithuania 485 (4.2) 485 (4.3) 486 (5.2) 443 (6.4) 424 (7.5) 491 (2.8) 42 (7.3) 66 (8.2)Macao-China 494 (1.7) 494 (1.7) 478 (1.8) 481 (1.6) 485 (1.2) 492 (3.8) 13 (2.0) 7 (4.1)Montenegro 471 (2.4) 427 (2.2) 379 (2.0) 360 (2.1) 361 (4.8) 430 (3.1) 111 (3.4) 69 (5.6)Panama 479 (10.2) 386 (9.0) 356 (6.8) 353 (12.2) 345 (5.8) 397 (9.2) 126 (14.2) 52 (9.6)Peru 456 (8.3) 399 (5.9) 358 (4.6) 315 (5.8) 330 (2.8) 419 (8.4) 141 (9.6) 89 (8.7)Qatar 442 (1.7) 378 (2.0) 335 (1.7) 333 (1.4) 339 (2.0) 390 (1.5) 108 (2.2) 52 (2.5)Romania 466 (8.1) 455 (10.5) 406 (10.5) 386 (11.2) 389 (6.4) 435 (5.6) 80 (14.9) 46 (7.5)Russian Federation 472 (5.4) 470 (4.7) 472 (5.9) 432 (7.1) 397 (12.3) 468 (3.2) 40 (7.7) 71 (12.0)Serbia 495 (5.3) 448 (8.2) 427 (5.5) 406 (6.9) 405 (6.3) 450 (3.0) 89 (8.4) 46 (6.1)Shanghai-China 608 (4.9) 568 (5.2) 541 (6.5) 510 (7.2) 532 (3.5) 582 (3.2) 98 (9.0) 50 (4.8)Singapore 587 (3.4) 530 (2.3) 498 (2.0) 488 (2.1) 484 (2.7) 555 (2.4) 99 (4.5) 71 (3.8)Chinese Taipei 543 (7.4) 510 (6.1) 474 (6.0) 454 (4.8) 470 (2.8) 519 (3.4) 88 (9.0) 50 (3.6)Thailand 473 (5.7) 422 (4.4) 409 (5.6) 399 (5.3) 410 (2.6) 473 (6.0) 75 (7.6) 63 (6.3)Trinidad and Tobago 501 (2.5) 429 (2.5) 390 (2.4) 369 (2.3) 401 (3.6) 436 (3.9) 132 (3.3) 35 (5.2)Tunisia 450 (7.0) 409 (9.9) 389 (7.6) 371 (6.3) 394 (2.6) 431 (8.0) 79 (10.1) 37 (7.8)Uruguay 500 (4.2) 450 (3.7) 410 (6.8) 365 (4.1) 398 (2.6) 483 (4.0) 134 (6.3) 85 (4.4)
Note: Disadvantage quartiles are defined at the country level ranking schools according to the proportion of students with low educated mothers. The highest disadvantage quartile is the one with the 25% of schools where the proportion of students with low educated mothers is highest. The opposite is true for the lowest disadvantage quartile. Low educated mothers are those with educational attainment lower than an upper-secondary education. Highly educated mothers are those with an tertiary level education (a university education). Values that are statistically significant are indicated in bold (see Annex A).
Source: PISA 2009 Database.
Please refer to the Reader’s Guide for information concerning the symbols replacing missing data.

196 © OECD 2012 UNTAPPED SKILLS: REALISING THE POTENTIAL OF IMMIGRANT STUDENTS
ANNEX B: DATA TABLES ON IMMIGRANT STUDENTS
Table B5.10a
Mean performance across mother’s educational attainment by quartile of most disadvantaged schools measured as the proportion of students with low educated mothersResults based on students’ self-reports
Least disadvantaged quartile (25% of schools with the lowest % of students with low educated mothers) in the country/economyAt best primary Lower secondary
Non-immigrant studentsSecond-generation
students First-generation students Non-immigrant studentsSecond-generation
students First-generation studentsMean score S.E. Mean score S.E. Mean score S.E. Mean score S.E. Mean score S.E. Mean score S.E.
OEC
D Australia m m c c c c c c c c c cAustria c c c c m m c c c c c cBelgium c c c c m m c c c c m mCanada m m m m m m m m m m m mChile c c m m m m 480 (14.5) c c m mCzech Republic m m m m m m m m m m m mDenmark c c m m c c c c c c c cEstonia m m m m m m m m m m m mFinland c c c c c c c c c c m mFrance c c c c m m c c c c c cGermany m m c c m m c c c c c cGreece c c m m c c 515 (14.8) m m m mHungary m m m m m m c c m m m mIceland c c m m m m 489 (17.0) m m m mIreland c c c c c c 492 (13.0) c c c cIsrael m m m m m m m m m m m mItaly 510 (13.4) c c c c 533 (5.2) c c c cJapan m m m m m m m m m m m mKorea c c m m m m c c m m m mLuxembourg c c c c c c 516 (13.0) c c c cMexico 464 (4.6) c c c c 476 (4.1) c c c cNetherlands c c c c c c c c c c c cNew Zealand c c m m c c c c c c c cNorway m m m m m m m m m m m mPoland m m m m m m c c m m m mPortugal 518 (7.1) c c c c 517 (7.2) c c c cSlovak Republic m m m m m m m m m m m mSlovenia m m m m m m c c m m m mSpain 479 (7.2) c c c c 504 (5.6) c c 424 (15.8)Sweden c c m m m m c c c c m mSwitzerland c c c c c c 543 (13.9) 535 (21.2) c cTurkey 521 (8.0) c c m m 513 (10.4) c c c cUnited Kingdom m m m m m m m m m m m mUnited States m m c c c c c c m m m mOECD average 498 (3.8) c c c c 507 (3.5) 535 (21.2) 424 (15.8)
Part
ners Albania c c m m m m 403 (9.8) m m m m
Argentina 455 (17.3) m m m m 474 (13.6) m m m mAzerbaijan c c m m m m c c m m m mBrazil 444 (6.7) c c c c 456 (6.9) m m c cBulgaria m m m m m m m m m m m mColombia 438 (8.9) c c m m 450 (7.9) m m m mCroatia m m m m m m c c c c c cDubai (UAE) m m m m m m m m c c c cHong Kong-China 590 (9.1) 595 (13.0) c c 580 (9.9) c c c cIndonesia 428 (8.7) m m c c 431 (9.6) m m m mJordan 385 (12.9) c c c c 421 (11.3) c c c cKazakhstan m m m m m m m m m m m mKyrgyzstan m m m m m m m m m m m mLatvia m m m m m m m m m m m mLiechtenstein m m m m m m c c m m c cLithuania m m m m m m m m m m m mMacao-China 493 (7.5) 492 (7.2) c c 490 (6.4) 493 (5.9) c cMontenegro c c m m m m c c m m c cPanama c c c c m m c c c c c cPeru 413 (12.0) m m m m 413 (12.2) m m m mQatar c c c c c c c c c c c cRomania c c m m m m c c m m m mRussian Federation m m m m m m m m m m m mSerbia c c m m m m c c c c c cShanghai-China c c m m c c 597 (9.0) c c m mSingapore 546 (19.7) c c c c c c c c c cChinese Taipei 509 (21.3) m m c c 527 (8.7) c c c cThailand 455 (7.9) m m m m 458 (10.3) m m m mTrinidad and Tobago 500 (12.4) c c c c c c c c c cTunisia 438 (8.6) c c m m 448 (6.6) m m m mUruguay 460 (6.6) m m m m 477 (6.9) c c c c
Note: At best primary is defined as MISCED = 0 or 1; Lower secondary is defined as MISCED = 2 , Upper secondary defined as MISCED = 3 or 4 and Tertiary defined as MISCED = 5 or 6.
Source: PISA 2009 Database.
Please refer to the Reader’s Guide for information concerning the symbols replacing missing data.
[Part 1/4]
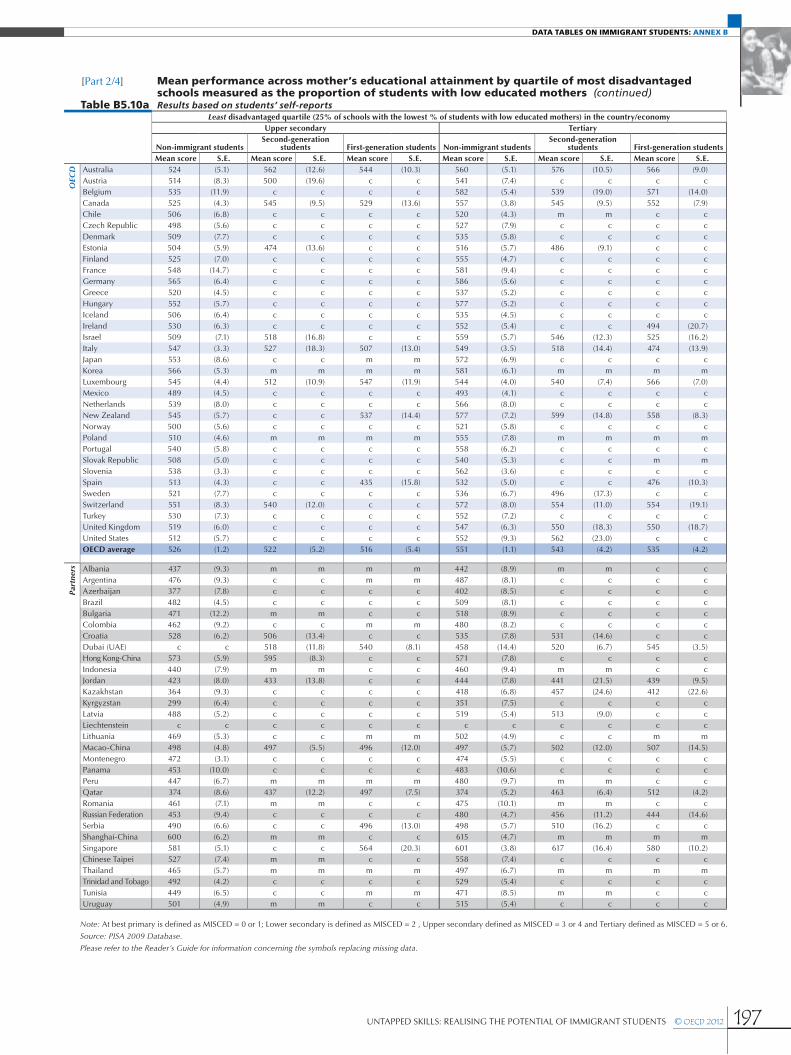
197UNTAPPED SKILLS: REALISING THE POTENTIAL OF IMMIGRANT STUDENTS © OECD 2012
DATA TABLES ON IMMIGRANT STUDENTS: ANNEX B
Table B5.10a
Mean performance across mother’s educational attainment by quartile of most disadvantaged schools measured as the proportion of students with low educated mothers (continued)Results based on students’ self-reports
Least disadvantaged quartile (25% of schools with the lowest % of students with low educated mothers) in the country/economyUpper secondary Tertiary
Non-immigrant studentsSecond-generation
students First-generation students Non-immigrant studentsSecond-generation
students First-generation studentsMean score S.E. Mean score S.E. Mean score S.E. Mean score S.E. Mean score S.E. Mean score S.E.
OEC
D Australia 524 (5.1) 562 (12.6) 544 (10.3) 560 (5.1) 576 (10.5) 566 (9.0)Austria 514 (8.3) 500 (19.6) c c 541 (7.4) c c c cBelgium 535 (11.9) c c c c 582 (5.4) 539 (19.0) 571 (14.0)Canada 525 (4.3) 545 (9.5) 529 (13.6) 557 (3.8) 545 (9.5) 552 (7.9)Chile 506 (6.8) c c c c 520 (4.3) m m c cCzech Republic 498 (5.6) c c c c 527 (7.9) c c c cDenmark 509 (7.7) c c c c 535 (5.8) c c c cEstonia 504 (5.9) 474 (13.6) c c 516 (5.7) 486 (9.1) c cFinland 525 (7.0) c c c c 555 (4.7) c c c cFrance 548 (14.7) c c c c 581 (9.4) c c c cGermany 565 (6.4) c c c c 586 (5.6) c c c cGreece 520 (4.5) c c c c 537 (5.2) c c c cHungary 552 (5.7) c c c c 577 (5.2) c c c cIceland 506 (6.4) c c c c 535 (4.5) c c c cIreland 530 (6.3) c c c c 552 (5.4) c c 494 (20.7)Israel 509 (7.1) 518 (16.8) c c 559 (5.7) 546 (12.3) 525 (16.2)Italy 547 (3.3) 527 (18.3) 507 (13.0) 549 (3.5) 518 (14.4) 474 (13.9)Japan 553 (8.6) c c m m 572 (6.9) c c c cKorea 566 (5.3) m m m m 581 (6.1) m m m mLuxembourg 545 (4.4) 512 (10.9) 547 (11.9) 544 (4.0) 540 (7.4) 566 (7.0)Mexico 489 (4.5) c c c c 493 (4.1) c c c cNetherlands 539 (8.0) c c c c 566 (8.0) c c c cNew Zealand 545 (5.7) c c 537 (14.4) 577 (7.2) 599 (14.8) 558 (8.3)Norway 500 (5.6) c c c c 521 (5.8) c c c cPoland 510 (4.6) m m m m 555 (7.8) m m m mPortugal 540 (5.8) c c c c 558 (6.2) c c c cSlovak Republic 508 (5.0) c c c c 540 (5.3) c c m mSlovenia 538 (3.3) c c c c 562 (3.6) c c c cSpain 513 (4.3) c c 435 (15.8) 532 (5.0) c c 476 (10.3)Sweden 521 (7.7) c c c c 536 (6.7) 496 (17.3) c cSwitzerland 551 (8.3) 540 (12.0) c c 572 (8.0) 554 (11.0) 554 (19.1)Turkey 530 (7.3) c c c c 552 (7.2) c c c cUnited Kingdom 519 (6.0) c c c c 547 (6.3) 550 (18.3) 550 (18.7)United States 512 (5.7) c c c c 552 (9.3) 562 (23.0) c cOECD average 526 (1.2) 522 (5.2) 516 (5.4) 551 (1.1) 543 (4.2) 535 (4.2)
Part
ners Albania 437 (9.3) m m m m 442 (8.9) m m c c
Argentina 476 (9.3) c c m m 487 (8.1) c c c cAzerbaijan 377 (7.8) c c c c 402 (8.5) c c c cBrazil 482 (4.5) c c c c 509 (8.1) c c c cBulgaria 471 (12.2) m m c c 518 (8.9) c c c cColombia 462 (9.2) c c m m 480 (8.2) c c c cCroatia 528 (6.2) 506 (13.4) c c 535 (7.8) 531 (14.6) c cDubai (UAE) c c 518 (11.8) 540 (8.1) 458 (14.4) 520 (6.7) 545 (3.5)Hong Kong-China 573 (5.9) 595 (8.3) c c 571 (7.8) c c c cIndonesia 440 (7.9) m m c c 460 (9.4) m m c cJordan 423 (8.0) 433 (13.8) c c 444 (7.8) 441 (21.5) 439 (9.5)Kazakhstan 364 (9.3) c c c c 418 (6.8) 457 (24.6) 412 (22.6)Kyrgyzstan 299 (6.4) c c c c 351 (7.5) c c c cLatvia 488 (5.2) c c c c 519 (5.4) 513 (9.0) c cLiechtenstein c c c c c c c c c c c cLithuania 469 (5.3) c c m m 502 (4.9) c c m mMacao-China 498 (4.8) 497 (5.5) 496 (12.0) 497 (5.7) 502 (12.0) 507 (14.5)Montenegro 472 (3.1) c c c c 474 (5.5) c c c cPanama 453 (10.0) c c c c 483 (10.6) c c c cPeru 447 (6.7) m m m m 480 (9.7) m m c cQatar 374 (8.6) 437 (12.2) 497 (7.5) 374 (5.2) 463 (6.4) 512 (4.2)Romania 461 (7.1) m m c c 475 (10.1) m m c cRussian Federation 453 (9.4) c c c c 480 (4.7) 456 (11.2) 444 (14.6)Serbia 490 (6.6) c c 496 (13.0) 498 (5.7) 510 (16.2) c cShanghai-China 600 (6.2) m m c c 615 (4.7) m m m mSingapore 581 (5.1) c c 564 (20.3) 601 (3.8) 617 (16.4) 580 (10.2)Chinese Taipei 527 (7.4) m m c c 558 (7.4) c c c cThailand 465 (5.7) m m m m 497 (6.7) m m m mTrinidad and Tobago 492 (4.2) c c c c 529 (5.4) c c c cTunisia 449 (6.5) c c m m 471 (8.5) m m c cUruguay 501 (4.9) m m c c 515 (5.4) c c c c
Note: At best primary is defined as MISCED = 0 or 1; Lower secondary is defined as MISCED = 2 , Upper secondary defined as MISCED = 3 or 4 and Tertiary defined as MISCED = 5 or 6.
Source: PISA 2009 Database.
Please refer to the Reader’s Guide for information concerning the symbols replacing missing data.
[Part 2/4]
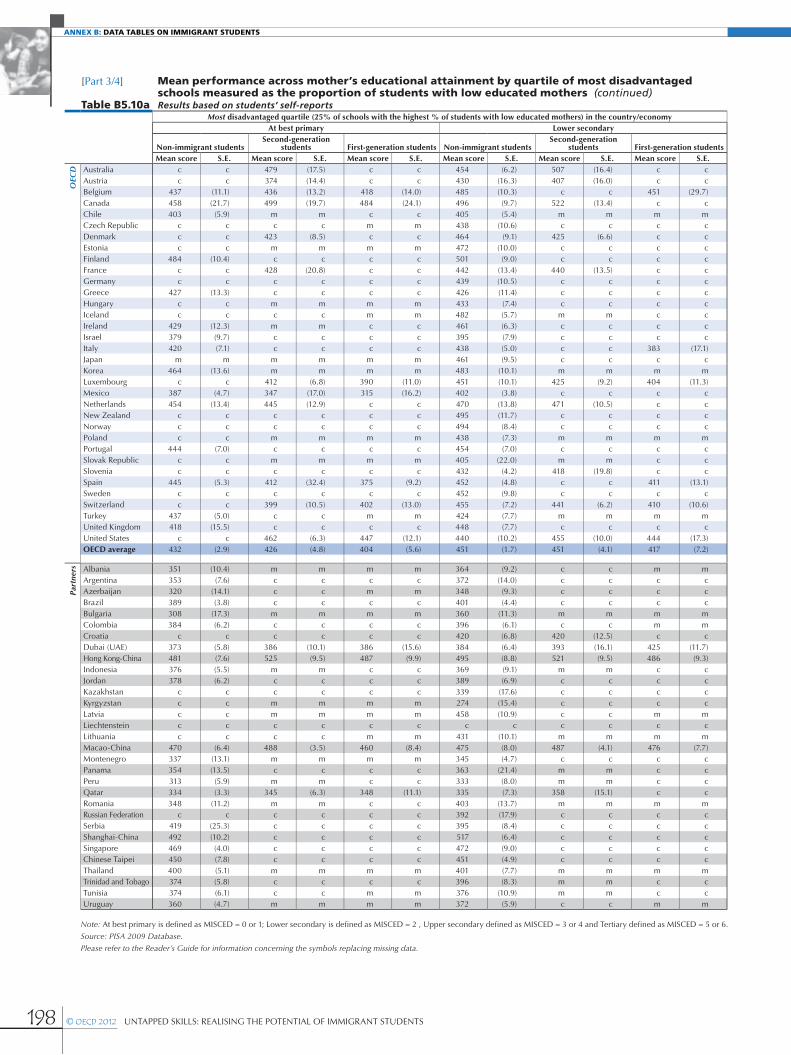
198 © OECD 2012 UNTAPPED SKILLS: REALISING THE POTENTIAL OF IMMIGRANT STUDENTS
ANNEX B: DATA TABLES ON IMMIGRANT STUDENTS
Table B5.10a
Mean performance across mother’s educational attainment by quartile of most disadvantaged schools measured as the proportion of students with low educated mothers (continued)Results based on students’ self-reports
Most disadvantaged quartile (25% of schools with the highest % of students with low educated mothers) in the country/economyAt best primary Lower secondary
Non-immigrant studentsSecond-generation
students First-generation students Non-immigrant studentsSecond-generation
students First-generation studentsMean score S.E. Mean score S.E. Mean score S.E. Mean score S.E. Mean score S.E. Mean score S.E.
OEC
D Australia c c 479 (17.5) c c 454 (6.2) 507 (16.4) c cAustria c c 374 (14.4) c c 430 (16.3) 407 (16.0) c cBelgium 437 (11.1) 436 (13.2) 418 (14.0) 485 (10.3) c c 451 (29.7)Canada 458 (21.7) 499 (19.7) 484 (24.1) 496 (9.7) 522 (13.4) c cChile 403 (5.9) m m c c 405 (5.4) m m m mCzech Republic c c c c m m 438 (10.6) c c c cDenmark c c 423 (8.5) c c 464 (9.1) 425 (6.6) c cEstonia c c m m m m 472 (10.0) c c c cFinland 484 (10.4) c c c c 501 (9.0) c c c cFrance c c 428 (20.8) c c 442 (13.4) 440 (13.5) c cGermany c c c c c c 439 (10.5) c c c cGreece 427 (13.3) c c c c 426 (11.4) c c c cHungary c c m m m m 433 (7.4) c c c cIceland c c c c m m 482 (5.7) m m c cIreland 429 (12.3) m m c c 461 (6.3) c c c cIsrael 379 (9.7) c c c c 395 (7.9) c c c cItaly 420 (7.1) c c c c 438 (5.0) c c 383 (17.1)Japan m m m m m m 461 (9.5) c c c cKorea 464 (13.6) m m m m 483 (10.1) m m m mLuxembourg c c 412 (6.8) 390 (11.0) 451 (10.1) 425 (9.2) 404 (11.3)Mexico 387 (4.7) 347 (17.0) 315 (16.2) 402 (3.8) c c c cNetherlands 454 (13.4) 445 (12.9) c c 470 (13.8) 471 (10.5) c cNew Zealand c c c c c c 495 (11.7) c c c cNorway c c c c c c 494 (8.4) c c c cPoland c c m m m m 438 (7.3) m m m mPortugal 444 (7.0) c c c c 454 (7.0) c c c cSlovak Republic c c m m m m 405 (22.0) m m c cSlovenia c c c c c c 432 (4.2) 418 (19.8) c cSpain 445 (5.3) 412 (32.4) 375 (9.2) 452 (4.8) c c 411 (13.1)Sweden c c c c c c 452 (9.8) c c c cSwitzerland c c 399 (10.5) 402 (13.0) 455 (7.2) 441 (6.2) 410 (10.6)Turkey 437 (5.0) c c m m 424 (7.7) m m m mUnited Kingdom 418 (15.5) c c c c 448 (7.7) c c c cUnited States c c 462 (6.3) 447 (12.1) 440 (10.2) 455 (10.0) 444 (17.3)OECD average 432 (2.9) 426 (4.8) 404 (5.6) 451 (1.7) 451 (4.1) 417 (7.2)
Part
ners Albania 351 (10.4) m m m m 364 (9.2) c c m m
Argentina 353 (7.6) c c c c 372 (14.0) c c c cAzerbaijan 320 (14.1) c c m m 348 (9.3) c c c cBrazil 389 (3.8) c c c c 401 (4.4) c c c cBulgaria 308 (17.3) m m m m 360 (11.3) m m m mColombia 384 (6.2) c c c c 396 (6.1) c c m mCroatia c c c c c c 420 (6.8) 420 (12.5) c cDubai (UAE) 373 (5.8) 386 (10.1) 386 (15.6) 384 (6.4) 393 (16.1) 425 (11.7)Hong Kong-China 481 (7.6) 525 (9.5) 487 (9.9) 495 (8.8) 521 (9.5) 486 (9.3)Indonesia 376 (5.5) m m c c 369 (9.1) m m c cJordan 378 (6.2) c c c c 389 (6.9) c c c cKazakhstan c c c c c c 339 (17.6) c c c cKyrgyzstan c c m m m m 274 (15.4) c c c cLatvia c c m m m m 458 (10.9) c c m mLiechtenstein c c c c c c c c c c c cLithuania c c c c m m 431 (10.1) m m m mMacao-China 470 (6.4) 488 (3.5) 460 (8.4) 475 (8.0) 487 (4.1) 476 (7.7)Montenegro 337 (13.1) m m m m 345 (4.7) c c c cPanama 354 (13.5) c c c c 363 (21.4) m m c cPeru 313 (5.9) m m c c 333 (8.0) m m c cQatar 334 (3.3) 345 (6.3) 348 (11.1) 335 (7.3) 358 (15.1) c cRomania 348 (11.2) m m c c 403 (13.7) m m m mRussian Federation c c c c c c 392 (17.9) c c c cSerbia 419 (25.3) c c c c 395 (8.4) c c c cShanghai-China 492 (10.2) c c c c 517 (6.4) c c c cSingapore 469 (4.0) c c c c 472 (9.0) c c c cChinese Taipei 450 (7.8) c c c c 451 (4.9) c c c cThailand 400 (5.1) m m m m 401 (7.7) m m m mTrinidad and Tobago 374 (5.8) c c c c 396 (8.3) m m c cTunisia 374 (6.1) c c m m 376 (10.9) m m c cUruguay 360 (4.7) m m m m 372 (5.9) c c m m
Note: At best primary is defined as MISCED = 0 or 1; Lower secondary is defined as MISCED = 2 , Upper secondary defined as MISCED = 3 or 4 and Tertiary defined as MISCED = 5 or 6.
Source: PISA 2009 Database.
Please refer to the Reader’s Guide for information concerning the symbols replacing missing data.
[Part 3/4]

199UNTAPPED SKILLS: REALISING THE POTENTIAL OF IMMIGRANT STUDENTS © OECD 2012
DATA TABLES ON IMMIGRANT STUDENTS: ANNEX B
Table B5.10a
Mean performance across mother’s educational attainment by quartile of most disadvantaged schools measured as the proportion of students with low educated mothers (continued)Results based on students’ self-reportsMean performance across mother’s educational attainment by quartiles of school disadvantaged measured as the proportion of students with low educated
mothers in the schoolMost disadvantaged quartile (25% of schools with the highest % of students with low educated mothers) in the country/economy
Upper secondary Tertiary
Non-immigrant studentsSecond-generation
students First-generation students Non-immigrant studentsSecond-generation
students First-generation studentsMean score S.E. Mean score S.E. Mean score S.E. Mean score S.E. Mean score S.E. Mean score S.E.
OEC
D Australia 487 (4.7) 502 (12.3) 499 (19.0) 511 (6.5) 549 (28.4) 517 (20.7)Austria 456 (11.0) 421 (15.2) 354 (14.3) 463 (18.2) 455 (14.2) c cBelgium 479 (6.6) 429 (15.3) 442 (12.2) 491 (8.0) 431 (17.4) 448 (14.6)Canada 515 (4.2) 500 (11.7) 484 (19.0) 525 (4.0) 528 (10.4) 514 (8.8)Chile 425 (6.4) m m m m 421 (11.9) m m m mCzech Republic 457 (6.7) c c c c 456 (11.7) c c c cDenmark 494 (5.3) 438 (8.5) c c 511 (5.9) 448 (15.9) 435 (17.2)Estonia 501 (3.3) c c c c 516 (5.4) c c c cFinland 513 (6.3) c c c c 540 (5.1) c c c cFrance 461 (8.9) 448 (26.1) c c 475 (17.4) 392 (26.2) c cGermany 478 (6.7) 443 (15.9) c c 473 (15.9) c c c cGreece 438 (14.1) c c 410 (18.1) 459 (15.6) c c c cHungary 448 (6.6) c c c c 438 (10.7) c c c cIceland 488 (6.2) m m c c 509 (6.0) c c c cIreland 487 (9.0) c c c c 499 (8.5) c c 486 (17.8)Israel 408 (7.9) c c c c 405 (10.7) c c c cItaly 443 (5.1) c c 388 (11.3) 426 (7.0) c c 389 (14.0)Japan 457 (9.3) m m c c 462 (8.8) c c m mKorea 498 (7.7) m m m m 500 (9.6) m m m mLuxembourg 461 (7.0) 423 (13.4) 403 (13.3) 450 (7.9) 412 (17.0) 396 (15.5)Mexico 413 (5.8) c c c c 397 (5.4) c c c cNetherlands 466 (8.1) 463 (14.9) c c 466 (9.1) 440 (17.9) c cNew Zealand 510 (8.2) 495 (17.6) 474 (15.3) 526 (10.0) c c 529 (14.0)Norway 496 (5.8) c c c c 511 (3.6) c c c cPoland 481 (4.0) m m m m 528 (7.5) m m m mPortugal 473 (7.5) c c c c 474 (13.5) c c c cSlovak Republic 453 (7.6) c c c c 459 (9.6) m m m mSlovenia 439 (2.5) 433 (9.9) c c 436 (6.1) c c c cSpain 466 (5.4) c c 398 (17.2) 481 (5.6) c c 422 (18.4)Sweden 496 (7.6) c c c c 504 (6.0) 464 (15.9) c cSwitzerland 482 (4.4) 436 (12.0) 415 (10.0) 471 (7.9) 432 (8.5) 428 (21.8)Turkey 455 (11.4) m m m m c c m m m mUnited Kingdom 481 (5.0) 494 (18.5) 431 (17.8) 497 (8.1) 471 (22.5) 470 (23.8)United States 467 (8.1) 453 (8.1) 453 (12.4) 475 (7.0) 487 (12.1) c cOECD average 470 (1.2) 455 (4.0) 429 (4.4) 477 (1.7) 459 (5.2) 457 (5.3)
Part
ners Albania 362 (9.3) c c m m 344 (13.6) m m m m
Argentina 368 (11.9) c c c c 387 (10.3) c c c cAzerbaijan 339 (7.9) c c c c 352 (6.1) c c c cBrazil 406 (8.8) m m c c 386 (9.8) c c m mBulgaria 387 (9.5) c c c c 383 (14.9) c c m mColombia 397 (8.1) c c m m 401 (8.3) m m c cCroatia 443 (4.8) c c c c 446 (7.0) c c c cDubai (UAE) 394 (5.7) 398 (9.0) 420 (15.9) 400 (8.6) 419 (12.6) 431 (12.4)Hong Kong-China 499 (8.7) 519 (11.9) 491 (12.6) c c c c c cIndonesia 379 (11.7) m m m m c c m m m mJordan 401 (7.2) c c c c 414 (14.0) c c c cKazakhstan 346 (8.5) c c c c 379 (5.8) 392 (28.5) 350 (10.0)Kyrgyzstan 279 (7.7) c c c c 319 (10.2) c c c cLatvia 470 (4.6) 451 (13.1) c c 485 (6.1) c c c cLiechtenstein c c m m c c c c c c c cLithuania 439 (6.4) c c c c 461 (7.2) c c c cMacao-China 481 (11.9) 486 (5.7) 500 (9.9) c c c c c cMontenegro 365 (3.4) c c 406 (14.3) 378 (7.1) c c c cPanama 381 (15.3) c c c c 367 (8.8) c c c cPeru 335 (7.6) c c c c 307 (13.8) m m c cQatar 329 (3.6) 368 (6.3) 386 (12.1) 316 (5.5) 342 (10.6) 388 (12.2)Romania 395 (11.0) c c m m 380 (12.2) c c c cRussian Federation 402 (10.4) c c c c 451 (6.5) 410 (17.0) 421 (15.2)Serbia 418 (6.9) c c c c 404 (8.1) c c c cShanghai-China 519 (8.0) m m c c 504 (10.6) m m c cSingapore 501 (3.8) c c c c 511 (7.3) c c 495 (13.4)Chinese Taipei 452 (6.8) c c m m 472 (6.4) c c m mThailand 391 (8.2) m m m m c c m m m mTrinidad and Tobago 382 (4.6) c c c c 345 (10.8) c c c cTunisia 351 (10.4) m m m m c c m m m mUruguay 378 (12.6) c c m m 379 (11.2) m m c c
Note: At best primary is defined as MISCED = 0 or 1; Lower secondary is defined as MISCED = 2 , Upper secondary defined as MISCED = 3 or 4 and Tertiary defined as MISCED = 5 or 6.
Source: PISA 2009 Database.
Please refer to the Reader’s Guide for information concerning the symbols replacing missing data.
[Part 4/4]

200 © OECD 2012 UNTAPPED SKILLS: REALISING THE POTENTIAL OF IMMIGRANT STUDENTS
ANNEX B: DATA TABLES ON IMMIGRANT STUDENTS
Table B5.10b
Mean performance across mother’s educational attainment by quartile of least disadvantaged schools measured as the proportion of students with low educated mothersResults based on students’ self-reports
Least disadvantaged quartile (25% of schools with the lowest % of students with low educated mothers) in the country/economy
At best primary Lower secondary Upper secondary Tertiary
Non-immigrant students
Second-generation students
First-generation students
Non-immigrant students
Second-generation students
First-generation students
Non-immigrant students
Second-generation students
First-generation students
Non-immigrant students
Second-generation students
First-generation students
Mean score S.E.
Mean score S.E.
Mean score S.E.
Mean score S.E.
Mean score S.E.
Mean score S.E.
Mean score S.E.
Mean score S.E.
Mean score S.E.
Mean score S.E.
Mean score S.E.
Mean score S.E.
Settlement 548 (4.6) c c c c 550 (21.6) c c c c 541 (24.0) 551 (6.6) 537 (7.1) 569 (16.9) 569 (23.3) 560 (6.8)
Germanic c c 515 (41.1) c c 531 (30.8) 501 (49.3) c c 541 (25.4) 519 (22.6) 526 (59.4) 560 (35.5) 547 (21.6) 561 (12.7)
Franco-Dutch c c c c c c 543 (14.3) c c c c 541 (6.5) 545 (6.6) c c 577 (2.9) 566 (16.8) 558 (10.0)
Nordic c c m m c c c c c c c c 519 (13.0) 512 (10.4) c c 537 (12.5) 505 (14.2) 489 (16.7)
Former Soviet Union m m m m m m m m m m m m 474 (61.1) 452 (87.4) c c 475 (49.6) 473 (33.0) 440 (57.6)
New migration 493 (34.9) c c c c 515 (20.1) c c 443 (26.4) 533 (5.9) 543 (37.5) 458 (21.8) 543 (8.9) 496 (19.3) 485 (14.5)
Anglo-American m m c c c c c c m m m m 516 (4.9) 533 (21.7) c c 550 (3.7) 558 (8.5) 573 (32.5)
Mixed group 485 (25.9) c c c c 490 (12.3) c c c c 494 (13.8) 457 (6.3) 444 (4.7) 505 (18.0) 459 (6.1) 454 (7.0)
Former Yugoslavia c c m m m m 484 (29.2) c c c c 494 (23.5) 495 (38.0) 480 (34.9) 506 (23.7) 517 (10.4) 482 (47.6)
China group 523 (85.6) 520 (91.7) c c 520 (79.8) 507 (80.3) 530 (68.8) 553 (62.2) 536 (85.7) 527 (67.1) 545 (62.1) 520 (53.0) 534 (69.4)
Table B5.10b
Mean performance across mother’s educational attainment by quartile of least disadvantaged schools measured as the proportion of students with low educated mothers in the school (continued)Results based on students’ self-reports
Most disadvantaged quartile (25% of schools with the highest % of students with low educated mothers) in the country/economy
At best primary Lower secondary Upper secondary Tertiary
Non-immigrant students
Second-generation students
First-generation students
Non-immigrant students
Second-generation students
First-generation students
Non-immigrant students
Second-generation students
First-generation students
Non-immigrant students
Second-generation students
First-generation students
Mean score S.E.
Mean score S.E.
Mean score S.E.
Mean score S.E.
Mean score S.E.
Mean score S.E.
Mean score S.E.
Mean score S.E.
Mean score S.E.
Mean score S.E.
Mean score S.E.
Mean score S.E.
Settlement 442 (20.6) 462 (19.6) 445 (20.3) 456 (11.5) 500 (23.7) 472 (8.1) 482 (9.8) 492 (6.5) 481 (11.6) 499 (15.7) 528 (12.1) 512 (3.9)
Germanic 417 (53.7) 407 (12.9) 393 (16.8) 446 (11.1) 425 (15.3) 401 (7.4) 467 (13.3) 428 (18.2) 404 (57.9) 464 (19.4) 432 (22.4) 414 (48.6)
Franco-Dutch 431 (34.9) 439 (6.8) 411 (41.8) 458 (22.6) 452 (17.6) 441 (16.5) 469 (8.2) 448 (7.9) 439 (6.8) 479 (6.7) 422 (26.2) 447 (11.0)
Nordic 418 (11.2) 418 (9.6) 370 (19.1) 454 (15.0) 417 (8.6) 433 (8.8) 473 (31.7) 446 (15.4) 403 (18.3) 501 (19.4) 452 (24.1) 428 (5.7)
Former Soviet Union c c c c c c 423 (80.3) c c c c 449 (98.0) 428 (71.1) 377 (94.6) 448 (69.3) 437 (80.2) 382 (36.2)
New migration 437 (5.0) 393 (8.1) 383 (53.3) 447 (13.4) 459 (109.0) 404 (16.6) 468 (28.6) 434 (75.8) 404 (23.2) 477 (37.0) c c 460 (60.4)
Anglo-American 440 (36.8) 459 (12.6) 442 (11.8) 445 (6.3) 464 (20.7) 439 (14.4) 474 (9.5) 463 (23.5) 446 (13.9) 487 (14.6) 479 (12.1) 475 (10.1)
Mixed group 405 (45.5) 367 (11.4) c c 414 (26.2) c c c c 423 (27.3) 418 (16.3) 401 (30.8) 426 (35.6) 385 (39.4) 370 (80.1)
Former Yugoslavia 385 (63.9) c c c c 389 (41.7) 421 (28.0) c c 405 (45.1) 434 (7.3) 409 (6.9) 413 (24.1) 415 (11.6) 398 (57.8)
China group 477 (9.2) 499 (32.8) 479 (22.3) 488 (17.1) 496 (30.3) 481 (8.5) 496 (13.8) 498 (28.8) 494 (8.8) c c 495 (61.4) c c
Note: At best primary is defined as MISCED = 0 or 1; Lower secondary is defined as MISCED = 2 , Upper secondary defined as MISCED = 3 or 4 and Tertiary defined as MISCED = 5 or 6.
The country groupings are the following: Germanic (Austria, Germany, Luxembourg, Switzerland), Anglo-American (United Kingdom, United States), Franco-Dutch (Belgium, France, Netherlands), Nordic (Denmark, Norway, Slovenia, Sweden), China group (Hong Kong-China, Macao-China), Former Soviet Union (Estonia, Kazakhstan, Latvia, Russian Federation), Former Yugoslavia (Croatia, Montenegro, Serbia), Mixed group (Argentina, Greece, Jordan, Portugal), New migration (Ireland, Italy, Spain), Settlement (Australia, Canada, Israel, New Zealand, Singapore)
Source: PISA 2009 Database.
Please refer to the Reader’s Guide for information concerning the symbols replacing missing data.
[Part 1/2]
[Part 2/2]

201UNTAPPED SKILLS: REALISING THE POTENTIAL OF IMMIGRANT STUDENTS © OECD 2012
DATA TABLES ON IMMIGRANT STUDENTS: ANNEX B
Table B6.1 Distribution of students by PISA reading performance levelAll students First-generation students Second-generation students Non-immigrant students
% % % %
Canada
Low (Level 2 or lower) 26 38 23 26
Medium (Level 3) 27 22 30 27
High (Level 4 and 5) 47 41 47 47
Switzerland
Low (level 2 or lower) 44 78 61 31
Medium (level 3) 30 14 23 34
High (level 4 and 5) 27 8 16 35
Note: First-generation refers to foreign born students; second-generation refers to domestic-born students with two foreign born parents.
Source: Canadian Youth in Transition Survey and Swiss Transition from Education to Employment Survey. See Picot and Hou (2012).
Table B6.2
Distribution of immigrant students (first- and second-generation combined) by source region
Source region
Immigrant students
%
In Canada
China 14.3
India 9.8
Other East, South East Asian 19.7
United States 4.4
Central/South America 13.0
United Kingdom 8.9
Northern/Western Europe 3.9
Other Europe 18.4
Africa and others 7.6
In Switzerland
Austria, Germany 3.1
Belgium, France 5.1
Italy 17.5
Portugal 9.0
Spain 3.8
Former Yugoslavia 15.6
Albania or Kosovo 13.5
Turkey 9.8
Others 21.6
Source: Swiss Transition from Education to Employment Survey and Canadian Youth in Transition Survey. See Picot and Hou (2012).
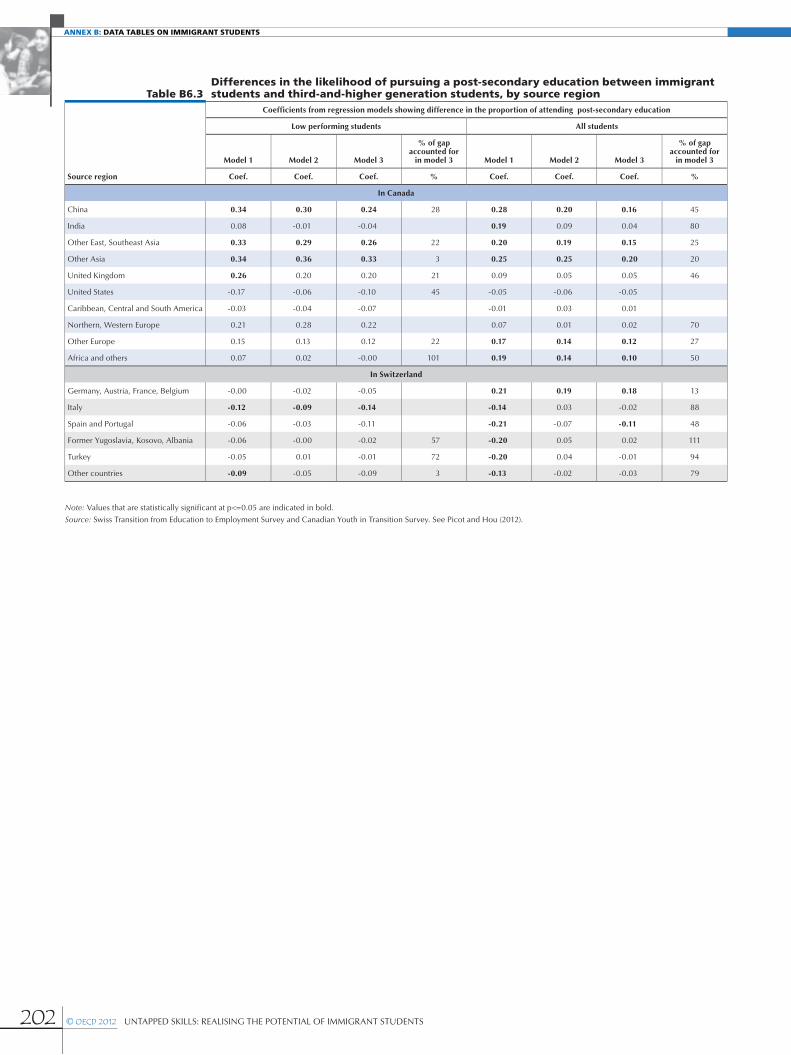
202 © OECD 2012 UNTAPPED SKILLS: REALISING THE POTENTIAL OF IMMIGRANT STUDENTS
ANNEX B: DATA TABLES ON IMMIGRANT STUDENTS
Table B6.3 Differences in the likelihood of pursuing a post-secondary education between immigrant students and third-and-higher generation students, by source region
Source region
Coefficients from regression models showing difference in the proportion of attending post-secondary education
Low performing students All students
Model 1 Model 2 Model 3
% of gap accounted for
in model 3 Model 1 Model 2 Model 3
% of gap accounted for
in model 3
Coef. Coef. Coef. % Coef. Coef. Coef. %
In Canada
China 0.34 0.30 0.24 28 0.28 0.20 0.16 45
India 0.08 -0.01 -0.04 0.19 0.09 0.04 80
Other East, Southeast Asia 0.33 0.29 0.26 22 0.20 0.19 0.15 25
Other Asia 0.34 0.36 0.33 3 0.25 0.25 0.20 20
United Kingdom 0.26 0.20 0.20 21 0.09 0.05 0.05 46
United States -0.17 -0.06 -0.10 45 -0.05 -0.06 -0.05
Caribbean, Central and South America -0.03 -0.04 -0.07 -0.01 0.03 0.01
Northern, Western Europe 0.21 0.28 0.22 0.07 0.01 0.02 70
Other Europe 0.15 0.13 0.12 22 0.17 0.14 0.12 27
Africa and others 0.07 0.02 -0.00 101 0.19 0.14 0.10 50
In Switzerland
Germany, Austria, France, Belgium -0.00 -0.02 -0.05 0.21 0.19 0.18 13
Italy -0.12 -0.09 -0.14 -0.14 0.03 -0.02 88
Spain and Portugal -0.06 -0.03 -0.11 -0.21 -0.07 -0.11 48
Former Yugoslavia, Kosovo, Albania -0.06 -0.00 -0.02 57 -0.20 0.05 0.02 111
Turkey -0.05 0.01 -0.01 72 -0.20 0.04 -0.01 94
Other countries -0.09 -0.05 -0.09 3 -0.13 -0.02 -0.03 79
Note: Values that are statistically significant at p<=0.05 are indicated in bold.
Source: Swiss Transition from Education to Employment Survey and Canadian Youth in Transition Survey. See Picot and Hou (2012).
OECD PUBLISHING, 2, rue André-Pascal, 75775 PARIS CEDEX 16
(98 2012 04 1P) ISBN 978-92-64-17229-6 – No. 60131 2012
The OECD is a unique forum where governments work together to address the economic, social and
environmental challenges of globalisation. The OECD is also at the forefront of efforts to understand and
to help governments respond to new developments and concerns, such as corporate governance, the
information economy and the challenges of an ageing population. The Organisation provides a setting
where governments can compare policy experiences, seek answers to common problems, identify good
practice and work to co-ordinate domestic and international policies.
The OECD member countries are: Australia, Austria, Belgium, Canada, Chile, the Czech Republic,
Denmark, Estonia, Finland, France, Germany, Greece, Hungary, Iceland, Ireland, Israel, Italy, Japan, Korea,
Luxembourg, Mexico, the Netherlands, New Zealand, Norway, Poland, Portugal, the Slovak Republic, Slovenia,
Spain, Sweden, Switzerland, Turkey, the United Kingdom and the United States. The European Commission
takes part in the work of the OECD.
OECD Publishing disseminates widely the results of the Organisation’s statistics gathering and research
on economic, social and environmental issues, as well as the conventions, guidelines and standards agreed
by its members.
ORGANISATION FOR ECONOMIC CO-OPERATIONAND DEVELOPMENT

Untapped Skills RealiSing the Potential of immigRant StUdentS
iSBn 978-92-64-17229-698 2012 04 1P
Please cite this publication as:OECD (2012), Untapped Skills: Realising the Potential of Immigrant Students, OECD Publishing.http://dx.doi.org/10.1787/9789264172470-en
This work is published on the OECD iLibrary, which gathers all OECD books, periodicals and statistical databases. Visit www.oecd-ilibrary.org and do not hesitate to contact us for more information.
2012
Untapped Skills Realising the Potential of immigRant students
a country’s success in integrating immigrants’ children is a key benchmark of the efficacy of social policy in general and education policy in particular. the variance in performance gaps between immigrant and non-immigrant students across countries, even after adjusting for socio-economic background, suggests that policy has an important role to play in eliminating such gaps. Yet education policy alone is unlikely to fully address these challenges.
Untapped Skills: Realising the Potential of Immigrant Students was jointly produced by the countries participating in Pisa, the experts and institutions working within the framework of the Pisa Consortium, the oeCd directorate for education and the oeCd directorate for employment, labour and social affairs. it offers an in-depth look at the various factors, including language and socio-economic disadvantage, that can impede the full integration of immigrant students into their host societies.
Contents
Chapter 1. overview of immigration Regimes and education systems
Chapter 2. the Performance Profiles of immigrant students
Chapter 3. mastery of the assessment language and Reading outcomes
Chapter 4. immigrant students’ age at arrival and assessment Results
Chapter 5. Parental education, immigrant Concentration and Pisa outcomes
Chapter 6. Post-secondary attendance of immigrants in switzerland and Canada
the oeCd PRogRamme foR inteRnational StUdent aSSeSSment (PiSa)
Pisa focuses on young people’s ability to use their knowledge and skills to meet real-life challenges. this orientation reflects a change in the goals and objectives of curricula themselves, which are increasingly concerned with what students can do with what they learn at school and not merely with whether they have mastered specific curricular content. Pisa’s unique features include its:
– Policy orientation, which highlights differences in performance patterns and identifies features common to high-performing students, schools and education systems by linking data on learning outcomes with data on student characteristics and other key factors that shape learning in and outside of school.
– Innovative concept of “literacy”, which refers both to students’ capacity to apply knowledge and skills in key subject areas and to their ability to analyse, reason and communicate effectively as they pose, interpret and solve problems in a variety of situations.
– Relevance to lifelong learning, which goes beyond assessing students’ competencies in school subjects by asking them to report on their motivation to learn, their beliefs about themselves and their learning strategies.
– Regularity, which enables countries to monitor their progress in meeting key learning objectives.
– Breadth of geographical coverage and collaborative nature, which, in Pisa 2009, encompasses the 34 oeCd member countries and 41 partner countries and economies.
Un
tapp
ed S
kills Re
aliS
ing
th
e P
ot
en
tia
l of im
mig
Ra
nt
St
Ud
en
tS
Programme for International Student Assessment