Embed Size (px)
Citation preview
37
CHAPTER
Recent trends in global trade and global value chainsCHRISTOPHE DEGAIN, BO MENG, AND ZHI WANG
2
During a long period after World War II, global trade grew several times faster than global GDP. Since 2012, however, the world may have entered a period of trade growth that is almost in line with GDP growth.
Is this pattern cyclical or structural? Can value-added trade data and information on global value chains (GVCs) help explain these developments? Are GVCs, which involve intermediate products crossing national borders, unwinding? What does this trend mean for developing countries? This chapter addresses these questions through in-depth analysis of available trade and global input- output statistics.
The chapter looks first at the changing patterns of trade in global intermediate goods during the last two decades and ana-lyzes the major factors driving these changes. Then it describes the structural change in global production and analyzes its rel-evance for the recent global trade slowdown by distinguishing GVC and non-GVC activities in GDP and final goods production. Last, it discusses the income distribution issues resulting from the development of GVCs and potential contributions to recent trade slowdowns and the growing antiglobalization sentiment. It does this by numerically estimating the “smile curve,” a graphical outline of the value-added potential of each production stage in a value chain for various industries, based on recently developed GVC length and participation indexes (box 2.1).
The value-added creation structure that has emerged during the slow economic recovery since 2012 is quite different from the
three previous growth periods of the last 20 years. First, there has been a reduction in cross-country production sharing in com-plex GVCs during the current economic recovery, contrary to the rapid production globalization driven by the growth of complex GVC activities in previous periods. Second, again unlike the pro-duction structure of the previous economic growth periods, the recent economic recovery has been driven mainly by traditional trade to satisfy foreign demand and pure domestic production activities in the United States and several major emerging econo-mies, such as China. Third, participation in simple GVCs has been mixed, rising in some developed economies but falling in most emerging Asian economies.
GVC production length (the average number of production stages between primary inputs and final products) has short-ened, reflecting mainly the declining number of national border crossings. The production length before and after national border crossings has actually increased, indicating the poten-tial deepening division of labor within national borders despite the decline in cross-border production-sharing activities. The reduced number of national border crossings for production can be observed in all countries, regardless of whether their GDP grew or shrank during this period.
Changes in the global production structure are consistent with three factors. First is the rising tide of protection around the globe after the global financial crisis. Second is the substitu-tion of domestically produced intermediate inputs for imported
Other contributors to this chapter include Xin Li from Beijing Normal University on intermediate goods trade, Xinding Yu from the University of International Busi-
ness and Economics on the global macroeconomic circle, and Ming Ye from the Organisation for Economic Co-operation and Development on the smile curves.

38 • Measuring and Analyzing the Impact of GVCs on Economic Development
intermediate inputs in major emerging developing economies, such as China. And third is the technology innovation and reshor-ing that deepened the domestic division of labor for major devel-oped economies, such as Japan and the United States. Whether such changes are temporary or permanent can be determined only as more data become available.
Complex GVCs were the most important driving force for globalization and the growth of global GDP during 1995–2000 and 2000–08. But during 2012–15, complex GVC–related cross-border production-sharing activities declined. Industry upgrad-ing occurred within emerging economies, especially in China, accompanied by a decline in processing trade. Trade protection-ism has increased because of the slow pace of economic recov-ery after the financial crisis.
Smile curves show that countries and sectors, depending on their position and degree of participation, can show very dif-ferent value added and job gains along GVCs. Joining a GVC increases economic efficiency, but this can have a distributional impact.
Intermediate trade in manufactured goods and global business cycles
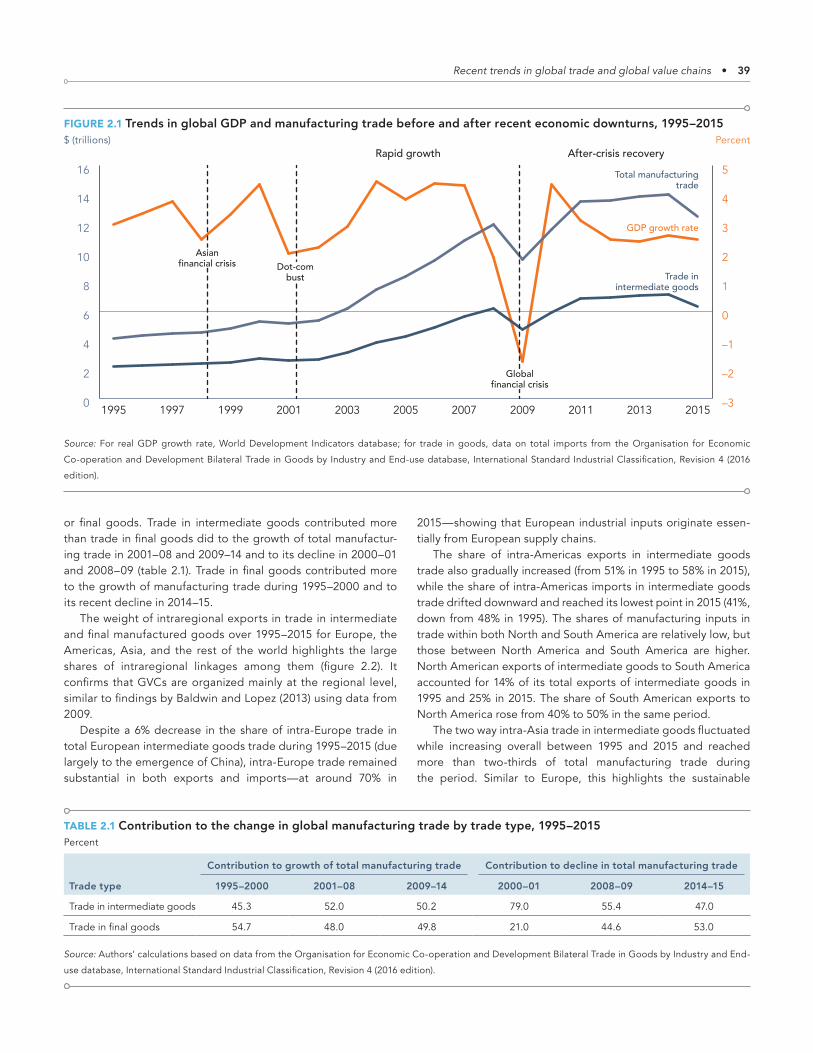
The global economy recently went through three short down-turns centered on the 1997–98 Asian financial crisis, the 2000–01 dot-com bust, and the 2008–09 global financial crisis (figure 2.1). The global financial crisis precipitated the only global reces-sion, defined by negative GDP growth for a period of at least two consecutive quarters. And it seems to have had a struc-tural impact on the global economy, both on economic growth and on patterns of trade. Global GDP grew at about 4% a year during the precrisis and postrecovery periods of both the Asian
financial crisis and the dot-com bust, suggesting that about 4% is the steady state for the world economy. GDP growth initially recovered to about 4% after the global financial crisis but then fell back and stabilized at roughly 2.5%, hinting that structural factors in addition to cyclical factors may be affecting global economic growth (see figure 2.1).
The 2008–09 global financial crisis may have also changed the pattern of global trade. Unlike the 1997 Asian financial crisis, the global financial crisis had large negative impacts on both the level and the growth of trade. The rapid trade growth from 2001 to 2008 contrasts sharply with the much slower growth starting in 2009. The decline in intermediate goods trade in 2015 pushes the world economy closer to precrisis levels, thus challenging the recovery six years after the crisis. There seems to be a clear link between the patterns of trade and the global business cycle. What roles have cross-country production sharing and GVCs played in such a global business cycle? As GVCs involve intermediate goods crossing national borders, trade in such goods provides the first piece of information to help understand what is going on.
The evolution of global manufacturing trade from 1995 to 2015 exhibits six phases (see figure 2.1). The Asian financial crisis severely damaged domestic demand in several Asian economies over 1995–2000, but total manufacturing trade still grew, albeit slowly, and reached a low peak in 2000. Due to the dot-com bust in 2000–01, manufacturing trade declined slightly. In 2001–08, and accompanying China’s accession to the World Trade Orga-nization (WTO) at the end of 2001, total manufacturing trade increased substantially. With the 2008–09 global financial crisis, however, total manufacturing trade dropped sharply. But then in 2010–14, it showed a rapid V-shaped recovery, before dropping again slightly in 2014–15.
There is no clear indication of which product type contrib-utes more to growth in total manfacturing trade, intermediate
BOX 2.1Identifying global value chain activities with new indicators
The rise of global value chains (GVCs) in the past two decades has dramatically altered the world economy. But with the increasing complexity and sophistication of cross-border production- sharing activities, the use of only official trade data (such as gross exports and imports) and GDP statistics has not revealed the significance and nature of changes in the global business cycle. An important reason is that indicators based on official trade and production data cannot identify and distinguish which types of trade are GVC activities and which are not, thus making it diffi-cult to evaluate the relation between changes in global trade and changes in GDP growth. This chapter introduces recently developed GVC indicators, which make it possible to decompose a country or sector’s GDP and final goods production into GVC and non-GVC activities (see box 2.2).
Applying this new GVC accounting system to the most up-to-date intercountry input- output databases (World Input- Output Database 2013, 2016; Asian Development Bank Multi-Region Input-Output Database 20161) makes it possible to identify the production length (more or fewer production stages between primary inputs and final goods) and degree of participation (simple or complex) in GVCs at country and sector levels.
Note1. The Asian Development Bank Multi-Region Input-Output Data-
base data cover a time-series intercountry input-output table,
compiled by the Asian Development Bank in 2016 using the World
Input-Output Database and other Asian countries’ input-output
tables.
Recent trends in global trade and global value chains • 39
or final goods. Trade in intermediate goods contributed more than trade in final goods did to the growth of total manufactur-ing trade in 2001–08 and 2009–14 and to its decline in 2000–01 and 2008–09 (table 2.1). Trade in final goods contributed more to the growth of manufacturing trade during 1995–2000 and to its recent decline in 2014–15.
The weight of intraregional exports in trade in intermediate and final manufactured goods over 1995–2015 for Europe, the Americas, Asia, and the rest of the world highlights the large shares of intraregional linkages among them (figure 2.2). It confirms that GVCs are organized mainly at the regional level, similar to findings by Baldwin and Lopez (2013) using data from 2009.
Despite a 6% decrease in the share of intra-Europe trade in total European intermediate goods trade during 1995–2015 (due largely to the emergence of China), intra-Europe trade remained substantial in both exports and imports — at around 70% in
2015 — showing that European industrial inputs originate essen-tially from European supply chains.
The share of intra-Americas exports in intermediate goods trade also gradually increased (from 51% in 1995 to 58% in 2015), while the share of intra-Americas imports in intermediate goods trade drifted downward and reached its lowest point in 2015 (41%, down from 48% in 1995). The shares of manufacturing inputs in trade within both North and South America are relatively low, but those between North America and South America are higher. North American exports of intermediate goods to South America accounted for 14% of its total exports of intermediate goods in 1995 and 25% in 2015. The share of South American exports to North America rose from 40% to 50% in the same period.
The two way intra-Asia trade in intermediate goods fluctuated while increasing overall between 1995 and 2015 and reached more than two-thirds of total manufacturing trade during the period. Similar to Europe, this highlights the sustainable
TABLE 2.1 Contribution to the change in global manufacturing trade by trade type, 1995–2015Percent
Trade type
Contribution to growth of total manufacturing trade Contribution to decline in total manufacturing trade
1995–2000 2001–08 2009–14 2000–01 2008–09 2014–15
Trade in intermediate goods 45.3 52.0 50.2 79.0 55.4 47.0
Trade in final goods 54.7 48.0 49.8 21.0 44.6 53.0
Source: Authors’ calculations based on data from the Organisation for Economic Co-operation and Development Bilateral Trade in Goods by Industry and End-
use database, International Standard Industrial Classification, Revision 4 (2016 edition).
FIGURE 2.1 Trends in global GDP and manufacturing trade before and after recent economic downturns, 1995–2015$ (trillions) Percent
–3
–2
–1
0
1
2
3
4
5
20152013201120092007200520032001199919971995
GDP growth rate
Total manufacturingtrade
Trade inintermediate goods
Globalfinancial crisis
Dot-combust
Asianfinancial crisis
Rapid growth After-crisis recovery
0
2
4
6
8
10
12
14
16
Source: For real GDP growth rate, World Development Indicators database; for trade in goods, data on total imports from the Organisation for Economic
Co-operation and Development Bilateral Trade in Goods by Industry and End-use database, International Standard Industrial Classification, Revision 4 (2016
edition).

40 • Measuring and Analyzing the Impact of GVCs on Economic Development
industrial linkages arrangement of “Factory Asia.” About 60% of Asia’s exports of final manufactured goods over the period went to extraregional markets, but only about 40% of the Americas’ exports did, an imbalance that began to change after the global financial crisis. Compared with Asia and the Americas, Europe’s final goods trade has been more balanced during the last two decades, with a slight decline in intraregional trade from more than 70% in 1995 to about 66% in 2015.
GVCs are still largely regional, despite the trend of increas-ing globalization before the recent global financial crisis (see also annex 2.1). Developing economies are increasingly participating in GVCs through exports and imports of intermediate manufac-tured goods. And some emerging economies are upgrading along GVCs — for example, China tends to export more interme-diate goods to other low-income downstream countries to sup-port their final goods exports to the global market.
FIGURE 2.2 Evolution of intraregional trade in intermediate and final manufactured goods, 1995–2015Percent of regional total
0
20
40
60
80
20152010200520001995
Rest of the world
The Americas
Asia
Europe
0
20
40
60
80
20152010200520001995
Rest of the world
The Americas
Asia
Europe
0
20
40
60
80
20152010200520001995
Rest of the world
The Americas
Asia
Europe
0
20
40
60
80
20152010200520001995
Rest of the world
The Americas
Asia
Europe
Intermediate goodsExports Imports
Final goodsExports Imports
Source: Organisation for Economic Co-operation and Development Bilateral Trade in Goods by Industry and End-use database, International Standard Industrial
Classification, Revision 4 (2016 edition).
Recent trends in global trade and global value chains • 41
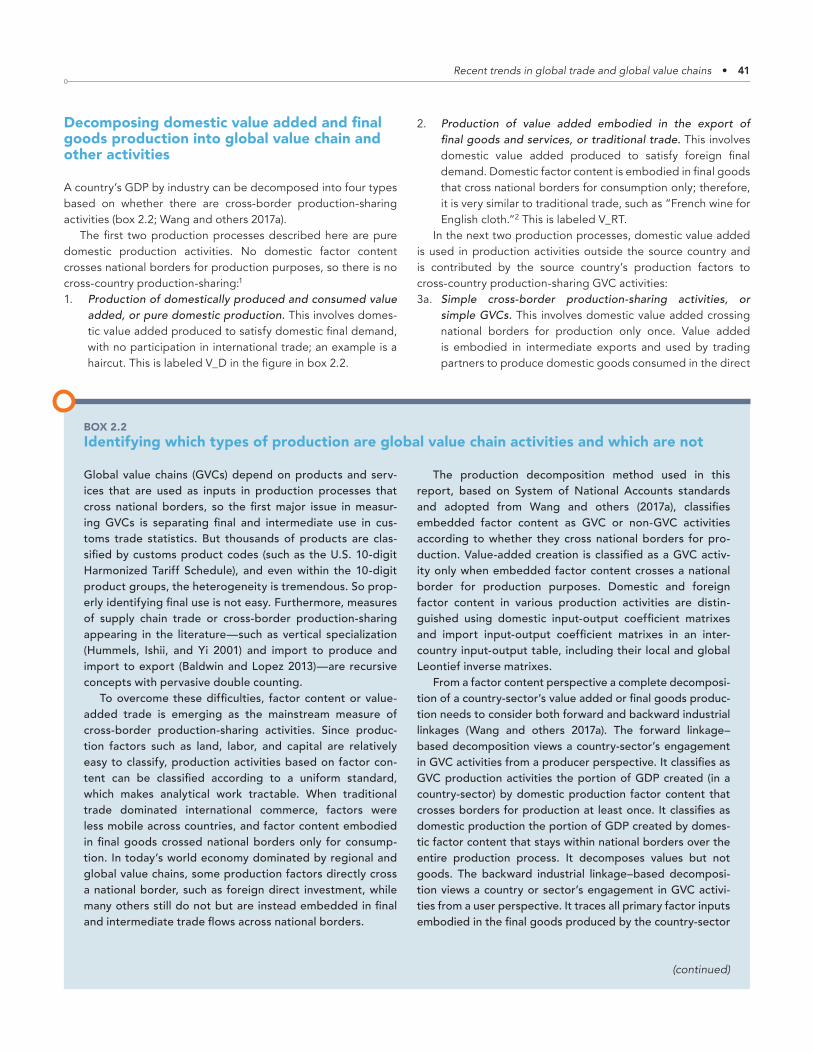
Decomposing domestic value added and final goods production into global value chain and other activities
A country’s GDP by industry can be decomposed into four types based on whether there are cross-border production-sharing activities (box 2.2; Wang and others 2017a).
The first two production processes described here are pure domestic production activities. No domestic factor content crosses national borders for production purposes, so there is no cross-country production-sharing:1
1. Production of domestically produced and consumed value added, or pure domestic production. This involves domes-tic value added produced to satisfy domestic final demand, with no participation in international trade; an example is a haircut. This is labeled V_D in the figure in box 2.2.
2. Production of value added embodied in the export of final goods and services, or traditional trade. This involves domestic value added produced to satisfy foreign final demand. Domestic factor content is embodied in final goods that cross national borders for consumption only; therefore, it is very similar to traditional trade, such as “French wine for English cloth.”2 This is labeled V_RT.
In the next two production processes, domestic value added is used in production activities outside the source country and is contributed by the source country’s production factors to cross-country production-sharing GVC activities:3a. Simple cross-border production-sharing activities, or
simple GVCs. This involves domestic value added crossing national borders for production only once. Value added is embodied in intermediate exports and used by trading partners to produce domestic goods consumed in the direct
BOX 2.2Identifying which types of production are global value chain activities and which are not
Global value chains (GVCs) depend on products and serv-ices that are used as inputs in production processes that cross national borders, so the first major issue in measur-ing GVCs is separating final and intermediate use in cus-toms trade statistics. But thousands of products are clas-sified by customs product codes (such as the U.S. 10-digit Harmonized Tariff Schedule), and even within the 10-digit product groups, the heterogeneity is tremendous. So prop-erly identifying final use is not easy. Furthermore, measures of supply chain trade or cross-border production-sharing appearing in the literature — such as vertical specialization (Hummels, Ishii, and Yi 2001) and import to produce and import to export (Baldwin and Lopez 2013) — are recursive concepts with pervasive double counting.
To overcome these difficulties, factor content or value-added trade is emerging as the mainstream measure of cross-border production-sharing activities. Since produc-tion factors such as land, labor, and capital are relatively easy to classify, production activities based on factor con-tent can be classified according to a uniform standard, which makes analytical work tractable. When traditional trade dominated international commerce, factors were less mobile across countries, and factor content embodied in final goods crossed national borders only for consump-tion. In today’s world economy dominated by regional and global value chains, some production factors directly cross a national border, such as foreign direct investment, while many others still do not but are instead embedded in final and intermediate trade flows across national borders.
The production decomposition method used in this report, based on System of National Accounts standards and adopted from Wang and others (2017a), classifies embedded factor content as GVC or non-GVC activities according to whether they cross national borders for pro-duction. Value-added creation is classified as a GVC activ-ity only when embedded factor content crosses a national border for production purposes. Domestic and foreign factor content in various production activities are distin-guished using domestic input-output coefficient matrixes and import input-output coefficient matrixes in an inter-country input- output table, including their local and global Leontief inverse matrixes.
From a factor content perspective a complete decomposi-tion of a country- sector’s value added or final goods produc-tion needs to consider both forward and backward industrial linkages (Wang and others 2017a). The forward linkage– based decomposition views a country- sector’s engagement in GVC activities from a producer perspective. It classifies as GVC production activities the portion of GDP created (in a country- sector) by domestic production factor content that crosses borders for production at least once. It classifies as domestic production the portion of GDP created by domes-tic factor content that stays within national borders over the entire production process. It decomposes values but not goods. The backward industrial linkage–based decomposi-tion views a country or sector’s engagement in GVC activi-ties from a user perspective. It traces all primary factor inputs embodied in the final goods produced by the country- sector
(continued)

42 • Measuring and Analyzing the Impact of GVCs on Economic Development
importing country. No indirect exports via third countries or re-exports or re-imports of the source countries’ factor content occur. For example, Chinese value added is embod-ied in its steel exports to the United States and used in U.S. house construction. This is labeled V_GVC_S.
3b. Complex cross-border production-sharing activities, or complex GVCs. This involves domestic value added that is embodied in intermediate exports and used by a partner country to produce exports (intermediate or final) for other
countries. Domestic factor content crosses the border at least twice and is used by the partner country to produce intermediate or final product exports either for re-export to the home country (such as an Apple engineer’s salary embodied in an iPhone bought by an American consumer) or for re-export to other countries (such as Japanese value added embodied in electronic chips installed in Chi-na-made toy exports to the United States). This is labeled V_GVC_C.
to the original country- sector sources and consistently clas-sifies embodied domestic or foreign factor content into GVC and non-GVC production activities based on whether they have crossed a national border for production.
Both ways to decompose production activities in a country-sector pair include the four types described in the text. Factor content or value added in types 1 and 2 involves no cross-border production activities and satisfies domestic (type 1) and foreign (type 2) demand. Factor con-tent or value added in type 2 crosses borders once but only for consumption activities since all value-added embodied in the good’s intermediate inputs are derived from domes-tic sources; therefore, it is traditional trade in value added terms (French wine for English cloth). Factor content in
type 3 is embodied in trade in intermediate goods and can be decomposed further into two types. Type 3a is value added embedded in intermediate goods absorbed by the direct importer and in which cross-border production activ-ities are conducted, but only within the direct importing country (without further border crossing) — thus, these are simple GVCs. Type 3b is value added that crosses borders at least twice to satisfy domestic and foreign final demand, respectively — thus, these are complex GVCs. These last two types measure cross-country production-sharing activities. They exclude domestic value added measured by the first two types because those production activities are accom-plished completely within national borders and so can be treated as pure domestic production activities.
Decomposing GDP and final goods production by country or sector
Forward linkage-based: Producer perspective Which types of GDP production activities belong to GVCs?
Backward linkage-based: User perspective Which types of final goods production belong to GVCs?
Absorbed bydirect importerSimple GVCs(V_GVC_S)
Re-export/re-importComplex GVCs
(V_GVC_C)
In production of finalgoods and services to
domestic marketdirectly (V_D)
In productionof final exportsdirectly (V_RT)
In production ofintermediate exports
(V_GVC)
A country-sector’stotal value added (V)
GDP by industry
1
0 1
≥2Partner value added
in production ofdomestically usedgoods (Y_GVC_S)
In production ofexported goods
(Y_GVC_C)
Domestic value addedin domestically used
final goods (Y_D)
Domesticvalue added in
final exports (Y_RT)
Domestic and foreignvalue added in
intermediate imports(Y_GVC)
Production of finalgoods and services
by country/sector (Y)
1
1
≥2
0
Source: Adapted from Wang and others 2017a.
Note: Numbers in circles are number of border crossings Blue circles represent border crossings for consumption. Orange circles represent border
crossings for production.
BOX 2.2 (continued)Identifying which types of production are global value chain activities and which are not
Recent trends in global trade and global value chains • 43
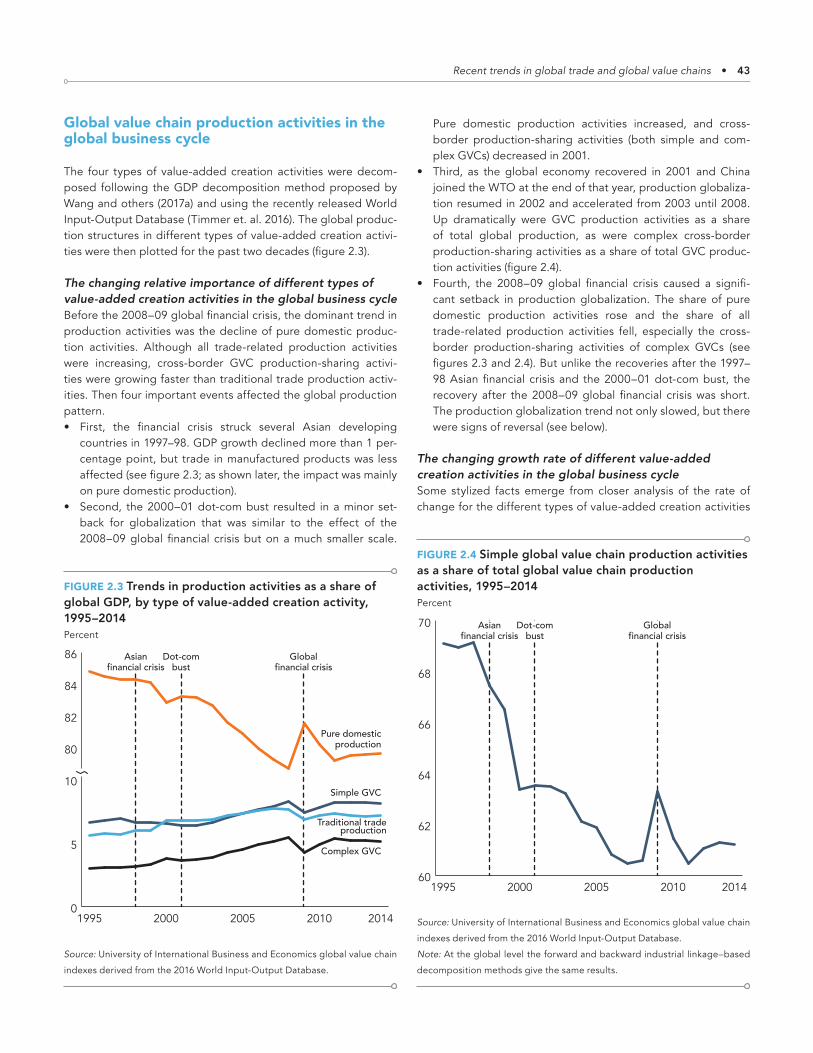
Global value chain production activities in the global business cycle
The four types of value-added creation activities were decom-posed following the GDP decomposition method proposed by Wang and others (2017a) and using the recently released World Input- Output Database (Timmer et. al. 2016). The global produc-tion structures in different types of value-added creation activi-ties were then plotted for the past two decades (figure 2.3).
The changing relative importance of different types of value-added creation activities in the global business cycleBefore the 2008–09 global financial crisis, the dominant trend in production activities was the decline of pure domestic produc-tion activities. Although all trade-related production activities were increasing, cross-border GVC production-sharing activi-ties were growing faster than traditional trade production activ-ities. Then four important events affected the global production pattern.• First, the financial crisis struck several Asian developing
countries in 1997–98. GDP growth declined more than 1 per-centage point, but trade in manufactured products was less affected (see figure 2.3; as shown later, the impact was mainly on pure domestic production).
• Second, the 2000–01 dot-com bust resulted in a minor set-back for globalization that was similar to the effect of the 2008–09 global financial crisis but on a much smaller scale.
Pure domestic production activities increased, and cross-border production-sharing activities (both simple and com-plex GVCs) decreased in 2001.
• Third, as the global economy recovered in 2001 and China joined the WTO at the end of that year, production globaliza-tion resumed in 2002 and accelerated from 2003 until 2008. Up dramatically were GVC production activities as a share of total global production, as were complex cross-border production- sharing activities as a share of total GVC produc-tion activities (figure 2.4).
• Fourth, the 2008–09 global financial crisis caused a signifi-cant setback in production globalization. The share of pure domestic production activities rose and the share of all trade-related production activities fell, especially the cross-border production-sharing activities of complex GVCs (see figures 2.3 and 2.4). But unlike the recoveries after the 1997–98 Asian financial crisis and the 2000–01 dot-com bust, the recovery after the 2008–09 global financial crisis was short. The production globalization trend not only slowed, but there were signs of reversal (see below).
The changing growth rate of different value-added creation activities in the global business cycleSome stylized facts emerge from closer analysis of the rate of change for the different types of value-added creation activities
FIGURE 2.3 Trends in production activities as a share of global GDP, by type of value-added creation activity, 1995–2014Percent
Globalfinancial crisis
Dot-combust
Asianfinancial crisis
80
82
84
86
201420102005200019950
5
10
Pure domesticproduction
Simple GVC
Traditional tradeproduction
Complex GVC
Source: University of International Business and Economics global value chain
indexes derived from the 2016 World Input-Output Database.
FIGURE 2.4 Simple global value chain production activities as a share of total global value chain production activities, 1995–2014Percent
Globalfinancial crisis
Dot-combust
Asianfinancial crisis
60
62
64
66
68
70
20142010200520001995
Source: University of International Business and Economics global value chain
indexes derived from the 2016 World Input-Output Database.
Note: At the global level the forward and backward industrial linkage–based
decomposition methods give the same results.
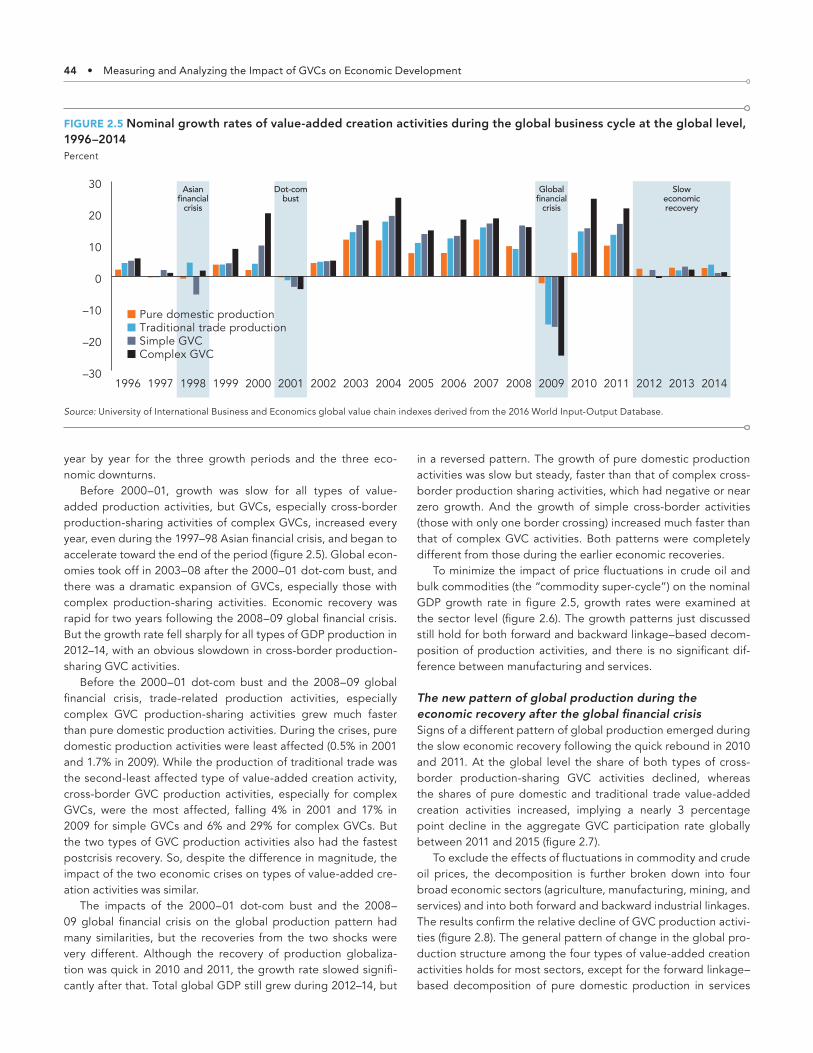
44 • Measuring and Analyzing the Impact of GVCs on Economic Development
year by year for the three growth periods and the three eco-nomic downturns.
Before 2000–01, growth was slow for all types of value- added production activities, but GVCs, especially cross-border production-sharing activities of complex GVCs, increased every year, even during the 1997–98 Asian financial crisis, and began to accelerate toward the end of the period (figure 2.5). Global econ-omies took off in 2003–08 after the 2000–01 dot-com bust, and there was a dramatic expansion of GVCs, especially those with complex production-sharing activities. Economic recovery was rapid for two years following the 2008–09 global financial crisis. But the growth rate fell sharply for all types of GDP production in 2012–14, with an obvious slowdown in cross-border production-sharing GVC activities.
Before the 2000–01 dot-com bust and the 2008–09 global financial crisis, trade-related production activities, especially complex GVC production-sharing activities grew much faster than pure domestic production activities. During the crises, pure domestic production activities were least affected (0.5% in 2001 and 1.7% in 2009). While the production of traditional trade was the second-least affected type of value-added creation activity, cross-border GVC production activities, especially for complex GVCs, were the most affected, falling 4% in 2001 and 17% in 2009 for simple GVCs and 6% and 29% for complex GVCs. But the two types of GVC production activities also had the fastest postcrisis recovery. So, despite the difference in magnitude, the impact of the two economic crises on types of value-added cre-ation activities was similar.
The impacts of the 2000–01 dot-com bust and the 2008–09 global financial crisis on the global production pattern had many similarities, but the recoveries from the two shocks were very different. Although the recovery of production globaliza-tion was quick in 2010 and 2011, the growth rate slowed signifi-cantly after that. Total global GDP still grew during 2012–14, but
in a reversed pattern. The growth of pure domestic production activities was slow but steady, faster than that of complex cross-border production sharing activities, which had negative or near zero growth. And the growth of simple cross-border activities (those with only one border crossing) increased much faster than that of complex GVC activities. Both patterns were completely different from those during the earlier economic recoveries.
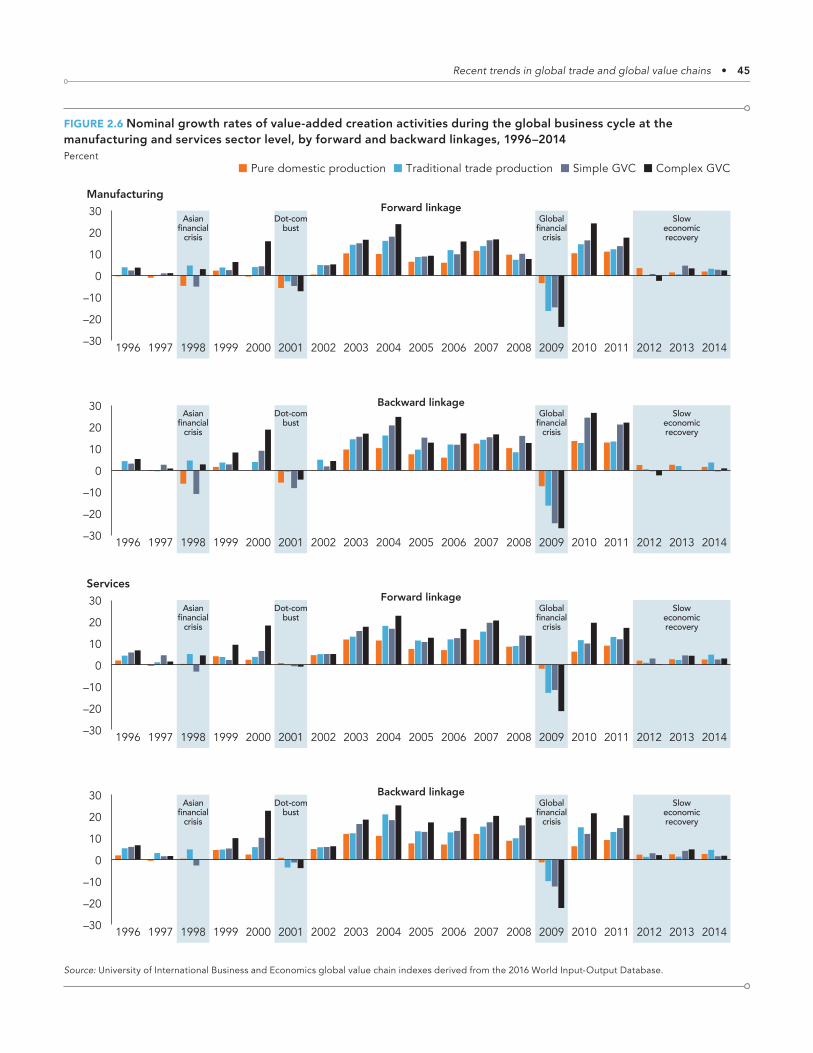
To minimize the impact of price fluctuations in crude oil and bulk commodities (the “commodity super-cycle”) on the nominal GDP growth rate in figure 2.5, growth rates were examined at the sector level (figure 2.6). The growth patterns just discussed still hold for both forward and backward linkage–based decom-position of production activities, and there is no significant dif-ference between manufacturing and services.
The new pattern of global production during the economic recovery after the global financial crisisSigns of a different pattern of global production emerged during the slow economic recovery following the quick rebound in 2010 and 2011. At the global level the share of both types of cross-border production-sharing GVC activities declined, whereas the shares of pure domestic and traditional trade value-added creation activities increased, implying a nearly 3 percentage point decline in the aggregate GVC participation rate globally between 2011 and 2015 (figure 2.7).
To exclude the effects of fluctuations in commodity and crude oil prices, the decomposition is further broken down into four broad economic sectors (agriculture, manufacturing, mining, and services) and into both forward and backward industrial linkages. The results confirm the relative decline of GVC production activi-ties (figure 2.8). The general pattern of change in the global pro-duction structure among the four types of value-added creation activities holds for most sectors, except for the forward linkage–based decomposition of pure domestic production in services
FIGURE 2.5 Nominal growth rates of value-added creation activities during the global business cycle at the global level, 1996–2014Percent
–30
–20
–10
0
10
20
30
2014201320122011201020092008200720062005200420032002200120001999199819971996
Pure domestic productionTraditional trade productionSimple GVCComplex GVC
Asianfinancial
crisis
Dot-combust
Globalfinancial
crisis
Sloweconomicrecovery
Source: University of International Business and Economics global value chain indexes derived from the 2016 World Input-Output Database.
Recent trends in global trade and global value chains • 45
FIGURE 2.6 Nominal growth rates of value-added creation activities during the global business cycle at the manufacturing and services sector level, by forward and backward linkages, 1996–2014Percent
Dot-combust
Asianfinancial
crisis
Dot-combust
Asianfinancial
crisis
Dot-combust
Asianfinancial
crisis
Globalfinancial
crisis
Dot-combust
Asianfinancial
crisis
Globalfinancial
crisis
–30
–20
–10
0
10
20
30
2014201320122011201020092008200720062005200420032002200120001999199819971996
Pure domestic production Traditional trade production Simple GVC Complex GVC
Manufacturing
Globalfinancial
crisis
–30
–20
–10
0
10
20
30
2014201320122011201020092008200720062005200420032002200120001999199819971996
Globalfinancial
crisis
–30
–20
–10
0
10
20
30
2014201320122011201020092008200720062005200420032002200120001999199819971996
Services
–30
–20
–10
0
10
20
30
2014201320122011201020092008200720062005200420032002200120001999199819971996
Forward linkage
Backward linkage
Forward linkage
Backward linkage
Sloweconomicrecovery
Sloweconomicrecovery
Sloweconomicrecovery
Sloweconomicrecovery
Source: University of International Business and Economics global value chain indexes derived from the 2016 World Input-Output Database.

46 • Measuring and Analyzing the Impact of GVCs on Economic Development
and the backward linkage–based decomposition of traditional trade in agriculture.
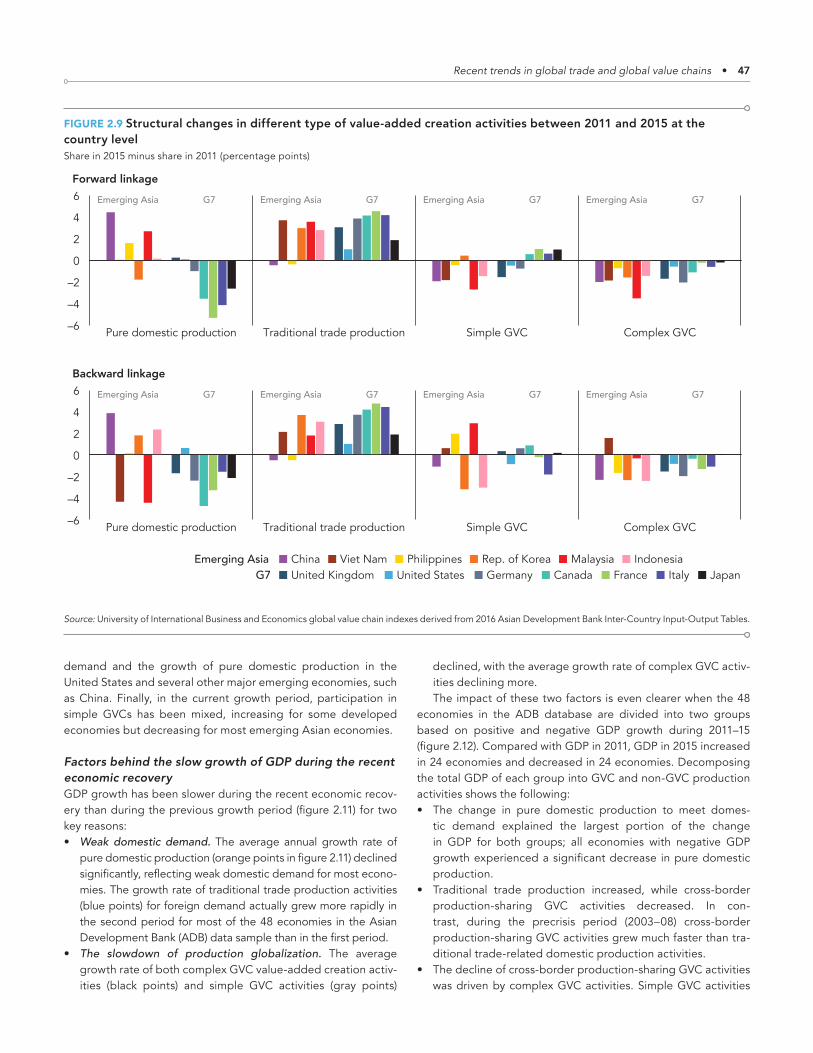
After 2011, complex GVC activities declined in all G7 coun-tries and in major Asian emerging economies except Viet Nam (figure 2.9). In backward linkage–based decomposition the changes in simple GVC activities were mixed across countries. At the same time, implying weak domestic demand for major world economies, pure domestic production declined in almost all G7 countries except the United States and in China and a few other emerging economies. The share of production for traditional trade, which satisfies foreign demand, increased for all G7 and most Asian emerging economies.
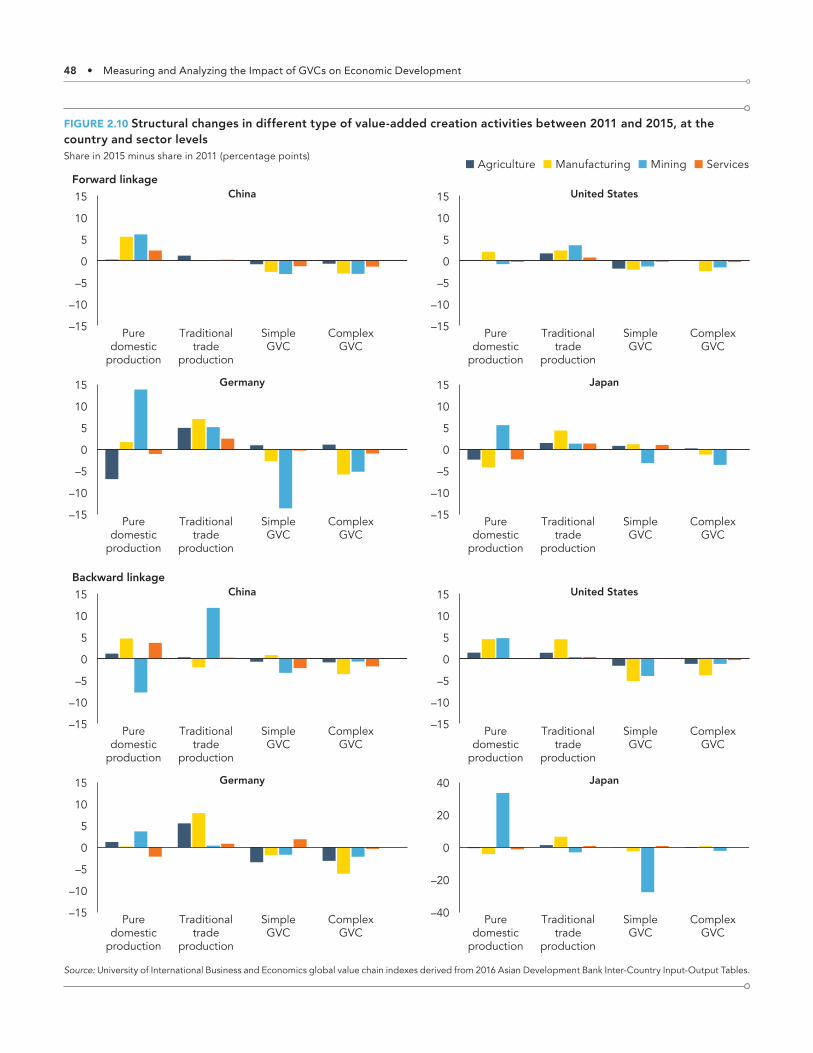
To ensure the robustness of these results, the changes in major portions of production activities based on the decomposition of both forward and backward linkages were compared for the four largest economies ranked by GDP — the United States, China, Japan, and Germany (figure 2.10). This analysis confirms the pro-duction structure changes identified at the aggregate level.
The structure of value-added creation during the slow eco-nomic recovery since 2011 is quite different from that during the three previous economic growth periods in the last 20 years. First, unlike the rapid production globalization driven by the growth of complex GVC activities in previous periods, during the current economic recovery the pattern was reversed, with less cross-border production-sharing activities in complex GVCs. Again contrary to the production structure of the previous eco-nomic growth periods, the current economic recovery has been driven mainly by traditional trade production to satisfy foreign
FIGURE 2.7 Structural changes in different types of value-added creation activities at the global level between 2011 and 2015Share in 2015 minus share in 2011 (percentage points)
–2
–1
0
1
2
ComplexGVC
SimpleGVC
Traditionaltrade
production
Puredomestic
production
Source: University of International Business and Economics global value
chain indexes derived from the 2016 Asian Development Bank Multi- Region
Input-Output Database.
FIGURE 2.8 Structural changes in different types of value-added creation activities at the sectoral level between 2011 and 2015Share in 2015 minus share in 2011 (percentage points)
–15
–10
–5
0
5
10
15
20
ComplexGVC
SimpleGVC
Traditionaltrade
production
Puredomestic
production
–5.0
–2.5
0.0
2.5
5.0
ComplexGVC
SimpleGVC
Traditionaltrade
production
Puredomestic
production
Forward linkage Backward linkage
AgricultureManufacturingMiningServices
AgricultureManufacturingMiningServices
Source: University of International Business and Economics global value chain indexes derived from 2016 Asian Development Bank Inter-Country Input-Output Tables.
Recent trends in global trade and global value chains • 47
demand and the growth of pure domestic production in the United States and several other major emerging economies, such as China. Finally, in the current growth period, participation in simple GVCs has been mixed, increasing for some developed economies but decreasing for most emerging Asian economies.
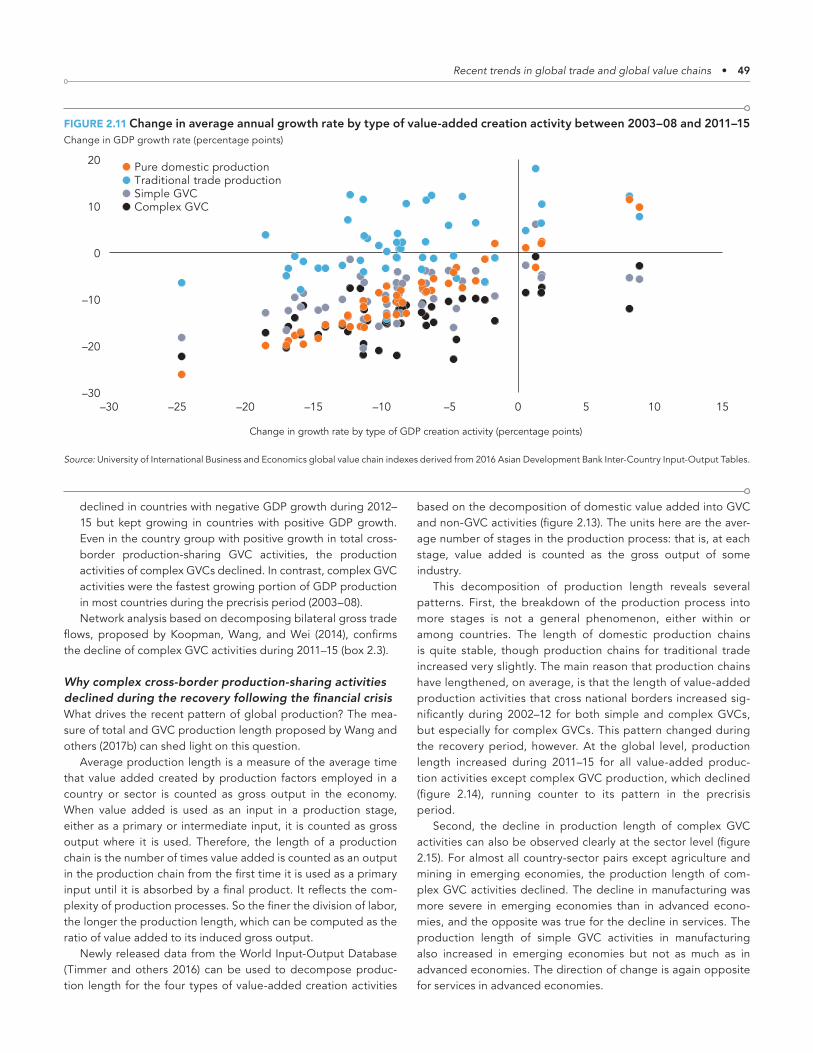
Factors behind the slow growth of GDP during the recent economic recoveryGDP growth has been slower during the recent economic recov-ery than during the previous growth period (figure 2.11) for two key reasons:• Weak domestic demand. The average annual growth rate of
pure domestic production (orange points in figure 2.11) declined significantly, reflecting weak domestic demand for most econo-mies. The growth rate of traditional trade production activities (blue points) for foreign demand actually grew more rapidly in the second period for most of the 48 economies in the Asian Development Bank (ADB) data sample than in the first period.
• The slowdown of production globalization. The average growth rate of both complex GVC value-added creation activ-ities (black points) and simple GVC activities (gray points)
declined, with the average growth rate of complex GVC activ-ities declining more.The impact of these two factors is even clearer when the 48
economies in the ADB database are divided into two groups based on positive and negative GDP growth during 2011–15 (figure 2.12). Compared with GDP in 2011, GDP in 2015 increased in 24 economies and decreased in 24 economies. Decomposing the total GDP of each group into GVC and non-GVC production activities shows the following:• The change in pure domestic production to meet domes-
tic demand explained the largest portion of the change in GDP for both groups; all economies with negative GDP growth experienced a significant decrease in pure domestic production.
• Traditional trade production increased, while cross-border production-sharing GVC activities decreased. In con-trast, during the precrisis period (2003–08) cross-border production-sharing GVC activities grew much faster than tra-ditional trade-related domestic production activities.
• The decline of cross-border production-sharing GVC activities was driven by complex GVC activities. Simple GVC activities
FIGURE 2.9 Structural changes in different type of value-added creation activities between 2011 and 2015 at the country levelShare in 2015 minus share in 2011 (percentage points)
–6
–4
–2
0
2
4
6
Complex GVCSimple GVCTraditional trade productionPure domestic production
Forward linkage
Backward linkage
–6
–4
–2
0
2
4
6
Complex GVCSimple GVCTraditional trade productionPure domestic production
United KingdomG7 United States Germany Canada France Italy JapanChinaEmerging Asia Viet Nam Philippines Rep. of Korea Malaysia Indonesia
Emerging Asia G7Emerging Asia G7 Emerging Asia G7 Emerging Asia G7
Emerging Asia G7Emerging Asia G7 Emerging Asia G7 Emerging Asia G7
Source: University of International Business and Economics global value chain indexes derived from 2016 Asian Development Bank Inter-Country Input-Output Tables.
48 • Measuring and Analyzing the Impact of GVCs on Economic Development
FIGURE 2.10 Structural changes in different type of value-added creation activities between 2011 and 2015, at the country and sector levelsShare in 2015 minus share in 2011 (percentage points)
–15
–10
–5
0
5
10
15
ComplexGVC
SimpleGVC
Traditionaltrade
production
Puredomestic
production
–15
–10
–5
0
5
10
15
ComplexGVC
SimpleGVC
Traditionaltrade
production
Puredomestic
production
ComplexGVC
SimpleGVC
Traditionaltrade
production
Puredomestic
production
Forward linkageChina
Agriculture Manufacturing Mining Services
United States
–15
–10
–5
0
5
10
15
ComplexGVC
SimpleGVC
Traditionaltrade
production
Puredomestic
production
ComplexGVC
SimpleGVC
Traditionaltrade
production
Puredomestic
production
Germany
Germany
Japan
–15
–10
–5
0
5
10
15
ComplexGVC
SimpleGVC
Traditionaltrade
production
Puredomestic
production
ComplexGVC
SimpleGVC
Traditionaltrade
production
Puredomestic
production
Backward linkageChina United States
Japan
–40
–20
0
20
40
ComplexGVC
SimpleGVC
Traditionaltrade
production
Puredomestic
production
–15
–10
–5
0
5
10
15
–15
–10
–5
0
5
10
15
–15
–10
–5
0
5
10
15
Source: University of International Business and Economics global value chain indexes derived from 2016 Asian Development Bank Inter-Country Input- Output Tables.
Recent trends in global trade and global value chains • 49
declined in countries with negative GDP growth during 2012–15 but kept growing in countries with positive GDP growth. Even in the country group with positive growth in total cross-border production-sharing GVC activities, the production activities of complex GVCs declined. In contrast, complex GVC activities were the fastest growing portion of GDP production in most countries during the precrisis period (2003–08).Network analysis based on decomposing bilateral gross trade
flows, proposed by Koopman, Wang, and Wei (2014), confirms the decline of complex GVC activities during 2011–15 (box 2.3).
Why complex cross-border production-sharing activities declined during the recovery following the financial crisisWhat drives the recent pattern of global production? The mea-sure of total and GVC production length proposed by Wang and others (2017b) can shed light on this question.
Average production length is a measure of the average time that value added created by production factors employed in a country or sector is counted as gross output in the economy. When value added is used as an input in a production stage, either as a primary or intermediate input, it is counted as gross output where it is used. Therefore, the length of a production chain is the number of times value added is counted as an output in the production chain from the first time it is used as a primary input until it is absorbed by a final product. It reflects the com-plexity of production processes. So the finer the division of labor, the longer the production length, which can be computed as the ratio of value added to its induced gross output.
Newly released data from the World Input-Output Database (Timmer and others 2016) can be used to decompose produc-tion length for the four types of value-added creation activities
based on the decomposition of domestic value added into GVC and non-GVC activities (figure 2.13). The units here are the aver-age number of stages in the production process: that is, at each stage, value added is counted as the gross output of some industry.
This decomposition of production length reveals several patterns. First, the breakdown of the production process into more stages is not a general phenomenon, either within or among countries. The length of domestic production chains is quite stable, though production chains for traditional trade increased very slightly. The main reason that production chains have lengthened, on average, is that the length of value-added production activities that cross national borders increased sig-nificantly during 2002–12 for both simple and complex GVCs, but especially for complex GVCs. This pattern changed during the recovery period, however. At the global level, production length increased during 2011–15 for all value-added produc-tion activities except complex GVC production, which declined (figure 2.14), running counter to its pattern in the precrisis period.
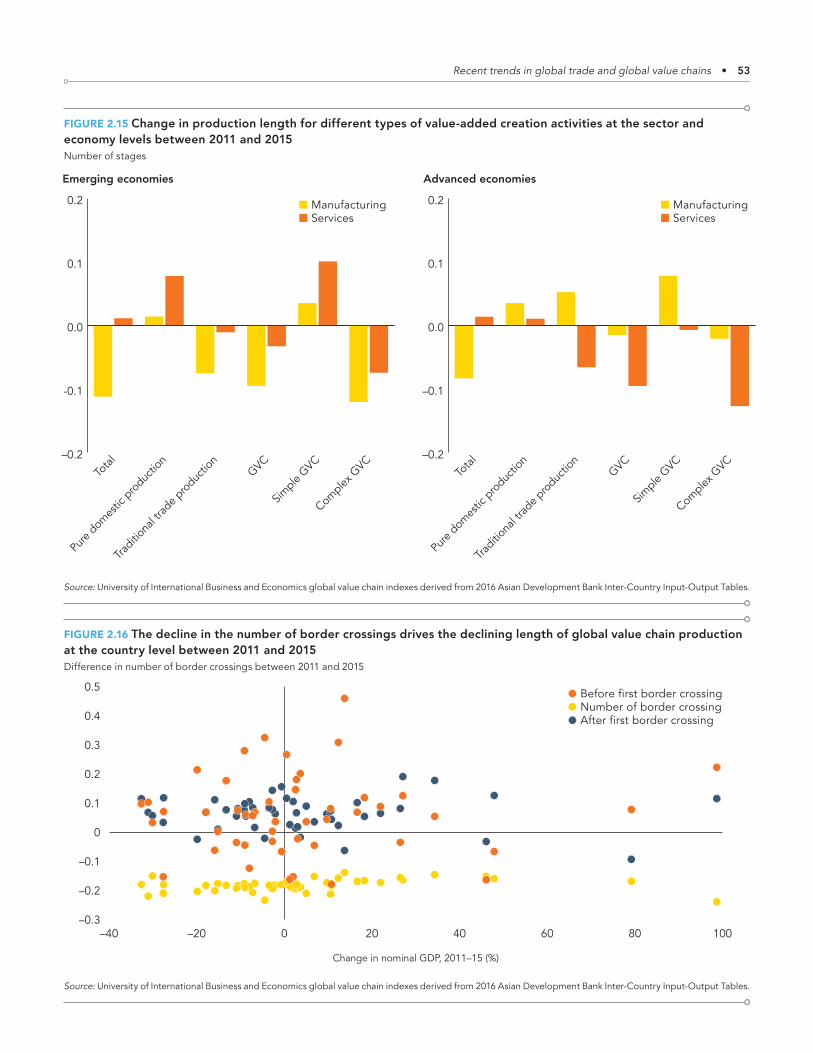
Second, the decline in production length of complex GVC activities can also be observed clearly at the sector level (figure 2.15). For almost all country-sector pairs except agriculture and mining in emerging economies, the production length of com-plex GVC activities declined. The decline in manufacturing was more severe in emerging economies than in advanced econo-mies, and the opposite was true for the decline in services. The production length of simple GVC activities in manufacturing also increased in emerging economies but not as much as in advanced economies. The direction of change is again opposite for services in advanced economies.
FIGURE 2.11 Change in average annual growth rate by type of value-added creation activity between 2003–08 and 2011–15Change in GDP growth rate (percentage points)
–30
–20
–10
0
10
20
–30 –25 –20 –15 –10 –5 0 5 10 15
Change in growth rate by type of GDP creation activity (percentage points)
Pure domestic productionTraditional trade productionSimple GVCComplex GVC
Source: University of International Business and Economics global value chain indexes derived from 2016 Asian Development Bank Inter-Country Input-Output Tables.

50 • Measuring and Analyzing the Impact of GVCs on Economic Development
FIGURE 2.12 Changes in growth of different types of value-added creation activities between country groups with positive and those with negative GDP growth between 2011 and 2015$ (trillions)
Forward linkage
Countries with negative GDP growth Decomposition changes of GVC activities
Countries with positive GDP growth
Countries with positive final output growth
Decomposition changes of GVC activities
Backward linkage
Countries with negative final output growth Decomposition changes of GVC activities
Decomposition changes of GVC activities
–0.3
0.0
0.3
0.6
Complex GVCSimple GVCGVC
–0.8
–0.6
–0.4
–0.2
0.0
Complex GVCSimple GVCGVC
–0.3
0.0
0.3
0.6
Complex GVCSimple GVCGVC
–0.8
–0.6
–0.4
–0.2
0.0
Complex GVCSimple GVCGVC
0
5
10
15
20
GVCTraditionaltrade
production
Puredomestic
production
Finaloutput
–5
–4
–3
–2
–1
0
1
GVCTraditionaltrade
production
Puredomestic
production
Finaloutput
0
5
10
15
20
GVCTraditionaltrade
production
Puredomestic
production
GDP
–5
–4
–3
–2
–1
0
1
GVCTraditionaltrade
production
Puredomestic
production
GDP
= +
= +
= +
= +
= + +
= + +
= + +
= + +
Source: University of International Business and Economics global value chain indexes derived from 2016 Asian Development Bank Inter-Country Input-Output Tables.
Recent trends in global trade and global value chains • 51
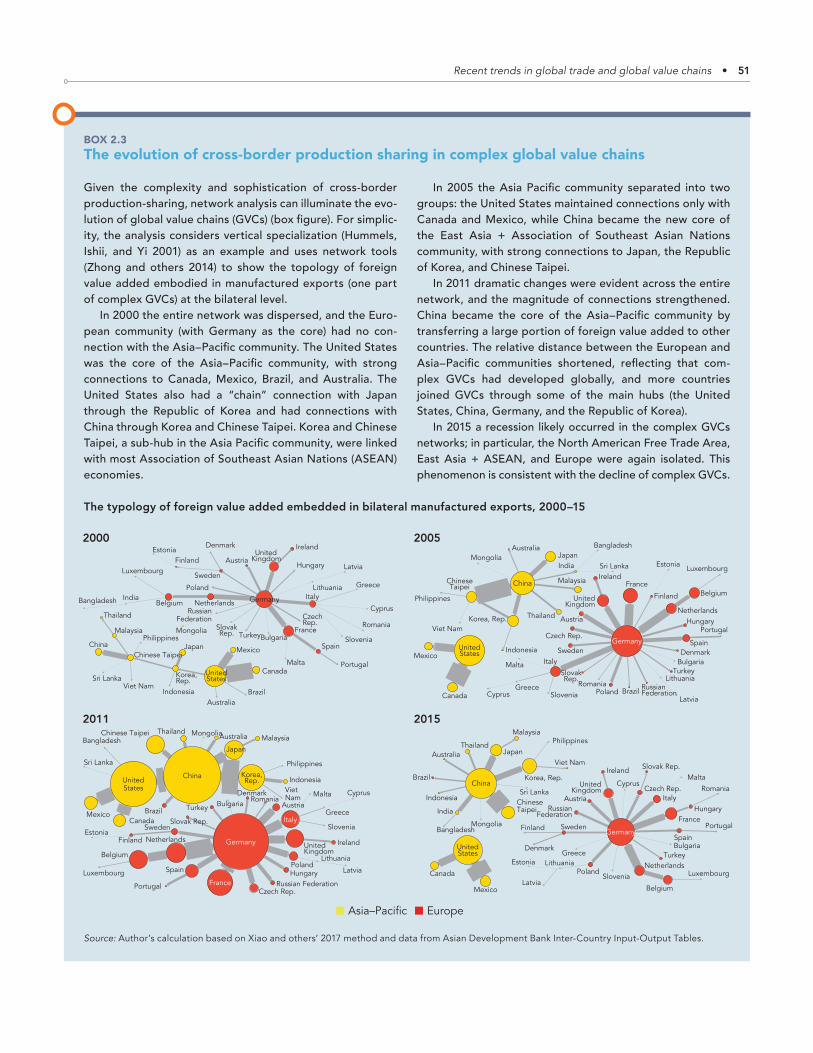
BOX 2.3The evolution of cross-border production sharing in complex global value chains
Given the complexity and sophistication of cross-border production-sharing, network analysis can illuminate the evo-lution of global value chains (GVCs) (box figure). For simplic-ity, the analysis considers vertical specialization (Hummels, Ishii, and Yi 2001) as an example and uses network tools (Zhong and others 2014) to show the topology of foreign value added embodied in manufactured exports (one part of complex GVCs) at the bilateral level.
In 2000 the entire network was dispersed, and the Euro-pean community (with Germany as the core) had no con-nection with the Asia–Pacific community. The United States was the core of the Asia–Pacific community, with strong connections to Canada, Mexico, Brazil, and Australia. The United States also had a “chain” connection with Japan through the Republic of Korea and had connections with China through Korea and Chinese Taipei. Korea and Chinese Taipei, a sub-hub in the Asia Pacific community, were linked with most Association of Southeast Asian Nations (ASEAN) economies.
In 2005 the Asia Pacific community separated into two groups: the United States maintained connections only with Canada and Mexico, while China became the new core of the East Asia + Association of Southeast Asian Nations community, with strong connections to Japan, the Republic of Korea, and Chinese Taipei.
In 2011 dramatic changes were evident across the entire network, and the magnitude of connections strengthened. China became the core of the Asia–Pacific community by transferring a large portion of foreign value added to other countries. The relative distance between the European and Asia–Pacific communities shortened, reflecting that com-plex GVCs had developed globally, and more countries joined GVCs through some of the main hubs (the United States, China, Germany, and the Republic of Korea).
In 2015 a recession likely occurred in the complex GVCs networks; in particular, the North American Free Trade Area, East Asia + ASEAN, and Europe were again isolated. This phenomenon is consistent with the decline of complex GVCs.
The typology of foreign value added embedded in bilateral manufactured exports, 2000–15
2000Australia
Austria
Belgium
Bulgaria
BrazilCanada
China
Cyprus
Czech Rep.Germany
DenmarkSpain
Estonia
Finland
France
UnitedKingdom
Greece
Hungary
Indonesia
IndiaIreland
Italy
Japan
Korea, Rep.
Lithuania
Luxembourg
Latvia
MexicoMalta
Netherlands
Poland
Portugal
Romania RussianFederation
SlovakRep.
Slovenia
Sweden
Turkey
ChineseTaipei
UnitedStates
Bangladesh
Malaysia
Philippines
Thailand
Viet Nam
MongoliaSri Lanka
Australia
Austria
Belgium
Bulgaria
Brazil
Canada
China CyprusCzech Rep.
Germany
DenmarkSpain
Estonia
FinlandFrance
UnitedKingdom
Greece
HungaryIndonesia
India
Ireland
Italy
Japan
Korea, Rep.
LithuaniaLuxembourg
LatviaMexico
Malta
NetherlandsPoland
Portugal
Romania
RussianFederation
Slovak Rep.
Slovenia
Sweden
Turkey
ChineseTaipei
UnitedStates
Bangladesh
MalaysiaPhilippines
Thailand
Viet Nam
Mongolia
Sri Lanka
Australia
Austria
Belgium
BulgariaBrazil
Canada
China
Cyprus
Czech Rep.
Germany
Denmark
Spain
EstoniaFinland
France
UnitedKingdom
Greece
Hungary
IndonesiaIND
Ireland
Italy
Japan
Korea,Rep.
Lithuania
Luxembourg Latvia
Mexico
Malta
Netherlands
Poland
Portugal
Romania
Russian Federation
Slovak Rep.SloveniaSweden
Turkey
Chinese Taipei
UnitedStates
Bangladesh Malaysia
Philippines
Thailand
VietNam
Mongolia
Sri Lanka
20152011
2005
Australia
Austria
Belgium
Bulgaria
Brazil
Canada
China
CyprusCzechRep.
Germany
Denmark
Spain
EstoniaFinland
France
UnitedKingdom
Greece
Hungary
Indonesia
India
Ireland
Italy
Japan
Korea,Rep.
Lithuania
Luxembourg Latvia
Mexico
Malta
Netherlands
Poland
Portugal
Romania
RussianFederation
SlovakRep.
Slovenia
Sweden
Turkey
Chinese Taipei
UnitedStates
Bangladesh
MalaysiaPhilippines
Thailand
Viet Nam
Mongolia
Sri Lanka
Asia–Pacific Europe
Source: Author’s calculation based on Xiao and others’ 2017 method and data from Asian Development Bank Inter-Country Input-Output Tables.

52 • Measuring and Analyzing the Impact of GVCs on Economic Development
Finally, the main reason for the decline in complex GVC pro-duction length is the declining number of national border cross-ings for production. The production length before and after national border crossing actually increased, indicating the poten-tial deepening division of labor within national borders despite the decline in cross-border production-sharing activities. The reduced number of national border crossings for production can be observed in every country in the ADB database (figure 2.16), regardless of whether its GDP grew or declined during this period.
Caution is required in interpreting these conclusions because official statistics always lag behind the real world economy. For example, many aspects of new economies, such as cross-border business- to- business e-commerce, are not easy to measure under the current national account system, so the analysis may underestimate cross-border production-sharing activities. How-ever, stylized facts on changes in the global production structure as summarized from the data are consistent with the following factors.• The rising tide of protection around the globe after the global
financial crisis.• The substitution of domestically produced intermediate
inputs for imported intermediate inputs in major emerging economies, such as China. When the domestic division of labor deepens in emerging economies, more intermediate inputs are produced domestically, so the domestic value chain lengthens, and cross-border production-sharing activ-ities may decline as major emerging economies upgrade along GVCs.
• Technological innovation and reshoring also deepen the domestic division of labor for major developed economies, such as the United States and Japan.It remains to be seen whether such changes are temporary or
permanent.
Measuring smile curves in global value chains: Creation and distribution of value added and job opportunities
From a development perspective, GVCs have at least three positive aspects. First, by linking into GVCs, firms, especially in
FIGURE 2.13 Trend in production length by different types of value-added creation activities, world average, 2000–14Average number of stages in the production process
1
2
3
4
5
6
20142012201020082006200420022000
Complex GVC
GVC
Simple GVC
Total
Pure domestic productionTraditional trade production
Source: University of International Business and Economics global value chain
indexes derived from the 2016 World Input-Output Database.
FIGURE 2.14 Change in production length for different types of value-added creation activities at the global level between 2011 and 2015Number of stages
–0.05
0.00
0.05
0.10
Complex GVCSimple GVCGVCTraditional tradeproduction
Pure domesticproduction
Total
0.15
Source: University of International Business and Economics global value chain indexes derived from 2016 Asian Development Bank Inter-Country Input-Output Tables.
Recent trends in global trade and global value chains • 53
FIGURE 2.15 Change in production length for different types of value-added creation activities at the sector and economy levels between 2011 and 2015Number of stages
–0.2
-0.1
0.0
0.1
0.2
Emerging economies
–0.2
–0.1
0.0
0.1
0.2
Advanced economies
ManufacturingServices
ManufacturingServices
Complex G
VC
Simple
GVCGVC
Traditio
nal tr
ade p
roduc
tion
Pure
domes
tic p
roduc
tion
Total
Complex G
VC
Simple
GVCGVC
Traditio
nal tr
ade p
roduc
tion
Pure
domes
tic p
roduc
tion
Total
Source: University of International Business and Economics global value chain indexes derived from 2016 Asian Development Bank Inter-Country Input-Output Tables.
FIGURE 2.16 The decline in the number of border crossings drives the declining length of global value chain production at the country level between 2011 and 2015Difference in number of border crossings between 2011 and 2015
Change in nominal GDP, 2011–15 (%)
–40 –20 0 20 40 60 80 100–0.3
–0.2
–0.1
0
0.1
0.2
0.3
0.4
0.5 Before first border crossingNumber of border crossingAfter first border crossing
Source: University of International Business and Economics global value chain indexes derived from 2016 Asian Development Bank Inter-Country Input-Output Tables.
54 • Measuring and Analyzing the Impact of GVCs on Economic Development
developing economies, do not need to build the entire course of production capacity for a product. Instead, they can use their comparative advantage to concentrate on a specific production process or task, which enables them to integrate into the global economy more rapidly than was possible in the previous industri-alization period (Kowalski and others 2015). Second, becoming a part of GVCs can create more job opportunities (UNCTAD 2013). For example, jobs are created in developing countries through iPhone assembly in China, call center operations in the Philip-pines and India, Nike shoe production in Viet Nam, and automo-bile and auto parts production in Mexico and Thailand. Third, GVCs also provide the opportunity for technology transfers or spillovers from developed countries to developing countries through local learning (Pietrobelli and Rabellotti 2010; Kawakami and Sturgeon 2012).
However, as mentioned in OECD, WTO, and World Bank Group (2014, p. 4), “Gains from GVC participation are not auto-matic. Benefits of GVCs can also vary considerably depending on whether a country operates at the high or at the low end of the value chain.” Thus, developed and developing countries may face quite different costs and risks in joining GVCs (Baldwin, Ito, and Sato 2014). Because of differences in comparative advan-tage across countries in GVC participation, developed countries tend to engage in high-end and intangible production activities, such as research and development, design, and brand building in the prefabrication stages and in after-sales services and mar-keting in the postfabrication stages. Thus, these countries may worry about the hollowing out of their economies as manufac-turing jobs are offshored to low-technology, low-wage countries. Developing countries, in contrast, tend to focus on low-end and tangible production activities such as manufacturing and assem-bly. So, they may worry that they are getting the wrong types of jobs and that their economies could be locked in to the bottom of the GVC “smile curve,” which presents an outline of the value-added potential of each production stage in a value chain for various industries.
The concept of the smile curve was first proposed around 1992 by Stan Shih, the founder of Acer, a technology company headquartered in Chinese Taipei (Shih 1996). In the personal computer industry, Shih observed that both ends of the value chain bring higher value added to the product than the middle part. The logic of the smile curve has been widely used and discussed in the context of GVCs. However, most research has focused on product-level case studies rather than the economy-wide implications.
Smile curves can help answer numerous questions at the econ-omy level. What is the relationship between developed and devel-oping countries in the creation and distribution of value added and job opportunities in GVCs? Do smile curves exist for country or industry GVCs? If yes, have smile curves deepened or flattened over the years? Have developing countries been locked into the low end of GVCs? Which policies can help countries maintain or improve their competitiveness on the smile curve? And how can
developing countries integrate into GVCs successfully and then move up from the low end to the high end of the smile curve? Answers to these questions are crucial for designing development strategies, industrial policies, and international governance. This section considers several highly fragmented exporting industries in some countries to show how value added and job opportunities are created and distributed in GVCs along various smile curves.
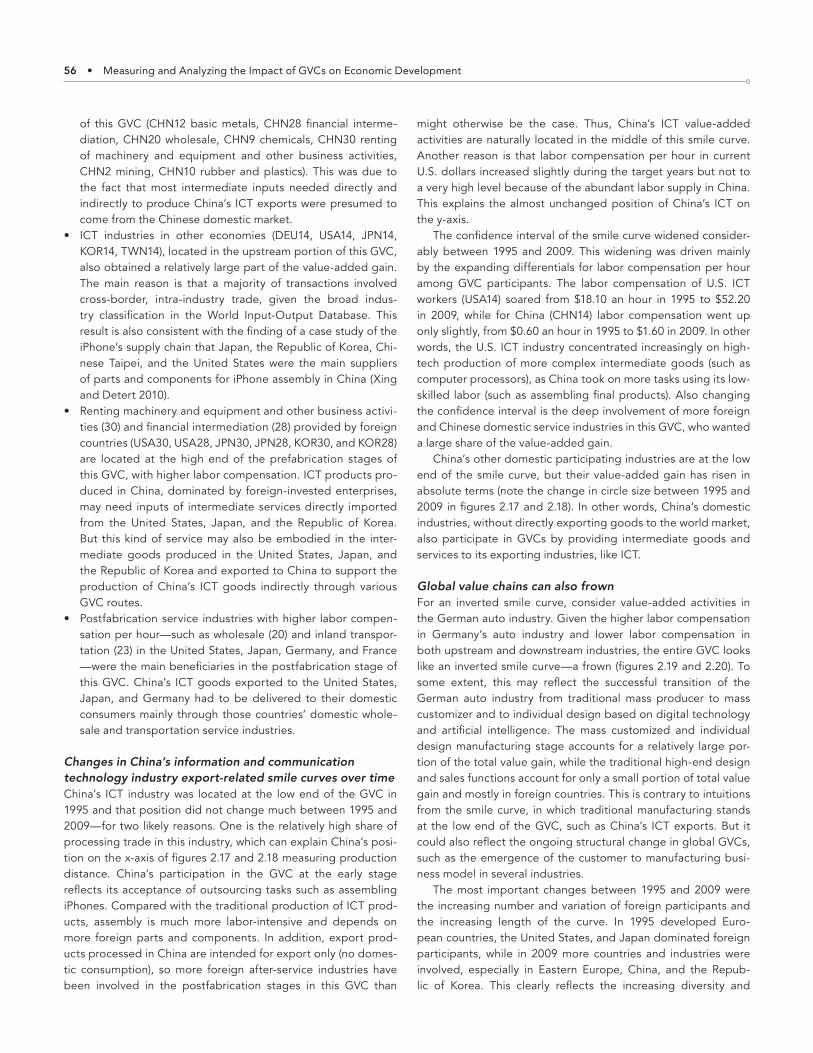
China’s information and communication technology industry export-related smile curves: Distribution of value added and job opportunitiesYe, Meng, and Wei (2015) and Meng, Ye, and Wei (2017) consis-tently measure both the value-added gain from GVC participa-tion and the distance (total production length) between produc-ers and consumers. Following their approach, smile curves can be drawn for various GVCs. A good starting point would be the iPhone, labeled “Designed by Apple in California; assembled in China.” But it is difficult to isolate the iPhone industry in exist-ing intercountry input- output databases. Here, the first step is to examine the information and communication technology (ICT) industry (industry 14, Electrical and Optical Equipment, in the World Input-Output Database) as a proxy to show how, and to what extent, countries and industries are involved in the GVCs for China’s ICT product exports.
In figures 2.17 and 2.18 the y-axis shows labor compensation per hour (a proxy for technology level or a first-order approxima-tion of labor productivity in current U.S. dollars), and the x-axis denotes distance, measured by the total forward linkage–based production length between global consumers of ICT products and a specific participating industry in the corresponding GVC. The 2013 version of World Input-Output Database data are used here, covering 41 economies and 35 industries, with the total number of GVC participants (41 × 35 = 1,435) represented as a circle in the figure. The size of the circle represents the absolute value added gained by joining the corresponding GVC (thresh-old equals 0.1% of the total value added gain). The smooth line is fitted by local polynomial regression–smoothing weighted by its value-added gain, and the shadowed area represents the con-fidence interval around the smooth line. Using the smile curve can lead to an understanding of the participants (countries and industries) of a specific GVC as well as their positions and gains in the chain.
The plotted GVC for China’s ICT exports to the world market clearly appears as a smile curve; to save space, only values for 1995 and 2009 are shown (see figures 2.17 and 2.18). Several styl-ized facts emerge from these curves:• China had the largest value-added gain in this GVC. China’s
ICT industry (CHN14) was the most affected industry based on China’s production of ICT exports through domestic back-ward and intra-industrial linkages.
• Several other Chinese domestic industries whose lowest labor compensation placed them at the low end of the smile curve also benefited by participating in prefabrication stages
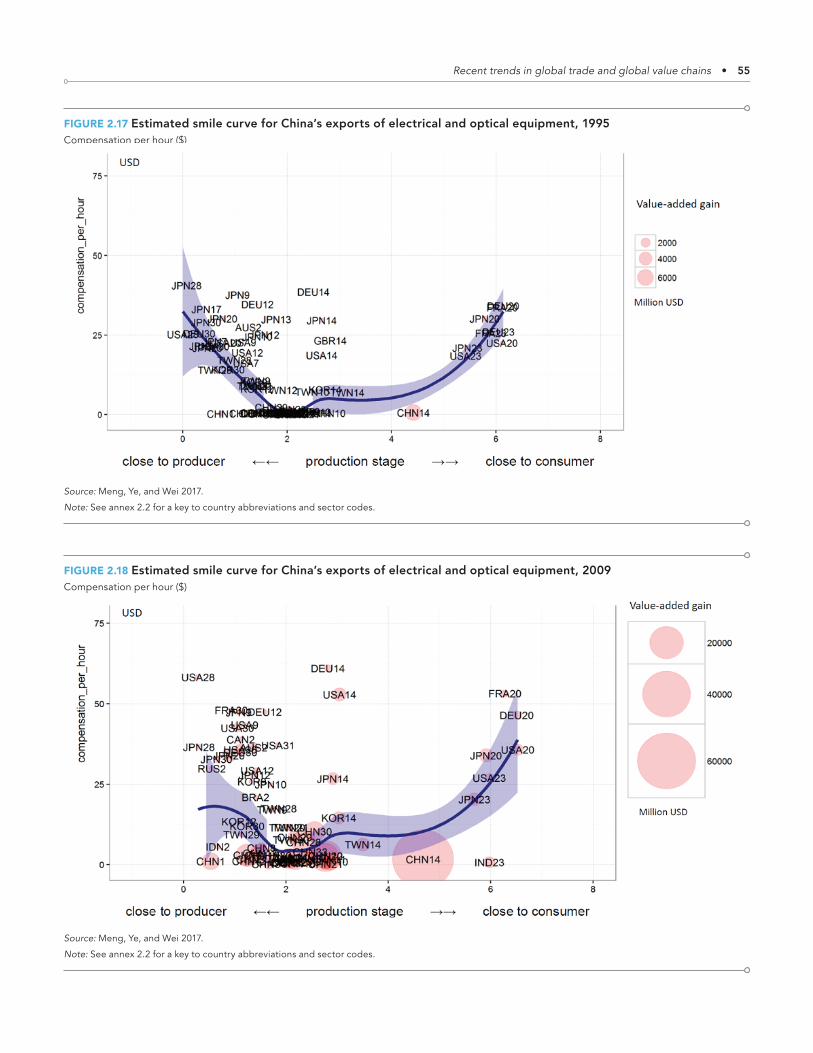
Recent trends in global trade and global value chains • 55
FIGURE 2.17 Estimated smile curve for China’s exports of electrical and optical equipment, 1995Compensation per hour ($)
Source: Meng, Ye, and Wei 2017.
Note: See annex 2.2 for a key to country abbreviations and sector codes.
FIGURE 2.18 Estimated smile curve for China’s exports of electrical and optical equipment, 2009Compensation per hour ($)
Source: Meng, Ye, and Wei 2017.
Note: See annex 2.2 for a key to country abbreviations and sector codes.
56 • Measuring and Analyzing the Impact of GVCs on Economic Development
of this GVC (CHN12 basic metals, CHN28 financial interme-diation, CHN20 wholesale, CHN9 chemicals, CHN30 renting of machinery and equipment and other business activities, CHN2 mining, CHN10 rubber and plastics). This was due to the fact that most intermediate inputs needed directly and indirectly to produce China’s ICT exports were presumed to come from the Chinese domestic market.
• ICT industries in other economies (DEU14, USA14, JPN14, KOR14, TWN14), located in the upstream portion of this GVC, also obtained a relatively large part of the value-added gain. The main reason is that a majority of transactions involved cross-border, intra-industry trade, given the broad indus-try classification in the World Input-Output Database. This result is also consistent with the finding of a case study of the iPhone’s supply chain that Japan, the Republic of Korea, Chi-nese Taipei, and the United States were the main suppliers of parts and components for iPhone assembly in China (Xing and Detert 2010).
• Renting machinery and equipment and other business activi-ties (30) and financial intermediation (28) provided by foreign countries (USA30, USA28, JPN30, JPN28, KOR30, and KOR28) are located at the high end of the prefabrication stages of this GVC, with higher labor compensation. ICT products pro-duced in China, dominated by foreign-invested enterprises, may need inputs of intermediate services directly imported from the United States, Japan, and the Republic of Korea. But this kind of service may also be embodied in the inter-mediate goods produced in the United States, Japan, and the Republic of Korea and exported to China to support the production of China’s ICT goods indirectly through various GVC routes.
• Postfabrication service industries with higher labor compen-sation per hour — such as wholesale (20) and inland transpor-tation (23) in the United States, Japan, Germany, and France — were the main beneficiaries in the postfabrication stage of this GVC. China’s ICT goods exported to the United States, Japan, and Germany had to be delivered to their domestic consumers mainly through those countries’ domestic whole-sale and transportation service industries.
Changes in China’s information and communication technology industry export-related smile curves over timeChina’s ICT industry was located at the low end of the GVC in 1995 and that position did not change much between 1995 and 2009 — for two likely reasons. One is the relatively high share of processing trade in this industry, which can explain China’s posi-tion on the x-axis of figures 2.17 and 2.18 measuring production distance. China’s participation in the GVC at the early stage reflects its acceptance of outsourcing tasks such as assembling iPhones. Compared with the traditional production of ICT prod-ucts, assembly is much more labor-intensive and depends on more foreign parts and components. In addition, export prod-ucts processed in China are intended for export only (no domes-tic consumption), so more foreign after-service industries have been involved in the postfabrication stages in this GVC than
might otherwise be the case. Thus, China’s ICT value-added activities are naturally located in the middle of this smile curve. Another reason is that labor compensation per hour in current U.S. dollars increased slightly during the target years but not to a very high level because of the abundant labor supply in China. This explains the almost unchanged position of China’s ICT on the y-axis.
The confidence interval of the smile curve widened consider-ably between 1995 and 2009. This widening was driven mainly by the expanding differentials for labor compensation per hour among GVC participants. The labor compensation of U.S. ICT workers (USA14) soared from $18.10 an hour in 1995 to $52.20 in 2009, while for China (CHN14) labor compensation went up only slightly, from $0.60 an hour in 1995 to $1.60 in 2009. In other words, the U.S. ICT industry concentrated increasingly on high-tech production of more complex intermediate goods (such as computer processors), as China took on more tasks using its low-skilled labor (such as assembling final products). Also changing the confidence interval is the deep involvement of more foreign and Chinese domestic service industries in this GVC, who wanted a large share of the value-added gain.
China’s other domestic participating industries are at the low end of the smile curve, but their value-added gain has risen in absolute terms (note the change in circle size between 1995 and 2009 in figures 2.17 and 2.18). In other words, China’s domestic industries, without directly exporting goods to the world market, also participate in GVCs by providing intermediate goods and services to its exporting industries, like ICT.
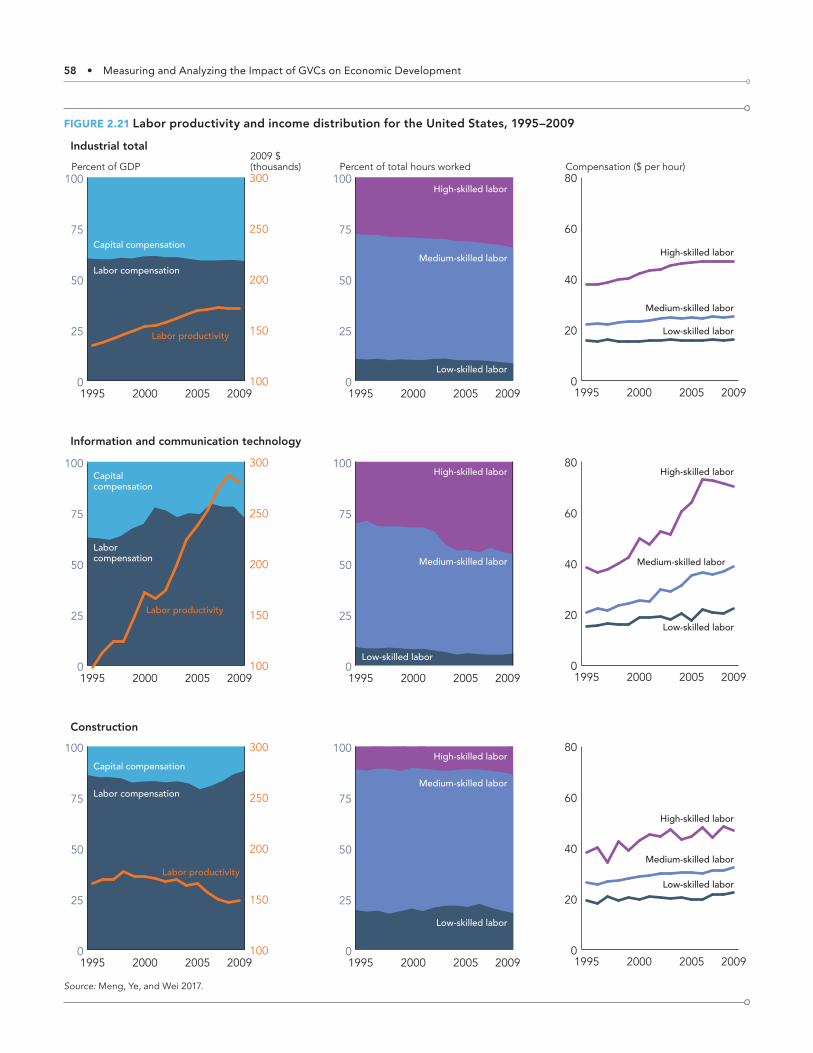
Global value chains can also frownFor an inverted smile curve, consider value-added activities in the German auto industry. Given the higher labor compensation in Germany’s auto industry and lower labor compensation in both upstream and downstream industries, the entire GVC looks like an inverted smile curve — a frown (figures 2.19 and 2.20). To some extent, this may reflect the successful transition of the German auto industry from traditional mass producer to mass customizer and to individual design based on digital technology and artificial intelligence. The mass customized and individual design manufacturing stage accounts for a relatively large por-tion of the total value gain, while the traditional high-end design and sales functions account for only a small portion of total value gain and mostly in foreign countries. This is contrary to intuitions from the smile curve, in which traditional manufacturing stands at the low end of the GVC, such as China’s ICT exports. But it could also reflect the ongoing structural change in global GVCs, such as the emergence of the customer to manufacturing busi-ness model in several industries.
The most important changes between 1995 and 2009 were the increasing number and variation of foreign participants and the increasing length of the curve. In 1995 developed Euro-pean countries, the United States, and Japan dominated foreign participants, while in 2009 more countries and industries were involved, especially in Eastern Europe, China, and the Repub-lic of Korea. This clearly reflects the increasing diversity and
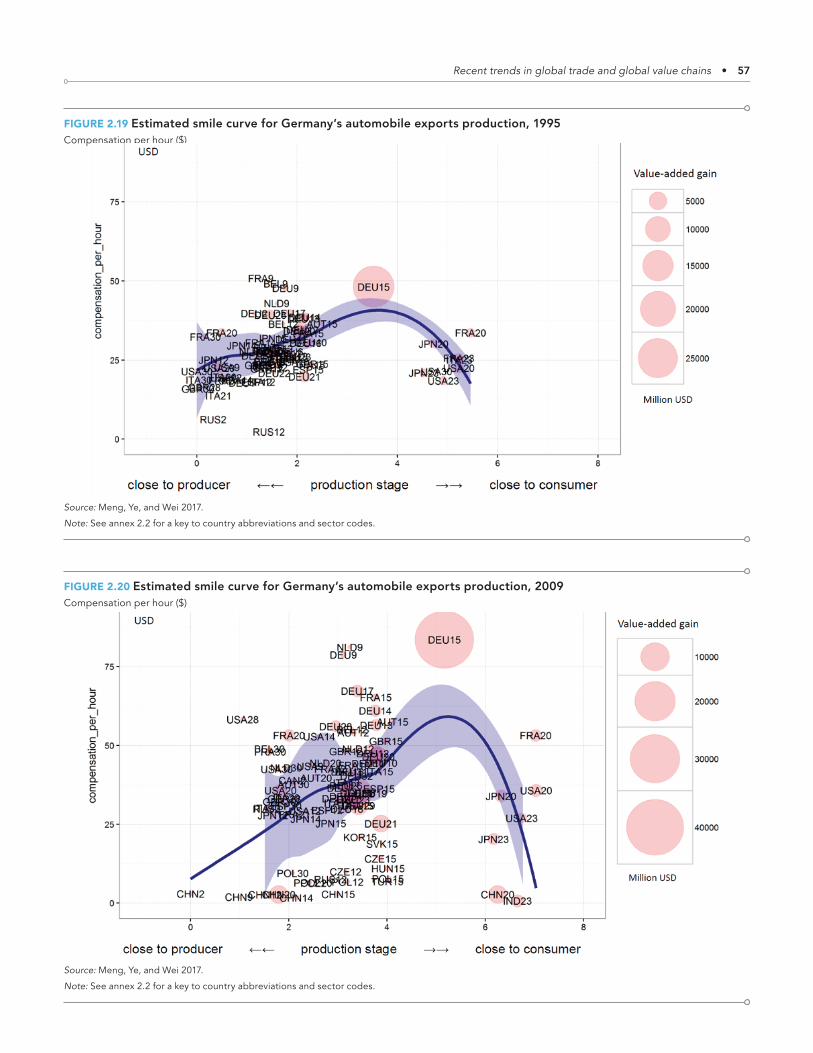
Recent trends in global trade and global value chains • 57
FIGURE 2.19 Estimated smile curve for Germany’s automobile exports production, 1995Compensation per hour ($)
Source: Meng, Ye, and Wei 2017.
Note: See annex 2.2 for a key to country abbreviations and sector codes.
FIGURE 2.20 Estimated smile curve for Germany’s automobile exports production, 2009Compensation per hour ($)
Source: Meng, Ye, and Wei 2017.
Note: See annex 2.2 for a key to country abbreviations and sector codes.
58 • Measuring and Analyzing the Impact of GVCs on Economic Development
FIGURE 2.21 Labor productivity and income distribution for the United States, 1995–2009
0
25
50
75
100
2009200520001995
0
25
50
75
100
2009200520001995
0
25
50
75
100
2009200520001995
0
25
50
75
100
2009200520001995
Industrial total
0
20
40
60
80
2009200520001995
Capital compensation
Labor compensation
Labor productivity
Medium-skilled labor
High-skilled labor
Low-skilled labor
Medium-skilled labor
High-skilled labor
Low-skilled labor
Medium-skilled labor
High-skilled labor
Low-skilled labor
0
20
40
60
80
2009200520001995
Medium-skilled labor
High-skilled labor
Low-skilled labor
Capital compensation
Labor compensation
Labor productivity
100
150
200
250
300
Construction
100
150
200
250
300
Percent of GDP Percent of total hours worked Compensation ($ per hour)2009 $(thousands)
Information and communication technology
0
20
40
60
80
2009200520001995
Medium-skilled labor
High-skilled labor
Low-skilled labor
0
25
50
75
100
20092005200019950
25
50
75
100
2009200520001995
Medium-skilled labor
Low-skilled labor
High-skilled laborCapitalcompensation
Laborcompensation
Labor productivity
100
150
200
250
300
Source: Meng, Ye, and Wei 2017.

Recent trends in global trade and global value chains • 59
FIGURE 2.22 Labor productivity and income distribution for China, 1995–2009
0
25
50
75
100
2009200520001995
0
25
50
75
100
20092005200019950
25
50
75
100
2009200520001995
Industrial total
0
5
10
15
20
2009200520001995
Capitalcompensation
Labor compensation
Labor productivity
Medium-skilledlabor
High-skilled labor
Low-skilled labor
Medium-skilled labor
High-skilled labor
Low-skilled labor0
5
10
15
20
2009200520001995
High-skilled labor
Low-skilled labor
Capital compensation
Labor compensation
Labor productivity
0
100
200
300
400
500
600
700
Construction
0
100
200
300
400
500
600
700
Percent of GDP Percent of total hours worked Compensation (renminbi per hour)2009 renminbi(thousands)
Medium-skilled labor
Information and communication technology
0
25
50
75
100
2009200520001995
Medium-skilled labor
High-skilled labor
Low-skilled labor
0
25
50
75
100
200920052000199520092005200019950
25
50
75
100
0
5
10
15
20
2009200520001995
Medium-skilled labor
High-skilled labor
Low-skilled labor
High-skilled labor
Low-skilled labor
Capital compensation
Labor compensation
Labor productivity
0
100
200
300
400
500
600
700
Medium-skilled labor
Source: Meng, Ye, and Wei 2017.
60 • Measuring and Analyzing the Impact of GVCs on Economic Development
complexity of international fragmentation in Germany’s auto exports. In addition, given the increase in labor compensation and absolute value-added gain in Germany’s auto industry and the relatively low labor compensation of upstream participants from China, the slope of the entire curve became much steeper.
Labor productivity and income distribution in global value chainsSmile curve mapping can be a touchstone for better understand-ing various country and industry positions and value-added gains from participating in GVCs. The empirical results presented so far raise an important issue about the relation between economic effi-ciency and income (or job opportunity) distribution along GVCs from the perspective of economic development. Following Meng, Ye, and Wei (2017), this section considers the ICT industry, an industry dominated by international production sharing, and the construction industry, one of the most domestic- oriented indus-tries (relatively less influenced by international trade). It also con-siders the United States and China as country comparisons since both are active in GVCs. The United States joins GVCs mainly from upstream — such as exporting complex intermediate goods, parts, and components — or through foreign direct investment outflows to developing countries. China joins GVCs mainly from downstream — such as exporting assembled final goods — or through foreign direct investment inflows (before the global financial crisis).
U.S. labor productivity (measured as output per person eco-nomically engaged, in 2009 national currency) increased rapidly from 1995 to 2009 as the U.S. economy became more efficient, with income distribution between capital and labor a relatively stable in their shares in total value added (figure 2.21). But high-skilled workers received more job opportunities, with increased compensation per hour, while medium- and low-skilled workers lost jobs gradually, with only a small increase in pay for medium-skilled workers and almost no change in compensation for low-skilled workers over the 15 years for which data are available. This phenomenon was more pronounced in ICT industries, while no significant change was observed in the income distribution between skilled and unskilled workers in construction. In other words, the rise of GVCs (and technological innovation) may lead to greater efficiency in the U.S. economy but may also leave low-skilled workers worse off, especially in industries with more out-sourcing of production tasks to low-wage developing countries such as China.
For the same industries in China, the evolution is very differ-ent, but it may be highly correlated with the U.S. phenomenon. China’s labor productivity also increased, but more value added was distributed to capital than to labor (figure 2.22). The gain accrued to the capital deployed in China, and that would include multinational corporations involved in GVCs. Given this, and the very large portion of low-skilled workers in China’s domestic labor market, the slow growth in compensation per hour for low-skilled workers should come as no surprise.
China, with the world’s largest pool of low-skilled labor, meets the United States, the world’s largest capital-abundant coun-try, through GVCs. This intersection generates very different
but highly correlated income distribution changes. The United States is facing the challenge of job offshoring for medium- and low-skilled workers and downward pressure on their wages. Until 2009, China faced the challenge of unequal income distri-bution between capital and labor, with very low compensation for low-skilled labor. In the United States the big winners appear to be high-skilled workers and multinational corporations. GVCs enabled them to benefit from the enormous productivity gains in developing countries such as China. In China, by contrast, ordi-nary workers benefited. Even at the beginning of the process, factory wages in China were far ahead of rural incomes. And those wages doubled over 15 years. This is one of the driving fac-tors behind the impressive decline of absolute poverty in China. But the really big benefits in China accrued to the small number of high-skilled workers and to the owners of capital, including foreign investors.
In summary, while developed and developing countries may face quite different costs and risks in joining GVCs, doing so may lead to efficiency improvements. But without proper domestic labor market adjustment policies and universal-coverage safety nets, as well as better international governance, medium-skilled and especially low-skilled workers can become the most easily injured groups in both developed and developing economies.
Conclusions
The rise of GVCs has dramatically changed the world economy. After explaining the changing patterns of global GDP and trade growth and the limitation of traditional trade indicators, this chapter showed how to use the most recent GVC indicators to decompose country and sector GDP and final goods production into GVC and non-GVC activities. These new indicators were also used to identify the production length and degree of participa-tion (simple or complex) in GVCs at the country and sector levels. This analysis found that complex GVC-related cross-border pro-duction-sharing activities were the most important force driving globalization and the growth of global GDP during 1995–2000 and 2000–08 before declining during 2012–15.
Why did complex GVC activities decline? As industrial upgrad-ing occurred in emerging economies, especially in China, pro-cessing trade declined. Trade protectionism may have increased due to the slow pace of economic recovery after the 2008–09 global financial crisis. And some types of manufacturing jobs may have returned to source countries (reshoring) in response to technology innovation.
Smile curve analysis was used to show how these new phe-nomena affect the distribution of value added and job oppor-tunities in GVCs across countries. This analysis shows that coun-tries and sectors can achieve very different value added and job gains along GVCs depending on their position and degree of participation. Joining a GVC increases economic efficiency, but this can have a distributional impact. The remaining chapters in this report discuss how to resolve the distribution issue and help participants from developing countries move up the smile curve.
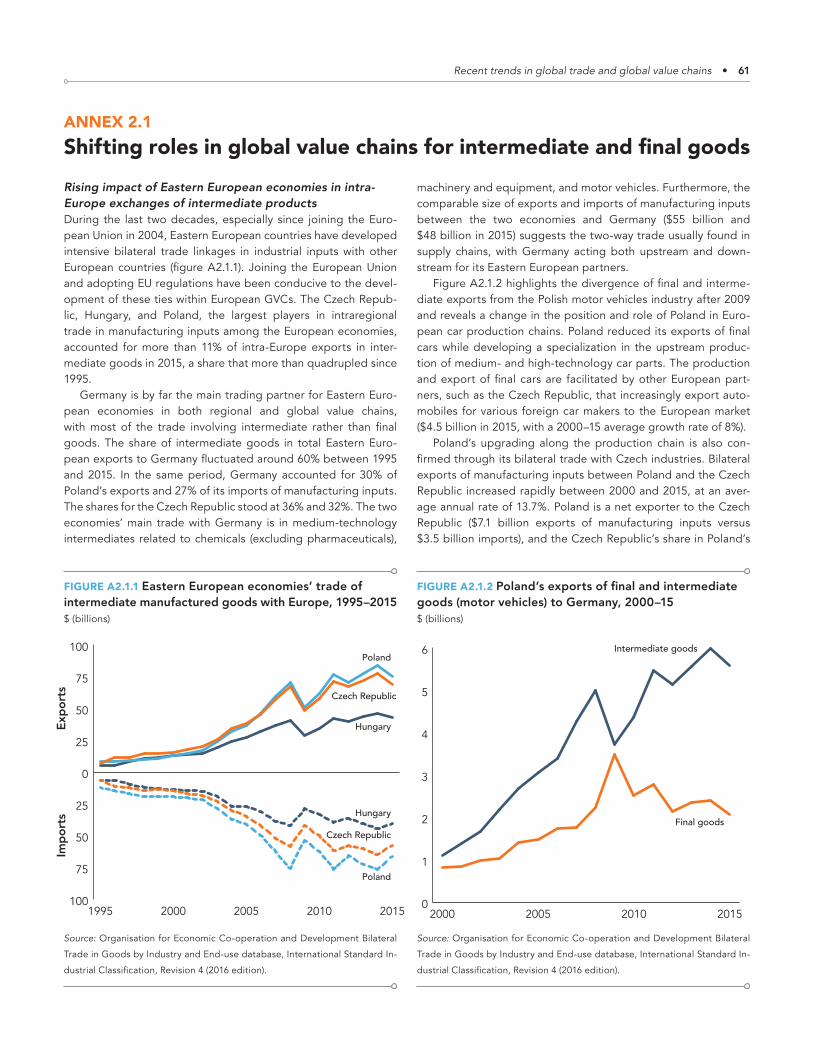
Recent trends in global trade and global value chains • 61
ANNEX 2.1Shifting roles in global value chains for intermediate and final goodsRising impact of Eastern European economies in intra-Europe exchanges of intermediate productsDuring the last two decades, especially since joining the Euro-pean Union in 2004, Eastern European countries have developed intensive bilateral trade linkages in industrial inputs with other European countries (figure A2.1.1). Joining the European Union and adopting EU regulations have been conducive to the devel-opment of these ties within European GVCs. The Czech Repub-lic, Hungary, and Poland, the largest players in intraregional trade in manufacturing inputs among the European economies, accounted for more than 11% of intra-Europe exports in inter-mediate goods in 2015, a share that more than quadrupled since 1995.
Germany is by far the main trading partner for Eastern Euro-pean economies in both regional and global value chains, with most of the trade involving intermediate rather than final goods. The share of intermediate goods in total Eastern Euro-pean exports to Germany fluctuated around 60% between 1995 and 2015. In the same period, Germany accounted for 30% of Poland’s exports and 27% of its imports of manufacturing inputs. The shares for the Czech Republic stood at 36% and 32%. The two economies’ main trade with Germany is in medium-technology intermediates related to chemicals (excluding pharmaceuticals),
machinery and equipment, and motor vehicles. Furthermore, the comparable size of exports and imports of manufacturing inputs between the two economies and Germany ($55 billion and $48 billion in 2015) suggests the two-way trade usually found in supply chains, with Germany acting both upstream and down-stream for its Eastern European partners.
Figure A2.1.2 highlights the divergence of final and interme-diate exports from the Polish motor vehicles industry after 2009 and reveals a change in the position and role of Poland in Euro-pean car production chains. Poland reduced its exports of final cars while developing a specialization in the upstream produc-tion of medium- and high-technology car parts. The production and export of final cars are facilitated by other European part-ners, such as the Czech Republic, that increasingly export auto-mobiles for various foreign car makers to the European market ($4.5 billion in 2015, with a 2000–15 average growth rate of 8%).
Poland’s upgrading along the production chain is also con-firmed through its bilateral trade with Czech industries. Bilateral exports of manufacturing inputs between Poland and the Czech Republic increased rapidly between 2000 and 2015, at an aver-age annual rate of 13.7%. Poland is a net exporter to the Czech Republic ($7.1 billion exports of manufacturing inputs versus $3.5 billion imports), and the Czech Republic’s share in Poland’s
FIGURE A2.1.1 Eastern European economies’ trade of intermediate manufactured goods with Europe, 1995–2015$ (billions)
100
75
50
25
0
25
50
75
100
20152010200520001995
Czech Republic
Poland
Hungary
Czech Republic
Poland
Hungary
Expo
rts
Impo
rts
Source: Organisation for Economic Co-operation and Development Bilateral
Trade in Goods by Industry and End-use database, International Standard In-
dustrial Classification, Revision 4 (2016 edition).
FIGURE A2.1.2 Poland’s exports of final and intermediate goods (motor vehicles) to Germany, 2000–15$ (billions)
0
1
2
3
4
5
6
2015201020052000
Final goods
Intermediate goods
Source: Organisation for Economic Co-operation and Development Bilateral
Trade in Goods by Industry and End-use database, International Standard In-
dustrial Classification, Revision 4 (2016 edition).
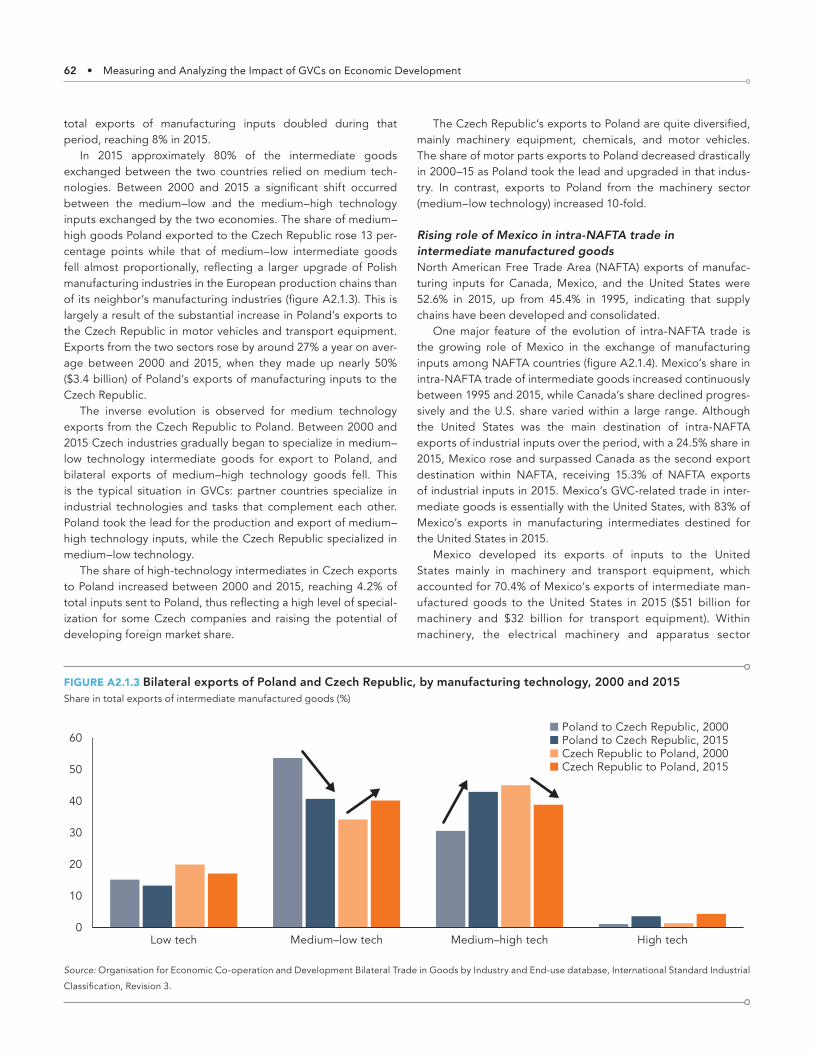
62 • Measuring and Analyzing the Impact of GVCs on Economic Development
total exports of manufacturing inputs doubled during that period, reaching 8% in 2015.
In 2015 approximately 80% of the intermediate goods exchanged between the two countries relied on medium tech-nologies. Between 2000 and 2015 a significant shift occurred between the medium–low and the medium–high technology inputs exchanged by the two economies. The share of medium–high goods Poland exported to the Czech Republic rose 13 per-centage points while that of medium–low intermediate goods fell almost proportionally, reflecting a larger upgrade of Polish manufacturing industries in the European production chains than of its neighbor’s manufacturing industries (figure A2.1.3). This is largely a result of the substantial increase in Poland’s exports to the Czech Republic in motor vehicles and transport equipment. Exports from the two sectors rose by around 27% a year on aver-age between 2000 and 2015, when they made up nearly 50% ($3.4 billion) of Poland’s exports of manufacturing inputs to the Czech Republic.
The inverse evolution is observed for medium technology exports from the Czech Republic to Poland. Between 2000 and 2015 Czech industries gradually began to specialize in medium–low technology intermediate goods for export to Poland, and bilateral exports of medium–high technology goods fell. This is the typical situation in GVCs: partner countries specialize in industrial technologies and tasks that complement each other. Poland took the lead for the production and export of medium–high technology inputs, while the Czech Republic specialized in medium–low technology.
The share of high-technology intermediates in Czech exports to Poland increased between 2000 and 2015, reaching 4.2% of total inputs sent to Poland, thus reflecting a high level of special-ization for some Czech companies and raising the potential of developing foreign market share.
The Czech Republic’s exports to Poland are quite diversified, mainly machinery equipment, chemicals, and motor vehicles. The share of motor parts exports to Poland decreased drastically in 2000–15 as Poland took the lead and upgraded in that indus-try. In contrast, exports to Poland from the machinery sector (medium–low technology) increased 10-fold.
Rising role of Mexico in intra-NAFTA trade in intermediate manufactured goodsNorth American Free Trade Area (NAFTA) exports of manufac-turing inputs for Canada, Mexico, and the United States were 52.6% in 2015, up from 45.4% in 1995, indicating that supply chains have been developed and consolidated.
One major feature of the evolution of intra-NAFTA trade is the growing role of Mexico in the exchange of manufacturing inputs among NAFTA countries (figure A2.1.4). Mexico’s share in intra-NAFTA trade of intermediate goods increased continuously between 1995 and 2015, while Canada’s share declined progres-sively and the U.S. share varied within a large range. Although the United States was the main destination of intra-NAFTA exports of industrial inputs over the period, with a 24.5% share in 2015, Mexico rose and surpassed Canada as the second export destination within NAFTA, receiving 15.3% of NAFTA exports of industrial inputs in 2015. Mexico’s GVC-related trade in inter-mediate goods is essentially with the United States, with 83% of Mexico’s exports in manufacturing intermediates destined for the United States in 2015.
Mexico developed its exports of inputs to the United States mainly in machinery and transport equipment, which accounted for 70.4% of Mexico’s exports of intermediate man-ufactured goods to the United States in 2015 ($51 billion for machinery and $32 billion for transport equipment). Within machinery, the electrical machinery and apparatus sector
FIGURE A2.1.3 Bilateral exports of Poland and Czech Republic, by manufacturing technology, 2000 and 2015Share in total exports of intermediate manufactured goods (%)
0
10
20
30
40
50
60
High techMedium–high techMedium–low techLow tech
Poland to Czech Republic, 2000Poland to Czech Republic, 2015Czech Republic to Poland, 2000Czech Republic to Poland, 2015
Source: Organisation for Economic Co-operation and Development Bilateral Trade in Goods by Industry and End-use database, International Standard Industrial
Classification, Revision 3.
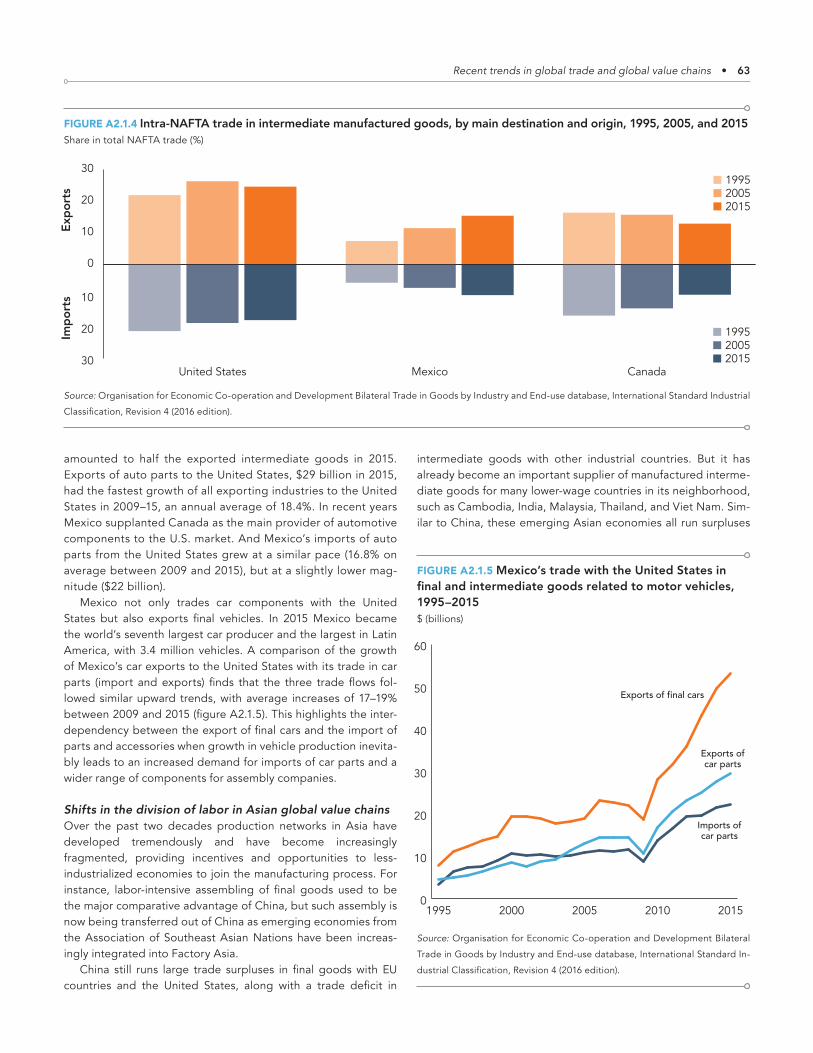
Recent trends in global trade and global value chains • 63
amounted to half the exported intermediate goods in 2015. Exports of auto parts to the United States, $29 billion in 2015, had the fastest growth of all exporting industries to the United States in 2009–15, an annual average of 18.4%. In recent years Mexico supplanted Canada as the main provider of automotive components to the U.S. market. And Mexico’s imports of auto parts from the United States grew at a similar pace (16.8% on average between 2009 and 2015), but at a slightly lower mag-nitude ($22 billion).
Mexico not only trades car components with the United States but also exports final vehicles. In 2015 Mexico became the world’s seventh largest car producer and the largest in Latin America, with 3.4 million vehicles. A comparison of the growth of Mexico’s car exports to the United States with its trade in car parts (import and exports) finds that the three trade flows fol-lowed similar upward trends, with average increases of 17–19% between 2009 and 2015 (figure A2.1.5). This highlights the inter-dependency between the export of final cars and the import of parts and accessories when growth in vehicle production inevita-bly leads to an increased demand for imports of car parts and a wider range of components for assembly companies.
Shifts in the division of labor in Asian global value chainsOver the past two decades production networks in Asia have developed tremendously and have become increasingly fragmented, providing incentives and opportunities to less- industrialized economies to join the manufacturing process. For instance, labor-intensive assembling of final goods used to be the major comparative advantage of China, but such assembly is now being transferred out of China as emerging economies from the Association of Southeast Asian Nations have been increas-ingly integrated into Factory Asia.
China still runs large trade surpluses in final goods with EU countries and the United States, along with a trade deficit in
intermediate goods with other industrial countries. But it has already become an important supplier of manufactured interme-diate goods for many lower-wage countries in its neighborhood, such as Cambodia, India, Malaysia, Thailand, and Viet Nam. Sim-ilar to China, these emerging Asian economies all run surpluses
FIGURE A2.1.4 Intra-NAFTA trade in intermediate manufactured goods, by main destination and origin, 1995, 2005, and 2015Share in total NAFTA trade (%)
30
20
10
0
10
20
30
CanadaMexicoUnited States
199520052015
199520052015
Expo
rts
Impo
rts
Source: Organisation for Economic Co-operation and Development Bilateral Trade in Goods by Industry and End-use database, International Standard Industrial
Classification, Revision 4 (2016 edition).
FIGURE A2.1.5 Mexico’s trade with the United States in final and intermediate goods related to motor vehicles, 1995–2015$ (billions)
0
10
20
30
40
50
60
20152010200520001995
Exports of final cars
Exports ofcar parts
Imports ofcar parts
Source: Organisation for Economic Co-operation and Development Bilateral
Trade in Goods by Industry and End-use database, International Standard In-
dustrial Classification, Revision 4 (2016 edition).
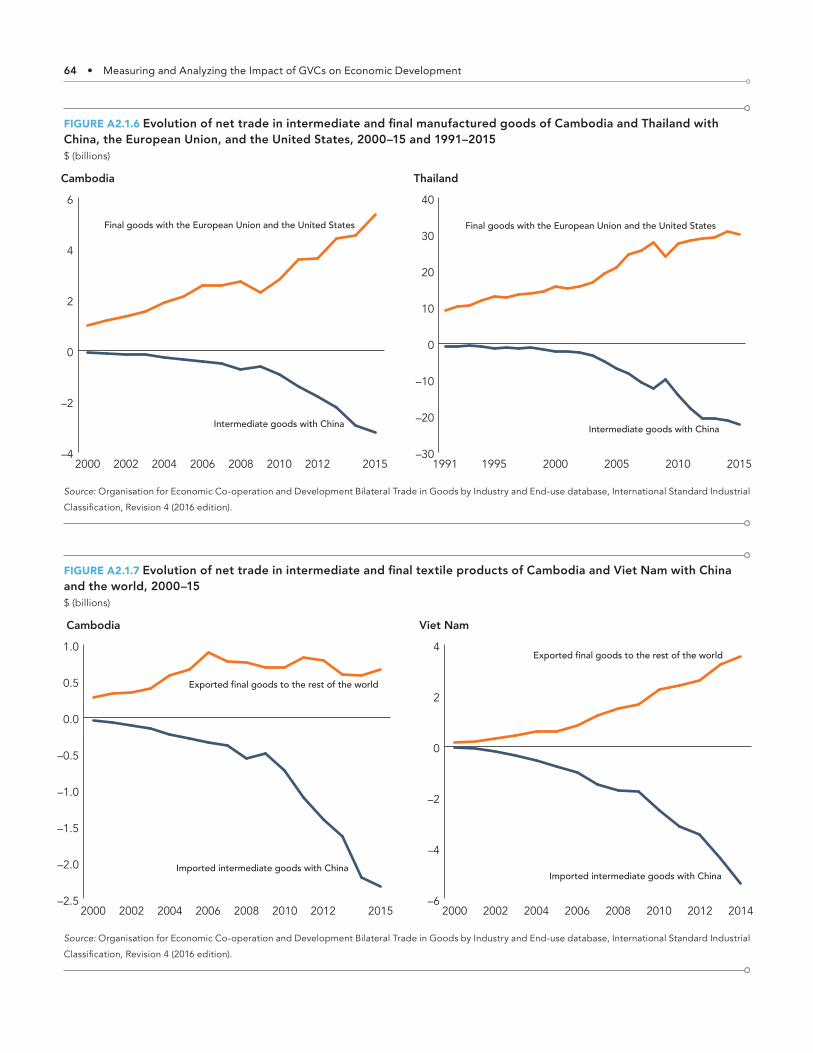
64 • Measuring and Analyzing the Impact of GVCs on Economic Development
FIGURE A2.1.6 Evolution of net trade in intermediate and final manufactured goods of Cambodia and Thailand with China, the European Union, and the United States, 2000–15 and 1991–2015$ (billions)
–4
–2
0
2
4
6
20152012201020082006200420022000–30
–20
–10
0
10
20
30
40
201520102005200019951991
Intermediate goods with China
Final goods with the European Union and the United States Final goods with the European Union and the United States
Intermediate goods with China
Cambodia Thailand
Source: Organisation for Economic Co-operation and Development Bilateral Trade in Goods by Industry and End-use database, International Standard Industrial
Classification, Revision 4 (2016 edition).
FIGURE A2.1.7 Evolution of net trade in intermediate and final textile products of Cambodia and Viet Nam with China and the world, 2000–15$ (billions)
–2.5
–2.0
–1.5
–1.0
–0.5
0.0
0.5
1.0
20152012201020082006200420022000–6
–4
–2
0
2
4
20142012201020082006200420022000
Imported intermediate goods with China
Exported final goods to the rest of the world
Imported intermediate goods with China
Exported final goods to the rest of the world
Cambodia Viet Nam
Source: Organisation for Economic Co-operation and Development Bilateral Trade in Goods by Industry and End-use database, International Standard Industrial
Classification, Revision 4 (2016 edition).
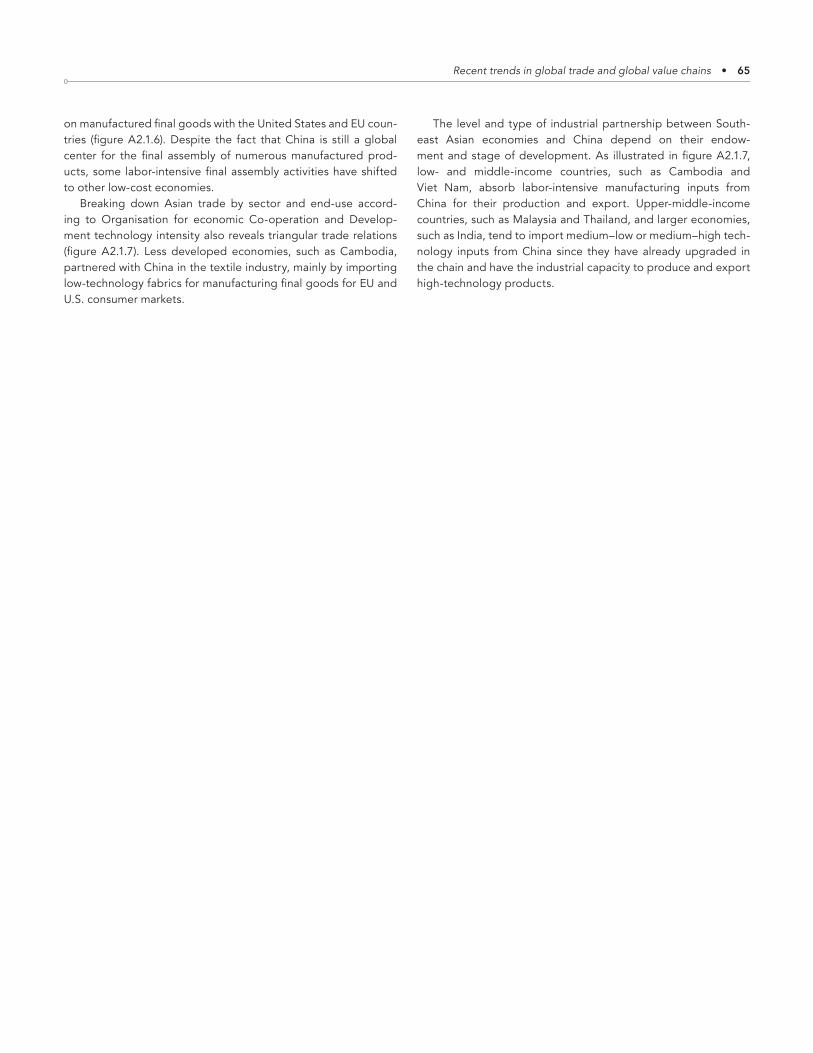
Recent trends in global trade and global value chains • 65
on manufactured final goods with the United States and EU coun-tries (figure A2.1.6). Despite the fact that China is still a global center for the final assembly of numerous manufactured prod-ucts, some labor-intensive final assembly activities have shifted to other low-cost economies.
Breaking down Asian trade by sector and end-use accord-ing to Organisation for economic Co-operation and Develop-ment technology intensity also reveals triangular trade relations (figure A2.1.7). Less developed economies, such as Cambodia, partnered with China in the textile industry, mainly by importing low-technology fabrics for manufacturing final goods for EU and U.S. consumer markets.
The level and type of industrial partnership between South-east Asian economies and China depend on their endow-ment and stage of development. As illustrated in figure A2.1.7, low- and middle-income countries, such as Cambodia and Viet Nam, absorb labor-intensive manufacturing inputs from China for their production and export. Upper-middle-income countries, such as Malaysia and Thailand, and larger economies, such as India, tend to import medium–low or medium–high tech-nology inputs from China since they have already upgraded in the chain and have the industrial capacity to produce and export high-technology products.
66 • Measuring and Analyzing the Impact of GVCs on Economic Development
ANNEX 2.2Key to country abbreviations and sector codes
TABLE A2.2.1 Country abbreviations
AUS Australia
AUT Austria
BEL Belgium
BGR Bulgaria
BRA Brazil
CAN Canada
CHN China
CYP Cyprus
CZE Czech Republic
DEU Germany
DNK Denmark
ESP Spain
EST Estonia
FIN Finland
FRA France
GBR United Kingdom
GRC Greece
HUN Hungary
IDN Indonesia
IND India
IRL Ireland
ITA Italy
JPN Japan
KOR Korea, Rep.
LTU Lithuania
LUX Luxembourg
LVA Latvia
MEX Mexico
MLT Malta
NLD Netherlands
POL Poland
PRT Portugal
ROM Romania
RUS Russian Federation
SVK Slovak Republic
SVN Slovenia
SWE Sweden
TUR Turkey
TWN Chinese Taipei
USA United States
RoW Rest of the world
Source: World Input-Output Database, 2013 release.
TABLE A2.2.2 Sector codes
1 Agriculture, hunting, forestry, and fishing
2 Mining and quarrying
3 food, beverages, and tobacco
4 Textiles and textile products
5 Leather, leather and footwear
6 Wood and products of wood and cork
7 Pulp, paper, paper, printing, and publishing
8 Coke, refined petroleum, and nuclear fuel
9 Chemicals and chemical products
10 Rubber and plastics
11 Other nonmetallic mineral
12 Basic metals and fabricated metal
13 Machinery, not elsewhere classified
14 Electrical and optical equipment
15 Transport equipment
16 Manufacturing, not elsewhere classified; recycling
17 Electricity, gas, and water supply
18 Construction
19 Sale, maintenance, and repair of motor vehicles and motorcycles; retail sale of fuel
20 Wholesale trade and commission trade, except of motor vehicles and motorcycles
21 Retail Trade, except of motor vehicles and motorcycles; repair of household goods
22 Hotels and restaurants
23 Inland transport
24 Water transport
25 Air transport
26 Other supporting and auxiliary transport activities; activities of travel agencies
27 Post and telecommunications
28 Financial intermediation
29 Real estate activities
30 Renting of machinery and equipment and other business activities
31 Public administration and defense; compulsory social security
32 Education
33 Health and social work
34 Other community, social, and personal services
35 Private households with employed persons
Source: World Input-Output Database, 2013 release.
Recent trends in global trade and global value chains • 67
Notes
1. This means that the production of final goods and services can be
classified as GVC production only when it is combined with foreign
factor content (value added) or returned domestic value added. See
backward industrial linkages based on the decomposition in Wang
and others (2017a) for details. The production of foreign affiliates
may also be considered a type of GVC activity since current resi-
dence-based national account rules treat all firms within national bor-
ders as domestic firms; therefore, they treat foreign affiliates’ value-
added creation as part of domestic GDP production. No intercountry
input-output table currently exists that can be used to separate pro-
duction activities between domestic firms and foreign affiliates. So
the GDP decomposition method here may underestimate GVC pro-
duction activities.
2. In David Ricardo’s time, exports were 100% domestically produced
value added, while today, foreign value added is always embodied
in final product exports from a country; therefore, domestically pro-
duced value added becomes only a part of exports. However, using
the decomposition method applied here, we are still able to compute
the portion of “classical trade” analytically.
References
ADB (Asian Development Bank). Inter-Country Input-Output Tables (data-
base). Mandaluyong, Philippines: ADB.
———. Multi-Regional Input-Output (MRIO) Tables (database). Mandalu-
yong, Philippines: ADB. Available at: http://www.wiod.org/otherdb#ADB.
Baldwin, R., and J. Lopez-Gonzalez. 2013. “Supply-Chain Trade: A Portrait
of Global Patterns and Several Testable Hypotheses.” National Bureau
of Economic Research (NBER) Working Paper No. 18957, NBER, Cam-
bridge, MA.
Baldwin, R., T. Ito, and H. Sato. 2014. The Smile Curve: Evolving Sources of
Value Added in Manufacturing. Joint Research Program Series. Chiba
City, Japan: Institute of Developing Economies–Japan External Trade
Organization.
EC (European Commission). 2013. World Input-Output Database. Brussels:
EC. Available at: http://www.wiod.org/release13.
———. 2016. World Input-Output Database. Brussels: EC. Available at:
http://www.wiod.org/database/wiots16.
Hummels, D., J. Ishii, and K. Yi. 2001. “The Nature and Growth of Vertical
Specialization in World Trade.” Journal of International Economics 54
(1): 75–96.
Kawakami, M., and T. J. Sturgeon, eds. 2012. The Dynamics of Local Learn-
ing in Global Value Chains: Experiences from East Asia. London: Pal-
grave Macmillan.
Koopman, R., Z. Wang, and S-J. Wei. 2014. “Tracing Value-added and
Double Counting in Gross Exports.” American Economic Review 104
(2): 459–94.
Kowalski, P., J. Lopez-Gonzalez, A. Ragoussis, and C. Ugarte. 2015. “Par-
ticipation of Developing Countries in Global Value Chains: Implica-
tions for Trade and Trade-Related Policies.” Organisation for Economic
Co-operation and Development (OECD) Trade Policy Papers No. 179,
OECD, Paris.
Meng, B., M. Ye, and S-J. Wei. 2017. “Value-added Gains and Job Oppor-
tunities in Global Value Chains.” IDE Discussion Paper No. 668, IDE–
JETRO, Chiba City, Japan.
Mudambi, R. 2008. “Location, Control, and Innovation in Knowledge-Inten-
sive Industries.” Journal of Economic Geography 8 (5): 699–725.
OECD (Organisation for Economic Co-operation and Development). 2016.
Bilateral Trade in Goods by Industry and End-use (BTDIxE) database, Inter-
national Standard Industrial Classification of All Economic Activities (ISIC),
Revision 3. Paris: OECD. Available at: http://stats.oecd.org/Index.aspx
?DataSetCode=BTDIXE_I3.
OECD (Organisation for Economic Co-operation and Development),
WTO (World Trade Organization), and World Bank. 2014. Global Value
Chains: Challenges, Opportunities, and Implications for Policy. Report
prepared for submission to the G20 Trade Ministers Meeting, Sydney,
July 29.
Pietrobelli, C., and R. Rabellotti. 2010. “Global Value Chains Meet Innova-
tion Systems: Are There Learning Opportunities for Developing Coun-
tries?” Working Paper Series 232, IDE, Chiba City, Japan.
Richard, R., and J. Lopez-Gonzalez. 2013. “Supply-Chain Trade: A Portrait
of Global Patterns and Several Testable Hypotheses.” NBER Working
Paper No. 18957, NBER, Cambridge, MA.
Shih, S. 1996. Me-Too is Not My Style: Challenge Difficulties, Break through
Bottlenecks, Create Values. Taipei: The Acer Foundation.
68 • Measuring and Analyzing the Impact of GVCs on Economic Development
Timmer, M., B. Los, R. Stehrer, and G. de Vries. 2016. An Anatomy of the
Global Trade Slowdown based on the WIOD 2016 Release. Groningen
Growth and Development Centre Research Memorandum 162. Gronin-
gen, Netherlands: University of Groningen.
UIBE (University of International Business and Economics). Global Value
Chain Index database. Available at: http://139.129.209.66:8000/d
/daedafb854/.
UNCTAD (United Nations Conference on Trade and Development). 2013.
World Investment Report 2013 — Global Value Chains: Investment and
Trade for Development. New York and Geneva: UN.
Wang Z., S. Wei, X. Yu, and K. Zhu. 2017a. “Measures of Participation in
Global Value Chain and Global Business Cycles.” NBER Working Paper
No. 23222, NBER, Cambridge, MA.
———. 2017b. “Characterizing Global Value Chains: Production Length and
Upstreamness.” NBER Working Paper No. 23261, NBER, Cambridge, MA.
World Bank. World Development Indicators (database). Washington, DC:
World Bank. Available at: http://data.worldbank.org/data-catalog
/world-development-indicators/.
Xiao, H., T. Sun, B. Meng, and L. Cheng. 2017. “Complex Network Analysis
for Characterizing Global Value Chains in Equipment Manufacturing.”
PLoS ONE 12 (1): e0169549.
Xing, Y., and H. Detert. 2010. “How the iPhone Widens the United States
Trade Deficit with the People’s Republic of China.” Working Paper 257,
Asian Development Bank Institute, Tokyo.
Ye, M., B. Meng, and S. Wei. 2015. “Measuring Smile Curves in Global Value
Chains.” IDE Discussion Paper No. 530, IDE–JETRO, Chiba City, Japan.