Embed Size (px)
Citation preview

Human–Wildlife Interactions 7(2):230–249, Fall 2013
Recommended management strategies to limit anthropogenic noise impacts on greater sage-grouse in WyomingGail l. patRiCelli, Department of Evolution and Ecology, University of California, Davis, CA
95616, USA [email protected] l. BliCkley, Department of Evolution and Ecology, University of California, Davis, CA
95616, USAStaCie l. hoopeR, Department of Evolution and Ecology, University of California, Davis, CA
95616, USAAbstract: Recent research has demonstrated that noise from natural gas development negatively impacts sage-grouse (Centrocercus urophasianus) abundance, stress levels, and behaviors. Other types of anthropogenic noise sources are similar to gas-development noise and, thus, the response by sage-grouse is likely to be similar. The results of research suggest that effective management of the natural soundscape is critical to the conservation and protection of sage-grouse. The goals of this review are to discuss current approaches in the management of new and existing noise sources in Wyoming and recommend research priorities for establishing effective noise management strategies. We make 4 interim recommendations: (1) that noise-management objectives should be set relative to typical ambient noise levels in sage-grouse habitat before development; the best currently available measuremenet of residual noise levels levels (L90) in undisturbed areas suggest an ambient level of 16 to 20 dBA; (2) that an increase in median noise levels (L50) of 10 dBA above ambient be allowed; (3) that management strategies be expanded to protect the soundscape in areas critical for mating, foraging, nesting, and brood-rearing activities of sage-grouse, rather than protecting the lek area alone; and (4) management strategies be focused on the siting of roads or limiting of traffic volumes during crucial times of the day (0600 to 0900 hours) and season (i.e., breeding season), rather than setting targets for vehicle noise exposure. Roads should be sited or traffic should be seasonally limited within 1.3 to 1.7 km from the edge of critical areas for nesting, foraging and breeding. We emphasize that protections based on these interim recommendations may need to be revised upon completion of ongoing and future research.
Key words: anthropogenic noise, Centrocercus urophasianus, chronic noise, energy development, human–wildlife conflicts, natural gas development, natural soundscape, noise management strategies, sage-grouse, roads
Greater sage-grouse (Centrocercus urophasianus) populations have declined throughout their range, leading to their designation as a candidate for listing under the Endangered Species Act. Among the factors identified as a threat to sage-grouse is the expansion of energy development across much of the remaining sage-grouse habitat (e.g., Aldridge and Boyce 2007, Doherty et al. 2010, Holloran et al. 2010, Naugle et al. 2011). One potential means by which energy development and other human activities might impact sage-grouse populations is through the production of noise (e.g., Rogers 1964, Braun 1998, Holloran 2005, Connelly et al. 2011).
Acoustic communication is very important in the reproductive behaviors of sage-grouse, and energy exploration and development activities generate substantial noise (Blickley and Patricelli 2012). Therefore, it is important
to determine whether noise produced by energy development affects sage-grouse breeding biology. Female sage-grouse use male vocalizations to find males on the lek (Gibson 1989), and, during courtship, females assess male vocalizations and other aspects of male display when choosing a mate (Wiley 1973, Gibson and Bradbury 1985, Gibson 1996, Patricelli and Krakauer 2010). Noise from natural gas development primarily is produced by drilling rigs, compressors, generators, and traffic on access roads. All of these noise sources are loudest in frequencies (i.e., pitch) <2.0 kHz (Blickley and Patricelli 2012). Male sage-grouse produce acoustic signals in a similar frequency range, between 0.2 and 2.0 kHz, so the potential exists for industrial noise to mask sage-grouse communication and, thus, interfere with the ability of females to find and choose mates (Blickley and Patricelli 2012). For a

231Noise impacts on sage-grouse • Patricelli et al.
prey species, such as sage-grouse, noise also may increase predation risk by masking the sounds of approaching predators and increase stress levels by increasing the perception of predation risk (Quinn et al. 2006, Rabin et al. 2006). In other vertebrate species, noise has been found to impact individuals directly, for example, by causing startling behaviors, increased heart rate, or increased annoyance. All of these factors may interfere with normal foraging, resting, and breeding behaviors and contribute to higher stress levels and reduced fitness (reviewed in Barber et al. 2009, Kight and Swaddle 2011).
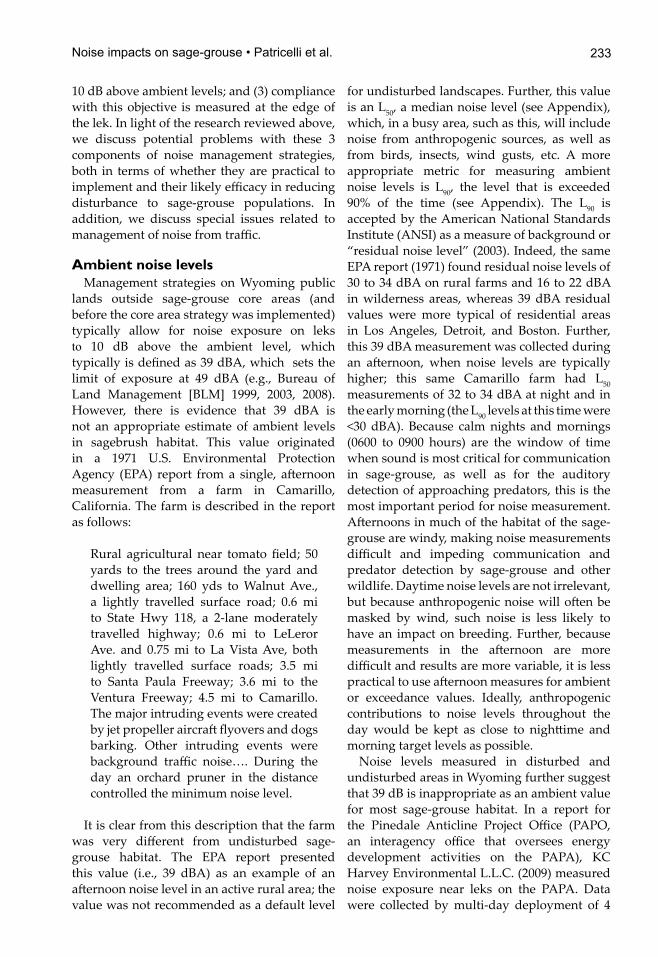
Holloran (2005) found observational evidence that noise may be at least partly responsible for impacts from natural gas development on sage-grouse populations in the Pinedale Anticline Project Area (PAPA), Wyoming, one of the largest natural gas fields in the United States (Figure 1). Juvenile males avoided leks located near natural-gas drilling sites, even if the leks previously had high attendance by males (Holloran et al. 2010). These effects were more pronounced downwind of the drilling sites where noise levels were higher, suggesting that noise contributed substantially to these declines (Holloran 2005).
To investigate potential impacts from noise on greater sage-grouse lekking activity, we experimentally introduced noise from natural gas drilling rigs and traffic on access roads at 8 leks and compared lek attendance to 8 paired control leks near Hudson, Wyoming, between 2006 and 2008 (Blickley et al. 2012a). Speakers were placed in a line along an edge of the lek, creating a noise gradient across the lek. The mean noise level (measured as an equivalent noise level, Leq) at 10 m from the speakers was 56.1 dBA on drilling-noise leks and 43.2 dBA on traffic noise leks, while the maximum noise level, Lmax, was 59.1 dBA and 59.4 dBA for drilling and traffic leks, respectively (see Appendix for glossary of noise terms). We found immediate and sustained declines in male attendance on noise leks (29% decline on drilling noise leks and 73% decline on traffic noise leks relative
to paired control leks) and evidence of similar declines in female attendance. These results suggest a strong noise avoidance in male and, possibly, female sage-grouse (Blickley et al. 2012a). In addition, we found evidence of elevated levels of corticosterone metabolites in fecal samples collected from noise leks compared to samples collected from control leks. Because elevated corticosterone levels are associated with increased physiological stress (Wasser et al. 2000, Wingfield 2005, Bonier et al. 2009), these results suggest that even males that do not abandon noisy leks are physiologically impacted (Blickley et al. 2012b). Further, our analyses of behaviors on playback leks suggest that males alter the timing of their vocalizations in response to noise, increasing display rates during close courtship on leks with drilling noise, and waiting for gaps of quiet on leks with vehicle noise (Blickley 2012). These results are consistent with males avoiding the impacts of masking noise on courtship communication; other types of disturbance, such as startling or learned aversion to vehicular noise, also may contribute to this response. Other types of anthropogenic noise sources (e.g., infrastructure from oil, geothermal, and mining, as well as wind development, off-road vehicles, highway traffic, and urbanization) are similar in acoustic frequency, amplitude, and timing to the noise played in this experiment, and response by sage-grouse to these other noise sources may be similar. These results suggest that effective management of the natural soundscape is critical to the conservation and protection of sage-grouse.
Figure 1. Male sage-grouse displaying on a lek in the Pinedale Anticline Project Area with natural gas drilling rigs in the back-ground (Photo © courtesy Gerrit Vyn)

232 Human–Wildlife Interactions 7(2)
In 2008, Governor Dave Freudenthal issued an executive order, titled “Greater Sage-Grouse Core Population Area Strategy” (State of Wyoming 2008), stating that “new development or land uses within Core Population Areas should be authorized or conducted only when it can be demonstrated by the state agency that the activity will not cause declines in Greater Sage-Grouse populations.” The core area strategy was reaffirmed and refined by Governor Matt Mead (State of Wyoming 2010, 2011). To better achieve the goals of the core area strategy, here we discuss management approaches for limiting noise impacts on greater sage-grouse. Specifically, our goals are 3-fold: (1) to discuss current approaches in the management of new
and existing noise sources in Wyoming; (2) to recommend research priorities for establishing effective noise management strategies; and (3) to provide managers and policy makers with recommendations for the interim protection of sage-grouse from known or expected impacts of increased noise levels using the best available science.
Current noise management strategies in Wyoming
Noise management strategies in greater sage-grouse habitat inside and outside of the core area typically share 3 common components: (1) the management objective for noise is established relative to ambient levels; (2) noise is limited to
Table 1. Spring 2009 noise levels on leks in the Pinedale Anticline Project area, Wyoming. Data were collected by KC Harvey Environmental L.L.C. for the Pinedale Anticline Project office (KC Harvey Environmental L.L.C. 2009); raw data were re-analyzed and summarized here. All measures are presented in dBA. All leks are close enough to development sites, access roads or highways to ex-perience anthropogenic noise; noise levels may also include sounds from male sage-grouse display-ing on the leks (displaying males on these relatively small leks are unlikely to significantly impact L50 or L90 measures, but may affect other metrics). Measurements are from the full 24 hours/day, so they are not focused on the night and morning periods likely critical to greater sage-grouse (0600 to 0900 hours). Further, weather data are not available and windy periods were not excluded, so these values likely include substantial energy from wind. Finally, these data were collected with a Type-2 SLM and, therefore, are likely higher than true ambient levels (see Appendix).Lek name Dates Duration
(hrs)L90 L50 L10 Lavg
(Leq)Lmax Lmin
Alkali Draw April 2, 6 121.0 23.6 28.8 41.2 44.1 92.6 19.6Big Fred April 12, 16, May 12 123.0 27.6 33.9 44.0 42.4 80.2 22.0
Bloom Reservoir April 22, 27 120.0 22.2 29.2 44.7 41.9 83.9 19.4Cat May 2, 7 120.3 22.8 28.1 44.1 44.3 86.9 19.6Little Fred April 12, 16, May 7 85.5 32.7 36.7 45.5 44.2 80.8 31.8Lovatt West April 22, 23, May 12 127.0 30.4 33.7 48.3 47.4 84.5 28.2Lower Sand Springs Draw
May 7 111.3 25.9 29.8 41.5 39.7 73.4 23.6
Mesa Road 3 May 12 141.3 31.9 32.1 33.1 32.5 53.4 31.7Oil Fork Road April 17, 22, 27 120.4 24.5 33.0 46.7 42.8 78.0 22.8The Rocks April 6 147.5 32.1 33.1 46.8 44.4 95.3 31.7Shelter Cabin Reservoir
April 6, 12, May 27 99.1 27.1 32.4 41.9 40.5 78.0 23.3
South Rocks May 2 121.0 27.4 33.3 46.2 42.7 73.7 23.8MEAN 119.8 27.4 32.0 43.7 42.2 80.1 24.8MEDIAN 120.7 27.2 32.7 44.4 42.8 80.5 23.4SD 16.4 3.7 2.5 4.0 3.7 10.8 4.8SE 3.3 0.7 0.5 0.8 0.7 2.2 1.0Maximum 147.5 32.7 36.7 48.3 47.4 95.3 31.8Minimum 85.5 22.2 28.1 33.1 32.5 53.4 19.4
233Noise impacts on sage-grouse • Patricelli et al.
10 dB above ambient levels; and (3) compliance with this objective is measured at the edge of the lek. In light of the research reviewed above, we discuss potential problems with these 3 components of noise management strategies, both in terms of whether they are practical to implement and their likely efficacy in reducing disturbance to sage-grouse populations. In addition, we discuss special issues related to management of noise from traffic.
Ambient noise levels Management strategies on Wyoming public
lands outside sage-grouse core areas (and before the core area strategy was implemented) typically allow for noise exposure on leks to 10 dB above the ambient level, which typically is defined as 39 dBA, which sets the limit of exposure at 49 dBA (e.g., Bureau of Land Management [BLM] 1999, 2003, 2008). However, there is evidence that 39 dBA is not an appropriate estimate of ambient levels in sagebrush habitat. This value originated in a 1971 U.S. Environmental Protection Agency (EPA) report from a single, afternoon measurement from a farm in Camarillo, California. The farm is described in the report as follows:
Rural agricultural near tomato field; 50 yards to the trees around the yard and dwelling area; 160 yds to Walnut Ave., a lightly travelled surface road; 0.6 mi to State Hwy 118, a 2-lane moderately travelled highway; 0.6 mi to LeLeror Ave. and 0.75 mi to La Vista Ave, both lightly travelled surface roads; 3.5 mi to Santa Paula Freeway; 3.6 mi to the Ventura Freeway; 4.5 mi to Camarillo. The major intruding events were created by jet propeller aircraft flyovers and dogs barking. Other intruding events were background traffic noise…. During the day an orchard pruner in the distance controlled the minimum noise level.
It is clear from this description that the farm was very different from undisturbed sage-grouse habitat. The EPA report presented this value (i.e., 39 dBA) as an example of an afternoon noise level in an active rural area; the value was not recommended as a default level
for undisturbed landscapes. Further, this value is an L50, a median noise level (see Appendix), which, in a busy area, such as this, will include noise from anthropogenic sources, as well as from birds, insects, wind gusts, etc. A more appropriate metric for measuring ambient noise levels is L90, the level that is exceeded 90% of the time (see Appendix). The L90 is accepted by the American National Standards Institute (ANSI) as a measure of background or “residual noise level” (2003). Indeed, the same EPA report (1971) found residual noise levels of 30 to 34 dBA on rural farms and 16 to 22 dBA in wilderness areas, whereas 39 dBA residual values were more typical of residential areas in Los Angeles, Detroit, and Boston. Further, this 39 dBA measurement was collected during an afternoon, when noise levels are typically higher; this same Camarillo farm had L50 measurements of 32 to 34 dBA at night and in the early morning (the L90 levels at this time were <30 dBA). Because calm nights and mornings (0600 to 0900 hours) are the window of time when sound is most critical for communication in sage-grouse, as well as for the auditory detection of approaching predators, this is the most important period for noise measurement. Afternoons in much of the habitat of the sage-grouse are windy, making noise measurements difficult and impeding communication and predator detection by sage-grouse and other wildlife. Daytime noise levels are not irrelevant, but because anthropogenic noise will often be masked by wind, such noise is less likely to have an impact on breeding. Further, because measurements in the afternoon are more difficult and results are more variable, it is less practical to use afternoon measures for ambient or exceedance values. Ideally, anthropogenic contributions to noise levels throughout the day would be kept as close to nighttime and morning target levels as possible.
Noise levels measured in disturbed and undisturbed areas in Wyoming further suggest that 39 dB is inappropriate as an ambient value for most sage-grouse habitat. In a report for the Pinedale Anticline Project Office (PAPO, an interagency office that oversees energy development activities on the PAPA), KC Harvey Environmental L.L.C. (2009) measured noise exposure near leks on the PAPA. Data were collected by multi-day deployment of 4

234 Human–Wildlife Interactions 7(2)
Type-2 sound-level meters (Quest-SoundPRO-DL-2-1/3-10). We analyzed the raw data collected by KC Harvey with permission of the PAPO, and found that that most leks, even those with multiple, active drilling rigs nearby, had residual (L90) and median (L50) levels much lower than 39 dBA (Table 2). These measurements from disturbed areas are almost all <39 dBA, demonstrating that this value is inappropriately high as an estimate for ambient noise in undisturbed areas.
Based on our review of reports and empirical measurements collected in Wyoming, we estimate that pre-development ambient values from nights and calm mornings in sagebrush habitat are closer to 16 to 20 dBA (see recommendations section for details). Assuming that 16 dBA is a more representative ambient value, a noise source at currently allowable levels (i.e., 49 dBA) would exceed ambient by 33 dB. This represents a 44-fold increase in the noise level, which would be perceived by humans as at least 10 times louder than ambient (see Appendix). Such a level of sound would dominate the soundscape and cause significant disruption. Results from our experiments further indicate that 49 dBA is too loud as an allowable exposure level within sage-grouse leks. Our noise-playback leks (described above, Blickley et al. 2012a) experienced levels that were mostly in compliance with the 49 dB noise limit (<49 dBA across most of the lek area, except for the area within ~20 m of the speakers). Yet, we found large declines in attendance by sage-grouse, increases in stress levels and altered display behaviors across the lek (Blickley 2012, Blickley et al. 2012a, b). Therefore, the available scientific evidence shows that 39 dBA is inappropriate for use as a default ambient value for sage-grouse habitat and suggests that allowing 49 dBA of noise exposure on leks and other sensitive areas will cause significant disturbance to sage-grouse populations.
In 2010, stipulations for sage-grouse core areas in Wyoming were created by executive order (State of Wyoming 2010). These stipulations used measured ambient values, rather than a 39 dBA default ambient value. A more recent executive order (State of Wyoming 2011) affirms this approach, stating:
“New noise levels, at the perimeter of a lek,
should not exceed 10 dBA above ambient noise (existing activity included) from 6:00 p.m. to 8:00 am during the initiation of breeding (March 1 to May 15). Ambient noise levels should be determined by measurements taken at the perimeter of a lek at sunrise.”
Because measured ambient noise levels are likely to be <39 dBA in most places, the core area stipulations will typically limit noise to levels <49 dBA and, thus, offer greater protection for sage-grouse. But because existing activity is explicitly included in measurements of ambient noise, there may be some areas where existing sources lead to ambient measures >39 dBA, thereby allowing for >49 dBA of noise exposure. Further, each new development may add 10 dB to existing noise levels, potentially causing an incremental increase in noise over time. Such increasing noise would likely cause increasing impacts, because sage-grouse do not appear to habituate to anthropogenic noise over time. The declines in male attendance that we observed on our noise-playback leks were immediate and sustained throughout the 3-year experiment (Blickley et al. 2012a), and elevated stress hormones were observed in both the second and third years of noise playback (Blickley et al. 2012b), indicating that sage-grouse do not adapt to increased noise levels over time. Therefore, the combined impact of all anthropogenic noise sources should be considered when assessing disturbance to sage-grouse habitat. To do so, management objectives should be set relative to the undisturbed soundscape, capping the total noise exposure at or near 10 dB above a “pre-development” ambient value. Such a cap would not preclude further development at sites that already have sources exceeding ambient by nearly 10 dB due to the complex way that multiple sound sources combine to determine overall noise levels. For example, a new source with an L50 9 dB quieter than the L50 of an existing source at the measurement site would add only 0.5 dB to the total noise exposure.
Collecting measurements of ambient noise levels in quiet areas is extremely challenging and requires expensive, specialized equipment, which makes the requirement to collect ambient values at each lek difficult to implement. Unfortunately, ambient measures will be inflated by non-ideal weather—especially wind,

235Noise impacts on sage-grouse • Patricelli et al.
even at low levels. Measures will also be inflated by almost all errors made by the person deploying the noise meter, such as poor placement of the meter for long-term deployment, rustling from clothing, crunching leaves underfoot, and even breathing close to the meter when it is handheld. Even professional measurements on a Type-1 sound level meter (SLM; see Appendix) will typically overestimate ambient levels in quiet areas (<27 dBA). This is because A-weighting approximates human hearing by boosting the amplitudes of the mid-frequencies, which in very quiet areas will include noise from the pre-amplifier on the sound-level meter. All of these sources of measurement inaccuracy will inflate ambient values and, therefore, allow more noise exposure at leks.
In summary, further research is needed to establish pre-development ambient noise values; in the interim, neither an unrealistic default value (39 dBA) nor ambient values measured at the edge of the lek will offer sufficient protection to sage-grouse.
The 10-dB threshold Once an ambient noise value is
established, most current noise management strategies limit new noise levels to 10 dB above this ambient value. The 10-dB threshold is used commonly inside and outside of Wyoming core areas and in other states; however, we do not yet know whether this threshold is sufficient to protect greater sage-grouse. This threshold is based on a small number of songbird studies (Nicholoff 2003, Dooling and Popper 2007), and there is no scientific basis for assuming that sage-grouse will respond to noise in a manner similar to songbirds. Indeed, the low-frequency vocalizations of sage-grouse might make them more vulnerable to masking by anthropogenic noise than many songbirds (Blickley and Patricelli 2012). Recent studies of songbirds have found that species with larger body size and lower-frequency vocalizations (i.e., more similar to sage-grouse) are more
prone to population declines in response to noise (Francis et al. 2009, Hu and Cardoso 2009).
Further, 10 dB is a significant increase in the amount of noise. For an animal vocalizing to communicate with potential mates or offspring, a 10-dB increase in noise levels corresponds to a 10-fold decrease in the active space of the vocalization (i.e., listening area; Brenowitz 1982, Barber et al. 2009; see Appendix). This same increase in noise will lead to up to a 3-fold decrease in the detection distance between 2 receivers (Barber et al. 2009 ). This means that, in a noisy environment, the receiver must be 3 times closer to hear a vocalization than in quiet conditions, and perhaps more critically,
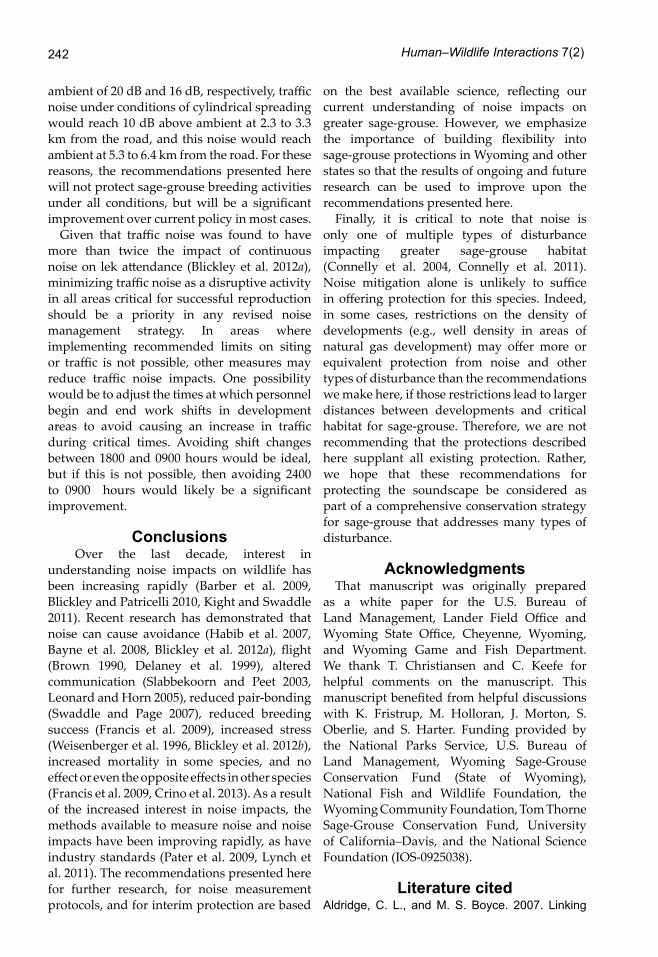
Figure 2. Traffic and drilling noise surrounding a lek. This illustration shows a lek in the center, surrounded by a 1.0-km buffer, a 3.1-km buffer and a 6.4-km buffer. Noise from an example natural gas drilling rig exceeds 10 dBA above ambi-ent (here ambient is assumed to be 20 dBA) for a radius of approximately 1.5 km (dark gray), and is audible above ambi-ent for at least 2.7 km (light gray). This is an example drilling rig measured in the Pinedale Anticline Project Area (PAPA)and is not meant to be representative of all drilling rigs. An average road at the lower edge of the 3.1-km buffer will have noise levels (Lmax) exceeding ambient by 10 dBA for a distance of 1.3 km and will be audible above ambient for at least 2.7 km with each passing vehicle. Distances are approximately to scale and calculations assume no temperature inversions, which nearly double sound propagation distances, and no topo-graphical effects on sound propagation (excess attenuation of sound is calculated as described in BLM 1999). The lek area is in compliance with the upper limit of recommended noise levels, but much of the surrounding area critical for foraging, nesting and brood-rearing is exposed to higher levels of noise.
Lek 1 km 3.1 km
Road
Drilling rig
6.4 km

236 Human–Wildlife Interactions 7(2)
a predator would be able to approach 3 times closer in noisy conditions before it was detected by a sage-grouse. Indeed, the night-time capture success of sage-grouse by spotlighting is greatly improved with a noise source to mask the sound of footsteps from approaching biologists (Connelly et al. 2003); predators likely gain a similar advantage in noise.
Masking of vocalizations and the sounds of predator approach is only a single source of impacts from noise. Animals may also experience behavioral disruptions, elevated heart rate, interrupted rest, and increased stress levels, all of which may affect health and reproduction or cause avoidance of noisy areas (reviewed in Barber et al. 2009, Kight and Swaddle 2011). Many of these behavioral and physiological impacts could occur at or below the 10-dB threshold. Further studies are needed on sage-grouse to determine whether the 10-dB threshold is insufficient, sufficient, or even too conservative.
Importance of measurement locationCurrent management strategies that limit
noise to 10 dB above ambient levels inside and outside of greater sage-grouse core areas, typically specify that measurements should be collected at the edge of the lek to assess compliance (e.g., State of Wyoming 2011; BLM 1999, 2003, 2008). This strategy introduces 2 potential problems. First, one could find ambient noise measures of 50 to 60 dBA Leq on the edge of a lek due to the vocalizing sage-grouse (Blickley and Patricelli 2012), allowing anthropogenic noise under the 10-dB-over-ambient rule to reach 60 to 70 dBA. After an ambient value is established, determining whether a development project is compliant would require again measuring noise exposure at the lek edge. This could lead to a scenario where increasing development noise could cause declines in lek attendance, which could reduce noise readings over time, as fewer birds contribute to the sound of the lek. Such data would be misleading and provide inaccurate noise measurements of anthropogenic sources. There are methods available to reduce this problem, such as using appropriate noise metrics (such as L50 and L90; see Appendix) and collecting measurements before birds arrive on the lek or after birds are flushed. But this issue
makes the current stipulations more difficult, disruptive, and ambiguous to implement.
A second potential problem with measuring compliance at edge of the lek is that much of the area surrounding a lek may be exposed to higher noise levels, even if the lek area per se is in compliance (Figure 2). This management strategy, therefore, protects only a fraction of sage-grouse activities during the breeding season (e.g., mate assessment and copulation on the lek) leaving unprotected other critical activities that occur in areas around the lek, such as foraging, roosting, nesting, and brood rearing. Our experimental design allowed us to examine noise impacts only on the lek (Blickley et al. 2012a), and, therefore, we cannot provide direct evidence that off-lek noise will impact sage-grouse populations. However, there is indirect evidence that male display and copulation activities on the lek may be affected by noise occurring around the lek area. To sustain their costly display behaviors, males must forage off lek, potentially exposing themselves to higher noise disturbance levels (Figure 2). Vehrencamp et al. (1989) found that males on the lek that are in good condition and are successful in mating forage farther from the lek during the day, compared to unsuccessful, poor-condition males (range 0.2 to 0.8 km off lek). Other studies have found males travelling an average of 1.0 km and a maximum of 2.4 km to forage off lek (e.g., Wallestad and Schladweiler 1974, Schoenberg 1982). If foraging in noisy areas increases male stress levels or predation risk, or decreases foraging efficiency, as has been found in other vertebrate species (Quinn et al. 2006, Rabin et al. 2006), then these noise impacts may affect subsequent male display behaviors on the lek. More importantly, there is evidence that females and juvenile males use male vocalizations to find males on the lek (Gibson 1989). Blickley and Patricelli (2012) found that industrial noise masks these sounds, which may make it more difficult for females and juvenile males in noisy areas surrounding a lek to find the lek itself. Reduced female visitation would decrease copulation activities on the lek, and reduced juvenile male recruitment would lead to male attendance declines over time. For these reasons, the protection of lekking activities may require protection of more than just the lek surface alone.

237Noise impacts on sage-grouse • Patricelli et al.
Additionally, many critical breeding activities occur off-lek, potentially in areas with higher noise levels. Because ~45% of females nest within a 3.1-km radius of the lek and 74 to 80% of females nest within a 6.4-km radius of the lek (Moynahan 2004, Holloran and Anderson 2005), many of these nesting females will experience noise levels exceeding management objectives for the lek (Figure 2). Most vocalizations used between hens and chicks are much quieter than sounds produced by males on leks (Schroeder et al. 1999), and, therefore, are much more prone to masking (Blickley and Patricelli 2012). Additionally, predation rates can be high for chicks and females on nests in disturbed habitats (Hagen 2011), and females likely rely mainly on acoustic rather than visual cues to detect the approach of predators at night. Thus, when noise masks the sounds of predator approach, females and chicks may be more at risk in noisy areas than males on the lek. Further, breeding females may suffer detrimental health impacts from elevated stress at a time when stress levels are already elevated (Jankowski 2007). While we do not have direct evidence for an impact of noise on these off-lek activities, there is evidence that proximity to roads and infrastructure (which raises noise levels) affects nest placement, nest initiation rates, chick survival, and brood-rearing activities (Lyon and Anderson 2003, Holloran and Anderson 2005, Aldridge and Boyce 2007, Holloran et al. 2010).
Other types of disruptive activities in sage-grouse habitat are managed throughout areas critical for lekking, nesting, and early brood rearing (e.g., State of Wyoming 2011, BLM 2012); there is no scientific basis for focusing the monitoring and management of noise on the lek area alone without including these other critical areas.
Traffic noiseThere is evidence that noise from traffic has
a significant impact on sage-grouse. Blickley et al. (2012a) found a 73% decline in male attendance on leks exposed to traffic noise compared to their paired controls, more than twice the decline observed on leks exposed to drilling noise (29%). Traffic noise also was also found to cause an increase in stress hormone levels (Blickley et al. 2012b) and a disruption
of strutting patterns on the lek (Blickley 2012). Further evidence comes from other studies not focused on noise alone. Lyon and Anderson (2003) found that even light vehicular traffic (1 to 12 vehicles/day) substantially reduced nest initiation rates and increased the distance of nests from lek sites. Holloran (2005) found that traffic on roads within 1.3 km of the lek during the early morning, while males are strutting, is related to declines in male attendance. These results suggest that effective management strategies should include efforts to minimize traffic near areas critical for sage-grouse reproduction.
However, management strategies that allow up to 10 dB of noise above ambient are not sufficient to protect sage-grouse from the impacts of traffic noise. Because traffic noise in sage-grouse habitat is typically intermittent and interspersed with periods of quiet, a high volume of traffic would be needed to raise overall noise levels by 10 dBA. In general, a 10-dB increase in average noise levels is associated with a 10-fold increase in traffic, which would represent an increase from 2 to 20 vehicles or from 20 to 200 vehicles over a given time interval. A 10-fold increase in traffic would likely have a major impact on sage-grouse, yet may not exceed current noise management objectives inside and outside of core areas. This suggests that approaches for the management of more continuous noise sources, such as noise from compressors stations, drilling rigs, and other permanent or temporary infrastructure, may not be suitable for the management of traffic noise.
Recommendations for research priorities
Our understanding of impacts of noise on sage-grouse has improved over the last few years, but there is still much to learn. Below, we outline recommendations for research that would help to develop more effective management strategies for anthropogenic noise.
Establishing ambient valuesAs discussed above, management objectives
for noise are typically established relative to ambient noise levels. The choice of ambient value, thus, has important consequences,

238 Human–Wildlife Interactions 7(2)
setting the upper limit of allowable noise. It is, therefore, critical to establish accurate ambient noise values for such management strategies to succeed in protecting vulnerable species.
Due to the previously discussed difficulty of measuring ambient values at quiet locations, we suggest that it is not feasible or practical to establish baseline noise levels by having personnel with little specialized training measure ambient noise at each lek prior to development. Further, experimental evidence discussed above indicates that ambient values should represent the pre-development ambient levels, such that new developments do not further impact already impacted soundscapes. One approach to establish pre-development ambient noise levels is to commission the measurement of ambient levels by professionals with experience in environmental acoustics. Such professionals would need to measure ambient values for each site prior to development (or if there are already noise sources in an area, they could choose a similar but undisturbed area to estimate natural ambient levels; e.g., Ambrose and Florian 2013). Alternatively these professionals could sample noise levels at representative undisturbed areas across the state, using such measurements to establish ambient values by region or habitat type.
We recommend that ambient measurements should be collected using a Type-1 precision SLM enclosed in environmental housing for long-term deployment at each site. The meter should log unweighted one-third-octave spectra of noise at 1-second intervals. The L90 and other metrics listed in the Appendix should each be collected as A-weighted values, and, if possible, as dBF (i.e., dB-flat or unweighted) and C-weighted. With a logging SLM, one can save the time history, showing how noise levels change over time in the sampling period. This can be very useful in isolating the causes of change in noise levels. One can also calculate each metric hourly or over the entire sampling period. Hourly metrics are useful when focusing on a critical time window (e.g., 0600 to 0900 hours). The meter (or a nearby station) should also log wind speed, so that measurements can be excluded when wind likely contributes to noise levels. In addition to using SLMs, alternative methods to
collect noise measurements, such as carefully calibrated audio recording units that can be used to calculate appropriate metrics, would also be appropriate (Patricelli et al. 2007, Lynch et al. 2011).
Such empirical sampling of noise levels also could be combined with noise modeling to create a map of natural ambient noise across focal areas. There are a number of suitable freeware programs for predicting sound propagation, such as NMSim (Wyle Laboratories Consulting, Arlington, Va., and Blue Ridge Research and Consulting, LLC, Asheville, N.C.), and SPreAD-GIS (Reed et al. 2012), as well as commercial software, such as SoundPLAN (Braunstein + Berndt GmbH, Germany) and Predictor-LimA (Brüel and Kjær Sound and Vibration Measurement A/S, Nærum, Denmark). This map would be useful for multiple public and private agencies interested in tracking noise exposure, because the data are not sage-grouse specific.
Determining an appropriate thresholdOnce an ambient value is determined,
we must then resolve whether the current threshold of 10 dB above ambient is sufficient to protect sage-grouse. The most feasible way to determine the threshold level at which sage-grouse are impacted by noise is by analyzing nesting success, lek attendance, and other population variables relative to existing variation in noise levels in a spatially-explicit manner using habitat-selection modeling. This method would examine the impact of variation in noise exposure across a disturbed landscape, while statistically controlling for other possible contributors. The resulting slope of the relationship between noise and measures of population change can then be used to predict the threshold level at which a minimal (or acceptable) level of impact on sage-grouse occurs. Such an approach would also be useful for examining noise impacts outside of the breeding season, especially in winter, where changes in habitat quality and availability can lead to significant impacts on population health (Beck 1977, Swenson et al. 1987, Doherty et al. 2008).
Measuring traffic noise The evidence reviewed above demonstrates

239Noise impacts on sage-grouse • Patricelli et al.
that traffic noise negatively impacts sage-grouse; however, we do not know the best metrics to use for management objectives in limiting traffic noise. This is because intermittent traffic, such as the traffic in most sage-grouse habitats, produces short periods of loud noise interspersed with longer periods of quiet. We do not know whether it is the total noise exposure throughout the day (or in a critical time period, such as nights and mornings) or the maximum noise level as a vehicle passes that best predicts impacts on sage-grouse. Lyon and Anderson (2003) found that nesting activities can be disturbed by only 1 to 12 vehicles/day, suggesting that the chosen noise metric should be sensitive to infrequent sounds. Infrequent to low traffic levels would barely register using measures of average or median amplitude (e.g., Leq or L50). Even measures of maximum noise levels (e.g., Lmax of Lpeak; see Appendix) can be problematic, because other sound sources besides vehicles can affect these measures. For example a single bird singing near the meter could lead to extremely high maximum noise measurements. Such events can be excluded using synchronized audio or video recordings, direct observations or by analyzing the frequency profile of the noise (Lynch et al. 2011). Even with such an exclusion protocol in place, maximum values may be more informative when combined with a measure of overall exposure, such as Leq or axle counts.
To determine which noise metrics best predict traffic impacts on sage-grouse, traffic noise can be included in habitat-selection models. This approach will allow estimation of the relationships between population variables and traffic variables (distance, traffic level and noise level). This would help to establish whether the impacts from traffic noise are better mitigated through setting noise objectives or by managing the siting and traffic levels of roads directly. Many of the noise-prediction models discussed in the previous section allow modeling of moving sources, such as different kinds of vehicles.
Recommendations for interim protections
The research described above will take time. Below, we provide managers and policy
makers with recommendations for the interim protection of sage-grouse from known or expected impacts of increased noise levels using the best available science. We emphasize that protections based on these interim recommendations may need to be revised upon completion of ongoing and future research.
Setting an ambient valueBased on our review of reports and empirical
measurements collected in Wyoming, we have concluded that true ambient values pre-development in nights and calm morning in sagebrush habitat are likely to be 16 to 20dBA. The first source for this conclusion is the 1971 EPA report from which the original 39 dBA ambient value was drawn (EPA 1971). This report finds residual noise levels (L90) in wilderness areas of 16-22 dBA, measured during day and nighttime at a campsite on the north rim of the Grand Canyon National Park (excluding evenings from 1900 to 2200 hours, which were dominated by insect noise that is minimal during the sage-grouse breeding season due to low temperatures). The EPA report concludes that “these increases in [residual] noise level, from wilderness to farm and to city, are the result of man’s activities and his use of machines.” Lynch et al. (2011) more recently measured noise exposure at 189 sites in 43 U.S. National Parks, finding an average 24-hour residual noise level of 21.6 dBA. Note that these measures include only the one-third octave bands from 12.5 Hz to 800 Hz, so they are not directly comparable to the full-spectrum measures; however, these frequencies span most anthropogenic noise and residual noise in undisturbed areas, so this measure provides an appropriate estimate of ambient noise levels at these sites (Lynch et al. 2011).
In addition, in our analysis of the data from long-term deployment of SLMs by KC Harvey Environmental L.L.C. (2009) on the PAPA, the median L90 among 12 monitored leks was 27.2 dBA and the minimum lek was 22.2 dBA (Table 1). These are likely overestimates of pre-development ambient, given that (1) all of these leks experienced some noise from natural gas infrastructure and highways and (2) that measurements included afternoons and windy periods, and (3) that this Type-2 SLM had a noise floor of 20 to 22 dBA and, thus,

240 Human–Wildlife Interactions 7(2)
could not measure quieter values (and likely overestimated levels near this lower limit; see Appendix for more information).
A more recent study, which measured noise using highly-sensitive Type-1 SLM with a noise floor of 14 dB, found that the mean day-long residual noise level (L90) of 3 undisturbed leks near the PAPA was 15.5 dBA (range 14.2 dBA to 17.1 dBA). Even on the heavily-developed PAPA, the 19 monitored leks ranged from 16.0 dBA to 34.8 dBA, with 4 of the leks having L90 values < 20 dBA (Ambrose and Florian 2013).Therefore, we recommend that an ambient value of 16 to 20 dBA should be used for interim protections in sage-grouse habitat. In revised management strategies, this new default ambient would replace the previous default of 39 dBA or replace empirical measurements of ambient at lek edge.
Setting a threshold above ambientAs discussed above, we do not yet know
whether limiting noise to 10 dB above ambient is appropriate for protecting sage-grouse. However, we recommend continuing to use the 10 dB threshold as an interim measure, combined with appropriate measures of ambient (i.e., 16 to 20 dBA). This threshold value is based on the best available science, but should be revised as needed when better information becomes available. Using 16 dBA as the ambient value would allow up to 26 dBA of noise exposure; using 20 dBA as ambient would allow up to 30 dBA of noise exposure.
How should compliance with this management objective be measured? Noise can be variable over time, space, and frequency spectrum, and no single metric can capture this complexity. However, using multiple metrics to assess compliance may be complicated to implement, at least in the interim. Therefore, we recommend using the A-weighted L50 as a measure of median noise exposure. This metric is useful because it is less influenced by the brief, intruding sounds (e.g., birds, insects and airplanes) that can dominate other metrics. This metric also may exclude some types of noise produced by the development activities being monitored, including vehicles (unless traffic is very heavy). For that reason, it will typically not be effective at reflecting any impacts caused by traffic noise. Despite this concern, the L50
is recommended because, otherwise, birds, insects, and other indicators of a healthy habitat may be counted against compliance (unless audio recordings are produced, allowing monitors to exclude time periods with such activity; this may be a preferable solution in the long run, but it will require time to develop such a protocol).
We recommend that measurements be made during times when noise exposure is most likely to affect greater sage-grouse; that is, nights and mornings (i.e., 0600 to 0900 hours). Further, we recommend using the average of L50 values at multiple (3 to 4) locations between each noise source and the edge of the protected area. This will reduce the impact of aberrant measurements (high or low) at particular locations, because noise values can change with topography and local ground cover. Measurements should be taken with a Type-1 sound level meter (or a method with similar accuracy and a noise floor <20 dBA). We recommend making measurements of ≥1 hour at each site, ideally over multiple days and climatic conditions, because temperature (especially temperature inversions), humidity, and wind can affect noise levels. Whenever possible, we recommend collecting additional metrics for research and long-term monitoring (see recommended metrics in the “Establishing ambient values” section above).
It should be noted that, based on the measurements presented in Table 1, four of the 12 monitored leks on the Pinedale Anticline are in compliance with the noise management objectives recommended here based on a 20-dBA ambient value (i.e., they do not exceed an L50 of 30 dBA). These leks are in a heavily developed area that has experienced declines in sage-grouse populations (Holloran 2005, Holloran et al. 2010). This suggests that (1) these recommended protections are not as onerous as they may initially seem, and (2) even these stricter recommendations may not suffice to avoid population declines if noise levels are measured at lek edge (as in Table 1), rather than across nesting and brood-rearing habitats, as discussed below.
Redefining the protected areaCurrent noise management strategies
typically recommend noise measurements at

241Noise impacts on sage-grouse • Patricelli et al.
the edge of the lek to assess compliance (e.g., State of Wyoming 2011; BLM 1999, 2003, 2008). This approach manages noise levels on the lek itself, but not in the surrounding habitat that is critical to successful reproduction of sage-grouse. As discussed above, there is evidence that this off-lek noise will affect on-lek activities and successful reproduction. Therefore, we recommend that interim and longer-term management strategies aim to protect the soundscape in areas critical for mating, foraging, nesting, and brood-rearing activities. Thus, we recommend that noise >10 dB above ambient be managed as a disruptive activity throughout sage-grouse lekking, nesting, and brood-rearing habitat (e.g., BLM 2012). To accomplish this, we recommend measuring compliance with noise objectives at the edge of the critical area encompassing lekking, nesting, and brood-rearing activities, rather than at the edge of the lek. These critical areas are typically defined as buffers surrounding the edge of the lek, with a 3.1-km buffer encompassing ~45% of nests and a 6.4-km buffer encompassing 74 to 80% of nests (Moynahan 2004, Holloran and Anderson 2005). Where possible, mapping of utilized areas would be preferable. The size and shape of the protected area should be determined based on management objectives.
Limiting traffic noiseGiven the difficulty of measuring intermittent
traffic noise and the uncertainty about which metrics are informative, we recommend that interim protections focus not on setting objectives for traffic noise levels, but, rather, on the siting of roads or the limitation of traffic during critical times of the day (0600 to 0900 hours) and year (breeding season).
To develop interim recommendations for the siting of roads, we estimated the distance from a road at which noise levels (Lmax as a single vehicle passes) will drop down to 10 dB above ambient. To calculate this estimate of impact distances from roads, we used our measurements of noise levels from 17 vehicles (flatbed trucks and big rigs) on the Luman Road and 8 vehicles on North Jonah Road on the Jonah Natural Gas Field in Sublette County, Wyoming (collected in 2006). All measurements were made at 0.4 km from the road. A-weighted Lmax values were averaged for
each road and the average of the 2 roads was 45.5 dBA (S.E. = 1.3 dBA; range 37 to 58.7 dBA). We similarly calculated average A-weighted levels for each octave from 16 to 16,000 Hz. In each octave band, we calculated propagation using the assumption of spherical spreading and octave-specific excess attenuation values from the Pinedale Anticline noise analysis report prepared by the BLM with assistance from the U.S. Army Corps of Engineers and U.S. Forest Service (BLM 1999). Using these methods, we extrapolated noise propagation beyond our quarter-mile measurements until levels reached 30, 26, 20 and 16 dBA (Figure 2). The same calculations were used to estimate propagation distances around an example drilling rig measured on the PAPA in 2006 (an Leq of 66.7 dBA at 0.1 km; Figure 2).
Using an ambient of 20 dBA, we calculated that vehicle noise will diminish to 30 dB at ~1.3 km from the road. Using an ambient of 16 dB, we calculated that vehicle noise will diminish to 26 dBA at ~1.7 km from the road. Therefore, to avoid disruptive activity in areas crucial to mating, nesting, and brood-rearing activities, we recommend that managers consider siting roads (or seasonally limiting traffic) within 1.3 to 1.7 km from the edge of these areas. We emphasize that we are recommending restrictions within this distance of the edge of sage-grouse nesting and brood-rearing habitat, not the lek edge. Further, note that noise from traffic will be audible at least until levels drop down to ambient values, which will occur 2.7 to 3.6 km from the road. Therefore, adopting these recommendations will not eliminate traffic noise in critical areas, but should reduce its impact.
Under certain conditions, noise may propagate much farther than predicted above. The above estimates are based on the maximum noise levels as a single vehicle passes; however, on roads with sufficient traffic to create a steady stream of vehicles, noise drops off more slowly (levels would follow predictions of cylindrical spreading, dropping only 3 dB with every doubling of distance, rather than 6 dB, as assumed here). Similarly, noise levels drop off according to predictions of cylindrical spreading during early morning temperature inversions, which are common in sage-grouse habitat (Schnell et al. 2009). For an
242 Human–Wildlife Interactions 7(2)
ambient of 20 dB and 16 dB, respectively, traffic noise under conditions of cylindrical spreading would reach 10 dB above ambient at 2.3 to 3.3 km from the road, and this noise would reach ambient at 5.3 to 6.4 km from the road. For these reasons, the recommendations presented here will not protect sage-grouse breeding activities under all conditions, but will be a significant improvement over current policy in most cases.
Given that traffic noise was found to have more than twice the impact of continuous noise on lek attendance (Blickley et al. 2012a), minimizing traffic noise as a disruptive activity in all areas critical for successful reproduction should be a priority in any revised noise management strategy. In areas where implementing recommended limits on siting or traffic is not possible, other measures may reduce traffic noise impacts. One possibility would be to adjust the times at which personnel begin and end work shifts in development areas to avoid causing an increase in traffic during critical times. Avoiding shift changes between 1800 and 0900 hours would be ideal, but if this is not possible, then avoiding 2400 to 0900 hours would likely be a significant improvement.
Conclusions Over the last decade, interest in
understanding noise impacts on wildlife has been increasing rapidly (Barber et al. 2009, Blickley and Patricelli 2010, Kight and Swaddle 2011). Recent research has demonstrated that noise can cause avoidance (Habib et al. 2007, Bayne et al. 2008, Blickley et al. 2012a), flight (Brown 1990, Delaney et al. 1999), altered communication (Slabbekoorn and Peet 2003, Leonard and Horn 2005), reduced pair-bonding (Swaddle and Page 2007), reduced breeding success (Francis et al. 2009), increased stress (Weisenberger et al. 1996, Blickley et al. 2012b), increased mortality in some species, and no effect or even the opposite effects in other species (Francis et al. 2009, Crino et al. 2013). As a result of the increased interest in noise impacts, the methods available to measure noise and noise impacts have been improving rapidly, as have industry standards (Pater et al. 2009, Lynch et al. 2011). The recommendations presented here for further research, for noise measurement protocols, and for interim protection are based
on the best available science, reflecting our current understanding of noise impacts on greater sage-grouse. However, we emphasize the importance of building flexibility into sage-grouse protections in Wyoming and other states so that the results of ongoing and future research can be used to improve upon the recommendations presented here.
Finally, it is critical to note that noise is only one of multiple types of disturbance impacting greater sage-grouse habitat (Connelly et al. 2004, Connelly et al. 2011). Noise mitigation alone is unlikely to suffice in offering protection for this species. Indeed, in some cases, restrictions on the density of developments (e.g., well density in areas of natural gas development) may offer more or equivalent protection from noise and other types of disturbance than the recommendations we make here, if those restrictions lead to larger distances between developments and critical habitat for sage-grouse. Therefore, we are not recommending that the protections described here supplant all existing protection. Rather, we hope that these recommendations for protecting the soundscape be considered as part of a comprehensive conservation strategy for sage-grouse that addresses many types of disturbance.
AcknowledgmentsThat manuscript was originally prepared
as a white paper for the U.S. Bureau of Land Management, Lander Field Office and Wyoming State Office, Cheyenne, Wyoming, and Wyoming Game and Fish Department. We thank T. Christiansen and C. Keefe for helpful comments on the manuscript. This manuscript benefited from helpful discussions with K. Fristrup, M. Holloran, J. Morton, S. Oberlie, and S. Harter. Funding provided by the National Parks Service, U.S. Bureau of Land Management, Wyoming Sage-Grouse Conservation Fund (State of Wyoming), National Fish and Wildlife Foundation, the Wyoming Community Foundation, Tom Thorne Sage-Grouse Conservation Fund, University of California–Davis, and the National Science Foundation (IOS-0925038).
Literature citedAldridge, C. L., and M. S. Boyce. 2007. Linking

243Noise impacts on sage-grouse • Patricelli et al.
occurrence and fitness to persistence: habitat-based approach for endangered greater sage-grouse. Ecological Applications 17:508–526.
Ambrose, S., and C. Florian. 2013. Draft: sound levels of gas field activities at greater sage-grouse leks, Pinedale Anticline Project Area, Wyoming, April 2013. Sandhill Company, Pine-dale Anticline Project Office, Pinedale, Wyo-ming, USA.
American National Standards Institute. 1983. American national standard specification for sound level meters, S1.4. American National Standards Institute, Washington, D.C., USA.
American National Standards Institute. 2001. American national standard specification for sound level meters, S1.4. American National Standards Institute, Washington, D.C., USA.
American National Standards Institute. 2003. American national standard quantities and pro-cedures for description and measurement of environmental sound, S12.9P1. American Na-tional Standards Institute, Washington, D.C., USA.
American National Standards Institute. 2005. American national standard quantities and pro-cedures for description and measurement of environmental sound: noise assessment and prediction of long-term community response, S12.9P4. American National Standards Insti-tute, Washington, D.C., USA.
Barber, J. R., K. R. Crooks, and K. M. Fristrup. 2009. The costs of chronic noise exposure for terrestrial organisms. Trends in Ecology and Evolution 25:180–189.
Bayne, E., L. Habib, and S. Boutin. 2008. Im-pacts of chronic anthropogenic noise from energy-sector activity on abundance of song-birds in the boreal forest. Conservation Biology 22:1186–1193.
Beck, T. D. I. 1977. Sage-grouse flock character-istics and habitat selection in winter. Journal of Wildlife Management 41:18–26.
Blickley, J. L. 2012. The effects of anthropogenic noise on lek attendance, communication, and behavior in greater sage-grouse (Centrocercus urophasianus). Dissertation, University of Cali-fornia, Davis, California, USA.
Blickley, J. L., D. Blackwood, and G. L. Patricelli. 2012a. Experimental evidence for the effects of chronic anthropogenic noise on abundance of greater sage-grouse at leks. Conservation Biology 26:461–471.
Blickley, J. L., and G. L. Patricelli. 2010. Impacts of anthropogenic noise on wildlife: research priorities for the development of standards and mitigation. Journal of International Wildlife Law and Policy 13:274–292.
Blickley, J. L., and G. L. Patricelli. 2012. Potential acoustic masking of greater sage-grouse dis-play components by chronic industrial noise. Ornithological Monographs 74:23–35.
Blickley, J. L., K. R. Word, A. H. Krakauer, J. L. Phillips, S. N. Sells, J. C. Wingfield, and G. L. Patricelli. 2012b. Experimental chronic noise exposure is related to elevated fecal corticoste-roid metabolites in lekking male greater sage-grouse (Centrocercus urophasianus). PLoS ONE 7:e50462.
Bonier, F., P. R. Martin, I. T. Moore, and J. C. Wingfield. 2009. Do baseline glucocorticoids predict fitness? Trends in Ecology and Evolu-tion 24:634–642.
Braun, C. E. 1998. Sage-grouse declines in west-ern North America: what are the problems? Proceedings of the Western Association of State Fish and Wildlife Agencies 78:139–156.
Brenowitz, E. A. 1982. The active space of red-winged blackbird song. Journal of Comparative Physiology 147:511–522.
Brown, A. L. 1990. Measuring the effect of aircraft noise on sea birds. Environment International 16:587–592.
Bureau of Land Mangement. 1999. Noise analy-sis for the Pinedale Anticline Oil and Gas Ex-ploration and Development Project, Sublette County, Wyoming. U.S. Bureau of Land Man-agement, Pinedale Field Office, Pinedale, Wy-oming, USA.
Bureau of Land Mangement. 2003. Final environ-mental impact statement and proposed plan amendment for the Powder River Basin oil and gas project. U. S. Bureau of Land Mangement, Buffalo Field Office, Buffalo, Wyoming, USA.
Bureau of Land Mangement. 2008 Record of de-cision for the supplemental environmental im-pact statement, Pinedale Anticline Oil and Gas Exploration and Development Project. U.S. Bureau of Land Mangement, Pinedale Field Office, Pinedale, Wyoming, USA.
Bureau of Land Management. 2012. Instruction memorandum 2012-19: greater sage-grouse habitat management policy on Wyoming Bu-reau of Land Management administered pub-lic lands, including the federal mineral estate.

244 Human–Wildlife Interactions 7(2)
U. S. Bureau of Land Management, Wyoming State Office, Cheyenne, Wyoming, USA.
Connelly, J. W., K. P. Reese, and M. A. Schroeder. 2003. Monitoring of greater sage-grouse habi-tats and populations. College of Natural Re-sources Experiment Station Bulletin. University of Idaho, Moscow, Idaho, USA.
Connelly, J. W., S. T. Knick, M. A. Schroeder, and S. J. Stiver. 2004 Conservation assessment of greater sage-grouse and sagebrush habitats. Western Association of Fish and Wildlife Agen-cies, Cheyenne, Wyoming, USA.
Connelly, J. W., S. T. Knick, C. E. Braun, W. T. Bak-er, E. A. Beever, T. Christiansen, K. E. Doherty, E. O. Garton, S. E. Hanser, D. H. Johnson, M. Leu, R. F. Miller, D. E. Naugle, S. J. Oyler-Mc-Cance, D. A. Pyke, K. P. Reese, M. A. Schroed-er, S. J. Stiver, B. L. Walker, and M. J. Wisdom. 2011. Conservation of greater sage-grouse: a synthesis of current trends and future manage-ment. Pages 549–563 in S. T. Knick and J. W. Connelly, editors. Greater sage-grouse: ecol-ogy and conservation of a landscape species and its habitats. Volume 38. University of Cali-fornia Press, Berkeley, California, USA.
Crino, O. L., E. E. Johnson, J. L. Blickley, G. L. Patricelli, and C. W. Breuner. 2013. Effects of experimentally elevated traffic noise on nest-ling white-crowned sparrow stress physiology, immune function and life history. Journal of Ex-perimental Biology 216:2055–2062.
Delaney, D. K., T. G. Grubb, P. Beier, L. L. Pater, and M. H. Reiser. 1999. Effects of helicopter noise on Mexican spotted owls. Journal of Wildlife Mangement 63:60–76.
Doherty, K. E., D. E. Naugle, B. L. Walker, and J. M. Graham. 2008. Greater sage-grouse win-ter habitat selection and energy development. Journal of Wildlife Management 72:187–195.
Doherty, K. E., D. E. Naugle, and B. L. Walker. 2010. Greater sage-grouse nesting habitat: the importance of managing at multiple scales. Journal Of Wildlife Management 74:1544–1553.
Dooling, R. J., and A. N. Popper. 2007. The Effects of highway noise on birds. California Depart-ment of Transportation Division of Environmen-tal Analysis, Sacramento, California, USA.
Environmental Protection Agency. 1971. Com-munity noise. U.S. Environmental Protection Agency, Washington, D.C., USA.
Francis, C. D., C. P. Ortega, and A. Cruz. 2009.
Noise pollution changes avian communities and species interactions. Current Biology 19:1415–1419.
Gibson, R. M. 1989. Field playback of male dis-play attracts females in lek breeding sage grouse. Behavioral Ecology and Sociobiology 24:439–443.
Gibson, R. M. 1996. Female choice in sage grouse: the roles of attraction and active com-parison. Behavioral Ecology and Sociobiology 39:55–59.
Gibson, R. M., and J. W. Bradbury. 1985. Sexual selection in lekking grouse: phenotypic cor-relates of male strutting success. Behavioral Ecology and Sociobiology 18:117–123.
Habib, L., E. M. Bayne, and S. Boutin. 2007. Chronic industrial noise affects pairing success and age structure of ovenbirds Seiurus auroca-pilla. Journal of Applied Ecology 44:176–184.
Hagen, C. A. 2011. Predation on greater sage-grouse: facts, process, and effects. Pages 95–100 in S. T. Knick and J. W. Connelly, edi-tors. Greater sage-grouse: ecology and con-servation of a landscape species and its habi-tats. Volume 38. University of California Press, Berkeley, California, USA.
Holloran, M. J. 2005. Greater sage-grouse (Cen-trocercuc urophasianus) population response to natural gas field development in western Wyoming. Dissertation, University of Wyoming, Laramie, Wyoming, USA.
Holloran, M. J., and S. H. Anderson. 2005. Spatial distribution of greater sage-grouse nests in rel-atively contiguous sagebrush habitats. Condor 107:742–752.
Holloran, M. J., R. C. Kaiser, and W. A. Hubert. 2010. Yearling greater sage-grouse response to energy development in Wyoming. Journal Of Wildlife Management 74:65–72.
Hu, Y., and G. C. Cardoso. 2009. Are bird species that vocalize at higher frequencies preadapted to inhabit noisy urban areas? Behavioral Ecol-ogy 20:1268–1273.
Jankowski, M. D. 2007. The influence of habitat disturbance and synergized resmethrin on avi-an immunocompetence. Dissertation, Univer-sity of Wisconsin, Madison, Wisconsin, USA.
KC Harvey Environmental L.L.C. 2009. Pinedale Anticline Project area sage-grouse monitor-ing: noise monitoring report. Pinedale Anticline Project Office, Pinedale, Wyoming, USA.
Kight, C. R., and J. P. Swaddle. 2011. How and

245Noise impacts on sage-grouse • Patricelli et al.
behavior in California ground squirrels (Sper-mophilus beecheyi). Biological Conservation 131:410–420.
Reed, S. E., J. L. Boggs, and J. P. Mann. 2012. A GIS tool for modeling anthropogenic noise propagation in natural ecosystems. Environ-mental Modelling and Software 37:1–5.
Rogers, G. E. 1964. Sage-grouse investigations in Colorado, Technical Publication No. 16, Colo-rado Game, Fish and Parks Department, Den-ver, Colorado, USA.
Schnell, R. C., S. J. Oltmans, R. R. Neely, M. S. Endres, J. V. Molenar, and A. B. White. 2009. Rapid photochemical production of ozone at high concentrations in a rural site during winter. Nature Geoscience 2:120–122.
Schoenberg, T. J. 1982. Sage- grouse movements and habitat selection in North Park, Colorado. Thesis, Colorado State University, Fort Collins, Colorado, USA.
Schroeder, M. A., J. R. Young, and C. E. Braun. 1999 Sage-grouse: Centrocerus urophasia-nus. Birds of North America 425:1–28.
Slabbekoorn, H., and M. Peet. 2003. Ecology: Birds sing at a higher pitch in urban noise. Na-ture 424:267.
State of Wyoming. 2008. Greater sage-grouse core area protection. Office of the Governor, State of Wyoming Executive Order 2008-2, Cheyenne, Wyoming, USA, <http://www-wsl.state.wy.us/sis/wydocs/execorders/WS-GOV-EO-2008-02.pdf>. Accessed August 20, 2013.
State of Wyoming. 2010. Greater sage-grouse core area protection. Office of the Governor, State of Wyoming Executive Order 2010-4, Cheyenne, Wyoming, USA, <http://www-wsl.state.wy.us/sis/wydocs/execorders/WS-GOV-EO-2010-04.pdf>. Accessed August 20, 2013.
State of Wyoming. 2011. Greater sage-grouse core area protection. Office of the Governor, State of Wyoming Executive Order 2011-5, Cheyenne, Wyoming, USA, <http://www-wsl.state.wy.us/sis/wydocs/execorders/EO2011-05.pdf>. Accessed August 20, 2013.
Swaddle, J. P., and L. C. Page. 2007. High levels of environmental noise erode pair preferences in zebra finches: implications for noise pollu-tion. Animal Behaviour 74:363–368.
Swenson, J. E., C. A. Simmons, and C. D. Eustace. 1987. Decrease of sage-grouse Centrocerus urophasianus after ploughing of sagebrush steppe. Biological Conservation 41:125–132.
why environmental noise impacts animals: an integrative, mechanistic review. Ecology Let-ters 14:1052–1061.
Leonard, M. L., and A. G. Horn. 2005 Ambient noise and the design of begging signals. Pro-ceedings of the Royal Society of London, Se-ries B. 272:651–656.
Lynch, E., D. Joyce, and K. Fristrup. 2011. An as-sessment of noise audibility and sound levels in U.S. National Parks. Landscape Ecology 26:1297–1309.
Lyon, A. G., and S. H. Anderson. 2003. Potential gas development impacts on sage-grouse nest initiation and movement. Wildlife Society Bul-letin 31:486–491.
Moynahan, B. J. 2004. Landscape-scale factors affecting population dynamics of greater sage-grouse (Centrocercus urophasianus) in north-central Montana. Dissertation, University of Montana, Missoula, Montana, USA.
Naugle, D. E., K. E. Doherty, B. E. Walker, M. J. Holloran and H. J. Copeland. 2011. Energy development and greater sage-grouse. Pages 489–504 in S. T. Knick and J. W. Connelly, edi-tors. Greater sage-grouse: ecology and con-servation of a landscape species and its habi-tats. Volume 38. University of California Press, Berkeley, California, USA.
Nicholoff, S. H., compiler. 2003 Wyoming Bird Conservation Plan, Version 2.0. Wyoming Partners In Flight, Wyoming Game and Fish Department, Lander, Wyoming, USA.
Pater, L. L., T. G. Grubb, and D. K. Delaney. 2009. Recommendations for improved assessment of noise impacts on wildlife. Journal Of Wildlife Management 73:788–795.
Patricelli, G. L., M. S. Dantzker, and J. W. Brad-bury. 2007. Differences in acoustic directional-ity among vocalizations of the male red-winged blackbird (Agelaius phoeniceus) are related to function in communication. Behavioral Ecology and Sociobiology 61:1099–1110.
Patricelli, G. L., and A. H. Krakauer. 2010. Tacti-cal allocation of effort among multiple signals in sage grouse: an experiment with a robotic female. Behavioral Ecology 21:97–106.
Quinn, L., J. Whittingham, J. Butler, and W. Cress-well. 2006. Noise, predation risk compensation and vigilance in the chaffinch Fringilla coelebs. Journal of Avian Biology 37:601–608.
Rabin, L. A., R. G. Coss, and D. H. Owings. 2006. The effects of wind turbines on antipredator

246 Human–Wildlife Interactions 7(2)
Vehrencamp, S. L., J. W. Bradbury, and R. M. Gib-son. 1989. The energetic cost of display in male sage grouse. Animal Behaviour 38:885–896.
Wallestad, R. O., and P. Schladweiler. 1974. Breeding season movements and habitat se-lection of male sage grouse. Journal of Wildlife Management 38:634–637.
Wasser, S. K., K. E. Hunt, J. L. Brown, K. Cooper, C. M. Crockett, U. Bechert, J. J. Millspaugh, S. Larson, and S. L. Monfort. 2000. A generalized fecal glucocorticoid assay for use in a diverse array of nondomestic mammalian and avian species. General and Comparative Endocrinol-ogy 120:260–275.
Weisenberger, M. E., P. R. Krausman, M. C. Wal-lace, D. W. D. Young, and O. E. Maughan. 1996. Effects of simulated jet aircraft noise on heart rate and behavior of desert ungulates. Journal of Wildlife Management 60:52–61.
Wiley, R. H. 1973. Territoriality and non-random mating in sage-grouse (Centrocercus uropha-sianus). Animal Behaviour Monographs 6:85–169.
Wingfield, J. C. 2005. The concept of allostasis: coping with a capricious environment. Journal of Mammalogy 86:248–254.
Gail l. patRiCelli is an associate profes-sor of evolution and ecology at the University of
California–Davis. She studies bioacoustics, breed-ing behaviors, and noise impacts in sage-grouse and songbirds. For the last 7 years, with graduate student Jessica Blickley and postdoctoral scholars Diane Blackwood, Stacie Hooper, and Alan Krakauer, she has been investigating the impacts of noise from natural gas development
activities on greater sage-grouse lek attendance, stress levels, and behaviors. She has published multiple peer-reviewed papers on noise impacts on wildlife and has served on expert panels to establish noise measurement protocols for the U.S. National Parks Service.
JeSSiCa l. BliCkley recently completed her Ph.D. degree in ecology in the Patricelli Lab at
the University of California–Davis. Blickley has been studying noise impacts on sage-grouse for 6 years. She has published multiple peer-reviewed papers on noise impacts on wildlife, and has served on expert panels to establish noise measurement protocols for the U.S. National Parks Service. She recently co-edited an ornithological
monograph on the impacts of anthropogenic noise on birds and bird studies.
StaCie l. hoopeR is a postdoctoral researcher in the Patricelli Lab in the Department
of Evolution and Ecol-ogy at the University of California–Davis. She has published multiple peer-reviewed papers on noise impacts on wildlife; her dissertation research addressed noise impacts on ground squirrels in Yosemite National Park. She also works for the California Department of Fish and Game as the California Wildlife Habitat
Relationships (CWHR) program coordinator, main-taining and updating species range data and habitat suitability models to predict species occurrence across the state. She is also part of the California contingent of the Crucial Habitat Assessment Tool team of the Western Governors Association.

247Noise impacts on sage-grouse • Patricelli et al.
Appendix:
Glossary of noise terms
A-weighting: A-weighting (usually denoted as dBA or dB-A) is used to account for changes in level sensitivity as a function of frequency (ANSI 2001). In an effort to simulate the relative response of the human ear, A-weighting de-emphasizes the high (>6.3 kHz) and low (<1 kHz) frequencies, and emphasizes the frequencies in between. Unfortunately, there is no weighting specific to sage-grouse or other wildlife. Most birds, besides owls, have hearing capabilities similar to or slightly worse than humans; therefore, some experts recommend that A-weighting may be a suitable if not ideal metric for studies of birds (Dooling and Popper 2007).
Ambient noise: Ambient noise, often called background noise, is typically defined as any sound other than the sound being monitored. Ambient noise can be measured to include all of the non-focal sounds in the environment, such as wind, birds, insects, and other sources, including anthropogenic noise. Here we recommend that, to improve repeatability and generality of measurements and better limit anthropogenic noise impacts, we should minimize the contribution of these sources of noise in our ambient measures when setting a baseline for noise management strategies.
Decibel: The amplitude of a sound, perceived as loudness, is typically measured in decibels (dB). The decibel scale is logarithmic, and, therefore, small changes in decibel level represent large changes in loudness. Every 6 dB increase in noise levels is a doubling in amplitude, measured as changes in air pressure. One often hears the rule of thumb that a 10 dB increase in noise is subjectively perceived by humans as a doubling in loudness. However, this perception depends on the frequencies (i.e., pitch) of the sounds and can vary with amplitude. In humans, a 6 dBA increase in noise level leads to an approximate doubling in the number of noise complaints (ANSI 2005), suggesting that humans are more sensitive than this 10 dB rule of thumb implies. Because we do not know if sage-grouse or other nonhuman animals perceive sounds similarly to humans, the non-subjective “6 dB doubling” rule of thumb is preferable. Noise measurements are typically made relative to the threshold of human hearing (20µPa) and denoted as sound pressure level (SPL), or dB SPL (though the SPL is often assumed). A value of 0 dB SPL is equal to the threshold of human hearing; 60 to 70 dB SPL is typical conversational level and 130 dB SPL is the threshold of pain.
Detection distance and listening area: Detection distance is the maximum distance between the sender and receiver where the signal is still audible. The listening area is the total area around the sender over which a sound can be detected (also called the active space; Brenowitz 1982). Barber et al. (2009) offered simple formulas for estimating the reduction in detection distance and listening area resulting from an increase in background noise. The formula for calculating how the detection distance changes with an increase in noise is: detection distance =10(- (dB change
in noise)/20). This shows a halving of detection distance for each 6 dB increase in noise; therefore, a >3-fold decrease (69% decrease) in detection distance with a 10 dB increase in noise and a 10-fold reduction in detection distance (90% decrease) with a 20 dB increase in noise. The formula for calculating how the listening area changes with an increase in noise is: listening area = 10(-(dB
change in noise)/10). The area of a circle (i.e., listening area around the vocalizing animal) decreases with the square of the radius (i.e., detection distance between the vocalizing animal and the receiver), which leads to a halving of listening area with every 3 dB increase in noise and 10-fold reduction with every 10 dB. These decreases in active space and detection distance are less extreme when environmental attenuation of noise is considered, but are nonetheless very large (Blickley and Patricelli 2012).

248 Human–Wildlife Interactions 7(2)
One-third octave bands: An octave is a band of frequencies whose lower limit is half of the upper limit, and is named for its central frequency. The range of human hearing is divided into 10 standardized octave bands; each octave-band can be broken down into 3 parts, or one-third-octave bands typically ranging from 12.5 Hz to 20 kHz. One-third-octave band levels can be used to construct power spectra that show the relative power of different frequencies. One-third octave band measures can be used to calculate a number of other metrics, especially if they are collected continuously at short intervals. Measurements of the relative amplitude of the noise at different frequencies is important for calculating the potential of a noise source to mask sound relevant to the species of interest and can sometimes be used to identify the source of the sound.
Leq (also called Lavg): The equivalent noise level. This can be thought of as the average noise level across the sample period; more precisely, it is the level of a constant sound over a specific time period that has the same sound energy as the actual (variable) sound.
Lmax and Lmin: The RMS (root-mean squared) maximum and minimum noise levels integrated over a specified time interval and measured during a single noise event or specified time period. The Lmax characterizes the maximum noise level, defined by the loudest single noise event. Similarly, Lmin is the minimum noise level or quietest period.
L50: The median noise level is the level that is exceeded 50% of the time. This measure is collected over some time period (e.g., 1 hour, or from 0600 to 0900 hours) with this period being broken down into much smaller intervals (typically 1 second); an L50 of 30 dBA would mean that half of the intervals measured were <30 dBA, and half of them were >30 dBA. This metric is recommended rather than a measure of average noise over a longer interval, like Leq or Lavg, because these average metrics are more influenced by occasional loud events, such as those caused by a songbirds, insects, aircraft, wind gusts, etc. These intruding sounds will have no impact on the L50, unless they are present more than 50% of the time.
L90: This is accepted by the American National Standards Institute (ANSI 2003) as a measure of background or “residual noise level”. As with the L50, the L90 is collected over some time period (e.g., 1 hour, or from 0600 to 0900 hours ) with this period being broken down into much smaller intervals (typically 1 second); an L90 of 20 dBA would mean that 10% of the intervals measured were <20 dBA and 90% of them were >20 dBA. Residual noise levels reflect background noise level at a site, since they exclude most intruding noise from birds, insects, wind gusts and sporadic anthropogenic noises (passing vehicles or aircraft) that raise the average (e.g., Leq or Lavg) and peak values (e.g., Lpeak, Lmax, and L10) over a measurement period. This metric is the most suited for estimating ambient values to set the baseline for management objectives. Note that in an area with anthropogenic noise sources producing continuous noise (like most energy development infrastructure), the L90 measurement will not represent pre-development ambient values since the continuous noise source will contribute to the residual levels. To estimate predevelopment ambient for a disturbed site, measurements must be collected in a similar but undisturbed area, or estimated through modeling.
L10: The L10 is the noise level that is exceeded 10% of the time and is a metric that characterizes the maximum of noise level in an area. The L10 is collected over some time period with this period being broken down into much smaller intervals (typically, 1 second); an L10 of 60 dBA would mean that 90% of the intervals measured were <60 dBA, and 10% of them were >60 dBA.
Noise: Any unwanted sound is considered noise. Thus, signals produced by 1 animal, such as crickets, may be noise to another animal. When managing noise impacts on wildlife, we typically consider only sounds produced by humans and human-produced infrastructure to be noise.

249Noise impacts on sage-grouse • Patricelli et al.
Sound level meter (SLM): A sound level meter is a tool used to measure the amplitude of a noise source in decibels. Most Type-1 (ANSI 1983) precision SLMs have a “noise floor” of ~17 dB, meaning that they cannot measure quieter sounds, because these sounds will be masked by the noise from the SLM itself. Recently, highly-sensitive Type-1 SLMs with noise floors of 12 to 14 dBA have become available. Some SLM noise is typically detected ≤10 dB above the noise floor (i.e., 27 dB), especially when using A-weighting, as discussed above. This is not a problem when measuring louder sounds (i.e., many noise sources associated with development) that overwhelm any contribution of the noise from the SLM (as well as noise from a slight breeze or other incidental sounds). Measurements of quiet sounds are, thus, particularly challenging. Type-2 SLMs are more affordable but can have noise floors of ~35 dB and should, therefore, never be used to measure ambient noise or quiet sound sources (expected to be <35 to 40 dBA); some more expensive Type-2 meters have noise floors approaching 22 dBA and would, therefore, be more useful for measuring quiet sounds, but not ambient levels. The importance of the noise floor of the meter can be seen clearly when comparing the data from Ambrose and Florian (2013), who found an L90 of 16.0 dB on the quietest lek on the PAPA with a Type-1 SLM (14 dB noise floor), and the data of KC Harvey (2009; Table 1), who found an L90 of 22.2 dBA on the quietest lek on the PAPA with a Type-2 SLM (20 to 22 dB noise floor). These data suggest that the L90 values from the KC Harvey study were likely determined by the noise floor of the SLM rather than by the ambient noise levels in this area Within a few decibels above the noise floor, the accuracy of Type-2 meters is typically only slightly lower than Type-1 meters. Type-3 SLMs have higher noise floors and lower accuracy and should not be used for measuring ambient or assessing compliance.
Soundscape: All of the sounds at a particular location.