Embed Size (px)
Citation preview
Recovering Spectral Reflectance under Commonly Available Lighting Conditions
Jun Jiang and Jinwei GuRochester Institute of Technology
54 Lomb Memorial Drive, Rochester, NY, [email protected], [email protected]
Abstract
Recovering the spectral reflectance of a scene is impor-tant for scene understanding. Previous approaches use ei-ther specialized filters or controlled illumination where theextra hardware prevents many practical applications. Inthis paper, we propose a method that accurately recoversspectral reflectance from two images taken with conven-tional consumer cameras under commonly available light-ing conditions, such as daylight at different times over aday, camera flash and ambient light, and fluorescent andtungsten light. Our approach does not require camera spec-tral sensitivities or the spectra of the illumination, whichmakes it easy to implement for a variety of practical appli-cations. Based on noise analysis, we also derive theoreticalpredictors that answer: (1) which two lighting conditionslead to the most accurate spectral recovery overall, and (2)for two given lighting conditions, which spectral reflectanceis more likely to be estimated accurately. We implementthe method on a variety of cameras from high-end DSLRsto cellphone cameras, and apply the recovered spectral re-flectance for several applications such as fine art reproduc-tion, fruit identification, and material classification. Bothsimulation and experimental results demonstrate the effec-tiveness of the proposed method.
1. IntroductionEstimating the spectral reflectance of a scene is an es-
sential component for scene recovery in computer vision.There is a large literature of spectral reflectance recoveryby using multiple images acquired with either specializedfilters, such as w/ and w/o a colored filter [4], a pair of yel-low and blue filters [2, 20] and liquid crystal tunable filters(LCTF) [5], or controlled illuminations, such as LED arrays[17] and a DLP projector with a color wheel [6]. While theycan obtain accurate results, most of these methods requireextra hardware for imaging, which prevent many practicalapplications such as those in the outdoors with consumer-grade cameras (e.g. smartphone cameras, point-and-shootcameras, and DSLRs).
In this paper, we aim to recover spectral reflectance un-
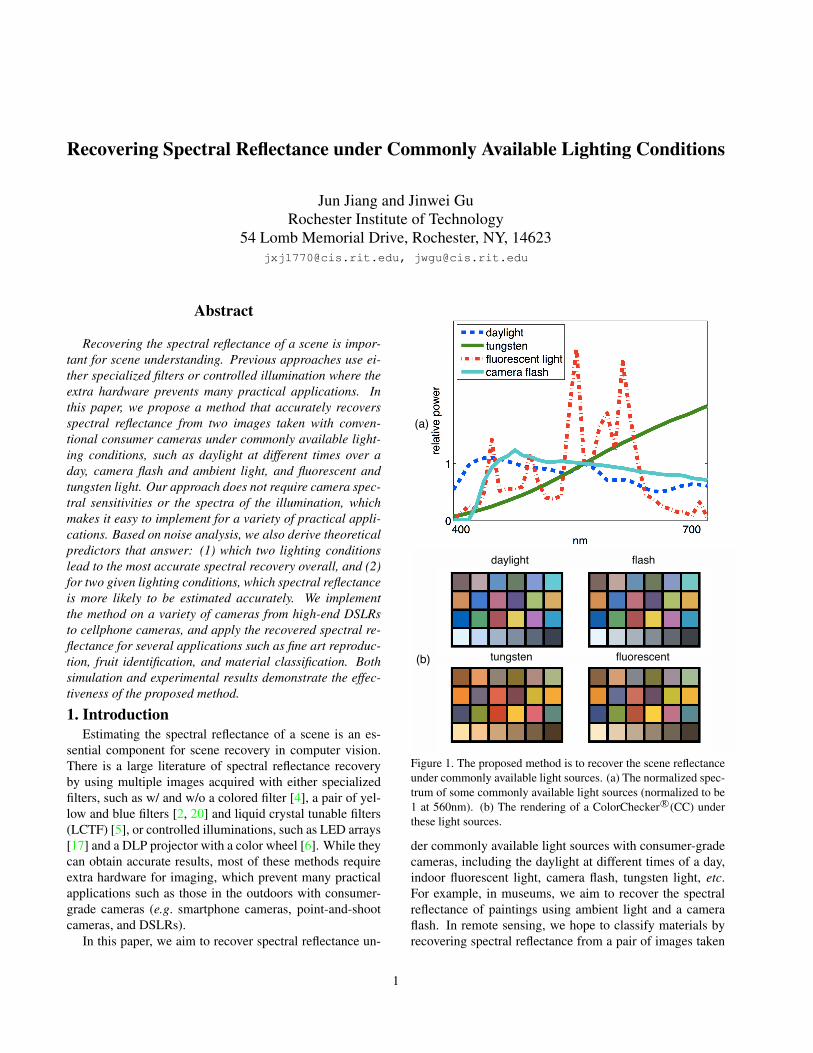
daylight flash
tungsten fluorescent(b)
(a)
Figure 1. The proposed method is to recover the scene reflectanceunder commonly available light sources. (a) The normalized spec-trum of some commonly available light sources (normalized to be1 at 560nm). (b) The rendering of a ColorChecker R©(CC) underthese light sources.
der commonly available light sources with consumer-gradecameras, including the daylight at different times of a day,indoor fluorescent light, camera flash, tungsten light, etc.For example, in museums, we aim to recover the spectralreflectance of paintings using ambient light and a cameraflash. In remote sensing, we hope to classify materials byrecovering spectral reflectance from a pair of images taken
1
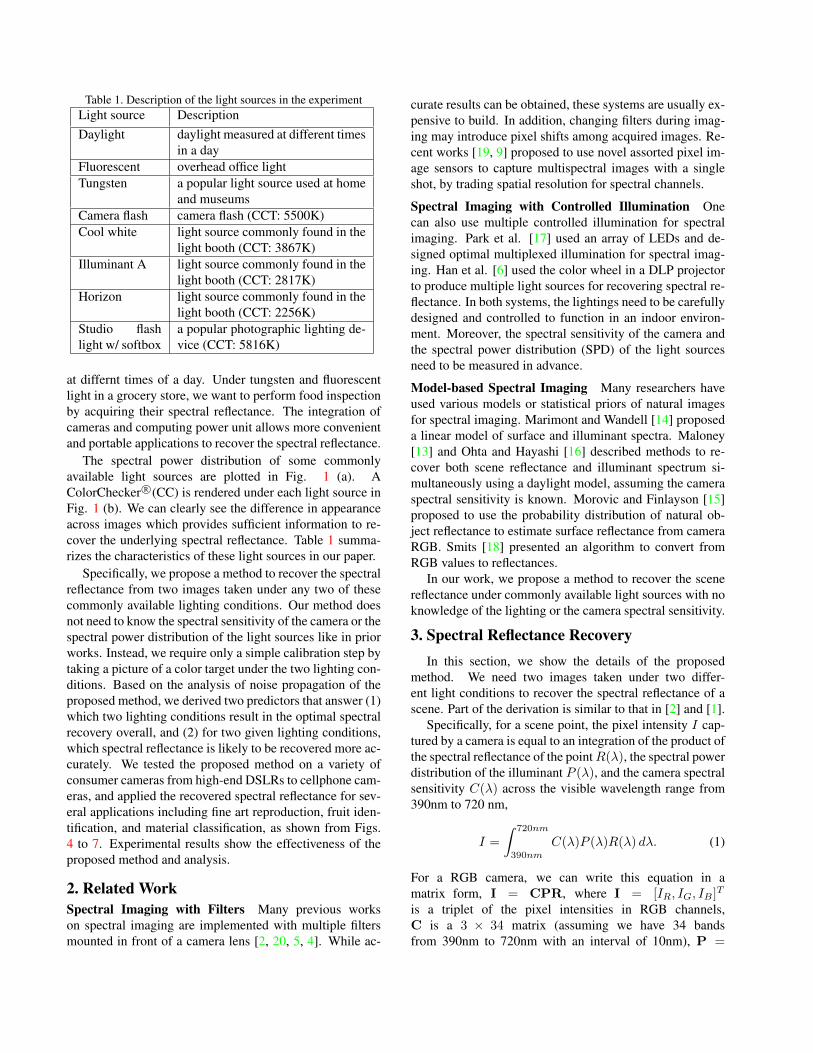
Table 1. Description of the light sources in the experimentLight source DescriptionDaylight daylight measured at different times
in a dayFluorescent overhead office lightTungsten a popular light source used at home
and museumsCamera flash camera flash (CCT: 5500K)Cool white light source commonly found in the
light booth (CCT: 3867K)Illuminant A light source commonly found in the
light booth (CCT: 2817K)Horizon light source commonly found in the
light booth (CCT: 2256K)Studio flashlight w/ softbox
a popular photographic lighting de-vice (CCT: 5816K)
at differnt times of a day. Under tungsten and fluorescentlight in a grocery store, we want to perform food inspectionby acquiring their spectral reflectance. The integration ofcameras and computing power unit allows more convenientand portable applications to recover the spectral reflectance.
The spectral power distribution of some commonlyavailable light sources are plotted in Fig. 1 (a). AColorChecker R©(CC) is rendered under each light source inFig. 1 (b). We can clearly see the difference in appearanceacross images which provides sufficient information to re-cover the underlying spectral reflectance. Table 1 summa-rizes the characteristics of these light sources in our paper.
Specifically, we propose a method to recover the spectralreflectance from two images taken under any two of thesecommonly available lighting conditions. Our method doesnot need to know the spectral sensitivity of the camera or thespectral power distribution of the light sources like in priorworks. Instead, we require only a simple calibration step bytaking a picture of a color target under the two lighting con-ditions. Based on the analysis of noise propagation of theproposed method, we derived two predictors that answer (1)which two lighting conditions result in the optimal spectralrecovery overall, and (2) for two given lighting conditions,which spectral reflectance is likely to be recovered more ac-curately. We tested the proposed method on a variety ofconsumer cameras from high-end DSLRs to cellphone cam-eras, and applied the recovered spectral reflectance for sev-eral applications including fine art reproduction, fruit iden-tification, and material classification, as shown from Figs.4 to 7. Experimental results show the effectiveness of theproposed method and analysis.
2. Related WorkSpectral Imaging with Filters Many previous workson spectral imaging are implemented with multiple filtersmounted in front of a camera lens [2, 20, 5, 4]. While ac-
curate results can be obtained, these systems are usually ex-pensive to build. In addition, changing filters during imag-ing may introduce pixel shifts among acquired images. Re-cent works [19, 9] proposed to use novel assorted pixel im-age sensors to capture multispectral images with a singleshot, by trading spatial resolution for spectral channels.
Spectral Imaging with Controlled Illumination Onecan also use multiple controlled illumination for spectralimaging. Park et al. [17] used an array of LEDs and de-signed optimal multiplexed illumination for spectral imag-ing. Han et al. [6] used the color wheel in a DLP projectorto produce multiple light sources for recovering spectral re-flectance. In both systems, the lightings need to be carefullydesigned and controlled to function in an indoor environ-ment. Moreover, the spectral sensitivity of the camera andthe spectral power distribution (SPD) of the light sourcesneed to be measured in advance.
Model-based Spectral Imaging Many researchers haveused various models or statistical priors of natural imagesfor spectral imaging. Marimont and Wandell [14] proposeda linear model of surface and illuminant spectra. Maloney[13] and Ohta and Hayashi [16] described methods to re-cover both scene reflectance and illuminant spectrum si-multaneously using a daylight model, assuming the cameraspectral sensitivity is known. Morovic and Finlayson [15]proposed to use the probability distribution of natural ob-ject reflectance to estimate surface reflectance from cameraRGB. Smits [18] presented an algorithm to convert fromRGB values to reflectances.
In our work, we propose a method to recover the scenereflectance under commonly available light sources with noknowledge of the lighting or the camera spectral sensitivity.
3. Spectral Reflectance RecoveryIn this section, we show the details of the proposed
method. We need two images taken under two differ-ent light conditions to recover the spectral reflectance of ascene. Part of the derivation is similar to that in [2] and [1].
Specifically, for a scene point, the pixel intensity I cap-tured by a camera is equal to an integration of the product ofthe spectral reflectance of the pointR(λ), the spectral powerdistribution of the illuminant P (λ), and the camera spectralsensitivity C(λ) across the visible wavelength range from390nm to 720 nm,
I =
∫ 720nm
390nm
C(λ)P (λ)R(λ) dλ. (1)
For a RGB camera, we can write this equation in amatrix form, I = CPR, where I = [IR, IG, IB ]T
is a triplet of the pixel intensities in RGB channels,C is a 3 × 34 matrix (assuming we have 34 bandsfrom 390nm to 720nm with an interval of 10nm), P =
diag(P (390nm), P (400nm), · · · , P (720nm)), and R =[R(390nm), R(400nm), · · · , R(720nm)]T .
As shown in many previous works [3, 12, 8], the spectralreflectance of real-world objects can be well approximatedas a weighted linear combination of a few basis spectra.Thus, R can be decomposed as
R = Bσ, (2)
where B = [B1(λ), · · · , BK(λ)] in which each of theK columns corresponds to one basis spectrum, σ =[σ1, · · · , σK ]T is a vector of scalars (i.e., weights) for thespectral reflectance R. K is the number of basis vectorsused in the model. Dimension reduction techniques, such asPrinciple Component Analysis (PCA), can be used to calcu-late the basis vectors. Combining the above two equations,we have I = CPBσ. The eigenvectors were extracted froma database [8] of 1250 Munsell chips and used as basis vec-tors.
Assuming we take M images of the same scene at dif-ferent illumination conditions, we have M such equationswhich can be concatenated as: I1
· · ·IM
=
CP1B· · ·
CPMB
σ. (3)
To recover the spectral reflectance (i.e., σ) from the ac-quired images (i.e., I1, · · · , IM ), we need to know the ma-trix T = [CP1B; · · · ; CPMB]. T is a 3M × K matrix,encoding the information of the camera spectral sensitivitiesand the multiple lighting conditions. Previous works [3, 12]show that K = 6 is sufficient for most real-world objects.Thus, to recover spectral reflectance scalar, σ, M = 2 im-ages are sufficient (in this case, T is a 6× 6 matrix).3.1. System Characterization
The matrix T can be estimated by capturing two imagesof six samples with known reflectance. Table 2 summarizesseveral ways to estimate T. First, T can be calculated ina least square sense by minimizing the difference betweenpixel intensities (i.e., scene radiance). In practice, however,directly optimizing T−1 by minimizing reflectance differ-ence often yields better results. Finally, whenever percep-tual color accuracy is a major concern (e.g., in the context offine art reproduction), one can optimize T−1 by minimizingcolor difference.1 In our experiments, we found minimizingreflectance difference and color difference have comparableresults, and their results are almost always better than thatof minimizing radiance difference.
The six samples of known reflectance for system char-acterization can be obtained according to specific applica-
1The color difference equation (∆E00, CIEDE2000 [11]) is used toquantify the perceptual color difference between the two samples in Table2. More details are given in the supplementary document.
Table 2. Optimization methods of T
Method Equation
Radiance difference minT̂(||T̂ · σ − I||)Reflectance difference minT̂−1(||R̂−R||)
Color difference minT̂−1(||∆E00(R̂,R)||)
tions. For example, for regular photography or industry ap-plications, one can put a color checker or other color targetsinto the scene before acquiring images; for some applica-tions such as fine art reproduction or remote sensing , onemight already know or can easily measure the spectral re-flectance for a few points in a given scene.
Once we know T for two given lighting conditions, wecan recover the spectral reflectance for an unknown surface,R̂, as follows
R̂ = BT̂−1I, (4)
where I = [I1; · · · ; IM ] includes all the measured im-ages.3.2. Spectral Reflectance Reconstruction
The reconstruction based on Eq. 4 is a baseline method.In practice, we found that certain priors of spectral re-flectance of real-world objects can be used to further im-prove the performance. For example, the reflectance curvesof real-world objects are mostly smooth, and thus we canadd a smoothness constraint for reflectance recovery,
minσ̂
(|||T · σ̂ − I|2 + α|∂2R
∂λ2|||) (5)
where the second derivative of the spectral reflectance∂2R/∂λ2 is to be minimized, and α is to adjust the weightof the smoothness parameter. Note Eq. 5 can still be opti-mized via a linear least square method.
Another prior is to recover a Maximum-a-Posterior(MAP) estimation by considering the probability distribu-tion of the recovered spectral reflectance, in which wemodel the probability of all spectral reflectance as a Gaus-sian Mixture Model (GMM)[10].
We found in experiments these two priors are compara-ble to each other, and often yields better results than thebaseline method. In our experiments, we use the smooth-ness constraint and set α = 1 for all experiments.3.3. Performance Prediction by Noise Analysis
The above method works for images taken under any twodifferent lighting conditions. Can we tell which two light-ing conditions are optimal overall for recovering spectralreflectance? Moreover, for two given lightings, can we pre-dict which spectral reflectance can be best estimated?
In this section, we derive two predictors that answer theabove questions by analyzing the noise propagation. As-sume that the measured radiance is composed of true signal
and noise, i.e., I = s + n, where s is a vector of signals andn = [nR,1, nG,1, nB,1, nR,2, nG,2, nB,2]T , correspondingto the noise in the red, green and blue channel in the firstand second picture. The estimated vector of scalars of thespectral reflectance can be expressed as
σ̂ = T−1 · (s + n) (6)
The noise contribution to the estimated reflectance becomes
∆R = BT−1 · n = W · n, (7)
where W = BT−1 is a matrix of size 33 × 6. The matrixW only depends on the lighting conditions and the eigen-vectors of the PCA model.
Two diffferent types of noise are considered. One isGaussian additive noise (accounts for read noise and ADCnoise), and the other is photon noise. Due to space limita-tion, we put the analysis of Gaussian additive noise in thesupplementary material. Below we talk about the case forphoton noise.
Photon Noise We know for photon noise, its variation islinearly proportional to the signal, i.e.,
Var(n) = k · I0 = k ·Tσ0 = k ·TBTR, (8)
where σ0 is the 6 × 1 PCA coefficients for a given spectralreflectance curve R, and B is a 6× 33 matrix of the top sixeigenvectors. The predictor to tell the overall performanceof the lighting condition can be calculated by Eq. 9,
Z = 1T ·W2 ·TBT · 1. (9)
Note that in this equation, W2 means element-wise square.For any given two light sources, we can compute the cor-responding Z value that will tell us how good they are forrecovering spectral reflectance overall.
Next, we hope to find a predictor for the second question.We can directly evaluate the normalized RMSE as follows:
ρ =||∆R||2
||R||2=
1T ·W2 ·TBT ·RRTR
. (10)
For two given lighting conditions, we know T, W, and B.Thus we can evaluate ρ for a given spectral reflectance R topredict the normalized RMSE for the recovery under thesetwo lighting conditions. The derivations of Eq. 9 and 10can be found in the supplementary materials.
To validate these two predictors, we simulated the sig-nals under the fluorescent light and tungsten light, usinga ColorChecker Passport R©(CCP) for characterization anda ColorChecker DC R©(CCDC) for validation. The truesignals were calculated given T, and photon noise wasmixed to form the simulated signals, based on which thereflectance was estimated by Eq. 4. A high correlation be-tween ρ and the normalized spectral RMS error can be ob-served in Fig. 2, indicating that ρ can be used to predict
0 50 100 1500
0.02
0.04
0.06
0.08
0.1
0.12
0.14
normalized
norm
aliz
ed s
pect
ral R
MS
erro
rFigure 2. The consistency between ρ (by Eq. 10) and the normal-ized spectral RMS error for patches in CCDC. Each triangle is acolor patch in CCDC. A high correlation can be found betweenρ and the spectral recovery accuracy. Therefore, ρ can be usedto predict which reflectance is likely to be estimated well given alighting.
which reflectance can be well estimated given two lightingconditions.
We also conducted real experiments under a variety oflighting conditions. The results are summarized in Table 3and Fig. 3. The results show the values of the two predictorsare highly correlated with the RMS error of the recoveredspectral reflectance. See below for detailed explanation.
4. Experiments4.1. Multispectral Imaging System
We test the proposed method on a variety of cameras, in-cluding Canon 50D, 5D, 60D, 550D and cellphone camera,Nokia N900. Among them, we remove the infrared filterof Canon 5D and Canon 550D to check whether there willbe performance improvement at longer wavelength. NokiaN900 is included to explore spectral recovery applicationson mobile devices. We perform flat-fielding when neededto ensure the uniformity of the light on the scene.
Ground truth was collected to evaluate the perfor-mance of the method. We measured the spectral re-flectance of color checkers, selected areas on the paintings,fruits and outdoor materials by a spectrophotometer X-Ritei1Pro R©from 380nm to 730nm with an internval of 10nm.4.2. Validation using ColorChecker DC R©
We use a CCP R©to get T, and a CCDC R©(w/ 240 colorpatches) for validation. Duplicate patches in CCDC R©are
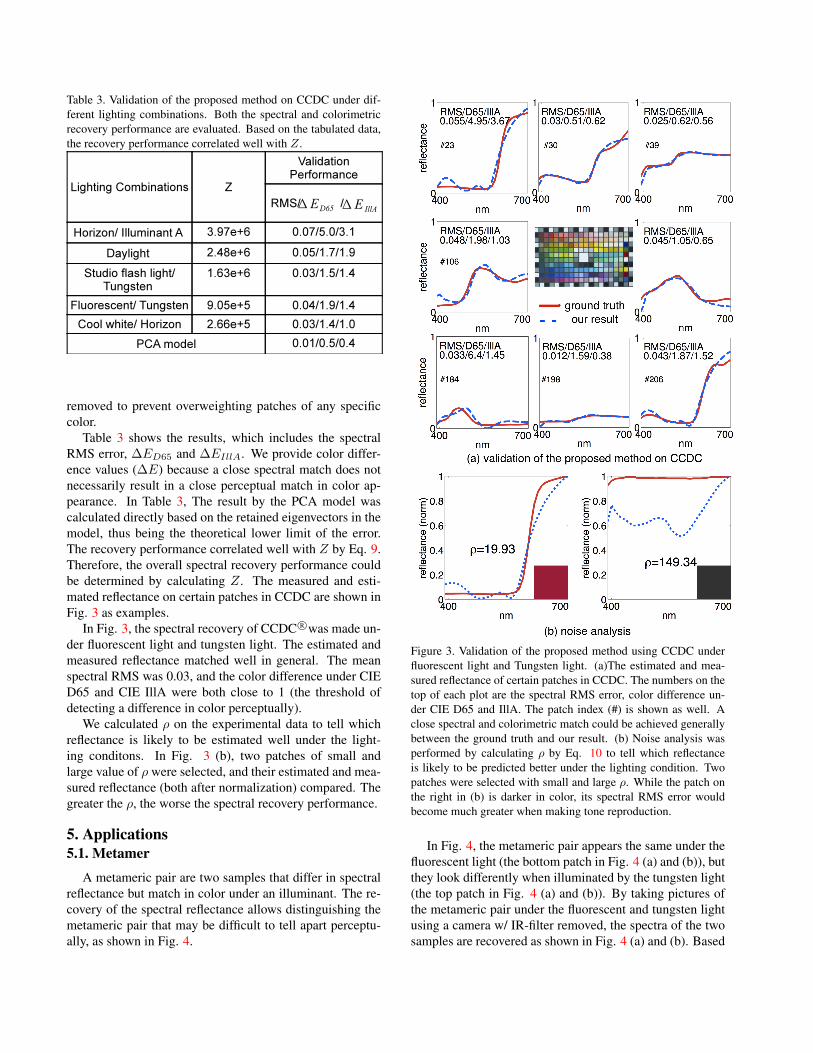
Table 3. Validation of the proposed method on CCDC under dif-ferent lighting combinations. Both the spectral and colorimetricrecovery performance are evaluated. Based on the tabulated data,the recovery performance correlated well with Z.
removed to prevent overweighting patches of any specificcolor.
Table 3 shows the results, which includes the spectralRMS error, ∆ED65 and ∆EIllA. We provide color differ-ence values (∆E) because a close spectral match does notnecessarily result in a close perceptual match in color ap-pearance. In Table 3, The result by the PCA model wascalculated directly based on the retained eigenvectors in themodel, thus being the theoretical lower limit of the error.The recovery performance correlated well with Z by Eq. 9.Therefore, the overall spectral recovery performance couldbe determined by calculating Z. The measured and esti-mated reflectance on certain patches in CCDC are shown inFig. 3 as examples.
In Fig. 3, the spectral recovery of CCDC R©was made un-der fluorescent light and tungsten light. The estimated andmeasured reflectance matched well in general. The meanspectral RMS was 0.03, and the color difference under CIED65 and CIE IllA were both close to 1 (the threshold ofdetecting a difference in color perceptually).
We calculated ρ on the experimental data to tell whichreflectance is likely to be estimated well under the light-ing conditons. In Fig. 3 (b), two patches of small andlarge value of ρ were selected, and their estimated and mea-sured reflectance (both after normalization) compared. Thegreater the ρ, the worse the spectral recovery performance.
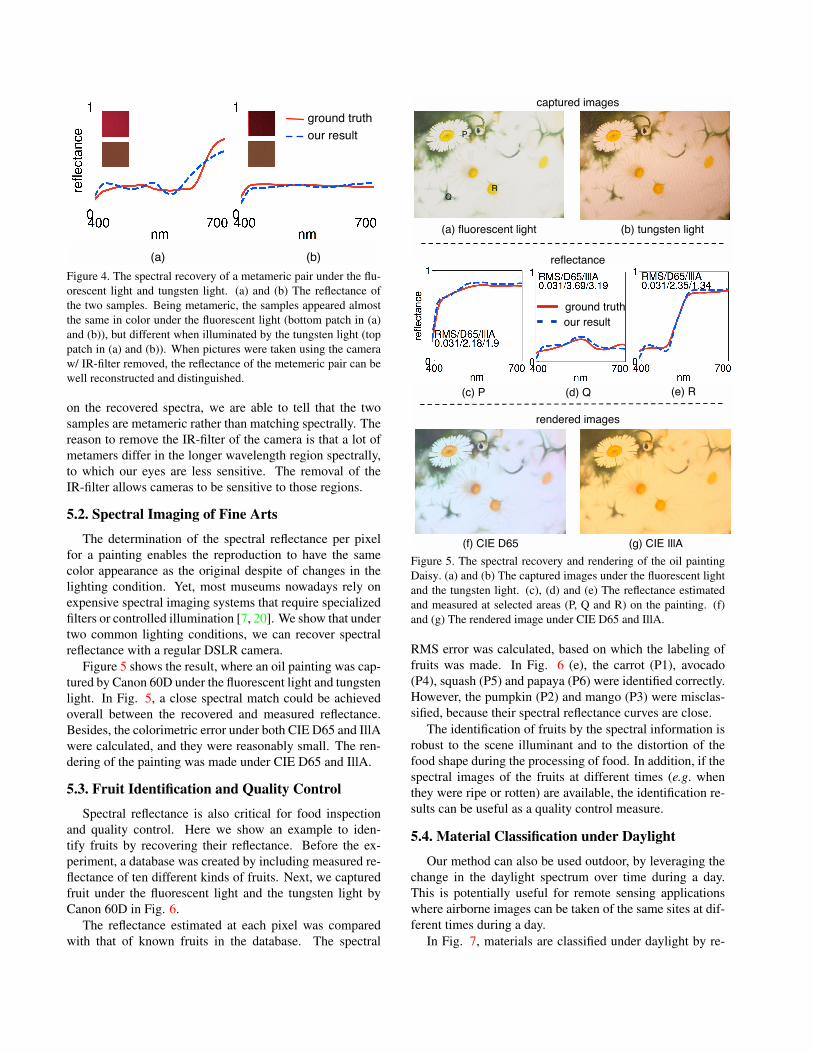
5. Applications5.1. Metamer
A metameric pair are two samples that differ in spectralreflectance but match in color under an illuminant. The re-covery of the spectral reflectance allows distinguishing themetameric pair that may be difficult to tell apart perceptu-ally, as shown in Fig. 4.
Figure 3. Validation of the proposed method using CCDC underfluorescent light and Tungsten light. (a)The estimated and mea-sured reflectance of certain patches in CCDC. The numbers on thetop of each plot are the spectral RMS error, color difference un-der CIE D65 and IllA. The patch index (#) is shown as well. Aclose spectral and colorimetric match could be achieved generallybetween the ground truth and our result. (b) Noise analysis wasperformed by calculating ρ by Eq. 10 to tell which reflectanceis likely to be predicted better under the lighting condition. Twopatches were selected with small and large ρ. While the patch onthe right in (b) is darker in color, its spectral RMS error wouldbecome much greater when making tone reproduction.
In Fig. 4, the metameric pair appears the same under thefluorescent light (the bottom patch in Fig. 4 (a) and (b)), butthey look differently when illuminated by the tungsten light(the top patch in Fig. 4 (a) and (b)). By taking pictures ofthe metameric pair under the fluorescent and tungsten lightusing a camera w/ IR-filter removed, the spectra of the twosamples are recovered as shown in Fig. 4 (a) and (b). Based
(b)(a)
our result
ground truth
Figure 4. The spectral recovery of a metameric pair under the flu-orescent light and tungsten light. (a) and (b) The reflectance ofthe two samples. Being metameric, the samples appeared almostthe same in color under the fluorescent light (bottom patch in (a)and (b)), but different when illuminated by the tungsten light (toppatch in (a) and (b)). When pictures were taken using the cameraw/ IR-filter removed, the reflectance of the metemeric pair can bewell reconstructed and distinguished.
on the recovered spectra, we are able to tell that the twosamples are metameric rather than matching spectrally. Thereason to remove the IR-filter of the camera is that a lot ofmetamers differ in the longer wavelength region spectrally,to which our eyes are less sensitive. The removal of theIR-filter allows cameras to be sensitive to those regions.
5.2. Spectral Imaging of Fine Arts
The determination of the spectral reflectance per pixelfor a painting enables the reproduction to have the samecolor appearance as the original despite of changes in thelighting condition. Yet, most museums nowadays rely onexpensive spectral imaging systems that require specializedfilters or controlled illumination [7, 20]. We show that undertwo common lighting conditions, we can recover spectralreflectance with a regular DSLR camera.
Figure 5 shows the result, where an oil painting was cap-tured by Canon 60D under the fluorescent light and tungstenlight. In Fig. 5, a close spectral match could be achievedoverall between the recovered and measured reflectance.Besides, the colorimetric error under both CIE D65 and IllAwere calculated, and they were reasonably small. The ren-dering of the painting was made under CIE D65 and IllA.
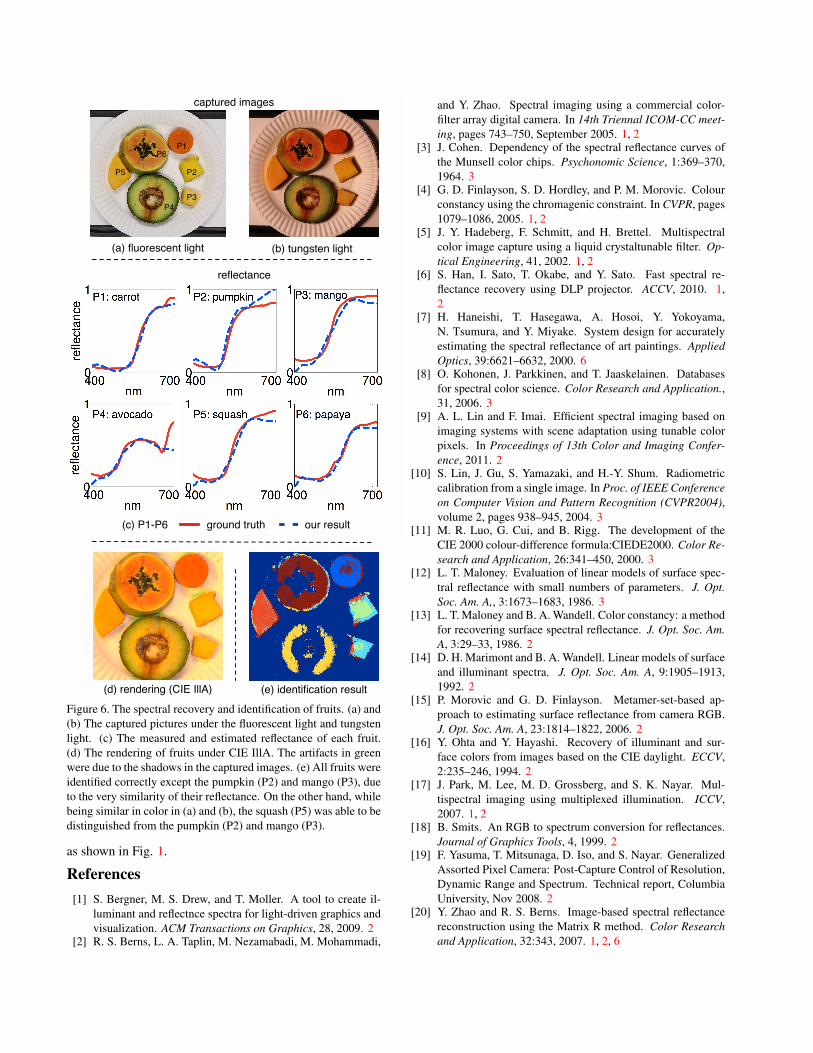
5.3. Fruit Identification and Quality Control
Spectral reflectance is also critical for food inspectionand quality control. Here we show an example to iden-tify fruits by recovering their reflectance. Before the ex-periment, a database was created by including measured re-flectance of ten different kinds of fruits. Next, we capturedfruit under the fluorescent light and the tungsten light byCanon 60D in Fig. 6.
The reflectance estimated at each pixel was comparedwith that of known fruits in the database. The spectral
(a) fluorescent light (b) tungsten light
(f) CIE D65 (g) CIE IllA
(c) P (d) Q (e) R
QR
captured images
rendered images
reflectance
P
ground truth
our result
Figure 5. The spectral recovery and rendering of the oil paintingDaisy. (a) and (b) The captured images under the fluorescent lightand the tungsten light. (c), (d) and (e) The reflectance estimatedand measured at selected areas (P, Q and R) on the painting. (f)and (g) The rendered image under CIE D65 and IllA.
RMS error was calculated, based on which the labeling offruits was made. In Fig. 6 (e), the carrot (P1), avocado(P4), squash (P5) and papaya (P6) were identified correctly.However, the pumpkin (P2) and mango (P3) were misclas-sified, because their spectral reflectance curves are close.
The identification of fruits by the spectral information isrobust to the scene illuminant and to the distortion of thefood shape during the processing of food. In addition, if thespectral images of the fruits at different times (e.g. whenthey were ripe or rotten) are available, the identification re-sults can be useful as a quality control measure.
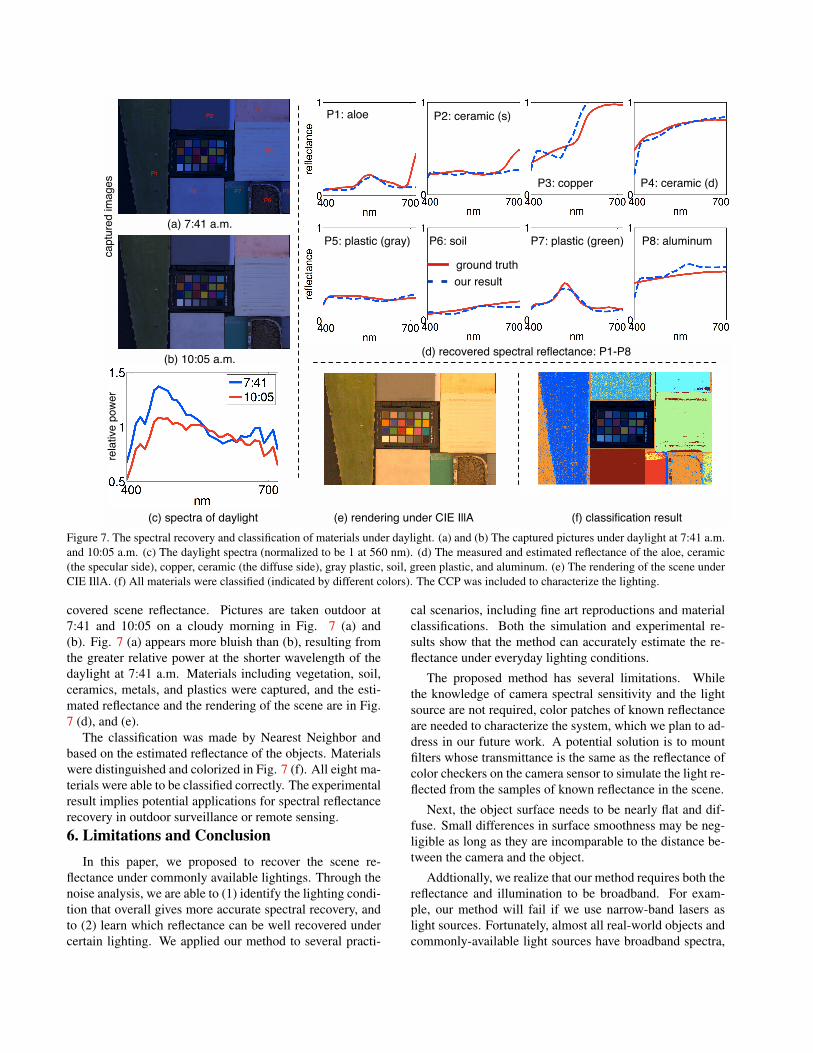
5.4. Material Classification under Daylight
Our method can also be used outdoor, by leveraging thechange in the daylight spectrum over time during a day.This is potentially useful for remote sensing applicationswhere airborne images can be taken of the same sites at dif-ferent times during a day.
In Fig. 7, materials are classified under daylight by re-
ground truth
our result
(d) recovered spectral reflectance: P1-P8
(c) spectra of daylight (e) rendering under CIE IllA (f) classification result
P1
P2P3
P4
P5
P6
P7P8
P1: aloe P2: ceramic (s)
P3: copper P4: ceramic (d)
P5: plastic (gray) P6: soil P7: plastic (green) P8: aluminum
(b) 10:05 a.m.
(a) 7:41 a.m.
captured images
relative power
Figure 7. The spectral recovery and classification of materials under daylight. (a) and (b) The captured pictures under daylight at 7:41 a.m.and 10:05 a.m. (c) The daylight spectra (normalized to be 1 at 560 nm). (d) The measured and estimated reflectance of the aloe, ceramic(the specular side), copper, ceramic (the diffuse side), gray plastic, soil, green plastic, and aluminum. (e) The rendering of the scene underCIE IllA. (f) All materials were classified (indicated by different colors). The CCP was included to characterize the lighting.
covered scene reflectance. Pictures are taken outdoor at7:41 and 10:05 on a cloudy morning in Fig. 7 (a) and(b). Fig. 7 (a) appears more bluish than (b), resulting fromthe greater relative power at the shorter wavelength of thedaylight at 7:41 a.m. Materials including vegetation, soil,ceramics, metals, and plastics were captured, and the esti-mated reflectance and the rendering of the scene are in Fig.7 (d), and (e).
The classification was made by Nearest Neighbor andbased on the estimated reflectance of the objects. Materialswere distinguished and colorized in Fig. 7 (f). All eight ma-terials were able to be classified correctly. The experimentalresult implies potential applications for spectral reflectancerecovery in outdoor surveillance or remote sensing.6. Limitations and Conclusion
In this paper, we proposed to recover the scene re-flectance under commonly available lightings. Through thenoise analysis, we are able to (1) identify the lighting condi-tion that overall gives more accurate spectral recovery, andto (2) learn which reflectance can be well recovered undercertain lighting. We applied our method to several practi-
cal scenarios, including fine art reproductions and materialclassifications. Both the simulation and experimental re-sults show that the method can accurately estimate the re-flectance under everyday lighting conditions.
The proposed method has several limitations. Whilethe knowledge of camera spectral sensitivity and the lightsource are not required, color patches of known reflectanceare needed to characterize the system, which we plan to ad-dress in our future work. A potential solution is to mountfilters whose transmittance is the same as the reflectance ofcolor checkers on the camera sensor to simulate the light re-flected from the samples of known reflectance in the scene.
Next, the object surface needs to be nearly flat and dif-fuse. Small differences in surface smoothness may be neg-ligible as long as they are incomparable to the distance be-tween the camera and the object.
Addtionally, we realize that our method requires both thereflectance and illumination to be broadband. For exam-ple, our method will fail if we use narrow-band lasers aslight sources. Fortunately, almost all real-world objects andcommonly-available light sources have broadband spectra,
P1: carrot P2: pumpkin P3: mango
P4: avocado P5: squash P6: papaya
ground truth our result
(d) rendering (CIE IllA)
P1
P2
P3
P4
P5
P6
(c) P1-P6
captured images
(a) fluorescent light (b) tungsten light
reflectance
(e) identification result
Figure 6. The spectral recovery and identification of fruits. (a) and(b) The captured pictures under the fluorescent light and tungstenlight. (c) The measured and estimated reflectance of each fruit.(d) The rendering of fruits under CIE IllA. The artifacts in greenwere due to the shadows in the captured images. (e) All fruits wereidentified correctly except the pumpkin (P2) and mango (P3), dueto the very similarity of their reflectance. On the other hand, whilebeing similar in color in (a) and (b), the squash (P5) was able to bedistinguished from the pumpkin (P2) and mango (P3).
as shown in Fig. 1.
References[1] S. Bergner, M. S. Drew, and T. Moller. A tool to create il-
luminant and reflectnce spectra for light-driven graphics andvisualization. ACM Transactions on Graphics, 28, 2009. 2
[2] R. S. Berns, L. A. Taplin, M. Nezamabadi, M. Mohammadi,
and Y. Zhao. Spectral imaging using a commercial color-filter array digital camera. In 14th Triennal ICOM-CC meet-ing, pages 743–750, September 2005. 1, 2
[3] J. Cohen. Dependency of the spectral reflectance curves ofthe Munsell color chips. Psychonomic Science, 1:369–370,1964. 3
[4] G. D. Finlayson, S. D. Hordley, and P. M. Morovic. Colourconstancy using the chromagenic constraint. In CVPR, pages1079–1086, 2005. 1, 2
[5] J. Y. Hadeberg, F. Schmitt, and H. Brettel. Multispectralcolor image capture using a liquid crystaltunable filter. Op-tical Engineering, 41, 2002. 1, 2
[6] S. Han, I. Sato, T. Okabe, and Y. Sato. Fast spectral re-flectance recovery using DLP projector. ACCV, 2010. 1,2
[7] H. Haneishi, T. Hasegawa, A. Hosoi, Y. Yokoyama,N. Tsumura, and Y. Miyake. System design for accuratelyestimating the spectral reflectance of art paintings. AppliedOptics, 39:6621–6632, 2000. 6
[8] O. Kohonen, J. Parkkinen, and T. Jaaskelainen. Databasesfor spectral color science. Color Research and Application.,31, 2006. 3
[9] A. L. Lin and F. Imai. Efficient spectral imaging based onimaging systems with scene adaptation using tunable colorpixels. In Proceedings of 13th Color and Imaging Confer-ence, 2011. 2
[10] S. Lin, J. Gu, S. Yamazaki, and H.-Y. Shum. Radiometriccalibration from a single image. In Proc. of IEEE Conferenceon Computer Vision and Pattern Recognition (CVPR2004),volume 2, pages 938–945, 2004. 3
[11] M. R. Luo, G. Cui, and B. Rigg. The development of theCIE 2000 colour-difference formula:CIEDE2000. Color Re-search and Application, 26:341–450, 2000. 3
[12] L. T. Maloney. Evaluation of linear models of surface spec-tral reflectance with small numbers of parameters. J. Opt.Soc. Am. A,, 3:1673–1683, 1986. 3
[13] L. T. Maloney and B. A. Wandell. Color constancy: a methodfor recovering surface spectral reflectance. J. Opt. Soc. Am.A, 3:29–33, 1986. 2
[14] D. H. Marimont and B. A. Wandell. Linear models of surfaceand illuminant spectra. J. Opt. Soc. Am. A, 9:1905–1913,1992. 2
[15] P. Morovic and G. D. Finlayson. Metamer-set-based ap-proach to estimating surface reflectance from camera RGB.J. Opt. Soc. Am. A, 23:1814–1822, 2006. 2
[16] Y. Ohta and Y. Hayashi. Recovery of illuminant and sur-face colors from images based on the CIE daylight. ECCV,2:235–246, 1994. 2
[17] J. Park, M. Lee, M. D. Grossberg, and S. K. Nayar. Mul-tispectral imaging using multiplexed illumination. ICCV,2007. 1, 2
[18] B. Smits. An RGB to spectrum conversion for reflectances.Journal of Graphics Tools, 4, 1999. 2
[19] F. Yasuma, T. Mitsunaga, D. Iso, and S. Nayar. GeneralizedAssorted Pixel Camera: Post-Capture Control of Resolution,Dynamic Range and Spectrum. Technical report, ColumbiaUniversity, Nov 2008. 2
[20] Y. Zhao and R. S. Berns. Image-based spectral reflectancereconstruction using the Matrix R method. Color Researchand Application, 32:343, 2007. 1, 2, 6